the Creative Commons Attribution 4.0 License.
the Creative Commons Attribution 4.0 License.
 | 26 Mar 2026
DANRA: the kilometer-scale Danish regional atmospheric reanalysis
Xiaohua Yang
Carlos Peralta
Bjarne Amstrup
Kasper Stener Hintz
Søren Borg Thorsen
Leif Denby
Simon Kamuk Christiansen
Hauke Schulz
Sebastian Pelt
Mathias Schreiner
The DANish regional atmospheric ReAnalysis (DANRA) is a novel high-resolution (2.5 km) reanalysis dataset covering Denmark and its surrounding regions over a 34-year period (1990–2023). Denmark's complex coastline, with over 400 islands and an extensive 7400 km coastline, means that most municipalities experience mixed land-sea variability. This complexity requires a regional climate reanalysis system that can resolve fine-scale coastal and inland features, as well as their impact on climate variability. DANRA is based on the HARMONIE-AROME Numerical Weather Prediction (NWP) model and assimilates a comprehensive set of observations, with a particular focus on Denmark. Compared to global reanalyses such as the European Centre for Medium-range Weather Forecast (ECMWF) Reanalysis v5 (ERA5), DANRA demonstrates superior performance in representing essential climate variables, including near-surface weather parameters during both extreme and ordinary conditions. We illustrate these improvements in the representation of several extreme weather cases over Denmark, such as the December 1999 hurricane-force storm, the July 2022 national temperature record, and the August 2007 cloudburst in South Jutland. DANRA is made to support climate adaptation, impact modelling, and the training of next-generation data-driven atmospheric forecasting models. DANRA is distributed as Zarr dataset freely accessible from an object store (https://doi.org/10.5281/zenodo.17294179, Yang et al., 2025), maximizing its usability for climate adaptation, impact modelling, and data-driven research.
- Article
(5650 KB) - Full-text XML
- BibTeX
- EndNote


Global reanalysis datasets are extensively utilized in climate research as well as planning and development of both private and public projects, providing valuable information on historical weather and climate change. Recently, a rapidly growing machine learning community has leveraged global reanalysis data to develop data-driven models, which have shown promising results (Price et al., 2025; Lam et al., 2023). This interest is driving an increasing demand for high-quality, state-of-the-art reanalysis datasets in both private and public sectors. However, compared to regional reanalyses based on Limited Area Modeling (LAM), global reanalysis datasets typically lack sufficient horizontal resolution to capture weather extremes. This limitation often restricts their applicability in climate studies and modeling activities, particularly for local (municipal-level) applications, renewable energy planning (Gualtieri, 2022; Hunt and Bloomfield, 2024) and the representation of extreme weather conditions. To address these shortcomings, several regional reanalysis datasets have been developed, offering higher resolution and improved local representation (Gleeson et al., 2017; Yang et al., 2020; Køltzow et al., 2022; Ridal et al., 2024).
DANish regional atmospheric ReAnalysis (DANRA) is a kilometer-scale regional reanalysis dataset, specifically designed to overcome the limitations of global reanalyses in regional applications. Denmark's complex coastal geography, characterized by numerous fjords and over 400 islands, yields an extensive coastline of approximately 7400 km (Møller, 1988). Given the country’s small size, this lengthy coastline significantly influences local weather and climate variability. Most Danish municipalities feature mixed land-water coverage, making high-resolution climate reanalysis, capable of accounting for coastal complexity, particularly valuable for regional planning and climate adaptation efforts.
At its core, DANRA leverages the state-of-the-art operational Numerical Weather Prediction (NWP) model at the Danish Meteorological Institute (DMI), HARMONIE-AROME (HIRLAM–ALADIN Research on Mesoscale Operational NWP in Euromed – Applications of Research to Operations at Mesoscale) as its foundational system (Yang et al., 2017). The reanalysis features a horizontal grid-spacing of 2.5 km on a 800×600 grid with 65 vertical levels. With a reanalysis system based on a non-hydrostatic, mesoscale convection-resolving weather forecasting system, DANRA achieves a kilometer-scale spatial resolution, which is unprecedented among reanalysis products for the region. This poses DANRA as a promising high-fidelity dataset for climate applications in Danish society.
Reanalysis datasets typically span several decades, reflecting the evolution of observation systems as well as climate conditions. Choosing a state-of-the-art operational forecasting system for reanalysis helps secure high-quality data while making production more stable, efficient, and maintainable. For the DANRA reanalysis, the system base is adapted from the Copernicus Arctic Regional Reanalysis (CARRA) (Yang et al., 2020) system. The CARRA system is based on the operational (at the time of production start) NWP HARMONIE-AROME Cycle 40h1 assimilation and forecast model systems used in the national weather services of Denmark and Norway among other countries (Bengtsson et al., 2017) for weather prediction over the European and Arctic regions. Among the adaptations made for the CARRA reanalysis, the focus is mainly on introducing and adapting additional observation data streams and improving modelling for the “cold” climate condition in the Nordic and Arctic regions, particularly for ice and snow conditions (Yang et al., 2020). In DANRA, the primary focus of the adaptation from CARRA is the inclusion of additional observation data collected over Denmark and nearby regions, and harmonisation of configuration parameters to be consistent with those used in the operational NWP system at DMI for the Danish area (Yang et al., 2017). For the lateral boundary, DANRA utilizes the reanalysis data from the Copernicus Climate Change Service (C3S) global reanalysis of the European Centre for Medium-Range Weather Forecasts (ECMWF) Reanalysis v5 (ERA5) (Hersbach et al., 2020).
In this paper, we present a comprehensive 34-year dataset of the DANRA reanalysis (1990–2023). The reanalysis encompasses a wide range of weather events, offering a unique opportunity to test the system's ability to replicate various meteorological conditions, including weather extremes. In assessing the quality of the DANRA reanalysis dataset, we have benchmarked it against ERA5, which is widely recognized as the reference for reanalysis in recent decades at the global scale. This comparative approach highlights the value of resolution and detail, which is a pivotal aspect in understanding and predicting weather phenomena crucial to the regional climate. The insights gained from this evaluation show promise to significantly enhance our comprehension of weather patterns and trends, particularly in the context of Denmark's unique climatic conditions. During the pilot phase of the DANRA project, DANRA reanalysis system has been examined for a series of high-impact weather episodes to demonstrate the prediction capability in representing Danish weather conditions, including extremes (Yang et al., 2021). A case study is presented for each historical extreme in temperature, wind, and heavy precipitation in this paper. These studies underline the quality of the DANRA high-resolution dataset. For comparison, the corresponding data from the Copernicus 5.5 km Copernicus European Regional Reanalysis (CERRA) reanalysis, as well as the 31 km global reanalysis ERA5, have also been extracted to examine the added value of higher-resolution reanalyses. The DANRA dataset has been converted to CF-compliant Zarr data and made freely accessible in an S3-compatible object store. With this effort, we maximise the usability of the dataset for climate adaptation, impact modelling, data-driven research, and other stakeholders. Converting such a big dataset is non-trivial. Details about this are presented in Sect. 2.3.
2.1 Reanalysis system
In terms of model source, DANRA employs DMI's operational HARMONIE-AROME-40h1.1 NWP model suite (Yang et al., 2017). The HARMONIE-AROME-40h1.1 model (Bengtsson et al., 2017) is a non-hydrostatic, convection-permitting NWP system that has been used extensively by a wide array of European national weather services contributing to A Consortium for Convection-scale modelling Research and Development (ACCORD) NWP research collaboration (https://www.umr-cnrm.fr/accord/, last access: 23 March 2026).
The DANRA reanalysis operates through a cyclic process of analysis and short-range forecasting, updated every three hours at 00:00, 03:00, 06:00, … and 21:00 UTC. During the analysis step, the system assimilates both surface and upper-air observations using a three-dimensional variational (3DVar) data assimilation scheme for upper-air model states, and multivariate optimal interpolation for the near-surface temperature and humidity, soil temperature and moisture and snow depth. Each cycle is followed by a short-range forecast: 18 h for the 00:00 and 12:00 UTC cycles, and 3 h for all other analysis times. The extended forecast lead time at 00:00 and 12:00 UTC is designed to enable the extraction of accumulated precipitation through model integration beyond a 6 h lead time. This approach mitigates potential moisture spin-up, a common issue during the initial stages of model integration following data assimilation. This configuration aligns with practices adopted in other reanalysis projects (Hersbach et al., 2020; Ridal et al., 2024; Gleeson et al., 2017).
The DANRA reanalysis is conducted at a horizontal 2.5 km grid-spacing on the DKA model domain, the operational DMI-HARMONIE-AROME domain used for weather forecasting over Denmark during the period 2012–2016. The DKA domain consists of an 800 × 600 horizontal grid and 65 vertical levels, as illustrated in Fig. 1a. To highlight the resolution advantage, the grid-averaged orography of DANRA's 2.5 km × 2.5 km grid is compared to that of ERA5's 31 km × 31 km grid (Hersbach et al., 2020, Fig. 1b and c, respectively). The comparison reveals a substantially improved representation of Denmark's coastal landscape in the kilometer-scale DANRA reanalysis compared to the coarser-resolution global ERA5 model. Higher resolution enhances quantitative realism in depicting local-scale weather and climate characteristics, making it particularly valuable for municipality-level climate adaptation planning.
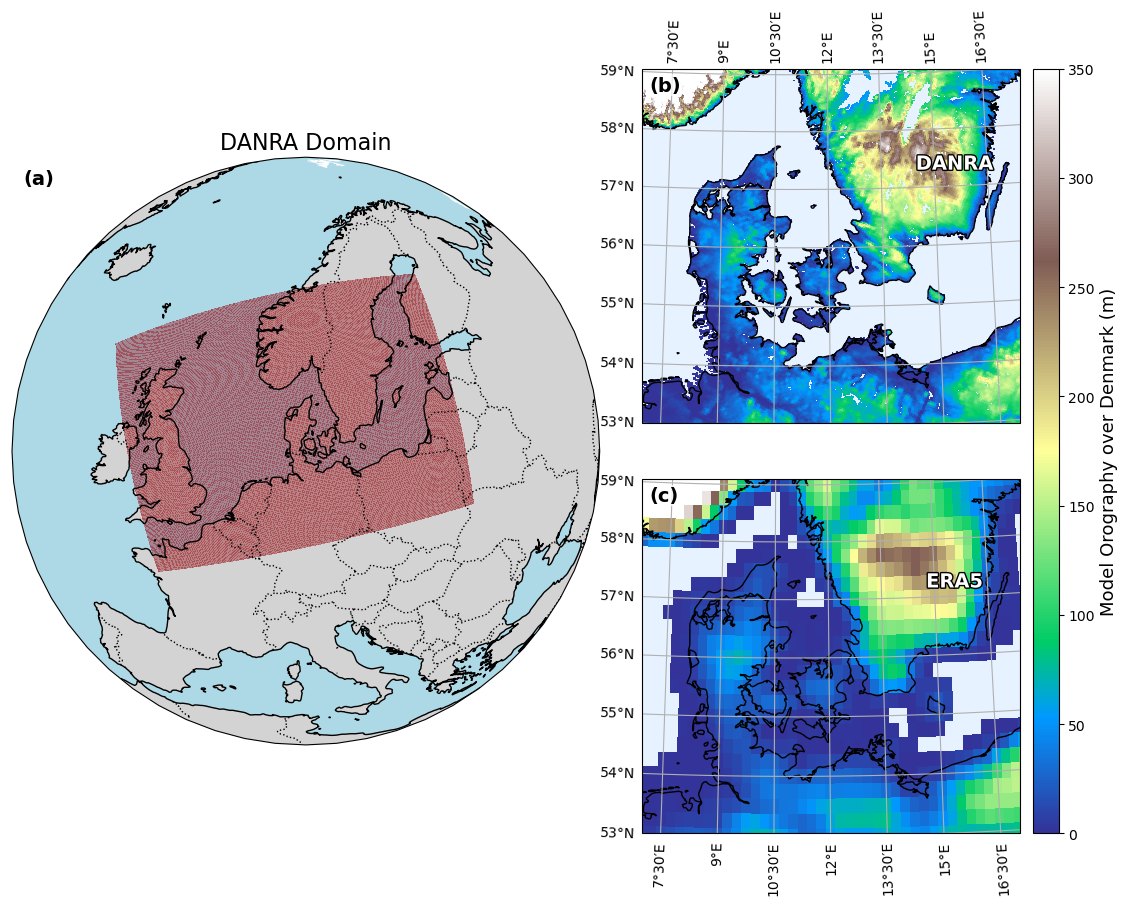
Figure 1(a) Domain of the DANRA reanalysis, (b) Model orography over Denmark of DANRA at 2.5 km horizontal resolution and (c) model orography over Denmark of ERA5 at 31 km horizontal resolution.
For reanalysis applications, the DANRA system incorporates adaptations similar to those implemented in CARRA (Yang et al., 2020), including the use of hourly ERA5 analyses at the lateral boundaries, as well as system modifications optimized for reanalysis. In the data assimilation process, we include all conventional observations used by ERA5 at ECMWF as a baseline, supplemented by additional local observations not archived by ECMWF (see Sect. 2.2). The upper-air data assimilation also incorporates a wide range of satellite remote sensing data, including microwave and infrared radiances, atmospheric motion vectors, scatterometer readings, and radio occultation measurements. This represents a substantial expansion of observational input compared to the data usage in operational NWP forecasts for the same historical periods, particularly during the early years of the DANRA reanalysis. All observations undergo quality control and thinning steps before assimilation. The generation of background error covariance in DANRA uses a two-step iterative process: first, short-range downscaling ensemble forecasts are run for two-week periods starting on 1 January and 1 July 2017, initialized from ERA5 Ensemble Data Assimilation (EDA) data to produce provisional covariances. These are then refined using a 3DVar-based EDA over two-month runs, with ensembles of 6 h forecasts collected to derive the final background error covariances. While a time-varying proxy would be ideal, DANRA uses statistics from these two representative seasons throughout the reanalysis period, applying a linear weighting approach similar to CARRA to account for seasonal variations in background error characteristics.
The DANRA reanalysis was produced using the High-Performance Computing Facility (HPCF) at ECMWF, leveraging computational resources allocated to ECMWF member states, with a total compute time of approximately 80 000 node hours.
2.2 Observational data acquisition and quality assurance
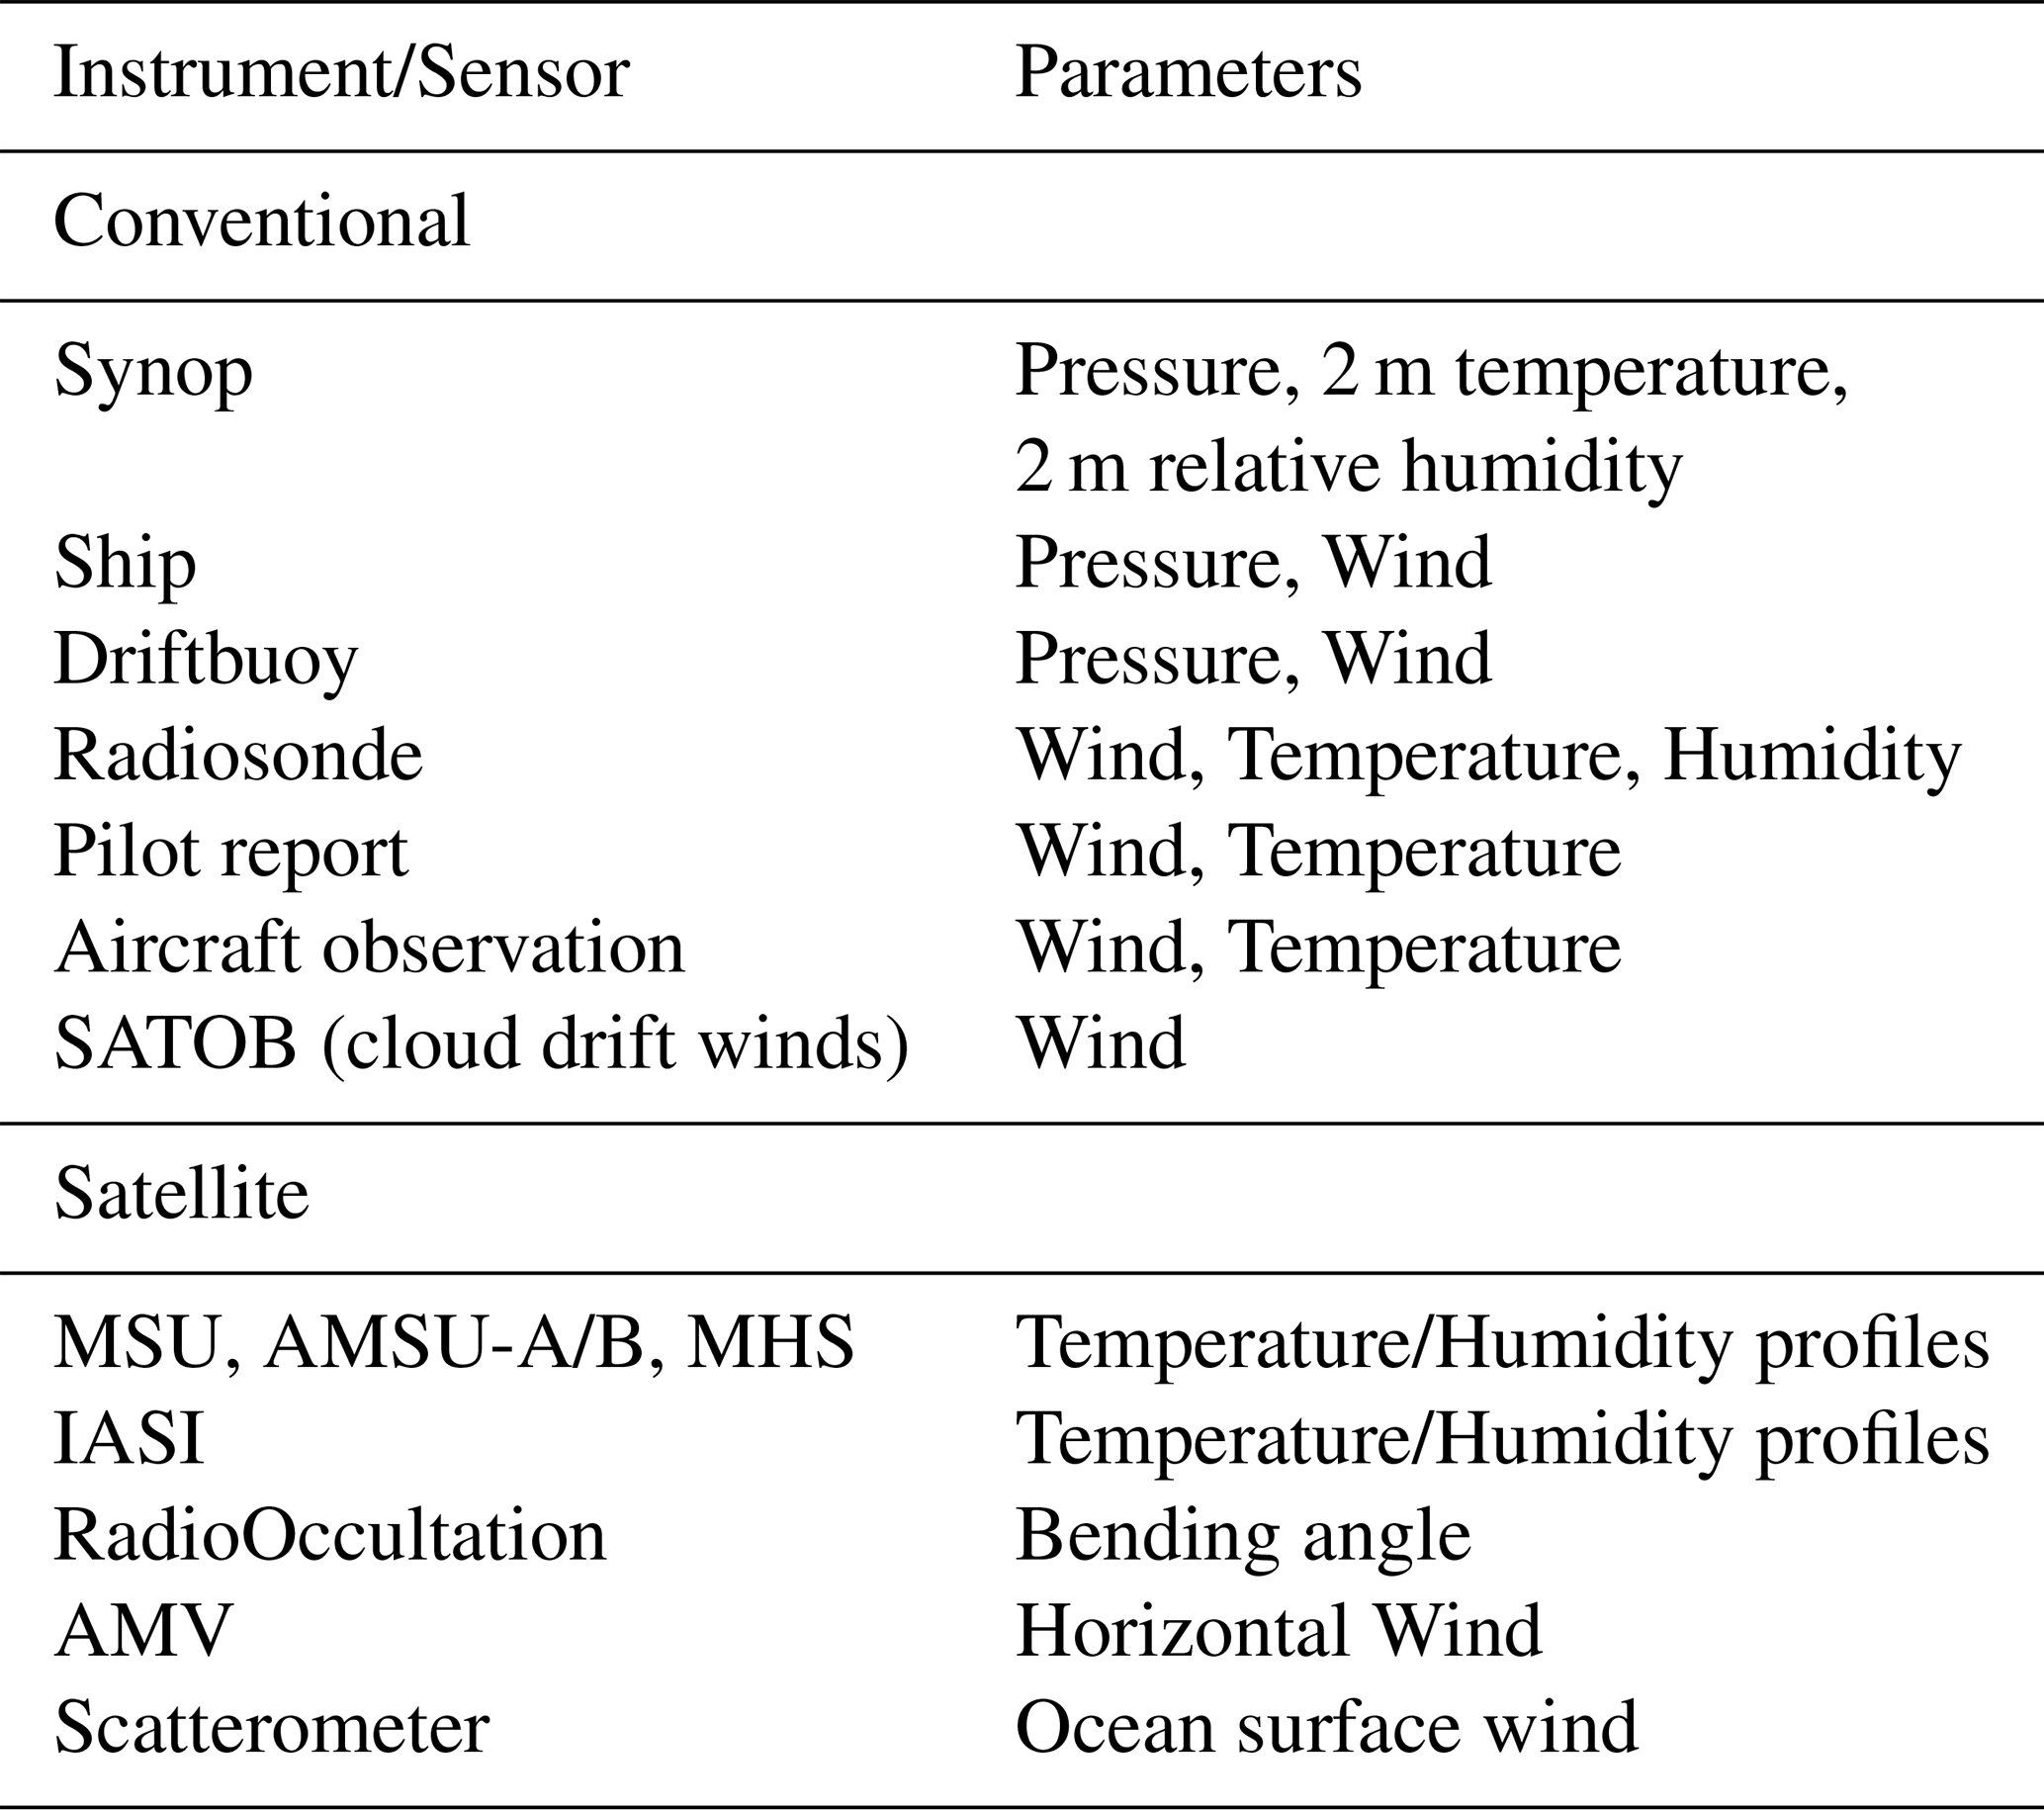
In a reanalysis system, observation data is integrated with NWP models through data assimilation to produce a spatially and temporally continuous historical weather record. Table 1 summarizes the different types of observational data used to create the analyses in DANRA. For surface assimilation in DANRA, in-situ measurements, including screen-level temperature, humidity, and snow depth observations, are assimilated to update near-surface soil states. For upper-air assimilation, DANRA incorporates surface pressure and upper-air wind, temperature, and humidity data collected from conventional in-situ platforms such as synoptic weather stations, ships, drifting buoys, aircrafts, and radiosondes, as well as satellite remote sensing data. For most conventional and remote sensing observations, the data used in the ERA5 reanalysis as archived in the Meteorological Archival and Retrieval System (MARS) at ECMWF, serve as the baseline. Additionally, DANRA enhances observation coverage by assimilating additional local observation data, reprocessed atmospheric motion vectors, satellite scatterometer wind data, and reprocessed GPS radio occultation bending-angle data from the ROM SAF Interim Climate Data Record (ICDR) (EUMETSAT ROM SAF, 2020).
Table 1Summary of Instruments/Sensors and Measured Parameters used in the data assimilation of DANRA.
As detailed in Yang et al. (2021), the DANRA region has experienced changes in observational data availability over the past three decades. Aircraft measurement data became available in the late 1990's, while satellite remote sensing data increased steadily from virtually non-existent levels. Additionally, in-situ surface observations have seen a marked expansion. For example, the availability of surface pressure and screen-level temperature data more than doubled between the early 1990's and 2015, driven by both an increase in the number of stations and higher reporting frequencies. Figure 2 illustrates the use of different conventional observation types, demonstrating that aircraft and Surface Synoptic Observations (SYNOP) dominate the conventional observation pool.
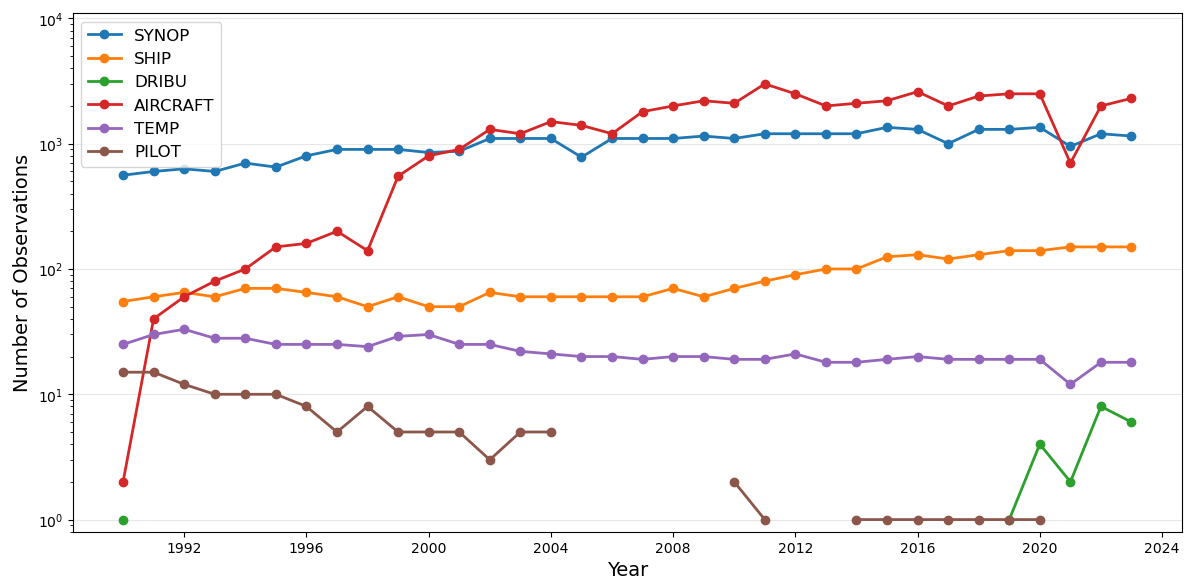
Figure 2Time series of daily conventional observation usage in DANRA averaged for each simulated January. Note the logarithmic vertical axis.
A key feature of the DANRA reanalysis is its comprehensive collection, rescue, and quality assurance of in-situ observation in and around Denmark. This effort builds on the extensive work of the Copernicus regional reanalysis projects CARRA and CERRA, which aimed to maximize the availability of in-situ observations over the European Arctic and Pan-European reanalysis regions, respectively. One of the focuses in such efforts has been the collection of local observations that were previously not widely distributed via the Global Telecommunications System (GTS), the backbone of global meteorological observation exchange coordinated by the World Meteorological Organisation (WMO).
For DANRA, the enhancements on in-situ data encompass the collection of surface observations previously outside of the GTS, as well as stations reporting at higher frequencies than those available through the GTS. For example, while GTS-distributed observations in the 1990's – the start of the DANRA reanalysis period – were typically limited to 3 to 6 h intervals, DANRA leverages hourly SYNOP records for most Danish stations throughout the reanalysis period. In fact, beginning around 1998, a rapidly expanding network of Danish SYNOP stations began providing 10 min data following the modernization of the Danish SYNOP station network. Although high-frequency fix-point data (sub-3-hourly) is not directly assimilated in DANRA's 3DVar system, it has proven invaluable for validation and for gap-filling when full-hour observations are unavailable. Additionally, these local datasets offer greater precision, with four-digit coordinate accuracy compared to the two-digit precision historically used in observation reporting via Binary Universal Form for data Representation (BUFR) messages, along with corrections to station positions.
To enhance observational input over the Danish area, data from multiple sources have been carefully examined, and the final in-situ observation dataset has been compiled from three distinct sources. First, BUFR data from the MARS archive at ECMWF were used. Second, observations from the DMI operational observation database (DMIdb) were compiled. Finally, archived BUFR data originally used for the operational NWP forecasts at DMI since mid-1994. Though initially containing some gaps, they were also extracted. While these three datasets should ideally be identical, practical comparisons reveal significant differences in both coverage and content. To ensure maximum coverage with optimal quality, a rigorous quality assurance process, including manual inspections, was implemented. The inspection identified a substantial number of deficiencies in observations from different datasets. Consequently, significant effort was dedicated to selecting the highest-quality observational data for both assimilation and validation. For specific parameters, ERA5 time series proved valuable in identifying anomalies clearly unrelated to weather regime changes.
While different data sources often contain overlapping observations, a multitude of inconsistencies can arise. The origins of these discrepancies vary, stemming from manual errors, rounding errors, or other unidentified factors. Some of the most commonly detected errors include:
-
pressure offsets by 1, 10, or 100 hPa.
-
temperature offsets by 1 or 10 K.
-
incorrect sign of temperatures recorded in Celsius.
-
wind speeds off by a factor of 10.
-
wind (speed and/or direction) frozen for a longer period.
-
wrong barometer height used in conversion from surface to Mean Sea Level Pressure (MSLP).
-
succeeding sets of observations being identical.
In the early part of the reanalysis period, prior to 2000, several cases with poor MSLP due to the absence of 2 m temperature occurred. These data have been discarded. In the same period, the datasets include occurrences where the same data (pressure, relative humidity, temperature, and wind) appear in 2 consecutive reportings, one or three hours apart. Such sightings are extremely unlikely, and in many cases, they occur in one or two of the three datasets, but not in all of them. In such cases, data from the record exhibiting the expected behaviour was selected. It can also be noted that the quality of resolution of wind direction is much better in the last half of the reanalysis period (1° uncertainty) than in the first, where uncertainties are 30 or 10°.
Figure 3 presents an example of examining an observation record of MSLP recorded at 10 min intervals from DMIdb for Sønderborg airport station (station id 06118) in south Denmark during 11–12 March 2009, where several data points need to be removed. During the inspection step, the corresponding time series from ERA5 is used as background reference. As shown in the figure, while the measurement data for the selected time slice in DMIdb generally correspond well to the ERA5 time series, there is a segment of the DMIdb MSLP time series that exhibits significant drops in magnitude every three hours. Notably, the anomaly occurs at minute 00 in these cases, coinciding perfectly with system analysis times, whereas the values at other minutes are more aligned with each other and ERA5. Further, during hours 02:00 and 05:00 Z of 12 March 2009, only a single, erroneous observation is available. For a record as the one presented in Fig. 3, the data assimilation routine would first remove all observations except those at analysis time, where such is available (i.e. at every third full hour). In this case, the remaining observation would be erroneous. The algorithm would most likely discard it due to a large discrepancy between the initial guess and the observation in NWP. However, by manually removing the obviously erroneous observations, the assimilation algorithm, using a three-hour assimilation window, will include temporally close observation points for analysis, thereby fully exploiting the high-frequency temporal observations
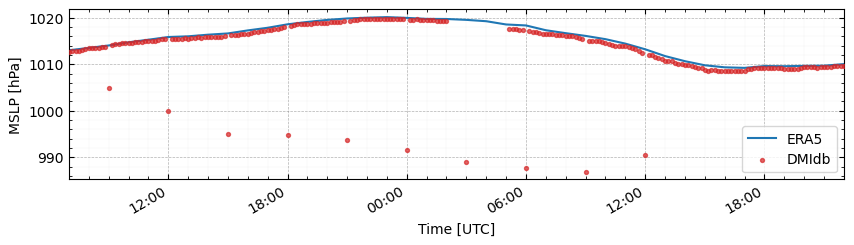
Figure 3Time series of MSLP from DMIdb (red) and ERA5 (blue) for station 06118 (Sønderborg airport) during an episode between 11 and 12 March 2009.
Thus, while the data assimilation algorithm within the NWP model would flag erroneous observations in such records and not use them for the assimilation, information is lost in such cases. The quality assurance of DANRA ensures that this information is retained and used by the reanalysis system.
The persistent use of inaccurate, sometimes erroneous, barometer heights in the derivation of MSLP from surface pressure measurements is a commonly encountered quality issue in data records generated for the Danish weather observation network. During data inspection, potential quality problems associated with incorrect barometer heights can be detected through comparison with model equivalents such as ERA5. Typically, wrong barometer heights get exposed in such comparisons through a systematically large bias accompanied by a relatively small standard deviation error. To correct for such error, barometer heights may be estimated by minimizing long-term average differences in MSLP to that of the ERA5 time series. The inferred barometer height can then be used to derive a corrected MSLP from surface pressure. One such example of data rescue is shown in Fig. 4. The green curve and red curves represent the observed surface pressure corresponding to the original MSLP from DMIdb. The orange curve is re-derived MSLP data using the corrected barometer height, and the blue is the ERA5 reanalysis nearest neighbour MSLP.
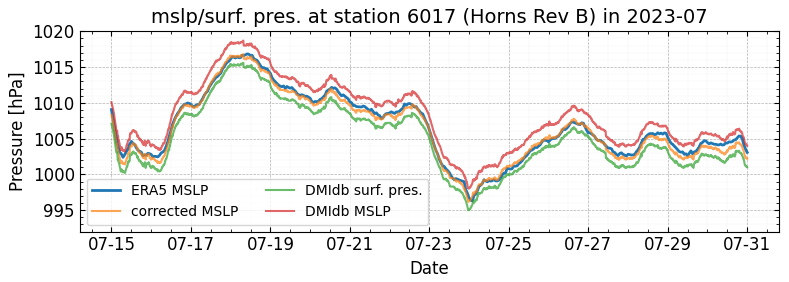
Figure 4Time series of DMIdb surface pressure (green) and DMIdb MSLP (red), corrected MSLP (orange) and ERA5 MSLP (blue) for 06017 (Horns Rev B) during second half of July 2018.
2.3 Creation of DANRA Zarr archive
The complete DANRA dataset was created in GRIB (edition 1), using the tools available as part of the integrated HARMONIE-AROME forecasting system. The conversion efforts by e.g., Google and Amazon have shown that to provide a dataset that is widely accessible without technical domain knowledge barriers and ready to use (Carverand Merose, 2017), datasets need to be converted and aligned with modern infrastructure. Inspired by this successful approach, DANRA is officially released as an analysis-ready, cloud-optimized reanalysis product, eliminating the need for third-party conversion efforts. As a consequence, the General Regularly distributed Information in Binary form (GRIB) files have been converted to CF-compliant Zarr (Davis et al., 2024). The Zarr format enables more flexible access, facilitates easier data analysis, and provides efficient parallel and cloud computing capabilities (Gowan et al., 2022). Additionally, it is better suited to machine learning workflows (Nakamura et al., 2025). As an example, 30 years of wind speed (10 m u and v components) can be loaded from a network drive, and combined to compute the wind speed distributions for a single grid point in 38 ± 10 s (average ± standard deviation of 7 runs). For comparison, loading just a single wind component for just one month from GRIB files on the same network drive takes 419 ± 14 s (average ± standard deviation of 7 runs). Loading the GRIB files, however, also requires decompressing tar files and writing index files for the GRIB files. It would be faster if index files were pre-computed and GRIB files were uncompressed.
The conversion was done using gribscan (Kölling et al., 2025) to create index files for the GRIB messages, and load them into Xarray (Hoyerand Joseph, 2017). From there, they were saved as Zarr datasets (Miles et al., 2025) with chunking in both space and time (, average size ≈50 Mb). The optimal chunking depends heavily on the use case. For applications requiring a single snapshot of the entire domain, users benefit from a high temporal and low spatial resolution in data chunking. Conversely, if a time series for a single point is needed, users benefit from a low temporal, high spatial resolution. By chunking in both space and time, we try to strike a balance between these two considerations.
For more information on the structure of Zarr files, data content, usage examples, and access information, please refer to the links provided in the data availability statement (Sect. 4)
Kilometre-scale reanalysis offers distinct advantages over coarse-resolution products, including a more accurate representation of local weather features, an improved ability to resolve extreme events, and a higher spatial resolution for regional climate applications. During the production of DANRA, rigorous quality assurance measures were implemented, including regular monitoring and inter-comparison with ERA5, both in terms of fit to in-situ observations and through case studies about high-impact weather events (Yang et al., 2021). In Denby (2026), monthly verification statistics can be found, which compare DANRA and ERA5 against station observations for the entire reanalysis period. These include verification of key weather parameters (e.g., temperature, wind, humidity) at analysis time against SYNOP station data. For upper-air validation, free-atmosphere parameters (e.g., temperature, wind and humidity profiles) are compared to radiosonde observations. This comprehensive evaluation demonstrates DANRA's performance relative to both observations and ERA5, highlighting its added value for high-resolution applications. In this paper, we present verification statistics to demonstrate DANRA’s superior alignment with surface observations and assess its performance during some of the most extreme weather events.
3.1 Verification against station observations
In the following, we evaluate the agreement between DANRA reanalysis and surface observations of 2 m temperature (T2m) and 10 m wind speed (S10m) across Denmark, using ERA5 as a benchmark. Following the usual practice in operational NWP verification at DMI, this verification utilizes only data from well-established Danish SYNOP stations, which have a long history of reporting to the GTS. The analysis covers the entire 34-year reanalysis period. During the earlier years, the Danish SYNOP network was relatively sparse, with infrequent daily reporting. The data from this period also exhibits various deficiencies, including incorrect units, frozen values, and metadata errors. Since the late 1990s, however, station density and reporting frequency have improved significantly, leading to better data quality and quantity.
To assess overall performance, we begin by comparing modelled and observed near-surface temperature and wind speed. Figures 5 and 6 show scatter plots of T2m and S10m, respectively. In both figures, DANRA exhibits a tighter distribution along the identity line compared to ERA5, indicating reduced standard deviation and improved alignment with observations. Notably, for temperature, DANRA demonstrates a narrower spread, whereas ERA5 reveals a systematic warm bias. For wind speed, DANRA effectively mitigates the persistent underestimation observed in ERA5, particularly at higher wind speeds.
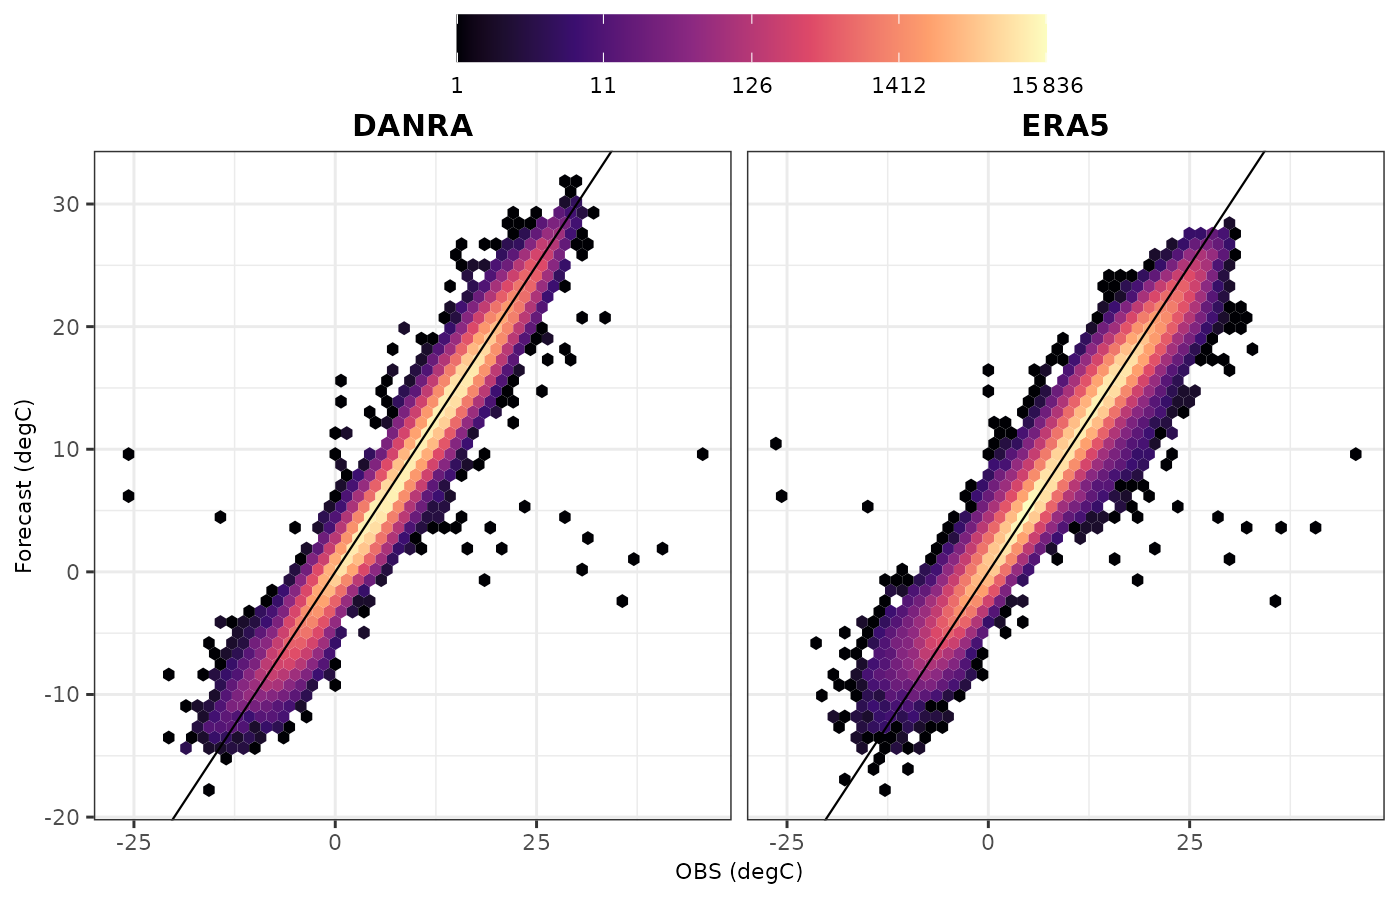
Figure 5Scatter plot of 3-hourly analyses for 2 m temperature (T2m) by DANRA (left) and ERA5 (right) versus SYNOP observations over Denmark during 1990–2023. The color scale shows the density of points.
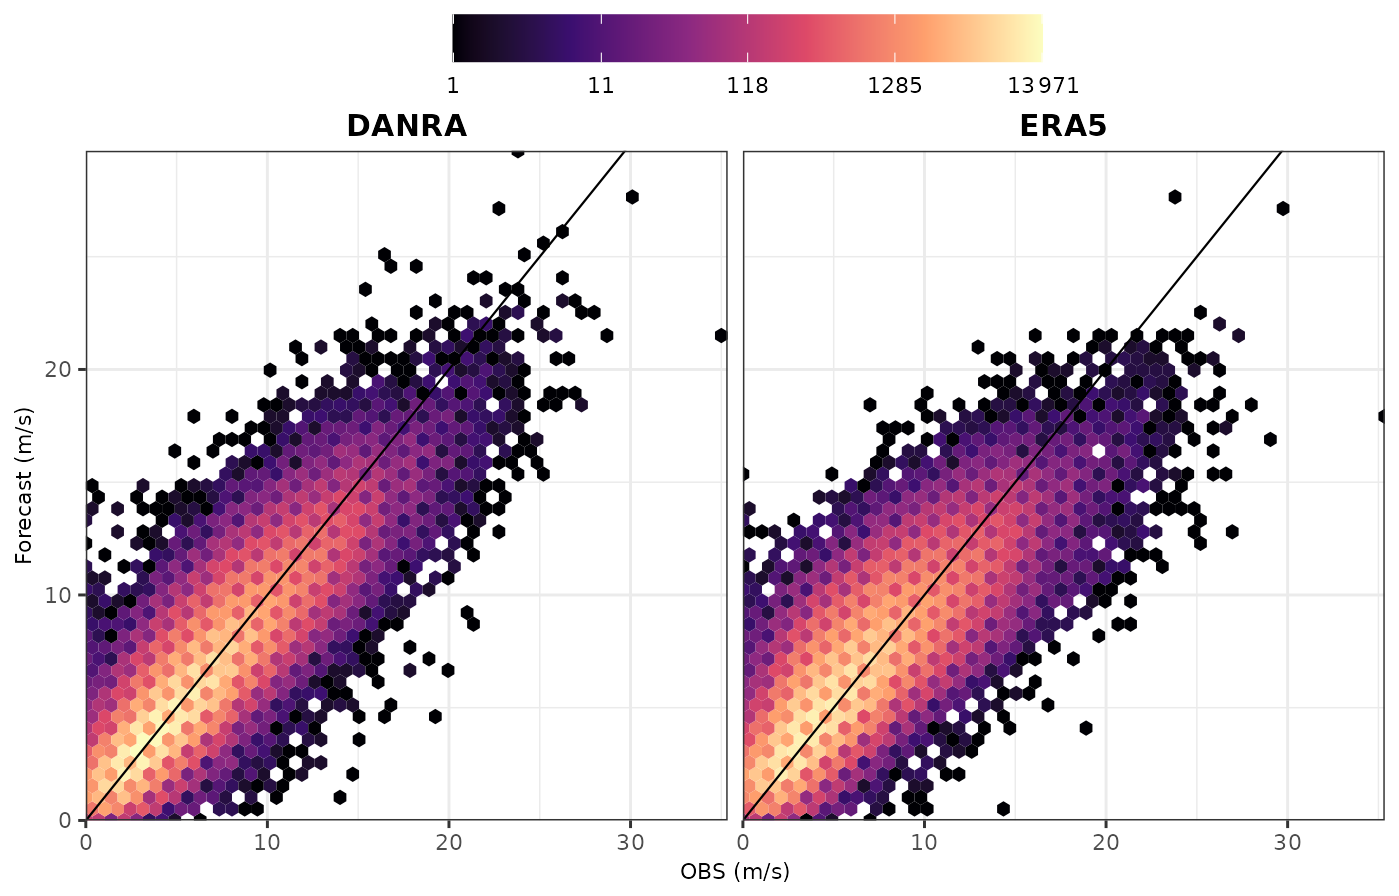
Figure 6Scatterplot of 3-hourly 10 m wind speed (S10m) analyses by DANRA (left) and ERA5 (right) versus SYNOP observations over Denmark during 1990–2023. The color scale shows the density of points.
The long-term verification statistics complement the scatter plots. Figure 7 shows the monthly averaged time series of bias and standard deviation errors comparing fit to T2m observations by the DANRA and ERA5 data sets across the entire reanalysis period (1990–2023).
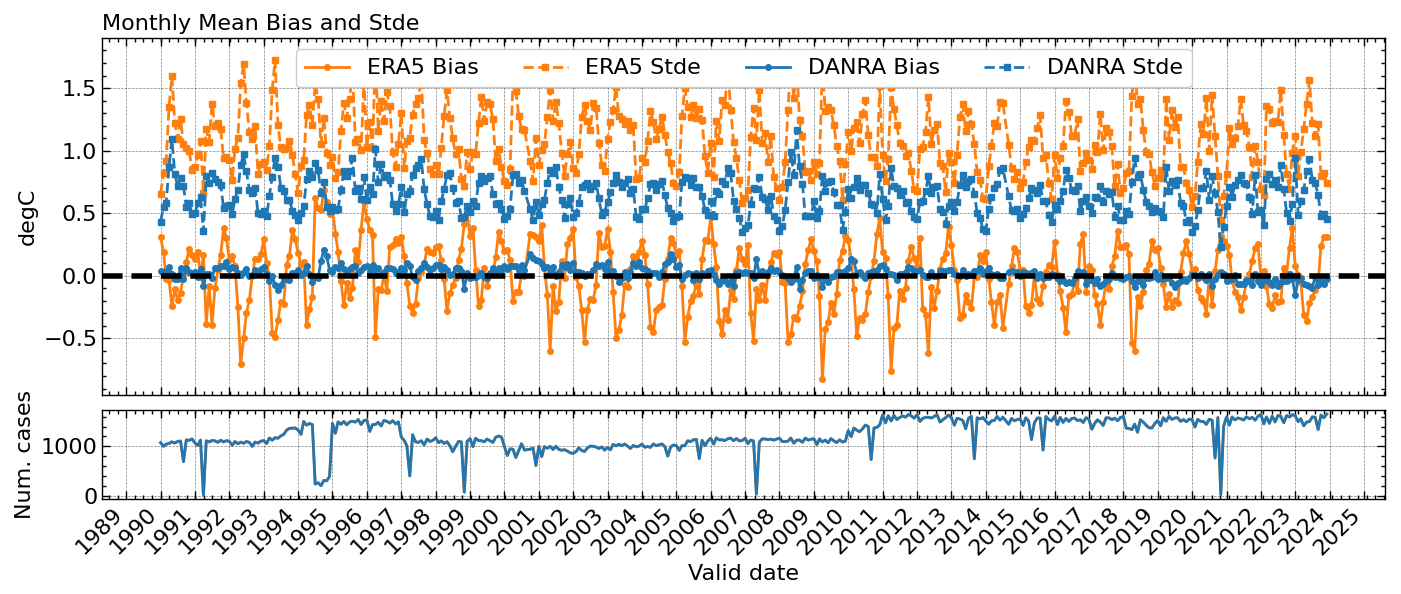
Figure 7Time series of monthly bias and monthly standard deviation errors for T2m in comparison to in-situ observation for the period 1990–2023. The DANRA reanalysis is shown in blue, while ERA5 is shown in orange. The lower panel depicts the corresponding number of matching cases for each month.
Due to its significantly higher model resolution and the assimilation of additional surface observations, DANRA demonstrates a clear added value compared to ERA5 throughout the reanalysis period. As illustrated in the lower panel of Fig. 7, the number of station data available for statistical analysis varies over time. This reflects the evolving nature of observation networks and data availability, a common challenge in climate reanalysis, where changes can sometimes be substantial. In the corresponding time series for S10m as shown in Fig. 8, DANRA reveals a significant advantage in terms of standard deviation error, clearly indicating the added value of higher-resolution reanalysis compared to ERA5. Regarding bias trends, both DANRA and ERA5 exhibit a shift from a negative trend before 2005 to a positive trend in the past two decades. Occasionally, the bias error time series in Fig. 8 shows large jumps, which often coincide with significant drops in the number of sampled data available for statistical analysis. Given the substantial variability and evolution in the number of available observations over the reanalysis period, caution is advised when interpreting trends in bias error, as depicted in both Figs. 7 and 8.
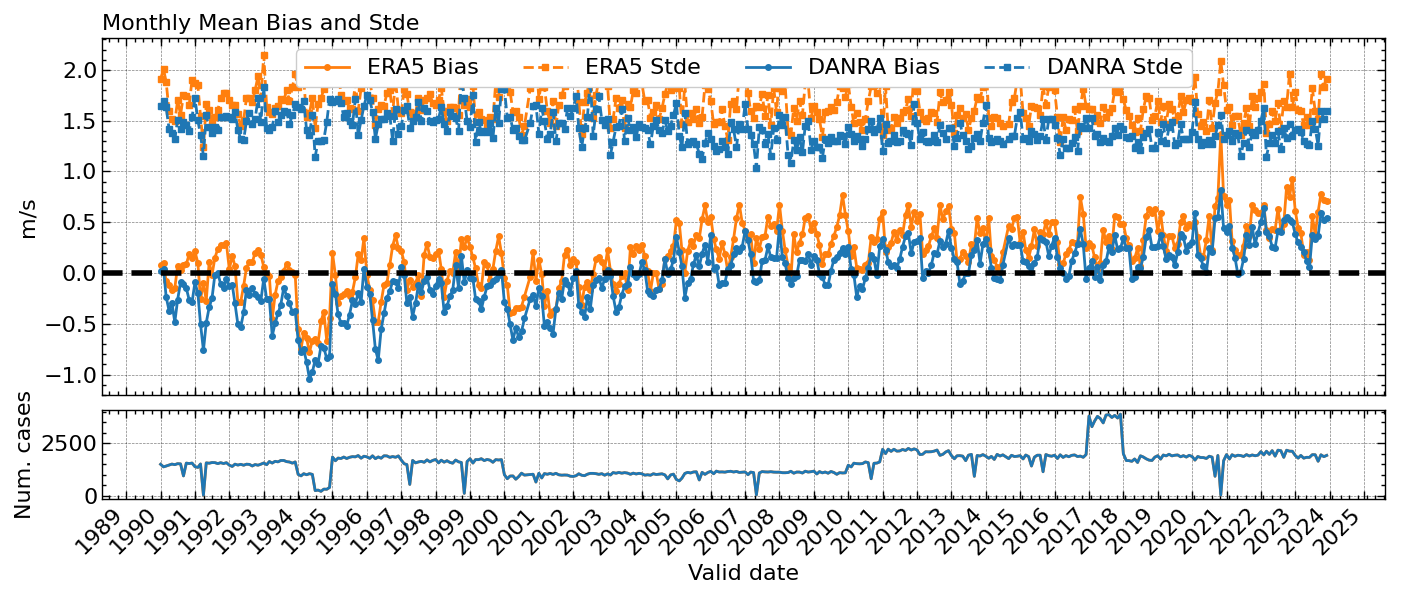
Figure 8Time series of monthly bias and monthly standard deviation errors for S10m in comparison to in-situ observation for the period 1990–2023. The DANRA reanalysis is shown in blue, while ERA5 is shown in orange. The lower panel depicts the corresponding number of matching cases for each month.
It is important to note that, when interpreting the relative performance of reanalysis fits to station observations, surface wind observations, unlike T2m, are not directly assimilated into the reanalysis process. Consequently, the agreement between reanalysis and independent wind measurements is more strongly influenced by representation errors. As a result, the correspondence between modelled and observed wind speed time series is less precise than that for T2m.
3.2 DANRA's representation of extreme weather events
For regional climate reanalysis, DANRA must demonstrate a strong capability to accurately represent major weather events and extreme climate conditions throughout the reanalysis period. In Yang et al. (2021), the DANRA reanalysis was evaluated for its representation of historical storms and heavy precipitation events. In this study, we present DANRA's performance in simulating three extreme events: a storm, a historical heatwave, and a flash flood. To highlight the added value of km-scale reanalysis, we also compare DANRA with both the 5.5 km CERRA reanalysis data and the 31 km global ERA5 reanalysis data, both of which are available through the Copernicus Climate Data Store (CDS). Note that in these case studies, while the T2m and S10m data at (3-hourly) analysis time (00:00, 03:00 UTC…) are extracted from reanalysis, for hourly data at non-analysis time (01:00, 02:00 UTC…), short-range forecasts of 1 to 2 h have been extracted. For precipitation, accumulated precipitation from the twice-daily reanalysis forecast steps has been extracted.
3.2.1 Historical storm on 3 December 1999
One of the most powerful cyclones in Denmark's modern history, the 3 December 1999 storm, serves as our case study for extreme wind events. This intense extratropical cyclone, marked by hurricane-force sustained winds, underwent rapid deepening over the North Sea before tracking eastward and crossing Denmark from the late afternoon of 3 December into the early hours of 4 December. At 18:00 UTC, the storm reached its peak intensity over Denmark, with a minimum surface pressure of 952 hPa near Skive in North Jutland (Voldborg, 2000). During its passage, hurricane-force average wind speeds were recorded at multiple locations. Raw data reveal that both Rømø (Wadden Sea) and Røsnæs (western Zealand) registered an extreme average wind speed of 41.2 m s−1. At Rømø, wind gusts reached 51.4 m s−1 before the instrument was destroyed. Even inland, the storm produced exceptional winds – most notably in Skrydstrup (Southern Jutland), where a mean wind speed of 31.4 m s−1 approached hurricane force, despite the station's inland location.
In addition to the extreme winds, the event also generated a major storm surge, with water levels rising to 5.0 m above normal – nearly breaching the dikes in the Wadden Sea. Fortunately, the peak wind speeds coincided with an astronomical low tide, which significantly reduced the potential impact.
Figure 9a shows the ERA5 analyses for MSLP and 10 m wind speed at 18:00 UTC on 3 December 1999 (upper panel). Notably, no 958 hPa isobars are present, and hurricane-force winds (>32.6 m s−1) are absent – even over coastal waters. The maximum mean wind speed in ERA5 reaches only 28.5 m s−1, corresponding to a “violent storm” scale on the Beaufort scale. This simulated peak is approximately 30 % lower than the observed peak winds at coastal stations along western Jutland. Similarly, the 5.5 km CERRA reanalysis (Fig. 9b), also appears to underestimate the storm's intensity, with a simulated surface pressure that is too shallow. In contrast, the DANRA reanalysis (Fig. 9c), with a minimum pressure of 954 hPa, provides a much closer match to observation in both magnitude and spatial positioning.
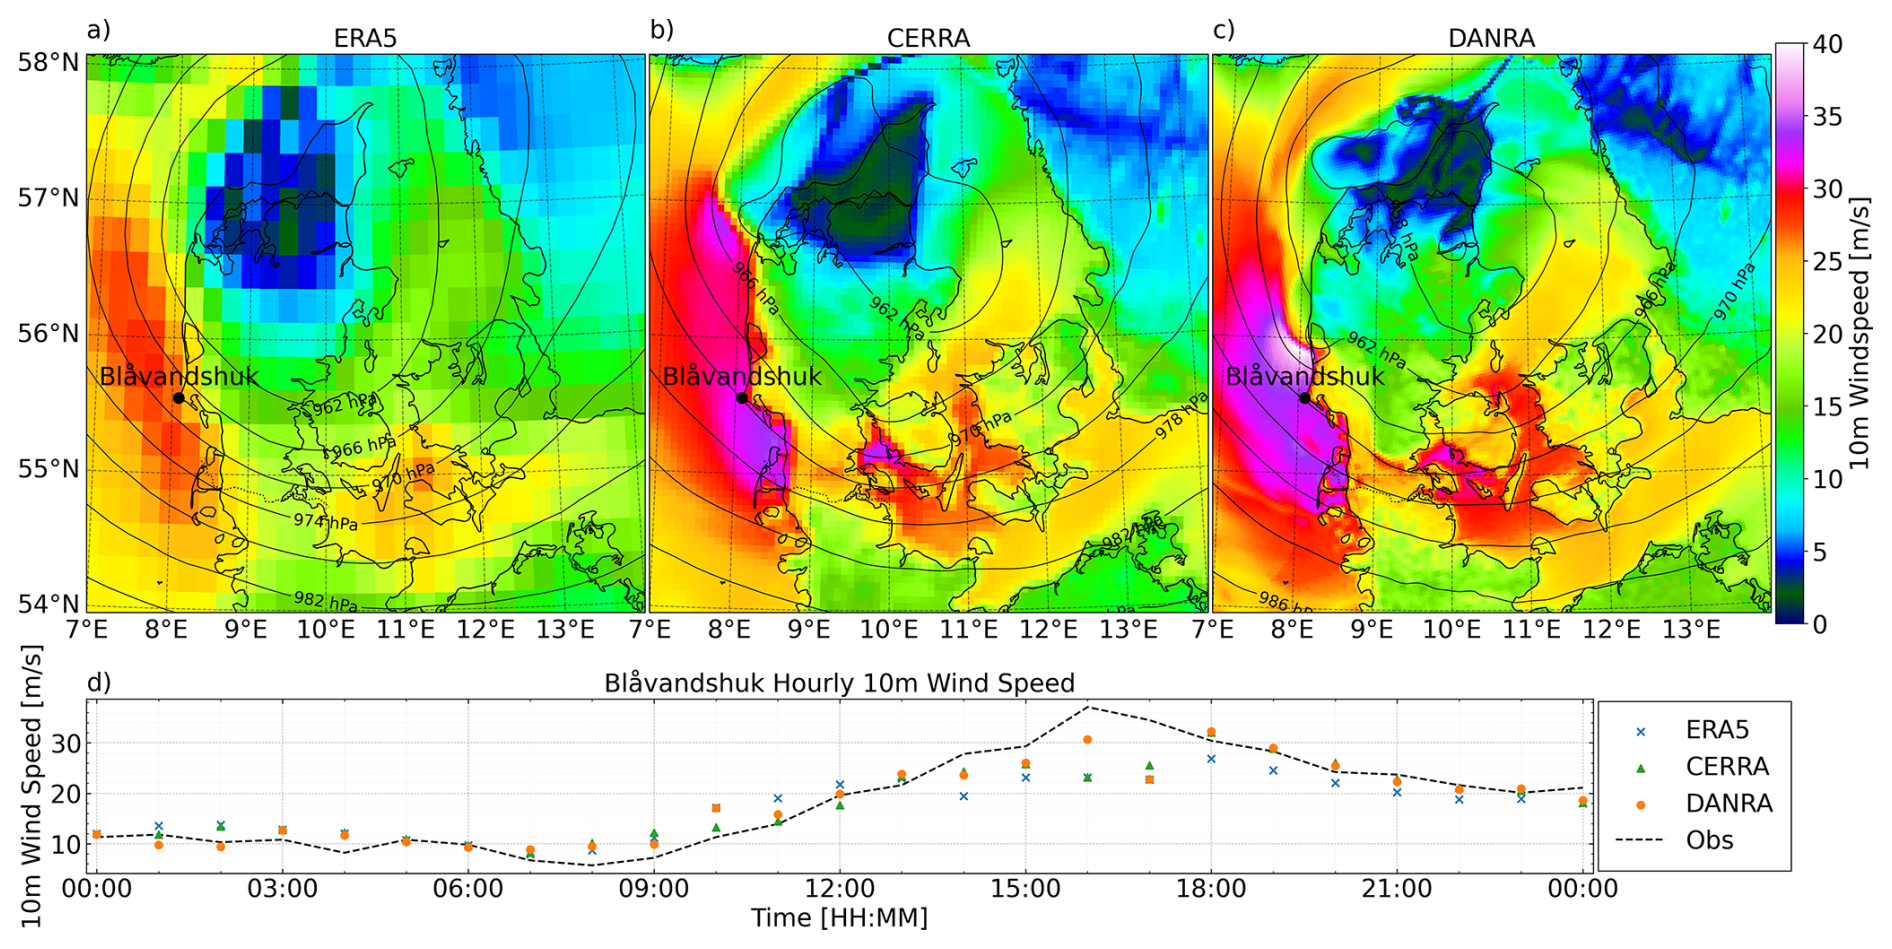
Figure 910 m Wind Speed and Mean Sea Level Pressure on 3 December 1999, 18:00 UTC. Comparison of ERA5, CERRA, and DANRA reanalyses during the December 1999 hurricane, one of the most severe extratropical cyclones to affect Denmark in modern times. The top panels show spatial distributions of 10 m wind speeds with mean sea-level pressure contours at 4 hPa intervals. The bottom panel shows hourly 10 m wind speeds measured at the Blåvandshuk SYNOP station (black dashed line) together with the corresponding values from ERA5 (blue), CERRA (green), and DANRA (orange).
In terms of wind speed, DANRA data also demonstrates significantly improved alignment with observations. At 18:00 UTC, both CERRA and DANRA feature strong pressure gradients, resulting in a markedly higher wind speed than ERA5. Specifically, in DANRA, coastal regions just north of Blåvandshuk include several grid cells (highlighted in whitish colors) with wind speeds approaching 40 m s−1, peaking at 40.2 m s−1 – though this area lacks weather stations for direct validation. Where stations are available, mean wind speeds consistently range from 33 to 38 m s−1, closely matching in-situ measurements from DMI’s automated weather stations.
In Fig. 9d, hourly measurement time series from Blåvandshuk are compared with the nearest grid cells data from ERA5, CERRA, and DANRA. All three reanalyses track the storm's evolution well until the peak period between 15:00 and 18:00 UTC, when their performance diverges. While observations show a clear wind speed peak at 16:00 UTC, ERA5 and CERRA time series depict a slower increase, reaching their maximum at 18:00 UTC. In contrast, the DANRA time series exhibits a double-peak pattern, with wind speed exceeding 30 m s−1 at both 16:00 and at 18:00 UTC. The temporal decrease in DANRA is caused by a mesoscale feature of the simulated storm. Whether this feature is a model artifact or is missing from observations due to the spatial resolution cannot be determined. Nevertheless, DANRA provides the best overall match to the observed time series.
3.2.2 Historical heat wave, 20 July 2022
The ability to reproduce temperatures correctly is one of the most important objectives in operational NWP as well as reanalysis products. We examine here a historically hot day in July 2022 and compare DANRA data with CERRA as well as ERA5.
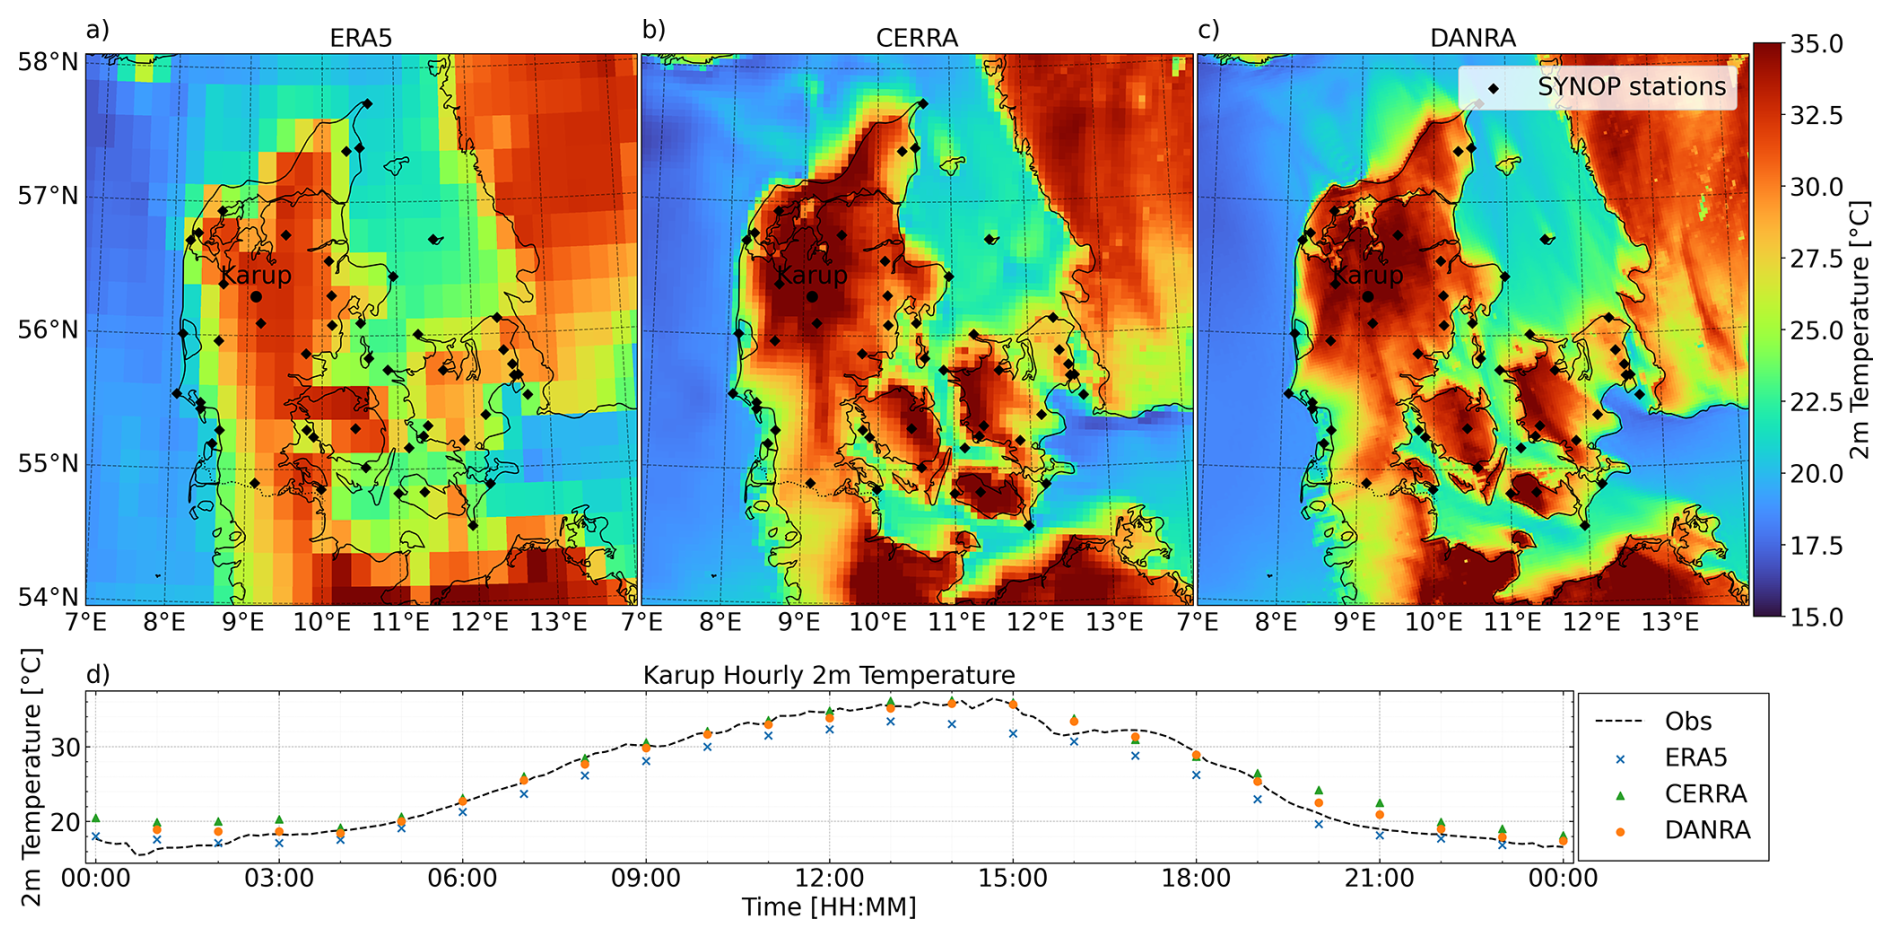
Figure 102 m Temperature – 20 July 2022, 15:00 UTC. Comparison of ERA5, CERRA, and DANRA reanalyses during the historic 20 July 2022 heatwave, which set the highest measured Danish temperature record of 36.7 °C at Karup. The top panels show spatial distributions of 2 m temperature. The bottom panel shows hourly 2 m temperatures measured at the Karup SYNOP station (black dashed line) together with the corresponding values from ERA5 (blue), CERRA (green), and DANRA (orange). The small black dot in the figures indicate positions of the official Danish SYNOP observation stations.
On 20 July 2022, an intense surge of hot air from the south and southeast swept across Northern Europe, pushing temperatures in Denmark to unprecedented levels. At over 10 official weather stations operated by DMI, temperatures soared above 35 °C. The highest recorded temperature, 36.7 °C, was observed at Karup station in central Jutland, marking the highest temperature ever measured in Denmark. The heatwave was widespread, with temperatures exceeding 35 °C across Jutland, Funen, and Lolland. Due to the southeasterly winds, the most extreme temperatures occurred in the northwestern part of each region. In these areas, the air had passed over large stretches of sun-heated land, which enhanced the transfer of sensible heat from the ground to the atmosphere. In contrast, coastal stations with onshore winds recorded the lowest temperatures, as the surrounding waters averaged just under 20 °C. Downwind of fjords, bays, and other bodies of water, cooler air extended inland, while offshore winds carried warm air out to sea before it could cool. Even areas near lakes exhibited slightly lower temperatures. Accurately reproducing these spatial temperature variations in numerical weather prediction (NWP) models requires sufficient horizontal resolution.
Figure 10 shows the 2 m temperature reanalysis by ERA5 (panel a), CERRA (panel b), and DANRA (panel c) at 15:00 UTC on 20 July 2022, when maximum temperatures have been simulated. In Fig. 10d, time series of the 2 m temperature from observation in station Karup, mid-Jutland in Denmark, with a 10 min interval, have been plotted, together with hourly model data from the nearest grid boxes from ERA5, CERRA, and DANRA. For this historical heat wave case, simulations by both regional reanalyses, CERRA and DANRA, show an excellent correspondence in comparison to the measurement record. As shown in Fig. 10, for that day, a relatively widespread region in Denmark has had temperatures over 35 °C, according to simulations by both CERRA and DANRA. Temperature of over 37 °C is simulated over a narrow, elongated band in western and northwestern Jutland with peak value in DANRA reaching as high as 37.8 °C. Although this cannot be directly verified due to a lack of 2 m temperature measurements in that area, it testifies to a historically hot day with exceptionally high temperatures. On the same day, 40.1 °C was recorded in Hamburg in northern Germany.
ERA5 also simulates a very warm day with widespread temperatures over 32 °C. The highest simulated grid value is also found in the northern part of central Jutland, where, according to ERA5, the temperature is 34.7 °C. This value is lower than what has been measured in many places at official weather stations, and 3.1 °C lower than the highest grid value that appears in DANRA. For station Karup, as shown in Fig. 10d, the ERA5 data appears to suffer a cold bias of around 5 °C close to the peak of the event.
It is evident that, owing to the coarser horizontal resolution, the same level of detail shown in kilometer scale DANRA is not visible with ERA5. The temperature footprint of the island of Bornholm, in the middle of the Baltic Sea, is not observable in ERA5. In general, the temperature gradient between sea and land in ERA5 is irregular and not as realistic as in DANRA.
While comparing model simulations such as those in Fig. 10 against observations on fine-scale variability of temperature fields as revealed by the kilometer-scale model DANRA, it may be interesting to reflect on the limitations of the existing observation network in representation of important weather where small-scale features may be dominating. In Fig. 10a–c, station positions of the Danish SYNOP observation network have been marked by small black dots to illustrate the distribution of the surface observation network. While this variability appears to contain many small scale details, presumably as consequence of forcing of various origins including both external and local conditions, it is evident that the existing surface observation network as shown in the Fig. 10, owing to the limitation in station density, is far from sufficient to resolve/represent all the essential scales of importance affecting weather and climate.
3.2.3 Extreme cloudburst over south Jutland, 20 August 2007
On the evening of 20 August 2007, an extremely violent cloudburst struck the south-eastern part of Jutland, where enormous amounts of rain fell locally within a short time. At Gråsten, a now decommissioned DMI station recorded 142 mm of rain in one and a half hours, and a subsequent analysis of radar-estimated precipitation concluded that the rainfall intensities were exceptionally high. During this episode, the maximum precipitation within 10 min was 53 mm, and 111.3 mm within 30 min. For comparison, according to DMI definition, a cloudburst in Denmark is defined as more than 15 mm in 30 min. Thus, at the peak of this event, the precipitation intensity was more than ten times the cloudburst threshold. The consequences of the extreme rainfall included a road being washed away by the tremendous water masses and a railway line becoming undermined, so that the tracks were left hanging freely several meters above the ground. Fortunately, no one was injured during the extreme event.
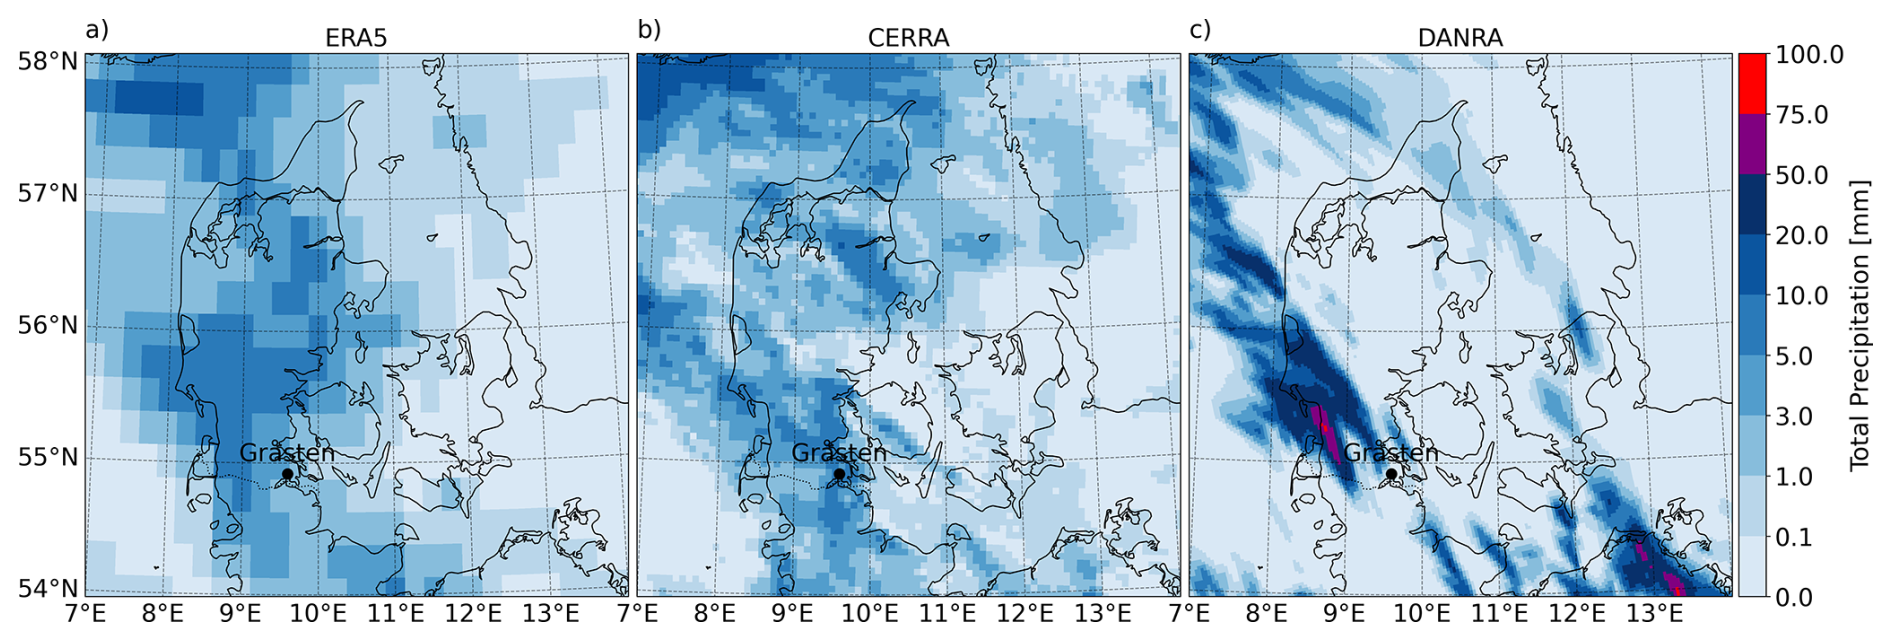
Figure 11Accumulated Precipitation – 20 August 2007, 15:00–21:00 UTC. Comparison of ERA5, CERRA, and DANRA reanalyses during the 20 August 2007 cloudburst, an extreme precipitation event recorded in Denmark, with more than 140 mm falling in 1.5 h over Gråsten. Each panel shows the spatial distribution of precipitation totals accumulated over the 6 h period ending at 21:00 UTC.
Figure 11a, b, and c present the precipitation output from ERA5, CERRA, and DANRA, respectively, during the period between 15:00 and 21:00 UTC on the evening of the cloudburst event. It is shown that DANRA produces a clear convective precipitation signal, with maximum simulated total precipitation exceeding 75 mm over an elongated area about 30 km northwest of Gråsten, the approximate center of the event. Despite a slight phase shift in the central location of the simulated convection, given the inherent challenges in forecasting convective storms – both temporally and spatially, it appears to be a great success that the kilometer-scale DANRA succeeds in reproducing the signature of intense convective activity. In contrast, the heavy convection situation appear absent in both of the other two reanalyses ERA5 and CERRA. The simulated precipitation amounts with these coarser-resolution reanalyses are generally very low, with accumulated rain well below double digits in millimeters. This highlights a key constraint in simulating events driven by deep moist convection, where kilometer-scale spatial resolution is an essential requirement to ensure that reanalysis projects accurately represent localized and convective precipitation.
4.1 Availability of DANRA data
DANRA reanalyses generate gridded data for a large number of weather and climate variables, both at 3-hourly analysis time. Some of the parameters are defined on height or pressure levels, the rest are on a single level.
The DANRA reanalysis data, available at three-hour intervals at 00:00, 03:00, 06:00, …, and 21:00 UTC daily (analysis data), can be accessed from an Amazon S3 object store. The data is split into three different Zarr datasets:
-
s3://dmi-danra-05/height_levels.zarr
-
s3://dmi-danra-05/single_levels.zarr
-
s3://dmi-danra-05/pressure_levels.zarr
Fetching one of these datasets with Python and xarray using lazy loading is as simple as
ds_danra_sl = xarray.open_zarr(
 "s3://dmi-danra-05/single_levels.zarr",
 consolidated=True,
 storage_options={
  "anon": True,
 }
)
Efforts are currently underway to prepare the DANRA forecasts for public release. Once available, the dataset will provide hourly temporal resolution. Updates and further details will be posted on the DANRA documentation website https://dmidk.github.io/danradocs (last access: 2 February 2026), which already includes information on the Zarr file structure, data access, and usage examples.
The dataset is published at https://doi.org/10.5281/zenodo.17294179 (Yang et al., 2025).
4.2 Availability of DANRA validation results
A vast amount of validation plots have been produced and examined as part of this work. All validation plots have been published in Denby (2026, https://doi.org/10.5281/zenodo.18954176).
Over recent years, atmospheric reanalysis has become an indispensable tool in climate research and monitoring. By applying data assimilation tools within state-of-the-art operational NWP systems, reanalysis generates long-term, gridded datasets of past atmospheric states. Unlike traditional climate statistics derived from observational records, reanalysis datasets offer the distinct advantages of spatial completeness, temporal continuity, and consistency – attributes that are particularly valuable for climate studies due to the use of a fixed model version. This study introduces DANRA, a 34-year climate reanalysis dataset focused on the Danish region, generated by a high-resolution (2.5 km grid-spacing) regional atmospheric reanalysis system. It provides gridded, gap-free climate information with unprecedented detail and fidelity for use in climate research and societal applications in Denmark.
DANRA integrates components from both the operational NWP model at DMI and the CARRA, both of which are based on HARMONIE-AROME 40h1. During the development phase, the system and its production infrastructure, including modules for monitoring, quality assurance, and post-processing, were established. The DANRA reanalysis was carried out on the ECMWF HPCF, leveraging existing infrastructure from regional reanalysis projects such as CARRA and CERRA, particularly for observation data management.
Extensive work on local observation data acquisition, quality assurance, and data rescue has been conducted to enhance observation input in the reanalysis. Quality assurance for DANRA involves validation against in-situ observations, as well as inter-comparison to the corresponding datasets from other reanalysis projects, with the underlying assumption that high-resolution regional reanalyses should outperform coarser resolution products in representing key weather parameters (e.g., near-surface temperature, wind, and humidity) due to their enhanced ability to resolve local surface effects. As described in this paper, both the validation statistics and case studies confirm this expectation, demonstrating the added value of DANRA’s high resolution and integration of dense, quality-controlled observations in representing the weather and climate characteristics important to various applications, such as climate research and adaptation.
A fundamental requirement for climate reanalysis datasets is the precise depiction of weather extremes, which are expected to become more frequent and intense due to global warming. In Denmark, high-impact events such as flash floods, storms, and heatwaves are heavily influenced by local surface conditions, making their accurate simulation highly dependent on model resolution.
Analyses of severe storm events over the past three decades – many of which reached hurricane-scale intensity – demonstrate that DANRA (Danish Reanalysis) more faithfully reproduces strong wind conditions compared to coarser-resolution reanalyses. As a cloud-resolving model, DANRA also excels in simulating heavy precipitation events with strong local characteristics, whereas coarser models like ERA5 often underestimate or entirely miss these events.
Inter-comparisons among ERA5, CERRA, and DANRA in case studies of high-impact weather extremes, including wind, temperature, and precipitation, reveal a clear pattern: higher grid resolution consistently improves the accuracy of event representation. These findings underscore the effectiveness of the kilometer-scale HARMONIE-AROME model in capturing local-scale weather features, such as severe convective events, and affirm DANRA's role as a valuable tool for regional climate research as well as renewable energy planning in Denmark, to mention a few applications.
With its high spatial grid-spacing of 2.5 km and temporal coverage spanning more than three decades, the DANRA dataset provides a unique foundation for advancing research on data-driven models. In particular, it supports the development and evaluation of lam-based machine learning frameworks that rely on the accurate representation of fine-scale atmospheric processes, such as coastal circulations, convective initiation, and orographic precipitation. These detailed structures, often unresolved or poorly represented in global reanalyses, are crucial for enhancing predictive skill at regional scales and for exploring new modeling methodologies.
XY designed and conceptualized the project as well as performing supervision, validation and writing. CP, BA and KSH did methodology, validation, visualization and writing. SBT, LD, SKC and HS performed data curation, writing and created software for data processing. SP and MS did visualisation and writing.
The contact author has declared that none of the authors has any competing interests.
Publisher's note: Copernicus Publications remains neutral with regard to jurisdictional claims made in the text, published maps, institutional affiliations, or any other geographical representation in this paper. The authors bear the ultimate responsibility for providing appropriate place names. Views expressed in the text are those of the authors and do not necessarily reflect the views of the publisher.
DANRA has benefited from the system and observation data infrastructure in the ERA5, CARRA, and CERRA. Colleagues at the DMI Weather Research Department, especially Irene Livia Kruse, Bent Hansen Sass, Rune Carbuhn Andersen, and Julia Sommer, are acknowledged for providing various support during different stages of the DANRA project. Eoin Whelan from Met Éireann is acknowledged for providing GRIB data extraction scripts from the Met Éireann ReAnalysis (MERA). THE EUMETSAT ROM-SAF team is acknowledged for making available the ROM-SAF ICDR data with reprocessed Radio Occultation bending angle for assimilation in ERA5. We acknowledge the two anonymous reviewers who helped improve the manuscript.
DANRA project is supported by the Danish National Center for Climate Research.
This paper was edited by Qingxiang Li and reviewed by two anonymous referees.
Bengtsson, L., Andrae, U., Aspelien, T., Batrak, Y., Calvo, J., de Rooy, W., Gleeson, E., Sass, B. H., Homleid, M., Hortal, M., Ivarsson, K.-I., Lenderink, G., Niemelä, S., Nielsen, K. P., Onvlee, J., Rontu, L., Samuelsson, P., Santos Muñoz, D., Subias, A., Tijm, S., Toll, V., Yang, X., and Køltzow, M. O.: The HARMONIE-AROME model configuration in the ALADIN-HIRLAM NWP system, Mon. Weather Rev., https://doi.org/10.1175/MWR-D-16-0417.1, 2017. a, b
Carver, R. W. and Merose, A.: ARCO-ERA5: An Analysis-Ready Cloud-Optimized Reanalysis Dataset, in: 22nd Conference on AI for Environmental Science, American Meteorological Society, Denver, CO, https://ams.confex.com/ams/103ANNUAL/meetingapp.cgi/Paper/415842 (last access: 2 February 2026), 2023. a
Davis, E., Taylor, K. E., Adloff, F., Gregory, J., Lawrence, B., and Lee, D.: Supporting Open Science with the CF Metadata Conventions for NetCDF, Zenodo, https://doi.org/10.5281/zenodo.15015065, 2024. a
Denby, L.: DANRA reanalysis verification plots, arXiv [data set], https://doi.org/10.5281/zenodo.18954176, 2026. a, b
EUMETSAT ROM SAF: Validation Report for the ROM SAF Interim Climate Data Record (ICDR) v1.1, Tech. Rep. ROM-SAF-VR-ICDRv1.1, EUMETSAT Radio Occultation Meteorology Satellite Application Facility (ROM SAF), version 1.1, describing Level 1B bending angle and Level 2-3 products, https://rom-saf.eumetsat.int/product_documents/romsaf_vr_icdr_v11.pdf (last access: 2 February 2026), 2020. a
Gleeson, E., Whelan, E., and Hanley, J.: Met Éireann high resolution reanalysis for Ireland, Adv. Sci. Res., 14, 49–61, https://doi.org/10.5194/asr-14-49-2017, 2017. a, b
Gowan, T. A., Horel, J. D., Jacques, A. A., and Kovac, A.: Using Cloud Computing to Analyze Model Output Archived in Zarr Format, J. Atmos. Ocean. Tech., 39, 449–462, https://doi.org/10.1175/JTECH-D-21-0106.1, 2022. a
Gualtieri, G.: Analysing the uncertainties of reanalysis data used for wind resource assessment: A critical review, Renew. Sust. Energ. Rev., 167, 112741, https://doi.org/10.1016/j.rser.2022.112741, 2022. a
Hersbach, H., Bell, B., Berrisford, P., Hirahara, S., Horányi, A., Muñoz-Sabater, J., Nicolas, J., Peubey, C., Radu, R., Schepers, D., Simmons, A., Soci, C., Abdalla, S., Abellan, X., Balsamo, G., Bechtold, P., Biavati, G., Bidlot, J., Bonavita, M., De Chiara, G., Dahlgren, P., Dee, D., Diamantakis, M., Dragani, R., Flemming, J., Forbes, R., Fuentes, M., Geer, A., Haimberger, L., Healy, S., Hogan, R. J., Hólm, E., Janisková, M., Keeley, S., Laloyaux, P., Lopez, P., Lupu, C., Radnoti, G., de Rosnay, P., Rozum, I., Vamborg, F., Villaume, S., and Thépaut, J.-N.: The ERA5 global reanalysis, Q. J. Roy. Meteor. Soc., 146, 1999–2049, https://doi.org/10.1002/qj.3803, 2020. a, b, c
Hoyer, S. and Joseph, H.: xarray: N-D labeled Arrays and Datasets in Python, Journal of Open Research Software, 5, https://doi.org/10.5334/jors.148, 2017. a
Hunt, K. M. R. and Bloomfield, H. C.: Quantifying renewable energy potential and realized capacity in India: Opportunities and challenges, Meteorol. Appl., 31, https://doi.org/10.1002/met.2196, 2024. a
Kölling, T., Kluft, L., and Rackow, T.: gribscan, Zenodo, https://doi.org/10.5281/zenodo.10625188, 2025. a
Køltzow, M., Schyberg, H., Støylen, E., and Yang, X.: Value of the Copernicus Arctic Regional Reanalysis (CARRA) in representing near-surface temperature and wind speed in the north-east European Arctic, Polar Res., 41, https://doi.org/10.33265/polar.v41.8002, 2022. a
Lam, R., Sanchez-Gonzalez, A., Willson, M., Wirnsberger, P., Fortunato, M., Alet, F., Ravuri, S., Ewalds, T., Eaton-Rosen, Z., Hu, W., Merose, A., Hoyer, S., Holland, G., Vinyals, O., Stott, J., Pritzel, A., Mohamed, S., and Battaglia, P.: GraphCast: Learning skillful medium-range global weather forecasting, arXiv, https://doi.org/10.48550/arXiv.2212.12794, 2023. a
Miles, A., jakirkham, Orfanos, D. P., Stansby, D., Hamman, J., Bennett, D., Bussonnier, M., Moore, J., Augspurger, T., Cherian, D., Rzepka, N., Jones, M., Spitz, H., Verma, S., Bourbeau, J., Fulton, A., Abernathey, R., Lee, G., Kristensen, M. R. B., Patel, Z., Chopra, S., Aghangu, A. D., Zimmerman, N., Rocklin, M., de Andrade, E. S., Hunt-Isaak, I., Gold, I., and Durant, M.: zarr-developers/zarr-python:v3.1.2, Zenodo, https://doi.org/10.5281/zenodo.16942992, 2025. a
Møller, J. T.: Denmark, in: Artificial Structures and Shorelines, edited by: Walker, H. J., 91–101, Springer Netherlands, Dordrecht, https://doi.org/10.1007/978-94-009-2999-9_13, 1988. a
Nakamura, H., Kobayashi, S., Wanzala, M. A., Adloff, F., Cheng, L., Cobb, A., Dee, D., Akkraoui, A. E., Fujiwara, M., Hersbach, H., Naoe, H., Rani, S. I., Rayner, N., Simmons, A., Slivinski, L., Tanaka, T., Thorne, P., Yang, C., Yin, Y., Ayinde, A. S., Banerjee, A., Bosilovich, M. G., Buela, L. C. M., Dong, B., Fukui, S., Hirose, N., Ikeuchi, H., Krakauer, N., Lenouo, A., Niraula, B., Oikonomou, C. L. G., Sekizawa, S., Sharma, N., Yamazaki, A., and Yoshida, T.: Toward Future Reanalyses That Meet Evolving Needs in Science, Public Services, Policymaking, and Socioeconomic Activity, B. Am. Meteorol. Soc., 106, E1445–E1453, https://doi.org/10.1175/BAMS-D-25-0126.1, 2025. a
Price, I., Sanchez-Gonzalez, A., Alet, F., Andersson, T. R., El-Kadi, A., Masters, D., Ewalds, T., Stott, J., Mohamed, S., Battaglia, P., Lam, R., and Willson, M.: Probabilistic weather forecasting with machine learning, Nature, 637, 84–90, https://doi.org/10.1038/s41586-024-08252-9, 2025. a
Ridal, M., Bazile, E., Le Moigne, P., Randriamampianina, R., Schimanke, S., Andrae, U., Berggren, L., Brousseau, P., Dahlgren, P., Edvinsson, L., El-Said, A., Glinton, M., Hagelin, S., Hopsch, S., Isaksson, L., Medeiros, P., Olsson, E., Unden, P., and Wang, Z. Q.: CERRA, the Copernicus European Regional Reanalysis system, Q. J. Roy. Meteor. Soc., 150, 3385–3411, https://doi.org/10.1002/qj.4764, 2024. a, b
Voldborg, H.: Vredens julemåned, Vejret, 82, 1–7, 2000. a
Yang, X., Stig, B., Dahldom, M., Sass, B., Zhuang, S., Amstrup, B., Petersen, C., Nielsen, K. P., Nielsen, N. W., and Mahura, A.: NEA, the Operational Implementation of HARMONIE 40h1.1 at DMI, ALADIN-HIRLAM Newsletter, 8, 104–111, 2017. a, b, c
Yang, X., Nielsen, K., Dahlbom, M., Amstrup, B., Peralta, C., Høyer, J., Englyst, P., Schyberg, H., Homleid, M., Køltzow, M., Randriamampianina, R., Dahlgren, P., Støylen, E., Valkonen, T., Palmason, B., Thorsteinsson, S., Bojarova, J., Körnich, H., Lindskog, M., Box, J., and Mankoff, K.: C3S Arctic regional reanalysis – Full system documentation, Tech. rep., Copernicus Climate Change Service contract 2018/C3S_D322_Lot2_METNorway/SC2 Deliverable Report no. C3S_D322_Lot2.1.1.1, https://dast.data.compute.cci2.ecmwf.int/documents/reanalysis-carra/CARRAFullSystemDocumentationFinal.pdf (last access: 23 March 2026), 2020. a, b, c, d
Yang, X., Hintz, K., Peralta Aros, C., and Amstrup, B.: Final scientific report of the 2020 National Centre for Climate Research Work Package 3.2.1, Regional Reanalysis Pilot, Tech. rep., DMI, https://www.dmi.dk/fileadmin/Rapporter/2021/DMI_Report_21-31.pdf (last access: 2 February 2026), 2021. a, b, c, d
Yang, X., Peralta, C., Amstrup, B., Hintz, K. S., Thorsen, S. B., Denby, L., Christiansen, S. K., Schulz, H., Pelt, S., and Schreiner, M.: DANRA Dataset, Zenodo [data set], https://doi.org/10.5281/zenodo.17294179, 2025. a, b