the Creative Commons Attribution 4.0 License.
the Creative Commons Attribution 4.0 License.
 | 23 Mar 2026
Spatial and morphometric analysis of a comprehensive dataset of loess sinkholes from a small basin in the Chinese Loess Plateau
Francisco Gutiérrez
Sisi Li
Ninglian Wang
Xi-an Li
Xingang Wang
Jinhui Sun
Songbai Wu
From a global perspective, the basic mapping and investigation of the loess sinkholes are far less extensive and in-depth than those of karst sinkholes. To some extent, this has limited people's understanding of the morphological characteristics, development patterns, and formation mechanisms of the loess sinkholes. The Chinese Loess Plateau (CLP) features the most typical loess landforms in the world, where tens of thousands of loess sinkholes have developed. However, due to the lack of high-precision and high-resolution survey data, the identification, characterization, and quantification of sinkholes in the CLP are basically blank, which significantly hinders in-depth research on loess sinkholes. In this study, we investigated a typical watershed in the CLP using photogrammetry, airborne laser scanning, and a handheld laser scanner. Based on previous studies, this paper introduces indices and methods for the morphological quantification of loess sinkholes and constructs the first-ever dataset of loess sinkhole morphology containing 1194 records at the basin scale. On this basis, we completed the spatial mapping of loess sinkholes, analysis of distribution patterns, morphological analysis, size-frequency analysis, fitting analysis of different parameters, estimation of subsurface soil erosion, in-depth investigation of typical sinkholes, and quantification of the contributions of different factors to sinkhole development. These efforts provide rich information for a deeper understanding of the morphological characteristics and genesis of loess sinkholes and offer data support for comparative studies with sinkholes in other regions. More importantly, we preliminarily estimate that the subsurface soil erosion triggered by sinkholes in the study area reaches as high as 345 000 metric tons. This finding underscores that loess sinkholes are not only a geological disaster but also a serious form of soil loss, highlighting their undeniable significance in regional soil erosion studies and laying a solid foundation for subsequent research and disaster prevention efforts. Furthermore, we suggest that the integration of airborne laser scanning and handheld laser scanning may represent a new trend in the detailed investigation of sinkholes in the future. This dataset is available on the Zenodo platform (https://doi.org/10.5281/zenodo.14000267, Hu et al., 2025).
- Article
(52443 KB) - Full-text XML
- BibTeX
- EndNote


It is widely recognized that soil erosion poses a global environmental problem with significant socioeconomic implications (Morgan, 2005; Poesen, 2018; Llena et al., 2024). When the term “soil erosion” is mentioned, most people envision surface processes such as sheet, rill, gully, or gravity erosion. However, subsurface mechanical erosion caused by soil piping and the resulting surface collapse remains largely overlooked (Bernatek-Jakiel and Poesen, 2018). The extensive international literature on soil erosion reveals a pronounced knowledge gap in soil piping research. Soil piping involves the formation of shallow conduits in soils and weakly consolidated sediments through seepage, pipe flow, and mass movements (e.g., wall and roof collapse) (Bernatek-Jakiel and Poesen, 2018). Soil pipes, owing to their concealed nature and complex patterns, are typically detected only after their collapse reaches the surface, forming a sinkhole (Donnelly, 2008; Bernatek, 2015; Bernatek-Jakiel et al., 2017). Ground instability resulting from sinkhole development poses threats to agriculture, transportation infrastructure, water storage facilities, oil and gas pipelines, buildings, and other human assets and activities (Gibbs, 1945; Gutiérrez et al., 2003, 2014; Richards and Reddy, 2007; Peng et al., 2018; Hu et al., 2020). Piping sinkholes contribute to soil erosion and can trigger or exacerbate hazardous processes such as ground collapse, landsliding, debris flows, and gullying (Peng et al., 2018; Li et al., 2020; Hu et al., 2022; Wang et al., 2024). Therefore, gaining insight into the factors controlling piping-related sinkholes, their morphometry, and spatial distribution patterns is of paramount scientific and practical importance (Hofierka et al., 2018; Bernatek-Jakiel et al., 2019).
The identification of sinkholes and the compilation of comprehensive sinkhole inventories constitute a fundamental yet challenging task. In recent decades, several countries have conducted extensive research on karst and piping sinkholes and developed national or regional geodatabases (Gao et al., 2002, 2005; Farrant and Cooper, 2008; Rajabi, 2018; Vennari and Parise, 2022; Hu et al., 2024). Traditional sinkhole mapping primarily relies on topographic maps, digital elevation models (DEM), historical aerial photography, or satellite imagery (Panno et al., 1997; Panno and Luman, 2013; De Carvalho Júnior et al., 2014; Vajedian and Motagh, 2019; Gökkaya et al., 2021). However, the data collected through conventional methods are often hampered by poor spatial resolution, making them inadequate for the comprehensive and accurate mapping and morphometric characterization of soil sinkholes, which are usually small. Consequently, researchers have increasingly turned to unmanned aircraft systems (UAS) equipped with optical lenses, LiDAR sensors, and thermal cameras to investigate piping sinkholes (Lee et al., 2016; Wu et al., 2016; Hofierka et al., 2018; Hu et al., 2020; Li et al., 2024). UAS technology can capture imagery and topographic data with high resolution and accuracy, and may even allow for vegetation filtering in the case of LiDAR data. Despite the variety of techniques and approaches currently available, each still possesses inherent limitations or shortcomings (Bernatek-Jakiel and Poesen, 2018). For instance, although UAS-based photogrammetry can yield high-resolution topographic models, those models do not allow for the reliable measurement of 3D morphometric parameters of piping sinkholes, such as depth or volume (Li et al., 2024). Airborne LiDAR, while capable of partly penetrating vegetation to reveal the underlying ground surface, typically employs orthogonal scanning, thereby missing zones along the vertical walls of collapsed pipes, and consequently failing to capture the complete inner morphology of the sinkholes (Jiang et al., 2024). The aforementioned mapping technologies and methods are suitable for regional sinkhole surveys, but they are inadequate for characterizing the internal morphology of individual sinkholes. In recent years, handheld laser scanners based on simultaneous localization and mapping (SLAM) technology have been developed and successfully applied to forest surveys, archaeological studies, as well as tunnel and sinkhole investigations (Jones and Beck, 2017; Konsolaki et al., 2020; Mokroš et al., 2021; Yuan et al., 2022; Hu et al., 2024; Jiang et al., 2024). When conducting non-destructive identification and characterization of soil pipes and their associated sinkholes, it is essential to select the most suitable investigation technique or to combine several complementary methods, taking into account factors such as the characteristics of the target features and the survey area (Bernatek-Jakiel and Kondracka, 2016; Borah et al., 2022).
A review on soil piping (Bernatek-Jakiel and Poesen, 2018) synthesizes current knowledge globally and outlines directions for future research. By collating data from 230 documented piping sites worldwide, the authors produced the first global map of soil-piping investigations, demonstrating that piping erosion occurs across all climate zones and most soil types. However, the review reveals a striking paucity of research on soil pipes in the Chinese Loess Plateau (CLP), with only two documented study sites. It is widely recognized that the CLP, covering 64×104 km2, hosts the world's most representative loess accumulation. Due to the relatively high permeability, collapsibility, and water sensitivity of loess deposits, together with their porous and jointed structure, pipes and sinkholes can readily form under the presence of water (Li et al., 2010; Geng et al., 2023; Zhang et al., 2026). In recent years, some scholars in China have recognized loess sinkholes as a specific geological hazard and have called for increased attention and research on this process given its growing economic implications (Li et al., 2010, 2020; Peng et al., 2018). The intensity map of sinkhole development in the CLP (Fig. 1) shows that the western region exhibits a higher intensity of sinkhole development compared to the east, particularly in the Dingxi and Huining areas, where sinkhole densities typically reach 243 and 265 sinkholes km−2, respectively (polygon I1 in Fig. 1) (Peng et al., 2018; Hu et al., 2020). Notably, no regional morphometric datasets of piping sinkholes have yet been published, constraining our understanding of their morphological characteristics and developmental patterns.
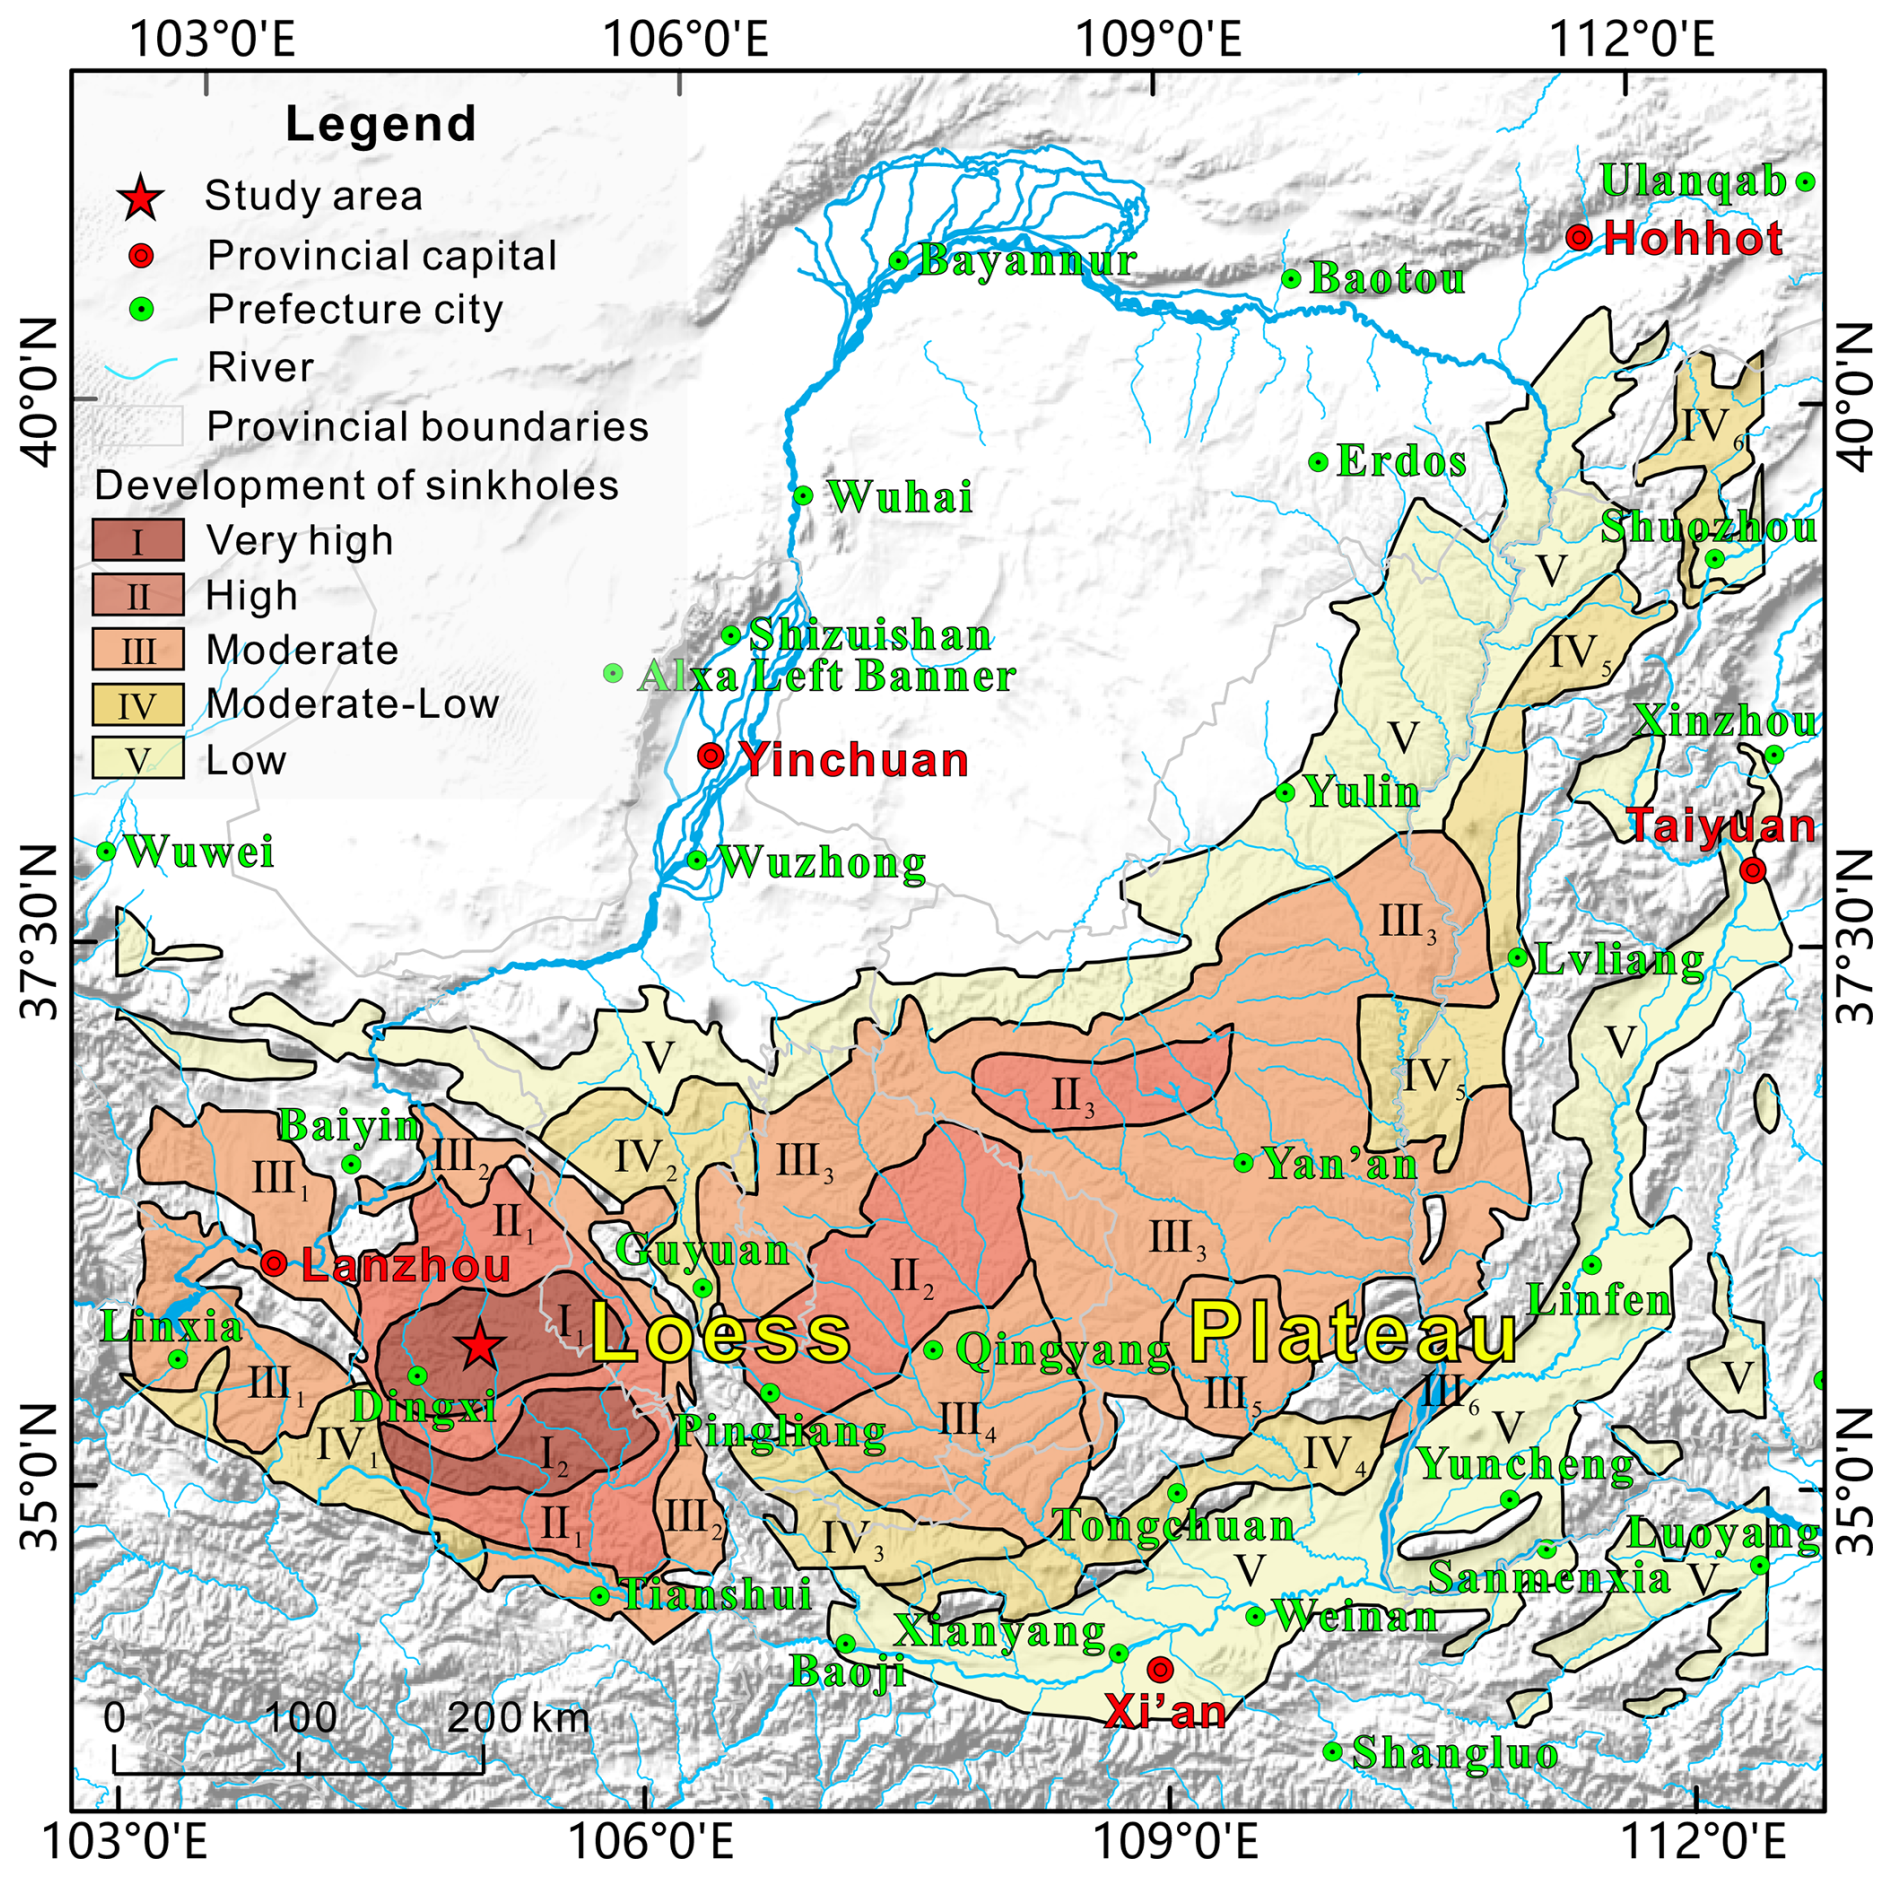
Figure 1Map illustrating the degree of piping-related sinkhole development in the Chinese Loess Plateau, grouped into five categories (Peng et al., 2018; Hu et al., 2020). The star denotes the location of the study area within a zone of very high sinkhole development.
In view of the above, the principal objectives of this study are:
- i.
to perform a comprehensive and high-resolution survey of loess sinkholes in a representative basin of the CLP by integrating UAS photogrammetry, airborne LiDAR, and a SLAM-based handheld laser scanner (HLS);
- ii.
to characterize the morphometric features of the sinkholes and produce an open-access database comprising 1194 sinkhole records, supplemented with data on multiple attributes;
- iii.
to analyze the spatial distribution patterns of the sinkholes and their relationships with other landforms in order to gain insight into the main controlling factors;
- iv.
to conduct an in-situ investigation inside a typical sinkhole using the HLS, evaluating the potential and advantages of SLAM technology for complete sinkhole characterization.
Through these efforts, we aim to partially fill the current knowledge gap on loess sinkholes in the CLP and identify suitable surveying approaches. This will make available a unique case-study dataset to the global soil-piping community and will provide a scientific basis for assessing and managing sinkhole risk in the region. The presented results reveal the strikingly large subsurface erosion volume attributable to piping erosion, underscoring that soil-piping research merits intensified attention, rather than continued neglect.
The study area is a small leaf-shaped watershed drained by the N-flowing Sunjiacha stream. It is located in the southwestern sector of the Loess Plateau of China, approximately 5 km east of Huining city (Fig. 2a–c). The drainage basin is approximately 2960 m long, and 1280 m wide, covering about 2.4 km2, and is characterized by sparse grassland vegetation. The elevation ranges from 2070 (highest point of the divide) to 1724 (outlet), resulting in a local relief of 346 m. The region is characterized by a semi-arid temperate monsoon climate, with a mean annual precipitation of 370 mm. Much of the rainfall occurs between May and September, and frequent severe rainfall events can account for up to 96 % of the monthly precipitation (Hu et al., 2020). Sunjiacha stream is an ephemeral channel that carries water flow after storms or rainy periods. Most of the slopes in the basin, with the exception of some sectors in the lower part, have been transformed into a terraced landscape on loess deposits for cultivation and erosion control (Fig. 2b).
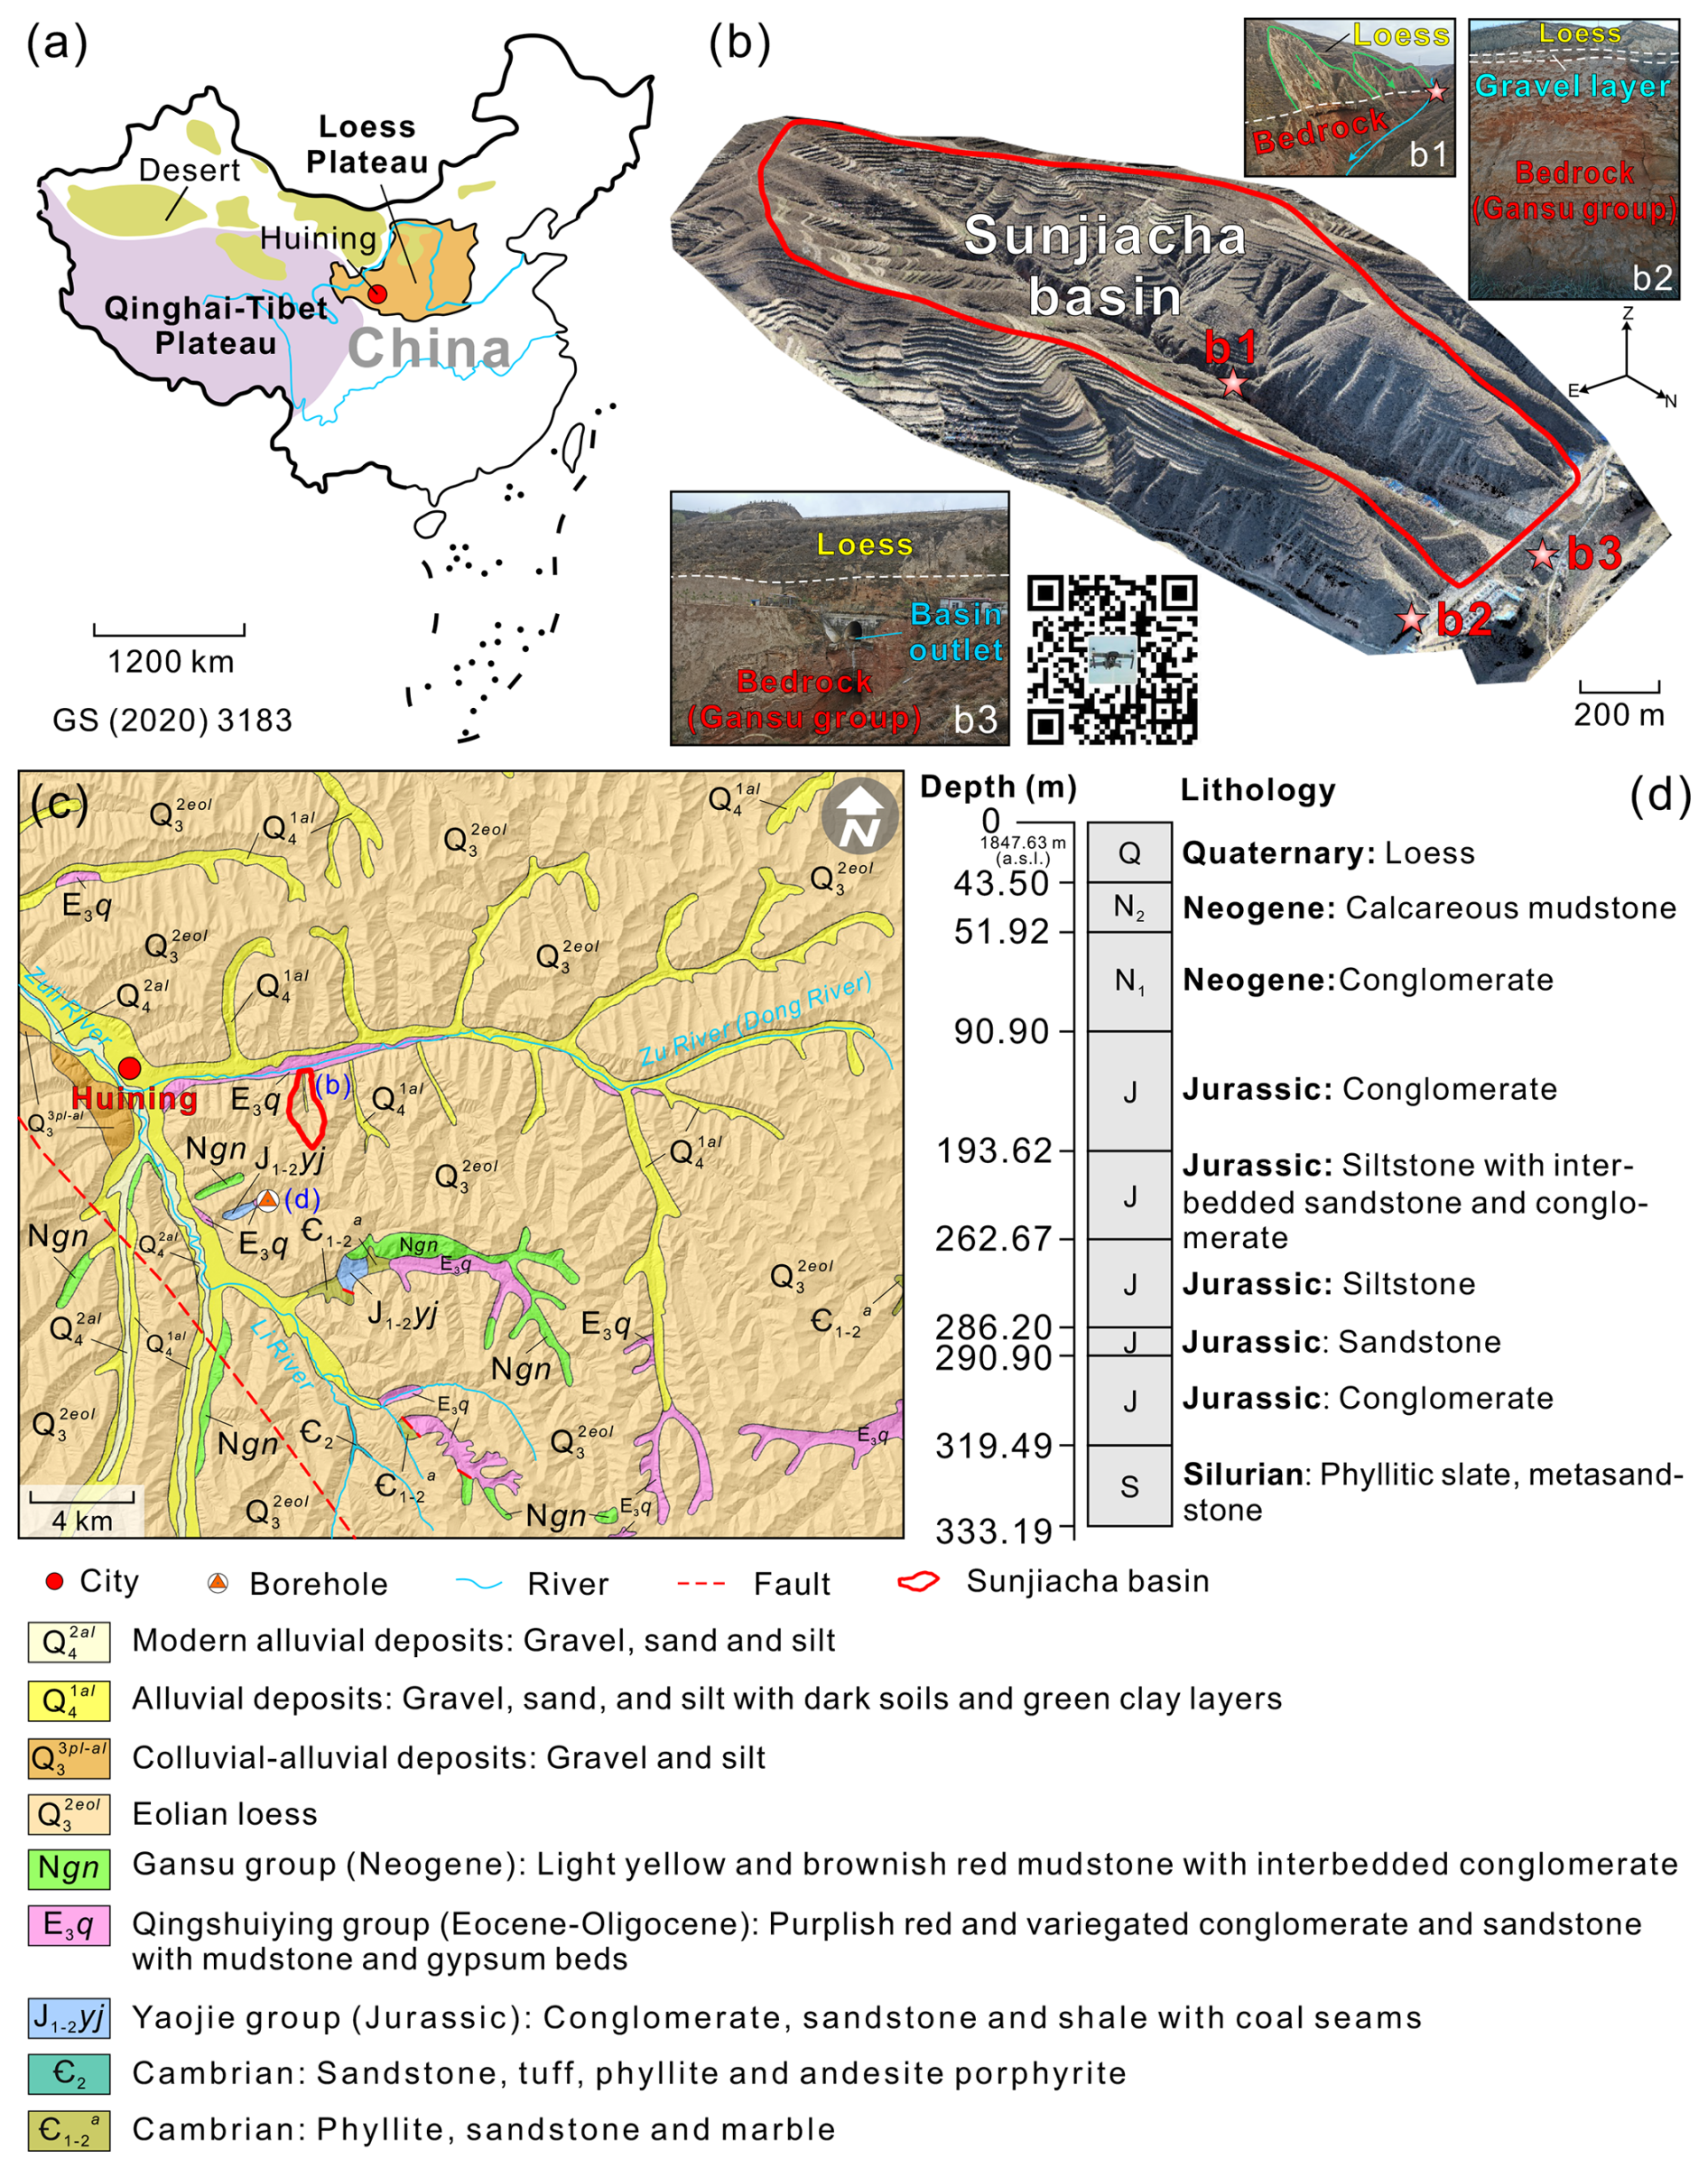
Figure 2Geographic and geological setting of the Sunjiacha drainage basin within the Loess Plateau: (a) Location of the study area; (b) 3D model of the Sunjiacha basin generated by Structure from Motion Photogrammetry with UAS images. The QR code provides access (https://www.720yun.com/t/0cvktq7yg2w, last access: 18 March 2026) to an online panorama of the study area created with drone images; (c) 1:200 000 scale regional geological map (data source: available at http://dcc.ngac.org.cn/, last access: 20 May 2021); (d) Stratigraphic log of the Huining #11 borehole drilled for coal exploration 2.6 km south of the study area (see location in c) (data source: available at http://zk.cgsi.cn/, last access: 19 August 2025).
From a geological perspective, the investigated zone is located in the Longxi Basin. Its development began during the Yanshan orogeny (ca. 205–66 Ma), continued further during the Himalayan orogeny (ca. 50 Ma to present), and finally took shape as the Longxi graben basin by the late Neogene. The basement of the basin is composed of Proterozoic metamorphic rocks, Paleozoic volcano-sedimentary rocks, Caledonian intrusive rocks and Mesozoic–Cenozoic sedimentary successions. Since the end of Neogene to the Quaternary, the Longxi Basin has been uplifted together with the Qinghai–Tibet Plateau and its surrounding mountains (Niu, 2023). The tectonic uplift in the Quaternary has been accompanied by (Fig. 2b and c): (1) downcutting of the drainage network into the Neogene sediments of the Gansu group; and (2) accumulation of loess and terraces over the relatively flat Gansu group red beds, forming a thick loess-paleosoil succession. The 1:200 000 scale regional geological map indicates that most slopes in the area are underlain by the Q3 aeolian loess (Malan loess), while Q4 alluvial and colluvial deposits, largely derived from the former, are mainly found in the valley floors (Fig. 2c). Figure 2d shows a simplified log of the 333 m deep Huining #11 borehole drilled 2.6 km south of the Sunjiacha basin by the China Geological Survey in 1972, revealing a Quaternary loess thickness of 43.5 m. In the 1960s, Liu (1964, 1965) observed a gradual NW-to-SE grain-size decrease in the loess across the CLP, and divided it into three zones: sand loess, typical loess, and clayey loess. This spatial pattern is attributed to factors such as the distance from the source area and the southeastward weakening of winds in winter (Yang and Ding, 2017). Previous studies have shown that the Huining loess contains both dust from inland desert areas and detritus generated during the Pleistocene glaciations on the Qinghai-Tibet Plateau (Peng, 2014). Because Huining is close to both source regions, relatively coarse sand and silt particles were deposited here by the northwesterly winds. Thus, the large pore size characteristic of the Q3 Malan loess is particularly pronounced in this area. The Q3 Malan loess is a light grey-yellow silt-dominated deposit with relatively uniform particle distribution, loose granular texture and blocky morphology. The grain size of the loess-paleosol sequence at Duanxian site (S0 ∼ L29; 62 km north of our study area) studied by Niu (2023) is generally coarse, with a median particle size ranging from 12 to 38.8 µm (silt size range: 2–50 µm). Particles >32 and >63 µm represent around 60 % and 25 % of the silt-dominated deposit, respectively (Niu, 2023).
The thickness of the Q3 Malan loess is highly variable, ranging from several meters to tens of meters. Under the presence of infiltration water, the Q3 Malan loess, which is often affected by vertical joints, is highly susceptible to hydrocompaction and piping, giving rise to unique loess sinkhole landscapes. In fact, this area is widely recognized as having the highest density of loess sinkholes in the vast Loess Plateau, covering 6370 km2 (2.33 % of the loess accumulation in China) (Fig. 1). The average density of sinkholes in our study area is ca. 500 sinkholes km−2. The investigated drainage basin, characterized by a dendritic gully network and terraced slopes, displays a large number of loess-related ground instability features, including 1194 loess collapse sinkholes and 288 landslides (Fig. 3). The latter include slope movements with deep and shallow sliding surfaces, typically induced by fluvial undercutting, artificial excavations, and intense rainfall events.
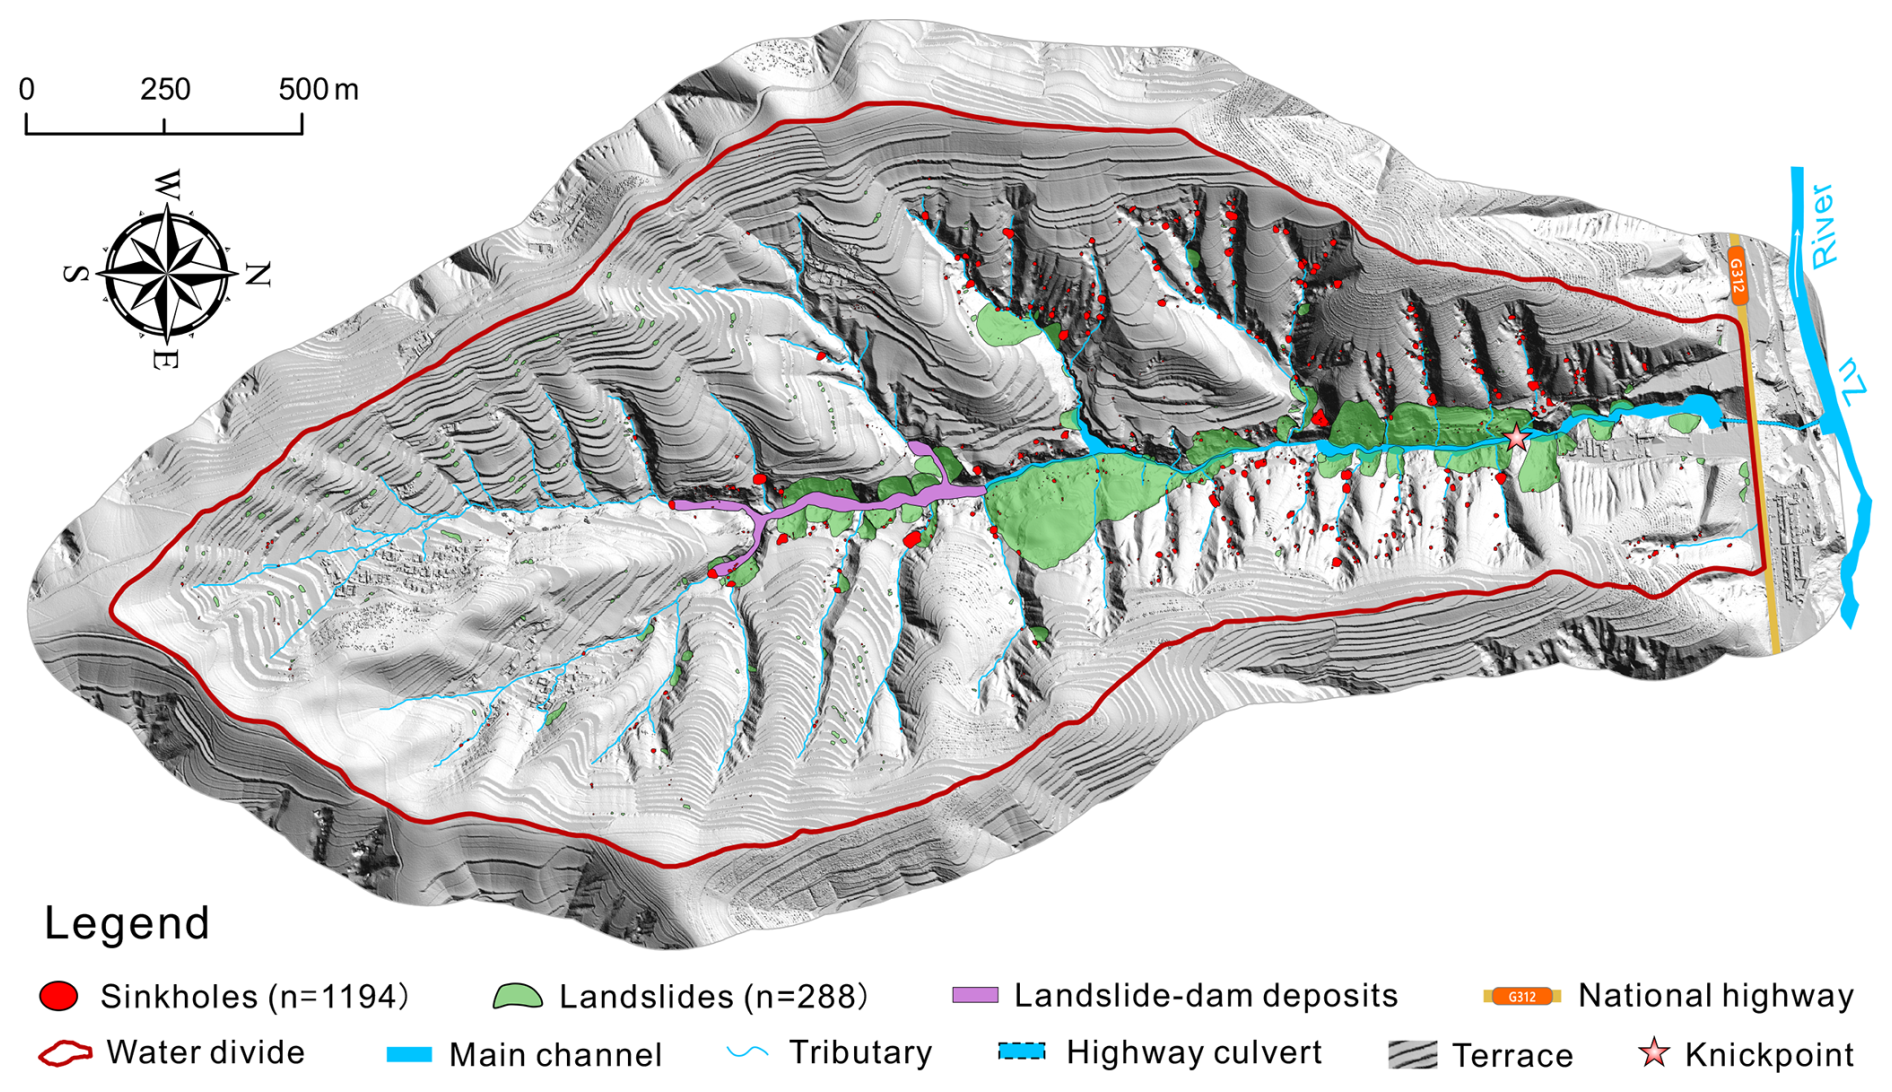
Figure 3Geomorphological map illustrating the distribution of loess sinkholes, landslides, and deposits accumulated upstream of a landslide dam in the Sunjiacha basin.
3.1 Technical procedure
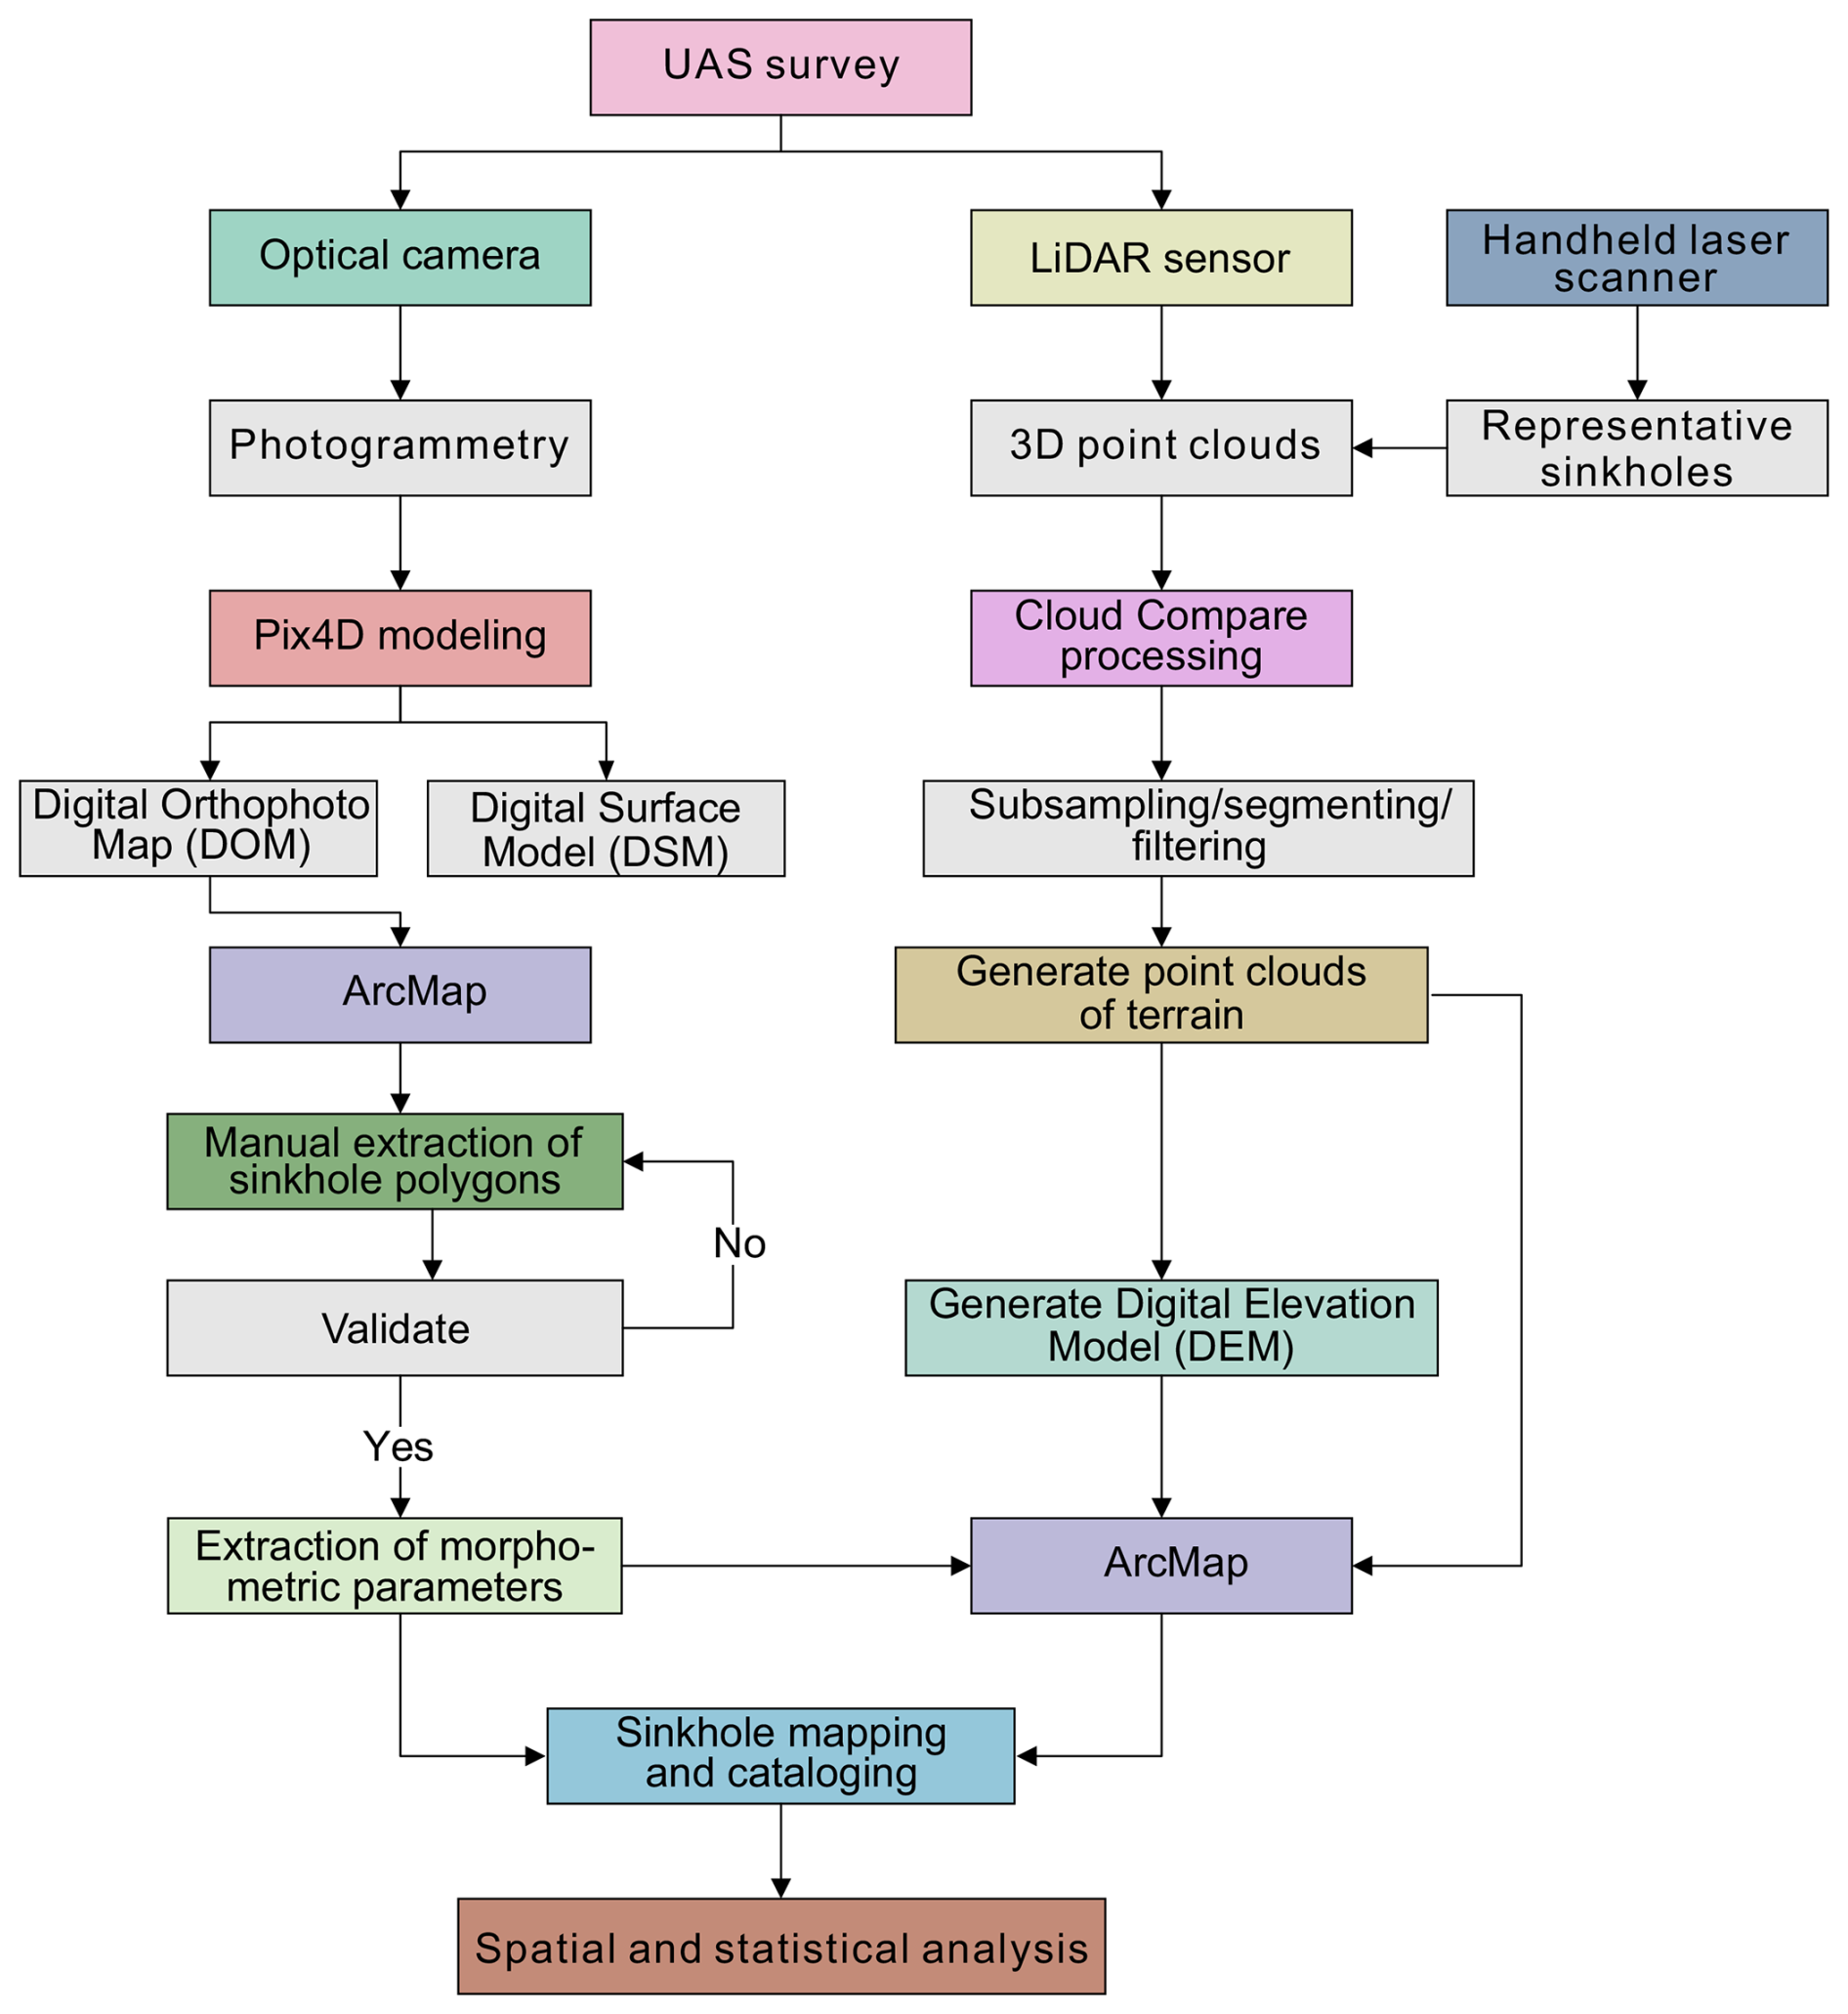
The flow diagram in Fig. 4 outlines the data acquisition and analysis approach adopted in this investigation, which consisted of several key steps. Initially, we performed surveys using an unmanned aircraft system (UAS) equipped with optical cameras and LiDAR sensors, along with a handheld laser scanner (HLS). Subsequently, the data collected during these surveys enabled the generation of a Digital Orthophoto Map (DOM), a bare-surface Digital Surface Model (DSM), a Digital Elevation Model (DEM), and 3D terrain point clouds. The drone imagery was processed with the Structure from Motion photogrammetry software Pix4D Mapper v4.5.6 (https://www.pix4d.com/, last access: 18 March 2026), while the open-source Cloud Compare v2.13.2 software (http://www.cloudcompare.org/, last access: 18 March 2026) was used to analyze the point clouds. ArcMap 10.5 was used to manually map the sinkholes and extract planimetric and three-dimensional morphometric parameters from the DOM, DEM and relief maps. This enabled the creation of a cartographic sinkhole inventory containing a number of categorical and numerical attributes for the morphometric and statistical analysis of the sinkholes. 3D data of the loess sinkholes, such as elevation and depth, were derived from noise-filtered terrain point clouds acquired with airborne LiDAR, rather than directly from the UAS-derived DSM, which significantly enhanced the accuracy of the parameters.
3.2 Field investigations
3.2.1 UAS survey
On 9 April 2021, we engaged the professional company Feima Robotics to conduct a detailed survey of the research area using a D2000 UAS (Fig. 5a–e). We carried out two flight missions at a height of 200 m utilizing the D-Lidar 2000 LiDAR sensor (linear scanning) and the D-CAM2000 optical camera mounted on the drone. Images were taken with longitudinal and lateral overlaps of 70 % and 60 %, respectively. Point clouds were acquired with a lateral overlap of 40 %. A total of 11 ground control points (GCPs) were distributed across the area and measured with a DGPS. Detailed specifications of the UAS and its sensors are available at http://www.feimarobotics.com/zhcn/productDetailD2000 (last access: 18 March 2026). The D-Lidar 2000 module employs three-echo technology, which ensures effective penetration through vegetation to obtain more accurate bare-ground data. After completing the field survey, we pre-processed the collected data with the UAV Manager v1.7.0 software to produce a 3 cm resolution Digital Orthophoto Map (DOM) and a Digital Surface Model (DSM), along with raw point cloud data (40 GB; average density of 192 points m−2). The modeling report from UAV Manager indicated that the average RMSE (root-mean-square error) for the 11 ground control points (GCPs) was 0.0137 m, with RMSEs of 0.012, 0.014, and 0.015 m for the X, Y, and Z coordinates, respectively. An elevation accuracy assessment of 19 laser point cloud validation points measured with the DGPS revealed an average RMSE of 0.029 m, with a maximum error of 0.058 m.
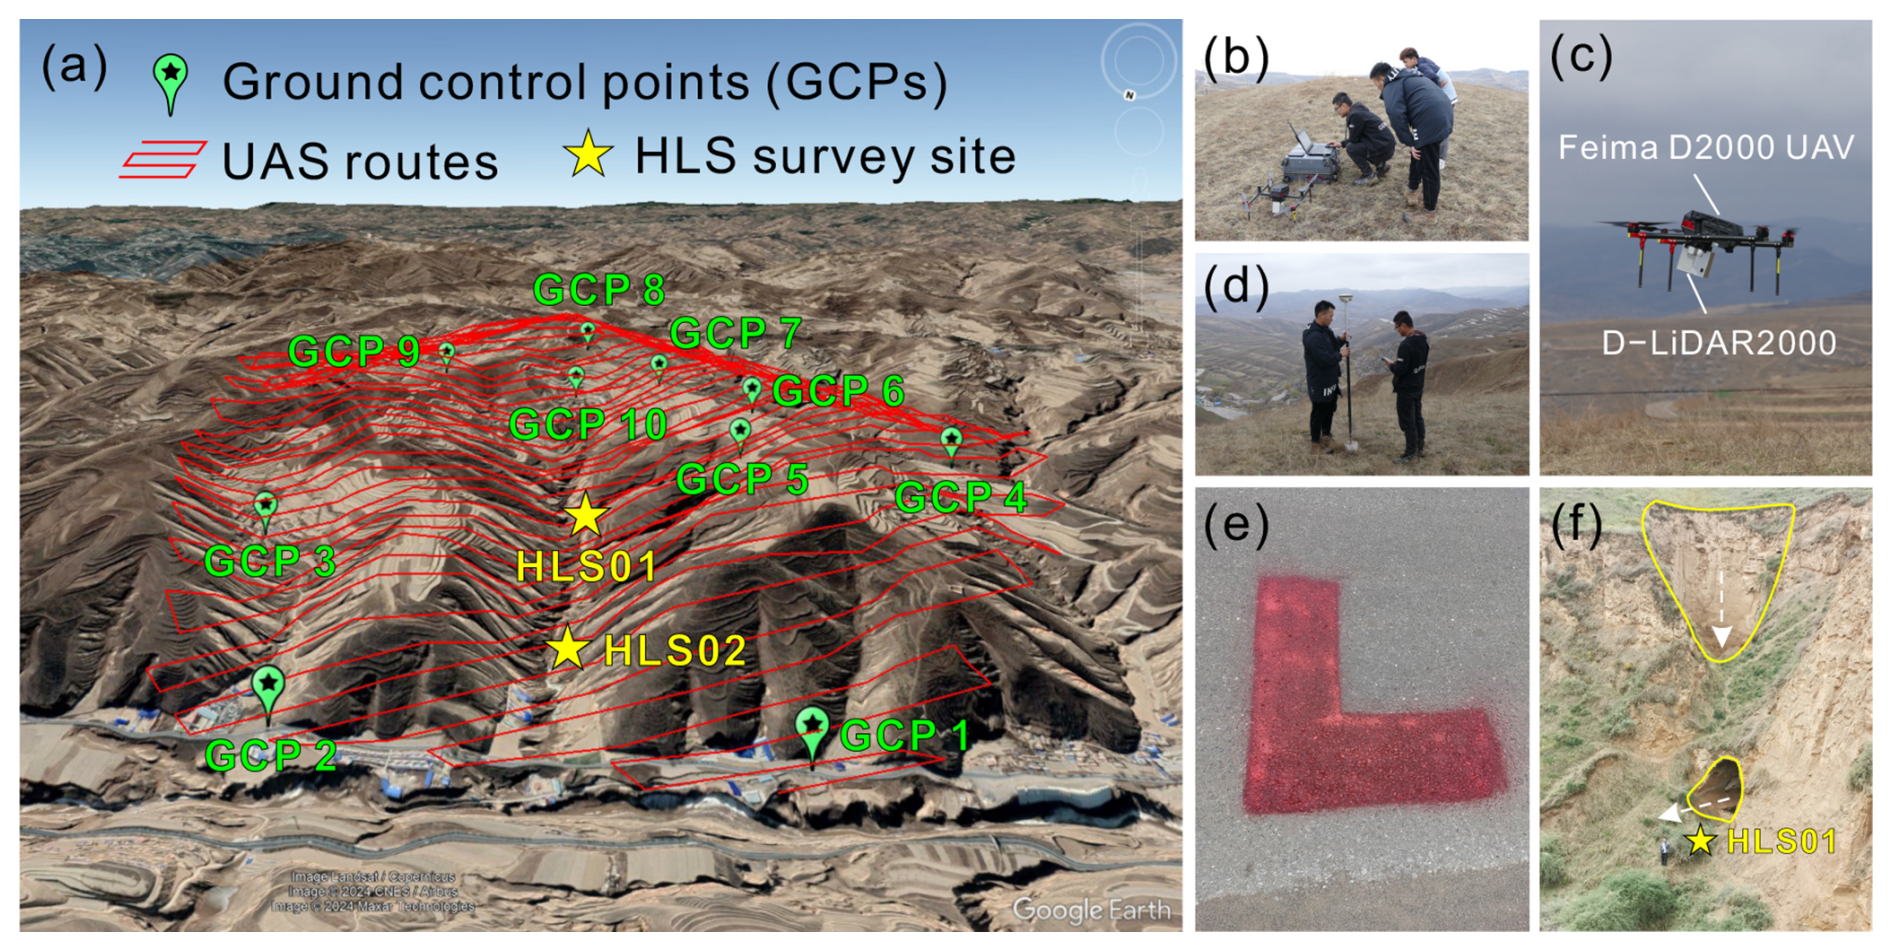
Figure 5Surveying of the study area with an UAS (Li et al., 2024) and a handheld laser scanner: (a) Terrain model of the study area draped by a Google Earth image. Red lines depict the UAS flight paths. Green paddle icons show the distribution of ground control points (GCPs) used to improve the accuracy of the UAS models. Yellow stars indicate the location of the handheld laser scanner surveys; (b–e) Unmanned aerial system field operations with the control unit (b), the drone (c), a DGPS (d) and GCPs (e); (f) Using the GeoSLAM (ZEB Horizon) handheld laser scanner to scan the interior of a sinkhole in a steep slope with an opening at the bottom.
3.2.2 Handheld laser scanner survey
We used a GeoSLAM ZEB Horizon handheld LiDAR scanner (https://geoslam.com/, last access: 18 March 2026) with a maximum range of 100 m to carry out high-resolution scans of thirteen representative sinkholes (1 sinkhole at HLS01 site; 12 sinkholes at HLS02 site; see location in Fig. 5a and f). This device utilizes SLAM (Simultaneous Localization and Mapping) technology, enabling real-time recording of point cloud data of the terrain or objects with accurate geographic coordinates. It weighs 1.45 kg, and records 300 000 points s−1 with a measurement error ranging from 6–30 mm. After the field survey, we pre-processed and post-processed the point cloud data using GeoSLAM Draw v4.0 and Cloud Compare software v2.13.2, and subsequently we obtained noise-filtered terrain point clouds and DEMs of the representative sinkholes.
3.2.3 Surveying and mapping
Figure 6 shows some of the products derived from the UAS survey. We filtered the raw point clouds using the Cloth Simulation Filter (CSF) developed by Zhang et al. (2016) in Cloud Compare v2.13.2. The main parameter settings were: General parameter setting – check Steep slope and Slope processing options; Advanced parameter setting – Cloth resolution 0.5 m, Maximum iterations 999, Classification threshold 0.1 m. Figure 6a shows the terrain point cloud processed in Cloud Compare v2.13.2 with above-surface noise removed (e.g., buildings, people, vehicles, vegetation, towers, and power lines). Figure 6b–f show enlarged views of the dashed boxes indicated in Fig. 6a, g and h. Figure 6b illustrates the largest landslide in the study area. Figure 6c and d depict an orthoimage and a terrain point cloud of a gully with a string of sinkholes related to a subsurface conduit created by internal erosion. Figure 6e and f display the 2D profile of the terrain point cloud and an excerpt of the 3D point cloud of a gully with numerous sinkholes, respectively. Figure 6g shows the 6.87 cm resolution Digital Orthophoto Map (DOM) derived from the drone images. Figure 6h presents the 0.5 m resolution Digital Elevation Model (DEM) generated from the terrain point cloud data in Fig. 6a. Figure 6i depicts the 3D models generated by Poisson Surface Reconstruction in Cloud Compare v2.13.2, based on LiDAR point-cloud data from six sinkholes. These spatial data provide the basis for mapping and cataloging sinkholes, identifying sediment-discharge holes, and extracting morphometric parameters.
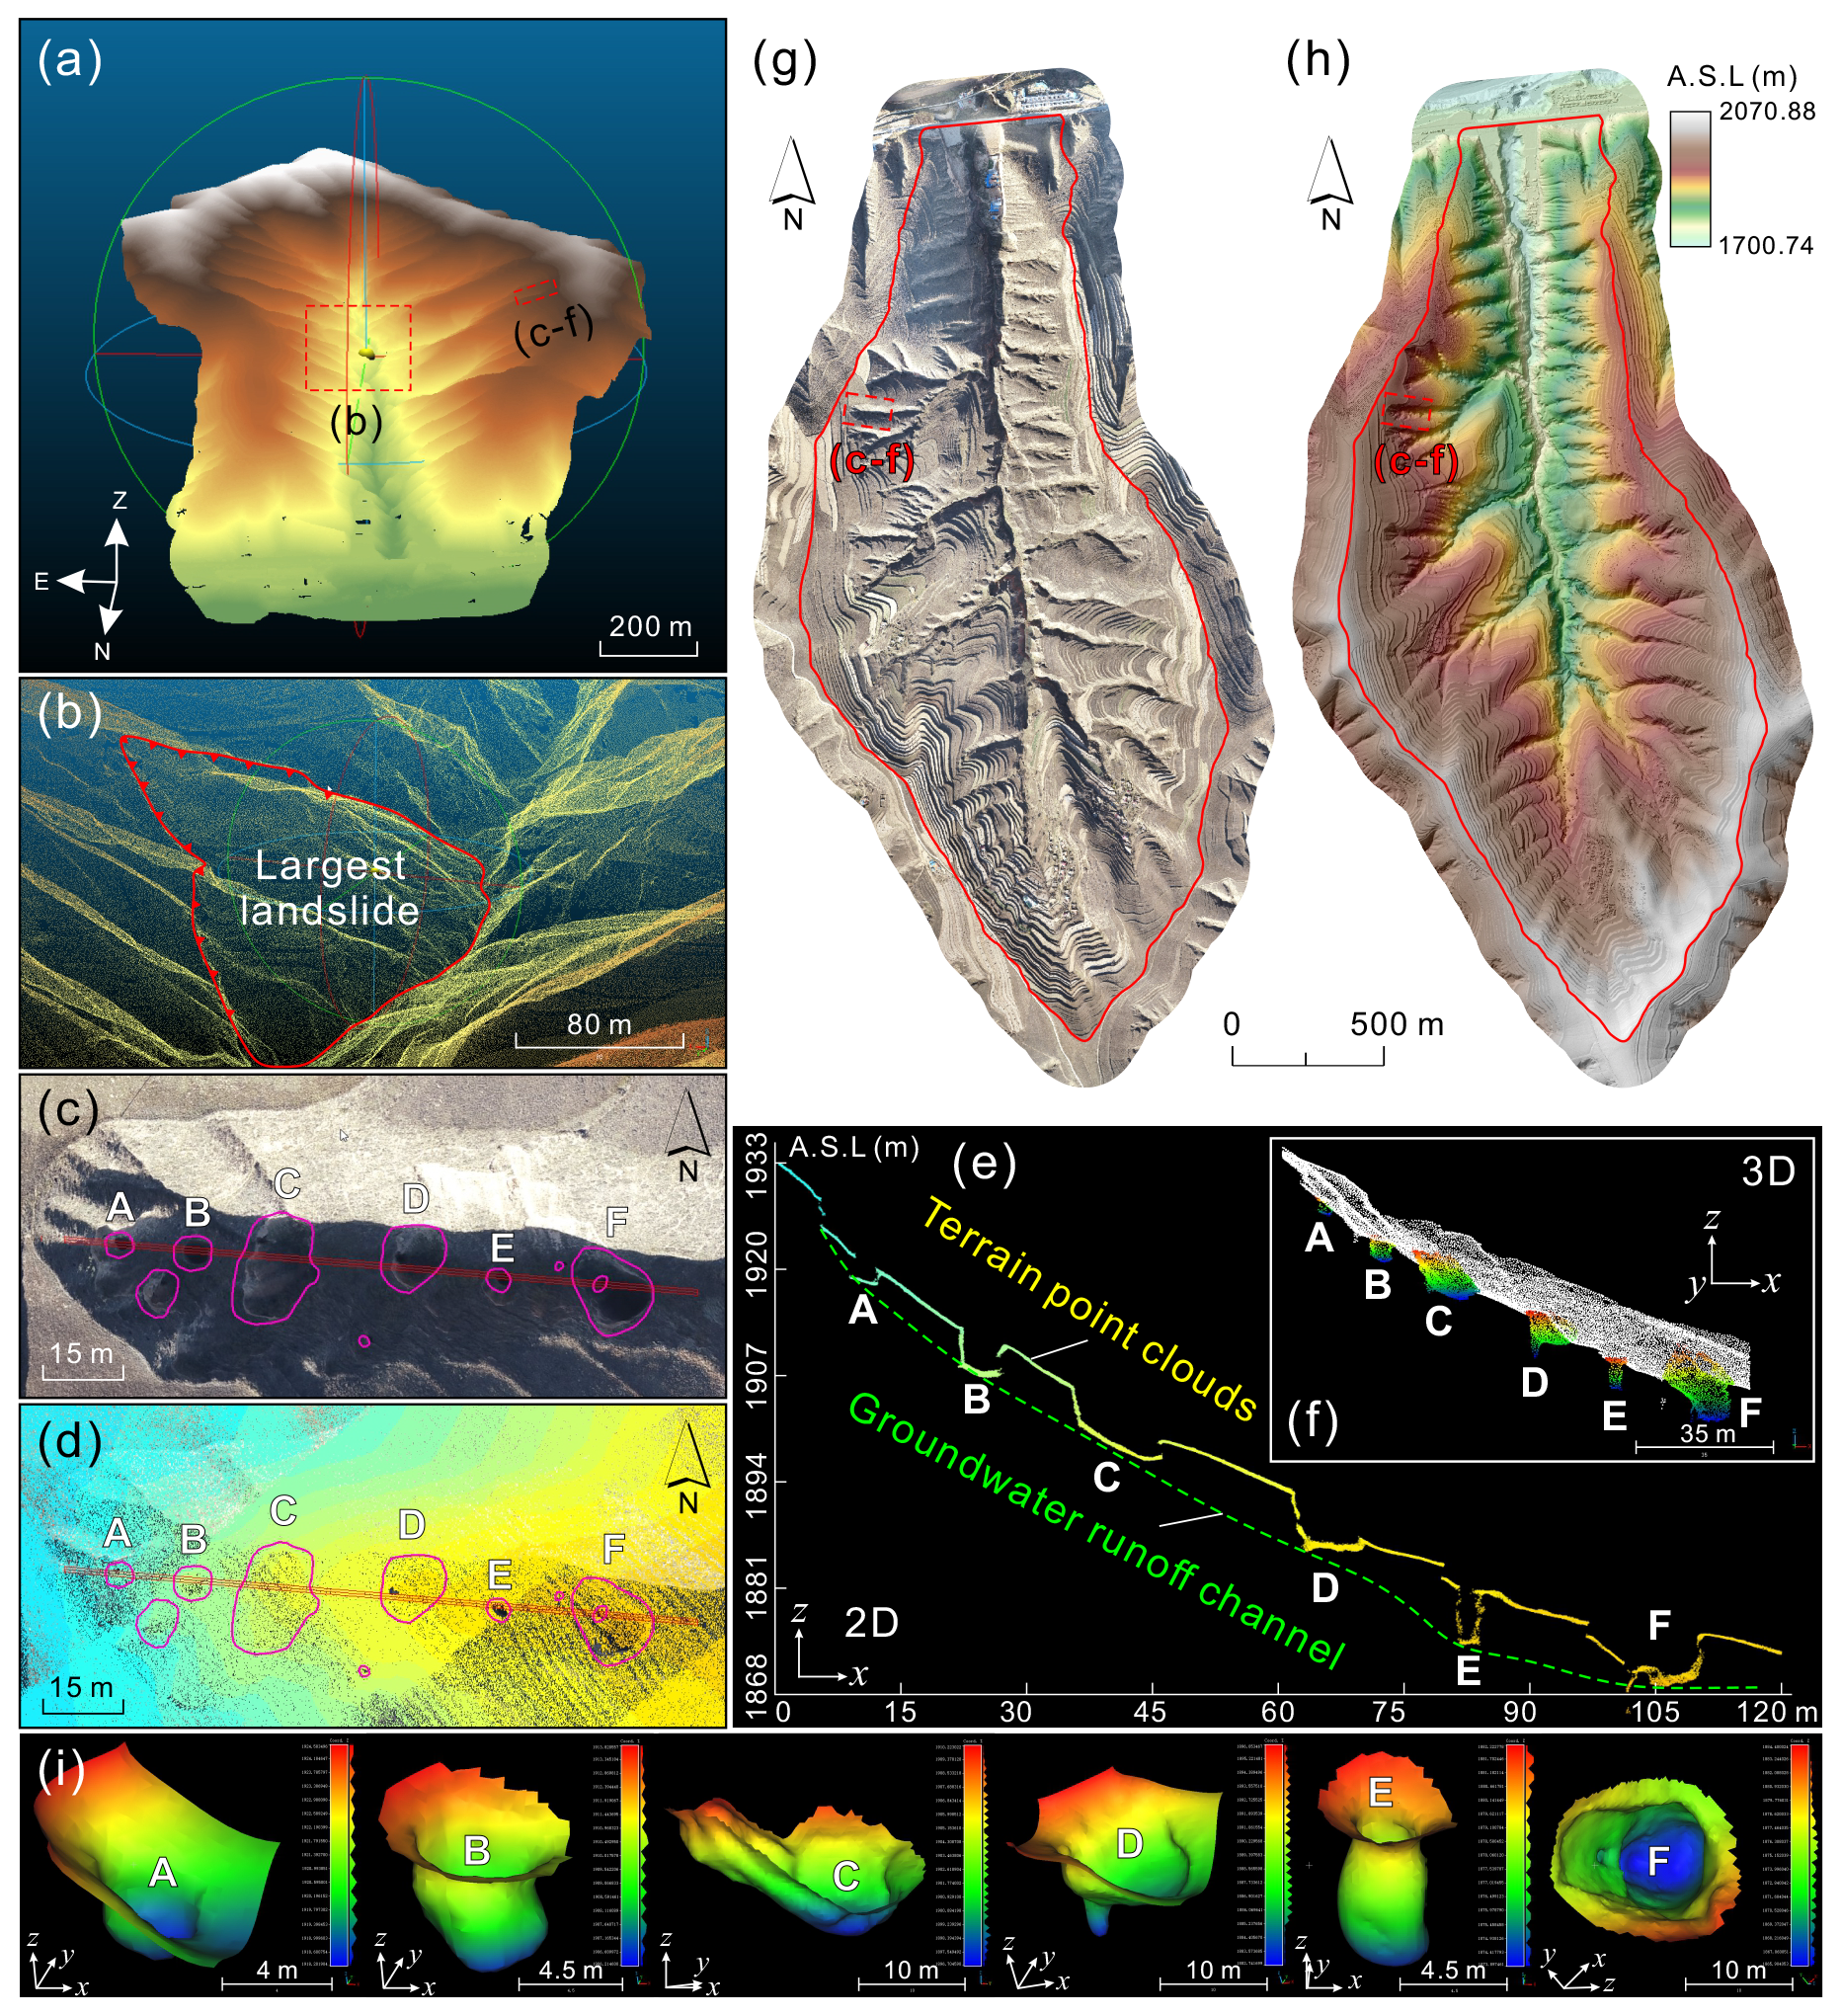
Figure 6Results of the UAS survey: (a) Bare-surface point cloud of the study area after filtering out above-surface objects; (b–f) Enlarged views of the areas indicated by dashed boxes in (a); (b) The largest landslide in the study area; (c–e) Orthoimage, point cloud, and a point-cloud section of a row of loess sinkholes (purple line in d) within a collapsed gully, respectively; (f) 3D perspective view of the area shown in (d); (g) Digital orthophoto map (DOM) generated from images acquired during the UAS survey; (h) Digital elevation model (DEM) derived from the bare-surface point clouds; (i) Poisson surface reconstruction of sinkholes A–F as seen in (f).
3.3 Basic morphometric parameters and extraction methods
Drawing on a literature review on studies about loess sinkholes and karst dolines worldwide, we selected a number of morphometric parameters for the geometrical characterization of the loess sinkholes (e.g., Day, 1983; Liu and Wang, 2008; De Waele and Gutiérrez, 2022, and references therein). Table 1 presents the selected parameters, their definitions, and the approach used for their automatic computation. The key morphological parameters and their definitions are illustrated in Fig. 7.
Table 1Morphometric parameters used for the characterization of loess sinkholes: index, definition and computing method.
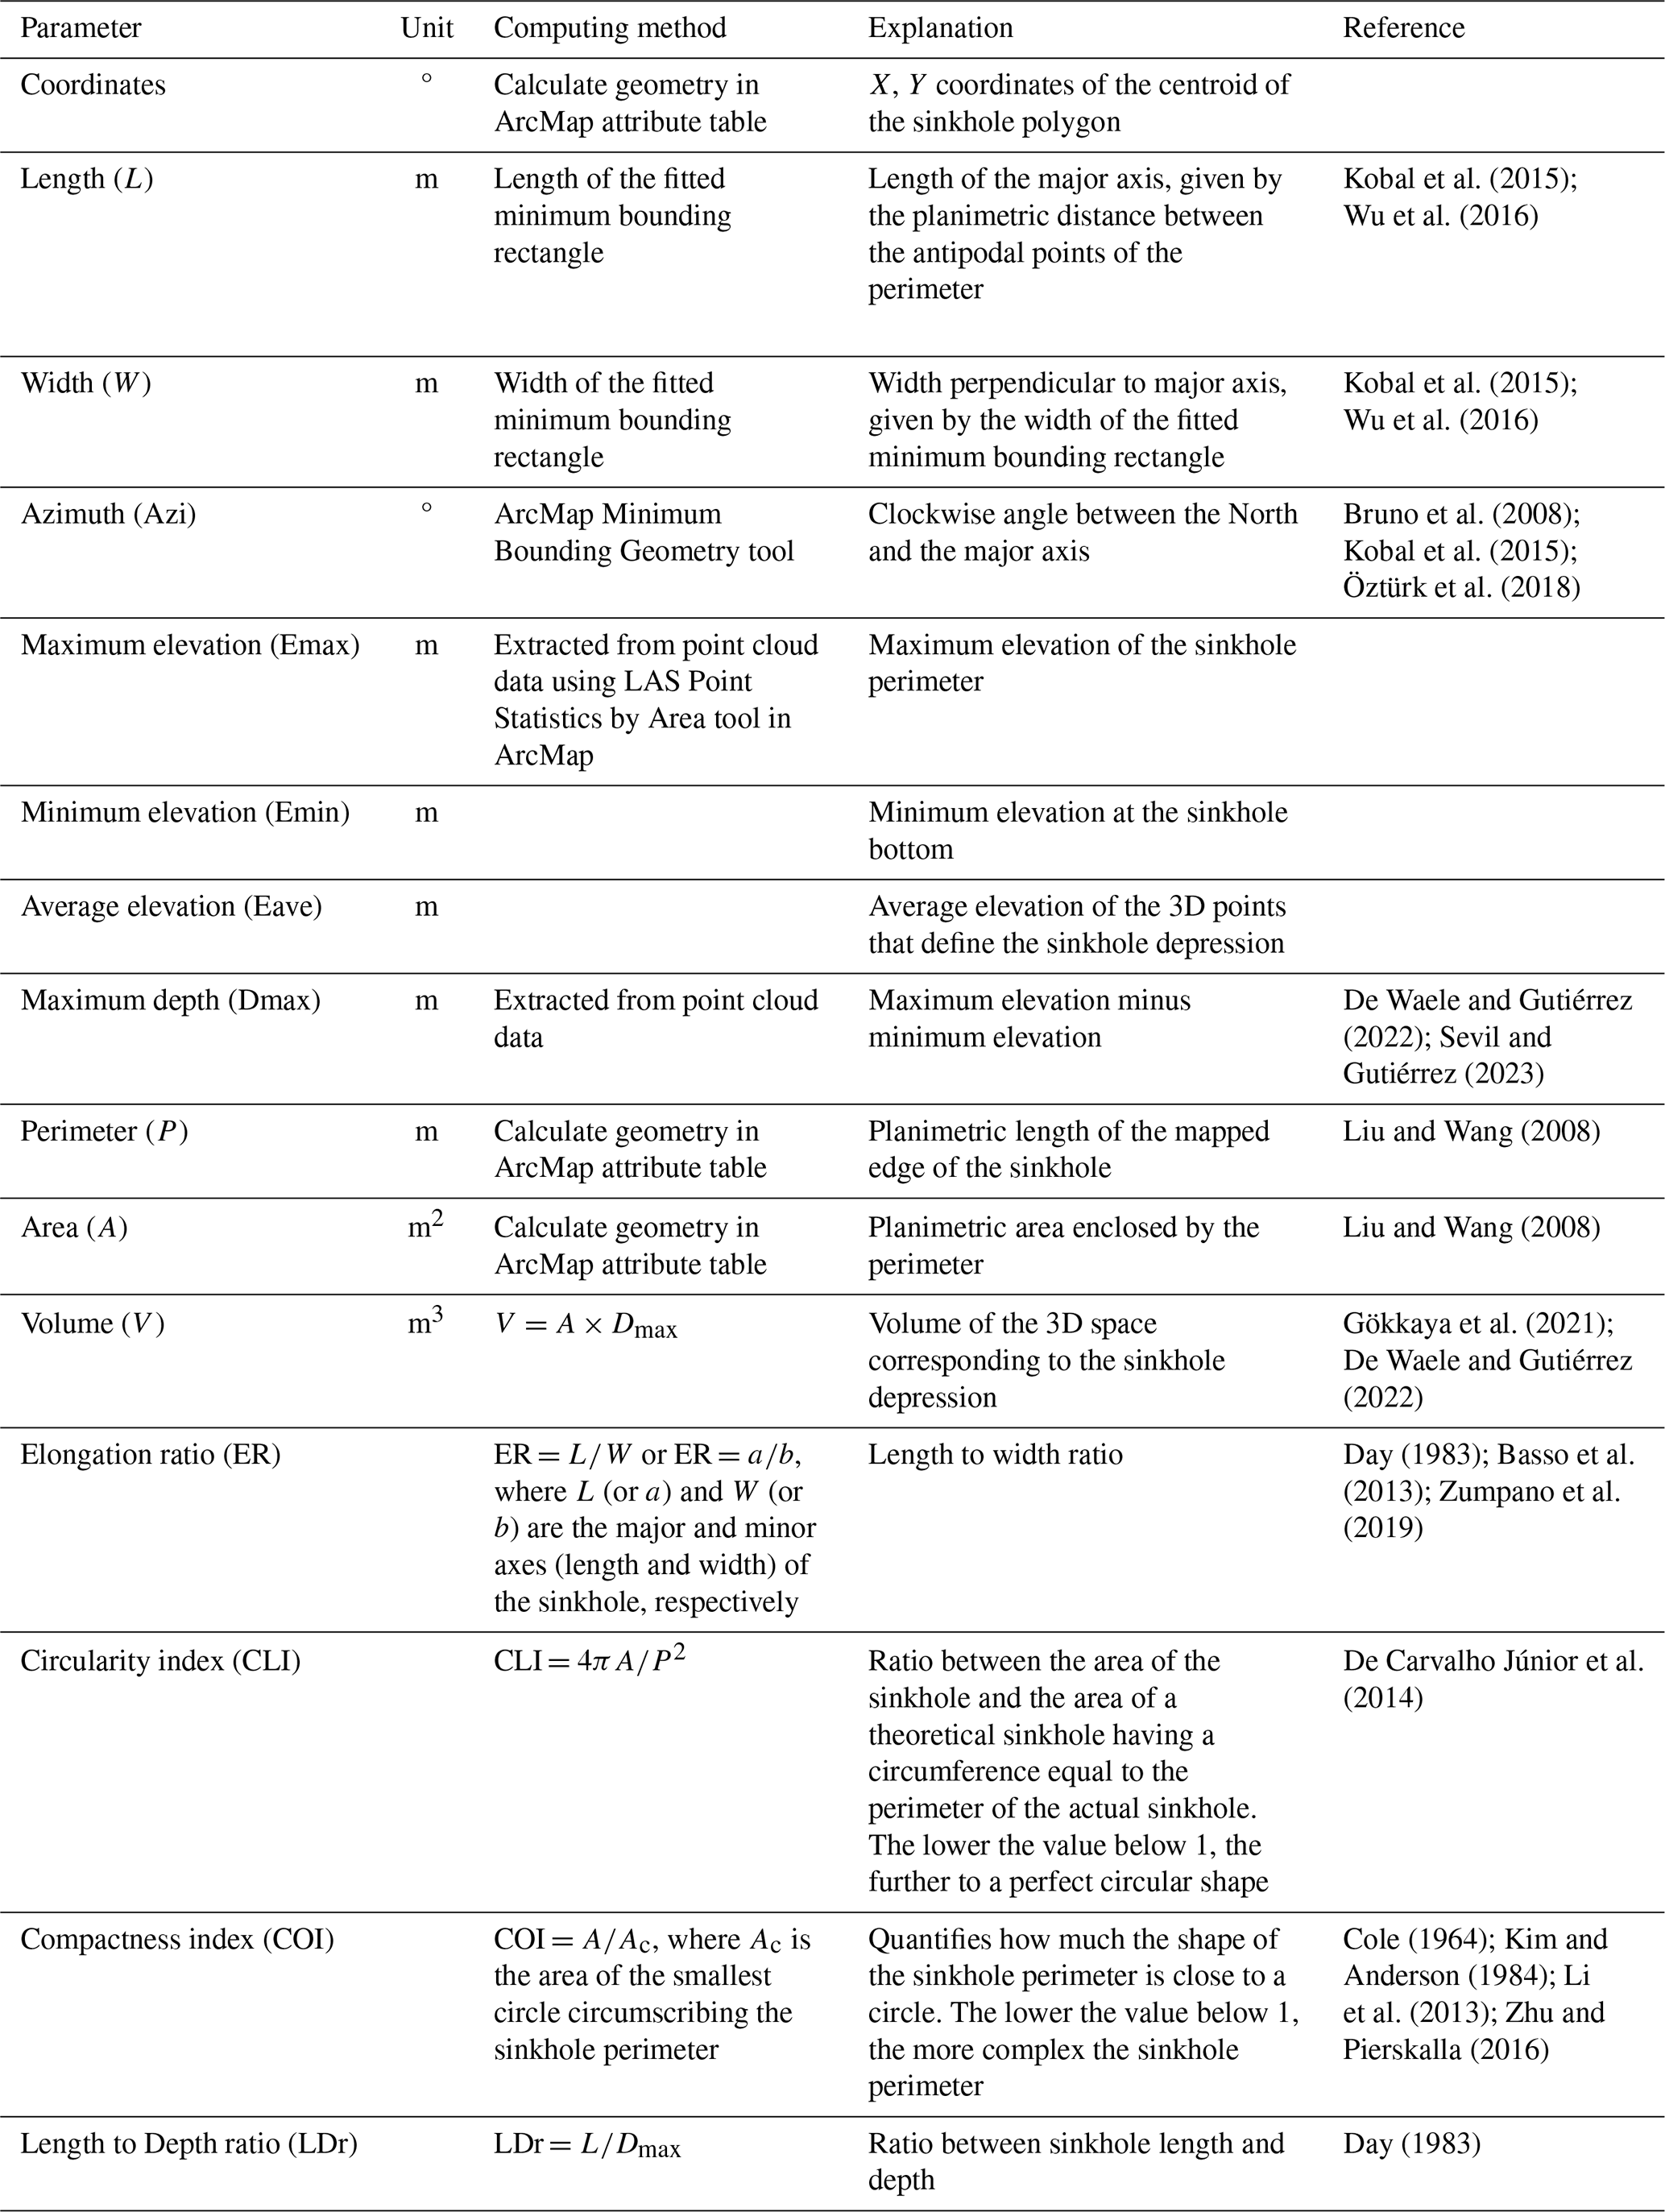
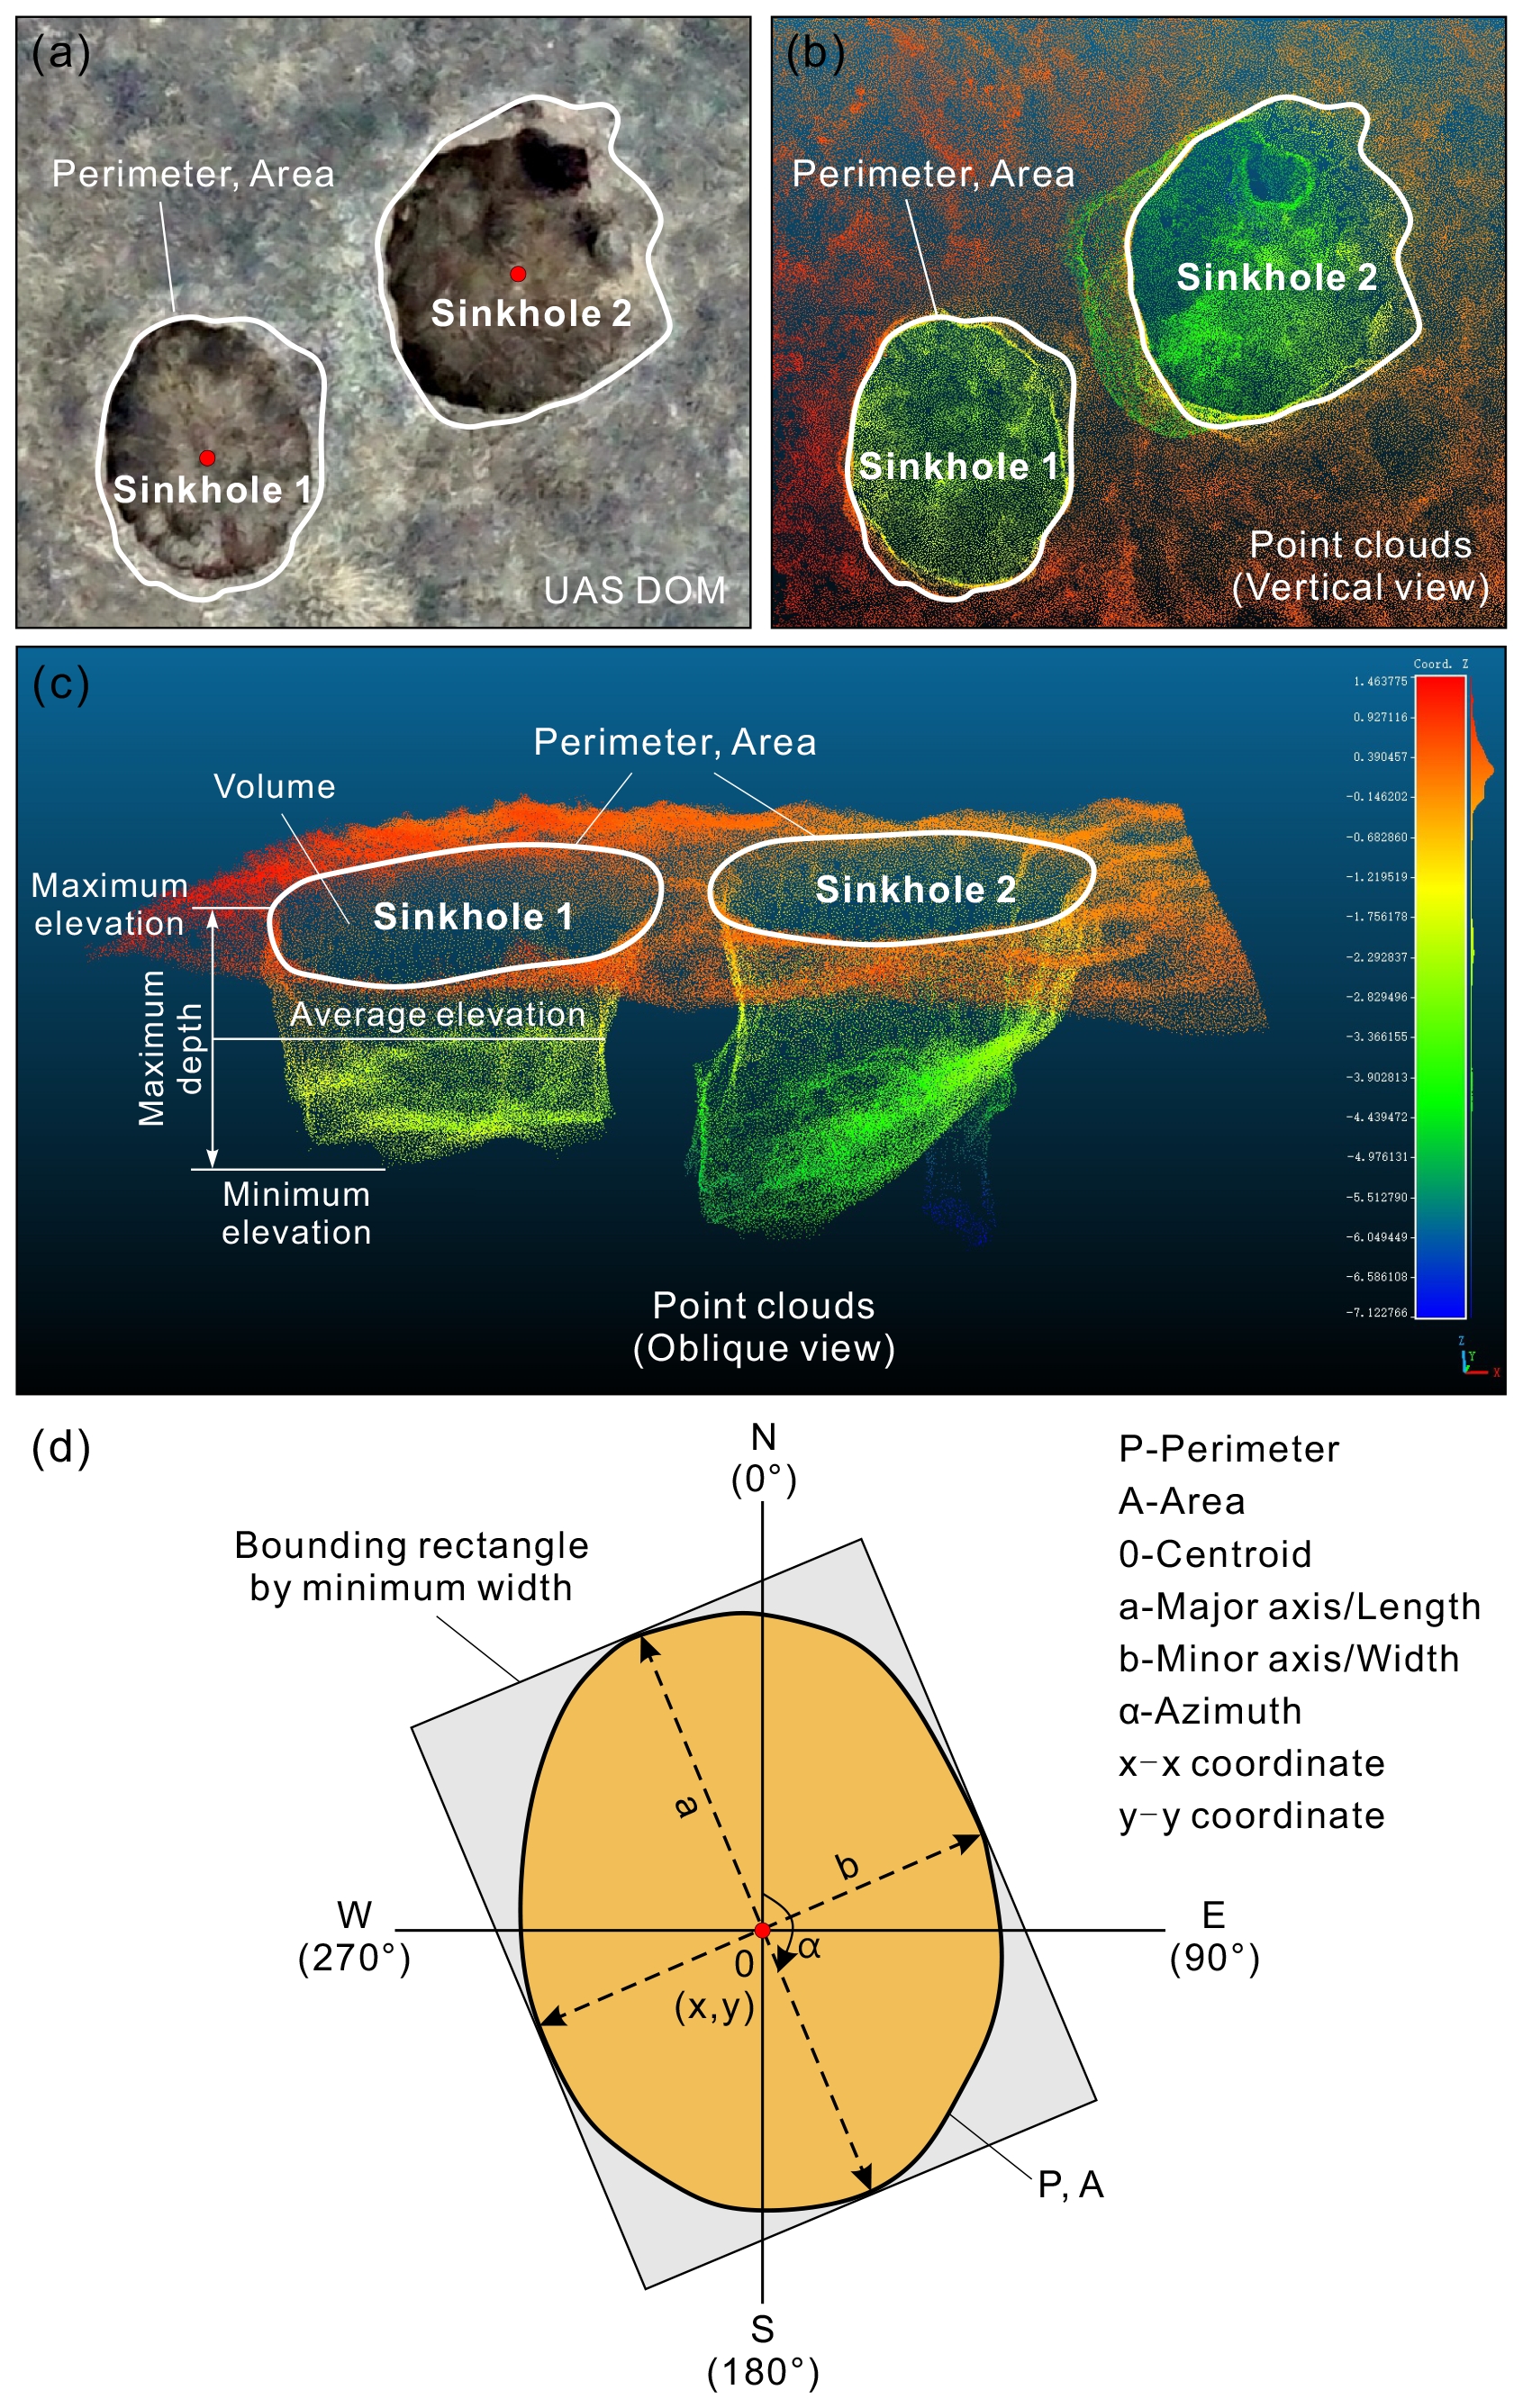
Figure 7Diagrams illustrating the key morphometric parameters of the loess sinkholes: (a) Orthoimage of sinkholes; (b) Vertical view of sinkholes point clouds (located at HLS 02 in Fig. 5a); (c) Oblique view of sinkholes point clouds; (d) Schematic diagram of key morphometric parameters of sinkholes.
4.1 Sinkhole mapping and inventorying
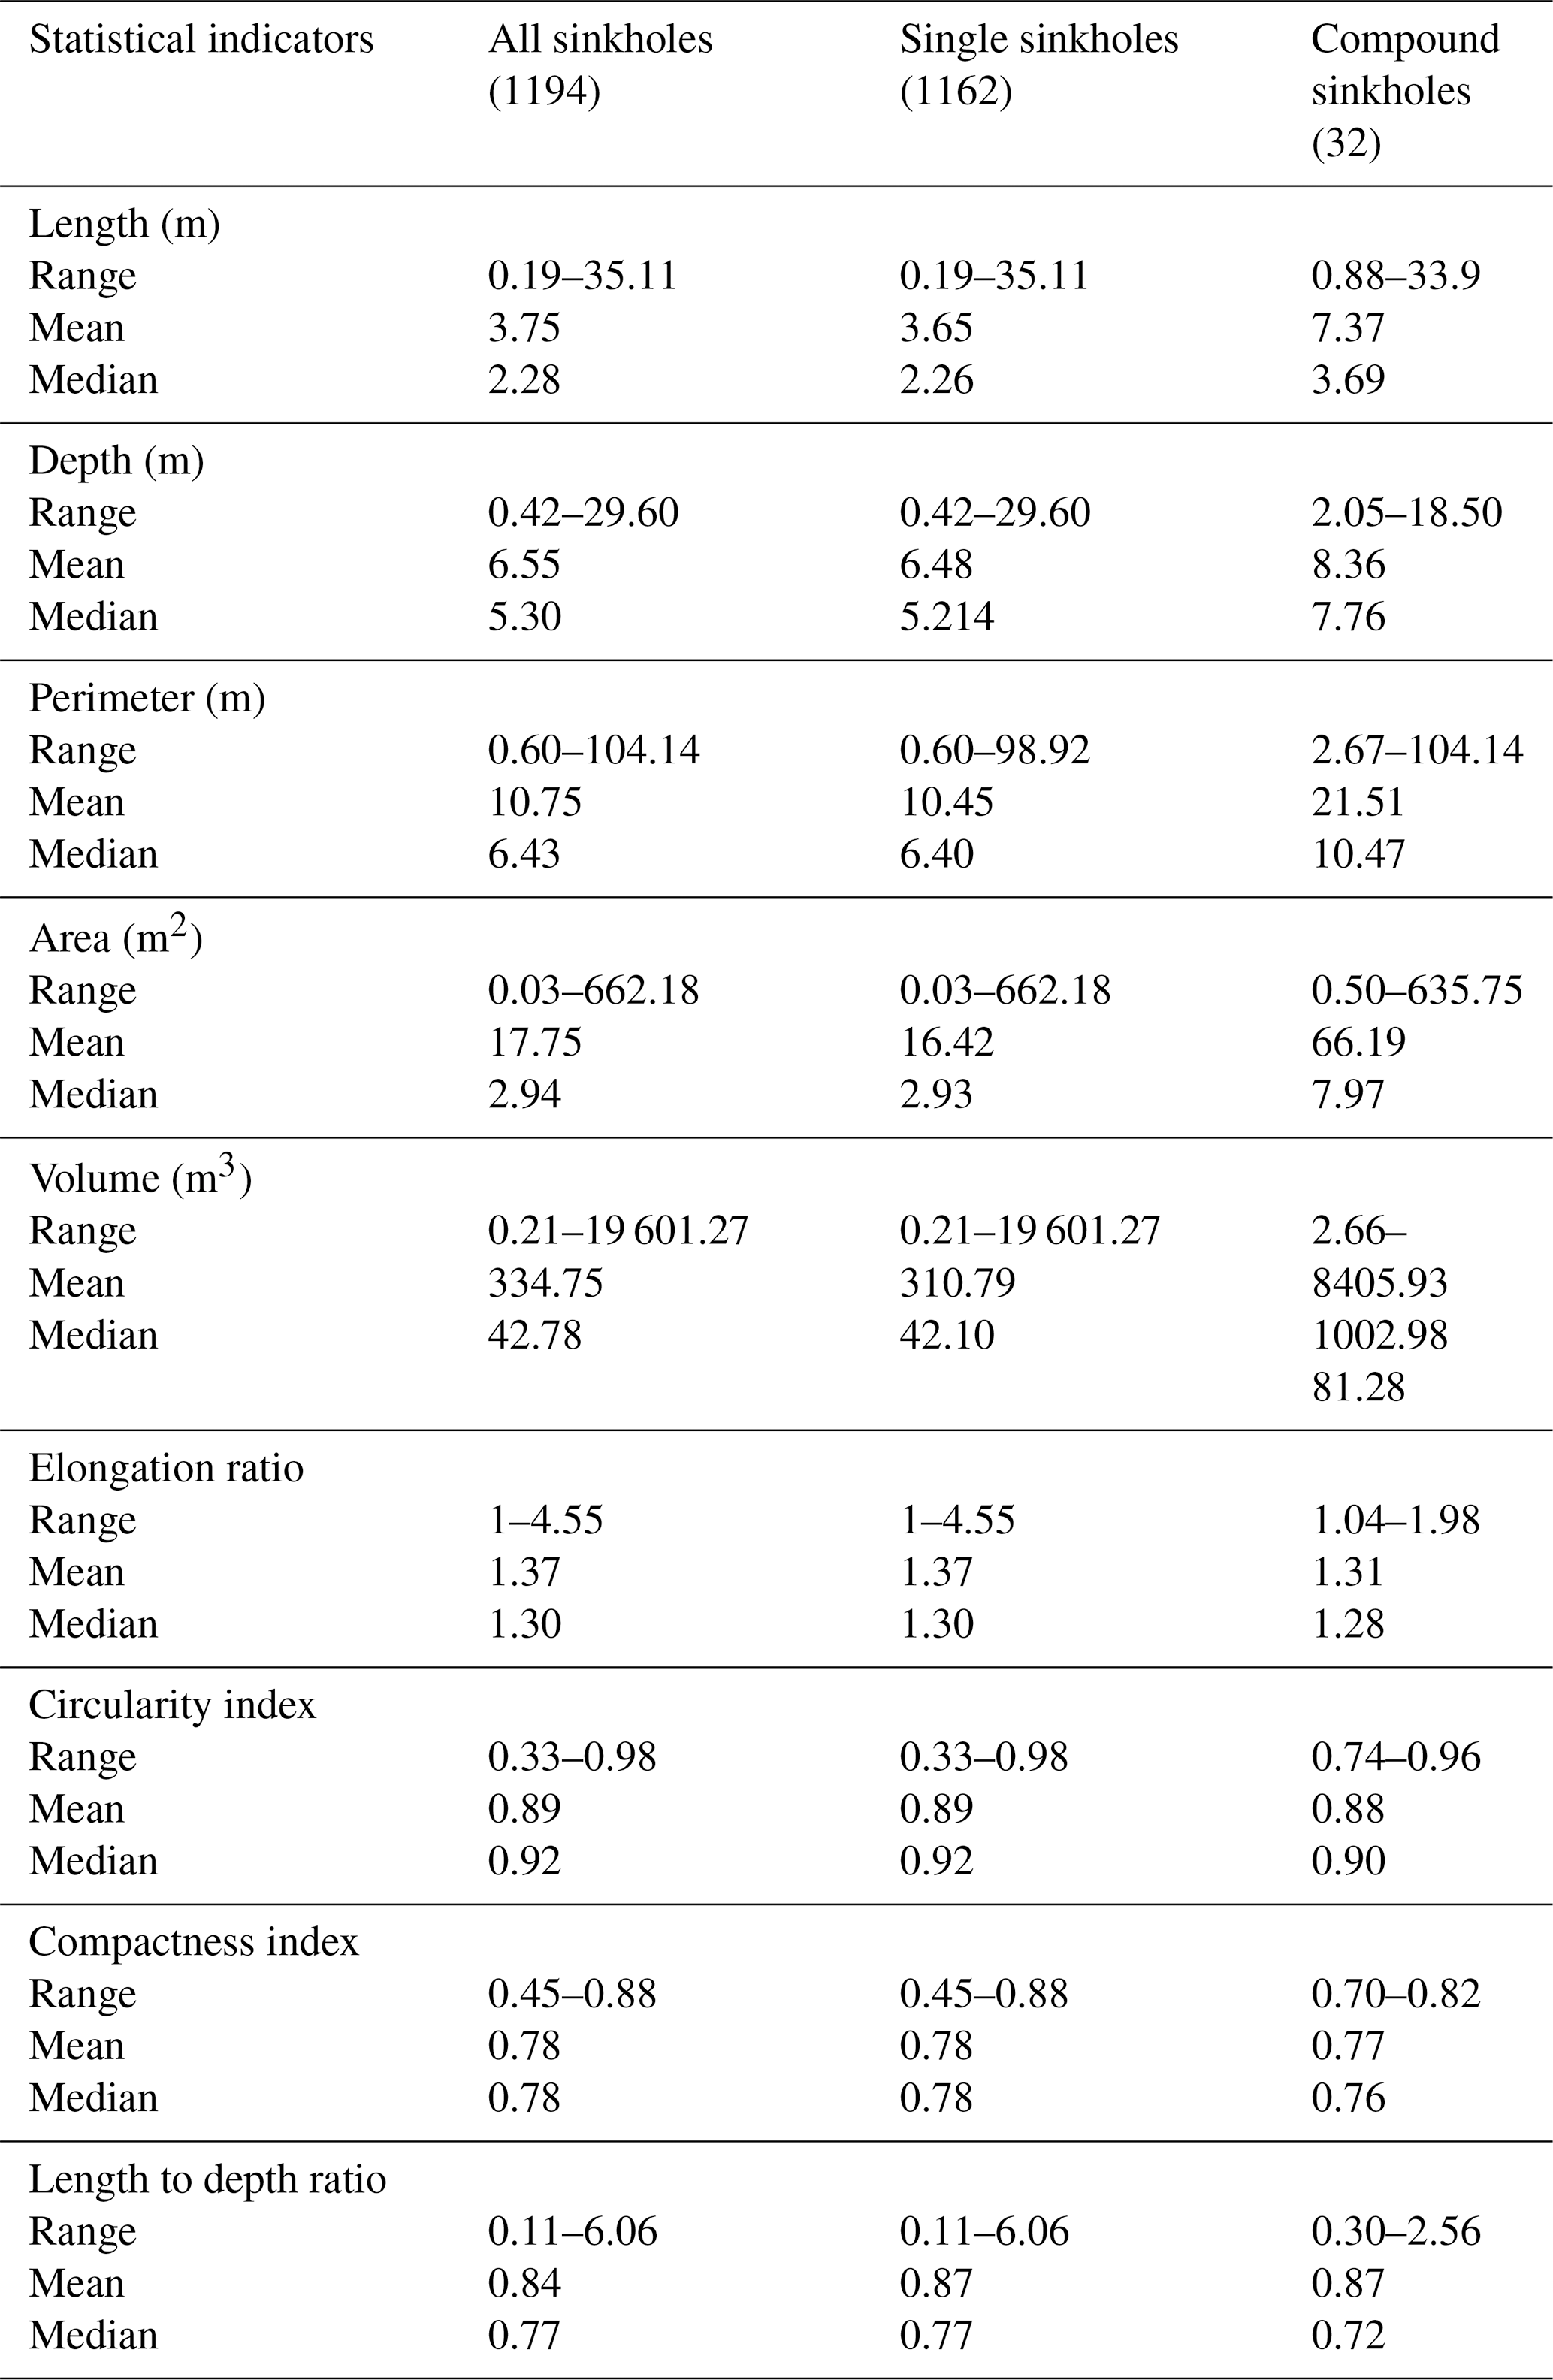
Given the exceptionally high-resolution of the data used for mapping, the inventory can be considered nearly complete, even including small decimeter-scale holes. This information furnished a database of 1194 loess sinkholes in the study area, each characterized by multiple attributes (Table 1 and Data availability): topographic (coordinates, azimuth, maximum, minimum and average elevation); morphometric (length, width, depth, perimeter, area, volume, geometrical indexes); and geomorphic (soil loss). The inventory also differentiates 1162 single sinkholes, and 32 compound sinkholes resulting from the aggregation of two or more adjacent sinkholes. This comprehensive database serves as the basis for the morphometric-statistical analysis presented in this work. For the detailed cataloging and the statistical parameters of these sinkholes, please refer to Table 2 and Data availability. Additionally, 9 thematic maps were generated with some parameters (length, maximum depth, perimeter, area, volume, elongation ratio, circularity index, compactness index, length to depth ratio) to explore spatial patterns of different value ranges. Table 2 presents the main statistics of the sinkholes grouped into three categories: all, single, and compound.
Table 2Summary statistics of morphometric parameters for different types of sinkholes.
4.2 Spatial distribution patterns
The spatial distribution patterns of the loess sinkholes were analyzed considering their relationships with other geomorphic features (Fig. 3) and using spatial analysis and statistics tools (Fig. 8). The detailed geomorphological map of the Sunjiacha basin reveals that sinkholes are preferentially distributed in the following zones (Fig. 3): (1) the margins of the deeply entrenched lower-middle section of the Sunjiacha trunk stream; (2) tributary gully systems in the lower-middle part of the Sunjiacha basin; (3) landslides (slid mass and crown), mostly associated with the trunk channel; and (4) man-made terraces. The kernel density model in Fig. 8a shows low densities mainly associated with upper part of the Sunjiacha basin, where the drainage network shows a lower degree of incision, and rounded divides characterized by low local gradients. Overall, there is a good spatial correlation between sinkholes and areas with high local topographic gradients and loess deposits disturbed by landslides. The hot spot model based on sinkhole area shown in Fig. 8b illustrates a pronounced cluster of small sinkholes (cold spots in blue) associated with recent landslides in the lower sector of the basin. Clustering of large sinkholes (hot spots in red) mainly occur along the main drainages of tributary catchments in the lower part of the Sunjiacha basin.
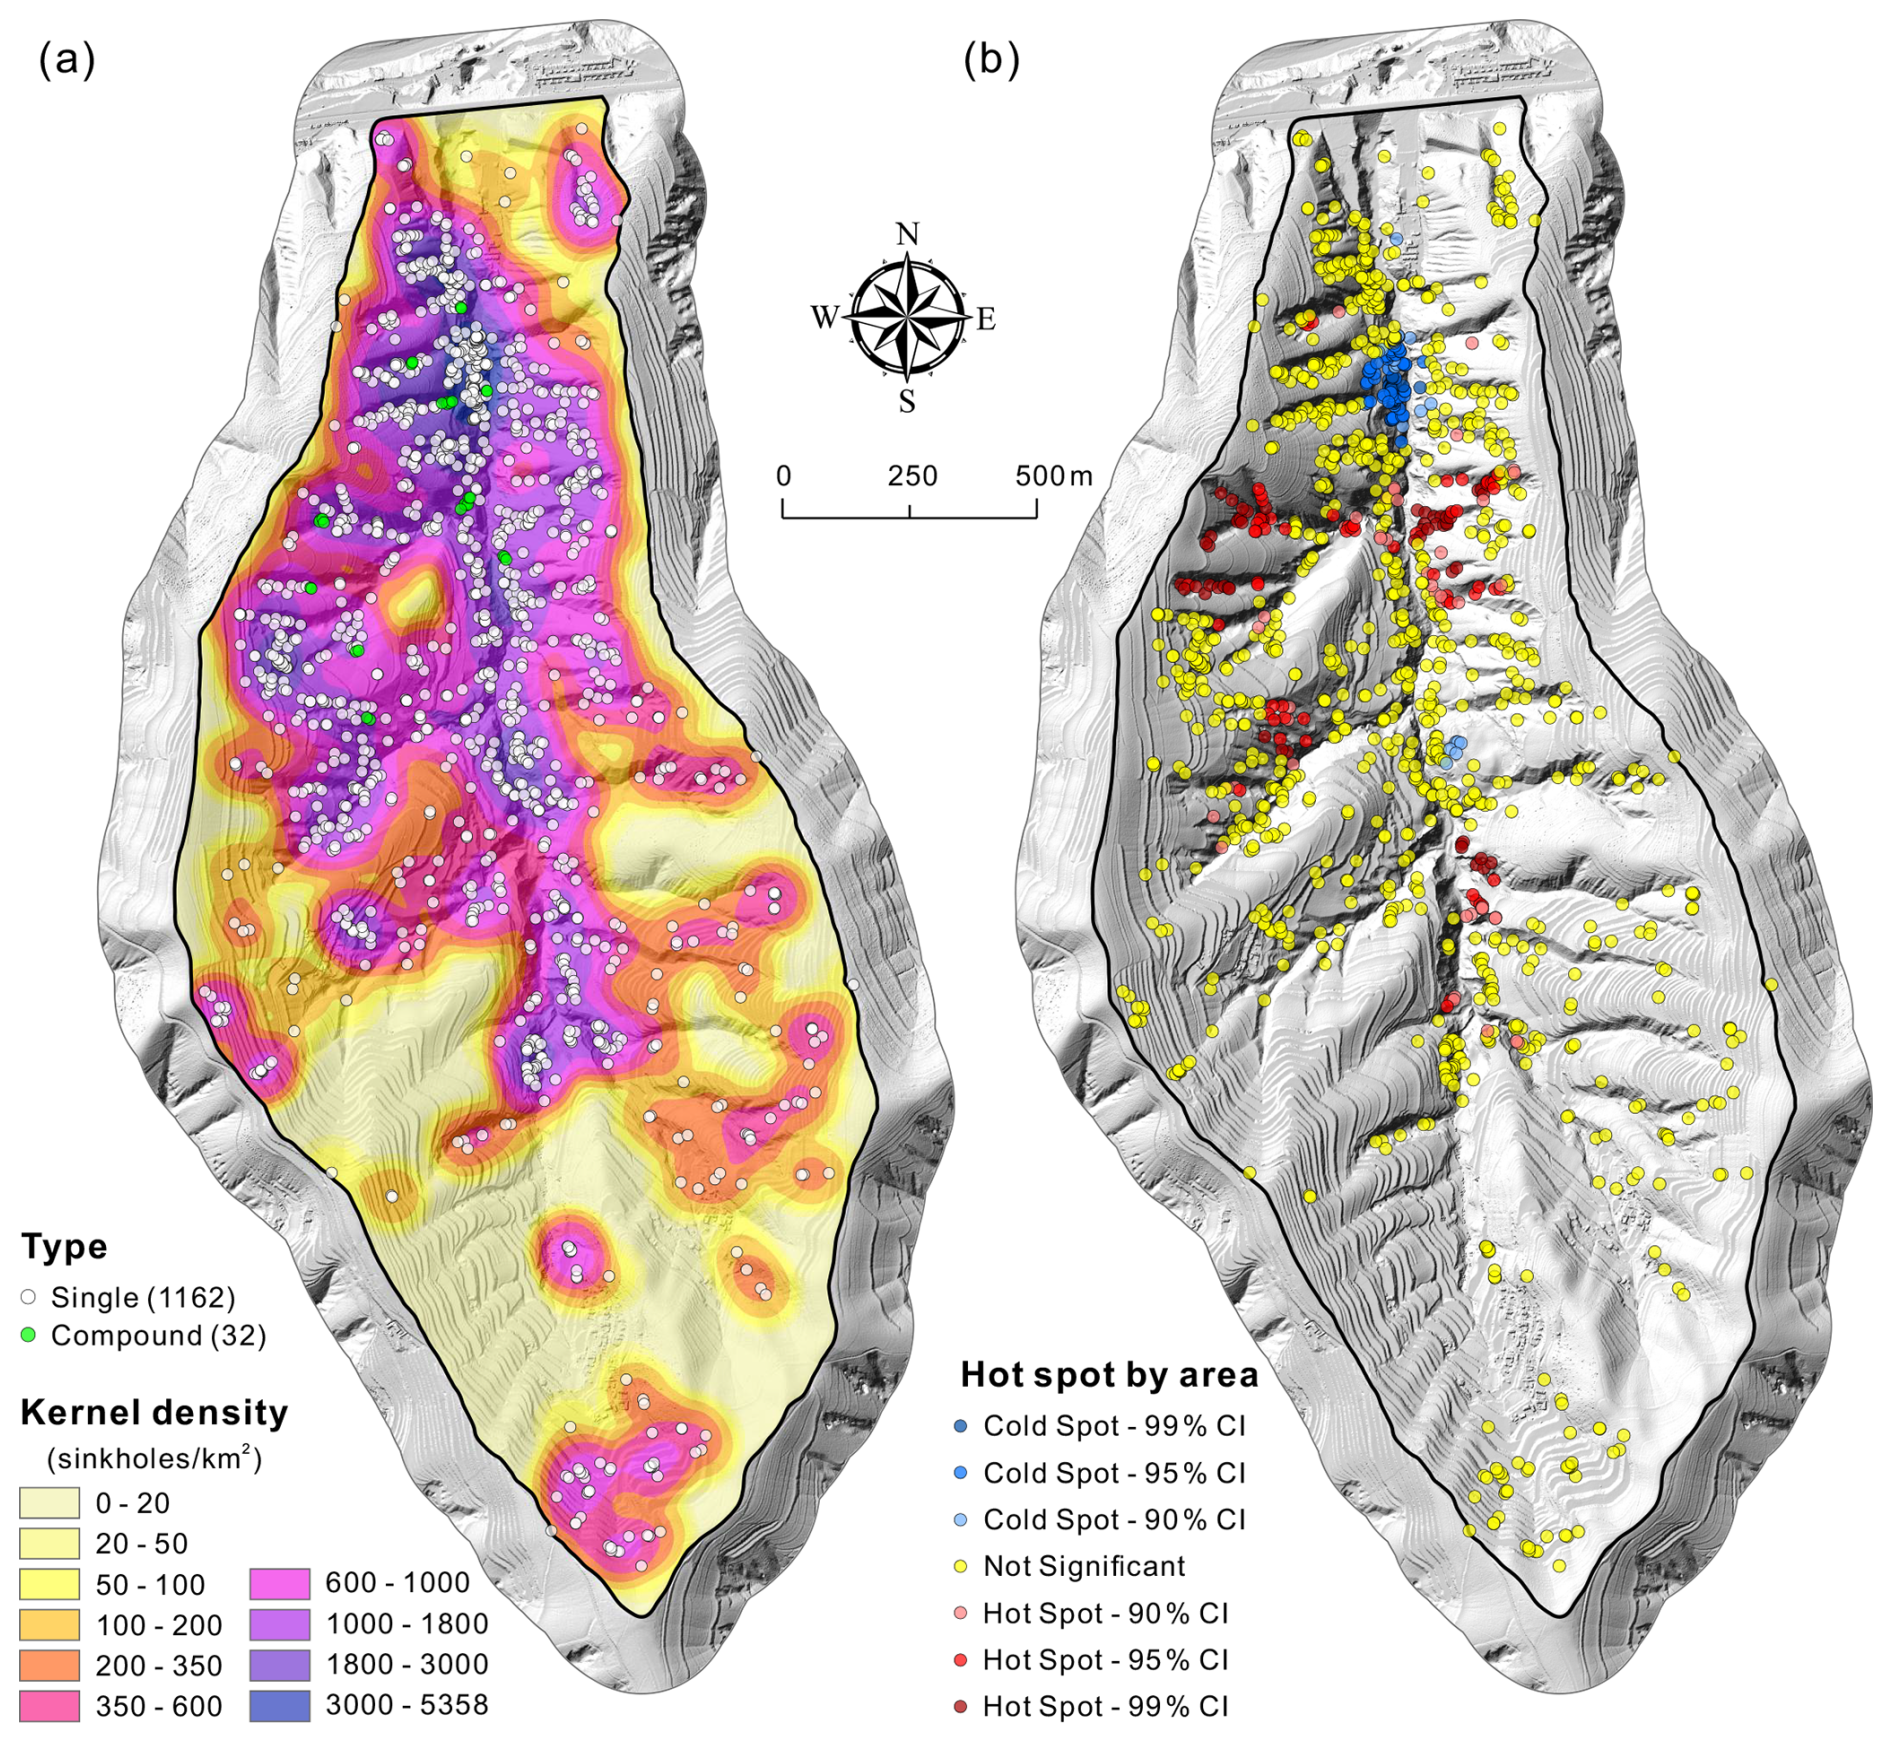
Figure 8Spatial distribution patterns of loess sinkholes: (a) Sinkhole type and kernel density map (search radius: 100 m); (b) Hot spot map by sinkhole area (threshold distance: 100 m).
4.3 Morphometric analysis
In this section, we analyze the spatial and morphometric parameters computed for the 1194 inventoried sinkholes (1162 single, 32 compound), their frequency-size distribution (Fig. 9), as well as some spatial patterns based on the distribution of different value ranges (Fig. 10). It should be noted that the airborne LiDAR returned sparse and limited point clouds when detecting sinkholes with diameters less than 1 m. Consequently, for the calculation of parameters related to sinkhole depth and volume (e.g., Maximum Elevation, Maximum Depth, Volume, and Length-to-Depth Ratio), we retained only those 809 sinkholes with diameters ≥1 m.
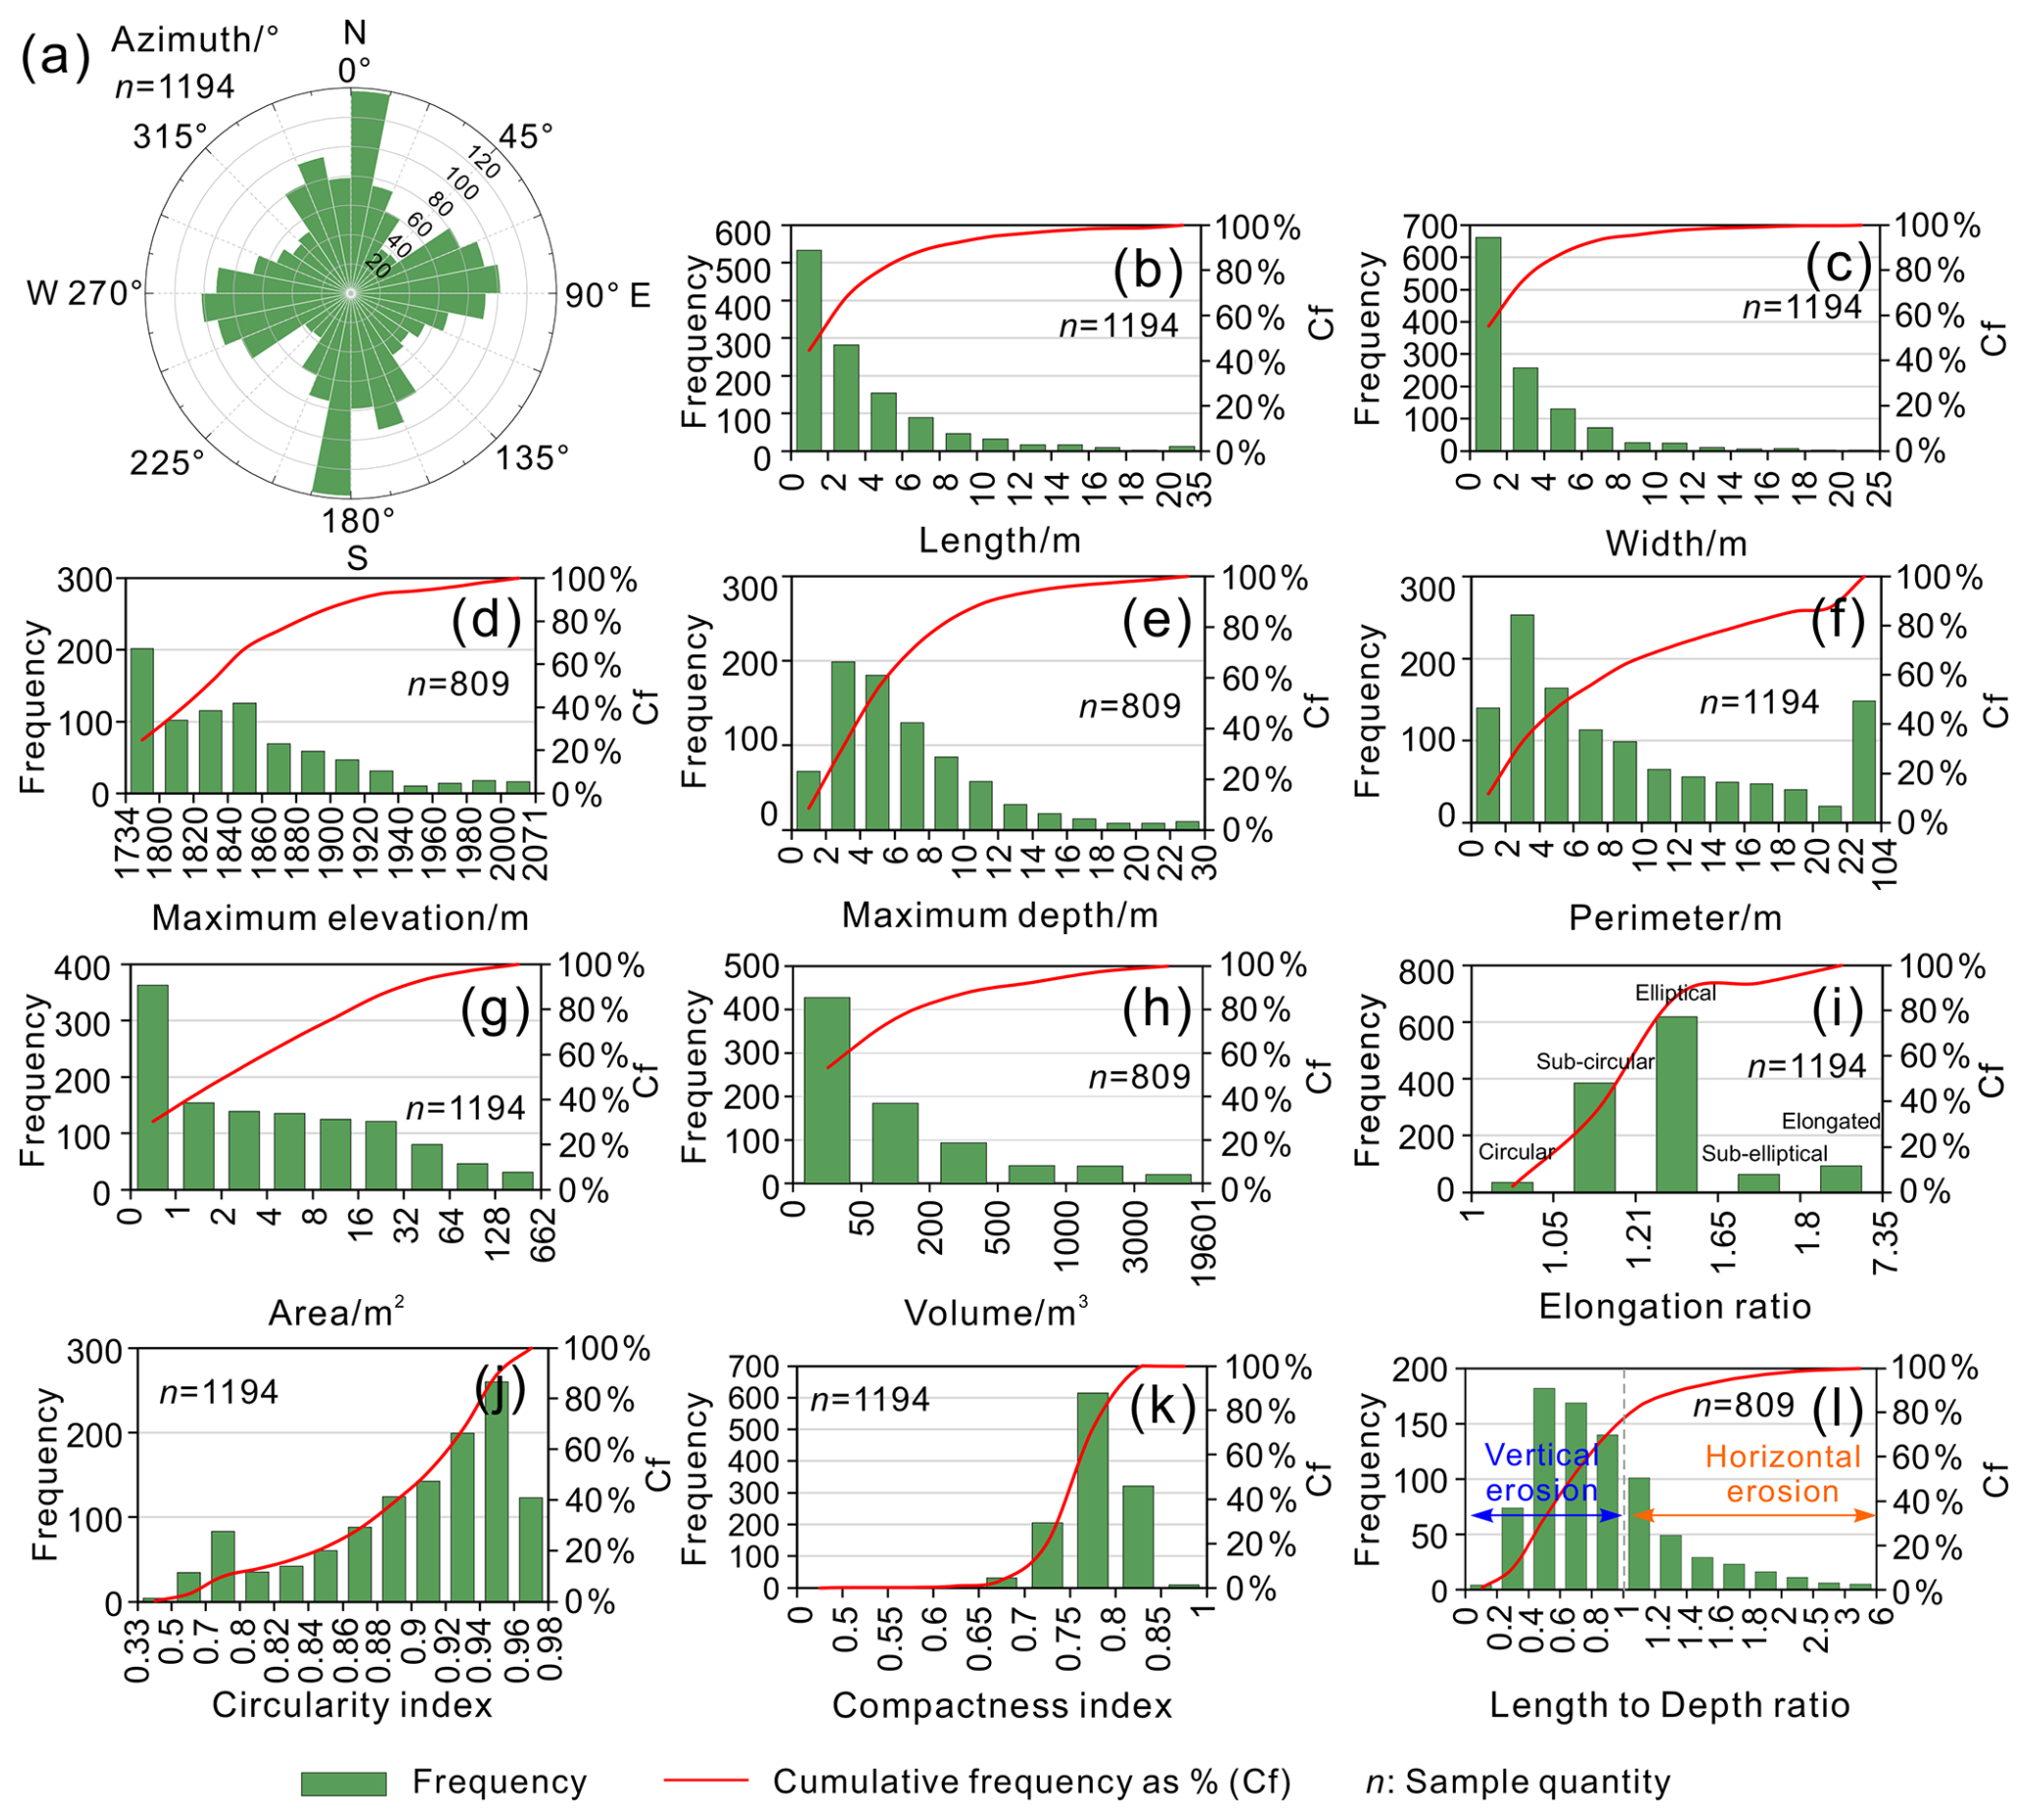
Figure 9Frequency distribution, represented as number of sinkholes and cumulative frequency in percentage, of different spatial and morphometric parameters of the inventoried sinkholes: (a) Azimuth; (b) Length; (c) Width; (d) Maximum elevation; (e) Maximum depth; (f) Perimeter; (g) Area; (h) Volume; (i) Elongation ratio; (j) Circularity index; (k) Compactness index; (l) Length to Depth ratio.
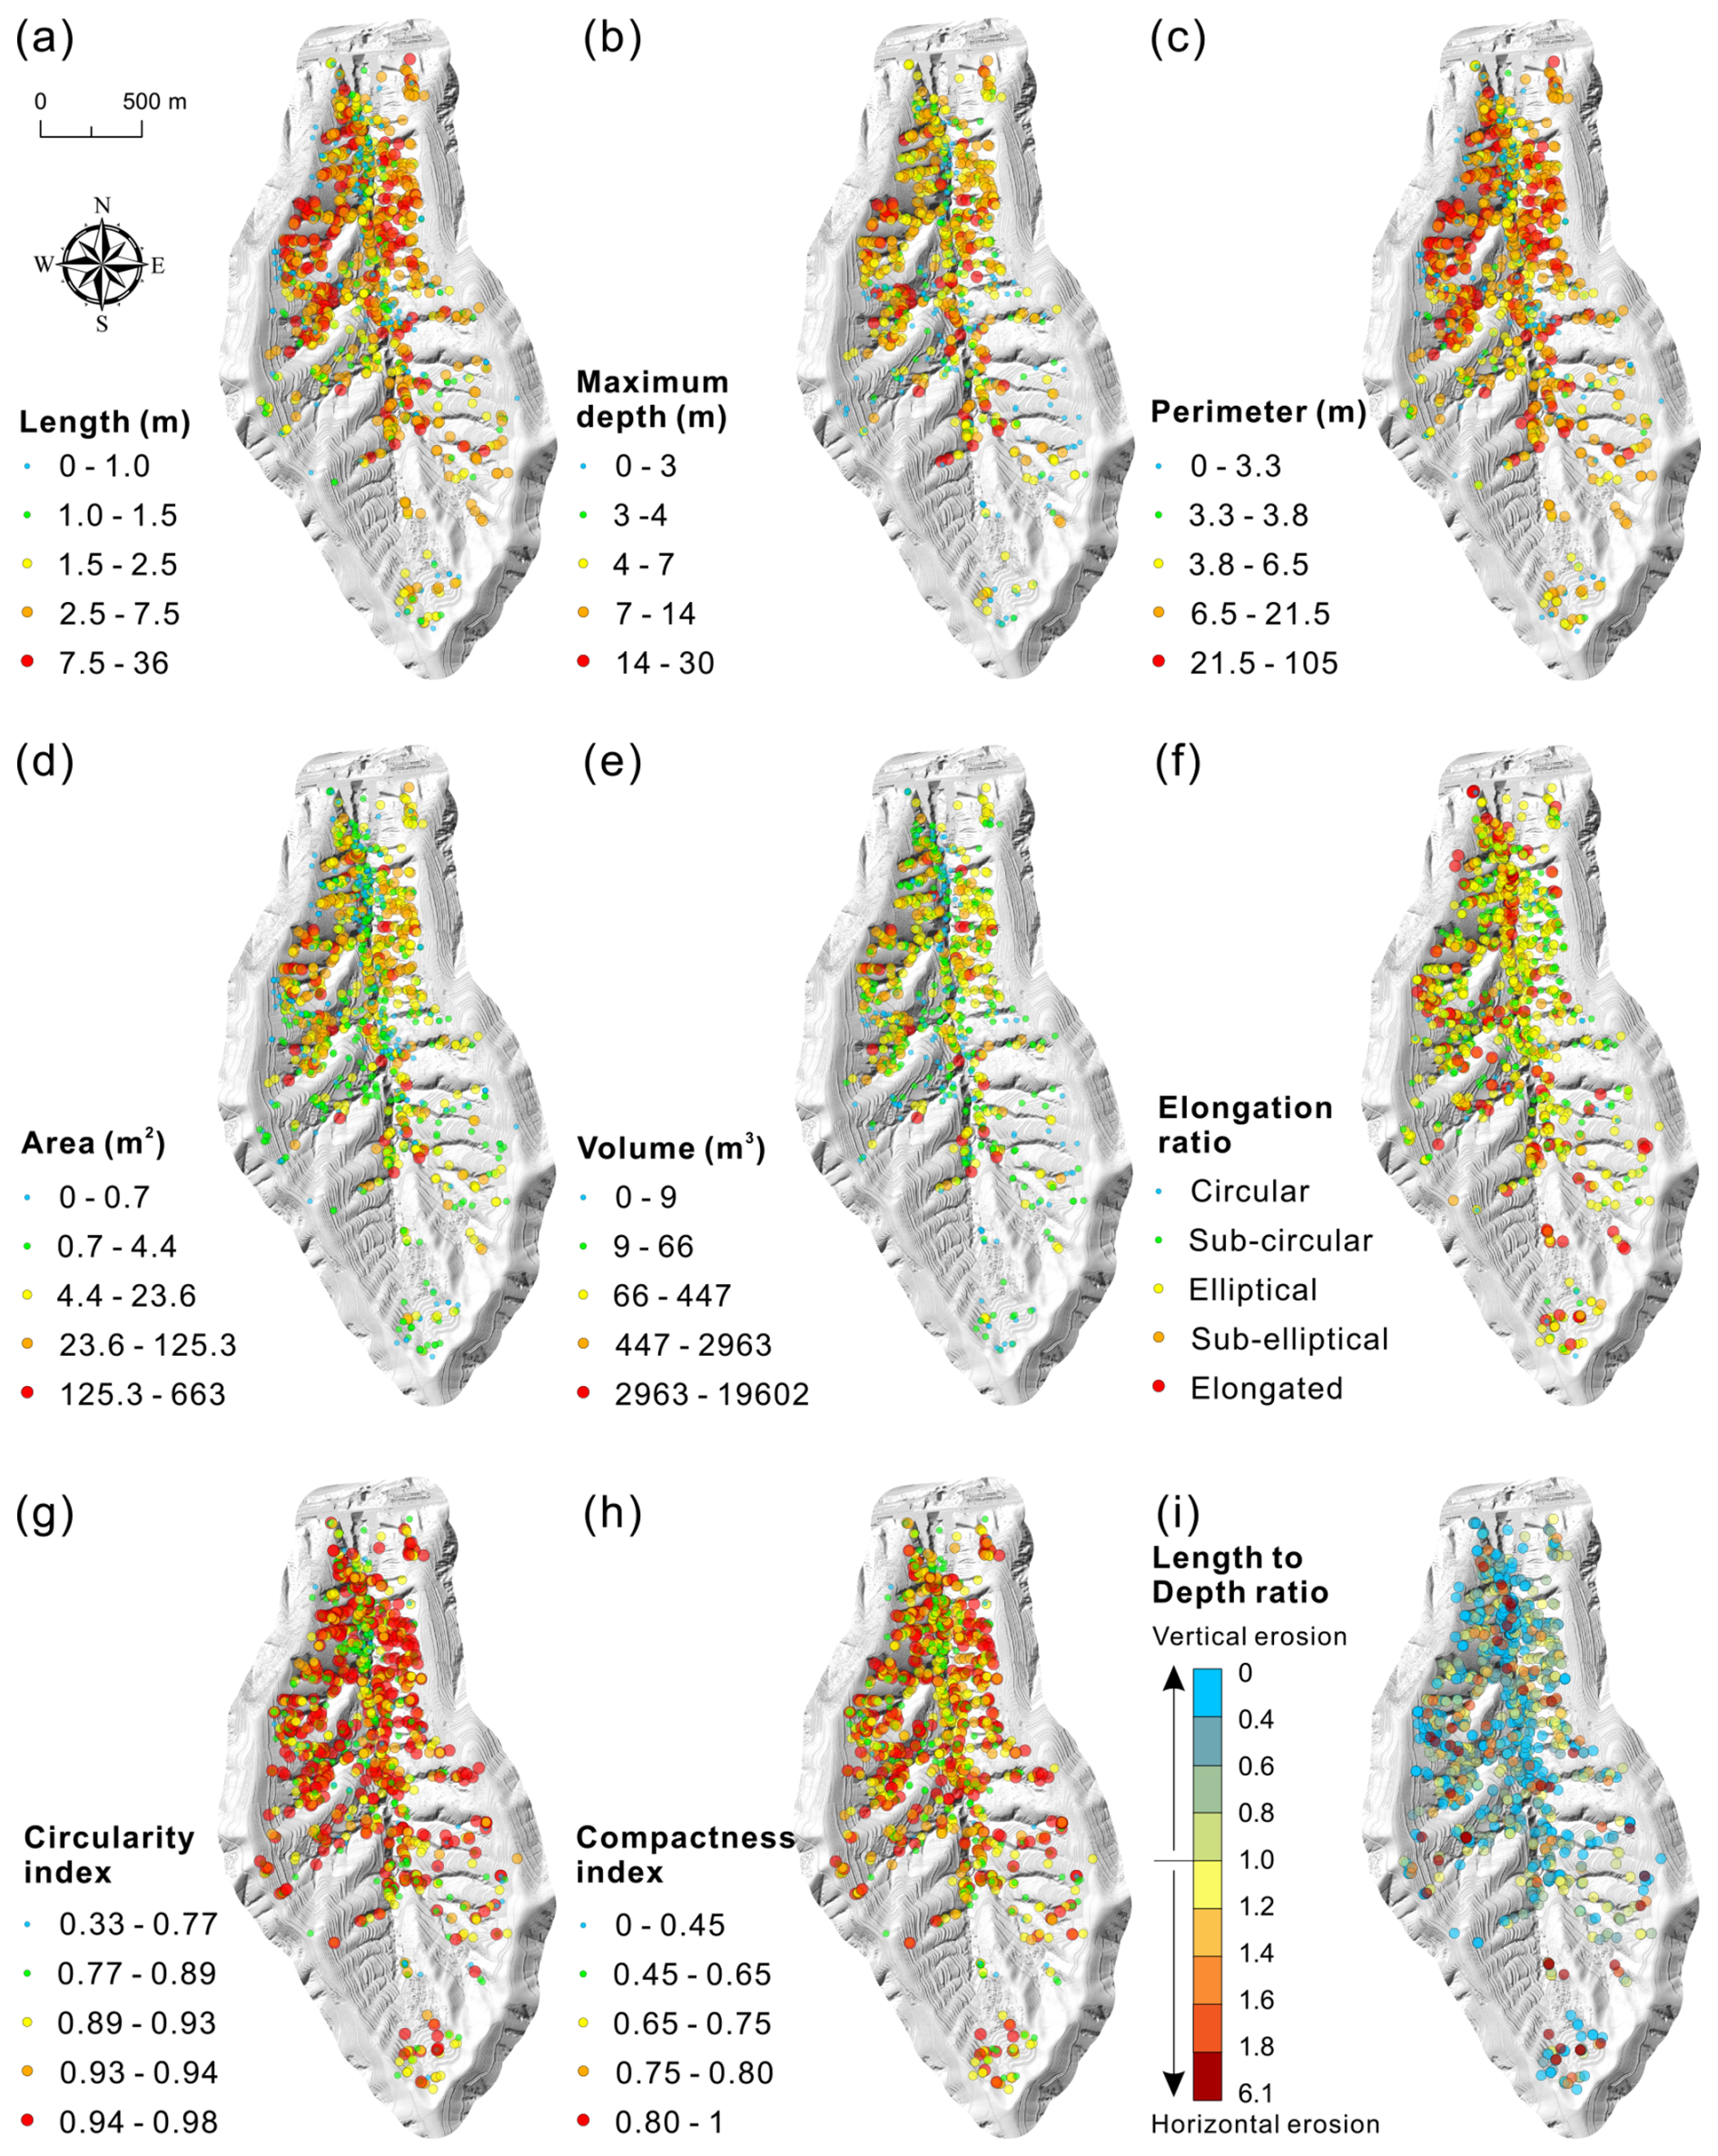
Figure 10Spatial distribution of the sinkholes categorized into different value ranges: (a) Length; (b) Maximum depth; (c) Perimeter; (d) Area; (e) Volume; (f) Elongation ratio; (g) Circularity index; (h) Compactness index; (i) Length to Depth ratio.
4.3.1 Spatial parameters
The analyzed spatial parameters include the orientation of the sinkholes (azimuth) and the maximum elevation. The rose diagram in Fig. 9a illustrates the frequency distribution of the azimuth of the major axes of sinkholes, showing preferred N–S and W–E orientations. The number of sinkholes in the Sunjiacha basin decreases as elevation increases (Fig. 9d). In the relatively low elevation range of 1734–1860 m, there are 545 sinkholes (67.37 %), whereas the number of sinkholes at mid-elevations (1860–1960 m) and high elevations (1960–2071 m) are 216 (26.58 %), and 48 (6.05 %), respectively. Approximately 94 % of the sinkholes are located in the more dissected mid- and low-elevation areas, despite they represent 76 % of the basin area.
4.3.2 Planimetric morphometric parameters
The analyzed planimetric morphometric parameters include length, width, perimeter, area, elongation ratio, circularity index, and compactness index. The frequency distribution of the length (Fig. 9b) and width (Fig. 9c) of sinkholes follows a consistent pattern, characterized by exponential decay as the values increase. The number of sinkholes with lengths and widths ranging from 0 to 2 m is the highest, totaling 533 (44.64 %) and 661 (55.36 %), respectively. Conversely, sinkholes exceeding 10 m in length and width account for only 7.45 % and 4.19 % of the total sample, respectively. The map in Fig. 10a reveals that sinkhole length exhibits distinct spatial patterns, with smaller sinkholes preferentially occurring in areas with lower degree of dissection (i.e., head of the basin and slopes close to the basin divides) and in recent landslides associated with the trunk stream.
Regarding the ratio between length and width (elongation ratio, ER), Basso et al. (2013) and Zumpano et al. (2019) classified the plan shape of sinkholes into five categories: circular (ER ≤1.05), sub-circular (), elliptical (), sub-elliptical (), and elongated (ER>1.8). Figures 9i and 10f show that sinkholes tend to have some degree of elongation, but without showing any clear spatial pattern in relation to this parameter. Elliptical shapes dominate in the study area, with 618 sinkholes (51.76 %), followed by sub-circular morphologies with 384 depressions (32.16 %). Elongated sinkholes also represent a considerable number, totaling 93 (7.79 %). Circular and sub-elliptical sinkholes are relatively infrequent, with 35 (2.93 %) and 64 (5.36 %), respectively. Similar to length and width, the frequency of sinkhole perimeter and area shows a general decreasing trend as the size increases (Fig. 9f and g). The maximum perimeter and area reach 104 m and 662 m2, respectively. Sinkholes with a perimeter ≤4 m represent 21.9 % (253) of the inventory, and 30.40 % are those with an area ≤1 m2. In agreement with length and width, sinkholes with large perimeter and area tend to occur in sectors of the basin where the drainage net shows a greater degree of entrenchment, with the exception of some recent landslides (Figs. 8b, 10c, and d).
The circularity index (CLI) quantitatively assesses how much the shape of a sinkhole deviates from a perfect circle. CLI is equal to 1 in the case of a perfect circular shape and attains progressively lower values as it becomes less circular (e.g., elongated, irregular edge). The circularity index statistics indicate that 89.87 % (1073 sinkholes), 60.64 % (724 sinkholes), and 10.30 % (123 sinkholes) of the mapped sinkholes have a CLI greater than 0.8, 0.9, and 0.96, respectively (Figs. 9j and 10g). The compactness index (COI) also quantifies how close is the shape of the sinkhole perimeter to a circle. The elongation and/or complexity of the sinkhole perimeter contributes to reduce the COI below 1. The loess sinkholes with a COI greater than 0.6, 0.7, and 0.8 represent 99.58 % (1189 sinkholes), 96.40 % (1151 sinkholes), and 27.72 % (331 sinkholes) of the sinkholes, respectively (Figs. 9k and 10h). The statistics of both the CLI and COI reveal that the perimeter of a great proportion of the sinkholes significantly deviates from a circular shape, in agreement with the calculated elongation ratios. Moreover, these parameters do not show any general spatial pattern, with the exception of a high proportion of sinkholes with low CLI and COI values in some landslides associated with the trunk stream (Fig. 10g and h).
4.3.3 3D morphometric parameters
The three-dimensional parameters are those that incorporate the vertical dimension, including maximum depth, volume, and Length to Depth ratio. Note that large-area and large-perimeter sinkholes may have reduced volume if their depth is low. The frequency distribution of the maximum depth of the sinkholes in the study area shows a positively skewed distribution (Fig. 9e). Sinkholes with depths ranging from 2 to 6 m represent 47.22 % of the sample (382 sinkholes). Only 58 sinkholes exceed a maximum depth of 14 m, representing just 7.17 % of the total. The deepest sinkhole reaches a remarkable value of 29.6 m, and the average maximum depth is 6.55 m. The frequency of the sinkhole volume decreases exponentially as the size increases, with maximum and average values of 19 601 and 335 m3, respectively (Fig. 9h). A total of 428 sinkholes (52.90 %) have volumes of ≤50 m3. The maps in Fig. 10b and e shows that deeper sinkholes and large-volume sinkholes (>500 m3) preferentially occur in association with deeply incised gullies.
To some extent, the length and depth of the sinkholes reflect the horizontal and vertical development of the depressions, respectively. Thus, the Length to Depth ratio (LDr) indicates whether sinkholes have greater horizontal (LDr >1) or vertical (LDr <1) dimension. The relative value of these parameters can be influenced by multiple factors and processes, some favoring greater lengths (e.g., sinkhole expansion, coalescence) and others greater depth (e.g., deep subsurface conduits, erosion at the floor of sinkhole with bottom outlet). The frequency distribution of the LDr shows a positively skewed distribution, with 569 sinkholes (70.33 %) having a LDr lower than 1 (greater depth than length), while those with a LDr greater than 1 represent 29.67 % (240) of the sinkholes with depth data (Fig. 9l). These values indicate that subsurface vertical erosion is the dominant process in the formation of loess sinkholes in the study area, largely due to the development of relatively deep pipes within the thick loess cover (Fig. 10i).
4.4 Frequency-size relationships
The semi-log plot in Fig. 11 represents separately the length of the 1162 single sinkholes and the 32 compound sinkholes mapped in the Sunjiacha basin, versus relative cumulative frequency. The latter indicates the frequency of sinkholes equal or larger than a given length. The length distribution of the single sinkholes, ranging from 35.1 to 0.2 m and covering 2.3 orders of magnitude (i.e., ), shows a wider range than the compound sinkholes, spanning 1.6 orders of magnitude from 33.9 to 0.9 m. As expected, compound sinkholes tend to reach larger dimensions (i.e., plotted to the right), with a median length (cumulative frequency =0.5) that is 1.7 times larger than that of single sinkholes (3.8 vs. 2.2 m).
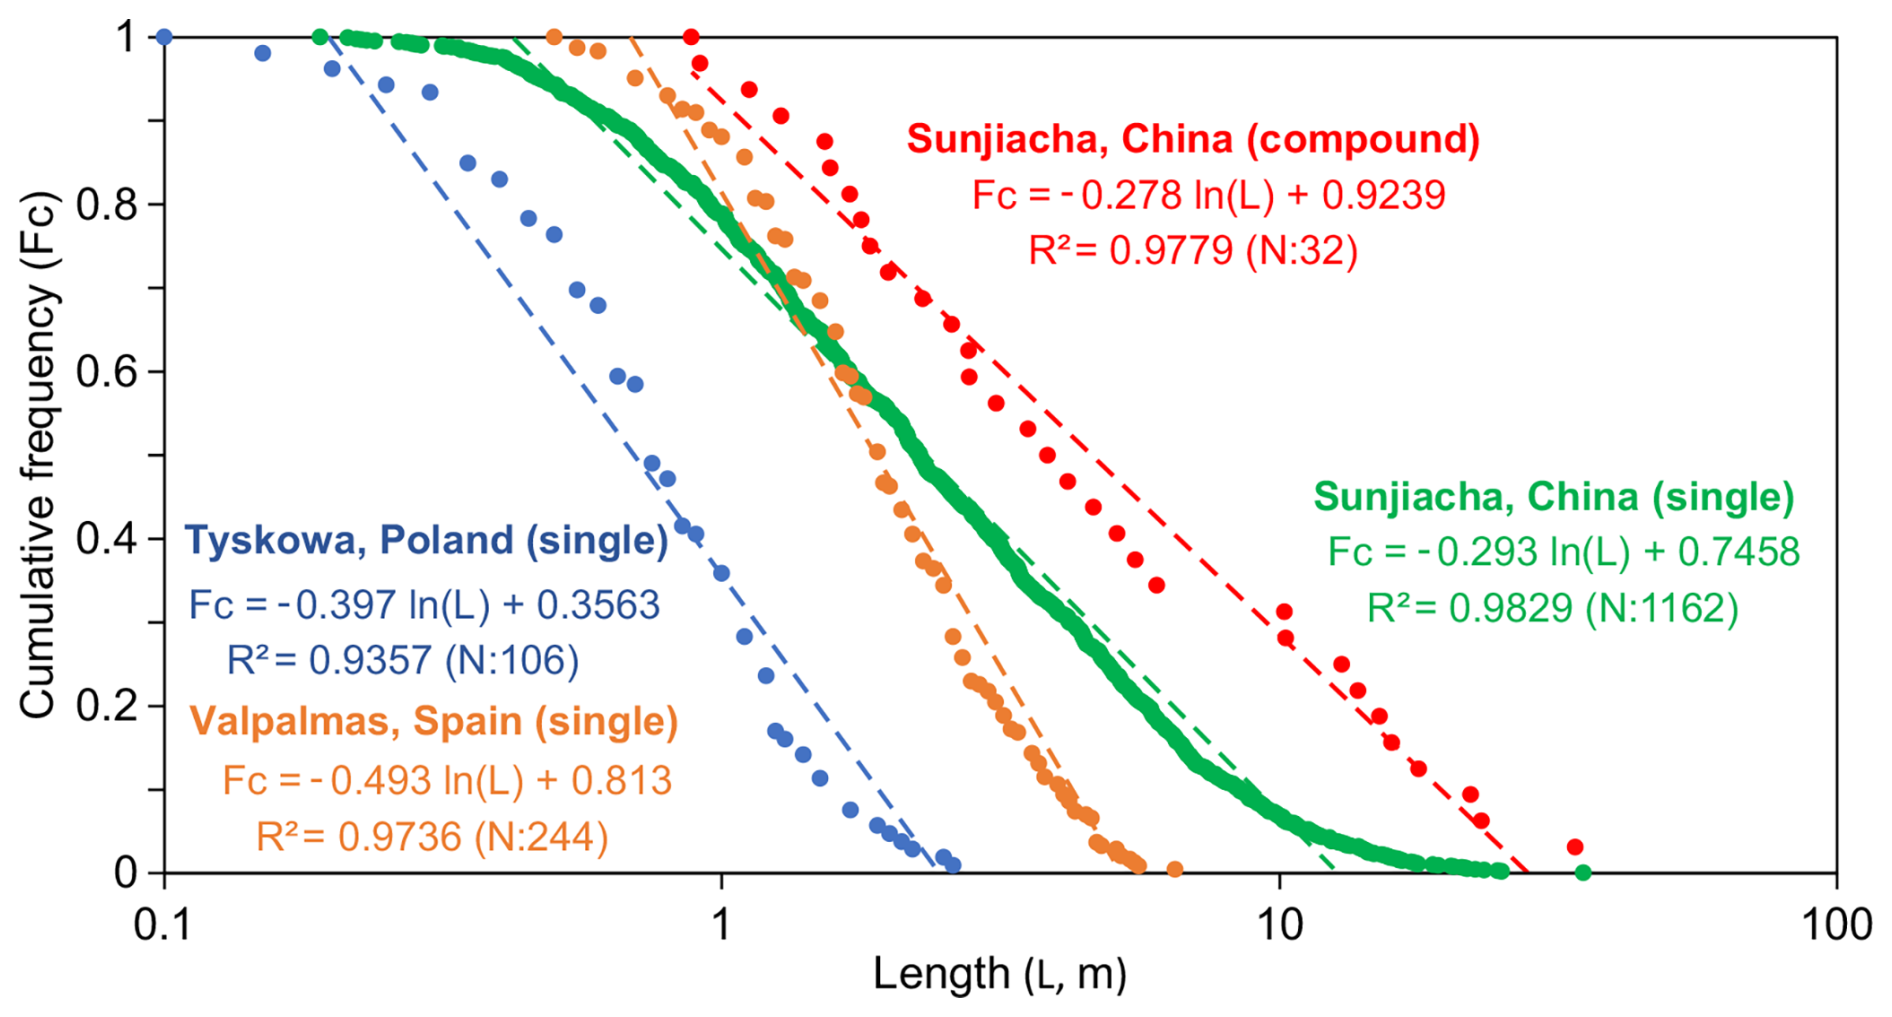
Figure 11Graph showing the cumulative frequency-size distribution of single and compound sinkholes in the study area, as well as single piping sinkholes in other regions with different soils and environmental conditions (Tyskowa, Bieszczady Mountains, Poland; Valpalmas, Ebro Basin, NE Spain).
In both cases, the empirical cumulative frequency-size distribution can be modelled satisfactorily by logarithmic functions (natural logarithm) with a high goodness of fit (R2>0.97). The regression of the compound sinkholes describes adequately the distribution for the whole length range. In contrast, the empirical distribution of the single sinkholes deviates from the fitted curve for both small (<0.4 m) and large dimensions (>12.7 m). These cut-off or rollover points indicate lower empirical frequencies for the smaller sinkholes and higher frequencies for the larger ones compared to the regression curve. Given the completeness of the sinkhole inventory, the lower rollover can be attributed to physical constraints, such as the minimum span of a pipe-roof required for a collapse to occur. The upper rollover could be related to factors such as the expansion of single sinkholes and the depth distribution of sinkhole-forming underground pipes, which in the study area can reach significant depths given the considerable thickness of the loess cover. Note that sinkholes reach a maximum depth of 29.6 m.
4.5 Relationships between different parameters
The planimetric (length, width, perimeter, area) and three-dimensional (maximum depth, volume) size parameters of the sinkholes were fitted pairwise in a matrix diagram showing graphically and with regressions (power functions) the relationships between each pair of morphometric parameters (Fig. 12). As expected, the regressions of pairs of planimetric parameters have always high goodness of fit R2>0.94. In contrast, the relationship between planimetric and 3D parameters is poorer. R2 is always below 0.6 for maximum depth, and less than 0.9 for volume.
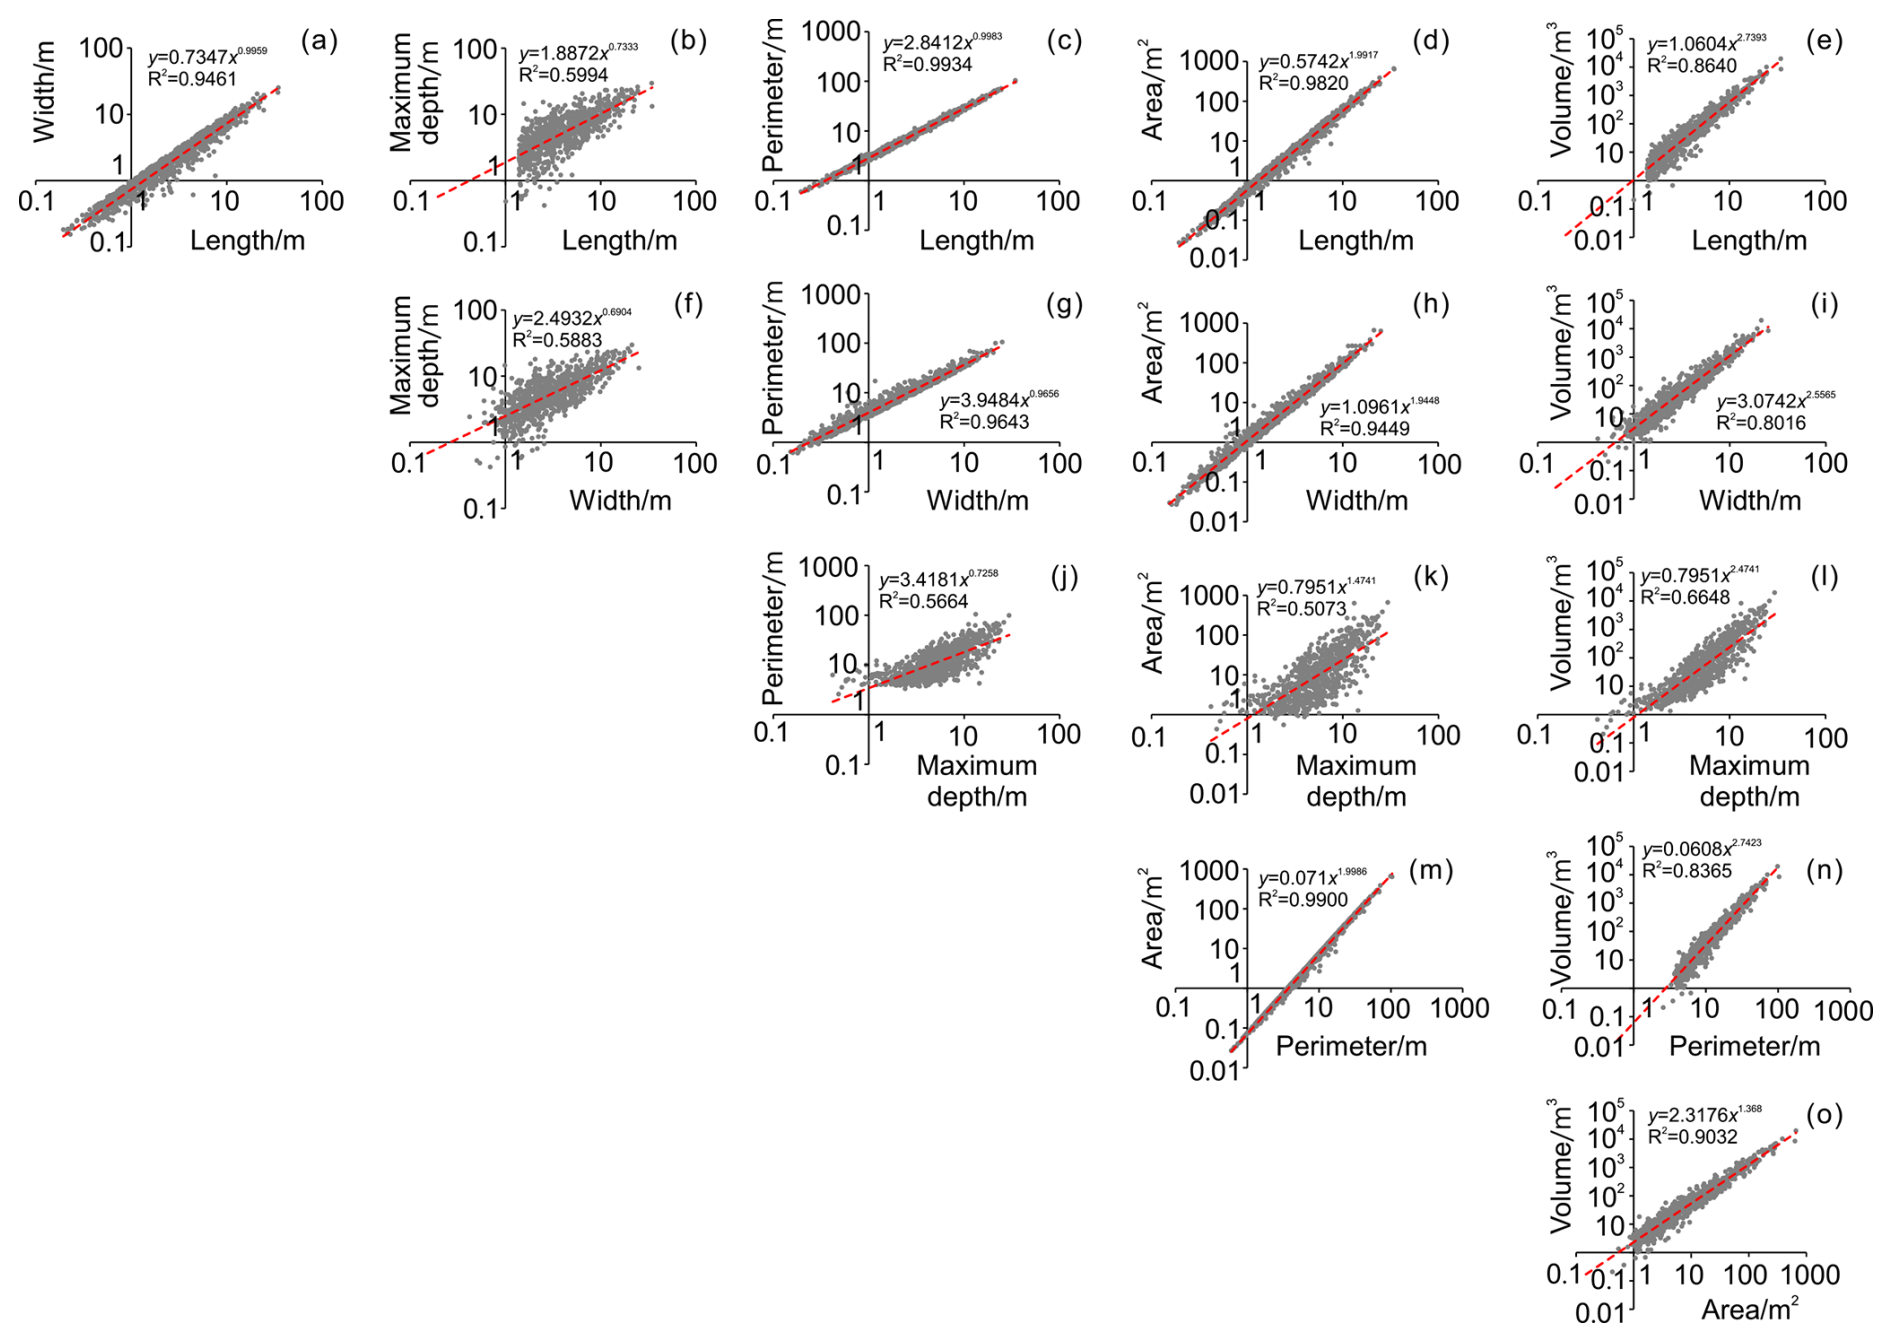
Figure 12Matrix diagram illustrating the pairwise fitting relationships of planimetric (length, width, perimeter, area) and 3D (maximum depth, volume) morphometric parameters.
4.6 Subsurface soil erosion
Sinkhole development, including cavity-roof collapse and the expansion of sinkhole margins by mass wasting processes, can contribute significantly to soil erosion, despite it is largely overlooked worldwide. The complete and accurate sinkhole inventory constructed in the Sunjiacha basin, including volumetric data, provides an excellent opportunity to assess the impact of sinkhole-related soil erosion within the context of the Loess Plateau. We calculated the soil loss associated with each sinkhole by multiplying the volume of each depression by the soil's dry bulk density, as shown in Fig. 13a. Figure 13b illustrates the frequency distribution of soil loss related to individual sinkholes: 0–1 t (389 sinkholes, 32.58 %); 1–14 t (211 sinkholes, 17.67 %); 14–177 t (361 sinkholes, 30.23 %); 177–2014 t (194 sinkholes, 16.25 %); 2014–24 973 t (39 sinkholes, 3.27 %). The aggregate volume of sinkholes (27.08×10⁴ m3) multiplied by the soil's dry bulk density (1.27 t m−3) yields a total soil loss for the basin of 34.50×10⁴ t. Considering the area of the basin (2400 ha), the specific soil erosion related to sinkholes can be estimated at 143.75 t ha−1. Note that these values do not include hidden non-collapsed pipes. Figure 13a shows that the impact of the process is quite uneven, with a much greater contribution in the lower half of the basin and in the areas associated with deeply incised gullies.

Figure 13Soil loss by sinkholes: (a) Spatial distribution map indicating soil erosion related to individual sinkholes; (b) Histogram and cumulative frequency (Cf) curve of soil loss for individual sinkholes.
4.7 In-depth investigation of a complex sinkhole
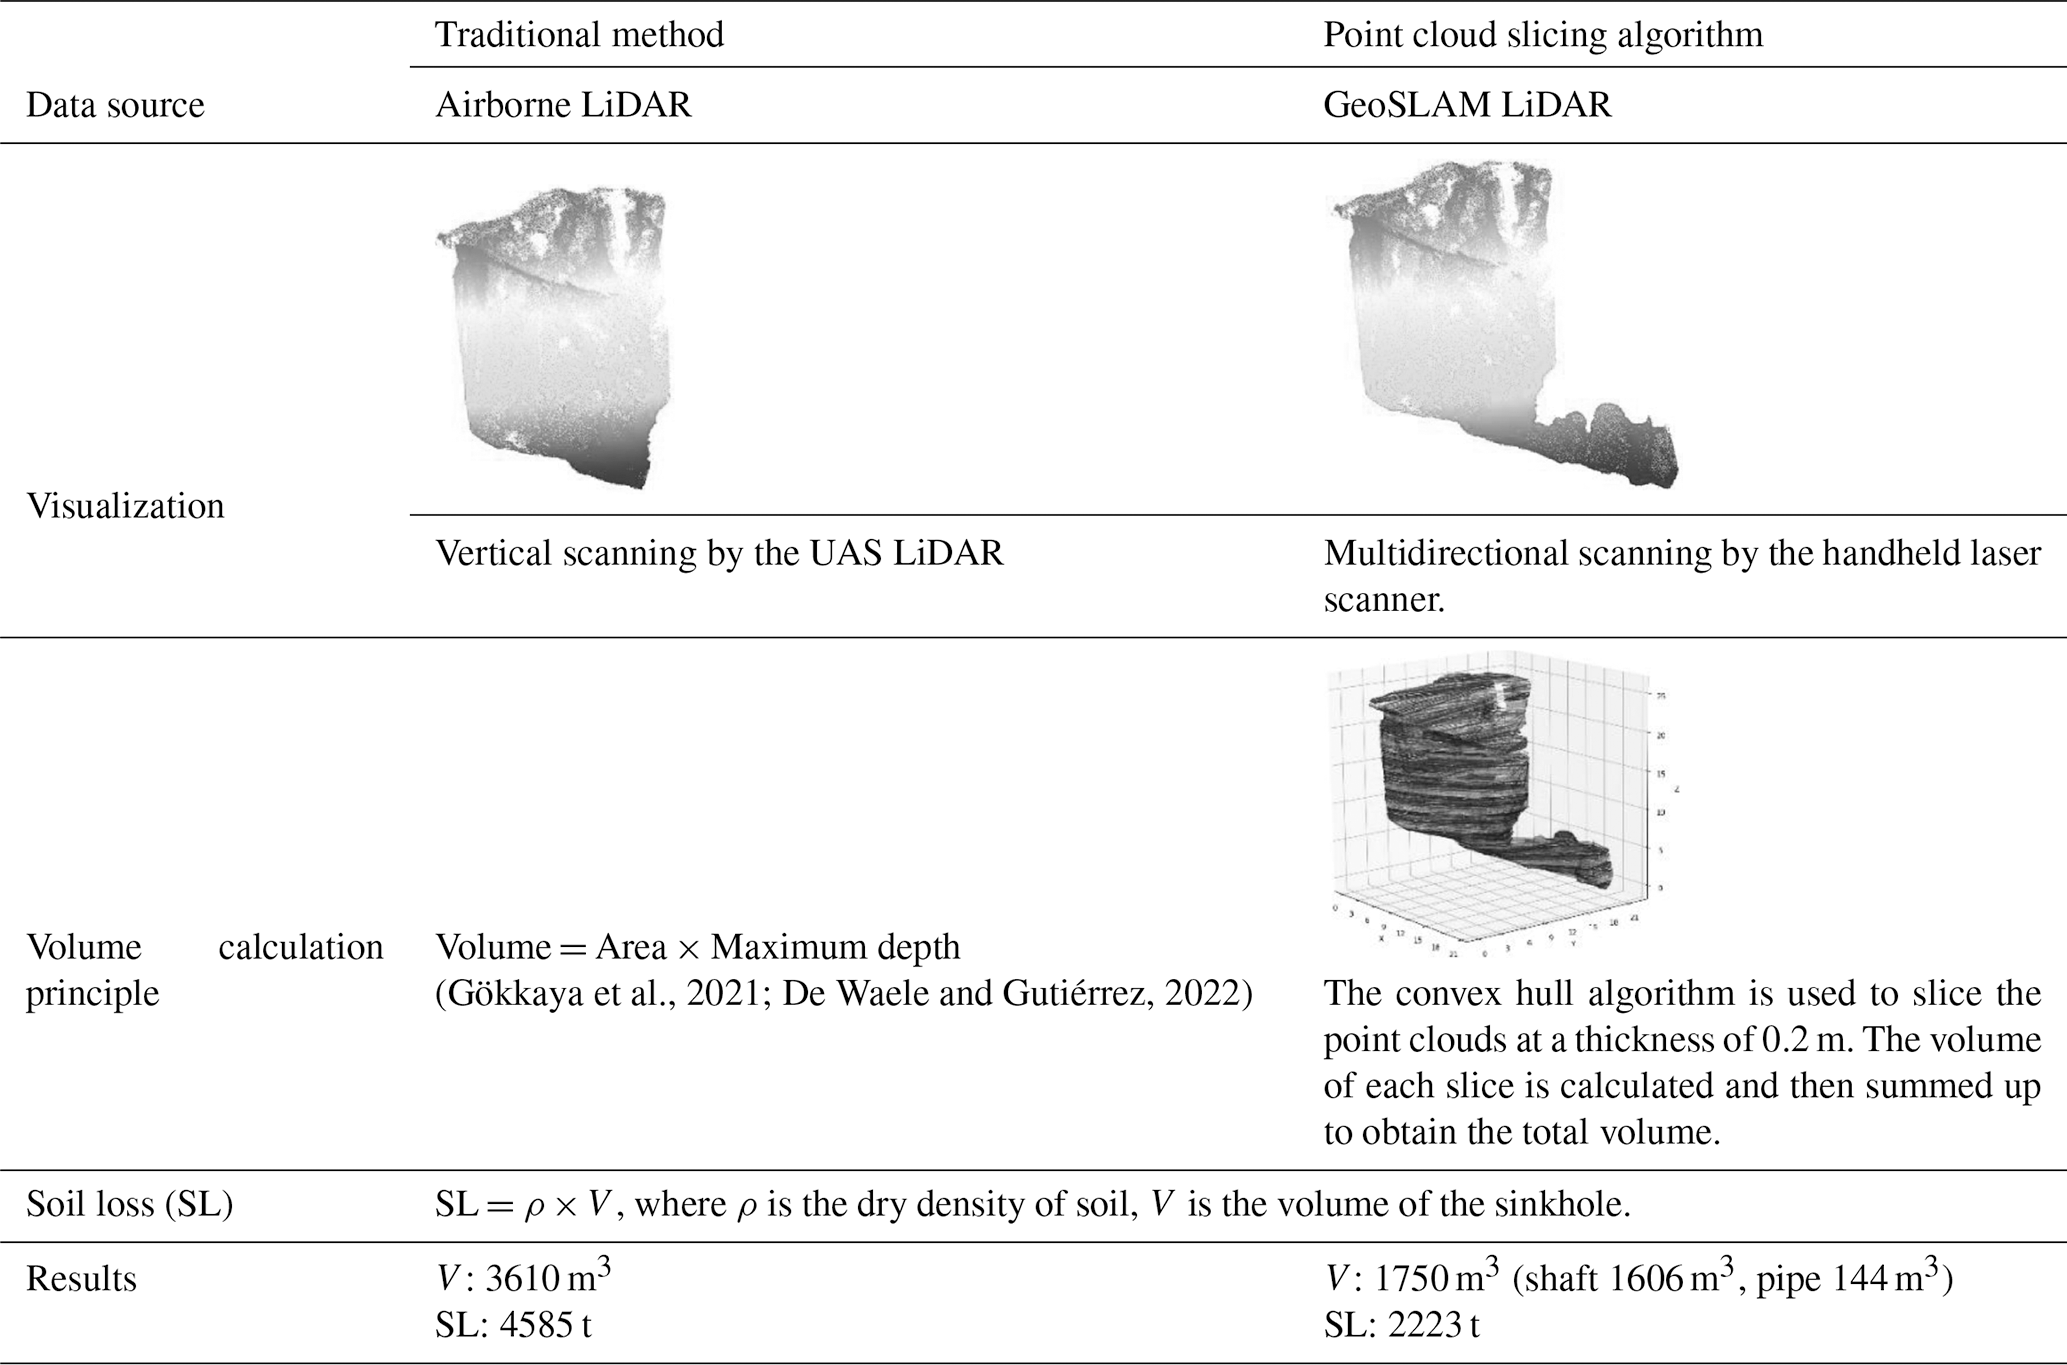
Point clouds captured by airborne LiDAR surveys cover most of the sinkhole topography, thanks to the vertical orientation of the sensors. However, obtaining comprehensive point clouds of the interior of sinkholes remains challenging due to line-of-sight obstructions and the complex morphology. To address the limitations of airborne LiDAR scanning, we employed a handheld laser scanner to conduct a detailed investigation in the interior of thirteen representative sinkholes. Figure 14a–j shows the field photographs and 3D models of a loess sinkhole (HLS01). Morphometric measurements indicate that the perimeter of the sinkhole at the land surface is 49.7 m, with an area of 179.6 m2 and a maximum vertical depth of 20.1 m. We adopted both the traditional method and the point cloud slicing algorithm to estimate the volume of this sinkhole. The results show a volume and soil loss of 3610 m3 and 4585 t calculated by the former method, while the latter yielded values of 1750 m3 and 2223 t, respectively (Table 3). Because the fact that the sinkhole has an inclined top opening and a sloping bottom underlain by deposits (Fig. 14a and d), the volume calculated by the traditional method was twice higher than the actual volume. This finding also demonstrates that handheld laser scanning can capture the complete geometry of the sinkhole more accurately, overcoming the technical limitations of airborne LiDAR.
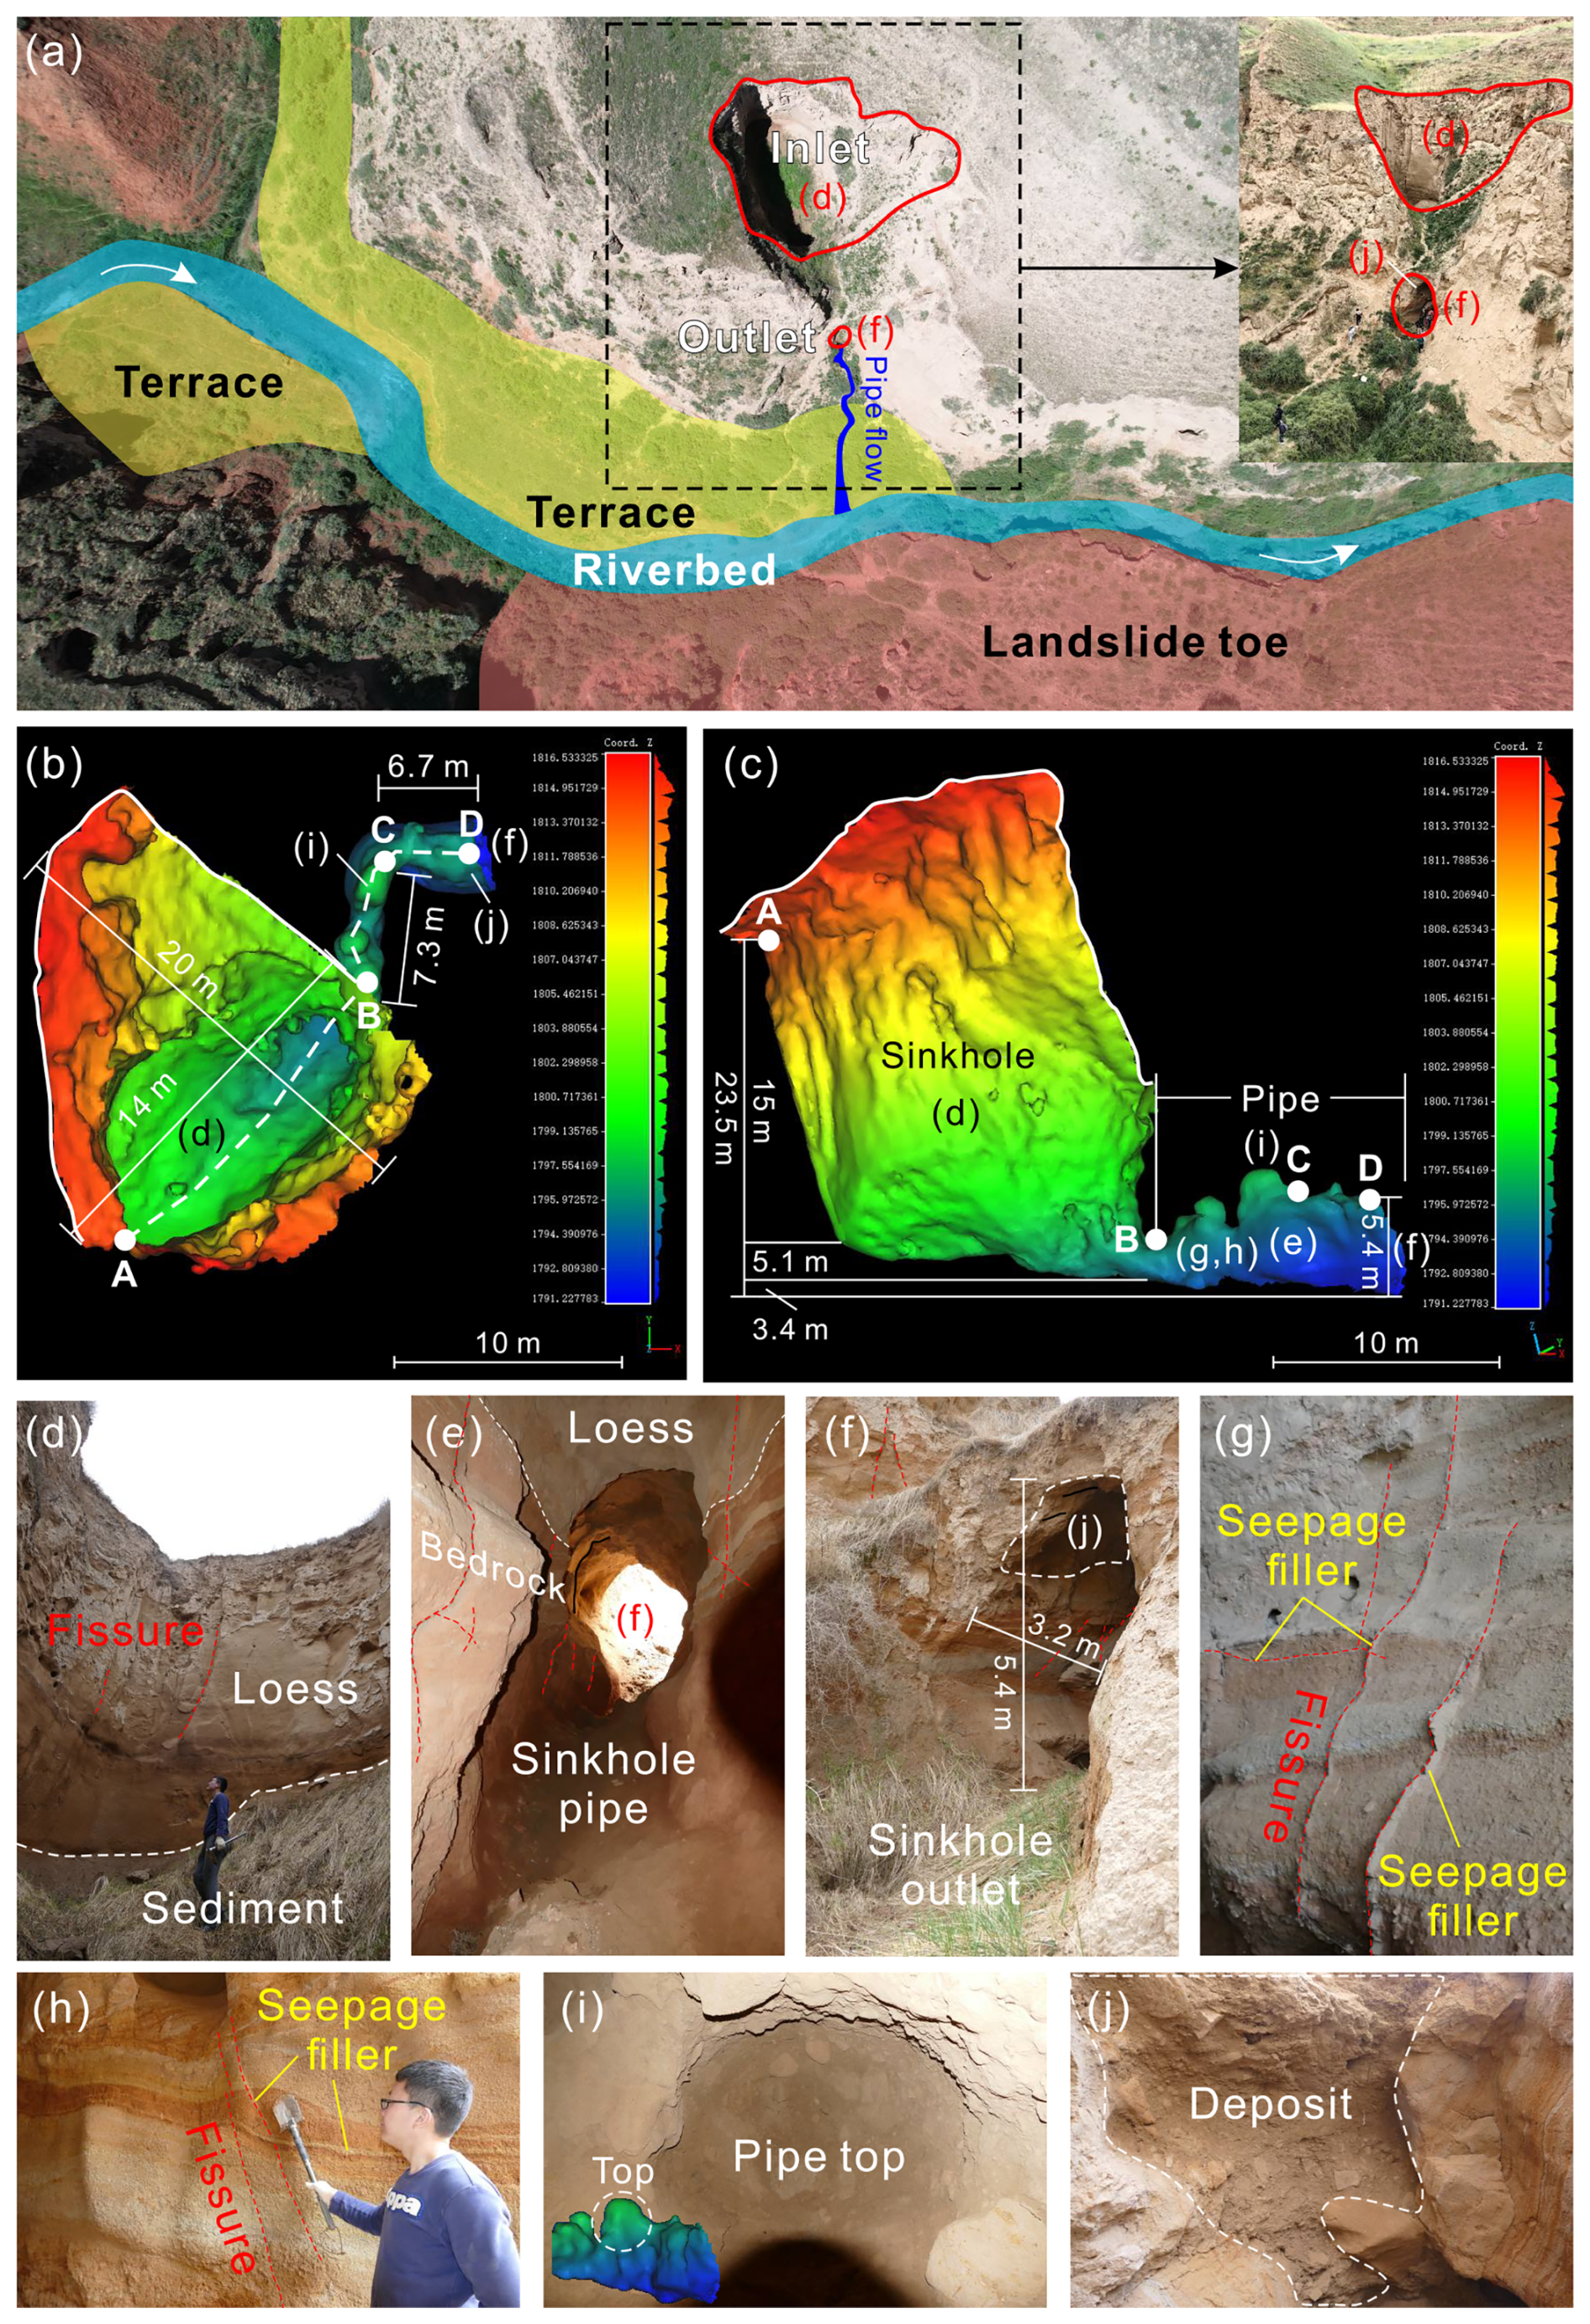
Figure 14Detailed investigation of the interior of a representative sinkhole with an opening at the bottom (see location in Fig. 5a and f): (a) Location, overview field photograph, and associated landforms; (b) 3D model generated from GeoSLAM point clouds, annotated with morphometric measurements; (c) Model slice along the AD profile line, also showing morphometric measurements; (d) Photograph of the sinkhole bottom; (e) Photograph of the pipe; (f) Sinkhole outlet; (g, h) Bedrock exposed in the sinkhole wall; (i) Photograph of the pipe top; (j) Poorly-sorted deposits including angular loess clasts accumulated in the sinkhole floor by collapse and mass wasting processes.
Table 3Comparison of sinkhole volume and corresponding soil loss estimated using traditional method versus point cloud slicing algorithm.
Interestingly, most sinkholes examined in the field display dominant vertical development, while this particular sinkhole exhibits a complex three-dimensional morphology comprising a vertical shaft connected to a subhorizontal pipe. The upper shaft-like portion of the sinkhole () is situated in loess deposits, while the lower portion () is a gently inclined ellipsoidal conduit carved into horizontally bedded and jointed reddish sandstone. This lower conduit ends at the sinkhole outlet perched 8 m above the valley floor (Fig. 14a). Unfortunately, due to the lack of precise chronological evidence, we are unable to determine whether the initial development of this sinkhole predates or postdates the valley incision. We interpret that the development of this complex sinkhole started as a backward propagating conduit at the foot of the slope, associated with a seepage outlet point controlled by joints in the loess cover and the bedrock (Fig. 14d–h). Eventually, the enlarging conduit reached a sufficiently large span to initiate upward roof collapse, ultimately originating the sinkhole. At present, five distinct ceiling cupolas can be clearly observed at the top of this pipe (Fig. 14b, c and i), indicating sites of upward roof propagation (stoping).
Additionally, we observed a significant accumulation of horizontally stratified flood deposits resting atop the aeolian loess on the fluvial strath terrace (Fig. 14a). The interior of the sinkhole is relatively cool and damp, with the bottom underlain by collapsed soil. We found remnants of past flash-flood or debris-flow deposits on the sinkhole floor, as well as on the walls and outlet ceiling of the connected lateral pipe (Fig. 14d, f and j). These sediments may include: (1) Horizontally bedded deposits accumulated during floods in the drainage, with a stage high enough to cause the penetration of flood waters into the sinkhole outlet (backflooding); (2) Massive to poorly stratified deposits derived from collapse and mass wasting processes acting primarily in the pipe roof and sinkholes margins, respectively. It should be particularly noted that the largest loess landslide in this basin occurred on the opposite bank of this sinkhole. Based on field investigations, we believe that this landslide completely blocked the paleo-channel at that time, forming a small-scale dammed lake, and the landslide deposits and lacustrine sediments could easily have entered the interior of the sinkhole through lateral pipe.
5.1 Contributions of different factors to the sinkhole development
The development of loess sinkholes is influenced by multiple factors of different nature, such as topography, climate, hydrology, soil texture, joints and fissures, animal activity, plant root systems, and human activity (Bernatek-Jakiel and Poesen, 2018; Peng et al., 2018; Geng et al., 2021; Hu et al., 2022; Kariminejad et al., 2023; Li et al., 2024). At the scale of a small basin, climate exhibits minimal variation. Therefore, we focus our analysis on the relationships between loess sinkholes and variables related to catchment topography, geomorphology, hydrology, and land use. In order to better understand the controlling factors, a number of topographic and geomorphic indices and variables, such as Slope, Total Catchment Area (TCA), Topographic Wetness Index (TWI), Valley Depth (VD), Channel Network Distance (CND), Landslides, and Landuse, were computed with the open-source SAGA GIS platform and subsequently mapped in ArcMap 10.5 (Fig. 15a–g). The selection of these indices and variables is primarily based on the following considerations: (1) Slope governs the inherent hydraulic gradient conditions for rainfall infiltration and surface runoff concentration, controlling the piping process leading to sinkhole development; (2) Total Catchment Area represents the upslope land surface that contributes surface and near-surface flow to a given outlet, pixel, or stream segment (Gallant and Hutchinson, 2011). It is a proxy for the potential volume of water that can reach a pipe or a sinkhole site, influencing on their initial formation and subsequent morphological evolution; (3) Topographic Wetness Index is a steady-state, terrain-based proxy for soil moisture and surface saturation potential. It quantifies the tendency of water to accumulate at any location by integrating local slope with the upslope contributing area (Moore et al., 1991); (4) Valley Depth is a measure of the vertical distance from a valley's highest ridges down to its lowest points. It is a proxy for the degree of dissection; (5) Channel Network Distance is the vertical height from a location to the nearest stream. Its value on valley margins depends on both gradient and planimetric distance to the nearest drainage; (6) Landslides can remodel the local topography and significantly disturb loess deposits, reducing their mechanical strength and increasing their permeability, which in turn promotes piping and sinkhole development; (7) Landuse mainly reflects the impact of human activity, notably terracing, on piping and sinkhole development.
In order to assess the spatial relationships between sinkholes and the different indices and variables, we calculated normalized frequencies for different intervals. This normalized frequency (Fn) is given by the ratio between the proportion of sinkholes in the interval and the proportion of the area of that interval. The higher the value of this “likelihood ratio”, the higher the spatial concurrence between sinkholes and the areas with values within the interval (Fig. 15a1–g1). These data, together with the findings presented in the results, help to shed light on the formation and spatial distribution of the loess sinkholes.
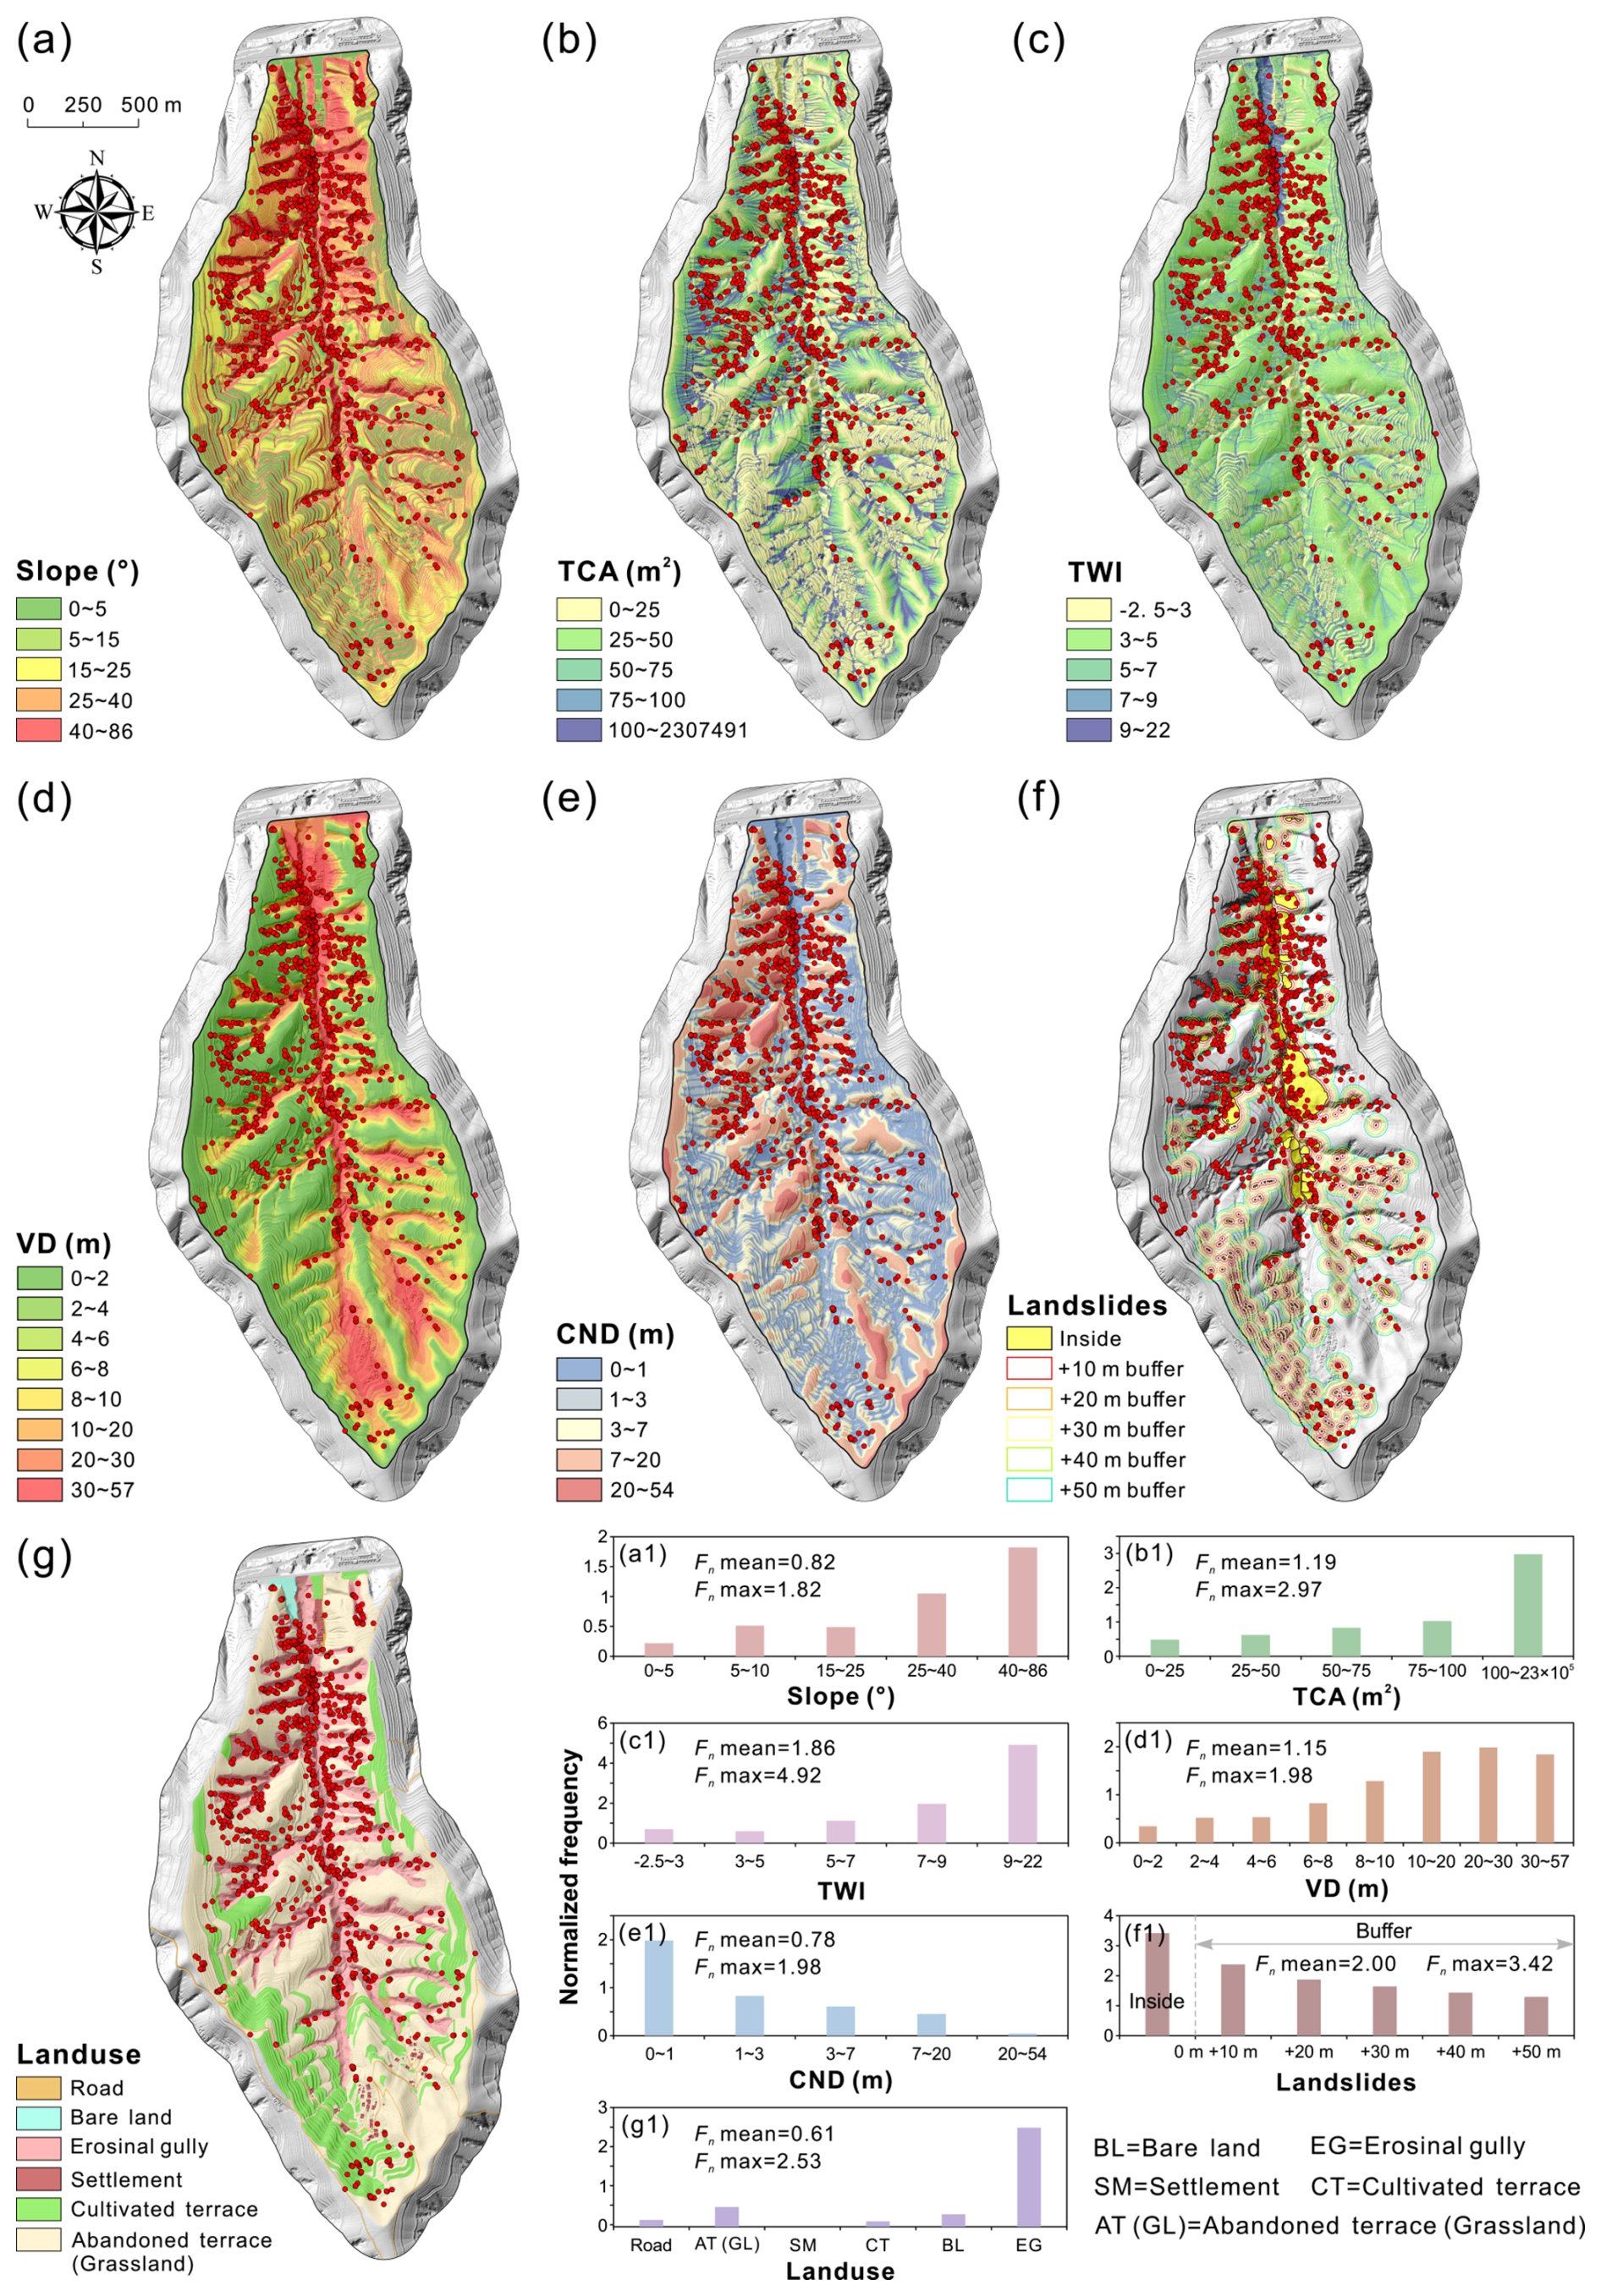
Figure 15Spatial relationships between sinkholes and different indices and variables expressed as maps (a–g) and normalized frequency graphs (a1–g1).
Overall, the normalized frequency graphs show that the distribution of sinkholes is primarily controlled by hydrological, topographic and geomorphic factors. Water availability is an essential factor, in as much as subsurface flow is the geomorphic agent responsible for piping development. This is illustrated by the higher normalized frequencies of sinkholes in areas with high Total Catchment Area (>100 m2; Fn=2.97) and high Topographic Wetness Index (>9; Fn=4.92). Slope is the main governing topographic factor, which largely determines hydraulic gradient and the erosional capability of subsurface flow. Sinkholes preferentially occur in high gradient areas and close to incised gullies, with high Slope (>40°; Fn=1.82), high Valley Depth ( m; Fn=1.98), low Channel Network Distance (<1 m; Fn=1.98), and areas primarily classified as erosional gullies (Fn=2.53). A good spatial correlation is also observed between sinkholes and landslides, with a normalized frequency of sinkholes within landslides (Fn=3.42). These spatial patterns are clearly recognizable in the detailed geomorphological map (Fig. 3) and the Kernel density (Fig. 8a) and hot spot maps (Fig. 8b). The latter shows that sinkholes developed on landslides tend to be smaller. This could be attributed to a younger age of those sinkholes, developed on a more recent geomorphic surface.
The vast majority of the sinkholes occur in erosional gullies (71.44 %, 853 sinkholes). This pattern is consistent with findings reported for soil pipes in other regions worldwide (Verachtert et al., 2010; Kariminejad et al., 2023). Incised gullies may foster the development of pipes and sinkholes through various mechanisms (Bernatek-Jakiel and Poesen, 2018; Peng et al., 2018): (1) they create steep hydraulic gradients; (2) they guide converging surface and subsurface drainage; (3) they favor the development of inlet points (e.g., unloading cracks) and outlet points for seepage flow. As shown in Fig. 6c–f, rows of sinkholes occur along the bottom of erosional gullies. These sinkholes can be connected through groundwater seepage channels, as confirmed by electrical resistivity tomography surveys in previous studies (Hu et al., 2022). It can be anticipated that, with the expansion and coalescence of the sinkholes, the gully will experience significant entrenchment and will turn into a drainage dominated by surface flow.
Another interesting feature is the close association between landslides and sinkholes in the Sunjiacha basin. Previous studies have shown that soil pipes in slopes can favor efficient drainage and, to some extent, help maintain slope stability (Pierson, 1983; Uchida et al., 2001; Sidle and Bogaard, 2016). However, the sinkholes mapped on the landslides have mostly formed after the development of the slope movements. The greater susceptibility of landslide ground to piping and sinkhole development can be attributed to several factors: (1) landsliding contributes to weaken the loess deposits; (2) the internal deformation of the landslide mass typically involves a bulking effect (dilation and volume expansion) accompanied by an increase in permeability; and (3) fissures and other pathways for focused water infiltration are common on landslides (Hu et al., 2020, 2022). At some sites, a causal relationship between landslides and sinkholes can be inferred, showing a cascading geomorphic effect. Figure 15f and f1 illustrate that landslides play an important role in the development of sinkholes. The distance to landslides seems to control the development of sinkholes, but this control effect gradually decays with increasing distance from the landslide boundary. Statistics show that as many as 251 sinkholes (accounting for 21 %) have developed within the landslides, making the landslide interior the second largest contributor to sinkhole formation (Fn=3.42). Approximately 43 % of sinkholes are distributed within the landslide and its outward 20 m buffer zone (Fn=1.87). The size of the sinkholes (e.g., length, area and volume), which can be considered as a proxy for their age, seems to be influenced by the age of the geomorphic surface. Mature sinkholes tend to be larger due to expansion and coalescence, and they usually occur on old geomorphic surfaces (such as old gullies, river terraces and ancient landslides). Conversely, sinkholes developed on landslides that have occurred in the past few years or decades tend to be smaller. This pattern is clearly depicted in the hot spot map shown in Fig. 8b.
We should be aware that the formation of soil pipes and sinkholes is not determined by a single factor, but rather results from the interplay of interconnected geomorphic processes and overlapping external influence factors (e.g., loess thickness, landscape position, surface and subsurface flow, impermeable base layers, etc.). Conversely, the development of soil pipes and sinkholes can further undermine slope stability, intensify gully erosion, and induce geological hazards such as collapses, landslides, and debris flows.
In recent decades, due to a significant decrease in the local agricultural population and the implementation of policies that promote the conversion of farmland back to forests and grasslands, approximately 74 % of the terraced fields have been taken out of cultivation. The landuse map (Fig. 15g and g1) shows that abandoned terraces have reverted to grasslands in the Sunjiacha basin. Abandoned terraces (25.63 %, 306 sinkholes) appear to be more prone to sinkhole formation than cultivated terraces (2.51 %, 30 sinkholes). This can be related to more favorable conditions for pipe development in the abandoned terraces and the lower preservation potential of the sinkholes in the cultivated terraces, where sinkholes tend to be filled soon after their formation. Without a doubt, pipe collapses and gully development pose threats to land productivity, agricultural sustainability, soil nutrient levels, and the carbon cycle, while also potentially destabilizing socio-economic conditions (Llena et al., 2024). By contrast, roads, bare land, and settlement sites seem to exert almost no influence on sinkhole occurrence.
5.2 Spatial and morphological features
Sinkholes tend to be elongated and preferentially oriented in the Sunjiacha basin (Fig. 9a and i). The majority of the major axes of the sinkholes align closely with the directions of the trunk (N–S) and secondary (E–W) channels in the watershed (Fig. 3). These directions tend to guide: (1) subsurface water flow and the trend of pipes generated by internal erosion, and (2) the orientation of unloading cracks (e.g., scarped channel margins) through which water can infiltrate. Both the pipes and the cracks influence the horizontal development of the sinkholes by mass wasting processes acting on the margins and through coalescence (e.g., the merging of aligned sinkholes connected to a common pipe).
The altitudinal distribution of sinkholes (Fig. 9d) may be governed by several factors: (1) the density and entrenchment degree of the drainage network are higher at lower elevations; (2) ground disturbed by landslides chiefly occurs in low elevation areas associated with the trunk Sunjiacha stream; (3) high-elevation zones (e.g., rounded drainage divides) generally have lower topographic gradient, lower degree of dissection, thinner loess cover, and more restricted runoff contributing areas.
The deeper and larger sinkholes tend to be distributed in the more deeply incised valleys (Fig. 10b and e). This pattern can be attributed to the development of deeper subsurface pipes in areas with thicker loess, greater topographic gradient and lower local base level. Thicker loess tends to accumulate in paleotopographic lows, which subsequently guide gully networks.
The goodness of fit between the planimetric and 3D parameters of the sinkholes is relatively poor (Fig. 12). This indicates a limited dependence between the horizontal and vertical dimensions of sinkholes, in agreement with the wide range shown by the Length to Depth ratio (0–6). That is, sinkholes with small area can have significant depth and volume, and sinkholes with limited volume can reach relatively large areas. This is also reflected by the relatively poor fit shown between the two 3D parameters (volume and maximum depth; R2=0.66). Even so, the fitting equations presented in Fig. 12 provide preliminary empirical support for characterizing and predicting scaling relationships for sinkholes in the Loess Plateau.
5.3 Frequency-size relationships of sinkholes in different soils and environments
The cumulative frequency-size graph in Fig. 11 shows that the length distribution of the compound sinkholes (red) is clearly shifted towards larger dimensions with respect to the single sinkholes (green). The average length of the compound and single sinkholes is 7.37 and 3.65 m, respectively. This expected deviation in the size distribution can be explained by the different sets of processes that operate in the development of the two sinkhole populations. The size of the single sinkholes is related to pipe-roof collapse and the subsequent expansion of the scarped edge of the depressions by erosional processes, mainly mass wasting and gullying. The size tends to increase with the time elapsed since the initial collapse, as the sinkhole edge recedes. Compound sinkholes result from the coalescence of adjoining and expanding sinkholes and/or the occurrence of a new sinkhole intersecting a pre-existing one, leading to the sudden enlargement of the depressions. The contribution of these processes (coalescence, intersection) is influenced by the density and clustering degree of the sinkholes, in as much as the likelihood of sinkhole aggregation is greater in tightly clustered sinkhole populations (Bernatek-Jakiel et al., 2019; De Waele and Gutiérrez, 2022; Sevil and Gutiérrez, 2023). Moreover, sinkhole merging entails a decrease in sinkhole density by number and a substantial increase in sinkhole size.
Figure 11 shows the cumulative frequency-length distribution of the single and compound sinkholes mapped in the Sunjiacha basin, together with the single sinkholes inventoried in two catchments with contrasting geological and climatic conditions (Bernatek-Jakiel et al., 2019): Valpalmas in the Ebro Cenozoic Basin (NE Spain), and Tyskowa in the Bieszczady Mountains of the Outer Eastern Carpathians (Poland). The pipe collapses in Valpalmas occur in Holocene valley-fill alluvium consisting of indurated, Na-rich cohesive clayey silt that reaches around 8 m in thickness. Here, the climate is semiarid (mean precipitation 500 mm) and sinkholes tend to occur associated with the edge of erosional scarps, showing a tightly clustered distribution. The pipe collapses in the Tyskowa catchment can be considered as a representative sample of those inventoried in several catchments of the Bieszczady Mts., characterized by a humid climate (mean precipitation 900 m; Bernatek-Jakiel et al., 2019). Here, sinkholes occur on relatively thin slope deposits with some eolian component consisting of poorly indurated clayey silt. The single sinkholes in Valpalmas (orange) show a similar size to the single sinkholes in Sunjiacha for the central cumulative frequencies (i.e., Fc 0.5–0.6). Nonetheless, single sinkholes in Valpalmas display a much narrower length range (1.1 vs. 2.3 orders of magnitude, resulting in steeper curve) and significantly smaller maximum dimensions (6.5 vs. 35.1 m). The more restricted size range for the smaller sinkholes can be attributed to the fact that the inventory in Valpalmas was restricted to sinkholes with lengths ≥0.5 m. The differences between Sunjiacha and Valpalmas can be ascribed to factors such as the greater morpho-sedimentary diversity of Sunjiacha, where sinkholes occur in a broad range of deposits and geomorphic settings (e.g., loess, colluvium, alluvium), and the wide depth range of sinkhole-forming pipes, substantiated by the measured maximum depth of the sinkholes, ranging from 29.6 to 0.42 m (Figs. 9e, 10b and 14c). Single sinkholes in the humid Bieszczady Mts. of Poland are much smaller, mainly because they occur on thinner and mechanically weaker deposits. The weaker the soils, the smaller the largest span that can reach cavities before collapse. Induration of the deposits by secondary carbonate (i.e., cementation) in this humid environment is less significant than in the semiarid environments of Valpalmas and the Loess Plateau.
5.4 Limitations and prospects
Extensive field surveys reveal that loess sinkholes possess highly complex three-dimensional morphologies, rather than being simple cylindrical or conical features (Figs. 6i, 7c, 14b and 16; Hu et al., 2024). This is illustrated by the high-resolution scanning of 142 sinkholes with a handheld laser device carried out in 2021 in a small basin, named Laozigou, east of our study area (Hu et al., 2024; Jiang et al., 2024). The data can be accessed at https://doi.org/10.1016/j.geomorph.2024.109404. As shown in Table 3, volume estimates based on airborne LiDAR point clouds and simplified volume estimation methods can lead to highly inaccurate approximations. The aggregate volume, and hence the inferred soil loss reported in our study area may therefore be overestimated. Several factors may contribute to the deviation between the actual volume and the volume calculated, leading to over- or under-estimations: (1) volumes are calculated using maximum depth and assuming a cylindrical geometry, but sinkholes may be conical (overestimation) or the actual depth may be deeper (underestimation); (2) sinkholes may be connected to conduits that cannot be imaged in airborne surveys, resulting in underestimations.
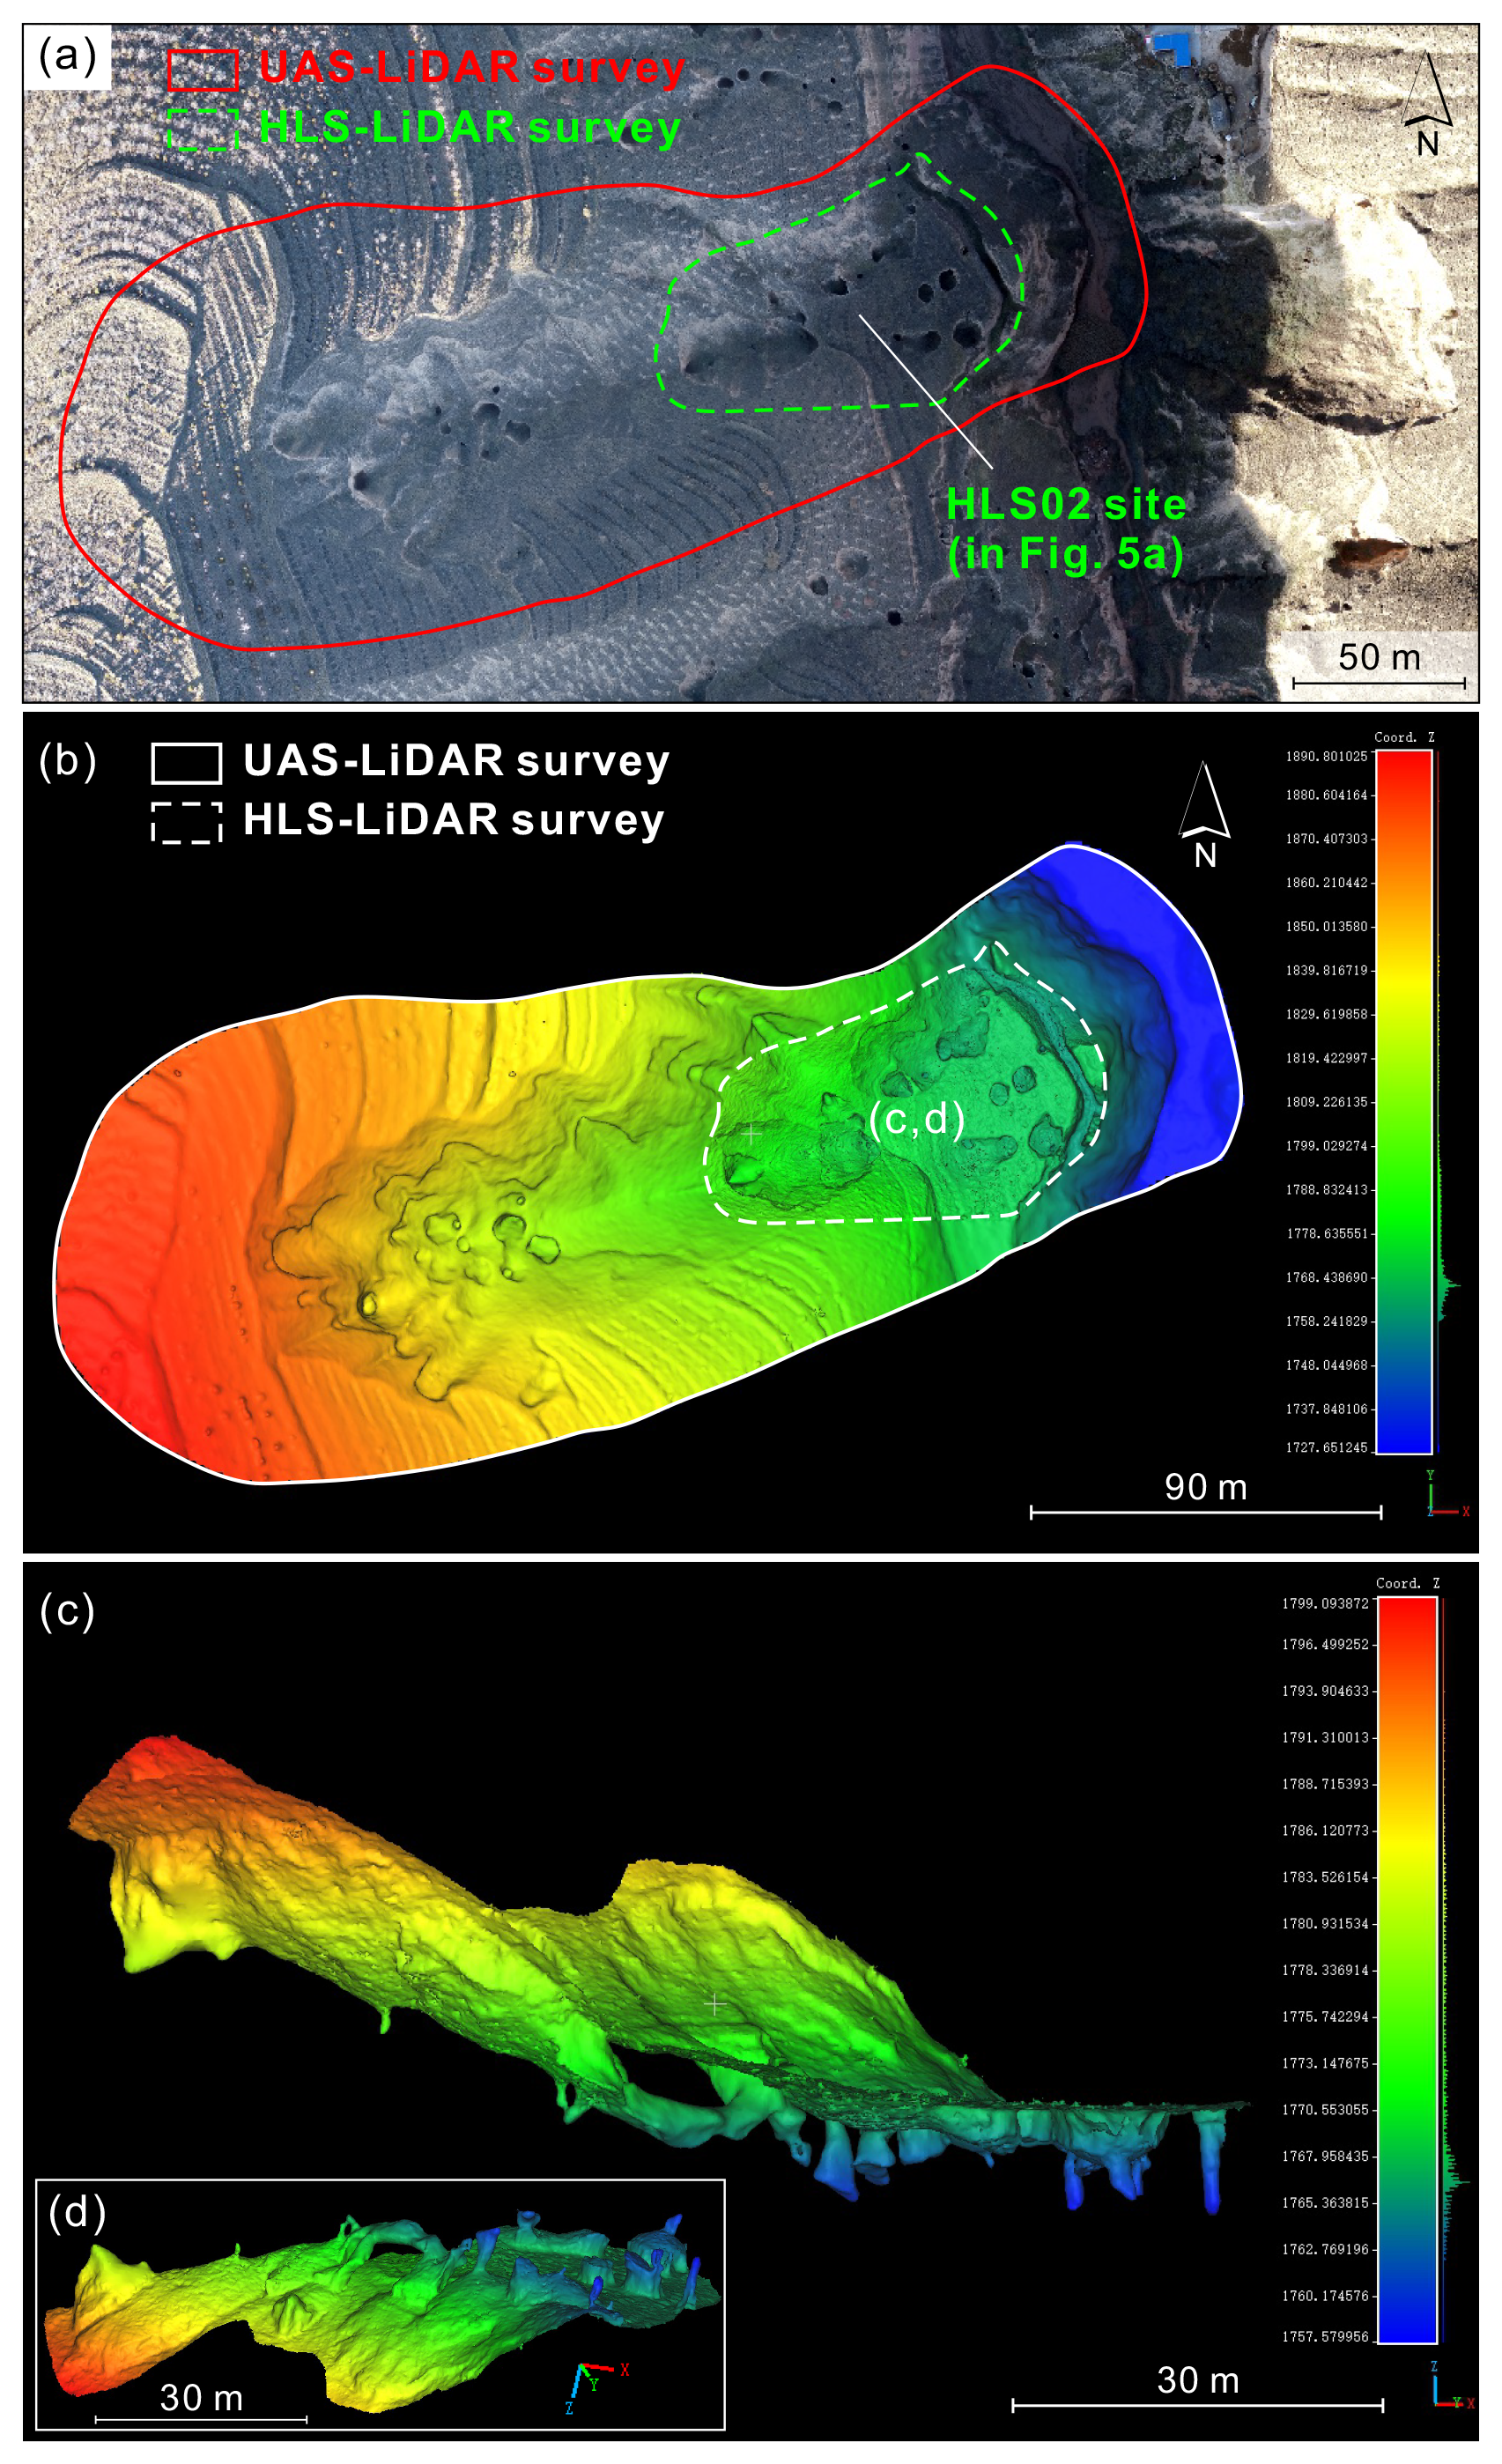
Figure 16Integrated sinkhole investigation combining UAS-LiDAR and HLS-LiDAR: (a) Coverage areas of the two LiDAR surveys; (b) The mesh model generated from the fused point cloud data; (c) The side view of mesh model from the HLS-LiDAR survey area; (d) The bottom view of (c).
Encouragingly, the comprehensive point clouds acquired by the handheld scanner enable us to develop far more precise cloud-slicing and volumetric-integration algorithms for exact volume computation (Hu et al., 2024). This will enable us to develop a more reliable fitting formula relating sinkhole area and volume, which could be used for refining the results obtained from the UAS surveys. We conducted a survey of a gully by jointly employing UAS-LiDAR and HLS-LiDAR technologies and found that the integrated point cloud data can effectively delineate the internal structure and connectivity of sinkholes, as they overcome the limitations of a single LiDAR technology. Meanwhile, machine-learning approaches for the automatic detection and delineation of sinkholes are rapidly emerging and showing promising results (Zhu et al., 2016, 2020; Jiang et al., 2024; Li et al., 2024; Coşkuner et al., 2025; Creati et al., 2025). Indeed, we have already implemented an end-to-end workflow that couples airborne LiDAR point clouds with deep-learning models to achieve automatic sinkhole identification, instance segmentation, feature extraction, cataloguing, and mapping (Li et al., 2025).
The dataset supporting this study is openly available on Zenodo at https://doi.org/10.5281/zenodo.14000267 (Hu et al., 2025).
High-resolution models derived from photographs and LiDAR data captured with a UAS have allowed the production of a comprehensive cartographic inventory of loess sinkholes in a catchment (2.4 km2) of the Chinese Loess Plateau with a high density of sinkholes (ca. 500 sinkholes km−2). The spatial data, including a bare-surface digital elevation model and a 3D terrain point cloud, proved suitable for accurately mapping the sinkholes, differentiating between single (1194) and compound depressions (288), and extracting precise planimetric morphometric parameters. This is the first morphometric dataset available for the piping-related sinkholes of the CLP. Three dimensional parameters such as depth and volume can be also extracted or estimated, although with much higher uncertainty. Rough cumulative volume estimates yield sinkhole-related soil erosion values of around 140 t ha−1. The work illustrates that the limitations of the airborne data for measuring 3D morphometric parameters can be overcome by using SLAM-based handheld scanners. The 3D point clouds obtained with these devices at specific sinkholes, although labor intensive, allow precise measurement of the volume of the scanned voids. Nonetheless, hidden pipes, which may account for a significant volume of subsurface erosion, remain elusive for these direct surveying techniques.
The sinkholes in the analyzed catchment tend to be elongated (52 % with elongation ratio between 1.21 and 1.65) and preferentially oriented following the dominant trends of the drainage network. They show a broad range of dimensions, ranging from 0.19 to 35.11 m in length (2.3 orders of magnitude). As expected, compound sinkholes tend to be significantly larger than single sinkholes (7.37 vs. 3.65 m in average length, respectively), although the degree of coalescence is rather moderate (single 97.3 %; compound 2.7 %). A remarkable feature of the investigated sinkholes is their large vertical dimension. Around 70 % of the sinkholes have a greater depth than length. The average and maximum depths are 6.5 and 29.6 m, respectively, indicating the development of deep-seated pipes in thick loess cover or even within the jointed and friable sandstone bedrock. Comparison with other morphometric datasets from semiarid Spain (fine grained alluvium) and humid Poland (thin loess-rich colluvium) reinforces the large size of the studied sinkholes in the Chinese loess, developed on much thicker loess and generally rooted in deeper pipes.
The spatial relationships between the sinkholes and other geomorphic features and various topographic and hydrologic indices reveal that their development is mainly controlled by the amount of water available for subsurface flow (i.e., runoff contributing area) and topographic gradient. Sinkholes occur preferentially along the steep margins of deeply incised streams and gully networks. Recent landslides, underlain by weakened and more porous disturbed loess deposits are also identified as areas especially prone to piping and sinkhole occurrence.
SH, FG, FZ, and SL designed the study and wrote the manuscript. SH, FG, and SL compiled and analyzed the dataset. SH, XW, JS, and SW performed field investigation. NW, XL, and FG supervised and reviewed the manuscript. All authors contributed to the writing and editing of this paper.
The contact author has declared that none of the authors has any competing interests.
Publisher's note: Copernicus Publications remains neutral with regard to jurisdictional claims made in the text, published maps, institutional affiliations, or any other geographical representation in this paper. The authors bear the ultimate responsibility for providing appropriate place names. Views expressed in the text are those of the authors and do not necessarily reflect the views of the publisher.
The authors are grateful to Anita Bernatek-Jakiel for providing published morphometric data on piping sinkholes in the Valpalmas (Spain) and the Tyskowa (Poland) catchments. FG belongs to the IUCA and the Geoenvironmental Processes and Global Change (E02_23R) research group financed by the Aragón Government and the European Social Fund (ESF-FSE). We would also like to thank Yixian Chen for his participation in the fieldwork.
This research has been supported by the National Natural Science Foundation of China (grant nos. 42371009, 42001006, and 42230712), the National Key Research and Development Program of China (grant nos. 2022YFC3003401 and 2023YFC3008401), the Undergraduate Innovative Training Program of Northwest University (grant no. 202510697130), and the DIAPERNO Project of the Spanish Government (Ministerio de Ciencia e Innovación) (grant no. PID2021-123189NB-I00).
This paper was edited by Giulio G. R. Iovine and reviewed by Christian Sommer and one anonymous referee.
Basso, A., Bruno, E., Parise, M., and Pepe, M.: Morphometric analysis of sinkholes in a karst coastal area of southern Apulia (Italy), Environ. Earth Sci., 70, 2545–2559, 2013.
Bernatek, A.: The Influence of Piping on Mid-Mountain Relief: A Case Study from the Polish Bieszczady Mts. (Eastern Carpathians), Carpath. J. Earth Env., 10, 107–120, 2015.
Bernatek-Jakiel, A. and Kondracka, M.: Combining geomorphological mapping and near surface geophysics (GPR and ERT) to study piping systems, Geomorphology, 274, 193–209, 2016.
Bernatek-Jakiel, A. and Poesen, J.: Subsurface erosion by soil piping: significance and research needs, Earth-Sci. Rev., 185, 1107–1128, https://doi.org/10.1016/j.earscirev.2018.08.006, 2018.
Bernatek-Jakiel, A., Jakiel, M., and Krzemień, K.: Piping dynamics in mid-altitude mountains under a temperate climate: Bieszczady Mountains, eastern Carpathians, Earth Surf. Proc. Land., 42, 1419–1433, https://doi.org/10.1002/esp.4160, 2017.
Bernatek-Jakiel, A., Gutiérrez, F., Nadal-Romero, E., and Jakiel, M.: Exploring the frequency-size relationships of pipe collapses in different morphoclimatic regions, Geomorphology, 345, 106845, https://doi.org/10.1016/j.geomorph.2019.106845, 2019.
Borah, U. K., Gond, A., Rajan, P. P., Sivan, R., and Vivekanandan, N.: Joint geomorphological and geophysical (electrical resistivity) investigation for the configuration of soil pipe, Contrib. Geophys. Geod., 52, 239–255, https://doi.org/10.31577/congeo.2022.52.2.4, 2022.
Bruno, E., Calcaterra, D., and Parise, M.: Development and morphometry of sinkholes in coastal plains of Apulia, southern Italy. Preliminary sinkhole susceptibility assessment, Eng. Geol., 99, 198–209, https://doi.org/10.1016/j.enggeo.2007.11.017, 2008.
Cole, J. P.: Study of major and minor civil divisions in political geography, The 20th International Geographical Congress, London, 1964.
Coskuner, B., İnce, İ., and Barstuğan, M.: Sinkhole detection via deep learning using DEM images, Nat. Hazards, 121, 8347–8366, https://doi.org/10.1007/s11069-025-07127-0, 2025.
Creati, N., Paganini, P., Sterzai, P., and Pavan, A.: Mapping of karst sinkholes from LIDAR data using machine-learning methods in the Trieste area, J. Spat. Sci., 70, 365–380, https://doi.org/10.1080/14498596.2025.2469176, 2025.
Day, M.: Doline morphology and development in Barbados, Ann. Assoc. Am. Geogr., 73, 206–219, 1983.
De Carvalho Júnio, O. A., Guimarães, R. F., Montgomery, D. R., Gillespie, A. R., Gomes, R. A. T., De Souza Martins, É. D., and Silva, N. C.: Karst Depression Detection Using ASTER, ALOS/PRISM and SRTM-Derived Digital Elevation Models in the Bambu Group, Brazil, Remote Sens.-Basel, 6, 330–351, https://doi.org/10.3390/rs6010330, 2014.
De Waele, J. and Gutiérrez, F.: Karst hydrogeology, geomorphology and caves, John Wiley & Sons, 888 pp., ISBN 9781119605348, 2022.
Donnelly, L. J.: Subsidence and associated ground movements on the Pennines, northern England, Q. J. Eng. Geol. Hydroge., 41, 315–332, https://doi.org/10.1144/1470-9236/07-216, 2008.
Farrant, A. R. and Cooper, A. H.: Karst geohazards in the UK: the use of digital data for hazard management, Q. J. Eng. Geol. Hydroge., 41, 339–356, https://doi.org/10.1144/1470-9236/07-201, 2008.
Gallant, J. C. and Hutchinson, M. F.: A differential equation for specific catchment area, Water Resour. Res., 47, W05535, https://doi.org/10.1029/2009wr008540, 2011.
Gao, Y., Alexander, E. C. and Tipping, R.: The development of a karst feature database for southeastern Minnesota, J. Cave Karst Stud., 64, 51–57, 2002.
Gao, Y., Alexander, E. J. R., and Barnes, R. J.: Karst database implementation in Minnesota: analysis of sinkhole distribution, Environ. Geol., 47, 1083–1098, https://doi.org/10.1007/s00254-005-1241-2, 2005.
Geng, H. P., Liu, R., Zheng, W. S., Zhang, Y. B., Xie, R., Guo, Y., and Pan, B. T.: Interaction Between Animal Burrowing and Loess Cave Formation in the Chinese Loess Plateau, Front. Earth Sci., 9, 806921, https://doi.org/10.3389/feart.2021.806921, 2021.
Geng, H. P., Xu, W. Y., Zheng, W. S., Gao, X. L., and Pan, B. T.: A hybrid mechanism for the initiation and expansion of loess caves across the Chinese Loess Plateau, Land Degrad. Dev., 34, 3329–3339, https://doi.org/10.1002/ldr.4686, 2023.
Gibbs, H. S.: Tunnel-gully erosion on the Wither Hills, Marlborough, New Zealand Journal of Science and Technology, 27, 135–146, 1945.
Gökkaya, E., Gutiérrez, F., Ferk, M., and Görüm, T.: Sinkhole development in the Sivas gypsum karst, Turkey, Geomorphology, 386, 107746, https://doi.org/10.1016/j.geomorph.2021.107746, 2021.
Gutiérrez, F., Desir, G., and Gutiérrez, M.: Causes of the catastrophic failure of an earth dam built on gypsiferous alluvium and dispersive clays (Altorricon, Huesca Province, NE Spain), Environ. Geol., 43, 842–851, https://doi.org/10.1007/s00254-002-0700-2, 2003.
Gutiérrez, F., Parise, M., De Waele, J., and Jourde, H.: A review on natural and human-induced geohazards and impacts in karst, Earth-Sci. Rev., 138, 61–88, https://doi.org/10.1016/j.earscirev.2014.08.002, 2014.
Hofierka, J., Gallay, M., Bandura, P., and Šašak, J.: Identification of karst sinkholes in a forested karst landscape using airborne laser scanning data and water flow analysis, Geomorphology, 308, 265–277, https://doi.org/10.1016/j.geomorph.2018.02.004, 2018.
Hu, S., Qiu, H. J., Wang, N. L., Cui, Y. F., Wang, J. D., Wang, X. G., Ma, S. Y., Yang, D. D., and Cao, M. M.: The influence of loess cave development upon landslides and geomorphologic evolution: A case study from the northwest Loess Plateau, China, Geomorphology, 359, 107167, https://doi.org/10.1016/j.geomorph.2020.107167, 2020.
Hu, S., Qiu, H. J., Wang, N. L., Wang, X. G., Ma, S. Y., Yang, D. D., Wei, N., Liu, Z. J., Shen, Y. D., Cao, M. M., and Song, Z. P.: Movement process, geomorphological changes, and influencing factors of a reactivated loess landslide on the right bank of the middle of the Yellow River, China, Landslides, 19, 1265–1295, https://doi.org/10.1007/s10346-022-01856-0, 2022.
Hu, S., Jiang, Z. D., Wang, N. L., Zhang, F. Y., Chen, Y. X., Wu, S. B., Wang, L., and Li, S. S.: In Situ Dataset of Loess Sinkholes using UAS and LiDAR Technology in Huining County, China (2024), Digital Journal of Global Change Data Repository, https://doi.org/10.3974/geodb.2024.05.05.V1, 2024.
Hu, S., Gutiérrez, F., Zhang, F., Li, S., Wang, N., Li, X., and Wang, X.: A morphological dataset of loess sinkholes from a small basin in the Chinese Loess Plateau (1.0), Zenodo [data set], https://doi.org/10.5281/zenodo.14000267, 2025.
Jiang, Z. D., Hu, S., Deng, H., Wang, N. L., Zhang, F. Y., Wang, L., Wu, S. B., Wang, X. A., Cao, Z. W., Chen, Y. X., and Li, S. S.: Detection and automatic identification of loess sinkholes from the perspective of LiDAR point clouds and deep learning algorithm, Geomorphology, 465, 109404, https://doi.org/10.1016/j.geomorph.2024.109404, 2024.
Jones, E. and Beck, D.: The use of 3D laser scanning for deformation monitoring in underground mines, Proceedings of the 13th AusIMM Underground Operators Conference, 66, 267–270, https://www.ausimm.com/publications/conference-proceedings/13th-ausimm-underground-operators-conference-2017/the-use-of-3d-laser-scanning-for-deformation-monitoring-in -underground-mines/ (last access: 19 March 2026), 2017.
Kariminejad, N., Sepehr, A., Poesen, J., and Hassanli, A.: Combining UAV remote sensing and pedological analyses to better understand soil piping erosion, Geoderma, 429, 116267, https://doi.org/10.1016/j.geoderma.2022.116267, 2023.
Kim, C. E. and Anderson, T. A.: Digital disks and a digital compactness measure, Proceedings of the sixteenth annual ACM symposium on Theory of computing, ACM Press, New York, 117–124, https://doi.org/10.1145/800057.808673, 1984.
Kobal, M., Bertoncelj, I., Pirotti, F., Dakskobler, I., and Kutnar, L.: Using Lidar Data to Analyse Sinkhole Characteristics Relevant for Understory Vegetation under Forest Cover-Case Study of a High Karst Area in the Dinaric Mountains, Plos One, 10, e0122070, https://doi.org/10.1371/journal.pone.0122070, 2015.
Konsolaki, A., Vassilakis, E., Gouliotis, L., Kontostavlos, G., and Giannopoulos, V.: High Resolution Digital 3d Modelling of Subsurface Morphological Structures of Koutouki Cave, Greece, Acta Carsologica, 49, 163–177, https://doi.org/10.3986/ac.v49i2-3.7708, 2020.
Lee, E. J., Shin, S. Y., Ko, B. C., and Chang, C.: Early sinkhole detection using a drone-based thermal camera and image processing, Infrared Phys. Techn., 78, 223–232, https://doi.org/10.1016/j.infrared.2016.08.009, 2016.
Li, S., Sun, J., Hu, S., and Wang, L.: LSPNet for Automatic Recognition and Cataloguing of Loess Sinkholes from Point Clouds (V1.0), Zenodo [data set], https://doi.org/10.5281/zenodo.17667244, 2025.
Li, S. S., Hu, S., Wang, L., Zhang, F. Y., Wang, N. L., Wu, S. B., Wang, X. A., and Jiang, Z. D.: Quantifying the Geomorphological Susceptibility of the Piping Erosion in Loess Using LiDAR-Derived DEM and Machine Learning Methods, Remote Sens.-Basel, 16, 4203, https://doi.org/10.3390/rs16224203, 2024.
Li, W. W., Goodchild, M. F., and Church, R.: An efficient measure of compactness for two-dimensional shapes and its application in regionalization problems, Int. J. Geogr. Inf. Sci., 27, 1227–1250, https://doi.org/10.1080/13658816.2012.752093, 2013.
Li, X., Song, Y., and Ye, W.: Engineering geological research on tunnel-erosion in loess, Tongji University Press, Shanghai, ISBN 9787560844343, 2010 (in Chinese).
Li, X. A., Wang, L., Hong, B., Li, L. C., Liu, J., and Lei, H. N.: Erosion characteristics of loess tunnels on the Loess Plateau: A field investigation and experimental study, Earth Surf. Proc. Land., 45, 1945–1958, https://doi.org/10.1002/esp.4857, 2020.
Liu, H. X. and Wang, L.: Mapping detention basins and deriving their spatial attributes from airborne LiDAR data for hydrological applications, Hydrol. Process., 22, 2358–2369, https://doi.org/10.1002/hyp.6834, 2008.
Liu, T. S.: Loess Deposits in the Middle Reaches of the Yellow River, Science Press, Beijing, 1–234, ISBN 13031196, 1964 (in Chinese).
Liu, T. S.: Loess Deposits in China, Science Press, Beijing, 1–244, ISBN 9787030567390, 1965 (in Chinese).
Llena, M., Carreras, S., Bernatek-Jakiel, A., Ollero, A., and Nadal-Romero, E.: Agricultural land abandonment linked to pipe collapse and gully development: Reconstruction from archival SfM and LiDAR datasets, Geoderma, 449, 116995, https://doi.org/10.1016/j.geoderma.2024.116995, 2024.
Mokroš, M., Mikita, T., Singh, A., Tomaštík, J., Chudá, J., Wężyk, P., Kuželka, K., Surový, P., Klimánek, M., Zieba-Kulawik, K., Bobrowski, R., and Liang, X. L.: Novel low-cost mobile mapping systems for forest inventories as terrestrial laser scanning alternatives, Int. J. Appl. Earth Obs., 104, 102512, https://doi.org/10.1016/j.jag.2021.102512, 2021.
Moore, I. D., Grayson, R., and Ladson, A.: Digital terrain modelling: a review of hydrological, geomorphological, and biological applications, Hydrol. Process., 5, 3–30, 1991.
Morgan, R. P. C.: Soil erosion and conservation, 3rd edn., Blackwell Publishing, United Kingdom, ISBN 978-1-405-14467-4, 2005.
Niu, Y. N.: Study on provenance of Quaternary loess in Longxi area: a case from Huining, Lanzhou University Thesis, https://kns.cnki.net/kcms2/article/abstract?v=mDcNmAOuO1Pjp 9ey5nvgjsMQZFUnaQnnNy0-lWqmaTTUFr0UvurDsVTHZK-u-iY5EnUwFAPCt1U9wTAA5_aYAFoHP1dR_gwxkPDmghu GBeikPI_sG_MwHt9cPDZr13WAm0HpFK-uEwerlvN0Mt0JrauY3P6od-BmAXY2oVsXObBp7f68h2v9rB SnqTO9048R&uniplatform=NZKPT&language=CHS (last access: 19 March 2026), 2023 (in Chinese).
Öztürk, M. Z., Şener, M. F., Şener, M., and Şimşek, M.: Structural controls on distribution of dolines on Mount Anamas (Taurus Mountains, Turkey), Geomorphology, 317, 107–116, https://doi.org/10.1016/j.geomorph.2018.05.023, 2018.
Panno, S., Weibel, C. P., and Li, W.: Karst regions of Illinois, Open file series 1997-02, http://hdl.handle.net/10111/UIUCOCA:karstregionsofil19972pann (last access: 18 March 2026), 1997.
Panno, S. V. and Luman, D. E.: Mapping palimpsest karst features on the Illinois sinkhole plain using historical aerial photography, Carbonate Evaporite, 28, 201–214, https://doi.org/10.1007/s13146-012-0107-4, 2013.
Peng, J. B., Sun, P., Igwe, O., and Li, X.: Loess caves, a special kind of geo-hazard on loess plateau, northwestern China, Eng. Geol., 236, 79–88, https://doi.org/10.1016/j.enggeo.2017.08.012, 2018.
Peng, S. S.: Pronounced changes in atmospheric circulation and dust source areas during the mid-Pleistocene implicated by the Huining loess-soil sequence from the northeastern margin of the Tibetan Plateau, PhD thesis, China University of Geosciences (Beijing), https://kns.cnki.net/kcms2/article/abstract?v=_JlElU3EDUoUxL 9OxR02LElq9UEjk1MwopcUC91BNJR7dJx-jDvYVWIzmjINQ6l-XIzdcOEYZNTurjrmQgyur06J2xnMczTe SXkzolVyJtY8xXles0Ldklaf1Jdr0dPiSiH5_q0FO7PiHzT-GR5-zCbdBmeQIkmc-kM6a6GGAVojRQJ73lc_AQ==&uniplatform =NZKPT (last access: 19 March 2026), 2014 (in Chinese).
Pierson, T. C.: Soil pipes and slope stability, Q. J. Eng. Geol. Hydroge., 16, 1–11, 1983.
Poesen, J.: Soil erosion in the Anthropocene: Research needs, Earth Surf. Proc. Land., 43, 64–84, https://doi.org/10.1002/esp.4250, 2018.
Rajabi, A.: Sinkhole Detection and Quantification Using LiDAR Data, Electronic Theses and Dissertations, 5776, https://stars.library.ucf.edu/etd/5776 (last access: 18 March 2026), 2018.
Richards, K. S. and Reddy, K. R.: Critical appraisal of piping phenomena in earth dams, B. Eng. Geol. Environ., 66, 381–402, https://doi.org/10.1007/s10064-007-0095-0, 2007.
Sevil, J. and Gutiérrez, F.: Morphometry and evolution of sinkholes on the western shore of the Dead Sea. Implications for susceptibility assessment, Geomorphology, 434, 108732, https://doi.org/10.1016/j.geomorph.2023.108732, 2023.
Sidle, R. C. and Bogaard, T. A.: Dynamic earth system and ecological controls of rainfall-initiated landslides, Earth-Sci. Rev., 159, 275–291, https://doi.org/10.1016/j.earscirev.2016.05.013, 2016.
Uchida, T., Kosugi, K., and Mizuyama, T.: Effects of pipeflow on hydrological process and its relation to landslide: a review of pipeflow studies in forested headwater catchments, Hydrol. Process., 15, 2151–2174, https://doi.org/10.1002/hyp.281, 2001.
Vajedian, S. and Motagh, M.: Extracting sinkhole features from time-series of TerraSAR-X/TanDEM-X data, ISPRS J. Photogramm., 150, 274–284, https://doi.org/10.1016/j.isprsjprs.2019.02.016, 2019.
Vennari, C. and Parise, M.: A Chronological Database about Natural and Anthropogenic Sinkholes in Italy, Geosciences, 12, 200, https://doi.org/10.3390/geosciences12050200, 2022.
Verachtert, E., Van den Eeckhaut, M., Poesen, J., and Deckers, J.: Factors controlling the spatial distribution of soil piping erosion on loess-derived soils: A case study from central Belgium, Geomorphology, 118, 339–348, https://doi.org/10.1016/j.geomorph.2010.02.001, 2010.
Wang, X. G., Hu, S., Lian, B. Q., Wang, J. D., Zhan, H. B., Wang, D. Z., Liu, K., Luo, L., and Gu, C. Y.: Formation mechanism of a disaster chain in Loess Plateau: A case study of the Pucheng County disaster chain on August 10, 2023, in Shaanxi Province, China, Eng. Geol., 331, 107463, https://doi.org/10.1016/j.enggeo.2024.107463, 2024.
Wu, Q. S., Deng, C. B., and Chen, Z. Q.: Automated delineation of karst sinkholes from LiDAR-derived digital elevation models, Geomorphology, 266, 1–10, https://doi.org/10.1016/j.geomorph.2016.05.006, 2016.
Yang, S. and Ding, Z.: Spatial changes in grain size of loess deposits in the Chinese Loess Plateau and implications for palaeoenvironment, Quaternary Sciences, 37, 934–944, 2017 (in Chinese).
Yuan, Z. L., Ban, X. J., Han, F. Y., Zhang, X. Q., Yin, S. H., and Wang, Y. M.: Integrated three-dimensional visualization and soft-sensing system for underground paste backfilling, Tunn. Undergr. Sp. Tech., 127, 104578, https://doi.org/10.1016/j.tust.2022.104578, 2022.
Zhang, F., Peng, J., Zhang, Y., Wang, Y., and Zhang, T.: Prediction of static liquefaction landslides in loess: Integrating triaxial shear parameters into the sliding-block model, Eng. Geol., 108549, https://doi.org/10.1016/j.enggeo.2026.108549, 2026.
Zhang, W. M., Qi, J. B., Wan, P., Wang, H. T., Xie, D. H., Wang, X. Y., and Yan, G. J.: An Easy-to-Use Airborne LiDAR Data Filtering Method Based on Cloth Simulation, Remote Sens.-Basel, 8, 501, https://doi.org/10.3390/rs8060501, 2016.
Zhu, J. F. and Pierskalla, W. P.: Applying a weighted random forests method to extract karst sinkholes from LiDAR data, J. Hydrol., 533, 343–352, https://doi.org/10.1016/j.jhydrol.2015.12.012, 2016.
Zhu, J. F., Nolte, A. M., Jacobs, N., and Ye, M.: Using machine learning to identify karst sinkholes from LiDAR-derived topographic depressions in the Bluegrass Region of Kentucky, J. Hydrol., 588, 125049, https://doi.org/10.1016/j.jhydrol.2020.125049, 2020.
Zumpano, V., Pisano, L., and Parise, M.: An integrated framework to identify and analyze karst sinkholes, Geomorphology, 332, 213–225, https://doi.org/10.1016/j.geomorph.2019.02.013, 2019.