the Creative Commons Attribution 4.0 License.
the Creative Commons Attribution 4.0 License.
 | 05 Mar 2026
The Potsdam Soil Moisture Observatory: high-coverage reference observations at kilometer scale
Peter M. Grosse
Elodie Marret
Lena Scheiffele
Katya Dimitrova Petrova
Till Francke
Daniel Altdorff
Maik Heistermann
Merlin Schiel
Carsten Neumann
Daniel Scheffler
Mehdi Saberioon
Matthias Kunz
Jonas Marach
Marcel Reginatto
Miroslav Zboril
Anna Balenzano
Daniel Rasche
Christine Stumpp
Benjamin Trost
Sascha E. Oswald
Cosmic-ray neutron sensing (CRNS) has gained popularity for estimating soil moisture due to its innovative capability to measure at an intermediate scale – a notable advantage over point-scale sensors, which are often sparsely installed and lead to inaccurate absolute values due to small-scale heterogeneity. CRNS serves as a crucial link between small and large scales and has been emerging as a reference measurement for validating remote sensing algorithms. However, the sparse availability of long-term datasets limits use of this possibility. Within the DFG-research unit Cosmic Sense and the European 21GRD08 SoMMet project, multiscale soil moisture monitoring was implemented to integrate CRNS with complementary in-situ observations. In this paper, we present harmonized soil moisture data from different sensor types, including a CRNS cluster, shallow soil moisture measurements, and soil moisture profile data, creating a ready-to-use dataset as a reference observation for remote sensing products, covering a highly-instrumented agricultural site in the northeast of Germany. The newly established Potsdam Soil Moisture Observatory (PoSMO) comprises 16 stationary CRNS sensors with point-scale soil moisture sensors installed at the same locations in different depths and data from intensive manual sampling campaigns (covering soil moisture, bulk density, organic matter, etc.). This dataset goes beyond other studies by covering a larger area of approx. 1 km2, while nevertheless achieving a high sensor density and mostly overlapping CRNS footprints allowing for nearly complete coverage. Complementary measurements of soil properties, vegetation, groundwater, meteorology, and remote sensing imagery provide the context required to interpret the observed soil moisture dynamics across spatial and temporal scales. The data are available at https://doi.org/10.23728/b2share.bxamy-4zh85 (Grosse et al., 2025) and provide a new reference dataset for remote sensing products, hydrological or land-surface models, and other applications related to soil water balance.
- Article
(9772 KB) - Full-text XML
- BibTeX
- EndNote


The dynamic storage of water in soil is an important component of the terrestrial water cycle, yet it exhibits pronounced spatial and temporal variability. It regulates water and energy exchange between land surface and atmosphere and plays a key role in ecohydrological processes, agricultural productivity, forest dynamics and groundwater recharge. Due to its critical influence on weather, climate, hydrology, and ecosystem functioning, soil moisture has been designated as one of the Essential Climate Variables (Bojinski et al., 2014). Reliable soil moisture observations are therefore needed not only for climate and ecological research, but also for applied purposes including water resources management, irrigation planning, and agricultural management, as well as flood and drought forecasting and weather prediction (Vereecken et al., 2008; Brocca et al., 2017; Moragoda et al., 2022; Levi and Bestelmeyer, 2018; Molenaar et al., 2024; Srivastava, 2017; Hövel et al., 2025; Pendergrass et al., 2020; Abioye et al., 2020; Lachenmeier et al., 2024; Szilagyi and Franz, 2020). Major challenges include the need to observe soil moisture across multiple spatial scales, the limited ability to directly capture root-zone and deeper soil water storage, and the spatial and depth mismatches between satellite observations and in-situ measurements (Oswald et al., 2024). Accurate measurements for spatial scales beyond the point scale remain challenging, as small-scale variation due to heterogeneity in precipitation, soil properties, vegetation, and other influences question the applicability of point-scale sensors to achieve good spatial and temporal coverage beyond the spot measurement (Peng et al., 2021). Point-scale observations range from campaign-based manual soil sampling to long-term observations using dielectric permittivity-based methods (time-domain reflectometry, frequency-domain reflectometry, capacitance-based sensors) or suction-based methods, with soil moisture usually associated with soil volumetric water content (VWC). These techniques provide observations with high temporal resolution but due to their small support volume (typically only a few cubic centimeters) at selected locations only (Robinson et al., 2008). Thus, due to the aforementioned heterogeneity of soil moisture, their representativeness remains limited. When deployed as networks, these sensors enable representative observations of soil moisture at the field scale (Bogena et al., 2022; Rosenbaum et al., 2012). However, installing and operating sensor networks is resource-intensive and may interfere with agricultural management practices, especially tillage, and thus are limited in areas where soil-moisture observations could be particularly informative.
Over the past decades, satellite-based remote sensing has significantly advanced the assessment of soil moisture from space. The most notable progress has been achieved using microwave sensors, which offer the distinct advantage of being operable under all weather conditions and during both day and night, however with the temporal intervals determined by the satellite's observation schedule. Global-scale soil moisture measurements with spatial resolutions of approximately 25×25 km2 or coarser and a temporal frequency of 2–3 d, are currently available e.g. through missions such as the European Space Agency's Soil Moisture and Ocean Salinity (SMOS) mission (Kerr et al., 2001) or NASA's Soil Moisture Active Passive (SMAP) mission (Entekhabi et al., 2010). Furthermore, the long-term Copernicus program, via the Sentinel-1 (S-1) radar satellites, is fostering the development of operational soil moisture monitoring at higher spatial resolutions, down to 1 km (Bauer-Marschallinger et al., 2019). The quality assessment of satellite-derived soil moisture products heavily depends on ground-based measurements (Dorigo et al., 2021). A persistent challenge in this context is the mismatch not only in spatial scale between the relatively coarse satellite footprints and point-based in-situ observations, but also in depth, as satellite sensors primarily capture near-surface soil moisture while ground measurements often represent deeper layers (Gruber et al., 2020). This mismatch complicates the accurate validation and interpretation of remote-sensing products.
Introduced in 2008 (Zreda et al., 2008), Cosmic-Ray Neutron Sensing (CRNS) technology has proven to be a valuable method for intermediate-scale soil moisture measurements, applicable in different land-use and vegetation settings, including forest (Rivera Villarreyes et al., 2011; Baatz et al., 2015). The non-invasive detector retrieves soil moisture time series by detecting the intensity of epithermal neutrons present above ground. This epithermal neutron count rate is inversely correlated to soil moisture, or more precisely, the hydrogen content within its support volume, termed “sensor footprint” in this context, extending vertically about 15 to 60 cm and horizontally about 150 to 200 m radius (Köhli et al., 2015; Schrön et al., 2017). Neutron counts are typically accumulated over several hours, yielding neutron count rates, that are corrected for influencing factors such as air pressure, and then converted to soil moisture using a custom calibration function (Desilets et al., 2010; Zreda et al., 2012). Significant advancements have been made in the past decade in signal correction (e.g. Baatz et al., 2015; Schrön et al., 2018; McJannet and Desilets, 2023), interpretation (e.g. Köhli et al., 2021; Schrön et al., 2023; Rasche et al., 2021), sensor calibration/uncertainty reduction (e.g. Schrön et al., 2017), and data processing (e.g. Power et al., 2021, 2025). As a result, CRNS technology is increasingly tested for diverse applications, besides soil moisture measurements it could alternatively also give an estimate of biomass or interception (Baroni and Oswald, 2015; Jakobi et al., 2018; Brogi et al., 2025) or is used for irrigation assessment (Brogi et al., 2022), and observations of snow water equivalent (Schattan et al., 2017; Bogena et al., 2020). Overall, the major advantage of CRNS is its ability to provide a time-resolved, large-scale, and integrative measurement of the so-called root-zone soil moisture (RZSM), representing soil water storage in the upper decimeters of the soil profile. This zone typically contains the highest root densities for many vegetation types and thus constitutes a key component of soil water storage and the critical zone. Consequently, CRNS captures a substantially larger fraction plant-available soil water than the so-called surface soil moisture (SSM) retrieved commonly by satellite remote sensing. Nevertheless, it has remained underutilized in its first decade, though for some years now there are studies actually employing CRNS data in hydrological modeling, deriving water fluxes or snowmelt using the CRNS data, beyond merely comparing their results to it (see e.g. Shuttleworth et al., 2013; Barbosa et al., 2021; Patil et al., 2021; Scheiffele et al., 2025; Arnault et al., 2025; Denager et al., 2020; Foolad et al., 2017; Strebel et al., 2024; Fatima et al., 2024, 2025; Schattan et al., 2020; Krebs et al., 2025). This can largely be attributed to the initial sparseness of sufficiently-long records, the required expertise in their conversion to soil moisture and technical questions of directly using CRNS-derived root-zone soil moisture in modeling.
The non-invasive and low-maintenance nature of CRNS technology, together with its ability to provide long-term continuous observations, makes it a highly suitable tool for remote sensing assessments (Babaeian et al., 2018; Mengen et al., 2023; Beale et al., 2021). Although various CRNS-datasets have been published (e.g. Bogena et al., 2022; Cooper et al., 2021; Dorigo et al., 2021), they are mostly composed of solitary, i.e. spatially detached, stations. While the footprint of an individual CRNS already marks substantial progress toward matching the spatial resolution of remote sensing products (Meyer et al., 2022), they still fall short of the pixel size used by many applications. Combining multiple CRNS sensors in close vicinity helps addressing these spatial limitations. By establishing dense CRNS station networks, so called CRNS clusters, recent studies have begun to fill the gap of comprehensive spatial datasets: overlapping or adjacent CRNS footprints provide a robust means of capturing the spatial and temporal variation of soil moisture in the covered area. To date, three such data sets have been published. At the pre-alpine agro-sylvo-pastoral headwater catchment site in Fendt, 24 CRNS sensors were deployed across 1 km2 for a two-month period (Fersch et al., 2020). In 2020, 15 detectors were operated for three months in the 0.4 km2 forested Wüstebach catchment in the Eifel Mountains (Heistermann et al., 2022). Most recently, Heistermann et al. (2023) presented three years of observations from a high-density cluster of 15 CRNS stations installed over 0.1 km2 of lowland agricultural land at the Marquardt site of the Leibniz-Institut für Agrartechnik und Bioökonomie (ATB). The latter cluster was the only one explicitly aiming for long-term operation (i.e. beyond one year) and was intentionally configured at unusually high density to exploit the strongly overlapping CRNS footprints, together with inversion techniques, to resolve sub-footprint heterogeneity.
The Potsdam Soil Moisture Observatory (PoSMO) replaces the former high-density cluster at the ATB site and was established to provide spatially representative reference data for validating high-resolution satellite soil moisture products and for capturing hydrological extremes. Its design was guided by the following objectives (i) to exploit the footprint sizes of the CRNS more completely than before; (ii) to cover an area of about 1 km2, with a denser coverage at the core and a looser coverage at the outer parts; (iii) to keep some of the former CRNS stations (position and device) to provide long-term time series continuing former observations, as valuable e.g. for satellite remote sensing comparison; and (iv) to enable a closer link to surface soil moisture remote sensing observations by adding shallow point scale sensors.
PoSMO integrates 16 distributed CRNS sensors with complementary point-scale soil moisture measurements from shallow depths consistent with remote-sensing penetration depths to profiles down to 1 m, enabling both horizontal and vertical characterization of soil water dynamics. Operational since mid-December 2023, PoSMO covers approximately 1–3 km2 of predominantly agricultural land and provides continuous soil moisture observations under a wide range of hydrological conditions, including droughts, heavy rainfall, irrigation events, and snow cover.
Complementary data sets enhance soil moisture reconstruction at the km2 scale, including several intensive campaigns for CRNS calibration (soil moisture, bulk density, texture and soil hydrogen pools), hyperspectral and Lidar data, stable water isotopes, electrical resistivity tomography, and others. Soil moisture monitoring at PoSMO is intended to be continued further, to finally be able to provide a three-years data set (as a future update to the first data set presented in the current paper).
In the following we will introduce the field site with the CRNS installation and supporting instrumentation, describe in detail the observations, data processing and calibration workflow, and finally present exemplary results illustrating key dynamics in the dataset and highlight future applications of PoSMO as a long-term reference site for remote sensing and hydrological research.
The Potsdam Soil Moisture Observatory (PoSMO) has been established by the University of Potsdam at and around an agricultural research site located in the northwest of Potsdam in northeastern Germany, which is operated by the ATB. In its central part the DFG research unit Cosmic Sense had operated a dense CRNS cluster since end of 2019, referred to as the “Marquardt cluster”. This cluster was originally designed to exploit strongly overlapping CRNS footprints for assessing sub-footprint soil moisture heterogeneity. Within the second phase of Cosmic Sense and for the interdisciplinary EURAMET (European Association of National Metrology Institutes) project 21GRD08 SoMMet, a new cluster setup was envisioned, now as a key long-term soil moisture monitoring observatory at km2 scale. The main aim has been the observation and harmonization of soil moisture across multiple spatial and temporal scales. To achieve that, the newly-created PoSMO was implemented by repositioning and refurbishing some of the existing CRNS stations but also by deploying a number of additional CRNS stations, a station setup consisting of CRNS sensor, dielectric profile and single-depth soil moisture sensors. By that the former cluster was not only extended by nearly an order of magnitude, but now includes cropped fields larger in size than before, also outside the fenced ATB site. To further increase the spatial coverage of PoSMO, a suitable location with similar land use and soil type was selected approximately 2 km east of the ATB (Fig. 1).
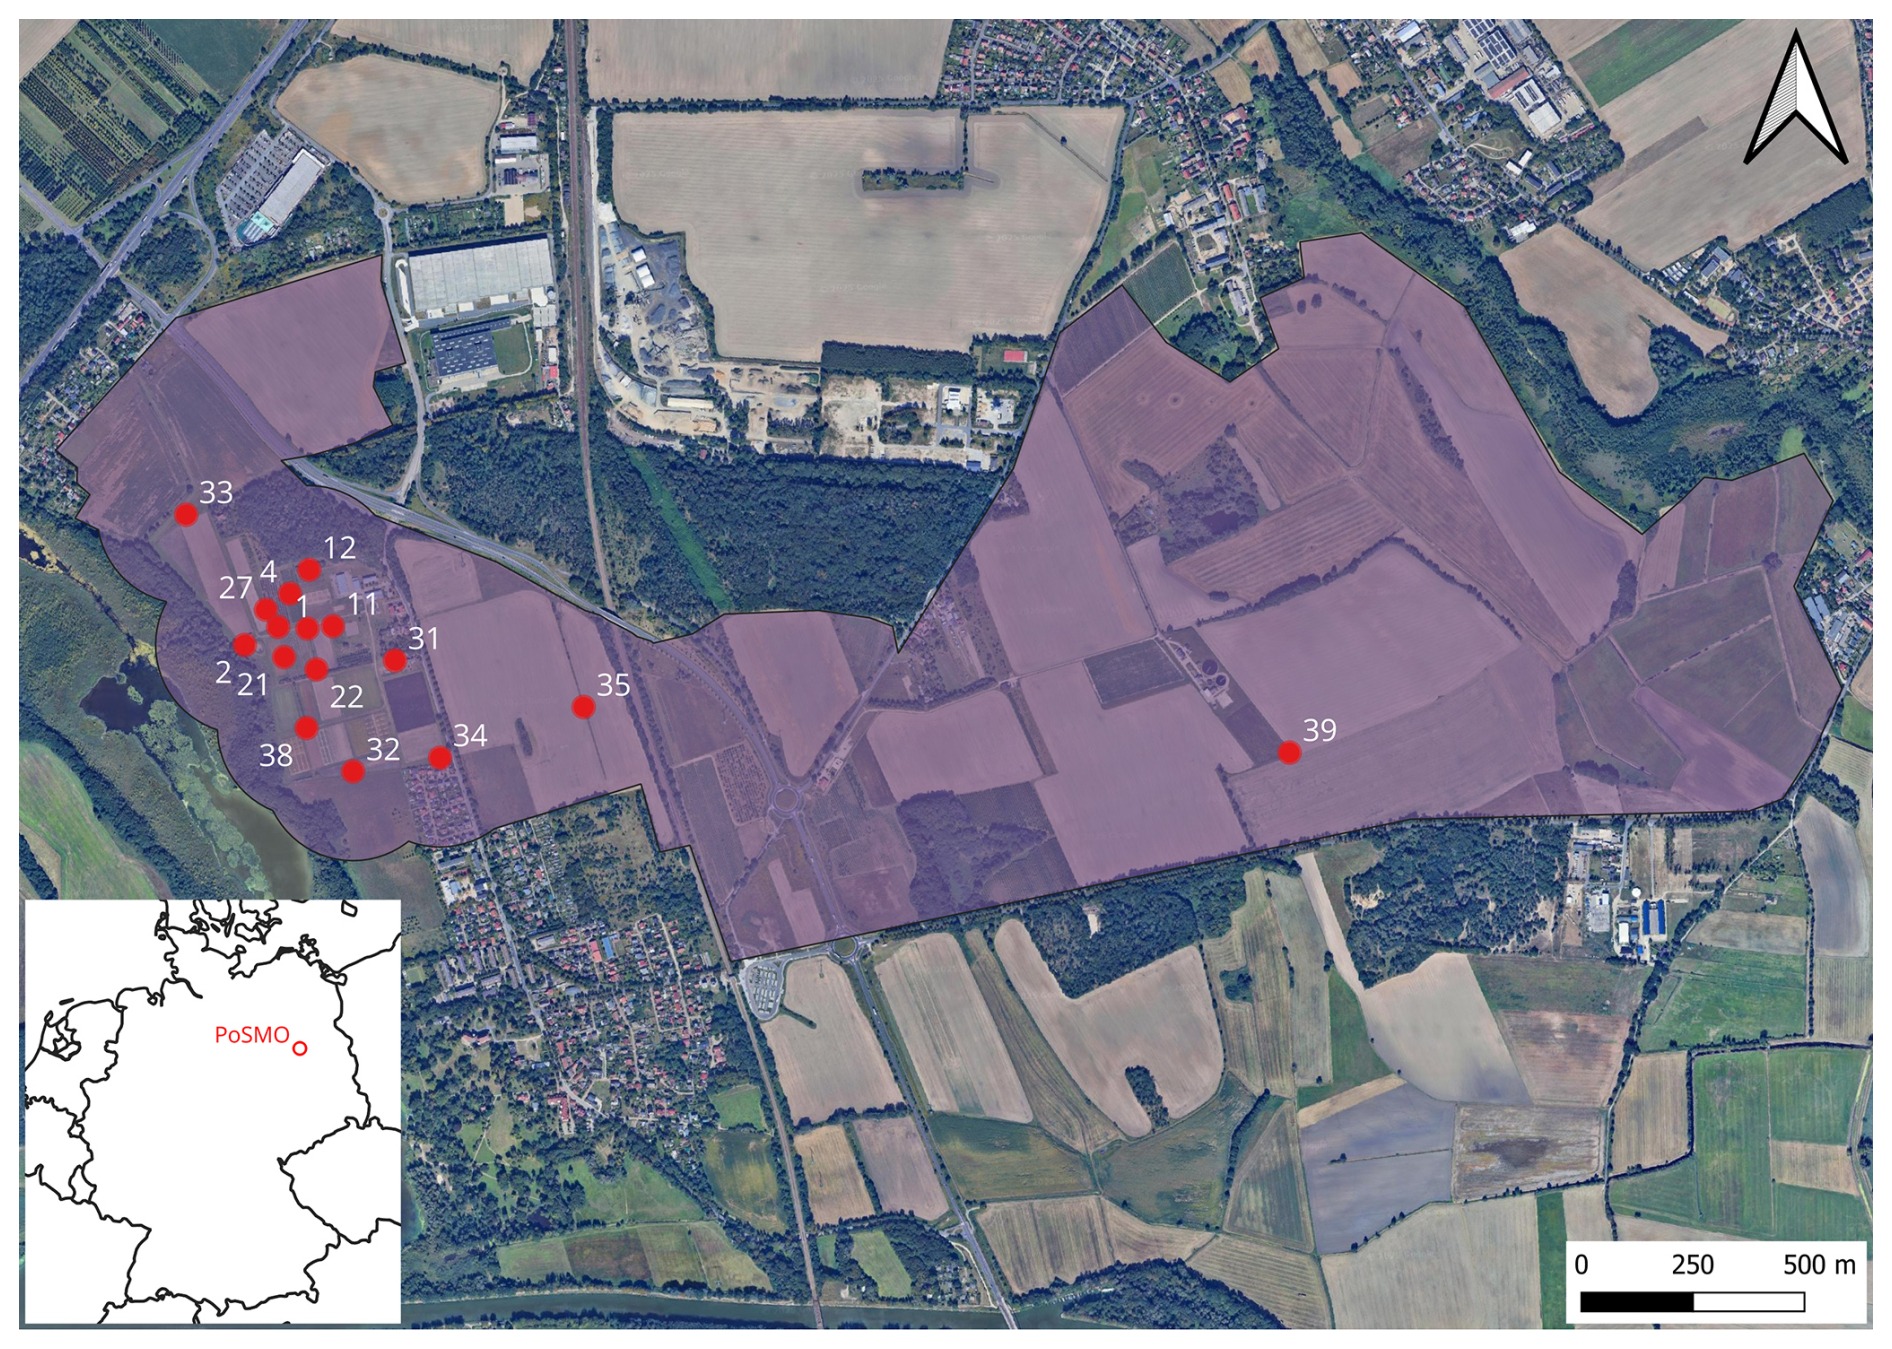
Figure 1Locations of CRNS stations at the Potsdam Soil Moisture Observatory (PoSMO). Numbers refer to the station IDs, a station consisting of a CRNS device and point-scale shallow and profile soil moisture sensors installed in close proximity. The purple area indicates the extent of predominantly agricultural land with broadly similar land use and soil types, representing land-use unit that PoSMO aims to characterize and provide reference data at landscape scale and that is consistent with the spatial aggregation of satellite soil-moisture products (forest and settlement areas excluded). Background image from Google Earth Engine (Gorelick et al., 2017), Imagery © 2023 Google, Maxar Technologies. Map data based on OpenStreetMap (© OpenStreetMap contributors, 2025, distribution under ODbL license).
As a result, the denser cluster in the western part of PoSMO provides an actual soil moisture measurement covering the complete area of the ATB site including its immediate surroundings (approximately 0.7 km2) under mixed agricultural land use. This is achieved through overlapping or adjoining horizontal CRNS footprints of multiple CRNS stations distributed across the fenced ATB site. The coverage is expanded by one CRNS station directly east of the ATB site and especially the more isolated easternmost CRNS station, both reflecting a more typical remote sensing validation setup, with one station representing a rather homogeneous land use in its surrounding (Schmidt et al., 2024). Altogether PoSMO could be taken to represent an area of about 3.4 km2 of predominantly cropped fields and meadows, with some other agricultural land use and loose urban settlings (Fig. 1). The current setup thus combines the scale of coverage of the first temporary CRNS cluster at the Fendt site (Fersch et al., 2020) with the continuity of observation of the ATB Marquardt site (Heistermann et al., 2023).
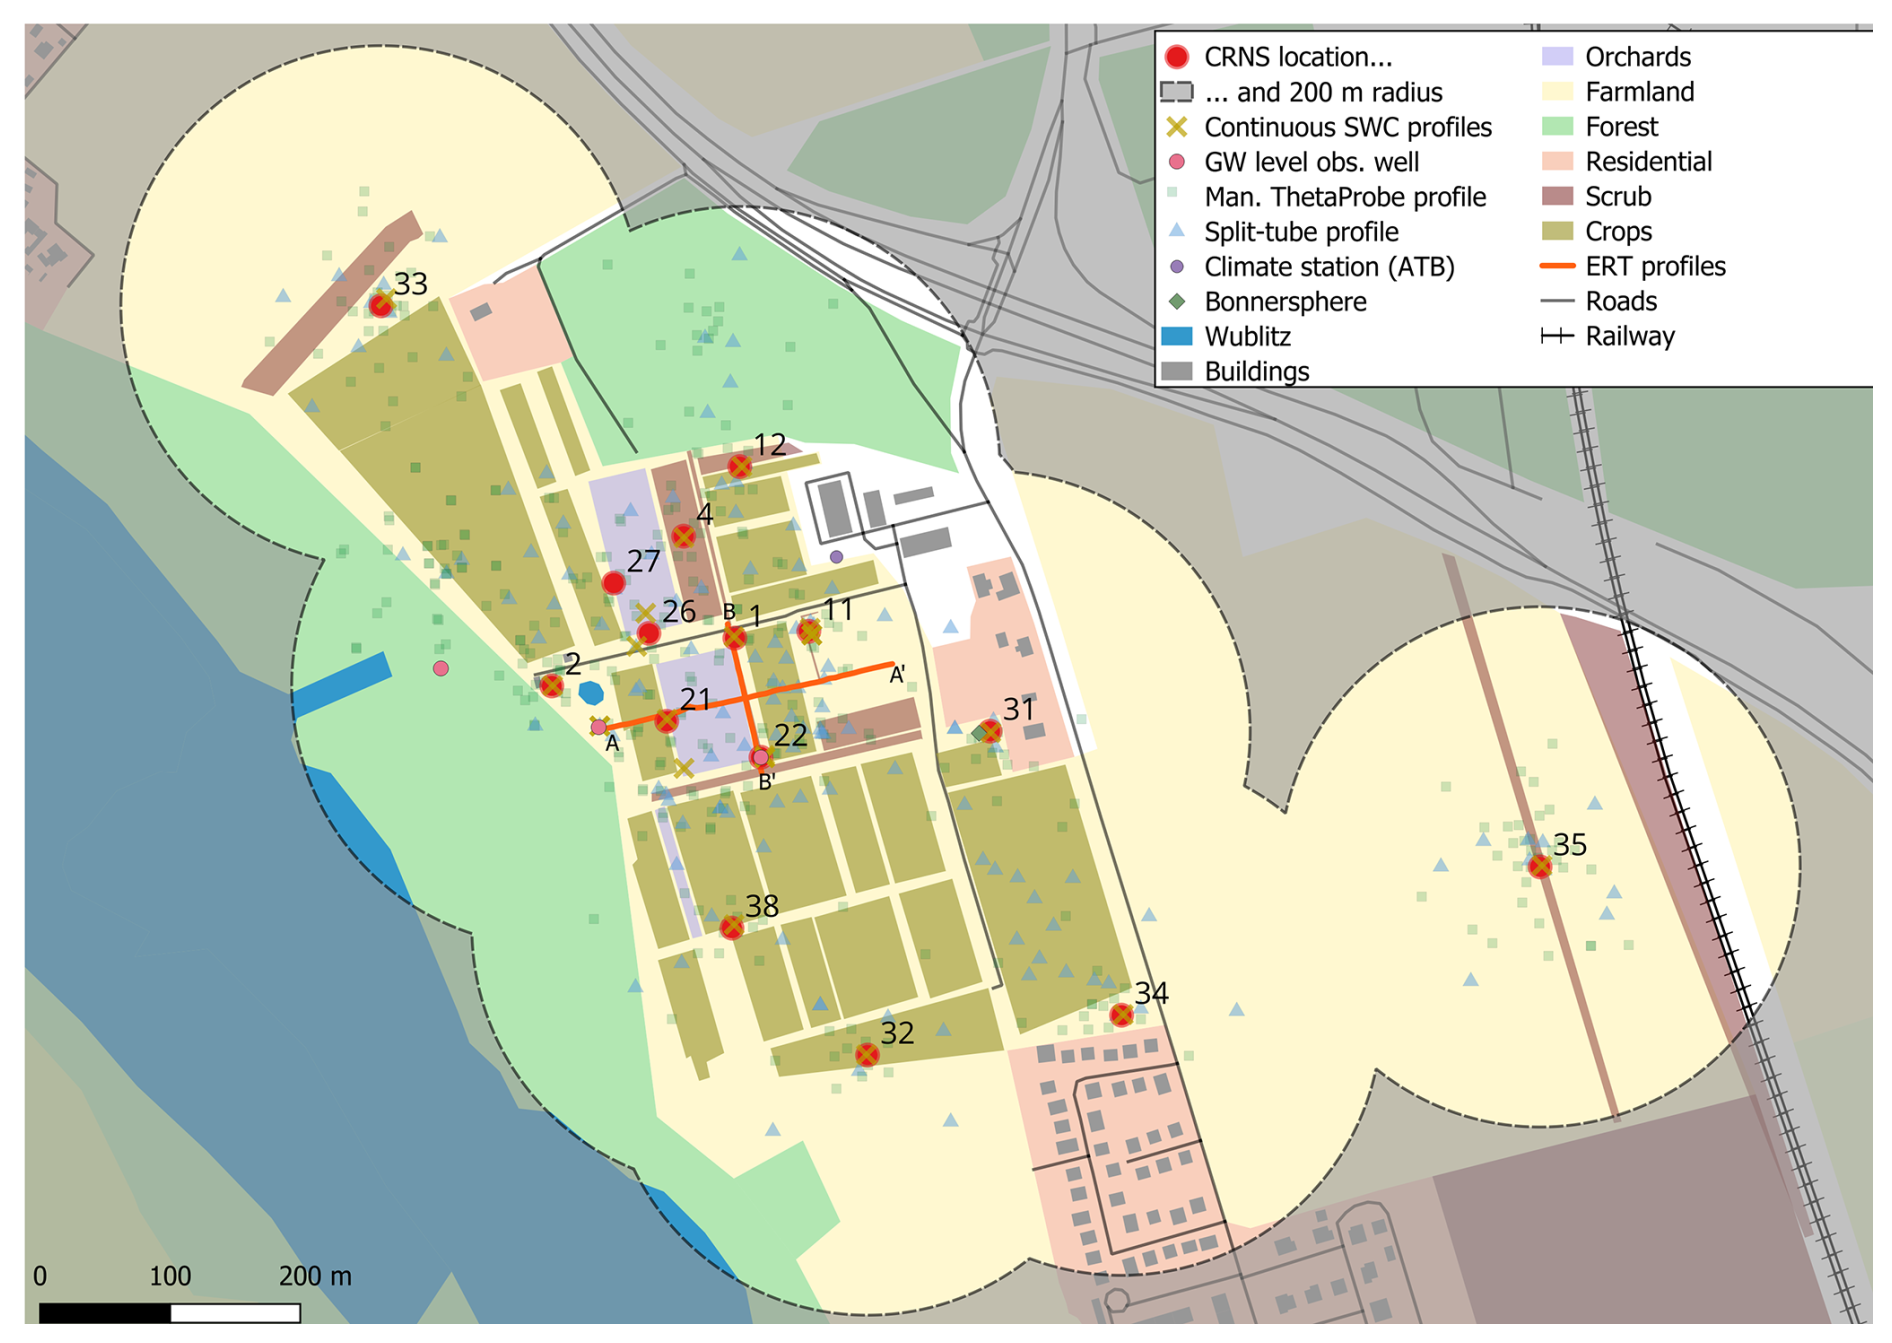
Figure 2Overview of the main part of PoSMO, showing continuously operating CRNS stations with the numbers showing their ID (a station includes a CRNS detector, point-scale shallow and profile soil moisture sensors), as well as groundwater monitoring wells and climate station. The approximate horizontal footprint of the CRNS detectors, based on a 150 m radius, is given as highlighted area, with the envelope of the area covered indicated as dashed line. Additionally, the map shows the two ERT transects, hyperspectral camera position, Bonner sphere spectrometer location and calibration sampling points (Manual ThetaProbe profile and Split-tube profile). Landuse based on OpenStreetMap (© OpenStreetMap contributors, 2025, distribution under ODbL license).
The ATB site, as the most densely instrumented western area of PoSMO, is located at 40 m a.s.l. on a gentle hillslope sloping towards the lake in the west and characterized by diverse experimental agricultural plots (Fig. 2). Crops grown include cereals, maize, alfalfa, sunflower, and rape seed; the site also features meadows, a variety of orchards (cherry, apple, chestnut) and a poplar short-rotation plantation. With exception of a few irrigated orchards and occasional local irrigation (on potatoes, maize and spring wheat), the site is mainly rainfed. The observatory is situated on predominantly periglacial deposits with sandy to loamy topsoil (0 to 50 cm depth) and soil texture ranging from 68 %–91 % sand, 8 %–27 % silt, 0.6 %–4.4 % clay, and organic matter contents between 0.4 %–17.3 % (by mass). The climate is temperate, with an mean annual precipitation of 584 mm (1981–2010) and a mean annual temperature of 9.3 °C (Cfb by Köppen-Geiger). The groundwater table lies between 1.5 and 10 m beneath the surface, and two observation wells were installed in 2019. Comprehensive meteorological observations are provided by an on-site weather station, a second station 5 km away (both operated by ATB), and a third station 12 km away operated by the German Meteorological Service (DWD) (details see Sect. 4).
The site is representative of typical lowland agricultural landscapes in northern Central Europe, situated within a climatic transition zone between maritime and continental influences. Moderate seasonal contrasts allow the site to capture a broad range of hydro-meteorological conditions relevant to temperate agro-ecosystems. As such, the site serves as a valuable model environment for investigating soil moisture dynamics across diverse hydro-climatological conditions, including dry periods, snow events, and variable precipitation patterns. Although the two research projects Cosmic Sense and SoMMet that initiated and supported the establishment and operation of the observatory have finished end of 2025, automated measurements are scheduled to be continued by University of Potsdam at least until end of 2026, allowing for future updates of the published dataset.
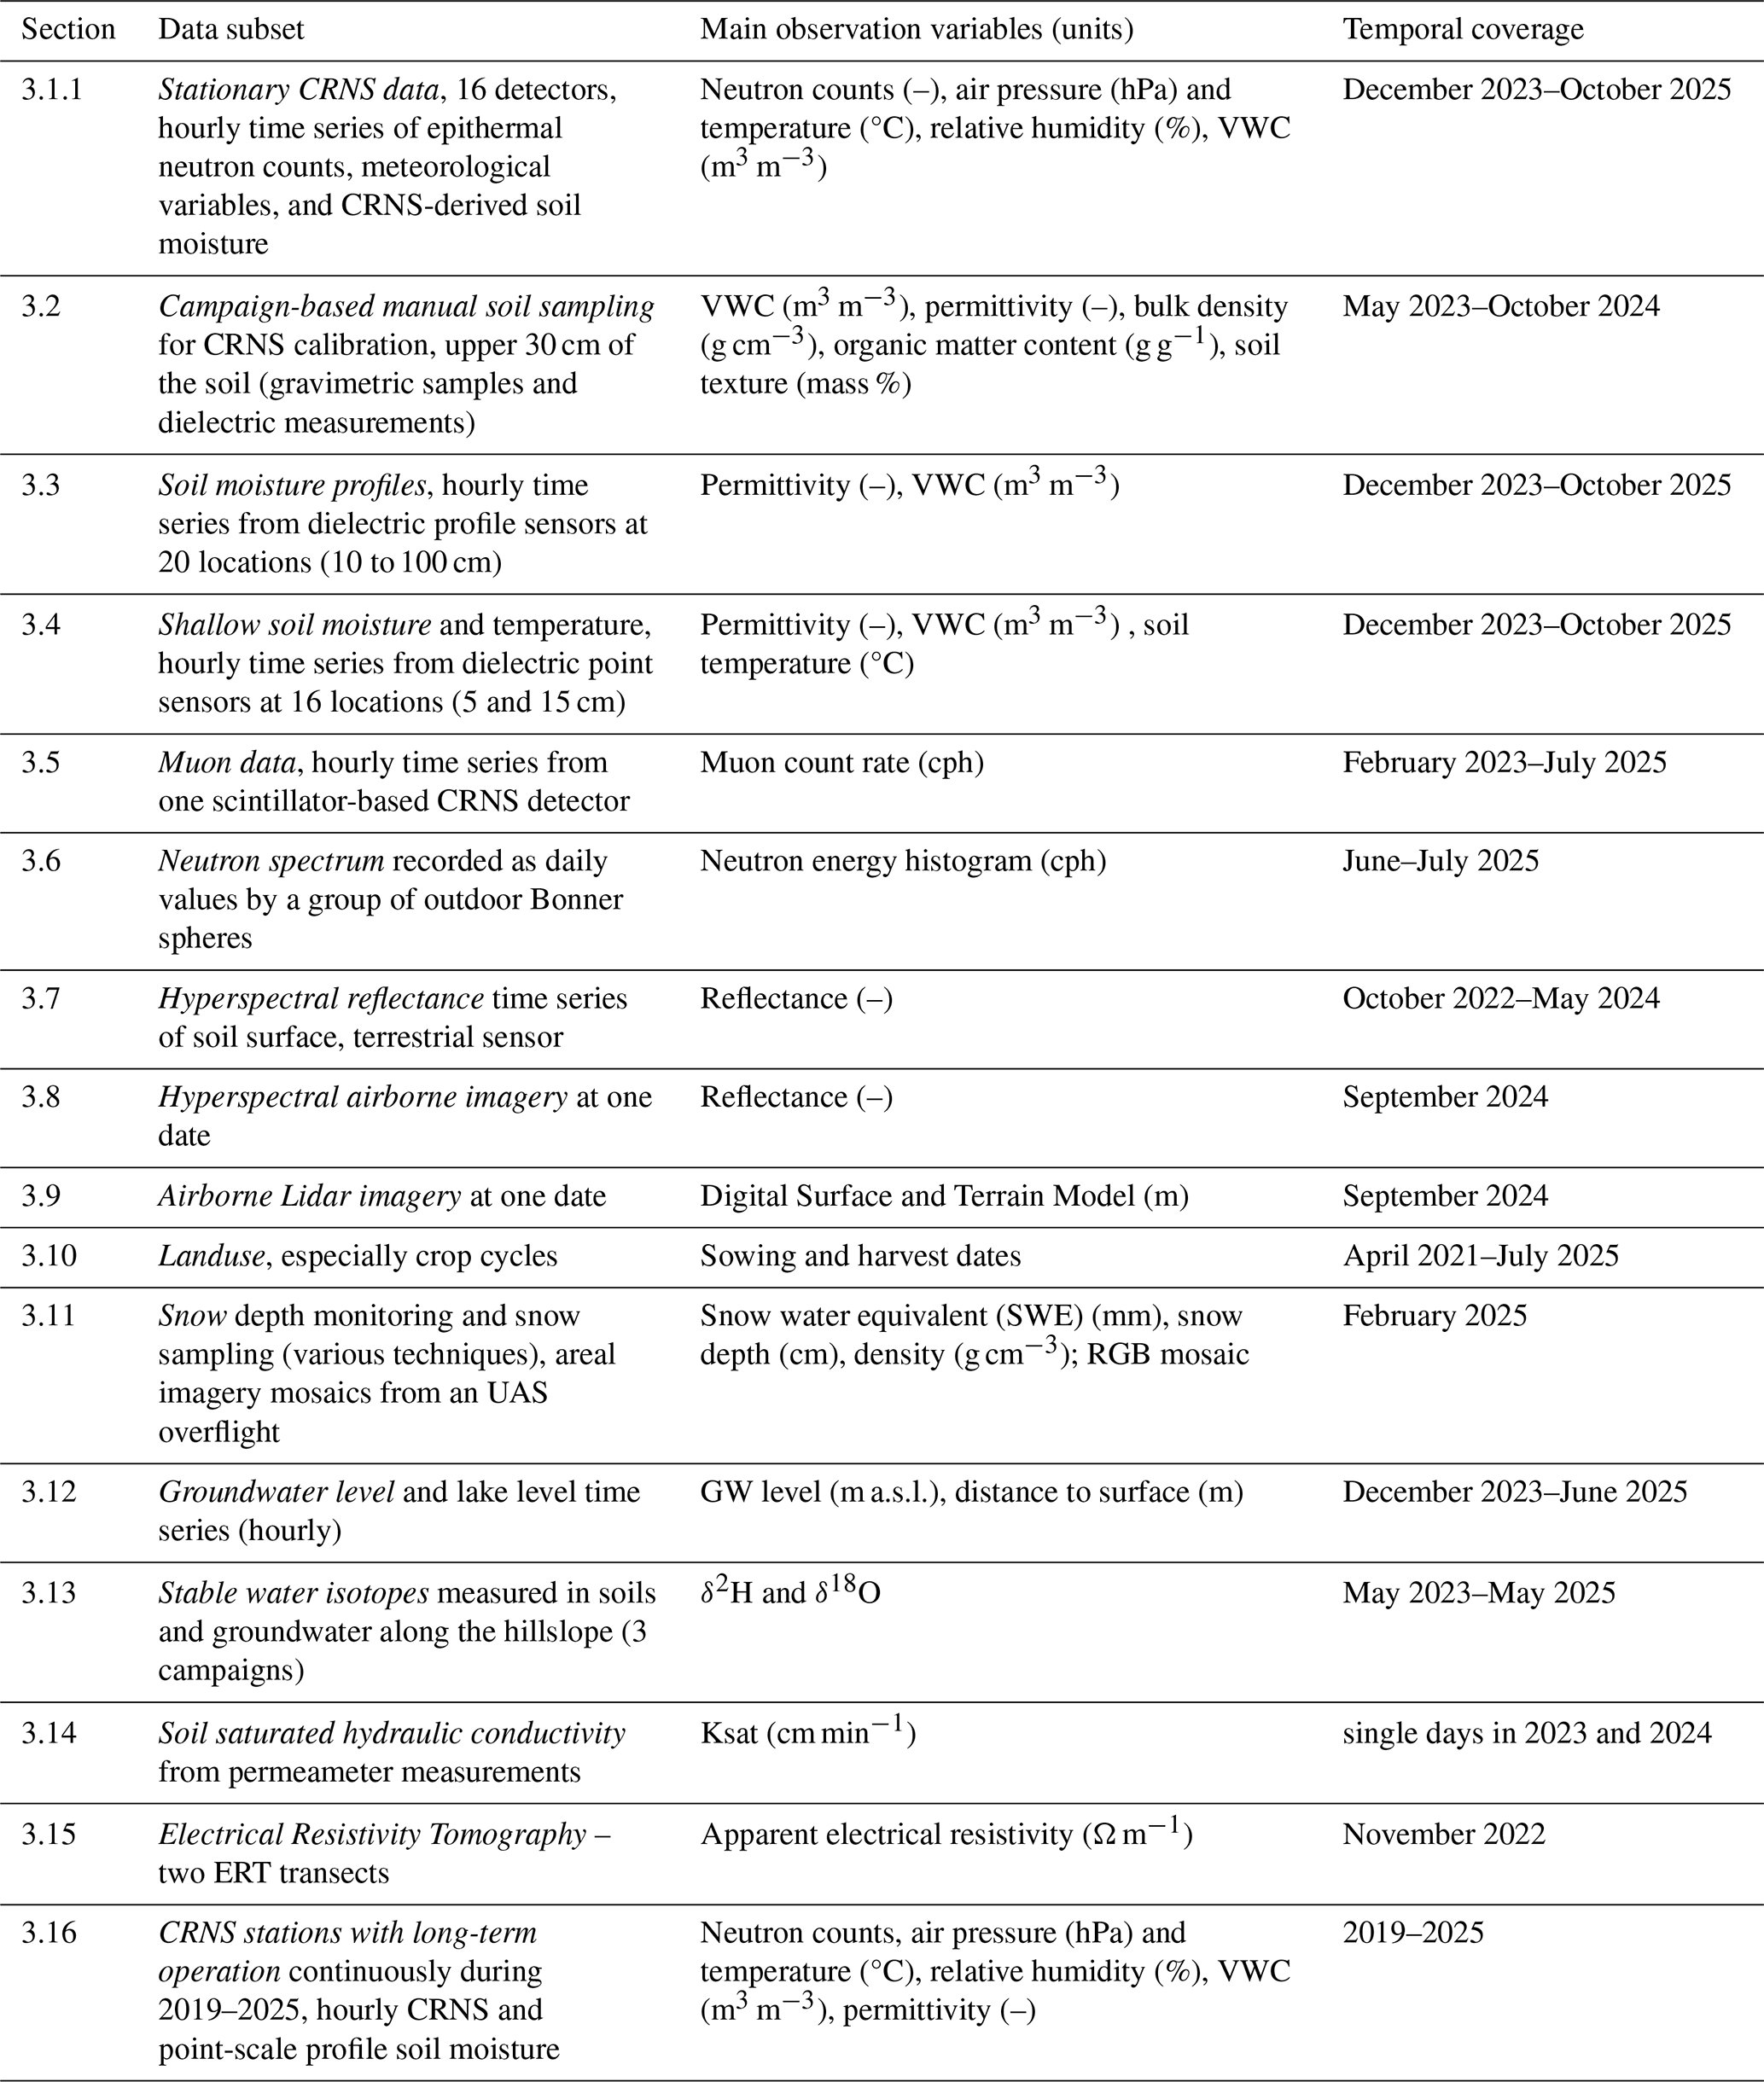
The following subsections provide an overview of the instruments and related observations that comprise the dataset. Table 1 summarizes the various sub-datasets collected.
Table 1Overview of Sect. 3: brief summary of each data subset, main observed variables, units, and temporal coverage. Specific details are given in the corresponding subsections and in the accompanying JSON files, which document each subset within the repository. Folder names (shown in italics) follow the section numbering of the manuscript, with each numbered folder in the dataset containing the data described in the respective section.
3.1 Stationary CRNS data
3.1.1 CRNS sensor installation
From December 2023 to October 2025, we collected epithermal neutron count data from 16 stationary Cosmic-Ray Neutron Sensors (CRNS) at the soil moisture observatory established in Potsdam (PoSMO). The positions of the CRNS sensors are depicted in Figs. 1 and 2. The placement of the sensors was selected based on several key considerations: (i) to ensure a substantial overlap of the footprints, (ii) to capture the site's variability along the hillslope gradient, (iii) to position some sensors near the groundwater wells, (iv) to avoid interfering with agricultural management activities, which necessitated to not directly place sensors on cultivated areas, and (v) to extend the spatial coverage for direct comparison with remote sensing products, while placing the sensors to largely homogeneous surroundings.
The detailed specifications of the sensors installed at the observatory are provided in Table 2, including the manufacturer, sensor type, and detector sensitivity (for further details, see Heistermann et al., 2023). A total of 16 sensors from various manufacturers were included in the study: five devices from Hydroinnova LLC (Albuquerque, USA), four from Quaesta Instruments LLC (Tucson, USA), four from StyX Neutronica GmbH (Mannheim, Germany), one Canberra (now Mirion Technologies, USA), one from Finapp S.r.l. (San Pietro in Cariano, Italy), and one from Lab-C LLC (Sheridan, USA), which is now associated with Quaesta Instruments. The sensitivity of each device was determined through parallel measurements with a reference CRNS sensor (calibrator) over a period of at least 24 h, allowing for a comparison of the neutron count rates observed by different instruments. The detector sensitivities (Table 2) would allow to process the neutron counts of all sensors with a universal calibration parameter to derive CRNS soil moisture (Heistermann et al., 2024). As detailed in Table 2, the majority of the devices employ gases with high neutron cross-sections to detect neutrons, including 3He gas (CRS-1000, CRS-2000) and 10BF3 enriched gas (BF3-C-4, BF3-A-3, CRS-2000-B, B-E1-4). The “HydroSense Dual” detector is based on a multiwire proportional chamber with solid 6Li (Fersch et al., 2020; Patrignani et al., 2021), while the StX-140-5-15 sensors utilize 10B-lined converters. Finally, the FINAPP5 relies on a multi-layer zinc sulfide Ag doped scintillator with 6Li fluoride powder (Gianessi et al., 2024). All of the devices described above are detectors for epithermal neutrons.
Most CRNS devices also record temperature, relative humidity, and barometric pressure using external sensors. These data were used to correct the raw neutron count rates. For sensors without an external sensor, data from the reference station at location #11 were used for corrections. Besides the neutron count time series we also provide processed CRNS soil moisture.
Table 2Properties of CRNS sensors used at the PoSMO (including manufacturer, model, and detector principle). Also provided is the ratio of the sensor's raw counts of epithermal neutrons to the counts of a calibrator sensor (consistent with Heistermann et al., 2023), referred to as sensitivity. This is a device specific property, which is independent of the site. It can be used to infer a local calibration parameter value (cf. Heistermann et al., 2024). Some CRNS devices have been refurbished and are technically different to the formerly used device, and thus the sensitivity value had to be updated and is different to the former one. CRNS stations that have been continued at their former position with identical set-up are printed with bold ID. Finapp s.r.l. has changed its CRNS model names; Finapp 3 (F3) refers now to Finapp SWC, Finapp 5 (F5) to Finapp SWC plus, and Finapp 6 (F6) to Finapp SWC Premium. Some Lab-C CRNS devices are currently only sold via Quaesta Instruments, and then the manufacturer listed is Quaesta Instruments.
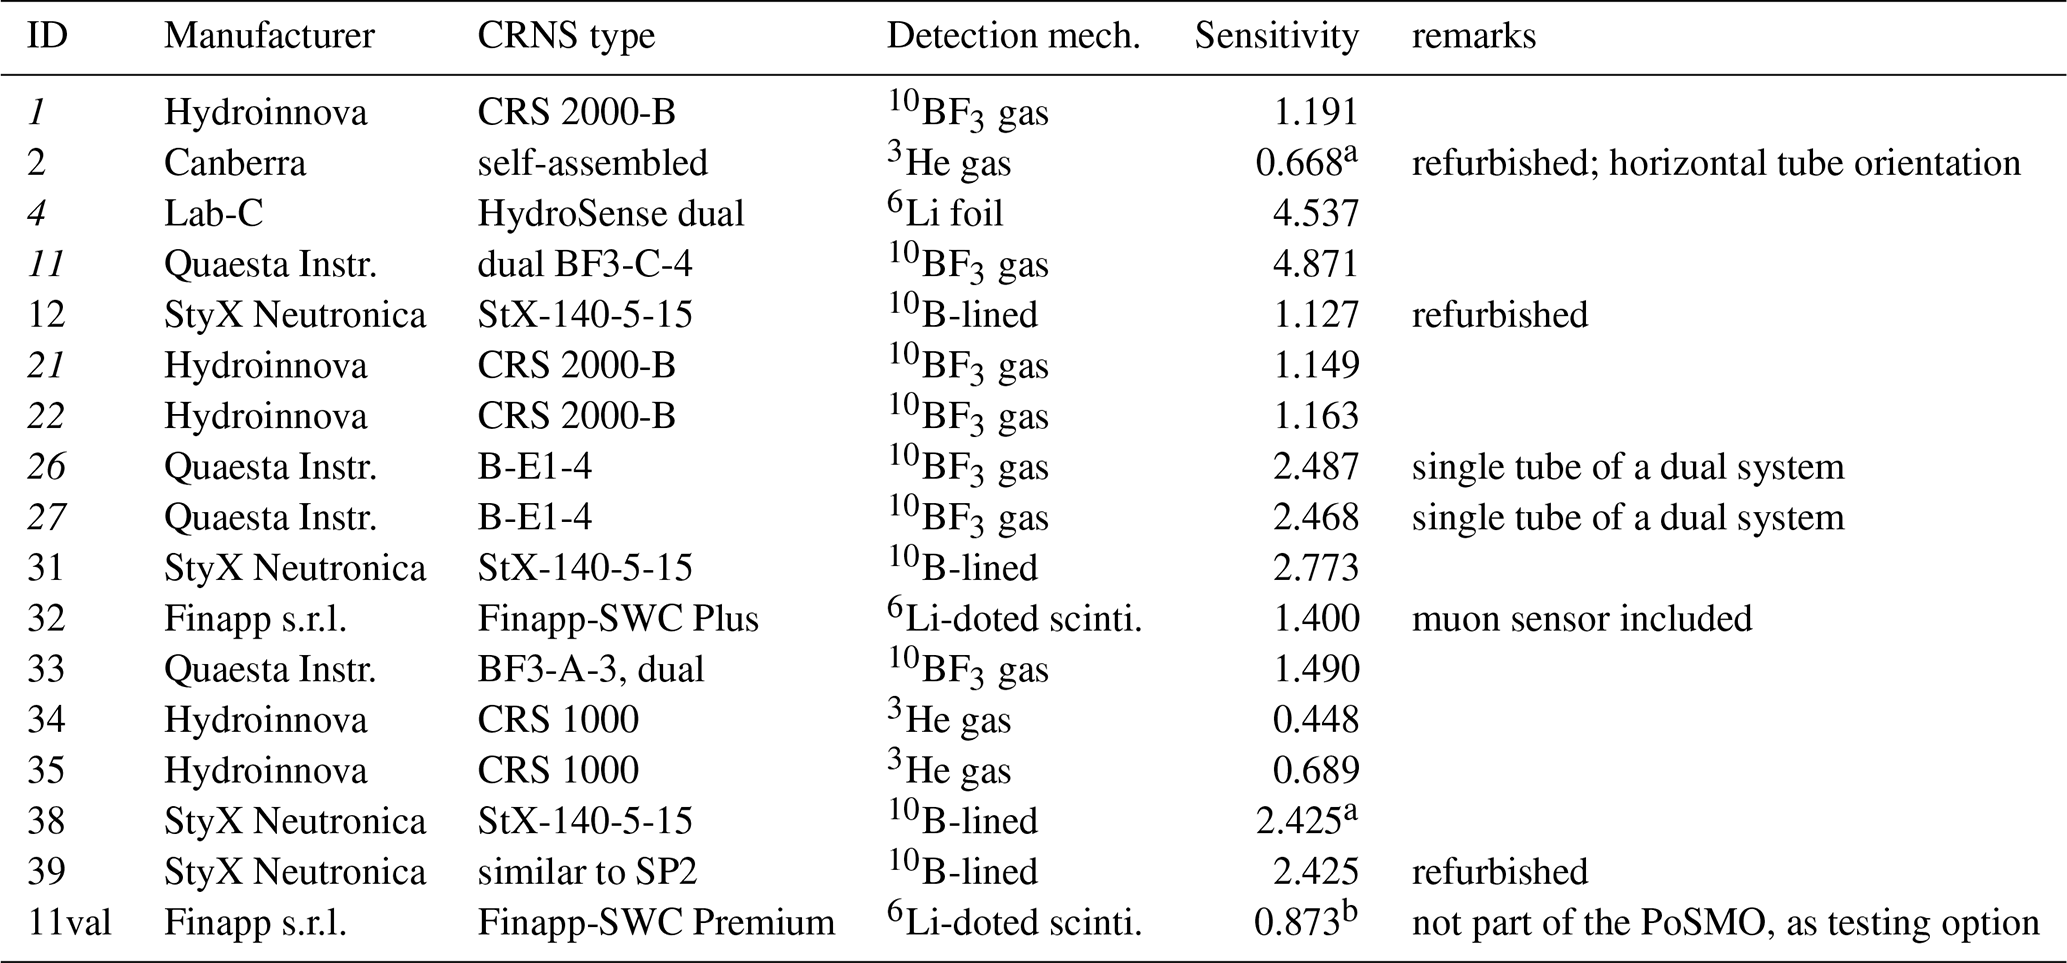
a Type-generic sensitivity factor. b Half count rates and sensitivity compared to standard operation of this detector.
3.1.2 CRNS-based soil moisture estimation
For the data processing of CRNS neutron count time series, the Python tools Corny (Schrön, 2025) and Neptoon (Power et al., 2025) were used. Both tools provide algorithms to filter raw counts for outliers, aggregate them to the desired time interval, correct for atmospheric influences, smooth the time series, and calibrate the CRNS with independently derived soil moisture data (Sect. 3.2), which is required to convert neutron counts to soil moisture. The data processing involves several subjective choices. To ensure transparency and reproducibility, we provide the full configuration files for Corny and Neptoon in the data repository. This will allow users to understand, reproduce, or adapt the data processing details.
The first step in the processing for the CRNS soil moisture products provided in this data set is the filtering of neutron count time series for outliers, which are identified using a standard deviation–based threshold.
Count rates are influenced by atmospheric factors; therefore, we applied the following corrections: the effects of barometric pressure were corrected following Zreda et al. (2012); effects of incoming cosmic-ray neutron flux were corrected using the station Jungfraujoch JUNG (Switzerland), following either the approach from Zreda et al. (2012) or Hawdon et al. (2014); effects of atmospheric vapour content were corrected using the method described in Rosolem et al. (2013) or inherently accounted for, depending on the conversion function to soil moisture (calibration function). CRNS time series were calibrated using the revised standard transfer function from Desilets et al. (2010) and the universal transfer function (UTS) function according to Köhli et al. (2021). For calibration, neutron counts are related to independently determined reference soil moisture, typically derived from in-situ soil sampling campaigns (see Sect. 3.2). This procedure allows the determination of the site specific calibration parameter N0 and ND for the two approaches, respectively. While the standard transfer function is most widely used, the newer UTS does specifically accounts for the influence of air humidity on neutron transport and provides more accurate soil moisture estimates especially for dry soil conditions (Rasche et al., 2024). Besides soil moisture, calibration requires information on soil bulk density and hydrogen stored within the subsoil of the sensor footprint. For this purpose, the vertically-generalized profiles of soil moisture, bulk density, lattice water and organic matter were interpolated onto a 1 m-grid and weighted following Schrön et al. (2017). The weighting includes the estimation of the effective sensing depth (D86), also called integration depth, and the horizontal footprint (R86), also called support area; for sampling details see Sect. 3.2. Resulting CRNS soil moisture time series are provided at hourly resolution. Because neutron count time series exhibit high statistical noise, either corrected count rates (prior to conversion) or the resulting soil moisture products must be smoothed. A moving average with a window length of 12–14 h is commonly applied, although alternative smoothing approaches have been proposed (Franz et al., 2020). CRNS-derived soil moisture time series are presented and discussed in Sect. 5.1.
3.2 Campaign-based soil measurements for CRNS calibration
To facilitate the calibration of the CRNS sensors, extensive field campaigns were conducted at 283 new profile locations, complemented by data from two previous campaigns in 2019 and 2022 (Heistermann et al., 2023). This dataset encompasses a total of 38 campaigns within the CRNS footprints, with both dielectric and soil core measurements taken down to a depth of 35 cm. In total, dielectric profiles for obtaining soil moisture were measured at 447 locations, while soil core measurements (100 cm3 sampling cylinders) were carried out at 152 locations, thereby increasing the spatial density of soil moisture observations. All sampling locations were accurately recorded using differential GPS (dGPS). In accordance with the procedures outlined by Heistermann et al. (2022), key soil properties were derived from oven-dried samples (105 °C for 24 h), including dry soil bulk density, soil moisture, and organic matter as well as lattice water obtained from loss-on-ignition analysis (400 °C for 16 h and 1000 °C for 12 h, respectively). Soil moisture measurements taken manually with portable dielectric devices (ThetaProbe ML2x, Delta-T Devices LLC, Cambridge, UK) were individually corrected using a two-point (air–water) calibration for each device. The conversion from permittivity to volumetric water content (VWC) followed the equation of Zhao et al. (2016), with customized coefficients based on all PoSMO campaigns following Heistermann et al. (2022). This site-specific conversion, which yielded a root mean square error (RMSE) of ±0.05 m3 m−3 for the VWC estimates, was applied to all point-scale sensors – handheld and stationary.
To investigate the potential impact of tillage (by disc) on temporal variation of soil bulk density, a test in a plot cropped with maize was done in 2024. Bulk density was sampled at 0, 5, 10 and 15 cm before and again shortly after harvest and tillage, with a time difference of about 2 months.
3.3 Continuous soil moisture profiles at point scale
We employed four different methods for measuring soil moisture profiles, each involving different depths and sensors (resulting in a total of 25 individual profiles, see Fig. 1, covering about two years of data). This approach enabled us to capture detailed data on the vertical soil moisture dynamics relevant to infiltration and drying processes, which are vital for improving the understanding of CRNS-derived soil moisture measurements (cf. Scheiffele et al., 2020). The impedance-based profile probes (2 PR2/4 and 13 PR2/6, Delta-T Devices LLC, Cambridge, UK) collected data at 10, 20, 30, and 40 cm depths (with the PR2/6 extending to 60 and 100 cm). Five additional profiles each comprising 4–5 individual impedance-based probes (ThetaProbe ML2x, Delta-T Devices LLC, Cambridge, UK) extended the network by measuring at depths of up to 200 cm in areas where deeper monitoring was desirable or where profile probes were impractical to install. Furthermore, five soil moisture profiles were equipped with five TDR probes each (TDR100, Campbell Scientific Ltd., Logan, USA) installed at depths of 10, 25, 45, and 75 cm close proximity to the ATB climate station (Fig. 2). For all dielectric sensor we applied a site-specific conversion of measured permittivity to soil moisture, as described in Sect. 3.2.
3.4 Shallow soil moisture from point-scale sensors
To enhance the monitoring of the upper soil layers at all CRNS stations (e.g. for remote sensing applications), additional dielectric SMT100 sensors (Truebner, Germany) were installed at depths of 5 and 15 cm. These time-domain transmission-based sensors (Jackisch et al., 2020) provide observations of soil moisture and soil temperature. Shallower depths than the chosen 5 cm are prone to larger errors in respect to deeper installation depths, considering the usually rough soil surface and the vertical averaging of soil moisture point-scale sensors such as the SMT100. Measured permittivity was converted to VWC using a site-specific calibration function (Sect. 3.2).
3.5 Muon data
Neutron monitors, such as the one at Jungfraujoch (JUNG), Switzerland, are conventionally used to correct locally measured epithermal neutron counts for variations in incoming neutrons. Recent studies suggest that local measurements of muon counts could improve this correction (Stevanato et al., 2022). Station #32 operated at PoSMO also includes muon detection (Gianessi et al., 2024), allowing for respective analyses. These data span January 2023 to July 2025 (see also Table 2).
3.6 Bonner sphere measurements of full neutron energy spectrum
Another option to potentially provide an estimate of the local incoming neutron flux are Bonner sphere spectrometers (BSS), as previously applied in combination with a temporary CRNS cluster (Fersch et al., 2020). Such measurements also yield background information on the neutron signal, for example, quantifying the thermal neutron component in the environment that must be eliminated prior to detection, as this contribution can impair the accurate counting of epithermal neutrons by CRNS devices.
Based on an existing extended range BSS system, known as NEMUS (Wiegel and Alevra, 2002), Physikalisch-Technische Bundesanstalt (PTB) developed an SI-traceable version specifically for automated neutron spectrometry measurements under outdoor conditions (NEMUS-UMW), which was deployed at PoSMO during summer and autumn 2025. The system consists of a bare thermal neutron detector, 6 polyethylene spheres with diameters of 3, 4, 5, 6, 8 and 10 in., and four modified spheres with lead and copper shells, recording contributions from low to high neutron energies. The central detection of (thermal) neutrons inside the individual moderator sphere of each device was via spherical 3He-filled proportional counters of type SP9 (Centronic Ltd., Croydon, UK), selected due to its low intrinsic background, which was systematically tested and quantified in a “neutron-free” environment (underground laboratory UDO II). Using unfolding procedures (Reginatto, 2010), and the NEMUS-UMW response functions characterized and validated in the PTB's neutron reference fields, and thus the resulting unfolded neutron spectrum could be determined in absolute terms, i.e. neutron fluence Φ(E) in neutrons cm−2.
3.7 Ground-based reference measurements of hyperspectral surface reflectance
For measurements of ground-based hyperspectral surface reflectance on 11 October 2022, a HYPSTAR®-XR unit was installed at the ATB HYPERNETS site close to CRNS station #11 (at N, E), mounted on a 5 m mast with a 5 m horizontal boom, which was oriented southward toward a bare soil surface to avoid obstructions in the sensor's field of view. The Hyperspectral Pointable System for Terrestrial and Aquatic Radiometry (HYPSTAR®) is a two-axis, autonomous hyperspectral radiometer designed to deliver multi-angular measurements of land and water surface reflectance. The system acquired measurements every 30 min between 09:00 and 17:00 UTC across a range of zenith and azimuth angles until May 2024. It incorporated two spectrometers: a VNIR unit covering 380–1000 nm with 1330 channels at 3 nm full width at half maximum (FWHM), and a SWIR unit covering 1000–1700 nm with 220 channels at 10 nm FWHM. An onboard camera provided contextual imagery, while an internal LED source tracked calibration stability (De Vis et al., 2024; Goyens et al., 2021). Data were transmitted to a central server and processed using the hypernets_processor, a Python-based pipeline for radiometric calibration, quality control, and computation of radiance, irradiance, and surface reflectance. The system rigorously propagates both random and systematic uncertainties, along with spectro-temporal covariance, ensuring that the data meet Fiducial Reference Measurement (FRM) standards (European Space Agency, 2024). The dataset collected includes raw and processed surface reflectance data as a complete time series of angular hyperspectral surface reflectance for a bare soil target under varying illumination and atmospheric conditions. It supports applications such as validation of radiative transfer models and soil spectral analysis. Future work shall explore the use of this dataset for estimating surface soil moisture, using both empirical spectral indices and physically based retrieval approaches. The dataset provides also a valuable reference for validating airborne and satellite-based remote sensing products, to improve the retrieval accuracy of soil and vegetation parameters across scales. Additionally, it can support the development and calibration of radiative transfer and machine learning models for soil moisture, surface condition, and land-surface process monitoring.
3.8 Airborne hyperspectral data
Hyperspectral data were not only observed at PoSMO as ground-based time series for a reference area (see Sect. 3.7), but were accompanied by a dedicated airborne campaign on 5 September 2024, providing hyperspectral as well as Lidar imagery. The former will be presented in this section, and the latter in the following Sect. 3.9.
Airborne hyperspectral data were acquired during an aerial survey campaign using two pushbroom imaging spectrometers mounted aboard a Cessna 208B Grand Caravan aircraft equipped with GNSS/IMU POS AV inertial navigation unit. These two sensors were a CASI-1500 (covering the visible to near-infrared range, VNIR: 380–1050 nm) and a SASI-600 (covering the shortwave infrared range, SWIR: 950–2450 nm), both manufactured by Itres, Calgary, Canada. The native spatial resolution achieved was 25 cm for CASI-1500 and 63 cm for SASI-600. The CASI sensor provided 15 spectral bands at an average spectral resolution of 38 nm, whereas SASI delivered 100 bands with a spectral resolution of 15 nm. The survey consisted of two parallel flight lines, each 375 m swath width.
Initial data pre-processing was conducted by CZglobe (Czechglobe, the Czech Global Change Research Institute, Department of flight activities). Radiometric calibration was performed using the RadCorr software package, following the procedures outlined in Hanuš et al. (2023), and employed laboratory-derived sensor calibration parameters. Additional corrections included scattered light correction, frame shift smear correction, second-order light correction, and bad pixel interpolation to ensure optimal signal integrity. Georeferencing was accomplished using a GNSS/IMU navigation system in combination with a high-resolution digital terrain model (DTM), implemented within the GeoCor software suite. The hyperspectral imagery was projected into the UTM coordinate system (Zone 33N, ETRS-89 datum). Subsequent atmospheric correction and reflectance retrieval were carried out using ATCOR-4 (version 7.1) (Richter and Schläpfer, 2011). The algorithm employs the MODTRAN radiative transfer model to correct for atmospheric effects and retrieve surface-level reflectance. The resulting reflectance values are stored as integer-scaled values, where a reflectance of 10.00 % is represented as 1000 (i.e., scaled by a factor of 100).
Following atmospheric correction, the VNIR and SWIR datasets were spatially co-registered using the AROSICS software (Scheffler et al., 2017). The registration process utilized spectrally overlapping bands at 1004.8 nm (VNIR) and 1002.5 nm (SWIR) to ensure high alignment accuracy. The overall registration error could be reduced from an RMSE of 39 to 16 cm. Redundant overlapping bands were removed, and the SWIR data were resampled to match the finer spatial resolution of the CASI sensor (25 cm). The final dataset was generated by mosaicking the two flight lines and saved as Cloud Optimized GeoTIFF (COG), resulting in a geometrically and radiometrically consistent hyperspectral cube for subsequent analysis.
3.9 Airborne Lidar data
Airborne Lidar (ALS) data were captured using a Riegl LMS Q-780 airborne full-waveform laser scanner mounted also onboard the Cessna 208B (see Sect. 3.8). The site was captured in three strips, north-south orientation, flown in the morning of 5 September 2024. The Riegl LMS Q-780 operates at a wavelength of 1064 nm with a laser pulse repetition rate of up to 400 kHz and a beam divergence of 0.25 mrad. FOV was 60°. Flight height was 620 m and scan line width was 710, 1190 and 1660 m. The captured strips have an average point density of 7.3 points m−2.
Strips were aligned using the RiPROCESS 1.9.2, RiUNITE, and GeoSysManager 2.2.4 software from RIEGL Laser Measurement System GmbH. For the flight trajectory calculations, the POSPac 8.7 software was used, followed by trajectory conversion in the Riegl-POFImport 1.8 software. After import into the RiProcess software, the reference surfaces were first searched automatically. This was followed by the calculation of deviations between the same reference surfaces on different lines, which then were minimized while adjusting the trajectory parameters for each individual flight line. The laser data was then re-georeferenced using the adjusted trajectories. The error (standard deviation) of the scan data adjustment was 0.007 m (based on 120 000 tie points). Data were georeferenced to the UTM coordinate system (Zone 33N, ETRS-89 datum). The resulting laser data were exported as point clouds in las-format (v1.4), including the so-called Riegl extra bytes, which associate each point with the information from the full-waveform analysis (amplitude and pulse width). The point density resulting is 15.2 points m−2 in the co-registered point cloud. Finally, noise was removed from the processed data using LAStools software, and a classification (surface and terrain) of the point cloud was performed.
As a result, a DTM (digital terrain model), DSM (digital surface model) and nDSM (normalized digital surface model – elevation map) are provided as individual Geotiff rasters with a spatial resolution of 0.25 m (an example shown in Fig. 3). The provided Lidar dataset includes flight strip data (including amplitude, reflectance, pulse width) from the Riegl LMS Q-780 in las-format as well as a mosaic of all co-registered *.laz lines and 1000 m × 1000 m tiles.
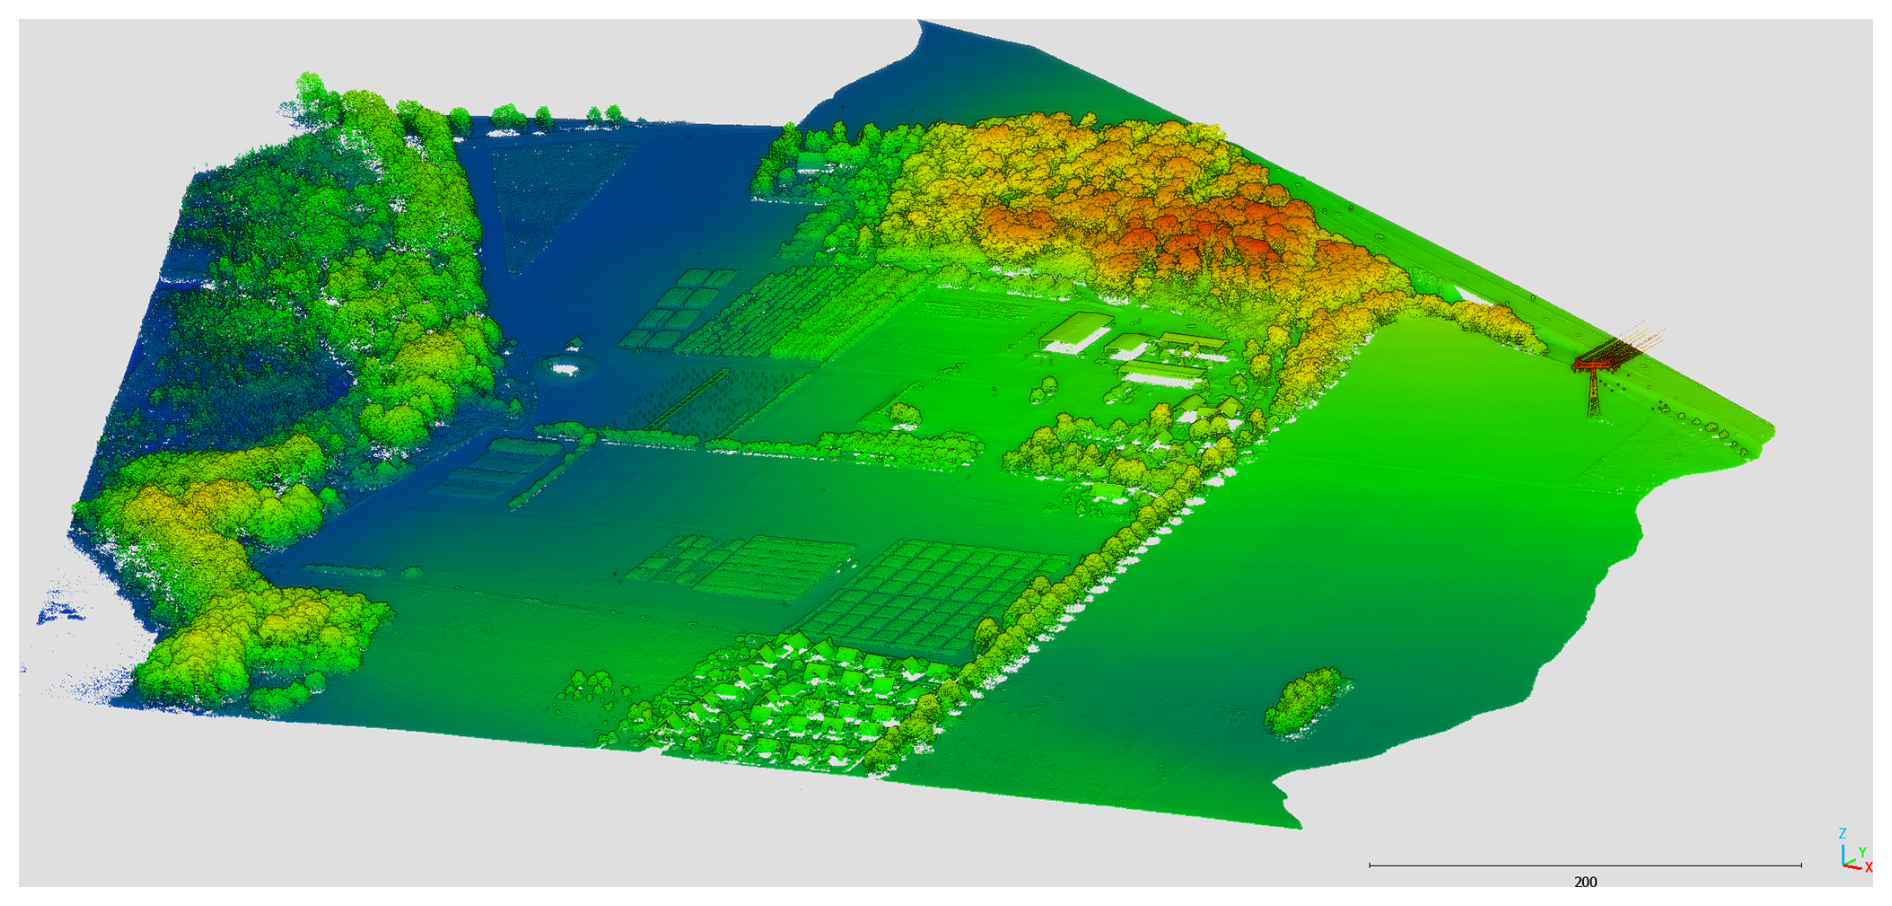
Figure 3Illustration of the Lidar data as a height-colorized point cloud, with focus on the western area of PoSMO (14 of 16 stations included), retrieved on 5 September 2024; view from Southeast.
3.10 Land use, cropping and irrigation
The neutron counts recorded by CRNS are influenced by hydrogen contained in vegetation. Likewise, remote sensing algorithms require information on biomass for calibration. To support a comprehensive comparison between remote sensing products and CRNS measurements and enable a more detailed analysis, we provide auxiliary information on crops grown (e.g., winter wheat, maize, alfalfa, sunflower) on the experimental plots at the fenced ATB site and the associated sowing and harvest dates. These data, supplied by the ATB, complement the airborne Lidar dataset and improve the characterization of above-ground hydrogen pools for future CRNS analyses.
Several crops, including potatoes, maize, and spring wheat, received irrigation during summer. The orchards (cherry, apple, strawberries, wine grape) and blueberry plantations were also irrigated routinely during spring and summer. All irrigation events (plots, date, amount) are included in the dataset.
3.11 Snow cover campaign winter 2025
Snow cover at the research site is infrequent, with substantial continuous snow cover during several days typically occurring every 2–3 years. However, its occasional presence significantly influences the vertical soil water balance, and affects the interpretation of CRNS signals. Additionally, the surface's spectral characteristics are either completely masked or modified, making comprehensive documentation of snow cover periods essential for remote sensing applications.
For the presented time span, three periods with persistent snow cover occurred: 16–21 January 2024, 10–14 January 2025, and 13–21 February 2025 (end of periods ± 0.5 d), each of them with a few centimeters of snow depth. For the third period (mid-February 2025) with depths reaching a maximum of 6 cm, a sampling campaign was conducted. We recorded the temporal progression of snow cover using a stationary wildlife camera (SECACAM HomeVista, VenTrade GmbH, Köln, Germany) capturing images. The spatial distribution and properties of the respective snow cover were mapped using UAV-based RGB imagery with a Mavic Pro (Da-Jiang Innovations Science and Technology Co., Ltd, China) from a survey flight at 100 m flight altitude. The imagery was mosaicked using Photoscan software (Agisoft LLC, St. Petersburg, Russia) and geo-referenced to 20 cm orthophotos provided by the Federal State of Brandenburg, producing an RGB image with 3 cm ground resolution. Additional manual snow sampling involved 240 measurements of snow depth using a ruler and 10 density measurements obtained either through cylinder cores or by collecting all snow from a specific area for subsequent weighing in the field.
3.12 Groundwater and lake levels
Groundwater levels data complement soil moisture observations as they capture the subsurface response to recharge and storage changes, linking surface and vadose zone dynamics with aquifer behavior. The depth to the groundwater table at the western area of PoSMO increases from very shallow near the lake in the west towards approximately 10 m below ground in the east of the field site and water levels have been monitored in two wells along the slope (see Fig. 2). Additionally, between September 2022 and January 2025 the lake level was monitored. The upslope well is located in the vicinity of CRNS station #22 approximately at the middle of the hillslope (ground elevation 36.17 m a.s.l.), the downslope well close to CRNS station #2 (31.14 m a.s.l.) and the lake level is observed in a peripheral ditch in the vicinity of the same CRNS station. The well pipes of 63 mm diameter have a length of 2, 4 and 6 m for the lake, well #2 and well #22, respectively. They are screened over a length of one meter at the lower end, and pressure sensors (Hobo U20L, Onset, Bourne, USA) were installed to record pressure and temperature at a 30 min interval. In well #22, an additional sensor recorded air pressure and temperature but had to be removed because of sensor failure in May 2024. To correct for air pressure variations after this time, air pressure recorded at the CRNS sensors were utilized. Regular manual measurements of the groundwater heads were used to validate the continuous measurements and exclude a drift in the pressure sensor measurements. Starting in September 2023, groundwater was pumped regularly for sampling stable water isotopes (see Sect. 3.13). The periods with artificial drop in water table resulting from this sampling were excluded from the data set.
3.13 Stable water isotopes in soil and groundwater
Stable water isotopes (δ2H and δ18O) are widely used as natural tracers of water transport processes in the critical zone and across scales (Sprenger et al., 2019; Scandellari et al., 2024). Tracking the isotopic signature of precipitation through the soil profile enables qualitative and quantitative assessment of the timing and spatial variability of infiltration and percolation, and, together with soil moisture data, provides estimates of groundwater recharge (Canet-Martí et al., 2023; Wang et al., 2023; Koeniger et al., 2016). To qualitatively assess vertical percolation rates and their spatial heterogeneity within PoSMO, we conducted three field campaigns under contrasting hydrological conditions. In May 2023, during dry soil conditions, profiles at locations #2 and #22 were sampled on 24 May, and at locations #21 and #11 on 26 May; groundwater was sampled subsequently on 31 May. No rainfall occurred between these dates, ensuring consistent conditions across sampling sites. In January 2024, following several days of snowfall and subsequent snowmelt, soil profiles at locations #2 and #22 were sampled on 25 January, and at #21 and #11 on 26 January, with groundwater sampled on the same day. In each campaign, bulk soil samples were collected along the hillslope at four locations (#2, #11, #21, and #22, see Fig. 2), covering the full soil depth from 0 to 150 cm at 10 cm intervals. To capture deeper infiltration of the January 2024 snowmelt, soil and groundwater samples were collected at all locations on 2 May 2024, and profiles at locations #21, #22, and #11 were extended to 200 cm for additional sampling. Groundwater isotopes were analysed from piezometers at locations #2 and #22, with additional samples collected opportunistically between May 2024 and May 2025, generally about once per month. During sampling, soil samples were sealed in Ziploc bags (S. C. Johnson & Sons Inc., USA) to minimize evaporative losses and groundwater samples were stored in 10 ml vials. All samples were refrigerated until transport to the isotope laboratory of BOKU University in Vienna (Austria) for analysis of δ2H and δ18O (Stumpp et al., 2018). In the laboratory, soil water isotopes were determined using the direct-equilibration method (Wassenaar et al., 2008). The isotopic ratios of the vapour of the soil samples as well as the isotopic ratios of the groundwater samples were determined using a Picarro L2130-i laser isotope analyser (Picarro Inc., Sunnyvale, USA). The isotopic ratios of all samples are expressed in δ‰ units, which describe the relative difference in the ratio of heavy to light isotopes in a water sample with respect to VSMOW (Vienna Standard Mean Ocean Water). To better interpret the isotopic signature profiles of the water, the volumetric moisture content of the soil samples was also calculated. To do this, the gravimetric moisture of the samples was multiplied by soil bulk density (ρb), using average values by depth as measured earlier for these locations (Heistermann et al., 2023).
3.14 Soil saturated hydraulic conductivity in the root zone
Saturated hydraulic conductivity (Ksat) governs water flow through soil and controls key processes such as infiltration, percolation and groundwater recharge, affecting both surface and subsurface hydrology. In unsaturated flow situations, Ksat is also important, as it can be used in the estimation of unsaturated hydraulic conductivity curves (Durner, 1994; Hohenbrink et al., 2023). Due to spatial variability in soils, laboratory measurements on small soil cores often fail to represent field-scale conditions, a limitation highlighted in recent studies (Weber et al., 2024). Field measurements of Ksat, by contrast, are considered to integrate over larger volumes, capturing effects of macropores and heterogeneities, and thus more accurately reflect the hydraulic response of natural soils (Reynolds et al., 2000). Because PoSMO targets larger-scale soil moisture and hydrological processes, we conducted field measurements of Ksat to assist in the assessment of water fluxes at the site.
Ksat was determined using a constant head permeameter (a so called Amoozemeter), which measures infiltration rates within an auger hole. During measurement, a constant hydraulic head was maintained in the hole while monitoring the infiltration rate until steady-state flow was achieved. Ksat was then calculated using the Glover equation (Amoozegar, 1989). A total of 28 measurements were conducted across different land uses, including grassland, orchards (cherry, berry, and apple trees), arable crops, and hazelnut hedges. Measurements were performed at depths of 12.5, 20 and 35 cm in eight soil profiles, with four of these profiles additionally sampled at 50 cm depth, following the methodology described by Elrick and Reynolds (1992). Data were collected between 6 January 2023 and 7 June 2024 under different wetness conditions.
3.15 Electrical Resistivity Tomography (ERT) Surveys
Two Electrical Resistivity Tomography (ERT) surveys were conducted to provide a first overview of the deeper subsurface conditions at the western area of PoSMO. The results can provide information about stratigraphic layering and inhomogeneities as well as the approximate groundwater table depth, helping to understand variations in surface soil moisture patterns. We used a Syscal ISIS system with 48 electrodes (IRIS Instruments, Orléans, France) along two perpendicular profiles: Profile 1 (A–A′) with 5 m electrode spacing (235 m total length) and Profile 2 (B–B′) with 2.5 m spacing (117.5 m total length; see Fig. 2) using a Wenner array. Electrode positions including absolute elevations were recorded with a Differential Global Position System (dGPS) antenna (Leica Zeno GG04, Leica Geosystems AG, Heerbrugg, Switzerland) for topographic correction of the resistivity data. The raw data sets from 16 November 2022 were imported and filtered in ProSys II (IRIS Instruments, Orléans, France). The apparent resistivity pseudo section was inverted in two dimensions using the open source GUI ResIPy (Blanchy et al., 2020) on a fine triangular mesh with convergence reached within two iterations.
3.16 CRNS stations with long-term operation
A subset of PoSMO had been operated as a smaller CRNS cluster at the ATB site Marquardt since 2019 (Heistermann et al., 2023). Some of its CRNS stations were sustained, shallow point sensors added and integrated as part of the newly established PoSMO design. These are CRNS stations marked with bold IDs in Table 2, and the same holds for the accompanying soil moisture profile measurements. Thus, these stations provide time series from 1 September 2019 to 14 October 2025. For convenience of data users interested only in this longer term data set, it is provided additionally as separate data files. The first three years of these time series are based on neutron count rates and profile measurements as provided in Heistermann et al. (2023). These data together with the more recent data, as a complete neutron count time series, were consistently processed, corrected and calibrated according to Sect. 3.1.2 for CRNS and as described in Sect. 3.3 for the soil moisture profiles.
The following subsections describe datasets provided by third parties, either previously published or available through other sources. They are required to process CRNS data or create maps and introduced here shortly for reference and user convenience.
4.1 DWD/ATB weather station
A climate station equipped with a heated tipping-bucket rain gauge is situated in the north-eastern part of the ATB site, as depicted in Fig. 2. The station records standard climate variables at an hourly resolution, including air temperature, relative humidity, precipitation, soil temperature at multiple depths (5, 10, and 30 cm), and solar irradiation, as well as wind speed and direction. The original data are publicly accessible via https://www2.atb-potsdam.de/Technologygarden/bsa_wetter.aspx (last access: 1 September 2025). While not part of the primary dataset, this dataset offers valuable complementary information that may assist readers in interpreting the presented observations. The ATB operates another climate station at their main site in Potsdam-Bornim, located about 5 km south of PoSMO, and this data is also available online at https://www2.atb-potsdam.de/Technologygarden/atb_wetter.aspx (last access: 1 September 2025). The nearest climate station operated by the Deutscher Wetterdienst (DWD) is located at Telegrafenberg in Potsdam, approximately 12 km south-east (station ID 03987). The corresponding data are publicly available through DWD's open data repository (DWD, 2025).
4.2 Incoming Neutron Flux
The incoming cosmic-ray neutron flux is provided by the Neutron Monitor Database at http://www.nmdb.eu (last access: 14 October 2025). In accordance with previous studies by Hawdon et al. (2014); Baatz et al. (2015); Jakobi et al. (2018); Baroni et al. (2018), the Jungfraujoch (JUNG) neutron monitor is recommended for correcting the incoming neutron flux at PoSMO. Recent approaches account more explicitly for the geomagnetic cut-off rigidity and shielding depth of the atmosphere at the measurement site in relation to different neutron monitors of the data base and promise to be more accurate (McJannet and Desilets, 2023).
4.3 Other spatial data and maps
A digital elevation model (DEM) with a resolution of 1 m × 1 m is available for download from the Landesvermessung und Geobasisinformation Brandenburg (LGB) website at https://geobroker.geobasis-bb.de (last access: 1 September 2025), with an accuracy of 30 cm. Additionally, a soil map from the state of Brandenburg, BUEK300 (Kühn, 2002), provides soil types and texture data beyond the PoSMO area at a scale of 1:300 000 and is publicly accessible through the Brandenburg Geoportal at https://geoportal.brandenburg.de (last access: 1 September 2025). For fieldwork and visualization purposes, we utilized OpenStreetMap data layers, which are available for download from the Geofabrik website at http://download.geofabrik.de (last access: 1 September 2025). Specifically, we employed the land use, waterways, and traffic ways data layers (OSM data OpenStreetMap contributors, 2025, distribution under ODbL license).
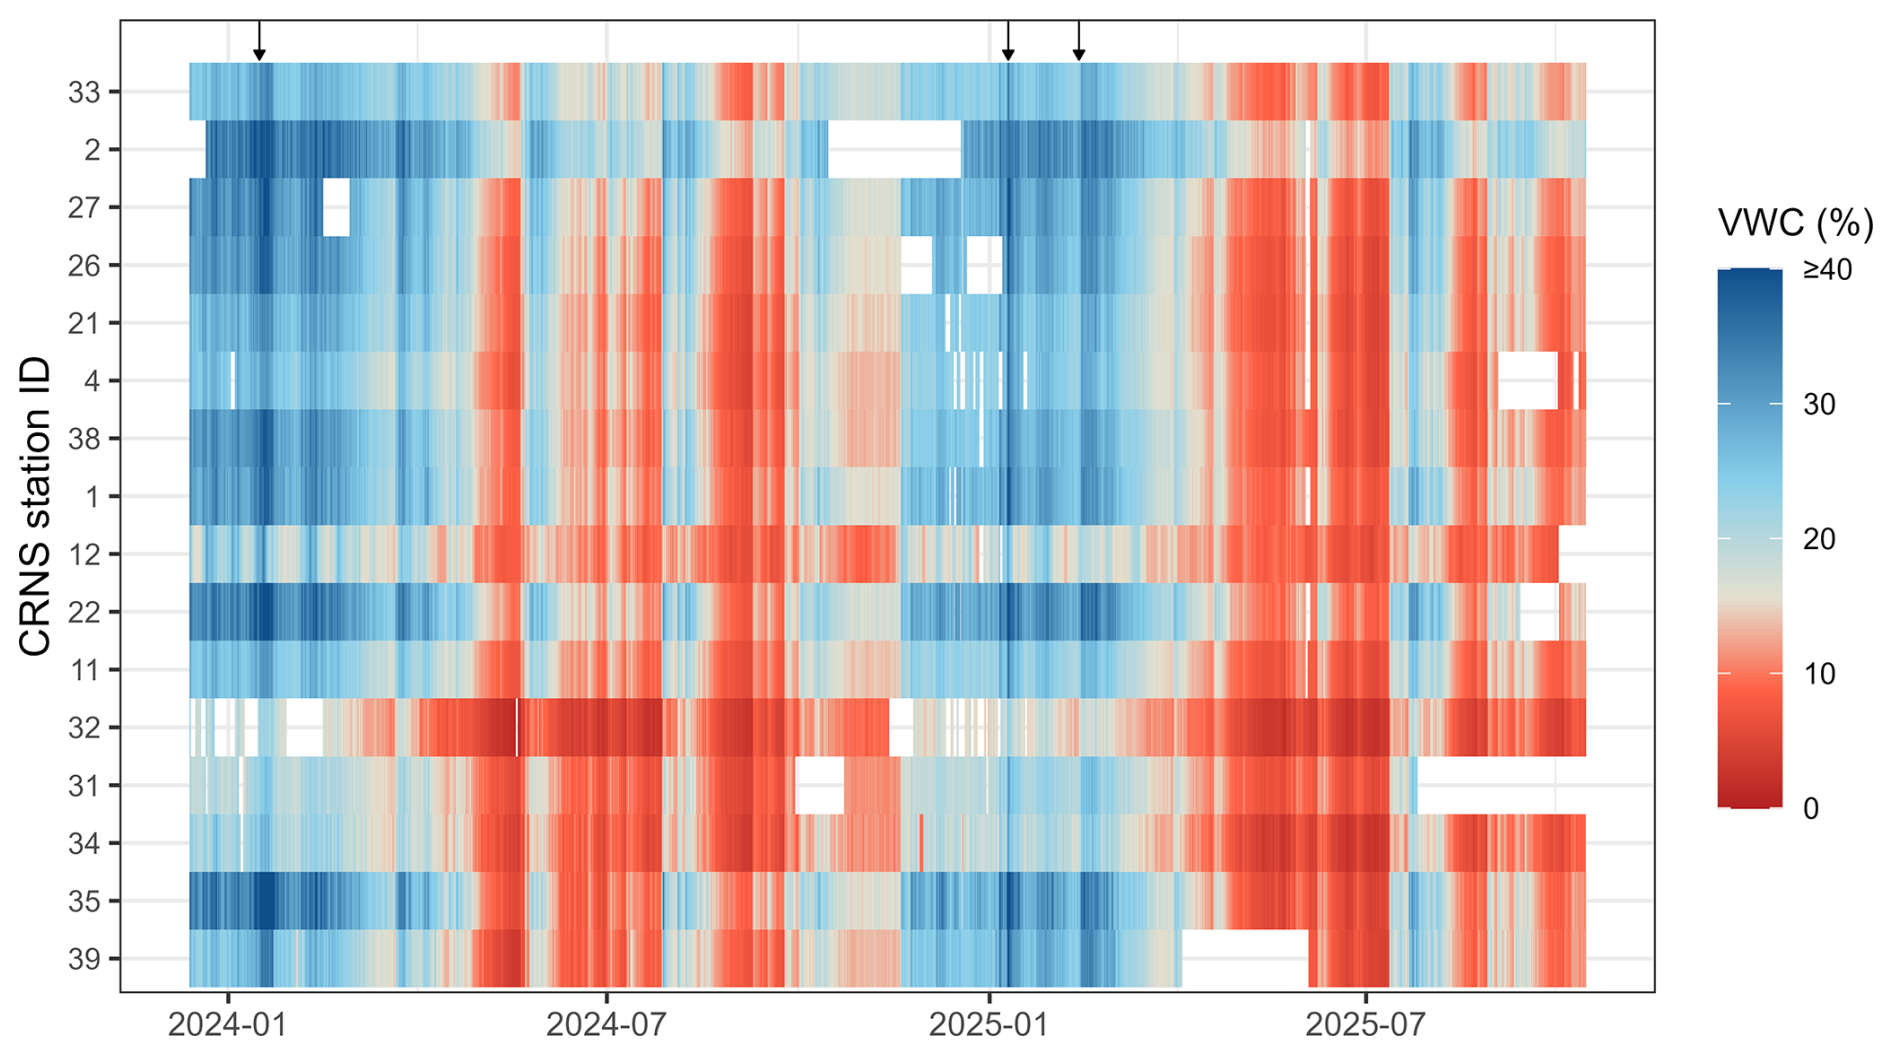
Figure 4CRNS-derived daily volumetric water content (VWC) time series of PoSMO, arranged from west to east according to station positions. Arrows above the time series indicate periods of snow cover, which influence neutron counts and can lead to an apparent increase in retrieved soil moisture.
5.1 Examples of CRNS-derived root-zone soil moisture
The data set presented and described here can contribute to understand soil moisture spatial patterns and related soil moisture dynamics at the plot- to landscape-scale, especially within the top decimeters of soil. However, the merit of the PoSMO data goes beyond that, as these data close the spatial gap between point observations – or even soil moisture in-situ networks – and larger scale observations and modeling. In particular, remote sensing can use the data as reference for soil moisture related products, because they provide especially high representativity compared to other mixed-land use reference sites used for calibration and validation. For this purpose, PoSMO was established at the km2-scale (which corresponds to the typical resolution of current hydrological or also land-surface models). Thus, suitable grid cells of remote sensing products or distributed land surface models could be adequately compared, assimilated or used for validation, as has been done with stand-alone CRNS already (e.g., Baatz et al., 2017; Fatima et al., 2024). Figure 4 presents a comprehensive overview of the soil moisture time series data from December 2023 to October 2025. The temporal dynamics of the 16 locations exhibit consistent patterns over time, but also differences in soil moisture across the site are evident in respect to absolute values as well as dynamics. As a simple way of ordering, the CRNS stations have been listed according to their position, from west to east. This heat map reveals five major dry spells (occurring in summer 2024 and summer 2025, with CRNS soil moisture below 15 % for all stations) and long wet conditions during winter including one snow cover period in January 2024 and two snow cover periods in January to February 2025 (see also Sect. 3.11).
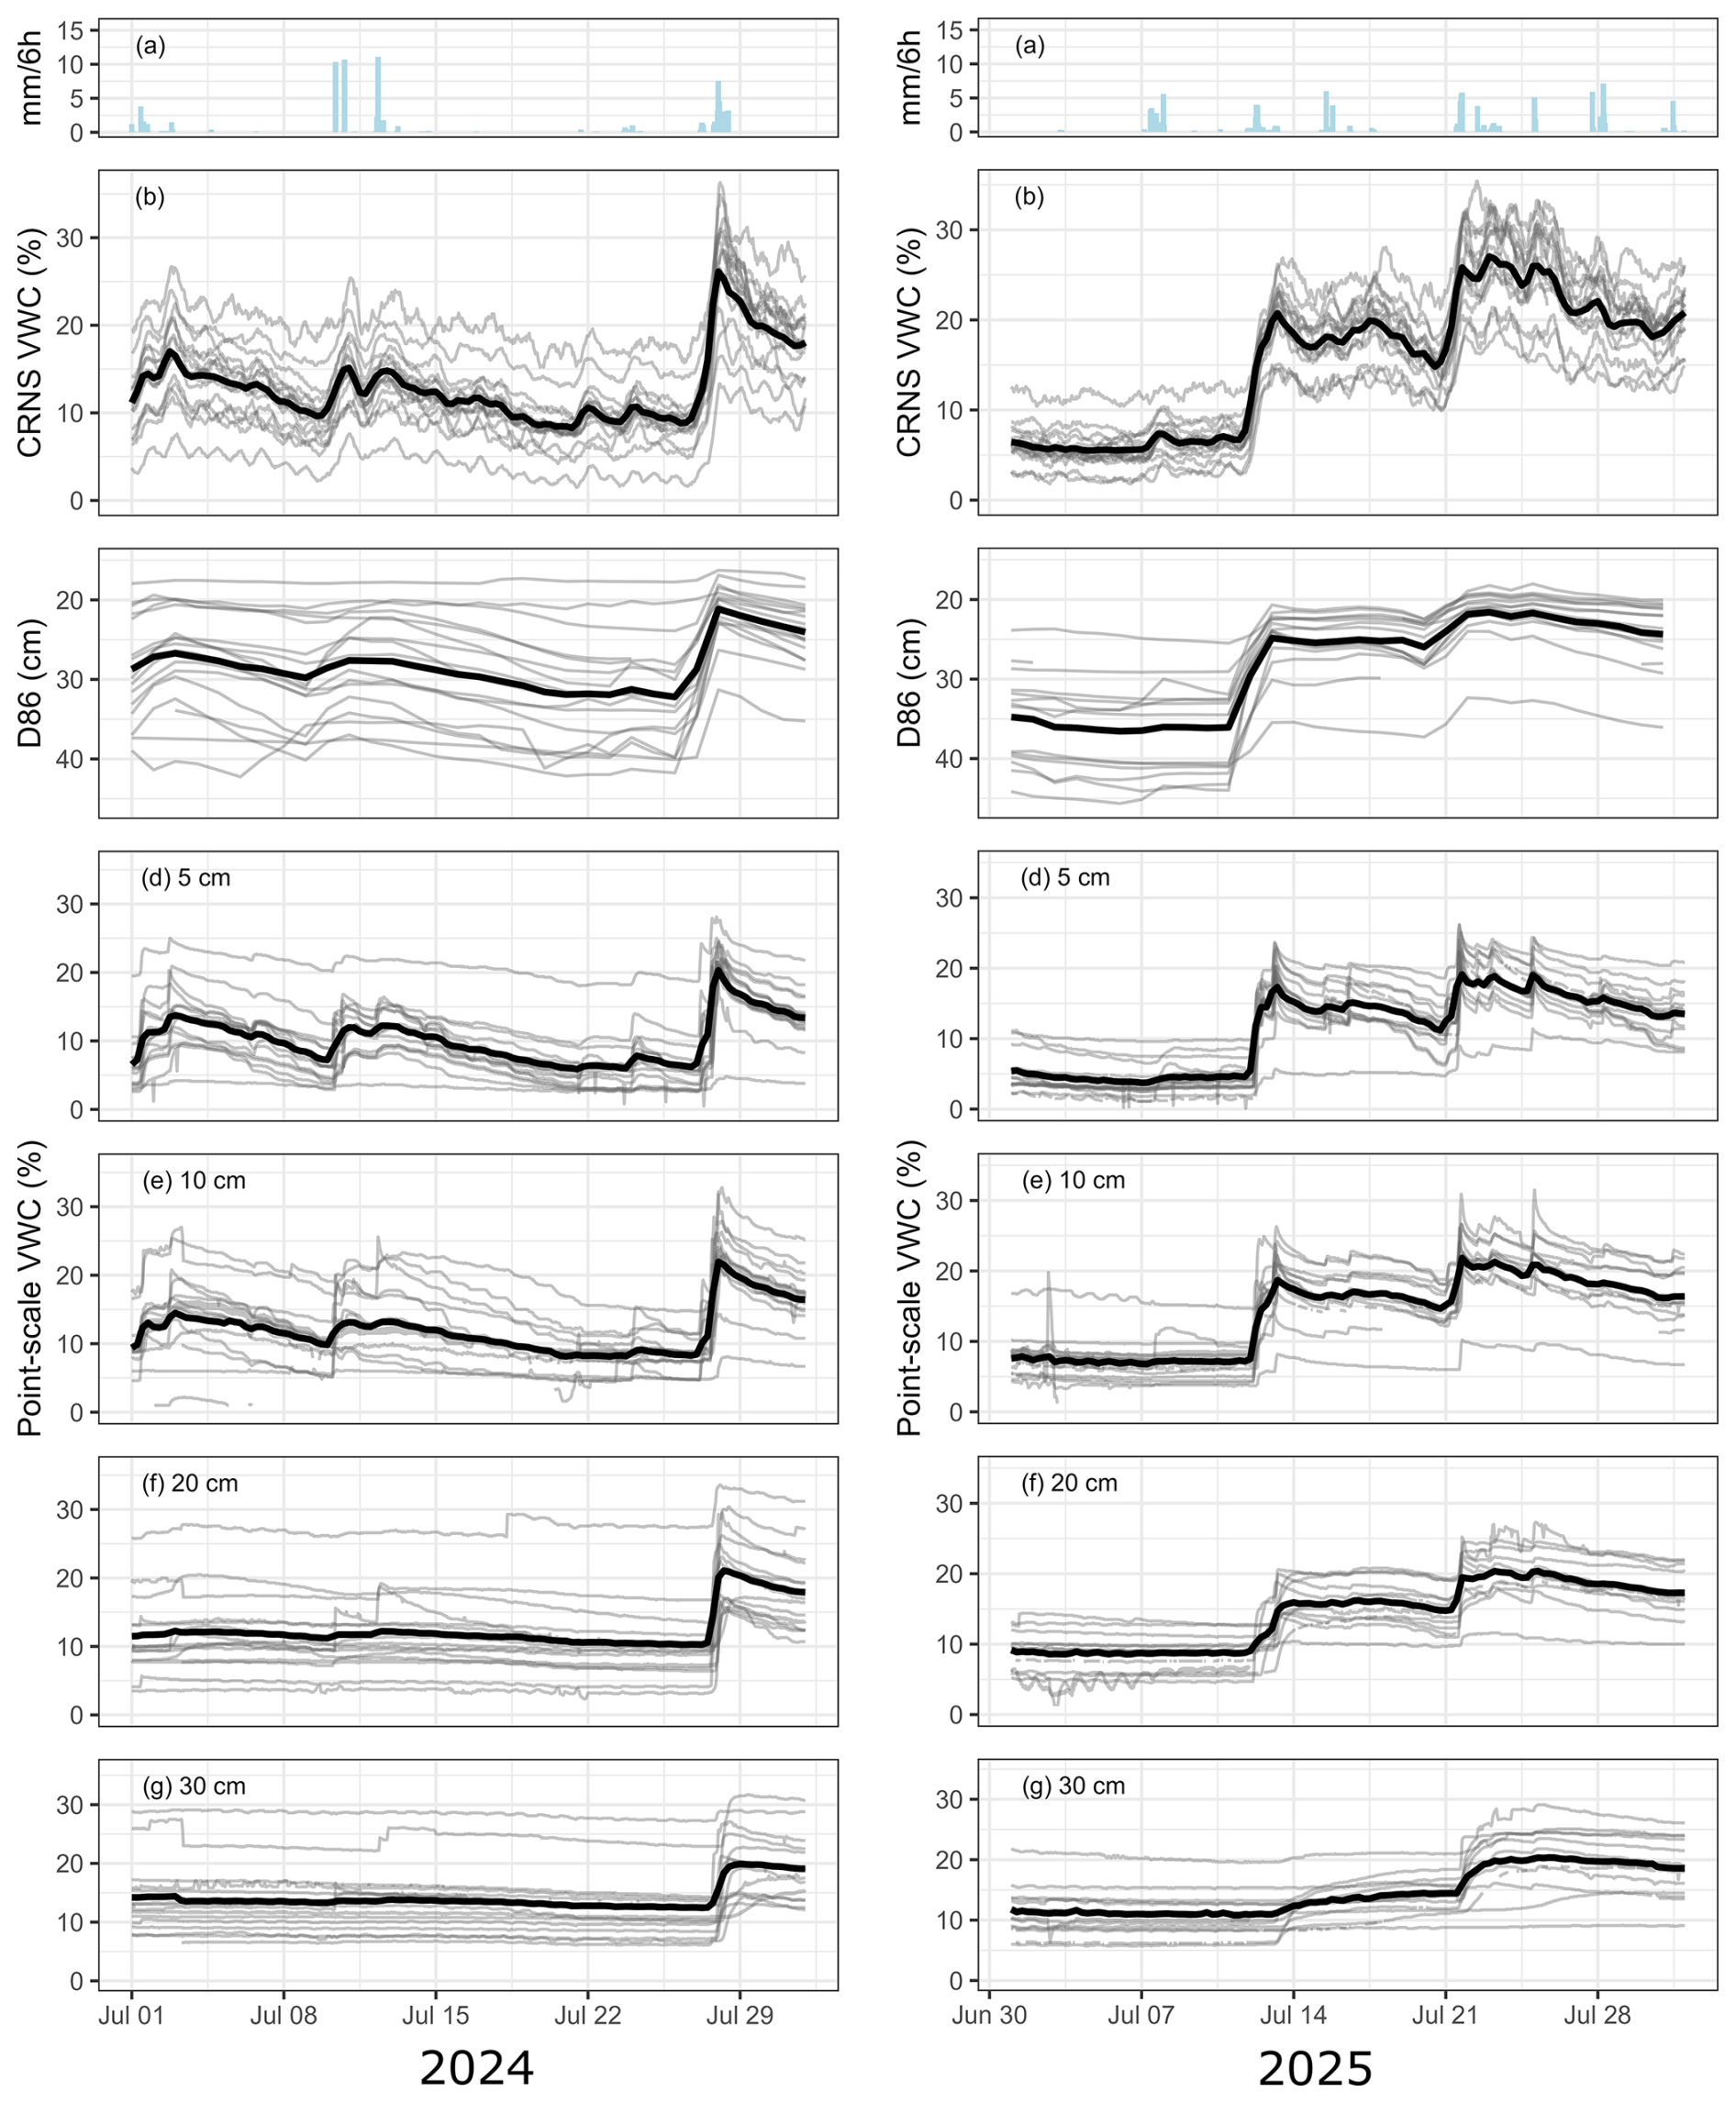
Figure 5 Exemplary view of soil moisture dynamics in July 2024 and July 2025. (a) Precipitation amount in mm per 6 h from DWD climate station in Potsdam, (b) CRNS-derived volumetric water content (VWC) representing RZSM (with a 6 h moving average) (c) Estimated daily D86-integration depth of CRNS observation based on the independently measured point-scale soil moisture profiles (d–g) VWC derived from point-scale dielectric sensors at 5 to 30 cm depth. Grey lines are measurements at individual stations, the bold line represents the arithmetic mean of the whole sensor cluster.
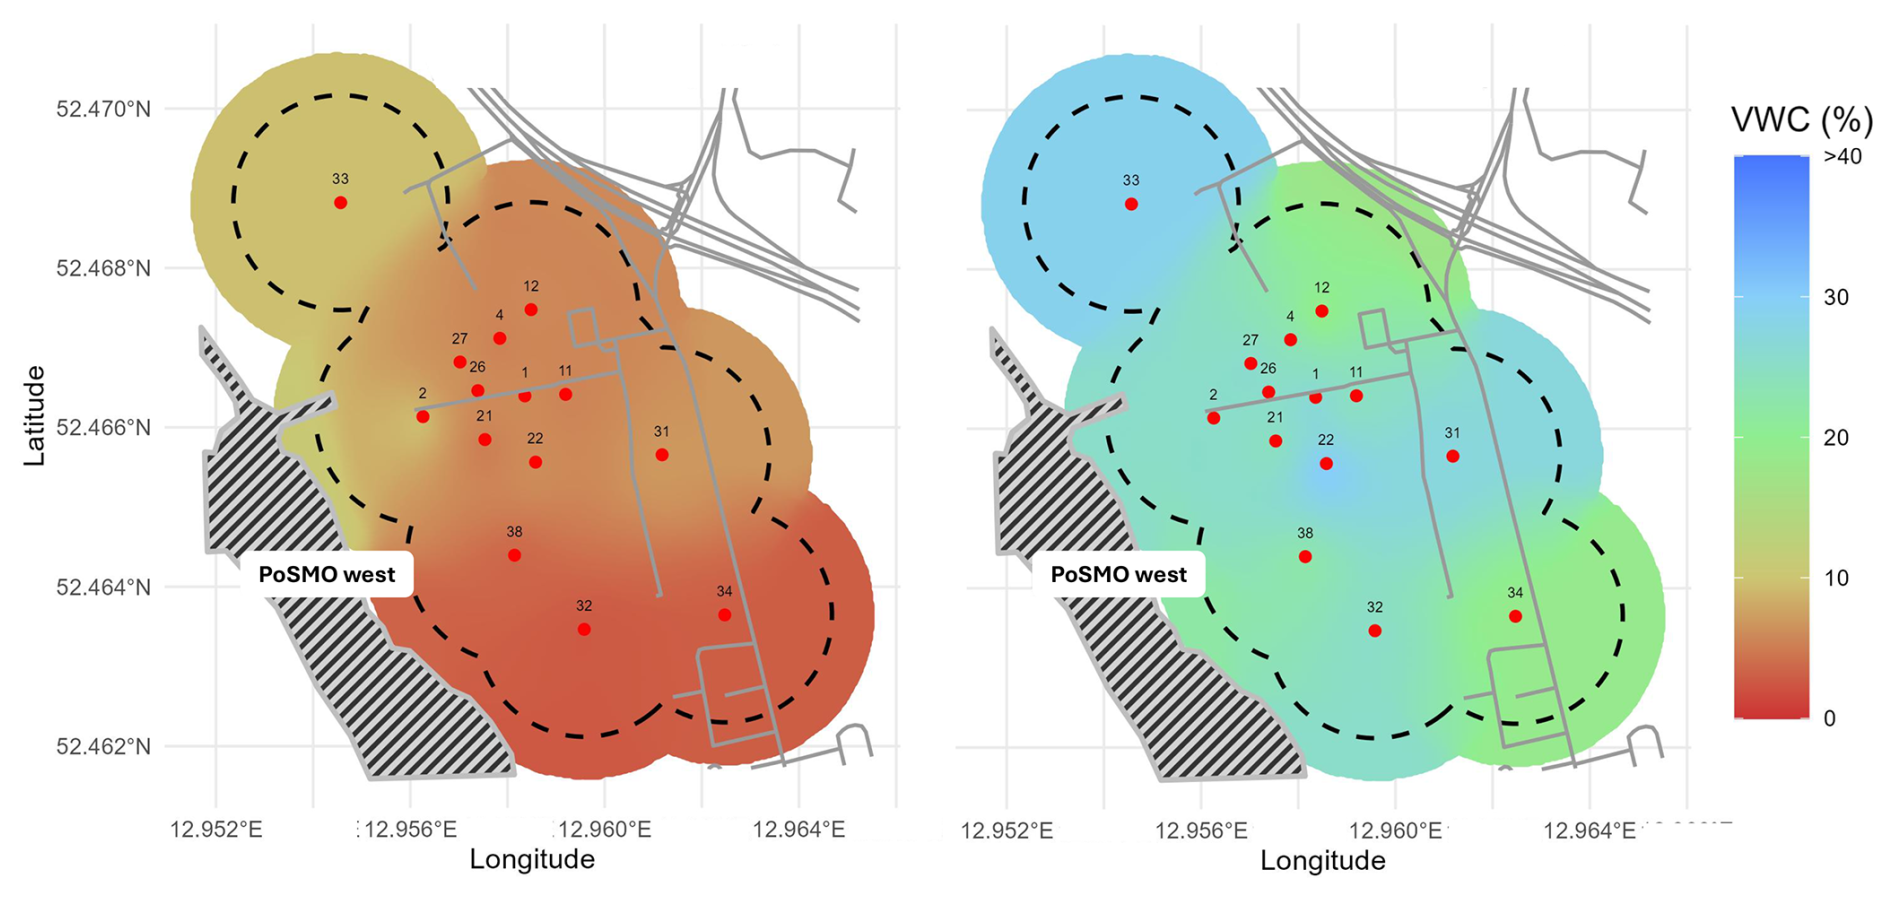
Figure 6Root-zone soil moisture maps from CRNS-derived soil volumetric water content (VWC) attributed to the CRNS station locations in the western area of PoSMO (cf. Sect. 3.1.1), shown for a day during a dry period in September 2024 (left) and for a relatively moist day after autumn rewetting in November 2024 (right). Dashed circles illustrate the area circumference covered, based on a 150 m footprint radius for each CRNS sensor. VWC was interpolated onto a 2 m grid (details see text). Map data based on OpenStreetMap (© OpenStreetMap contributors, 2025, distribution under ODbL license).
Figure 5 illustrates the soil moisture dynamics of CRNS sensors and dielectric sensors as a response to rainfall, exemplarily for July 2024 and July 2025. Inherent to the non-invasive measurement the effective integration depth (D86) of CRNS-sensors varies to some degree with soil moisture, for these two summer months between about 20 and 40 cm, and stays around 30 cm as mean across the CRNS cluster (panel c), while CRNS-derived VWC values ranged between about 5 % and 25 % . The D86-estimate presented here is derived from the independently measured point-scale soil moisture profiles (all sensing depths) rather than from CRNS-derived soil moisture alone. The depth weighting procedure for point-scale data is described in detail by Schrön et al. (2017) and involves an iterative estimation of point-scale average VWC, effective sensing depth D86 and CRNS apparent soil moisture (see their Sect. 2.3). By explicitly accounting for the shape of the soil moisture profile (and all sensing depths), our approach addresses an an important control on CRNS-derived soil moisture estimates (Baroni et al., 2018), which is not captured when relying solely on CRNS-derived soil moisture values (cf. Appendix A in Schrön et al., 2017). Due to small-scale heterogeneity and uncertainty in quantitative estimates from the dielectric sensors, however, the daily estimate of the integration depth based on a single soil moisture profile might not be fully representative for the respective CRNS footprint. During the full time frame and across all PoSMO stations, the effective integration depth estimates varied between 15 and 46 cm (on average 25 cm). This illustrates the representativeness of CRNS for root-zone soil moisture (RZSM). While the overall dynamics of the CRNS-derived soil moisture time series is most comparable to those of the 5 and 10 cm soil layers (Fig. 5), the CRNS measurements have a higher responsiveness to small rainfall inputs, as CRNS is also detecting soil moisture in the soil layers shallower than 5 cm, which cannot reliably be captured with point-scale sensors. Additionally, the range of absolute values of both CRNS- and dielectric sensors for any given time suggests that there is considerable spatial heterogeneity, which calls for spatially aggregating measurement methods such as CRNS. A fair and direct comparison between CRNS-derived and point-scale soil moisture can be achieved either by vertically “unweighting” the CRNS data, to make it comparable to a depth-averaged soil moisture profile (Scheiffele et al., 2020), or by applying depth scaling methods such as the exponential filter (Franz et al., 2020; Rasche et al., 2024), which can interpolate the different soil moisture data to the same nominal depths.
The spatial distribution of CRNS soil moisture is shown exemplarily in Fig. 6 for 8 September and 24 November 2024 during relatively dry and moist conditions, respectively. Spatial interpolation on a 2 m grid shows an initial impression of the soil moisture distribution for specific days. For this visualization only, inverse distance weighting was applied, treating each CRNS station as a point measurement. However, due to the large horizontal footprint of CRNS, more robust interpolation approaches should account for the sensors' horizontal sensitivity, as demonstrated in Heistermann et al. (2021).
Soil moisture estimates derived from CRNS data are susceptible to several sources of uncertainty, including corrections on neutron counts and the influence of hydrogen contained in vegetation. These effects are only implicitly included in the soil moisture product provided here through the local calibration procedure (Sect. 3.1.2 and 3.2). Consequently, the soil moisture product presented in this dataset should be regarded as an estimate that can be further refined as correction approaches advance. For example, the most recent method for correcting the incoming neutron flux by McJannet and Desilets (2023) scales the dynamics of the neutron monitor time series to the theoretical dynamics at the CRNS site using the geomagnetic cut-off rigidity and shielding depth of the atmosphere. This approach has been shown to outperform earlier methods by Zreda et al. (2012) and Hawdon et al. (2014), as demonstrated in Schrön et al. (2024); Hertle et al. (2025); McJannet et al. (2025). Likewise, a more explicit consideration of biomass and its temporal dynamics could reduce biases and improve the robustness of CRNS soil moisture estimates (Jakobi et al., 2022), and recent research suggests that combined measurements of epithermal and thermal neutron detectors may even allow biomass estimation (Brogi et al., 2025). Nevertheless, the CRNS-derived soil moisture provided here constitutes a valid and representative estimate of root-zone soil moisture, including the most dynamic soil-plant-atmosphere interactions (root density typically highest within the upper 40 cm of the soil profile (Schenk and Jackson, 2002)) and thus the zone of strongest temporal variability in soil moisture and water fluxes.
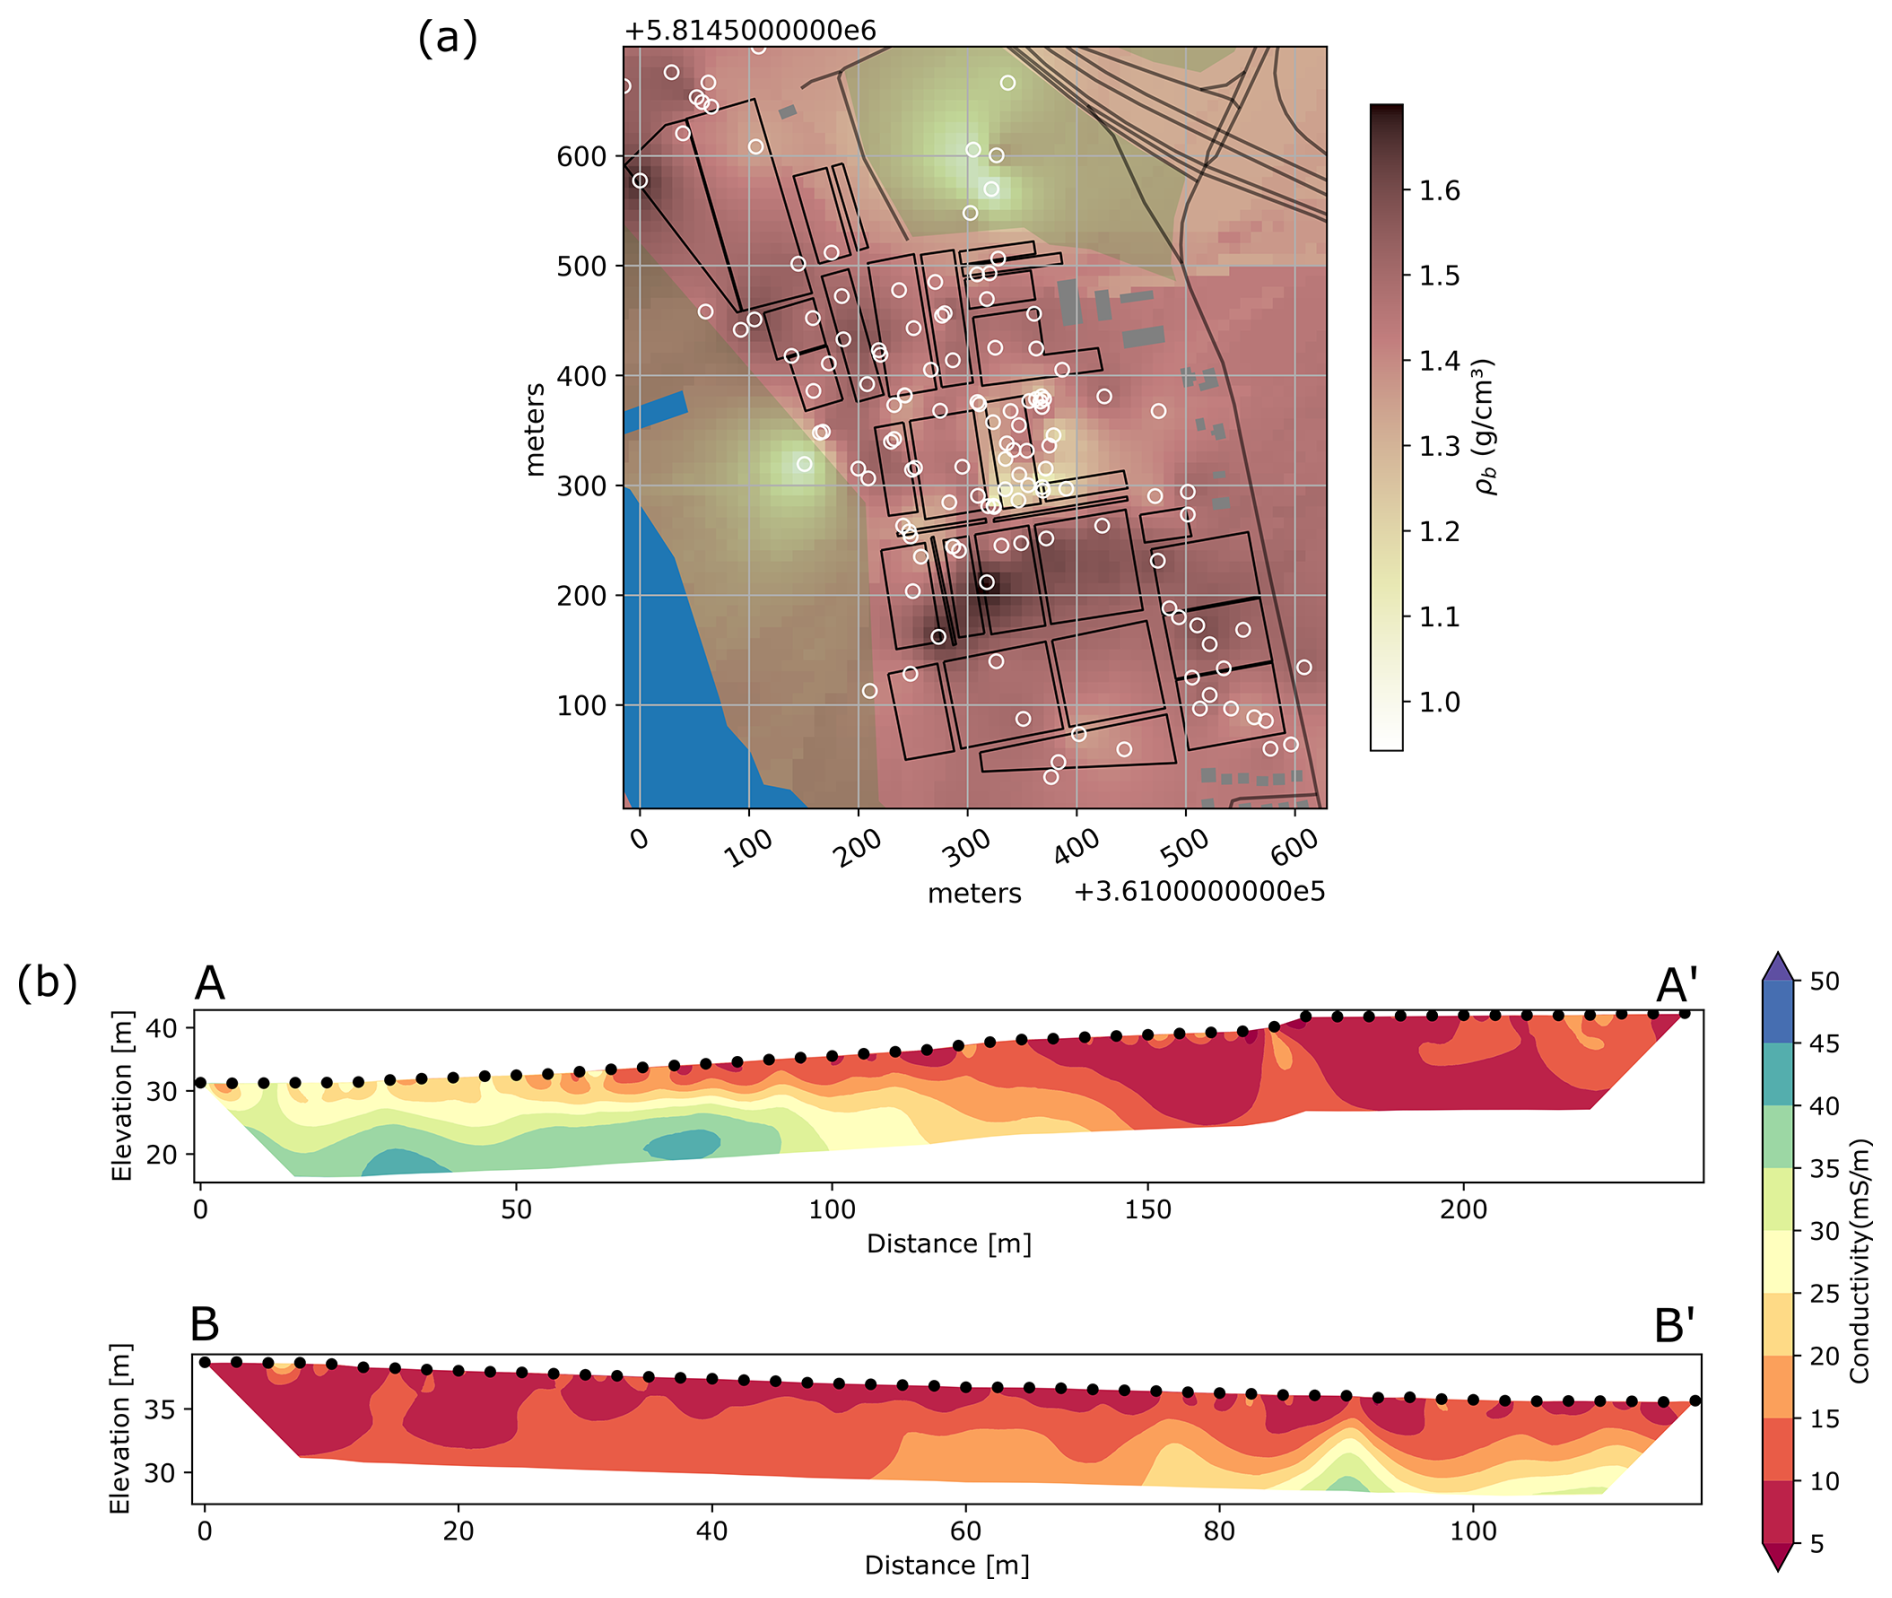
Figure 7(a) Average soil dry bulk density (g cm−3) in the top 30 cm of the soil, across the western area of the Potsdam Soil Moisture Observatory; the spatial distribution was obtained by Ordinary Kriging (exponential variogram with a range of 50 m). Map data based on OpenStreetMap (© OpenStreetMap contributors, 2025, distribution under ODbL license). (b) ERT profiles of electrical conductivity in two transects at the hillslope part of PoSMO (A–A′ from west to east, B–B′ from north to south, see Fig. 2).
5.2 Examples subsurface properties
Soil bulk density information is important for calibrating dielectric soil moisture sensors and within the functions to transfer neutrons to soil moisture (Sect. 3.2). Extensive measurement efforts at the experimental site allowed to generate interpolated maps of bulk density distribution for the top soil layer, as shown in Fig. 7a, revealing some local variations across the site, though larger parts have similar values.
A small case study assessed the impact of agricultural practices on temporal variation of bulk density by sampling soil before and after harvest at one of the larger agricultural fields. No significant effect was detected: bulk density did not differ significantly before and after harvest or tillage (Tukey's test, α=0.05). Given the absence of detectable temporal changes, all measurements were merged into a single dataset. Based on 152 soil cores, bulk density values ranged from 1.10 to 1.47 g cm−3, with a mean of 1.30 g cm−3 and a standard deviation of 0.12 g cm−3.
Figure 7b shows the first results of the ERT survey at the field site (see Sect. 3.15 and locations of cross sections in Fig. 2). The zones of highest electrical conductivity shown in the inverted pseudsections approximately coincided with the depth of the groundwater table, as indicated from the monitoring wells (Sect. 3.12). Inferring deeper soil water storage from conductivity patterns would require time-lapse ERT measurements and/or higher-resolution shallow surveys, combined with independent calibration using profile soil moisture data.
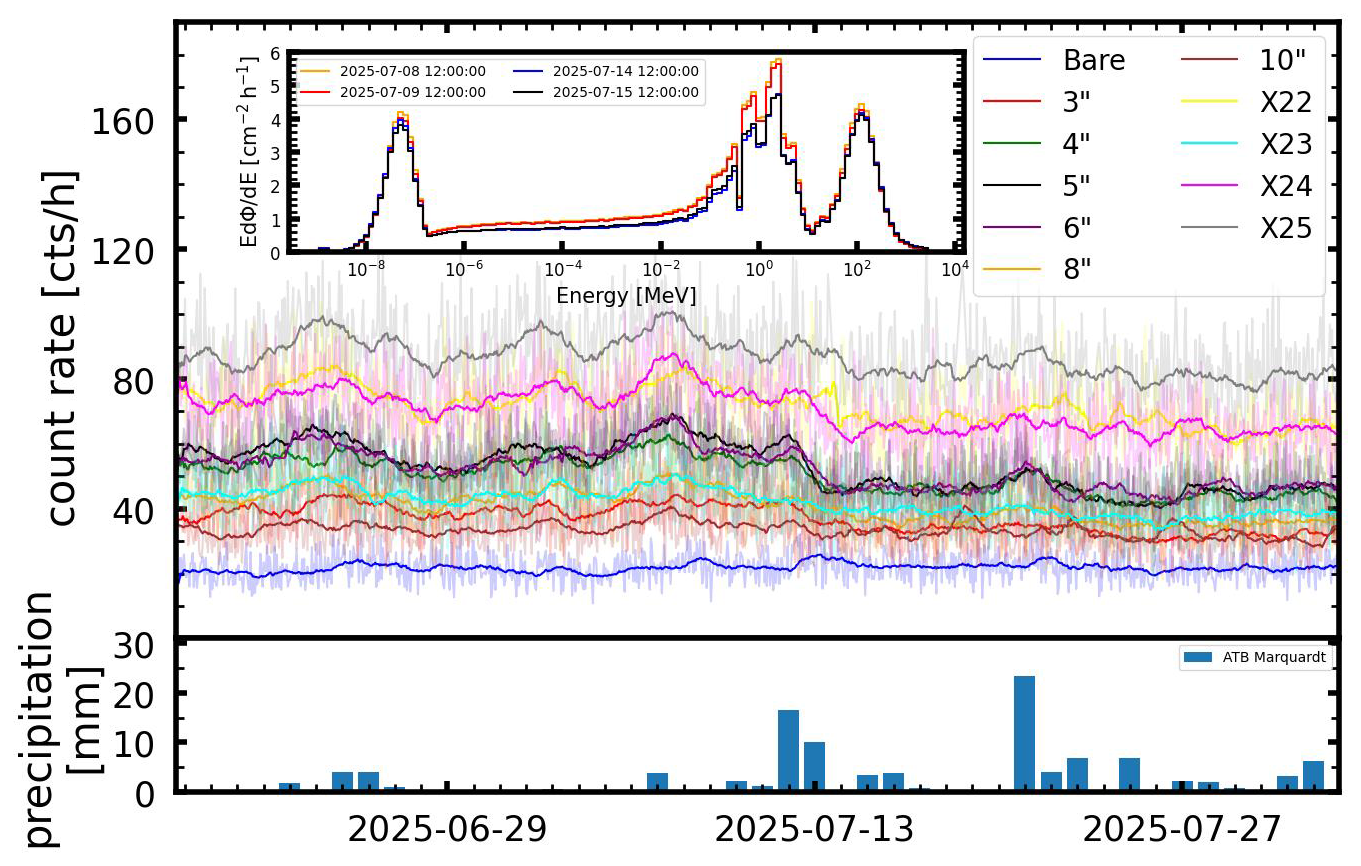
Figure 8Neutron count rates of the extended range BSS system for different sphere sizes (moderators) and thus neutron energy ranges (top panel), along with the precipitation records at the site (bottom panel). Inlet graph in the top panel shows exemplarily unfolded neutron spectra on two days before and two days after the rain event on 12 and 13 July 2025, as recorded on site.
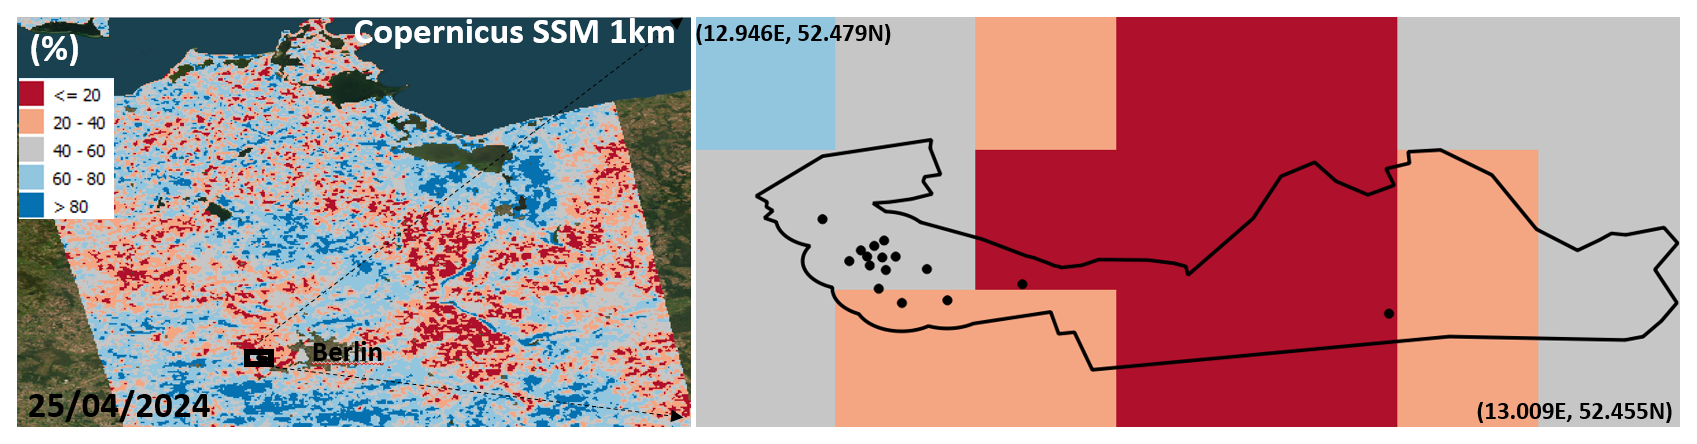
Figure 9Example of Copernicus Sentinel-1 relative Surface Soil Moisture (SSM), in % saturation for Northern Germany on 25 April 2024 (left) (Basemap Imagery by ESRI, Maxar Technologies, CNES | Powered by ESRI). Zoom into the PoSMO area, with dots indicating an individual cluster location with CRNS, SMT100 and soil moisture profile each (right); pixel size is 1 by 1 km; the black outline marks area of similar land use and soil type, as represented by PoSMO (see Fig. 1).
5.3 Examples neutron spectrometer
Since 18 June 2025, the extended range BSS system has been operated at PoSMO close to CRNS station #31 until 4 December 2025. We obtained time series of neutron intensities for different energies, and are able to provide daily neutron spectra. Figure 8 shows time series for the neutron count rates of the individual detector spheres, indicating also daily precipitation and highlighting neutron spectra for four particular days. The first two were obtained on 8 and 9 July 2025, prior to a precipitation event around 12 July 2025, and the other two on 14 and 15 July 2025, after about 30 mm of cumulated rain has been received. The resulting neutron spectra provide detailed information about the energy distributions of neutrons detected on site. The character of the neutron spectrum is the same before and after the precipitation event, but there occurred a decrease of neutron fluence in the epithermal and fast range, while the high-energy parts of the neutron distribution, i.e. the incoming neutron intensity, remained unchanged. This change in the neutron distribution induced by the precipitation event can be attributed to the increase of soil moisture in the first decimeters of soil (cf. Fig. 5, right graph). This reflects the mechanism underlying the CRNS observation of root-zone soil moisture via the detection of epithermal neutron intensities. Furthermore, it demonstrates the potential of an extended range BSS system to characterize the incoming neutron component and a future development of a local, observation-based incoming correction.
5.4 Examples remote sensing
PoSMO provides carefully compiled, high-resolution soil moisture time series, including standardized metadata and documentation. This dataset facilitates the cross-validation and uncertainty assessment of the increasing number of high resolution (e.g. 1 km) soil moisture products derived from downscaled coarse-resolution remote sensing microwave sources or reanalysis data, as well as from active microwave sources (Fan et al., 2025).
As an example, Fig. 9, on the left, shows the Copernicus relative Surface Soil Moisture (SSM), derived from Sentinel-1 constellation covering the Potsdam Observatory. The Copernicus surface soil moisture product represents an index of saturation that can be converted into volumetric water content by multiplying it by the soil porosity. On the right, the figure zooms in on the PoSMO locations, highlighting the product's 1 km pixels. The larger support volume of each CRNS together with the relatively dense distribution of CRNS within the 3.4 km2 area of similar land use and soil type, enhances comparisons between remote sensing products and reference soil moisture data. Although the clustered layout does not provide uniform spatial coverage, the multi-sensor information helps reduce local sampling uncertainty and improves the overall representativeness of the ground observations for validation.
For data sharing and archiving we used the EUDAT Collaborative Data Infrastructure (https://eudat.eu, last access: 25 August 2025). The data resides on the B2Share server at https://doi.org/10.23728/b2share.bxamy-4zh85 (Grosse et al., 2025). Its structure corresponds to the subsections of Sect. 3 of this paper. Each data subset is accompanied by a metadata text file (JSON format), offering additional details on the data format, units, column descriptors and remarks.
In conclusion, the Potsdam Soil Moisture Observatory (PoSMO) dataset provides a unique, multi-scale and long-term record of soil water dynamics under agricultural management. By combining CRNS-based soil moisture, profile and shallow in-situ measurements, groundwater observations, hydraulic and physical soil properties, stable water isotopes, and complementary remote sensing and hyperspectral information, the dataset offers a comprehensive basis for validation of large-scale soil moisture products as well as for the development, calibration, and validation of process-based hydrological models. The spatial density, temporal continuity, and multidisciplinary character of this dataset make it a robust reference for hydrological research, such as studies of land–atmosphere exchange or drought monitoring, and for transferring insights to comparable lowland agricultural regions.
SO, PG, TF, LS, MH, and KDP designed the study and coordinated the instrumentation; PG, EM, and TF coordinated the data management; PG and EM coordinated and led the writing of the manuscript. LS, PG, and SO led the revision of the manuscript; PG was responsible for setting up and maintaining the instrumentation; MeSch assisted with data analysis; BT co-designed the instrument network and provided data on land use, yields and irrigation water use; CN and DS contributed the airborne hyperspectral imagery, MeSa the hyperspectral ground-based time series and MK the airborne Lidar imagery; KDP did experimental work in the field in respect to stable water isotope data and together with CS the laboratory isotope analyses; DR provided soil moisture profiles from TDRs; MZ, JM, SR conceived the Bonner sphere set-up and performed the measurements with help of PG; DA performed the ERT measurements and LS added the preliminary analysis; SO headed the PoSMO effort and is the principal investigator of this study; all authors contributed by writing particular parts of the manuscript.
The contact author has declared that none of the authors has any competing interests.
Publisher's note: Copernicus Publications remains neutral with regard to jurisdictional claims made in the text, published maps, institutional affiliations, or any other geographical representation in this paper. The authors bear the ultimate responsibility for providing appropriate place names. Views expressed in the text are those of the authors and do not necessarily reflect the views of the publisher.
We thank the Helmholtz-Centre for Environmental Research – UFZ, Leipzig, for providing the majority of CRNS detectors deployed in the Potsdam Soil Moisture Observatory. Furthermore, we acknowledge the help of our technician Peter Bíró, Marie-Therese Schmehl and student workers for assistance in field work and data preparation: Paola Aleman Serrano, Jakob Terschlüsen, Isabel von Boetticher, Milan Flügel; and project work by Sebastian Rothermel. Our thanks also goes to the EWP-Stadtwerke Potsdam GmbH for allowing us to set up a CRNS network location on their premises in Satzkorn outside the ATB site. The measurements with a hyperspectral airborne sensor were partly based on use of Large Research Infrastructure CzeCOS supported by the Ministry of Education, Youth and Sports of CR within the CzeCOS program, grant number LM2023048. And we acknowledge the NMDB database https://www.nmdb.eu (last access: 15 January 2025), founded under the European Union's FP7 programme (contract no. 213007), for providing data from their JUNG measurements at Jungfraujoch, Switzerland.
This research was funded by the Deutsche Forschungsgemeinschaft (DFG, German Research Foundation) – research unit FOR 2694 “Cosmic Sense”, project number 357874777, and project SoMMet that has received funding from the European Partnership on Metrology (Funder name: European Partnership on Metrology, Funder ID: 10.13039/100019599, Grant number: 21GRD08 SoMMet), co-financed from the European Union's Horizon Europe Research and Innovation Programme and by the Participating States.
This paper was edited by Jiafu Mao and reviewed by Wolfgang Wagner and three anonymous referees.
Abioye, E. A., Abidin, M. S. Z., Mahmud, M. S. A., Buyamin, S., Ishak, M. H. I., Rahman, M. K. I. A., Otuoze, A. O., Onotu, P., and Ramli, M. S. A.: A Review on Monitoring and Advanced Control Strategies for Precision Irrigation, Computers and Electronics in Agriculture, 173, 105441, https://doi.org/10.1016/j.compag.2020.105441, 2020. a
Amoozegar, A.: Comparison of the Glover Solution with the Simultaneous-Equations Approach for Measuring Hydraulic Conductivity, Soil Science Society of America Journal, 53, 1362–1367, https://doi.org/10.2136/sssaj1989.03615995005300050010x, 1989. a
Arnault, J., Fersch, B., Schrön, M., Bogena, H. R., Franssen, H.-J. H., and Kunstmann, H.: Role of Infiltration on Land–Atmosphere Feedbacks in Central Europe: Fully Coupled WRF-Hydro Simulations Evaluated with Cosmic-Ray Neutron Soil Moisture Measurements, Journal of Hydrometeorology, 26, 129–153, https://doi.org/10.1175/JHM-D-24-0049.1, 2025. a
Baatz, R., Bogena, H. R., Hendricks-Franssen, H.-J., Huisman, J. A., Montzka, C., and Vereecken, H.: An empirical vegetation correction for soil water content quantification using cosmic ray probes, Water Resour. Res., 51, 2030–2046, https://doi.org/10.1002/2014wr016443, 2015. a, b, c
Baatz, R., Hendricks Franssen, H.-J., Han, X., Hoar, T., Bogena, H. R., and Vereecken, H.: Evaluation of a cosmic-ray neutron sensor network for improved land surface model prediction, Hydrol. Earth Syst. Sci., 21, 2509–2530, https://doi.org/10.5194/hess-21-2509-2017, 2017. a
Babaeian, E., Sadeghi, M., Franz, T. E., Jones, S., and Tuller, M.: Mapping soil moisture with the OPtical TRApezoid Model (OPTRAM) based on long-term MODIS observations, Remote Sens. Environ., 211, 425–440, https://doi.org/10.1016/j.rse.2018.04.029, 2018. a
Barbosa, L. R., Coelho, V. H. R., Scheiffele, L. M., Baroni, G., Filho, G. M. R., Montenegro, S. M., das N. Almeida, C., and Oswald, S. E.: Dynamic groundwater recharge simulations based on cosmic-ray neutron sensing in a tropical wet experimental basin, Vadose Zone J., e20145, https://doi.org/10.1002/vzj2.20145, 2021. a
Baroni, G. and Oswald, S.: A scaling approach for the assessment of biomass changes and rainfall interception using cosmic-ray neutron sensing, J. Hydrol., 525, 264–276, https://doi.org/10.1016/j.jhydrol.2015.03.053, 2015. a
Baroni, G., Scheiffele, L. M., Schrön, M., Ingwersen, J., and Oswald, S. E.: Uncertainty, sensitivity and improvements in soil moisture estimation with cosmic-ray neutron sensing, J. Hydrol., 564, 873–887, https://doi.org/10.1016/j.jhydrol.2018.07.053, 2018. a, b
Bauer-Marschallinger, B., Freeman, V., Cao, S., Paulik, C., Schaufler, S., Stachl, T., Modanesi, S., Massari, C., Ciabatta, L., Brocca, L., and Wagner, W.: Toward Global Soil Moisture Monitoring With Sentinel-1: Harnessing Assets and Overcoming Obstacles, IEEE Transactions on Geoscience and Remote Sensing, 57, 520–539, https://doi.org/10.1109/TGRS.2018.2858004, 2019. a
Beale, J., Waine, T., Evans, J., and Corstanje, R.: A Method to Assess the Performance of SAR-Derived Surface Soil Moisture Products, IEEE Journal of Selected Topics in Applied Earth Observations and Remote Sensing, 14, 4504–4516, https://doi.org/10.1109/JSTARS.2021.3071380, 2021. a
Blanchy, G., Saneiyan, S., Boyd, J., McLachlan, P., and Binley, A.: ResIPy, an Intuitive Open Source Software for Complex Geoelectrical Inversion/Modeling, Computers & Geosciences, 137, 104423, https://doi.org/10.1016/j.cageo.2020.104423, 2020. a
Bogena, H. R., Herrmann, F., Jakobi, J., Brogi, C., Ilias, A., Huisman, J. A., Panagopoulos, A., and Pisinaras, V.: Monitoring of Snowpack Dynamics With Cosmic-Ray Neutron Probes: A Comparison of Four Conversion Methods, Frontiers in Water, 2, https://doi.org/10.3389/frwa.2020.00019, 2020. a
Bogena, H. R., Schrön, M., Jakobi, J., Ney, P., Zacharias, S., Andreasen, M., Baatz, R., Boorman, D., Duygu, M. B., Eguibar-Galán, M. A., Fersch, B., Franke, T., Geris, J., González Sanchis, M., Kerr, Y., Korf, T., Mengistu, Z., Mialon, A., Nasta, P., Nitychoruk, J., Pisinaras, V., Rasche, D., Rosolem, R., Said, H., Schattan, P., Zreda, M., Achleitner, S., Albentosa-Hernández, E., Akyürek, Z., Blume, T., del Campo, A., Canone, D., Dimitrova-Petrova, K., Evans, J. G., Ferraris, S., Frances, F., Gisolo, D., Güntner, A., Herrmann, F., Iwema, J., Jensen, K. H., Kunstmann, H., Lidón, A., Looms, M. C., Oswald, S., Panagopoulos, A., Patil, A., Power, D., Rebmann, C., Romano, N., Scheiffele, L., Seneviratne, S., Weltin, G., and Vereecken, H.: COSMOS-Europe: a European network of cosmic-ray neutron soil moisture sensors, Earth Syst. Sci. Data, 14, 1125–1151, https://doi.org/10.5194/essd-14-1125-2022, 2022. a, b
Bojinski, S., Verstraete, M., Peterson, T. C., Richter, C., Simmons, A., and Zemp, M.: The Concept of Essential Climate Variables in Support of Climate Research, Applications, and Policy, Bulletin of the American Meteorological Society, 95, 1431–1443, https://doi.org/10.1175/BAMS-D-13-00047.1, 2014. a
Brocca, L., Ciabatta, L., Massari, C., Camici, S., and Tarpanelli, A.: Soil Moisture for Hydrological Applications: Open Questions and New Opportunities, Water, 9, 140, https://doi.org/10.3390/w9020140, 2017. a
Brogi, C., Bogena, H. R., Köhli, M., Huisman, J. A., Hendricks Franssen, H.-J., and Dombrowski, O.: Feasibility of irrigation monitoring with cosmic-ray neutron sensors, Geosci. Instrum. Method. Data Syst., 11, 451–469, https://doi.org/10.5194/gi-11-451-2022, 2022. a
Brogi, C., Jakobi, J., Huisman, J. A., Schmidt, M., Montzka, C., Bates, J. S., Akter, S., and Bogena, H. R.: Cosmic-Ray Neutron Sensors Provide Scale-Appropriate Soil Water Content and Vegetation Observations for Eddy Covariance Stations in Agricultural Ecosystems, Agricultural and Forest Meteorology, 373, 110731, https://doi.org/10.1016/j.agrformet.2025.110731, 2025. a, b
Canet-Martí, A., Morales-Santos, A., Nolz, R., Langergraber, G., and Stumpp, C.: Quantification of water fluxes and soil water balance in agricultural fields under different tillage and irrigation systems using water stable isotopes, Soil and Tillage Research, 231, 105732, https://doi.org/10.1016/j.still.2023.105732, 2023. a
Cooper, H. M., Bennett, E., Blake, J., Blyth, E., Boorman, D., Cooper, E., Evans, J., Fry, M., Jenkins, A., Morrison, R., Rylett, D., Stanley, S., Szczykulska, M., Trill, E., Antoniou, V., Askquith-Ellis, A., Ball, L., Brooks, M., Clarke, M. A., Cowan, N., Cumming, A., Farrand, P., Hitt, O., Lord, W., Scarlett, P., Swain, O., Thornton, J., Warwick, A., and Winterbourn, B.: COSMOS-UK: national soil moisture and hydrometeorology data for environmental science research, Earth Syst. Sci. Data, 13, 1737–1757, https://doi.org/10.5194/essd-13-1737-2021, 2021. a
De Vis, A., Goyens, C., Gaultier, L., Giardino, C., Vansteenwegen, J., Harpole, S., and Sterckx, S.: HYPERNETS: An autonomous, uncertainty-quantified reference network for validating satellite-derived surface reflectance over land and water, Frontiers in Remote Sensing, 5, 1347230, https://doi.org/10.3389/frsen.2024.1347230, 2024. a
Denager, T., Looms, M. C., Sonnenborg, T. O., and Jensen, K. H.: Comparison of Evapotranspiration Estimates Using the Water Balance and the Eddy Covariance Methods, Vadose Zone Journal, 19, e20032, https://doi.org/10.1002/vzj2.20032, 2020. a
Desilets, D., Zreda, M., and Ferré, T. P. A.: Nature's neutron probe: Land surface hydrology at an elusive scale with cosmic rays, Water Resources Research, 46, https://doi.org/10.1029/2009WR008726, 2010. a, b
Dorigo, W., Himmelbauer, I., Aberer, D., Schremmer, L., Petrakovic, I., Zappa, L., Preimesberger, W., Xaver, A., Annor, F., Ardö, J., Baldocchi, D., Bitelli, M., Blöschl, G., Bogena, H., Brocca, L., Calvet, J.-C., Camarero, J. J., Capello, G., Choi, M., Cosh, M. C., van de Giesen, N., Hajdu, I., Ikonen, J., Jensen, K. H., Kanniah, K. D., de Kat, I., Kirchengast, G., Kumar Rai, P., Kyrouac, J., Larson, K., Liu, S., Loew, A., Moghaddam, M., Martínez Fernández, J., Mattar Bader, C., Morbidelli, R., Musial, J. P., Osenga, E., Palecki, M. A., Pellarin, T., Petropoulos, G. P., Pfeil, I., Powers, J., Robock, A., Rüdiger, C., Rummel, U., Strobel, M., Su, Z., Sullivan, R., Tagesson, T., Varlagin, A., Vreugdenhil, M., Walker, J., Wen, J., Wenger, F., Wigneron, J. P., Woods, M., Yang, K., Zeng, Y., Zhang, X., Zreda, M., Dietrich, S., Gruber, A., van Oevelen, P., Wagner, W., Scipal, K., Drusch, M., and Sabia, R.: The International Soil Moisture Network: serving Earth system science for over a decade, Hydrol. Earth Syst. Sci., 25, 5749–5804, https://doi.org/10.5194/hess-25-5749-2021, 2021. a, b
Durner, W.: Hydraulic Conductivity Estimation for Soils with Heterogeneous Pore Structure, Water Resources Research, 30, 211–223, https://doi.org/10.1029/93WR02676, 1994. a
DWD: CDC (Climate Data Center) Deutscher Wetterdienst, https://opendata.dwd.de/climate_environment/CDC/observations_germany/climate/hourly/ (last access: 20 January 2025), 2025. a
Elrick, D. E. and Reynolds, W. D.: Methods for analyzing constant-head well permeameter data, Soil Science Society of America Journal, 56, 320–323, https://doi.org/10.2136/sssaj1992.03615995005600010052x, 1992. a
Entekhabi, D., Njoku, E. G., O'Neill, P. E., Kellogg, K. H., Crow, W. T., Edelstein, W. N., Entin, J. K., Goodman, S. D., Jackson, T. J., Johnson, J., Kimball, J., Piepmeier, J. R., Koster, R. D., Martin, N., McDonald, K. C., Moghaddam, M., Moran, S., Reichle, R., Shi, J. C., Spencer, M. W., Thurman, S. W., Tsang, L., and Van Zyl, J.: The Soil Moisture Active Passive (SMAP) Mission, Proceedings of the IEEE, 98, 704–716, https://doi.org/10.1109/JPROC.2010.2043918, 2010. a
European Space Agency: Fiducial Reference Measurements for Soil Moisture (FRM4SM): Executive Summary Report, Tech. Rep. ESA Contract No. 4000135204/21/I-BG, European Space Agency, Paris, France, Prepared by AWST, CESBIO, TU Wien https://earth.esa.int/eogateway/documents/d/earth-online/frm4sm_executive_summary_report_v2-0 (last access: 21 November 2025), 2024. a
Fan, D., Zhao, T., Jiang, X., García-García, A., Schmidt, T., Samaniego, L., Attinger, S., Wu, H., Jiang, Y., Shi, J., Fan, L., Tang, B.-H., Wagner, W., Dorigo, W., Gruber, A., Mattia, F., Balenzano, A., Brocca, L., Jagdhuber, T., Wigneron, J.-P., Montzka, C., and Peng, J.: A Sentinel-1 SAR-based global 1-km resolution soil moisture data product: Algorithm and preliminary assessment, Remote Sensing of Environment, 318, 114579, https://doi.org/10.1016/j.rse.2024.114579, 2025. a
Fatima, E., Kumar, R., Attinger, S., Kaluza, M., Rakovec, O., Rebmann, C., Rosolem, R., Oswald, S. E., Samaniego, L., Zacharias, S., and Schrön, M.: Improved representation of soil moisture processes through incorporation of cosmic-ray neutron count measurements in a large-scale hydrologic model, Hydrol. Earth Syst. Sci., 28, 5419–5441, https://doi.org/10.5194/hess-28-5419-2024, 2024. a, b
Fatima, E., Kumar, R., Altdorff, D., Attinger, S., Boeing, F., Oswald, S. E., Rakovec, O., Samaniego, L., Zacharias, S., and Schrön, M.: On the value of mobile cosmic-ray neutron measurements for spatio-temporal soil moisture simulations, Frontiers in Water, 7, https://doi.org/10.3389/frwa.2025.1630051, 2025. a
Fersch, B., Francke, T., Heistermann, M., Schrön, M., Döpper, V., Jakobi, J., Baroni, G., Blume, T., Bogena, H., Budach, C., Gränzig, T., Förster, M., Güntner, A., Hendricks Franssen, H.-J., Kasner, M., Köhli, M., Kleinschmit, B., Kunstmann, H., Patil, A., Rasche, D., Scheiffele, L., Schmidt, U., Szulc-Seyfried, S., Weimar, J., Zacharias, S., Zreda, M., Heber, B., Kiese, R., Mares, V., Mollenhauer, H., Völksch, I., and Oswald, S.: A dense network of cosmic-ray neutron sensors for soil moisture observation in a highly instrumented pre-Alpine headwater catchment in Germany, Earth Syst. Sci. Data, 12, 2289–2309, https://doi.org/10.5194/essd-12-2289-2020, 2020. a, b, c, d
Foolad, F., Franz, T. E., Wang, T., Gibson, J., Kilic, A., Allen, R. G., and Suyker, A.: Feasibility analysis of using inverse modeling for estimating field-scale evapotranspiration in maize and soybean fields from soil water content monitoring networks, Hydrol. Earth Syst. Sci., 21, 1263–1277, https://doi.org/10.5194/hess-21-1263-2017, 2017. a
Franz, T. E., Wahbi, A., Zhang, J., Vreugdenhil, M., Heng, L., Dercon, G., Strauss, P., Brocca, L., and Wagner, W.: Practical Data Products From Cosmic-Ray Neutron Sensing for Hydrological Applications, Front. Water, 2, 1–9, https://doi.org/10.3389/frwa.2020.00009, 2020. a, b
Gianessi, S., Polo, M., Stevanato, L., Lunardon, M., Francke, T., Oswald, S. E., Said Ahmed, H., Toloza, A., Weltin, G., Dercon, G., Fulajtar, E., Heng, L., and Baroni, G.: Testing a novel sensor design to jointly measure cosmic-ray neutrons, muons and gamma rays for non-invasive soil moisture estimation, Geosci. Instrum. Method. Data Syst., 13, 9–25, https://doi.org/10.5194/gi-13-9-2024, 2024. a, b
Gorelick, N., Hancher, M., Dixon, M., Ilyushchenko, S., Thau, D., and Moore, R.: Google Earth Engine: Planetary-scale geospatial analysis for everyone, Remote Sensing of Environment, https://doi.org/10.1016/j.rse.2017.06.031, 2017. a
Goyens, C., De Vis, A., Giardino, C., Harpole, S., and Sterckx, S.: The HYPERNETS Project: A New Hyperspectral Radiometer and Network for Satellite Validation, in: 2021 IEEE International Geoscience and Remote Sensing Symposium IGARSS, 1117–1120, https://doi.org/10.1109/IGARSS47720.2021.9553361, 2021. a
Grosse, P. M., Marret, E., Scheiffele, L., Dimitrova Petrova, K., Francke, T., Altdorff, D., Heistermann, M., Schiel, M., Neumann, C., Scheffler, D., Saberioon, M., Kunz, M., Zboril, M., Marach, J., Reginatto, M., Balenzano, A., Stumpp, C., Trost, B., and Oswald, S. E.: The Potsdam Soil Moisture Observatory: High-coverage reference observations at kilometer scale, b2share EUDAT [data set], https://doi.org/10.23728/b2share.bxamy-4zh85, 2025. a, b
Gruber, A., De Lannoy, G., Albergel, C., Al-Yaari, A., Brocca, L., Calvet, J.-C., Colliander, A., Cosh, M., Crow, W., Dorigo, W., Draper, C., Hirschi, M., Kerr, Y., Konings, A., Lahoz, W., McColl, K., Montzka, C., Muñoz-Sabater, J., Peng, J., Reichle, R., Richaume, P., Rüdiger, C., Scanlon, T., van der Schalie, R., Wigneron, J.-P., and Wagner, W.: Validation practices for satellite soil moisture retrievals: What are (the) errors?, Remote Sensing of Environment, 244, 111806, https://doi.org/10.1016/j.rse.2020.111806, 2020. a
Hanuš, J., Slezák, L., Fabiánek, T., Fajmon, L., Hanousek, T., Janoutová, R., Kopkáně, D., Novotný, J., Pavelka, K., Pikl, M., Zemek, F., and Homolová, L.: Flying Laboratory of Imaging Systems: Fusion of Airborne Hyperspectral and Laser Scanning for Ecosystem Research, Remote Sensing, https://doi.org/10.3390/rs15123130, 2023. a
Hawdon, A., McJannet, D., and Wallace, J.: Calibration and correction procedures for cosmic-ray neutron soil moisture probes located across Australia, Water Resources Research, 50, 5029–5043, https://doi.org/10.1002/2013WR015138, 2014. a, b, c
Heistermann, M., Francke, T., Schrön, M., and Oswald, S. E.: Spatio-temporal soil moisture retrieval at the catchment scale using a dense network of cosmic-ray neutron sensors, Hydrol. Earth Syst. Sci., 25, 4807–4824, https://doi.org/10.5194/hess-25-4807-2021, 2021. a
Heistermann, M., Bogena, H., Francke, T., Güntner, A., Jakobi, J., Rasche, D., Schrön, M., Döpper, V., Fersch, B., Groh, J., Patil, A., Pütz, T., Reich, M., Zacharias, S., Zengerle, C., and Oswald, S.: Soil moisture observation in a forested headwater catchment: combining a dense cosmic-ray neutron sensor network with roving and hydrogravimetry at the TERENO site Wüstebach, Earth Syst. Sci. Data, 14, 2501–2519, https://doi.org/10.5194/essd-14-2501-2022, 2022. a, b, c
Heistermann, M., Francke, T., Scheiffele, L., Dimitrova Petrova, K., Budach, C., Schrön, M., Trost, B., Rasche, D., Güntner, A., Döpper, V., Förster, M., Köhli, M., Angermann, L., Antonoglou, N., Zude-Sasse, M., and Oswald, S. E.: Three years of soil moisture observations by a dense cosmic-ray neutron sensing cluster at an agricultural research site in north-east Germany, Earth Syst. Sci. Data, 15, 3243–3262, https://doi.org/10.5194/essd-15-3243-2023, 2023. a, b, c, d, e, f, g, h
Heistermann, M., Francke, T., Schrön, M., and Oswald, S. E.: Technical Note: Revisiting the general calibration of cosmic-ray neutron sensors to estimate soil water content, Hydrol. Earth Syst. Sci., 28, 989–1000, https://doi.org/10.5194/hess-28-989-2024, 2024. a, b
Hertle, L., Zacharias, S., Larsen, N., Rasche, D., McJannet, D., and Schrön, M.: Neutron Monitor Based Incoming Flux Correction for Cosmic-Ray Neutron Sensing of Environmental Water, Water Resources Research, 61, e2025WR040527, https://doi.org/10.1029/2025WR040527, 2025. a
Hohenbrink, T. L., Jackisch, C., Durner, W., Germer, K., Iden, S. C., Kreiselmeier, J., Leuther, F., Metzger, J. C., Naseri, M., and Peters, A.: Soil water retention and hydraulic conductivity measured in a wide saturation range, Earth Syst. Sci. Data, 15, 4417–4432, https://doi.org/10.5194/essd-15-4417-2023, 2023. a
Hövel, A., Stumpp, C., Bogena, H., Lücke, A., Strauss, P., Blöschl, G., and Stockinger, M.: Hydro-Meteorological Drivers of Event Runoff Characteristics Under Analogous Soil Moisture Patterns in Three Small-Scale Headwater Catchments, Hydrological Processes, 39, e70173, https://doi.org/10.1002/hyp.70173, 2025. a
Jackisch, C., Germer, K., Graeff, T., Andrä, I., Schulz, K., Schiedung, M., Haller-Jans, J., Schneider, J., Jaquemotte, J., Helmer, P., Lotz, L., Bauer, A., Hahn, I., Šanda, M., Kumpan, M., Dorner, J., de Rooij, G., Wessel-Bothe, S., Kottmann, L., Schittenhelm, S., and Durner, W.: Soil moisture and matric potential – an open field comparison of sensor systems, Earth Syst. Sci. Data, 12, 683–697, https://doi.org/10.5194/essd-12-683-2020, 2020. a
Jakobi, J., Huisman, J. A., Vereecken, H., Diekkruger, B., and Bogena, H. R.: Cosmic Ray Neutron Sensing for Simultaneous Soil Water Content and Biomass Quantification in Drought Conditions, Water Resour. Res., 54, 7383–7402, https://doi.org/10.1029/2018wr022692, 2018. a, b
Jakobi, J., Huisman, J. A., Fuchs, H., Vereecken, H., and Bogena, H. R.: Potential of Thermal Neutrons to Correct Cosmic-Ray Neutron Soil Moisture Content Measurements for Dynamic Biomass Effects, Water Resour. Res., 58, e2022WR031972, https://doi.org/10.1029/2022WR031972, 2022. a
Kerr, Y., Waldteufel, P., Wigneron, J.-P., Martinuzzi, J., Font, J., and Berger, M.: Soil moisture retrieval from space: the Soil Moisture and Ocean Salinity (SMOS) mission, IEEE Transactions on Geoscience and Remote Sensing, 39, 1729–1735, https://doi.org/10.1109/36.942551, 2001. a
Koeniger, P., Gaj, M., Beyer, M., and Himmelsbach, T.: Review on soil water isotope-based groundwater recharge estimations, Hydrological Processes, 30, 2817–2834, https://doi.org/10.1002/hyp.10775, 2016. a
Köhli, M., Schrön, M., Zreda, M., Schmidt, U., Dietrich, P., and Zacharias, S.: Footprint Characteristics Revised for Field-Scale Soil Moisture Monitoring with Cosmic-Ray Neutrons, Water Resources Research, 51, 5772–5790, https://doi.org/10.1002/2015WR017169, 2015. a
Köhli, M., Weimar, J., Schrön, M., Baatz, R., and Schmidt, U.: Soil Moisture and Air Humidity Dependence of the Above-Ground Cosmic-Ray Neutron Intensity, Frontiers in Water, 2, https://doi.org/10.3389/frwa.2020.544847, 2021. a, b
Krebs, N., Schattan, P., Premier, V., Mejia-Aguilar, A., Fey, C., Bremer, M., and Rutzinger, M.: Evaluating Sentinel-1/-2 and MODIS fractional snow cover products for applications in alpine cosmic ray neutron snow monitoring, Remote Sensing Applications: Society and Environment, 40, 101812, https://doi.org/10.1016/j.rsase.2025.101812, 2025. a
Kühn, D. (Ed.): Bodenübersichtskarte des Landes Brandenburg 1 : 300 000 (BÜK 300) – Grundkarte Bodengeologie, in: Brandenburgische Geowissenschaftliche Beiträge; 2002; Band 9; Heft 1/2, Landesamt für Bergbau, Geologie und Rohstoffe Brandenburg, https://doi.org/10.23689/fidgeo-11709, 2002. a
Lachenmeier, E., Mahmood, R., Phillips, C., Nair, U., Rappin, E., Pielke, R. A., Brown, W., Oncley, S., Wurman, J., Kosiba, K., Kaulfus, A., Santanello, J., Kim, E., Lawston-Parker, P., Hayes, M., and Franz, T. E.: Irrigated Agriculture Significantly Modifies Seasonal Boundary Layer Atmosphere and Lower-Tropospheric Convective Environment, Journal of Applied Meteorology and Climatology, 63, 245–262, https://doi.org/10.1175/JAMC-D-23-0020.1, 2024. a
Levi, M. R. and Bestelmeyer, B. T.: Digital Soil Mapping for Fire Prediction and Management in Rangelands, Fire Ecology, 14, 11, https://doi.org/10.1186/s42408-018-0018-4, 2018. a
McJannet, D., Rasche, D., Marano, J., Hawdon, A., Stenson, M., and Schrön, M.: Over-Water Low-Energy Neutron Observations for Intensity Corrections Across Cosmic-Ray Soil Moisture Sensor Networks, Water Resources Research, 61, e2024WR039727, https://doi.org/10.1029/2024WR039727, 2025. a
McJannet, D. L. and Desilets, D.: Incoming Neutron Flux Corrections for Cosmic-Ray Soil and Snow Sensors Using the Global Neutron Monitor Network, Water Resources Research, 59, e2022WR033889, https://doi.org/10.1029/2022WR033889, 2023. a, b, c
Mengen, D., Jagdhuber, T., Balenzano, A., Mattia, F., Vereecken, H., and Montzka, C.: High Spatial and Temporal Soil Moisture Retrieval in Agricultural Areas Using Multi-Orbit and Vegetation Adapted Sentinel-1 SAR Time Series, Remote Sensing, 15, https://doi.org/10.3390/rs15092282, 2023. a
Meyer, R., Zhang, W., Kragh, S. J., Andreasen, M., Jensen, K. H., Fensholt, R., Stisen, S., and Looms, M. C.: Exploring the combined use of SMAP and Sentinel-1 data for downscaling soil moisture beyond the 1 km scale, Hydrol. Earth Syst. Sci., 26, 3337–3357, https://doi.org/10.5194/hess-26-3337-2022, 2022. a
Molenaar, R. E., Kleidorfer, M., Kohl, B., Teuling, A. J., and Achleitner, S.: Does Afforestation Increase Soil Water Buffering? A Demonstrator Study on Soil Moisture Variability in the Alpine Geroldsbach Catchment, Austria, Journal of Hydrology, 131984, https://doi.org/10.1016/j.jhydrol.2024.131984, 2024. a
Moragoda, N., Kumar, M., and Cohen, S.: Representing the Role of Soil Moisture on Erosion Resistance in Sediment Models: Challenges and Opportunities, Earth-Science Reviews, 229, 104032, https://doi.org/10.1016/j.earscirev.2022.104032, 2022. a
OpenStreetMap contributors: Planet dump retrieved from https://planet.osm.org, https://www.openstreetmap.org (last access: 9 January 2025), 2025. a, b, c, d, e
Oswald, S. E., Angermann, L., Bogena, H., Förster, M., García-García, A., Lischeid, G., Paton, E. N., Altdorff, D., Attinger, S., Güntner, A., Hartmann, A., Franssen, H.-J. H., Hildebrandt, A., Kleinschmit, B., Orth, R., Peng, J., Ryo, M., Schrön, M., Wagner, W., and Wagener, T.: Integration is key to closing knowledge gaps concerning landscape subsurface water storage dynamics, Hydrological Processes, 38, e15320, https://doi.org/10.1002/hyp.15320, 2024. a
Patil, A., Fersch, B., Hendricks-Franssen, H.-J., and Kunstmann, H.: Assimilation of cosmogenic neutron counts for improved soil moisture prediction in a distributed land surface model, Frontiers in Water, 3, https://doi.org/10.3389/frwa.2021.729592, 2021. a
Patrignani, A., Ochsner, T. E., Montag, B., and Bellinger, S.: A Novel Lithium Foil Cosmic-Ray Neutron Detector for Measuring Field-Scale Soil Moisture, Frontiers in Water, 3, https://doi.org/10.3389/frwa.2021.673185, 2021. a
Pendergrass, A. G., Meehl, G. A., Pulwarty, R., Hobbins, M., Hoell, A., AghaKouchak, A., Bonfils, C. J. W., Gallant, A. J. E., Hoerling, M., Hoffmann, D., Kaatz, L., Lehner, F., Llewellyn, D., Mote, P., Neale, R. B., Overpeck, J. T., Sheffield, A., Stahl, K., Svoboda, M., Wheeler, M. C., Wood, A. W., and Woodhouse, C. A.: Flash Droughts Present a New Challenge for Subseasonal-to-Seasonal Prediction, Nature Climate Change, 10, 191–199, https://doi.org/10.1038/s41558-020-0709-0, 2020. a
Peng, J., Albergel, C., Balenzano, A., Brocca, L., Cartus, O., Cosh, M. H., Crow, W. T., Dabrowska-Zielinska, K., Dadson, S., Davidson, M. W., de Rosnay, P., Dorigo, W., Gruber, A., Hagemann, S., Hirschi, M., Kerr, Y. H., Lovergine, F., Mahecha, M. D., Marzahn, P., Mattia, F., Musial, J. P., Preuschmann, S., Reichle, R. H., Satalino, G., Silgram, M., van Bodegom, P. M., Verhoest, N. E., Wagner, W., Walker, J. P., Wegmüller, U., and Loew, A.: A roadmap for high-resolution satellite soil moisture applications – confronting product characteristics with user requirements, Remote Sensing of Environment, 252, 112162, https://doi.org/10.1016/j.rse.2020.112162, 2021. a
Power, D., Rico-Ramirez, M. A., Desilets, S., Desilets, D., and Rosolem, R.: Cosmic-Ray neutron Sensor PYthon tool (crspy 1.2.1): an open-source tool for the processing of cosmic-ray neutron and soil moisture data, Geosci. Model Dev., 14, 7287–7307, https://doi.org/10.5194/gmd-14-7287-2021, 2021. a
Power, D., Schrön, M., Erxleben, F., Rosolem, R., and Zacharias, S.: Neptoon, Zenodo [code], https://doi.org/10.5281/zenodo.17209375, 2025. a, b
Rasche, D., Köhli, M., Schrön, M., Blume, T., and Güntner, A.: Towards disentangling heterogeneous soil moisture patterns in cosmic-ray neutron sensor footprints, Hydrol. Earth Syst. Sci., 25, 6547–6566, https://doi.org/10.5194/hess-25-6547-2021, 2021. a
Rasche, D., Blume, T., and Güntner, A.: Depth extrapolation of field-scale soil moisture time series derived with cosmic-ray neutron sensing (CRNS) using the soil moisture analytical relationship (SMAR) model, SOIL, 10, 655–677, https://doi.org/10.5194/soil-10-655-2024, 2024. a, b
Reginatto, M.: Overview of spectral unfolding techniques and uncertainty estimation, Radiation Measurements, 45, 1323–1329, https://doi.org/10.1016/j.radmeas.2010.06.016, 2010. a
Reynolds, W. D., Bowman, B. T., Brunke, R. R., Drury, C. F., and Tan, C. S.: Comparison of Tension Infiltrometer, Pressure Infiltrometer, and Soil Core Estimates of Saturated Hydraulic Conductivity, Soil Science Society of America Journal, 64, 478–484, https://doi.org/10.2136/sssaj2000.642478x, 2000. a
Richter, R. and Schläpfer, D.: Atmospheric/topographic correction for airborne imagery, Tech. Rep. 565-02, ReSe Applications LLC, Wil, Switzerland, ATCOR-4 user guide, https://www.rese.ch/pdf/atcor4_manual.pdf (last access: 19 February 2026), 2011. a
Rivera Villarreyes, C. A., Baroni, G., and Oswald, S. E.: Integral quantification of seasonal soil moisture changes in farmland by cosmic-ray neutrons, Hydrol. Earth Syst. Sci., 15, 3843–3859, https://doi.org/10.5194/hess-15-3843-2011, 2011. a
Robinson, D. A., Campbell, C. S., Hopmans, J. W., Hornbuckle, B. K., Jones, S. B., Knight, R., Ogden, F., Selker, J., and Wendroth, O.: Soil Moisture Measurement for Ecological and Hydrological Watershed-Scale Observatories: A Review, Vadose Zone Journal, 7, 358–389, https://doi.org/10.2136/vzj2007.0143, 2008. a
Rosenbaum, U., Bogena, H. R., Herbst, M., Huisman, J. A., Peterson, T. J., Weuthen, A., Western, A. W., and Vereecken, H.: Seasonal and Event Dynamics of Spatial Soil Moisture Patterns at the Small Catchment Scale, Water Resources Research, 48, https://doi.org/10.1029/2011WR011518, 2012. a
Rosolem, R., Shuttleworth, W. J., Zreda, M., Franz, T. E., Zeng, X., and Kurc, S. A.: The effect of atmospheric water vapor on neutron count in the cosmic-ray soil moisture observing system, Journal of Hydrometeorology, 14, 1659–1671, https://doi.org/10.1175/JHM-D-12-0120.1, 2013. a
Scandellari, F., Attou, T., Barbeta, A., Bernhard, F., D'Amato, C., Dimitrova-Petrova, K., Donaldson, A., Durodola, O., Ferraris, S., Floriancic, M. G., Fontenla-Razzetto, G., Gerchow, M., Han, Q., Khalil, I., Kirchner, J. W., Kühnhammer, K., Liu, Q., Llorens, P., Magh, R.-K., Marshall, J., Meusburger, K., Oliveira, A. M., Muñoz-Villers, L., Pires, S. S., Todini-Zicavo, D., van Meerveld, I., Voigt, C., Wirsig, L., Beyer, M., Geris, J., Hopp, L., Penna, D., and Sprenger, M.: Using stable isotopes to inform water resource management in forested and agricultural ecosystems, Journal of Environmental Management, 365, 121381, https://doi.org/10.1016/j.jenvman.2024.121381, 2024. a
Schattan, P., Baroni, G., Oswald, S. E., Schöber, J., Fey, C., Kormann, C., Huttenlau, M., and Achleitner, S.: Continuous Monitoring of Snowpack Dynamics in Alpine Terrain by Aboveground Neutron Sensing, Water Resources Research, 53, 3615–3634, https://doi.org/10.1002/2016WR020234, 2017. a
Schattan, P., Schwaizer, G., Schöber, J., and Achleitner, S.: The complementary value of cosmic-ray neutron sensing and snow covered area products for snow hydrological modelling, Remote Sens. Environ., 239, https://doi.org/10.1016/j.rse.2019.111603, 2020. a
Scheffler, D., Hollstein, A., Diedrich, H., Segl, K., and Hostert, P.: AROSICS: An Automated and Robust Open-Source Image Co-Registration Software for Multi-Sensor Satellite Data, Remote Sensing, 9, https://doi.org/10.3390/rs9070676, 2017. a
Scheiffele, L. M., Baroni, G., Franz, T. E., Jakobi, J., and Oswald, S. E.: A profile shape correction to reduce the vertical sensitivity of cosmic-ray neutron sensing of soil moisture, Vadose Zone J., 19, e20083, https://doi.org/10.1002/vzj2.20083, 2020. a, b
Scheiffele, L. M., Munz, M., Francke, T., Baroni, G., and Oswald, S. E.: Enhancing Hectare-Scale Groundwater Recharge Estimation by Integrating Data From Cosmic-Ray Neutron Sensing Into Soil Hydrological Modeling, Water Resources Research, 61, e2024WR037641, https://doi.org/10.1029/2024WR037641, 2025. a
Schenk, H. J. and Jackson, R. B.: Rooting Depths, Lateral Root Spreads and below-Ground/above-Ground Allometries of Plants in Water-Limited Ecosystems, Journal of Ecology, 90, 480–494, https://doi.org/10.1046/j.1365-2745.2002.00682.x, 2002. a
Schmidt, T., Schrön, M., Li, Z., Francke, T., Zacharias, S., Hildebrandt, A., and Peng, J.: Comprehensive quality assessment of satellite- and model-based soil moisture products against the COSMOS network in Germany, Remote Sens. Environ., 301, 113930, https://doi.org/10.1016/j.rse.2023.113930, 2024. a
Schrön, M.: CORNish PASDy – cosmic-ray neutron flavored PASDy – processing and analysis of sensor data in python, version 0.2, https://git.ufz.de/CRNS/cornish_pasdy (last access: 20 January 2025), 2025. a
Schrön, M., Köhli, M., Scheiffele, L., Iwema, J., Bogena, H. R., Lv, L., Martini, E., Baroni, G., Rosolem, R., Weimar, J., Mai, J., Cuntz, M., Rebmann, C., Oswald, S. E., Dietrich, P., Schmidt, U., and Zacharias, S.: Improving calibration and validation of cosmic-ray neutron sensors in the light of spatial sensitivity, Hydrol. Earth Syst. Sci., 21, 5009–5030, https://doi.org/10.5194/hess-21-5009-2017, 2017. a, b, c, d, e
Schrön, M., Rosolem, R., Köhli, M., Piussi, L., Schröter, I., Iwema, J., Kögler, S., Oswald, S. E., Wollschläger, U., Samaniego, L., Dietrich, P., and Zacharias, S.: Cosmic-ray Neutron Rover Surveys of Field Soil Moisture and the Influence of Roads, Water Resour. Res., 54, 6441–6459, https://doi.org/10.1029/2017wr021719, 2018. a
Schrön, M., Köhli, M., and Zacharias, S.: Signal contribution of distant areas to cosmic-ray neutron sensors – implications for footprint and sensitivity, Hydrol. Earth Syst. Sci., 27, 723–738, https://doi.org/10.5194/hess-27-723-2023, 2023. a
Schrön, M., Rasche, D., Weimar, J., Köhli, M., Herbst, K., Boehrer, B., Hertle, L., Kögler, S., and Zacharias, S.: Buoy-Based Detection of Low-Energy Cosmic-Ray Neutrons to Monitor the Influence of Atmospheric, Geomagnetic, and Heliospheric Effects, Earth and Space Science, 11, e2023EA003483, https://doi.org/10.1029/2023EA003483, 2024. a
Shuttleworth, J., Rosolem, R., Zreda, M., and Franz, T.: The COsmic-ray Soil Moisture Interaction Code (COSMIC) for use in data assimilation, Hydrol. Earth Syst. Sci., 17, 3205–3217, https://doi.org/10.5194/hess-17-3205-2013, 2013. a
Sprenger, M., Stumpp, C., Weiler, M., Aeschbach, W., Allen, S. T., Benettin, P., Dubbert, M., Hartmann, A., Hrachowitz, M., Kirchner, J. W., McDonnell, J. J., Orlowski, N., Penna, D., Pfahl, S., Rinderer, M., Rodriguez, N., Schmidt, M., and Werner, C.: The demographics of water: A review of water ages in the critical zone, Reviews of Geophysics, 57, 800–834, https://doi.org/10.1029/2018RG000633, 2019. a
Srivastava, P. K.: Satellite Soil Moisture: Review of Theory and Applications in Water Resources, Water Resources Management, 31, 3161–3176, https://doi.org/10.1007/s11269-017-1722-6, 2017. a
Stevanato, L., Baroni, G., Oswald, S. E., Lunardon, M., Mares, V., Marinello, F., Moretto, S., Polo, M., Sartori, P., Schattan, P., and Ruehm, W.: An Alternative Incoming Correction for Cosmic-Ray Neutron Sensing Observations Using Local Muon Measurement, Geophys. Res. Lett., 49, e2021GL095383, https://doi.org/10.1029/2021GL095383, 2022. a
Strebel, L., Bogena, H., Vereecken, H., Andreasen, M., Aranda-Barranco, S., and Hendricks Franssen, H.-J.: Evapotranspiration prediction for European forest sites does not improve with assimilation of in situ soil water content data, Hydrol. Earth Syst. Sci., 28, 1001–1026, https://doi.org/10.5194/hess-28-1001-2024, 2024. a
Stumpp, C., Brüggemann, N., and Wingate, L.: Stable Isotope Approaches in Vadose Zone Research, Vadose Zone Journal, 17, 180096, https://doi.org/10.2136/vzj2018.05.0096, 2018. a
Szilagyi, J. and Franz, T. E.: Anthropogenic Hydrometeorological Changes at a Regional Scale: Observed Irrigation–Precipitation Feedback (1979–2015) in Nebraska, USA, Sustainable Water Resources Management, 6, https://doi.org/10.1007/s40899-020-00368-w, 2020. a
Vereecken, H., Huisman, J. A., Bogena, H., Vanderborght, J., Vrugt, J. A., and Hopmans, J. W.: On the Value of Soil Moisture Measurements in Vadose Zone Hydrology: A Review, Water Resources Research, 44, W00D06, https://doi.org/10.1029/2008WR006829, 2008. a
Wang, S., Hrachowitz, M., Schoups, G., and Stumpp, C.: Stable water isotopes and tritium tracers tell the same tale: no evidence for underestimation of catchment transit times inferred by stable isotopes in StorAge Selection (SAS)-function models, Hydrol. Earth Syst. Sci., 27, 3083–3114, https://doi.org/10.5194/hess-27-3083-2023, 2023. a
Wassenaar, L., Hendry, M., Chostner, V., and Lis, G.: High Resolution Pore Water δ2H and δ18O Measurements by H2O(liquid)−H2O(vapor) Equilibration Laser Spectroscopy, Environmental Science & Technology, 42, 9262–9267, https://doi.org/10.1021/es802065s, 2008. a
Weber, T. K. D., Weihermüller, L., Nemes, A., Bechtold, M., Degré, A., Diamantopoulos, E., Fatichi, S., Filipović, V., Gupta, S., Hohenbrink, T. L., Hirmas, D. R., Jackisch, C., de Jong van Lier, Q., Koestel, J., Lehmann, P., Marthews, T. R., Minasny, B., Pagel, H., van der Ploeg, M., Shojaeezadeh, S. A., Svane, S. F., Szabó, B., Vereecken, H., Verhoef, A., Young, M., Zeng, Y., Zhang, Y., and Bonetti, S.: Hydro-pedotransfer functions: a roadmap for future development, Hydrol. Earth Syst. Sci., 28, 3391–3433, https://doi.org/10.5194/hess-28-3391-2024, 2024. a
Wiegel, B. and Alevra, A.: NEMUS – the PTB Neutron Multisphere Spectrometer: Bonner spheres and more, Nuclear Instruments and Methods in Physics Research Section A: Accelerators, Spectrometers, Detectors and Associated Equipment, 476, 36–41, https://doi.org/10.1016/S0168-9002(01)01385-7, 2002. a
Zhao, Y., Ling, D.-S., Wang, Y.-L., Huang, B., and Wang, H.-L.: Study on a calibration equation for soil water content in field tests using time domain reflectometry, Journal of Zhejiang University-Science A, 17, 240–252, https://doi.org/10.1631/jzus.A1500065, WOS:000372318500006, 2016. a
Zreda, M., Desilets, D., Ferré, T. P. A., and Scott, R. L.: Measuring Soil Moisture Content Non-Invasively at Intermediate Spatial Scale Using Cosmic-Ray Neutrons, Geophysical Research Letters, 35, https://doi.org/10.1029/2008GL035655, 2008. a
Zreda, M., Shuttleworth, W. J., Zeng, X., Zweck, C., Desilets, D., Franz, T., and Rosolem, R.: COSMOS: the COsmic-ray Soil Moisture Observing System, Hydrol. Earth Syst. Sci., 16, 4079–4099, https://doi.org/10.5194/hess-16-4079-2012, 2012. a, b, c, d