the Creative Commons Attribution 4.0 License.
the Creative Commons Attribution 4.0 License.
 | 23 Feb 2026
A gridded (0.1° × 0.1°) methane emission dataset for India for 2023 to redefine global climate studies
Ashirbad Mishra
Poonam Mangaraj
Pallavi Sahoo
Gufran Beig
Rajesh Janardanan
Methane (CH4) is a predominant climate-forcing agent and has become a focal point of global climate discussions, owing to its significant contribution to atmospheric warming. The ambiguity surrounding the relative contributions of various natural and anthropogenic sources, coupled with associated uncertainties, poses significant challenges to assessing methane emissions in developing nations like India. To address these challenges and better understand the methane-emitting sources, this study presents a comprehensive high-resolution gridded (0.1° × 0.1°) inventory of CH4 emission by including 25 distinct anthropogenic and natural sources in India for 2023 by adopting the IPCC bottom-up approach. The estimated CH4 over India is 37.79 Tg yr−1, which will redefine the contribution of various sources. The agriculture sector contributed ∼50 % followed by wetlands (22.8 %), fossil fuel (8.9 %) and waste management (8.4 %). This study reports the first-ever comprehensive emissions from natural sources like wetlands and termites. The Indo-Gangetic Plain (IGP) and coastal states show elevated emissions with Uttar Pradesh contributing the highest (10.8 %) followed by Gujarat (9.4 %), and Maharashtra (8.6 %). However, surprisingly cities exhibit lower CH4 as compared to other semi-urban/rural regions. This developed dataset can be a valuable input to optimize the climate study by filling the data gap, enabling policymakers to formulate various mitigation measures. The emission dataset can be accessed through the Zenodo repository https://doi.org/10.5281/zenodo.14089138 (Sahu, 2024).
- Article
(4869 KB) - Full-text XML
-
Supplement
(589 KB) - BibTeX
- EndNote


Methane (CH4) is the second most abundant and potent greenhouse gas (GHG) in the atmosphere, after Carbon Dioxide (CO2) (European Commission, 2023). Its ability to trap heat by absorbing outgoing thermal infrared radiation is 28 times more than CO2 resulting in 16 %–25 % of atmospheric warming to date (Rosentreter et al., 2021). The surface dry-air mole fraction of atmospheric CH4 has escalated to 1931 ppb, nearly 2.6 times the level recorded in the preindustrial era of 1750 (NOAA, 2024). The significant rise in CH4 concentrations necessitates urgent mitigation of methane emissions, given its potential to induce near-term climatic changes and its involvement in the formation of tropospheric ozone.
The global CH4 emissions in 2017 were estimated through the bottom-up approach amounted to be ∼ 747 (602–896) Tg yr−1, primarily contributed by anthropogenic sources (Saunois et al., 2020). China is responsible for the highest emissions with more than 20 % of the global anthropogenic CH4, followed by South Asia (13 %), Southeast Asia (8 %), and the United States of America (USA) (7 %) (Saunois et al., 2020). The anthropogenic emissions are attributed to various sources like livestock, agriculture, solid waste, wastewater management, fossil fuel production, biomass burning, etc. Given the extensive domestic and agricultural practices such as livestock and vegetative culture, South Asian regions are a global hotspot of CH4 emissions (Saunois et al., 2020). Given the diversity of methane sources across the world, the real challenge lies in identifying the country-specific prevailing and predominant sources that may have a disproportionate contribution to the national total emissions. Understanding regional sources in developing nations like India is paramount, where the spatial diversity of sources is much more complex, to identify and quantify methane emissions comprehensively. As per India's third Biennial Update Report to the United Nations Framework Convention on Climate Change (UNFCCC), Indian agriculture sectors contributed nearly 75 % of national total methane emissions in 2016 (excluding Land Use, Land Use Change, and Forestry) (MoEFCC, 2021). Owing to this report, the Government of India (GoI) has implemented numerous policies like the National Livestock Mission, Gobar-Dhan Scheme, National Biogas and Organic Manure Programme, National Mission for Sustainable Agriculture, National Innovations in Climate Resilient Agriculture, and Swachh Bharat Mission under Nationally Determined Contribution (NDC) to curtail CH4 like GHGs. However, India has not signed the “Global Methane Pledge” proposed by the European Union and the United States of America to target a 30 % reduction in global methane emissions from 2020 levels by 2030. Since, India is one of the largest producers and exporters of agricultural products, particularly from paddy cultivation and livestock farming, addressing food security both domestically and globally is crucial. Consequently, the CH4 from these sources are viewed as survival emissions rather than luxury emissions (MoEFCC, 2023). So, to account for the efficacy of these policy interventions, we need to have comprehensive updated sector-specific methane emission data and the emission inventory will help us keep track of sectoral emissions and our performance compared to other nations in curbing methane pollution.
National multi-sectoral CH4 emissions were last reported by Garg et al. (2011) for the base year 2008 at the district level (Garg et al., 2011). Although some global inventories have reported CH4 emissions from India in recent years, they primarily relied on Tier I top-down approach, resulting in inconsistent estimations for several sectors (EDGAR, 2023; Saunois et al., 2016). Given the lack of systematic reporting of sector-specific high-resolution activity data, there is a huge challenge in filling the data gaps that estimate comprehensive sectoral CH4 emissions in India. Parashar et al. (1996) reported 4 Tg yr−1 of CH4 from paddy fields for the first time in 1991. Since then, various studies focusing on specific sectors have been conducted, with livestock, solid waste management, and biomass burning being the most extensively examined sectors concerning CH4 emission. The CH4 from the livestock sector have ranged between 7.26 and 15.5 Tg yr−1 from 1990 to 2022 (EDGAR, 2023; Garg et al., 2001). Notably, there have been only four national multi-sectoral emission inventories during this period, all of which were conducted by Garg et al. (2001, 2006, 2011), where the estimated methane ranges from 17.05 to 20.57 Tg yr−1 for 1990 and 2008. Apart from livestock and paddy, the waste management sector, encompassing solid waste burning and landfilling, and both domestic and industrial wastewater sectors, is also responsible for a significant share of CH4. Similarly, activities based on biomass and fossil fuels contribute substantially to national CH4 emissions. However, the lack of updated sector-specific activity data and the coarse spatial distribution of emissions render these estimates incompatible, and huge data gaps lead to large uncertainties in climate studies. Furthermore, it has been observed that many natural and unmonitored sources were excluded from earlier estimates, adding to the uncertainty in identifying regional hotspots. The temporal and spatial diversity of sources outlines the necessity of an updated emission inventory (Sahu et al., 2023a; Mangaraj et al., 2022a, b, 2024a, b; Janardan et al., 2024). This study provides a comprehensive development and spatial analysis of sectoral methane (CH4) hotspots across India at a fine resolution of 0.1° × 0.1° by incorporating 25 natural and anthropogenic sources for the year 2023. This study also offers strategic targets for further climate research. The newly developed methane emission database will be invaluable, not only for advancing regional climate research by filling the data gap in the country but also as an essential tool for policymakers in formulating mitigation strategies.
The present attempt is intended to quantify the recent methane emission budget for India in 2023. The study targets 25 natural and anthropogenic sources, including livestock, rice crop fields, wetlands, oil & gas, solid waste, wastewater, and biomass burning, termite, transportation etc., which are the significant emission sectors in the country. The source-specific emissions are estimated in accordance with the IPCC tier II/III country-specific technological emission factors-based bottom-up approach methodology presented in the supplementary file in Sect. S1 in the Supplement (Sahu et al., 2023a, b, 2021, 2024; Mangaraj et al., 2022a, b, 2024a, b; Sahoo et al., 2024; Samal et al., 2024). The importance of the bottom-up approach lies in the compilation of high-resolution activity data (AD) and regional emission factors (EF). The AD entails gathering comprehensive information at each source level, such as species-wise population data of livestock, water regime-wise crop area and cropping pattern for rice and sugarcane cropping, high-resolution spatial information of each source for thermal power plants (TPP), wastewater treatment facilities, type of wetland area for wetlands, vehicular type, volume of traffic and driving pattern, technology used, age of vehicles, fuel use for transportation, waste and wastewater generation waste management, temperature data for wetland, etc. Similarly, country-specific EF is a pivotal component of developing emission inventory as the sensitivity of the EF decides the uncertainty in the estimation and leads to inappropriate spatial patterns of gridded emission. This study ratified the country-specific proxy-level technological EFs for estimation. The details of AD and EF are presented in Supplement Tables S1, S2, S3, and S4 respectively. The bottom-up framework relies on an emission factor-based formulation, in which emissions from each source category are estimated as a function of activity data, technology-specific emission factors, fuel use, and emission control efficiencies. The sectoral total emissions will then be estimated using established formulations, including sector–specific fuel-wise technology–based equations as per Eq. (1).
where sector, fuel type, technology; E= Total amount of Emission; F= sector-wise fuel amount; Ef = Country specific technology emission factors; A= amount of fuel associated with particular technology where for each kind of fuel and sector.
The detailed methodology, uncertainty estimation, and spatial allocation of emission are presented in Sects. S1, S2, and S3.
3.1 Sectoral contribution to total CH4 emission
The total methane emissions, estimated from 25 types of sources (natural and anthropogenic) in India, is ∼ 37.79 Tg yr−1 in 2023. The agricultural sector, encompassing both livestock and crop fields, emerged as the predominant contributor, accounting for nearly half (∼ 49 %) of the nation's methane emissions. Specifically, livestock enteric fermentation alone is responsible for approximately one-third of agricultural sector emissions, while rice crop fields contributed about 13 %. Wetlands constituted the next significant source, contributing more than one-fifth (8.6 Tg yr−1) of the national total. This is followed by emissions from fossil fuel-based activities, which accounted for approximately 9 % (3.35 Tg yr−1), waste management (∼ 8 %), biomass burning (∼ 5 %), cooking activities (∼ 4 %), and other miscellaneous sources comprising about ∼ 2 % of the total emissions, as illustrated in Fig. 1a.
In the case of livestock, cattle are the major contributors, emitting 6.03 Tg yr−1 (∼ 51 %) of methane due to enteric fermentation. Notably, indigenous cattle are identified as the largest contributors within this category, responsible for ∼ 37 % of the emissions, followed by crossbred cattle (∼ 14 %). It is observed that non-dairy cattle contributed more significantly to methane (∼ 33 %) than dairy cattle (∼ 18 %). Buffaloes also contributed a substantial ∼ 40 % to the emissions, with non-dairy buffaloes being the primary emitters (∼ 24 %), followed by goats (∼ 5 %), sheep (∼ 3 %), and other livestock species as shown in Fig. 1b. Moreover, a similar trend is observed in manure management, where cattle are the leading contributors, responsible for ∼ 45 % of methane emissions, followed by buffaloes (∼ 39 %), poultry (∼ 8 %), pigs (∼ 2.5 %), goats (∼ 2 %), and other species.
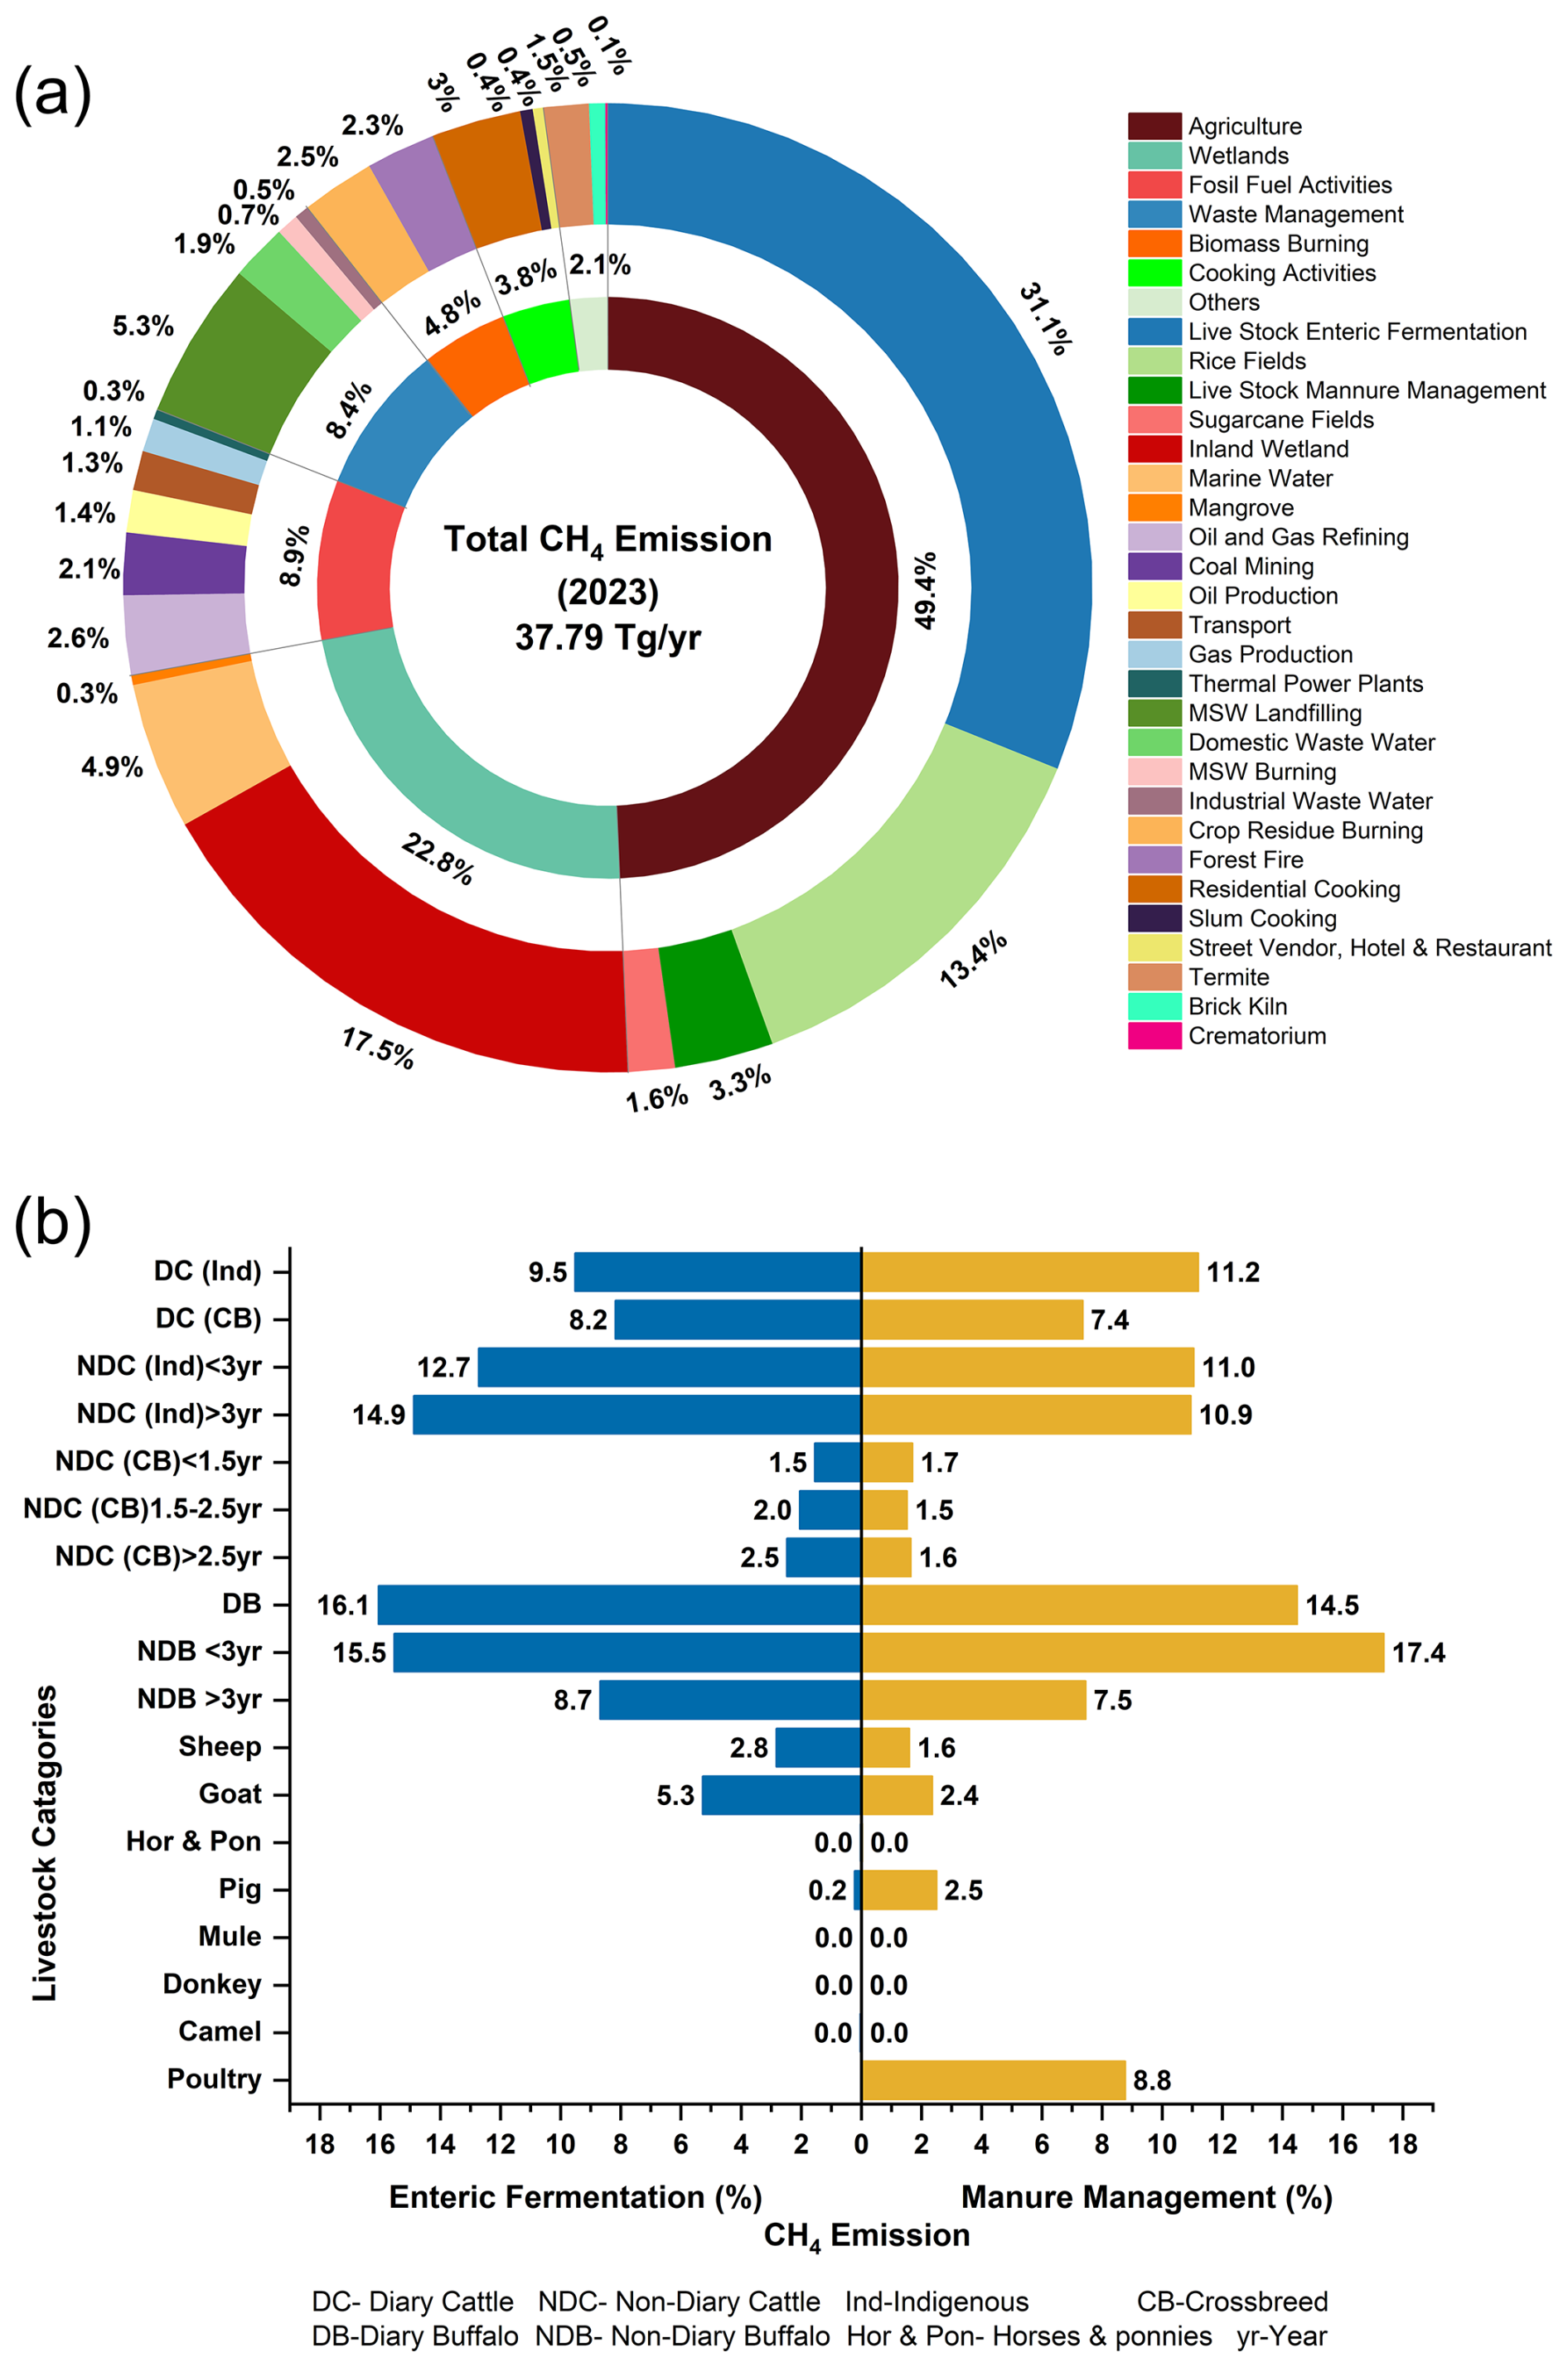
Figure 1(a) Sectoral Contribution of CH4 emission (% total), (b) Livestock (% of sector) in 2023.
Wetlands have emerged as the second largest source of CH4 emissions in India, where the inland wetlands contribute the highest (∼ 17 %) followed by rice fields (∼ 13 %). The present attempt examines the comprehensive coastal CH4 budget, revealing that the marine wetlands in coastal areas emit roughly 1.85 Tg yr−1. Additionally, the sensitive mangrove ecosystems release 0.84 Tg yr−1 into the atmosphere. The emission analysis also included data on rice and sugarcane cropping areas, as well as irrigation statistics, retrieved from the Ministry of Agriculture and Farmers' Welfare. The findings indicate that flooded agricultural lands contribute more significantly to methane emissions compared to single-irrigation or drought-prone regions, with rice fields alone responsible for 5.65 Tg yr−1 of CH4. In addition to wetlands and agricultural lands, MSW landfills are identified as a major source of methane emissions, releasing approximately 2 Tg yr−1. This is followed by cooking activities (∼ 1.4 Tg yr−1) where residential cooking in both rural and urban localities, slum areas, as well as commercial cooking activities do contribute a good fraction.
Further, methane emissions from coal mining and oil and gas extraction processes collectively amount to 1.74 Tg yr−1. Additionally, crude oil refining processes contribute another 1 Tg yr−1 of CH4. The transport and TPP sector, which rely on these fossil fuels, emit an extra 0.62 Tg yr−1. Smaller, but noteworthy, contributions come from fugitive sources like brick kilns and crematories, emitting 0.23 Tg yr−1. Lastly, natural methane emissions from termites were also accounted for, contributing approximately 1.5 % to the total CH4 in 2023.
3.2 Spatial variability in CH4
The spatially resolved estimated CH4 emissions are crucial in identifying precise dominating sources over particular regions. The resolution of the inventory is a significant parameter, as it allows for the precise identification of hotspots and associated dominating sectors contributing to high emissions. As illustrated in Fig. 2a, CH4 from livestock are particularly predominant in Western India, the Indo-Gangetic Plain, and the Deccan Plateau. Specifically, the province of Uttar Pradesh contributed the most (∼ 16 %) to CH4 emissions from the livestock sector as it outnumbered the other states in cattle and buffalo population. It is then followed by Rajasthan (∼ 10 %), Madhya Pradesh (∼ 9 %), Bihar (∼ 7 %) and Gujarat (∼ 7 %). It is very interesting to note that the top 160 districts (out of 785 districts) are responsible for nearly half of the livestock CH4 emissions with Banas Kantha district in Gujarat being the largest emitter with ∼ 99 Gg yr−1.
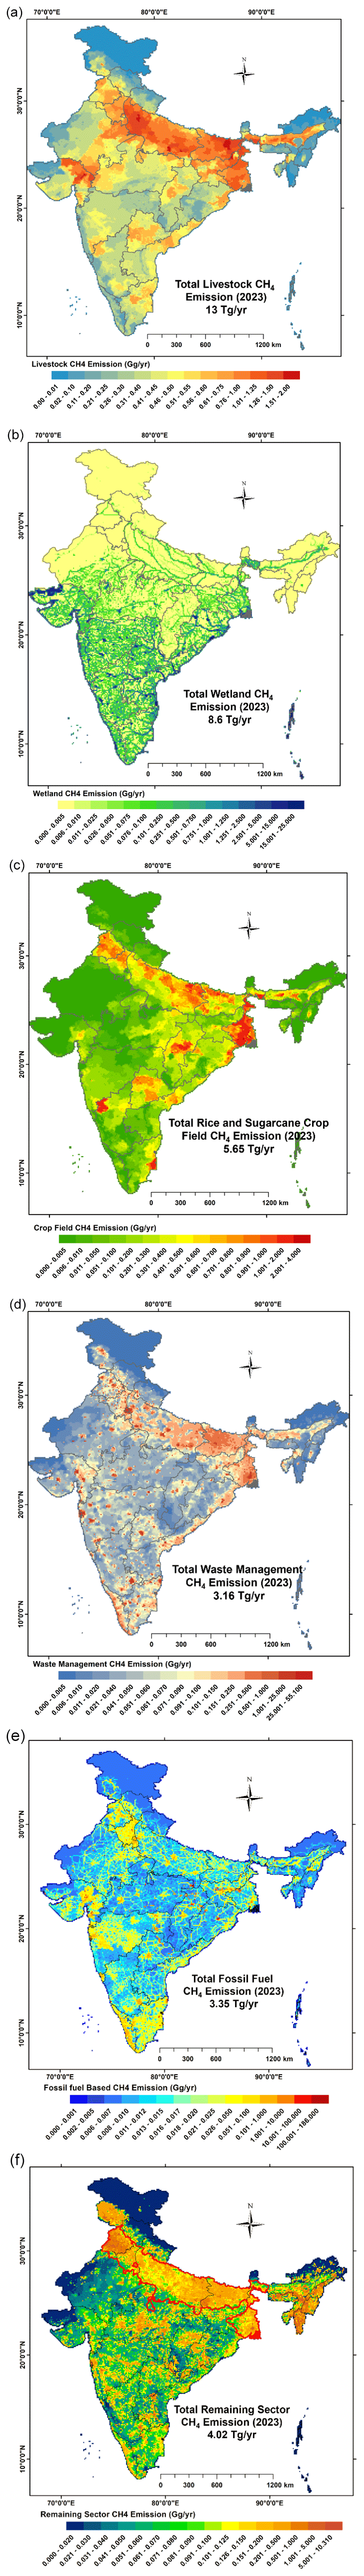
Figure 2Sectoral methane emission from India in 2023 (a) Livestock, (b) Wetland, (c) Rice and Sugarcane Crop Field, (d) Waste Management, (e) Fossil Fuel based Activities, (f) Remaining sector.
Natural sources like wetlands, especially inland water bodies that constitute rivers, lakes, and ponds are the second largest sources of CH4 emissions and are well scattered across the country. Figure 2b reveals that Eastern India is more susceptible to such emissions induced by inland water bodies compared to Western India, largely due to the eastward flow of most major river systems towards the Bay of Bengal. The Ganges, Brahmaputra, Mahanadi, and Godavari river basins, which span the Eastern, Northeastern, Deccan, and Southern peninsular regions, are identified as significant sources of wetland-based CH4 emissions. As some of the notable rivers originated from the Western Ghats and flowed east, the Southern peninsula and the Deccan plateau region became a web of CH4 emission, as presented in Fig. 2b. However, Gujarat comes out as the highest with 1205 Gg yr−1 (∼ 18 %) emitting state from inland water bodies for the Rann of Kachchh and the presence of significant water bodies like Narmada, Tapti and Sabarmati rivers and several lakes and ponds. In addition to it, this study also encompasses emissions from coastal and mangrove forest emissions. Although the Andaman and Nicobar Islands have the largest coastline in India, Gujarat leads in CH4 emissions from coastal water bodies, contributing approximately 506 Gg yr−1 (27 %), primarily due to the presence of numerous coastal creeks. Further, West Bengal is the highest emitter of CH4 from the mangrove ecosystem with 65.1 Gg yr−1 (52 %) due to the Sundarbans delta region. Hence, overall, Gujarat emerges as the highest emitting state from wetlands, accounting for approximately 20 %, followed by the Andaman and Nicobar Islands (12 %), Andhra Pradesh (12 %), Maharashtra (12 %), and Odisha (10 %), It is noteworthy that the top 25 districts contribute to more than half of the total CH4 from wetlands, with the Kachchh district of Gujarat being the largest emitter from the wetland sector. This is followed by North and Middle Andaman (Andaman and Nicobar Islands), South 24 Parganas (West Bengal), South Andaman (Andaman and Nicobar Islands), and Nellore (Andhra Pradesh).
The spatial distribution of CH4 from cropland exhibits a pattern closely aligned with that of inland wetlands, particularly in regions where intensive cropping practices are observed near freshwater bodies and experiencing monsoons. Indo-Gangetic basin, Brahmaputra basin, East Coastal, and the Deccan plateau states are the major rice and sugarcane-producing states, as shown in Fig. 2c. Telangana, Uttar Pradesh, and West Bengal are the largest rice-producing states while Uttar Pradesh, Maharashtra, and Karnataka lead in sugarcane production (MoA & FW, 2024). Consequently, Uttar Pradesh emerges as the highest contributor to CH4 from crop fields, accounting for approximately 1022 Gg yr−1 (18 %) of the total, followed by West Bengal 663 Gg yr−1 (12 %), Chhattisgarh 435 Gg yr−1 (8 %), Bihar 418 Gg yr−1 (7 %) and Telangana 409 Gg yr−1 (7 %). Notably, over 50 % of total emissions from crop fields originate from the top 90 districts out of which Nalgonda (Telangana), Paschim Medinipur (West Bengal) and Karimnagar (Telangana) are the leading emitters.
Waste management poses a significant challenge in developing India, where the burden of waste and its associated pollution has adversely affected urban living conditions. It is evident from Fig. 2d that the Indo-Gangetic Basin states are more susceptible to high emissions than rest India. In solid waste management like burning and landfilling, Uttar Pradesh contributes ∼ 303 Gg yr−1 (13 %), followed by Maharashtra ∼ 229 Gg yr−1 (10 %) and Bihar ∼ 200 Gg yr−1 (9 %). Similarly, in the wastewater management sector, Maharashtra is the largest contributor, responsible for approximately 202 Gg yr−1 (23 %), with Gujarat, Uttar Pradesh, and Tamil Nadu contributing 97 Gg yr−1 (11 %), 79 Gg yr−1 (9 %), and 76 Gg yr−1 (8 %), respectively. Collectively, Maharashtra accounts for the highest proportion of methane emissions from the waste management sector, with 14 %, followed by Uttar Pradesh and Gujarat, with 12 % and 7 %, respectively. Further analysis indicates that more than half of the CH4 emissions from the combined waste management sector originate from the top 100 districts across the country.
Methane is also primarily attributed to traditional fossil fuel consumption for energy, which includes coal mining, TPP, oil & gas extraction, refineries, and transportation activity. The states in the Central and Eastern India region, like Chhattisgarh, Odisha, Jharkhand, and Madhya Pradesh collectively emit two-thirds of CH4 emissions due to intense coal mining activities and substantial coal reserves within these regions. Further, the presence of high-capacity oil refineries in states like Gujarat, Maharashtra, and Assam over Western, and North-Eastern regions is jointly responsible for half of the emissions from the Oil & Gas sector. Though a very small amount is emitted from TPP, Maharashtra, Madhya Pradesh, Chhattisgarh, Uttar Pradesh and Odisha contribute nearly 50 % of emissions due to the presence of supercritical and ultra-supercritical power units. Similarly, significant transport-related emissions dominated over industrialized and populated states like Maharashtra, Rajasthan, Uttar Pradesh, Gujarat and Tamil Nadu, resulting in more than one-third contribution. The inclusive emission from all the sectors shows that Gujarat, Maharashtra, and Assam emit one-third of total from fossil fuel-based activity, as shown in Fig. 2e. The Jamnagar in Gujarat emerges as the largest emitter in India, primarily due to the presence of the country's largest oil refinery.
In addition to the above sources, there are several sectors contributing to methane emission, including organized and unorganized sectors like cooking activities, forest fires, crop residue burning, brick kilns, crematories, and termites. Given the high rural population density in the Indo-Gangetic region compared to the rest of India, emissions from solid fuel and biomass-based cooking activities are notably higher, with Uttar Pradesh and Bihar alone responsible for more than one-fourth of these emissions (MoHA, 2011). Moreover, it is evident from the spatial maps that cities exhibit lower methane emissions due to lower livestock density, limited cropland areas, and improved cooking-fuel penetration as compared to semi-urban and rural regions. Whereas the similar sectors dominate in rural regions, leading to a shift of the hotspots. In accordance with the shifting cultivation practices in Northeastern India, forest fires are predominant sources of emissions in that region. Nearly two-thirds of CH4 come from those Northeastern states, with Mizoram and Assam contributing ∼ 139 Gg yr−1 (16 %) and 112 Gg yr−1 (14 %), respectively. Methane from crop residue burning is predominant in Punjab, responsible for nearly one-fourth of emissions from this sector. Three major agricultural states, Punjab, Madhya Pradesh, and Maharashtra, collectively emit approximately half of CH4 emissions. The unorganized brick kilns sector is particularly found in Indo-Gangetic regions and Central India, where rural population density is high (MoHA, 2011). Though fly ash and concrete bricks are replacing mud bricks in urban and semi-urban areas, Northern states like Uttar Pradesh, Bihar, and Rajasthan still contribute nearly one-third of emissions from this sector. Traditional cremation practice, is another unorganized source of methane emissions, with the number of Hindu adherents in a state serving as a key regulatory factor. Uttar Pradesh and Maharashtra emit 15 Gg yr−1 of CH4 out of 30 Gg yr−1 from the cremation of the deceased. Natural sources of CH4, such as those from termites, have also been accounted for in this study. Emissions were estimated using forest area as a proxy, with dense forests in Jammu and Kashmir contributing to higher termite biomass and, consequently, greater CH4 emissions. Jammu and Kashmir, Madhya Pradesh, and Odisha jointly contribute one-third of emissions from the termites. The state-wise top three dominating sectors and districts listed in Table S5 can be used for mitigation.
The grid-wise analysis depicts in Fig. 3 that 11 740 (∼ 40 %) out of 30 185 grids account for more than 1 Gg yr−1 of methane. The per-capita methane footprint of Indians is found to be 27 kg, and the per square km area CH4 burden is 11.6 t.
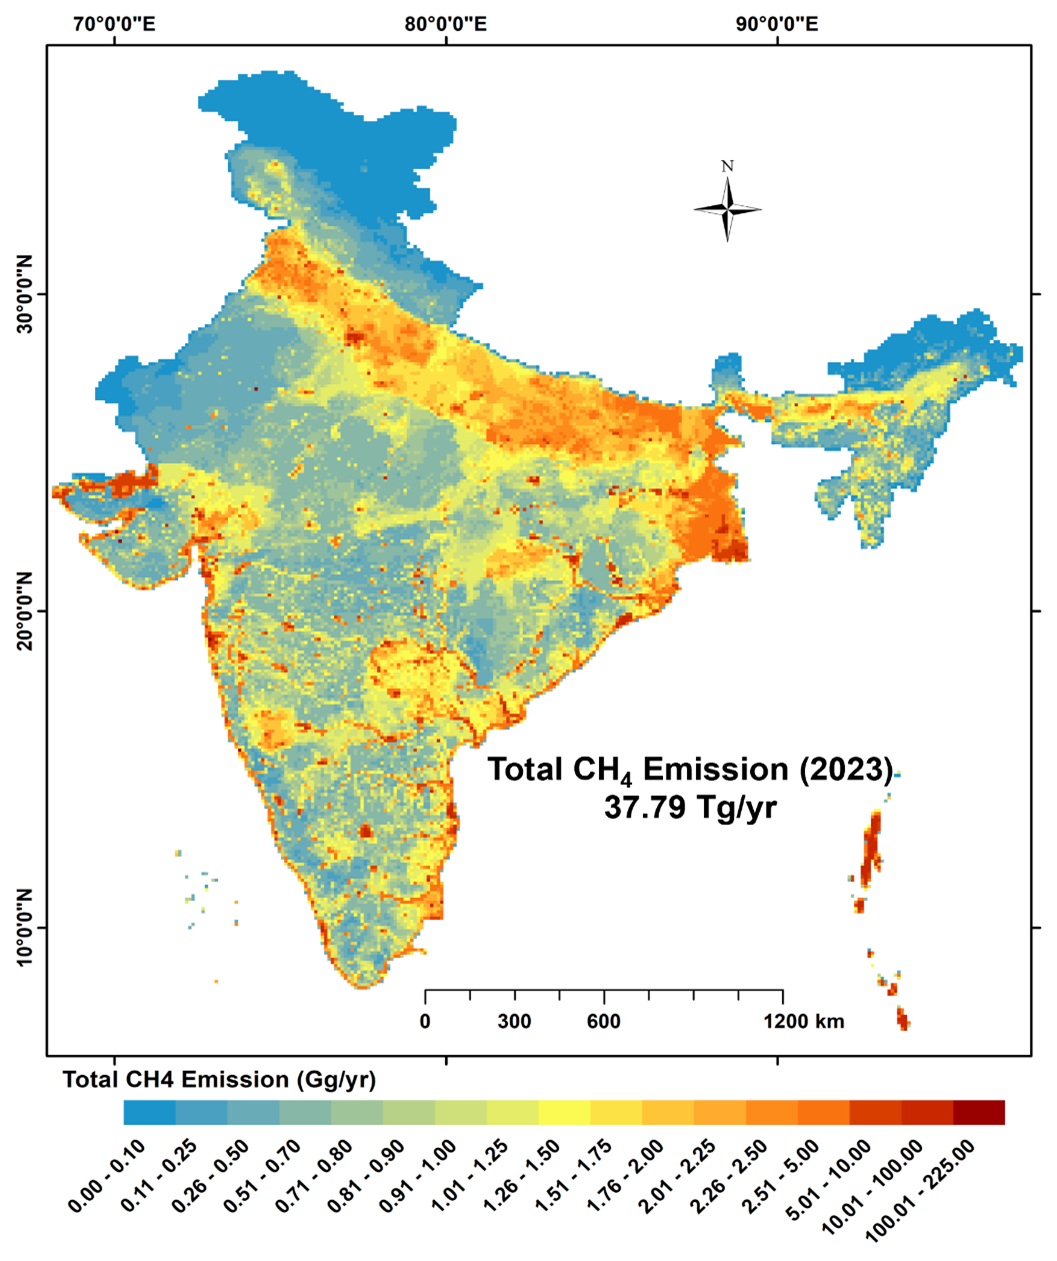
Figure 3Spatial distribution of methane emission for India in 2023.
3.3 Intercomparison with previous studies
The intercomparison of CH4 emissions amongst the current study and previously published papers gives insight into sector-specific contributions and reveals the concurrence and discrepancies in findings over time. Notably, the national-scale comprehensive CH4 emissions from various types of wetland systems and termites are reported for the first time in this study. The latest estimate of methane emissions from India, as reported by EDGAR (2023), amounts to 32.3 Tg yr−1 in 2022. The current study observes a consistent trend of contribution to total emission across most sectors; however, the estimated emissions from wastewater are remarkably high, exceeding the current estimate by more than sevenfold. Unlike the current estimation, EDGAR's lack of regional emission factors has led to some erratic estimates across various sectors. The current study identifies livestock as the largest contributor, with methane emissions amounting to 13 Tg yr−1. This figure is relatively consistent with the EDGAR (2023), which reports a slightly higher value of 15.5 Tg yr−1. Previous studies, including those by Samal et al. (2024), Garg et al. (2011) and Garg et al. (2006), reported emissions of 12.74, 10.11, and 10.62 Tg yr−1, respectively, for base years 2019, 2008, and 2005, indicating that livestock has consistently been recognized as a major source of methane. The variation in estimates is attributable to adopted emission factors, followed by differences in livestock population, feeding practices, and upgraded manure management strategies employed in these studies. It is also important to note that, the current estimate reveals that the agriculture sector comprising livestock and paddy fields accounts for nearly half of the total CH4 emission, which debunks the earlier reporting of the agriculture sector attributed to two-thirds of total emissions from India (Garg et al., 2001, 2006, 2011; EDGAR, 2023). Agricultural activities, particularly rice and sugarcane cultivation, contribute 5.65 Tg yr−1 of methane according to the present study, aligning with the understanding that India's status as a major rice producer significantly influences global methane from this sector. However, the EDGAR (2023) inventory reports a lower emission figure of 4.1 Tg yr−1 from agriculture, which may have resulted from emission factors associated with irrigated versus rain-fed rice paddies. Garg et al. (2011) and Garg et al. (2006) reported lower emissions from agriculture, at 3.88 and 4.02 Tg yr−1, respectively. These discrepancies may reflect changes in agricultural practices, water management practices, or even climatic conditions that affect methane emissions from paddy fields.
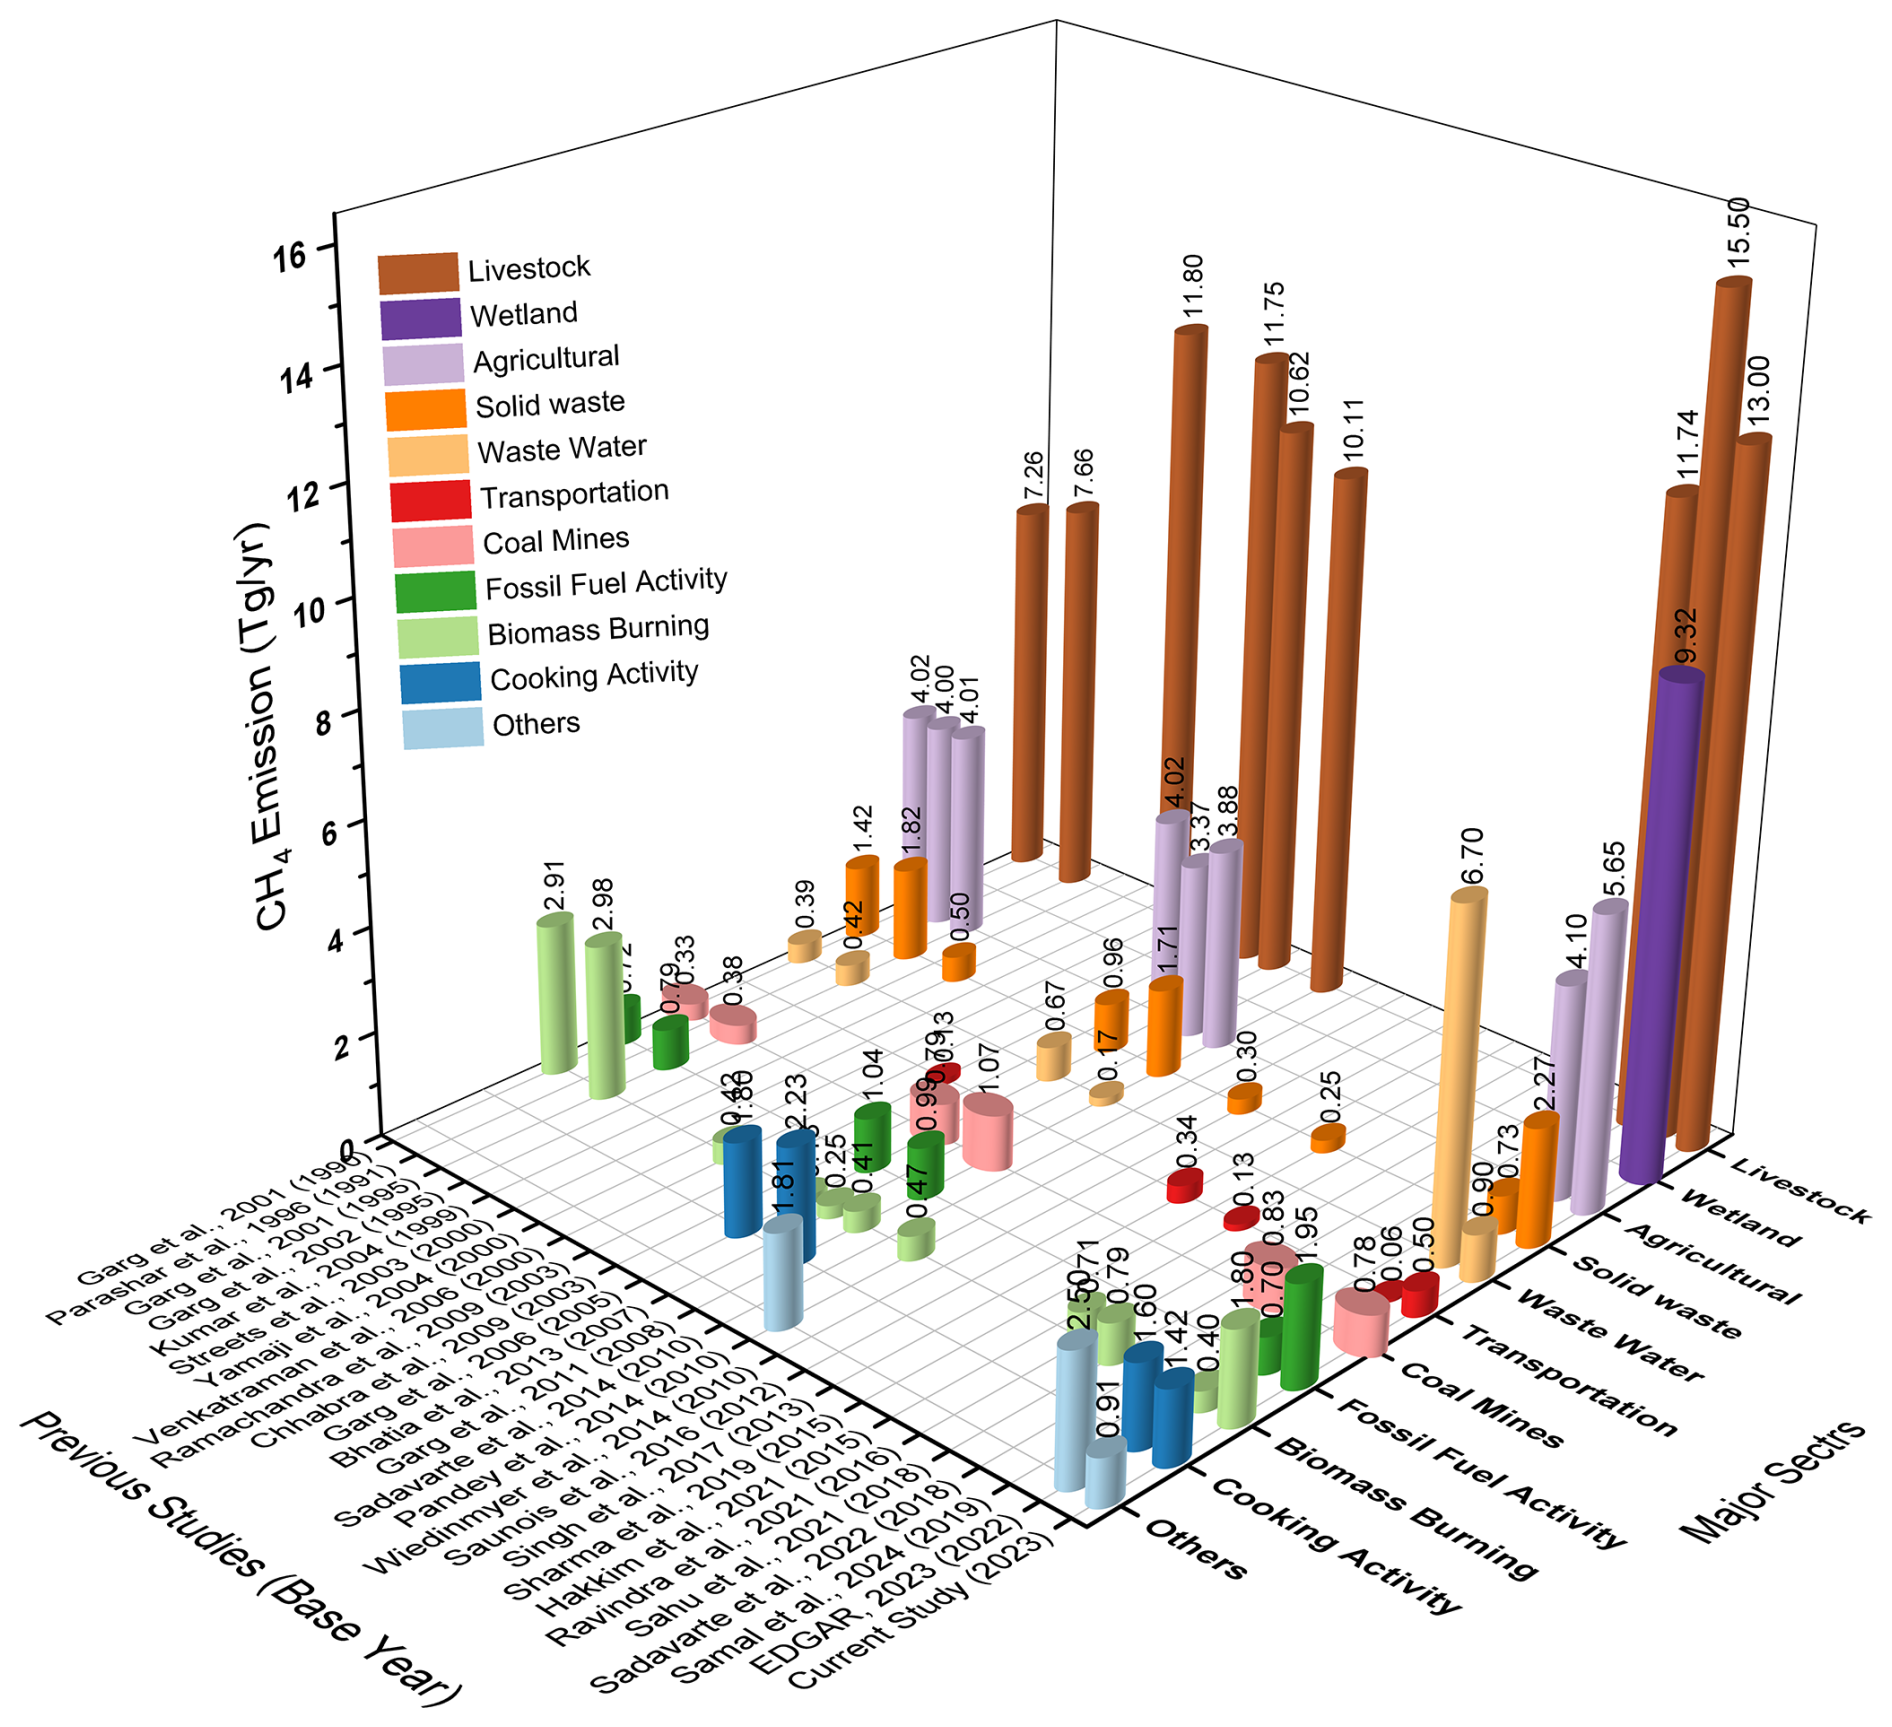
In the current study, methane emissions from waste management are found to be substantial, with 2.27 Tg yr−1 attributed to moderate solid waste management, including both open waste burning and landfilling, and 0.9 Tg yr−1 from the treatment of residential and industrial wastewater. By contrast, the EDGAR (2023) reports significantly higher emissions from wastewater at 6.7 Tg yr−1, yet lower rate from solid waste at 0.73 Tg yr−1. This discrepancy may stem from differences in the scope and methodologies employed in estimating emissions from urban versus rural waste management practices. Garg et al. (2011, 2006) reported methane of 1.71 and 0.96 Tg yr−1 from solid waste, and 0.17 and 0.67 Tg yr−1 from wastewater for the years 2008 and 2005, respectively. Although these figures are lower than those reported in the current study, they suggest a consistent trend in the contribution of waste management to methane emissions over time. In the fossil fuel sector, including emissions from coal mining, the current study estimates methane at 1.95 Tg yr−1, with 0.78 Tg yr−1 specifically attributed to coal-mines. In comparison, EDGAR (2023) reports a lower total of 0.7 Tg yr−1 from fossil fuel activities, suggesting potential underestimation or differences in methodologies used to account for fugitive emissions. Garg et al. (2011, 2006) reported 1.07 and 0.79 Tg yr−1 of methane emissions from fossil fuels, in the respective studies, which are lower figures but still indicate a recognized contribution from this sector over time. The current study estimates methane from biomass burning at 1.8 Tg yr−1 while emissions from cooking activities contribute 1.42 Tg yr−1. These figures align somewhat with previous estimates, such as the 1.6 Tg yr−1 for biomass burning reported in EDGAR (2023). However, estimates for cooking activities vary significantly across studies. For instance, Garg et al. (2011) reported 2.23 Tg yr−1, and Pandey et al. (2014) estimated 2.31 Tg yr−1, both of which are higher than the current study's figure. These variations could reflect differences in the types of fuels considered, the efficiency of stoves, or regional cooking practices. The intercomparison between the current and previous studies is illustrated in Fig. 4.
In the current study, natural sources such as wetlands contribute 8.6 Tg yr−1 of methane (the second most dominant contributor), a notable figure that has not been explicitly detailed in many previous studies. The inclusion of wetlands as a significant source in this study underscores a growing recognition of their importance in methane inventories, likely due to advancements in methodologies for measuring emissions from these ecosystems. While there is a consensus that India is a sink to substantial natural sources of methane, the exact magnitude varies considerably across studies due to differences in methodologies, emission factors used, and the scope of sectors considered. Traditionally, livestock, agriculture, and solid waste have been acknowledged as major contributors. However, the current study emphasizes the higher contributions from natural sources like wetlands and man-made solid waste, reflecting an evolving understanding of methane emissions in India. Moreover, earlier atmospheric methane inversion estimates by Ganesan et al. (2017), Miller et al. (2019), Chandra et al. (2021) and Janardanan et al. (2024) estimated 22 Tg yr−1 (2015), 35 Tg yr−1 (2015), 49 Tg yr−1 (2016), 29.24 Tg yr−1 (2020), respectively over India. The direct quantitative comparison with this 2023 bottom-up inventory is challenging due to varying base year-specific activity data and emission trends. Nevertheless, our national total of 37.79 Tg yr−1 falls comfortably within this observed range of inversion estimates, providing robustness to the inventory's magnitude.
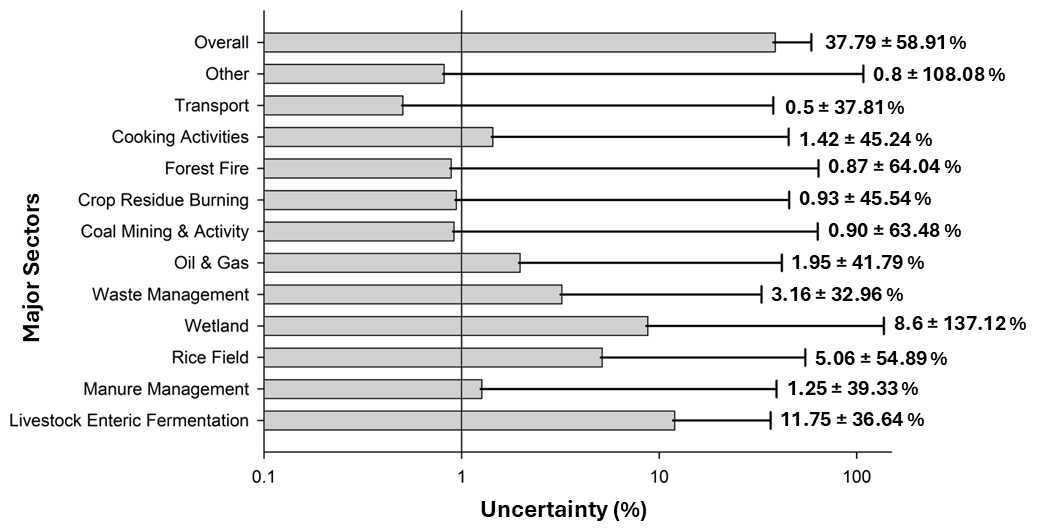
3.4 Uncertainty Estimation
Although the current study on methane emissions in India is extensive, it acknowledges inherent limitations in its estimations. The reliance on secondary activity data and emission factors and the lack of sufficient details introduces a degree of uncertainty. Despite these limitations, the study addresses crucial aspects of filling the data gap and providing support to climate modeling and will be instrumental in identifying methane hotspots across the country. It will also enhance the quantification of the roles played by various natural and anthropogenic sources in the country, thereby assisting policymakers in implementing advanced technological mitigation strategies to reduce methane emissions. The uncertainty of all the individual sectors lies in the range of ±32 %–161 % where the natural sources like wetlands and termites have higher uncertainty levels of ±137 % and ±161 % respectively. The uncertainty estimated from waste management is restricted to ±33 %. The overall uncertainty of the current CH4 emission inventory is found to be ±59 %. The sector-specific uncertainty level is illustrated in Fig. 5. The comparatively higher uncertainty associated with certain source categories, particularly wetlands and termites, primarily reflects deficiencies in high-resolution activity data and the limited availability of region-specific and country-wise emission factors. These natural sources are inherently difficult to constrain due to strong spatial and seasonal variability and their dependence on environmental drivers. Although sectoral uncertainties may affect the magnitude of emissions at localized scales, they do not compromise the integrity of the broader spatial patterns. Most of the previous studies haven't reported the sector-wise uncertainties for India specifically and global studies like Saunois et al. (2025) have reported the uncertainty of ∼ 45 % for Southeast Asia as a whole. This is the mean uncertainty calculated for all other nations in Southeast Asia, including India, where the uncertainty associated with large country like India is unclear. Solazzo et al. (2021) presented the sectoral uncertainties of CH4 in the EDGAR estimation for India. The reported uncertainties in the Energy: fuel consumption sector were found to be 223 %, followed by Oil & Gas (139 %), Waste (107 %), Solid fuels (57 %), Industrial processes and product use (42 %), and Agriculture (42 %). However, the uncertainty reported here is improved with the use of regional activity data, diverse proxy data and regional scale sectoral emission factors. The uncertainty shoots up with the inclusion of natural sources like emissions from Wetlands (Inland wetland, Coastal wetland & Mangroves) and Termites. It is observed that uncertainty associate with small sectors like coal mining, forest fire is high as compared to major traditional sectors like Livestock and paddy field. Besides these sectors, the overall anthropogenic emission uncertainty is found to be ∼ 44 %, improving the reliability of developed present inventory and robustness of the emission dataset. The higher uncertainty for various sources, including natural sources, is due to the paucity of updated technological emission factors. With higher emissions and higher uncertainty of the wetland sector, it alone drives the uncertainty upward.
The data supporting this article has been included as part of the Supplement. The emission dataset can be accessed through the open-access data repository Zenodo: https://doi.org/10.5281/zenodo.14089138 (Sahu, 2024).
The present study not only addresses the reporting of the most recent gridded methane dataset over India by synthesizing country-specific 25 distinct major and minor natural and anthropogenic sources but also fills the gap in the country's methane budget. The total methane emissions for the most recent base year, i.e., 2023, are found to be 37.79 Tg yr−1, with approximately 75 % attributed to anthropogenic activities. Methane data will be a crucial input not only for climate modeling but also for understanding India's contribution to the global methane budget. The study reports many sub-sectors of wetlands and termites, which are the first-of-its-kind to strengthen the understanding of methane emissions in India. This newly developed state-of-the-art, high-resolution gridded methane dataset would be valuable input for climate models to optimize simulation.
The supplement related to this article is available online at https://doi.org/10.5194/essd-18-1367-2026-supplement.
AM wrote the whole paper and analyzed and plotted the scientific data for necessary discussion. PM and PS helped in the analysis and provided useful insight. GB and RJ reviewed the article and suggested a justified conclusion, and SKS conceived the present idea, analyzed the data and reviewed the manuscript.
The contact author has declared that none of the authors has any competing interests.
Publisher's note: Copernicus Publications remains neutral with regard to jurisdictional claims made in the text, published maps, institutional affiliations, or any other geographical representation in this paper. The authors bear the ultimate responsibility for providing appropriate place names. Views expressed in the text are those of the authors and do not necessarily reflect the views of the publisher.
Ashirbad Mishra acknowledges the Mukhyamantri Research and Innovation Fellowship Program (MRIP), Odisha State Higher Education Council (OSHEC) for the fellowship to pursue research work.
This paper was edited by Graciela Raga and reviewed by two anonymous referees.
Chandra, N., Patra, P. K., Bisht, J. S. H., Ito, A., Umezawa, T., Saigusa, N., Morimoto, S., Aoki, S., Janssens-Maenhout, G., Fujita, R., Takigawa, M., Watanabe, S., Saitoh, N., and Canadell, J. G.: Emissions from the Oil and Gas Sectors, Coal Mining and Ruminant Farming Drive Methane Growth over the Past Three Decades, Journal of the Meteorological Society of Japan. Ser. II, 99, 309–337, https://doi.org/10.2151/jmsj.2021-015, 2021.
EDGAR – The Emissions Database for Global Atmospheric Research: GHG emissions of all world countries – JRC/IEA 2023 Report, https://edgar.jrc.ec.europa.eu/report_2023 (last access: 15 June 2024), 2023.
European Commission: Methane emissions, https://energy.ec.europa.eu/topics/carbon-management-and-fossil-fuels/methane-emissions_en (last access: 17 June 2024), 2023.
Ganesan, A. L., Rigby, M., Lunt, M. F., Parker, R. J., Boesch, H., Goulding, N., Umezawa, T., Zahn, A., Chatterjee, A., Prinn, R. G., Tiwari, Y. K., Marcel, and Krummel, P. B.: Atmospheric observations show accurate reporting and little growth in India's methane emissions, Nature Communications, 8, https://doi.org/10.1038/s41467-017-00994-7, 2017.
Garg, A., Bhattacharya, S., Shukla, P. R., and Dadhwal, V. K.: Regional and sectoral assessment of greenhouse gas emissions in India, Atmospheric Environment, 35, 2679–2695, https://doi.org/10.1016/s1352-2310(00)00414-3, 2001.
Garg, A., Shukla, P. R., and Kapshe, M.: The sectoral trends of multigas emissions inventory of India, Atmospheric Environment, 40, 4608–4620, https://doi.org/10.1016/j.atmosenv.2006.03.045, 2006.
Garg, A., Kankal, B., and Shukla, P. R.: Methane emissions in India: Sub-regional and sectoral trends, Atmospheric Environment, 45, 4922–4929, https://doi.org/10.1016/j.atmosenv.2011.06.004, 2011.
Janardanan, R., Maksyutov, S., Wang, F., Nayagam, L., Sahu, S. K., Mangaraj, P., Saunois, M., Lan, X., and Matsunaga, T.: Country-level methane emissions and their sectoral trends during 2009–2020 estimated by high-resolution inversion of GOSAT and surface observations, Environmental Research Letters, 19, 034007–034007, https://doi.org/10.1088/1748-9326/ad2436, 2024.
Mangaraj, P., Sahu, S. K., Beig, G., and Yadav, R.: A comprehensive high-resolution gridded emission inventory of anthropogenic sources of air pollutants in Indian megacity Kolkata, SN Applied Sciences, 4, https://doi.org/10.1007/s42452-022-05001-3, 2022a.
Mangaraj, P., Sahu, S. K., Beig, G., and Samal, B.: Development and assessment of inventory of air pollutants that deteriorate the air quality in Indian megacity Bengaluru, Journal of Cleaner Production, 360, 132209, https://doi.org/10.1016/j.jclepro.2022.132209, 2022b.
Mangaraj, P., Sahu, S. K., and Beig, G.: Development of emission inventory for air quality assessment and mitigation strategies over most populous Indian megacity, Mumbai, Urban Climate, 55, 101928–101928, https://doi.org/10.1016/j.uclim.2024.101928, 2024a.
Mangaraj, P., Sahu, S. K., Beig, G., Mishra, A., and Sharma, S.: What Makes the Indian Megacity Chennai's Air Unhealthy? – A Bottom-up Approach to Understand the Sources of Air Pollutants, Aerosol and Air Quality Research, 24, 240089–240089, https://doi.org/10.4209/aaqr.240089, 2024b.
Miller, S. M., Michalak, A. M., Detmers, R. G., Hasekamp, O. P., Bruhwiler, L. M. P., and Schwietzke, S.: China's coal mine methane regulations have not curbed growing emissions, Nature Communications, 10, https://doi.org/10.1038/s41467-018-07891-7, 2019.
MoA & FW: Ministry of Agriculture and Farmers Welfare: Production Of Important Crops in Three Largest Producing States in 2023-24* (Production in Million Tonnes), Government of India, https://www.indiabudget.gov.in/budget2024-25/economicsurvey/doc/stat/tab118.pdf (last access: 12 June 2024), 2024.
MoEFCC: India Third Biennial Update Report to The United Nations Framework Convention on Climate Change, https://moef.gov.in/uploads/2024/01/INDIA_BUR-3.pdf (last access: 12 June 2024), 2021.
MoEFCC: Ministry of Environment, Forest and Climate Change, Measures to Reduce Methane Emissions, https://pib.gov.in/PressReleaseIframePage.aspx?PRID=1942106#:~:text=Government of India promotes green (last access: 7 September 2024), 2023.
MoHA: Ministry of Home Affairs. Census of India 2011, National Population Register & Socio Economic and Caste Census – India, https://censusindia.gov.in/nada/index.php/catalog/42619 (last access: 9 September 2024), 2011.
NOAA: Global Monitoring Laboratory – Carbon Cycle Greenhouse Gases: https://gml.noaa.gov/ccgg/trends_ch4 (last access: 12 August 2024), 2024.
Pandey, A., Sadavarte, P., Rao, A. B., and Venkataraman, C.: Trends in multi-pollutant emissions from a technology-linked inventory for India: II. Residential, agricultural and informal industry sectors, Atmospheric Environment, 99, 341–352, https://doi.org/10.1016/j.atmosenv.2014.09.080, 2014.
Parashar, D. C., Mitra, A. P., Gupta, P. K., Rai, J., Sharma, R. C., Singh, N., Koul, S., Ray, H. S., Das, S. N., Parida, K. M., Rao, S. B., Kanungo, S. P., Ramasami, T., Nair, B. U., Swamy, M., Singh, G., Gupta, S. K., Singh, A. R., Saikia, B. K., and Batua, A. K. S.: Methane budget from paddy fields in India, Chemosphere, 33, 737–757, https://doi.org/10.1016/0045-6535(96)00223-8, 1996.
Rosentreter, J. A., Borges, A. V., Deemer, B. R., Holgerson, M. A., Liu, S., Song, C., Melack, J., Raymond, P. A., Duarte, C. M., Allen, G. H., Olefeldt, D., Poulter, B., Battin, T. I., and Eyre, B. D.: Half of global methane emissions come from highly variable aquatic ecosystem sources, Nature Geoscience, 14, 225–230, https://doi.org/10.1038/s41561-021-00715-2, 2021.
Sahoo, P., Sahu, S. K., Mangaraj, P., Mishra, A., Beig, G., and Gunthe, S. S.: Reporting of Gridded Ammonia Emission and Assessment of Hotspots across India: A comprehensive study of 24 anthropogenic sources, Journal of Hazardous Materials, 479, 135557–135557, https://doi.org/10.1016/j.jhazmat.2024.135557, 2024.
Sahu, S. K., Mangaraj, P., Beig, G., Samal, A., Pradhan, C., Dash, S., and Tyagi, B.: Quantifying the high resolution seasonal emission of air pollutants from crop residue burning in India, Environmental Pollution, 286, 117165, https://doi.org/10.1016/j.envpol.2021.117165, 2021.
Sahu, S. K.: Methane Emission Data, Zenodo [data set], https://doi.org/10.5281/zenodo.14089138, 2024.
Sahu, S. K., Mangaraj, P., and Beig, G.: Decadal growth in emission load of major air pollutants in Delhi, Earth Syst. Sci. Data, 15, 3183–3202, https://doi.org/10.5194/essd-15-3183-2023, 2023a.
Sahu, S. K., Mangaraj, P., Beig, G., Lund, M. T., Samset, B. H., Sahoo, P., and Mishra, A.: Development and comprehensive analysis of spatially resolved technological high resolution (0.1°×0.1°) Emission Inventory of Particulate Matter for India: A step Towards Air Quality Mitigation, Earth Syst. Sci. Data Discuss. [preprint], https://doi.org/10.5194/essd-2023-310, 2023b.
Sahu, S. K., Mishra, M., Mishra, A., Mangaraj, P., and Beig, G.: Quantification and assessment of hazardous mercury emission from industrial process and other unattended sectors in India: A step towards mitigation, Journal of Hazardous Materials, 470, 134103–134103, https://doi.org/10.1016/j.jhazmat.2024.134103, 2024.
Samal, A., Sahu, S. K., Mishra, A., Mangaraj, P., Pani, S. K., and Beig, G.: Assessment and Quantification of Methane Emission from Indian Livestock and Manure Management, Aerosol and air quality research, 24, 230204–230204, https://doi.org/10.4209/aaqr.230204, 2024.
Saunois, M., Bousquet, P., Poulter, B., Peregon, A., Ciais, P., Canadell, J. G., Dlugokencky, E. J., Etiope, G., Bastviken, D., Houweling, S., Janssens-Maenhout, G., Tubiello, F. N., Castaldi, S., Jackson, R. B., Alexe, M., Arora, V. K., Beerling, D. J., Bergamaschi, P., Blake, D. R., Brailsford, G., Brovkin, V., Bruhwiler, L., Crevoisier, C., Crill, P., Covey, K., Curry, C., Frankenberg, C., Gedney, N., Höglund-Isaksson, L., Ishizawa, M., Ito, A., Joos, F., Kim, H.-S., Kleinen, T., Krummel, P., Lamarque, J.-F., Langenfelds, R., Locatelli, R., Machida, T., Maksyutov, S., McDonald, K. C., Marshall, J., Melton, J. R., Morino, I., Naik, V., O'Doherty, S., Parmentier, F.-J. W., Patra, P. K., Peng, C., Peng, S., Peters, G. P., Pison, I., Prigent, C., Prinn, R., Ramonet, M., Riley, W. J., Saito, M., Santini, M., Schroeder, R., Simpson, I. J., Spahni, R., Steele, P., Takizawa, A., Thornton, B. F., Tian, H., Tohjima, Y., Viovy, N., Voulgarakis, A., van Weele, M., van der Werf, G. R., Weiss, R., Wiedinmyer, C., Wilton, D. J., Wiltshire, A., Worthy, D., Wunch, D., Xu, X., Yoshida, Y., Zhang, B., Zhang, Z., and Zhu, Q.: The global methane budget 2000–2012, Earth Syst. Sci. Data, 8, 697–751, https://doi.org/10.5194/essd-8-697-2016, 2016.
Saunois, M., Stavert, A. R., Poulter, B., Bousquet, P., Canadell, J. G., Jackson, R. B., Raymond, P. A., Dlugokencky, E. J., Houweling, S., Patra, P. K., Ciais, P., Arora, V. K., Bastviken, D., Bergamaschi, P., Blake, D. R., Brailsford, G., Bruhwiler, L., Carlson, K. M., Carrol, M., Castaldi, S., Chandra, N., Crevoisier, C., Crill, P. M., Covey, K., Curry, C. L., Etiope, G., Frankenberg, C., Gedney, N., Hegglin, M. I., Höglund-Isaksson, L., Hugelius, G., Ishizawa, M., Ito, A., Janssens-Maenhout, G., Jensen, K. M., Joos, F., Kleinen, T., Krummel, P. B., Langenfelds, R. L., Laruelle, G. G., Liu, L., Machida, T., Maksyutov, S., McDonald, K. C., McNorton, J., Miller, P. A., Melton, J. R., Morino, I., Müller, J., Murguia-Flores, F., Naik, V., Niwa, Y., Noce, S., O'Doherty, S., Parker, R. J., Peng, C., Peng, S., Peters, G. P., Prigent, C., Prinn, R., Ramonet, M., Regnier, P., Riley, W. J., Rosentreter, J. A., Segers, A., Simpson, I. J., Shi, H., Smith, S. J., Steele, L. P., Thornton, B. F., Tian, H., Tohjima, Y., Tubiello, F. N., Tsuruta, A., Viovy, N., Voulgarakis, A., Weber, T. S., van Weele, M., van der Werf, G. R., Weiss, R. F., Worthy, D., Wunch, D., Yin, Y., Yoshida, Y., Zhang, W., Zhang, Z., Zhao, Y., Zheng, B., Zhu, Q., Zhu, Q., and Zhuang, Q.: The Global Methane Budget 2000–2017, Earth Syst. Sci. Data, 12, 1561–1623, https://doi.org/10.5194/essd-12-1561-2020, 2020.
Saunois, M., Martinez, A., Poulter, B., Zhang, Z., Raymond, P. A., Regnier, P., Canadell, J. G., Jackson, R. B., Patra, P. K., Bousquet, P., Ciais, P., Dlugokencky, E. J., Lan, X., Allen, G. H., Bastviken, D., Beerling, D. J., Belikov, D. A., Blake, D. R., Castaldi, S., Crippa, M., Deemer, B. R., Dennison, F., Etiope, G., Gedney, N., Höglund-Isaksson, L., Holgerson, M. A., Hopcroft, P. O., Hugelius, G., Ito, A., Jain, A. K., Janardanan, R., Johnson, M. S., Kleinen, T., Krummel, P. B., Lauerwald, R., Li, T., Liu, X., McDonald, K. C., Melton, J. R., Mühle, J., Müller, J., Murguia-Flores, F., Niwa, Y., Noce, S., Pan, S., Parker, R. J., Peng, C., Ramonet, M., Riley, W. J., Rocher-Ros, G., Rosentreter, J. A., Sasakawa, M., Segers, A., Smith, S. J., Stanley, E. H., Thanwerdas, J., Tian, H., Tsuruta, A., Tubiello, F. N., Weber, T. S., van der Werf, G. R., Worthy, D. E. J., Xi, Y., Yoshida, Y., Zhang, W., Zheng, B., Zhu, Q., Zhu, Q., and Zhuang, Q.: Global Methane Budget 2000–2020, Earth Syst. Sci. Data, 17, 1873–1958, https://doi.org/10.5194/essd-17-1873-2025, 2025.