the Creative Commons Attribution 4.0 License.
the Creative Commons Attribution 4.0 License.
 | 16 Feb 2026
ForestScan: a unique multiscale dataset of tropical forest structure across 3 continents including terrestrial, UAV and airborne LiDAR and in-situ forest census data
Cecilia Chavana-Bryant
Phil Wilkes
Wanxin Yang
Andrew Burt
Peter Vines
Amy C. Bennett
Georgia C. Pickavance
Declan L. M. Cooper
Simon L. Lewis
Oliver L. Phillips
Benjamin Brede
Alvaro Lau
Martin Herold
Iain M. McNicol
Edward T. A. Mitchard
David A. Coomes
Toby D. Jackson
Löic Makaga
Heddy O. Milamizokou Napo
Alfred Ngomanda
Stephan Ntie
Vincent Medjibe
Pacôme Dimbonda
Luna Soenens
Virginie Daelemans
Laetitia Proux
Reuben Nilus
Nicolas Labrière
Kathryn Jeffery
David F. R. P. Burslem
Dan Clewley
David Moffat
Lan Qie
Harm Bartholomeus
Gregoire Vincent
Nicolas Barbier
Geraldine Derroire
Katharine Abernethy
Klaus Scipal
Mathias Disney
The ForestScan project was conceived to evaluate new technologies for characterising forest structure and biomass at Forest Biomass Reference Measurement Sites (FBRMS). It is closely aligned with other international initiatives, particularly the Committee on Earth Observation Satellites (CEOS) Working Group on Calibration and Validation (WGCV) aboveground biomass (AGB) cal/val protocols, and is part of GEO-TREES, an international consortium dedicated to establishing a global network of Forest Biomass Reference Measurement Sites (FBRMS) to support EO and encourage investment in relevant field-based observations and science. ForestScan is the first demonstration of what can be achieved more broadly under GEO-TREES, which would significantly expand and enhance the use of EO-derived AGB estimates.
We present data from the ForestScan project, a unique multiscale dataset of tropical forest three-dimensional (3D) structural measurements, including terrestrial laser scanning (TLS), unpiloted aerial vehicle laser scanning (UAV-LS), airborne laser scanning (ALS), and in-situ tree census and ancillary data. These data are critical for the calibration and validation of EO estimates of forest biomass, as well as providing broader insights into tropical forest structure.
Data are presented for three FBRMS: FBRMS-01: Paracou, French Guiana; FBRMS-02: Lopé, Gabon; and FBRMS-03: Kabili-Sepilok, Malaysia. Field data for each site include new 3D LiDAR measurements combined with plot tree census and ancillary data, at a multi-hectare scale. Not all data types were collected at all sites, reflecting the practical challenges of field data collection. We also provide detailed data collection protocols and recommendations for TLS, UAV-LS, ALS and plot census measurements for each site, along with requirements for ancillary data to enable integration with ALS data (where possible) and upscaling to EO estimates. We outline the requirements and challenges for field data collection for each data type and discuss the practical considerations for establishing new FBRMS or upgrading existing sites to FBRMS standard, including insights into the associated costs and benefits. All datasets described in this study are openly available. The TLS, UAV-LS and ALS datasets are provided through the ForestScan Project Data Collection in the CEDA archive (https://doi.org/10.5285/88a8620229014e0ebacf0606b302112d, Chavana-Bryant et al., 2025l). Tree census and plot description data for FBRMS-01 (Paracou, French Guiana) are hosted in the CIRAD Dataverse (https://doi.org/10.18167/DVN1/94XHID, Derroire et al., 2025b). Tree census and ancillary data for FBRMS-02 (Lopé, Gabon) and FBRMS-03 (Kabili-Sepilok, Malaysia) are available via a ForestPlots.net data package (https://doi.org/10.5521/forestplots.net/2025_2, Chavana-Bryant et al., 2025k). Together, these repositories provide access to the complete set of datasets released as part of the ForestScan project.
- Article
(15606 KB) - Full-text XML
- BibTeX
- EndNote


Our capability to estimate forest structure and AGB has rapidly advanced, leveraging new remote sensing observations from ground, air, and space. This progress underscores the importance of quantifying and understanding terrestrial carbon sources and sinks, the response of global forests to climate change, and conservation and restoration efforts at local to global scales. These new measurements broadly fall into the following categories:
-
TLS provides highly detailed (centimetre-scale) 3D structural measurements across hectare scales, enabling non-destructive AGB estimates that are independent of, yet complementary to, empirical allometric model estimates (e.g. Calders et al., 2022; Demol et al., 2024).
-
UAV-LS has evolved from highly specialised and expensive surveying platforms to more operational, low-cost systems that offer coverage of several to thousands of hectares, with hundreds to thousands of points per square metre from above. These data can be used to estimate forest canopy height, basal area, tree crown size and shape, vertical structure, and AGB via allometric model functions of tree properties, including height, diameter at breast height (DBH), and crown shape (Brede et al., 2022a; Kellner et al., 2019) However, as UAV-LS systems proliferate, the need for intercalibration between sensors increases, due to differences in scanner and laser properties such as power, wavelength, divergence, and scan rate, which result in notable variations in penetration and object detection rates (Vincent et al., 2023).
-
Airborne laser scanning (ALS) has been a well-established tool in forestry and forest ecology since the 1990s. ALS is routinely used to estimate forest height, structure, and AGB at stand level via empirical models and at regional to national scales via allometric models (Duncanson et al., 2019; Jucker et al., 2017).
-
Spaceborne Light Detection and Ranging (Spaceborne LiDAR) (e.g. GEDI, ICESat, and ICESat-2) can provide estimates of forest height in non-continuous footprints of tens to hundreds of metres, underpinning most large-scale AGB maps, particularly in the lowland tropics (Avitabile et al., 2011; Avitabile et al., 2016; Saatchi et al., 2011). Various satellite missions have also provided empirical evidence for correlations between the radar signal and AGB for AGB < 250 Mg ha−1 (Askne and Santoro, 2012), but the ESA BIOMASS mission, launched on 29 April 2025, is the only mission specifically targeting higher biomass tropical forests (Quegan et al., 2019; Ramachandran et al., 2023).
The current challenge is to consistently collect and process plot-based measurements in support of EO-derived AGB, combine them, integrate them with long-term ground-based inventory approaches, and optimally use them with EO data. There is increasing recognition that the value of large-scale EO approaches to assessing AGB and forest structure largely depends on robust calibration and validation data (Duncanson et al., 2019; Nature Editorial Team, 2022; Ochiai et al., 2023). This knowledge and capability gap have led to calls for concerted international funding and coordination to establish long-term Forest Biomass Reference Measurement Sites (FBRMS), with a particular focus on tropical forests (Labrière et al., 2023; Schepaschenko et al., 2019).
Here, we present a new dataset from the European Space Agency (ESA) funded ForestScan project, which contributes to this aim and provides access to data from the first three FBRMS of the GEO-TREES network. The project has collected data, including TLS, UAV-LS, ALS, and census data, covering three FBRMS across the tropics. We describe these data, related data collection and processing protocols and tools, and make brief recommendations for future data collection for FBRMS.
2.1 ForestScan Forest Biomass Reference Measurement Sites (FBRMS)
Three Forest Biomass Research Monitoring Sites (FBRMS) were selected based on various criteria, including the availability of well-established plots, the representativity of tropical forest types and climates, established collaborations, agreements and logistical support with in-country partners, and the availability of previously collected data, particularly census data, as well as ALS and TLS data. The chosen sites were:
-
FBRMS-01: Paracou Research Station, French Guiana
-
FBRMS-02: Station d'Etudes des Gorilles et Chimpanzés, Lopé National Park, Gabon
-
FBRMS-03: Kabili-Sepilok, Malaysian Borneo
2.1.1 FBRMS-01: Paracou Research Station, French Guiana
The Paracou research station is located near Sinnamary in the northern part of French Guiana, at a latitude of 5°18′ N and a longitude of 52°53′ W. It is established on a long-term concession of the French National Centre for Space Studies (CNES) and is managed by Centre de Coopération Internationale en Recherche Agronomique pour le Développement-Unité Mixte de Recherche Écologie des Forêts de Guyane (Cirad-UMR EcoFoG). The station experiences an equatorial climate characterised by two main climatic periods: a well-marked dry season from mid-August to mid-November and a long rainy season, often interrupted by a short drier period between March and April. The station receives approximately 3000 mm of rainfall annually (mean annual precipitation from 2004 to 2014: 3102 mm) and has a mean annual temperature of 25.7 °C.

Figure 1Multi-scale map depicting the location and spatial distribution of research plots at Paracou Research Station, French Guiana. (a) Location of French Guiana (green) within South America. (b) Location of Paracou Research Station (green) within French Guiana. (c) Detailed site map showing the spatial distribution of research plots with treatment-specific colours, UAV-LS coverage (yellow solid outline), and ALS coverage (yellow dashed outline). The map displays 15 experimental 4 ha plots, each containing four 1 ha subplots numbered 1–4 (60 subplots in total; plots 1–12: silvicultural treatments; plots 13–15: Biodiversity monitoring), one large 40 ha Biodiversity plot (plot 16; red), and 10 GuyaFlux plots (yellow). Treatment categories include: Biodiversity monitoring plots (plots 13, 14, 15, 16; red), T0 Control (plots 1, 6, 11; green), T1 Selective logging (plots 2, 7, 9; dark blue), T2 Selective logging + thinning by timber stand improvement (TSI; plots 3, 5, 10; cyan), and T3 Selective logging + TSI + fuelwood harvesting/FW (plots 4, 8, 12; pink). The three FBRMS-01 subplots – FG5c1 (subplot 1 of plot 5), FG6c2 (subplot 2 of plot 6), and FG8c4 (subplot 4 of plot 8) – are shown in solid orange and were surveyed using terrestrial laser scanning (TLS) with corresponding tree census data. The GuyaFlux tower location is indicated by a black triangle with radiating transmission waves, and the Base Camp location is marked with a white square. Scale bar: 800 m. Map data: Natural Earth 10 m cultural vectors. Satellite imagery basemap: Imagery © 2024 Google. Map projection: WGS84 (EPSG:4326).
The core area of the Paracou research station (approximately 500 ha) is predominantly covered by lowland terra firme rainforest. This old-growth forest has experienced no major human disturbance, although there are signs of pre-Columbian activities. Species richness is high, with more than 750 woody species recorded, and 150–200 tree species per hectare with DBH above 10 cm. A few dominant botanical families characterise the vegetation: Fabaceae, Chrysobalanaceae, Lecythidaceae, Sapotaceae, and Burseraceae. The local heterogeneity of the floristic composition is mainly driven by soil drainage. AGB, measured on trees with a DBH ≥ 10 cm, ranges from 286.10 to 450 Mg ha−1.
Following an initial inventory in the early 1980s, 12 permanent 6.25 ha plots were established in 1984. Plot corners, perimeters, and inner trails (defining four subplots) were verified ∼ 10 years later by a professional land surveyor. Nine plots were logged, and six received additional silvicultural treatments between 1986 and 1988, creating a disturbance gradient with AGB losses of 18 %–25 % (treatment 1), 40 %–52 % (treatment 2), and 48 %–58 % (treatment 3). In the early 1990s, three more 6.25 ha plots and one 25 ha plot were added, totalling ∼ 120 ha of forest censused annually (controls), biennially (disturbed plots), or every five years (25 ha plot). All 6.25 ha plots are subdivided into four subplots (see Fig. 1), with relative tree coordinates recorded. Trees and palms ≥ 10 cm DBH are mapped, identified, tagged, and periodically measured, forming a database of > 70 000 trees. Since 2003, a 57 m flux tower has measured greenhouse gas fluxes, and an N, P, NP fertilisation experiment has been ongoing since 2015.
2.1.2 FBRMS-02: Lopé National Park, Gabon
Lopé National Park is a 5000 km2 protected area in central Gabon (Latitude 0°30′ S and Longitude 11°30′ E), comprising predominantly intact old-growth moist tropical forest. The northern part of the park features a savanna-forest mosaic, an anthropogenically maintained remnant of the landscape from the Last Glacial Maximum. The broader landscape is designated as a UNESCO World Heritage Site.
The transition from savanna to old-growth forest in the northern part of the park is characterised by six distinct forest types (Cuni-Sanchez et al., 2016; White et al., 1995): (i) savanna, (ii) colonising forest, (iii) monodominant Okoume forest, (iv) young Marantaceae forest, (v) mixed Marantaceae forest, and (vi) old-growth forest.
A substantial and varied body of literature has emerged from research conducted in Lopé National Park (Agence Nationale des Parcs Nationaux, 2025). More than 100 long-term censused forest plots have been established within the park, contributing significant ground data for the calibration and validation of EO instruments (i.e. Duncanson et al., 2022; Saatchi et al., 2019). These plots also support various other research activities, such as the Global Ecosystem Monitoring (GEM) Network, an initiative aimed at understanding forest ecosystem functions and traits (Malhi et al., 2021).
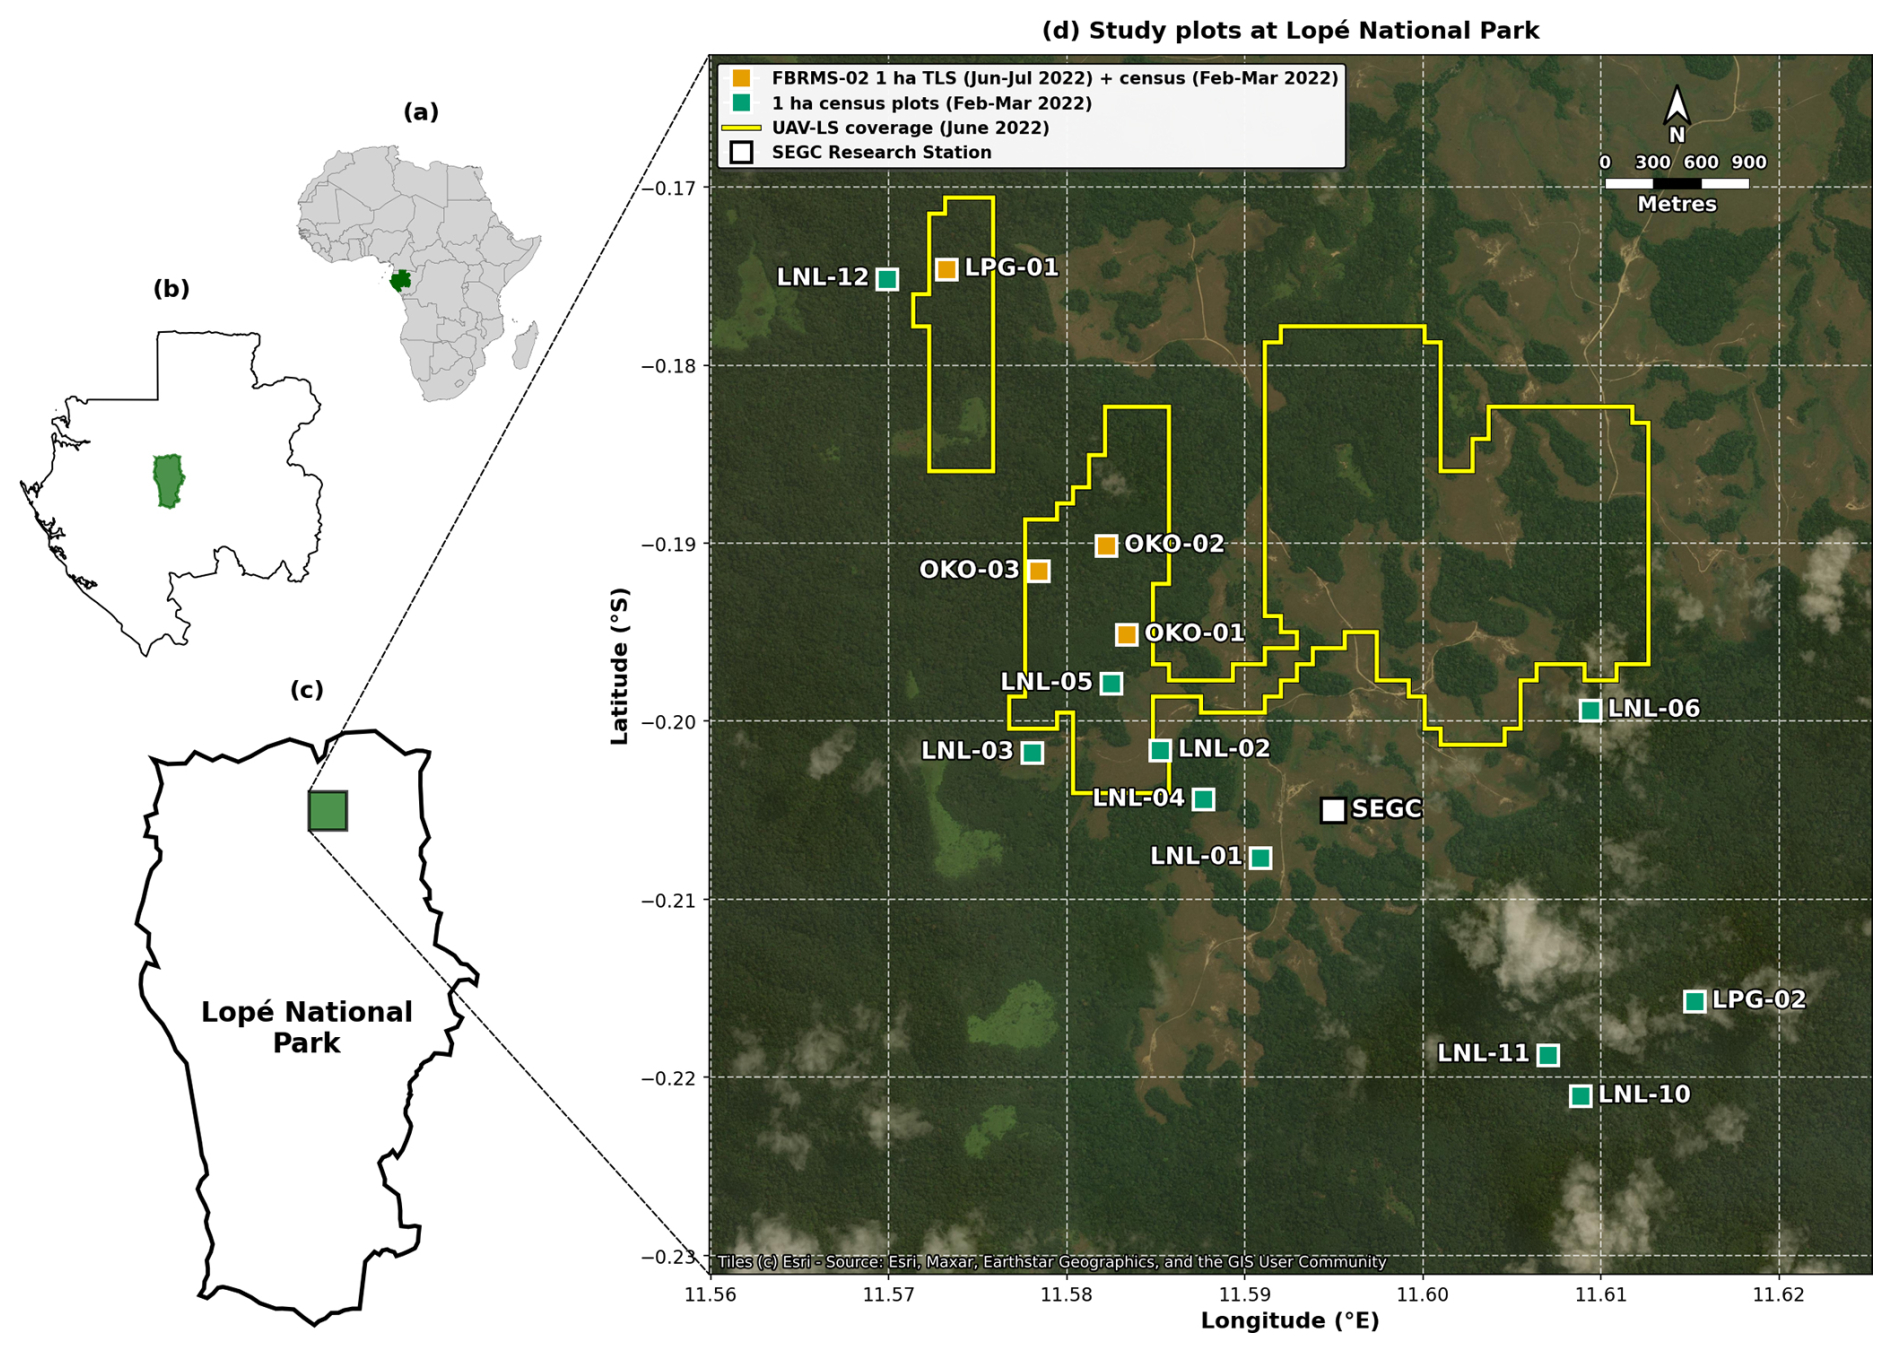
Figure 2Multi-scale map showing the location and spatial distribution of research plots within Lopé National Park, Gabon. (a) Location of Gabon (green) within Africa. (b) Location of Lopé National Park (green) within Gabon. (c) Park boundary showing the research site location (green). (d) Detailed site map showing the spatial distribution of 14 one-hectare research plots. The four ForestScan FBRMS-02 plots (LPG-01, OKO-01, OKO-02, OKO-03; orange squares) were scanned using TLS during June–July 2022 with tree census data collected during February–March 2022. Tree census data was also collected for another ten plots (green circles) which are not part of the ForestScan project. Yellow outlined areas indicate coverage of UAV-LS conducted in June 2022. The SEGC (Station d'Études des Gorilles et Chimpanzés) research station is marked with a white square. Map data: Natural Earth 10 m cultural vectors. Satellite imagery basemap: Esri World Imagery (Esri, Maxar, Earthstar Geographics, and the GIS User Community). Powered by Esri. Map projection: WGS84 (EPSG:4326).
2.1.3 BRMS-03: Kabili-Sepilok, Malaysian Borneo
The Kabili-Sepilok Forest Reserve is located on the Sandakan Peninsula in North-East Sabah, Malaysia, and encompasses approximately 4300 ha of intact old-growth tropical forest. Sepilok has been protected since its establishment by the Sabah Forest Department in 1931. The elevation ranges from 50 to 250 m a.s.l. This topographic variation, combined with edaphic differences, results in three distinct forest types: (i) lowland mixed dipterocarp forest overlaying alluvial soil in the valleys, (ii) sandstone hill forest on hillsides and crests, and (iii) lowland mixed dipterocarp and kerangas forest at higher elevations (Sabah Forestry Department, 2025).
Between 1995 and 2000, the Ecology Section of the Sabah Forestry Department established 36 one-hectare censused forest stands across these forest types, as illustrated in Fig. 3.
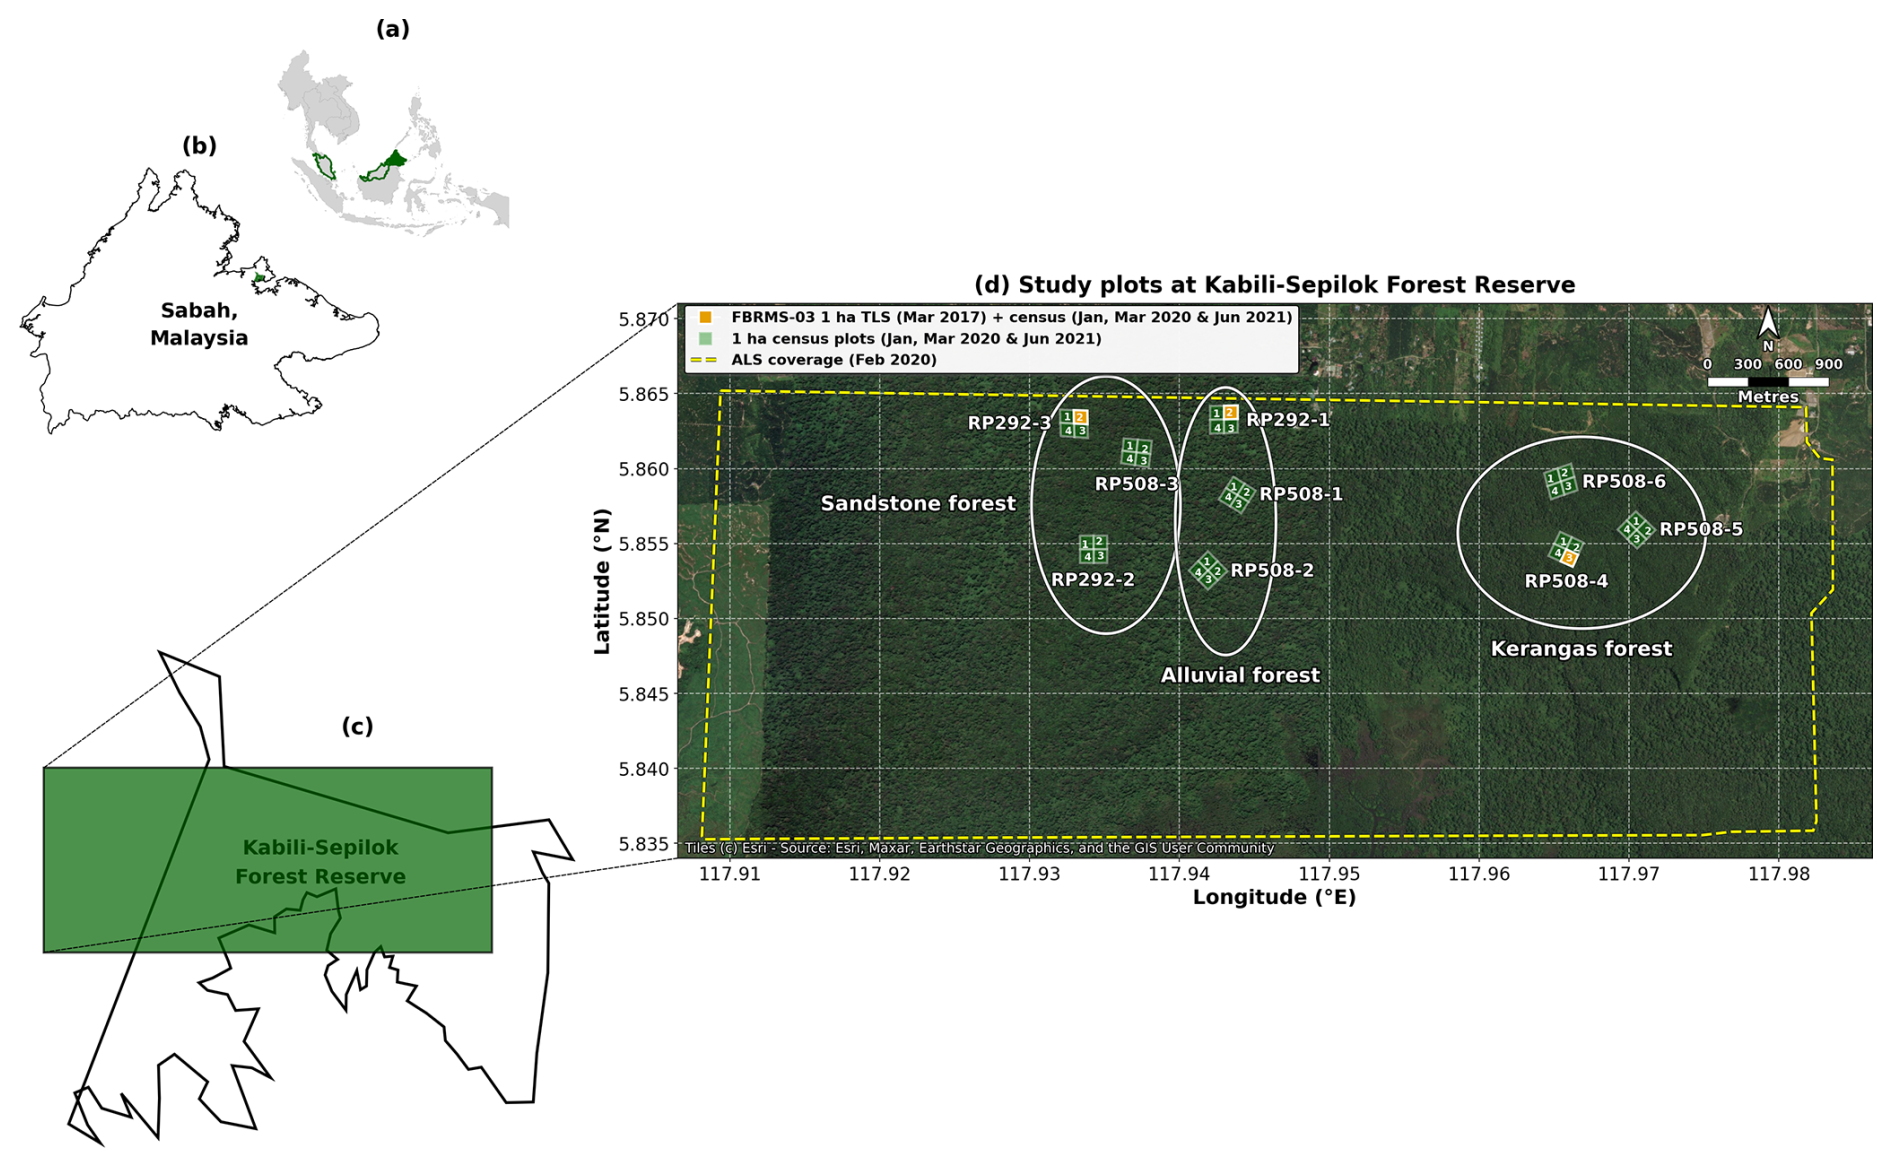
Figure 3Multi-scale map showing the location and spatial distribution of research plots at Kabili-Sepilok Forest Reserve, Sabah, Malaysian Borneo. (a) Location of Sabah (green) within Malaysia (green boundary) in Southeast Asia. (b) Location of the Kabili-Sepilok Forest Reserve (green) within Sabah. (c) Kabili-Sepilok Forest Reserve area and site map area of panel (d) (green rectangle). (d) Detailed site map showing the spatial distribution of 9×4 ha plots (labelled RP291-1, RP292-3, etc.) each containing four 1 ha subplots numbered 1–4 (36 subplots in total; green polygons with white subplot numbers) across three soil types: Alluvial forest, Sandstone forest, and Kerangas forest (delineated by white ellipses). The three FBRMS subplots are SEP-11 (subplot 2 of plot RP292-3, sandstone soil), SEP-12 (subplot 2 of plot RP292-1, alluvial soil) and SEP-30 (subplot 3 of plot RP508-4, kerangas soil). Three ForestScan FBRMS-03 1 ha subplots (orange squares) were scanned using TLS during March 2017 and tree census for all subplots was collected in January, March 2020 and June 2021. Yellow dased outline indicates ALS coverage acquired in February 2020. Scale bar: 900 m. Map data: Natural Earth 10 m cultural vectors. Satellite imagery basemap: Esri World Imagery (Esri, Maxar, Earthstar Geographics, and the GIS User Community). Powered by Esri. Map projection: WGS84 (EPSG:4326).
2.2 Data
2.2.1 Tree census
Quality-controlled, tree-by-tree data on identity (tag number and species) and diameter size for all sampled plots in each of the three FBRMS were collected using global standard tropical forest plot inventory protocols (Forestplots.Net et al., 2021). This ensured a consistent, full species-level census for all plot trees with a diameter equal to or greater than 10 cm at each FBRMS. Censuses provide tree-by-tree records that can potentially be linked to laser-scanning approaches. Species identity plays a key role in determining tree biomass through its strong influence on wood density. While laser-scanning techniques provide excellent measurements of tree dimensions (such as height and volume), they still require wood density estimates to convert these volumes into accurate biomass values (see Goodman et al., 2014). Census data also provide tree-by-tree measurements of tree diameter and whole forest basal area. Finally, because they are independent of constantly changing sensor technologies, when sustained over time, the core measurement protocols in forest plots deliver long-term consistency for tracking forest biomass change, growth, mortality, demography, and their trends over decades.
Census data for FBRMS plots in Gabon and Malaysia are available via ForestPlots.net (https://forestplots.net/, last access: 14 January 2026, Forestplots.Net et al., 2021; Lopez-Gonzalez et al., 2011). ForestPlots.net is an internet-based facility with functionality to support all aspects of forest plot data management, including archiving, quality control, sharing, analysis, and data publishing via stable URLs (DOIs). ForestPlots.net currently supports the data management needs of more than 2000 contributors working with 7000 plots across 23 participating tropical networks. Data access requires potential users to provide details of their planned use and agreement to abide by requirements for the inclusion of all contributing researchers. This encourages maximum inclusivity of data originators and is recognised as a key part of what is required to maintain long-term investment in people and infrastructure that enables continued measurements in these areas (de Lima et al., 2022).
Tree census: FBRMS-01: Paracou, French Guiana
In the Paracou FBRMS, tree censuses are conducted by two teams of three to five permanent field staff using Qfield on field tablets (since 2020, field computers were used prior to this). Tree girth is measured with a measuring tape at 1.3 m, except when buttresses necessitate a higher measurement point. The point of measurement (POM) is marked with paint to ensure the exact same point of measurement between censuses. POM and its potential changes are recorded. New recruits – trees that have grown beyond 10 cm DBH since the previous survey – are recorded by the field team using vernacular names, and their positions are measured relative to the original trees. To ensure accurate identification, periodic botanical campaigns are conducted by one or two experienced botanists, who also correct any misidentifications. When species cannot be identified in the field, samples are collected and examined at the EcoFoG herbarium in Kourou or the IRD herbarium in Cayenne. All identifications follow the Angiosperm Phylogeny Group (APG) IV plant classification system. Dead trees and the cause of their death are recorded. Data are checked for errors after field census using an R script. Any abnormal measurement (e.g., girth showing abnormal increase/decrease, missing value) is then rechecked in the field in the weeks following the initial census.
Plot descriptions for the Paracou FBRMS plots FG5c1, FG6c2 and FG8c4 are accessible via the Guyafor DataVerse (https://dataverse.cirad.fr, last access: 4 February 2026). This internet-based data repository provides plot descriptions and datasets downloadable as CSV files, together with the corresponding metadata (Derroire et al., 2025a). The ForestScan Project data package, including the latest tree census data used in our analysis and collected in August 2023 for FBRMS plot FG5c1, in June 2023 for plot FG6c2, and in September 2023 for plot FG8c4, is accessible at the following DOI: https://doi.org/10.18167/DVN1/94XHID (Derroire et al., 2025b).
Tree census: FBRMS-02: Lopé, Gabon
In the Lopé FBRMS, tree census data was collected at 12 plots in 2017 for the ESA AfriSAR campaign. During June–July 2022, these 13 plots plus one additional 1 ha plot (LPG-02) were re-censused, making a total of 11×1 ha forest plots, plus 3×1 ha plots in savanna (see Fig. 2). The 10 ha plots included LPG-01, OKO-01, OKO-02 and OKO-03, the 4×1 ha FBRMS plots where TLS was conducted in 2017 and 2022.
Tree census: FBRMS-03: Kabili-Sepilok, Malaysian Borneo
In the Kabili-Sepilok FBRMS, tree census data was collected during 2020–2022 for a total of 9×4 ha plots (IDs RP291-1, RP292-3, etc. see Fig. 3) each containing four 1 ha subplots numbered 1–4 and covering most of the long-term plots at this site. The three FBRMS subplots SEP-11 (subplot 2 of plot RP292-3, sandstone soil), SEP-12 (subplot 2 of plot RP292-1, alluvial soil) and SEP-30 (subplot 3 of plot RP508-4, kerangas soil) were scanned using TLS during March 2017 and tree census for all subplots was collected in January, March 2020 and June 2021. The 2020–2022 census was overdue as these plots had not been censused since 2013.
Plot meta-data, including geography, institution, personnel and historical context, as well as tree-level census attributes (tag, identity, diameter, point of measurement, stem condition, height, sub-plot, and, where measured x, y coordinates of 5×5 m subplots) and multi-census attributes (tree demography and measurement trajectory and protocols, including growth, point of measurement changes, recruitment, mortality, and mortality mode) were recorded for all Gabonese and Malaysian FBRMS plots.
The ForestScan Project data package, includes data from the 2022 tree census collected during February and March for the Gabon FBRMS plots and the Malaysian FBRMS plots census data collected in October 2020 for FBRMS plot SEP-11, in March 2020 for plot SEP-12, and in June 2021 for plot SEP-30. This data package can be accessed at the following DOI: https://doi.org/10.5521/forestplots.net/2025_2 (Chavana-Bryant et al., 2025k).
2.2.2 Terrestrial Laser Scanning (TLS)
TLS data was collected to provide state-of-the-art estimates of tree- and stand-scale AGB for each FBRMS. These LiDAR measurements, collected using the protocol described in the following sections, produce 3D point clouds with millimetre-level accuracy representing the forest at each FBRMS. TLS chain sampling protocols (Wilkes et al., 2017), as illustrated and described in Fig. 4, were employed at all three FBRMS. This data was processed to construct explicit Quantitative Structural Models (QSMs) describing individual trees within each FBRMS with a DBH ≥ 10 cm. Tree- and stand-scale AGB estimates were then calculated from the volumes of these models, using wood density values derived from published sources based on species identification from botanical surveys.
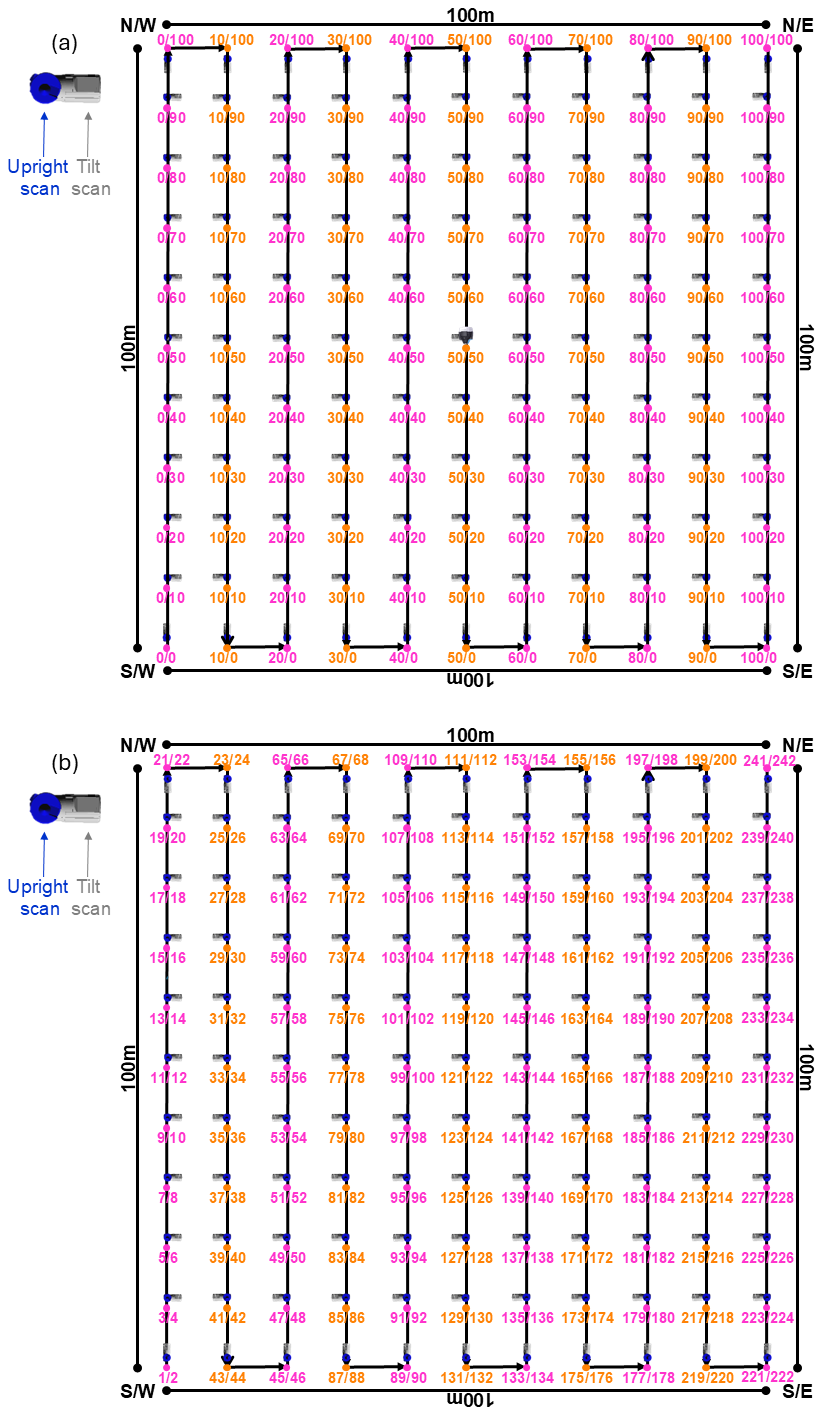
Figure 4TLS chain sampling was employed to capture high-quality LiDAR data suitable for accurate tree- and stand-scale AGB estimation. Chain sampling was deployed over a 10 m Cartesian grid, resulting in 11 sampling lines with 11 scan positions along each line (i.e., 0–10) within 1 ha forest plots. Sampling lines were established in a south-to-north direction (standard practice) and colour-coded using flagging tape, with the ID of each scan position written in permanent marker. Scan positions were identified by their line number and grid position, as shown in panel (a) (top). Due to the scanner's 100° field of view, capturing a complete scene at each scan position required two scans – upright and tilted. Consequently, 242 scans were collected from 121 positions at each 1 ha forest plot. The order in which the 242 individual scans were collected at each plot is depicted in panel (b) (bottom). The first scan at each plot was collected at the southwest corner, i.e., scan position 0,0 (unless impeded by obstacles such as streams, large tree falls, etc., or if the plot was oriented differently). To facilitate scan registration, all tilt scans along the first sampling line were oriented towards the same sampling position along the next sampling line, and all other tilt scans along plot edges were oriented towards the inside of the plot so that the previous scan location was within the tilt-scan field of view. Depending on the density of the canopy understory, terrain, and wind conditions (ideally, low to zero wind and no rain or mist/fog), a team of three experienced TLS operators required 1–2 full working days (8 h d−1) to set up the c hain sampling grid and 3–5 full days to complete the scanning of a 1 ha plot.
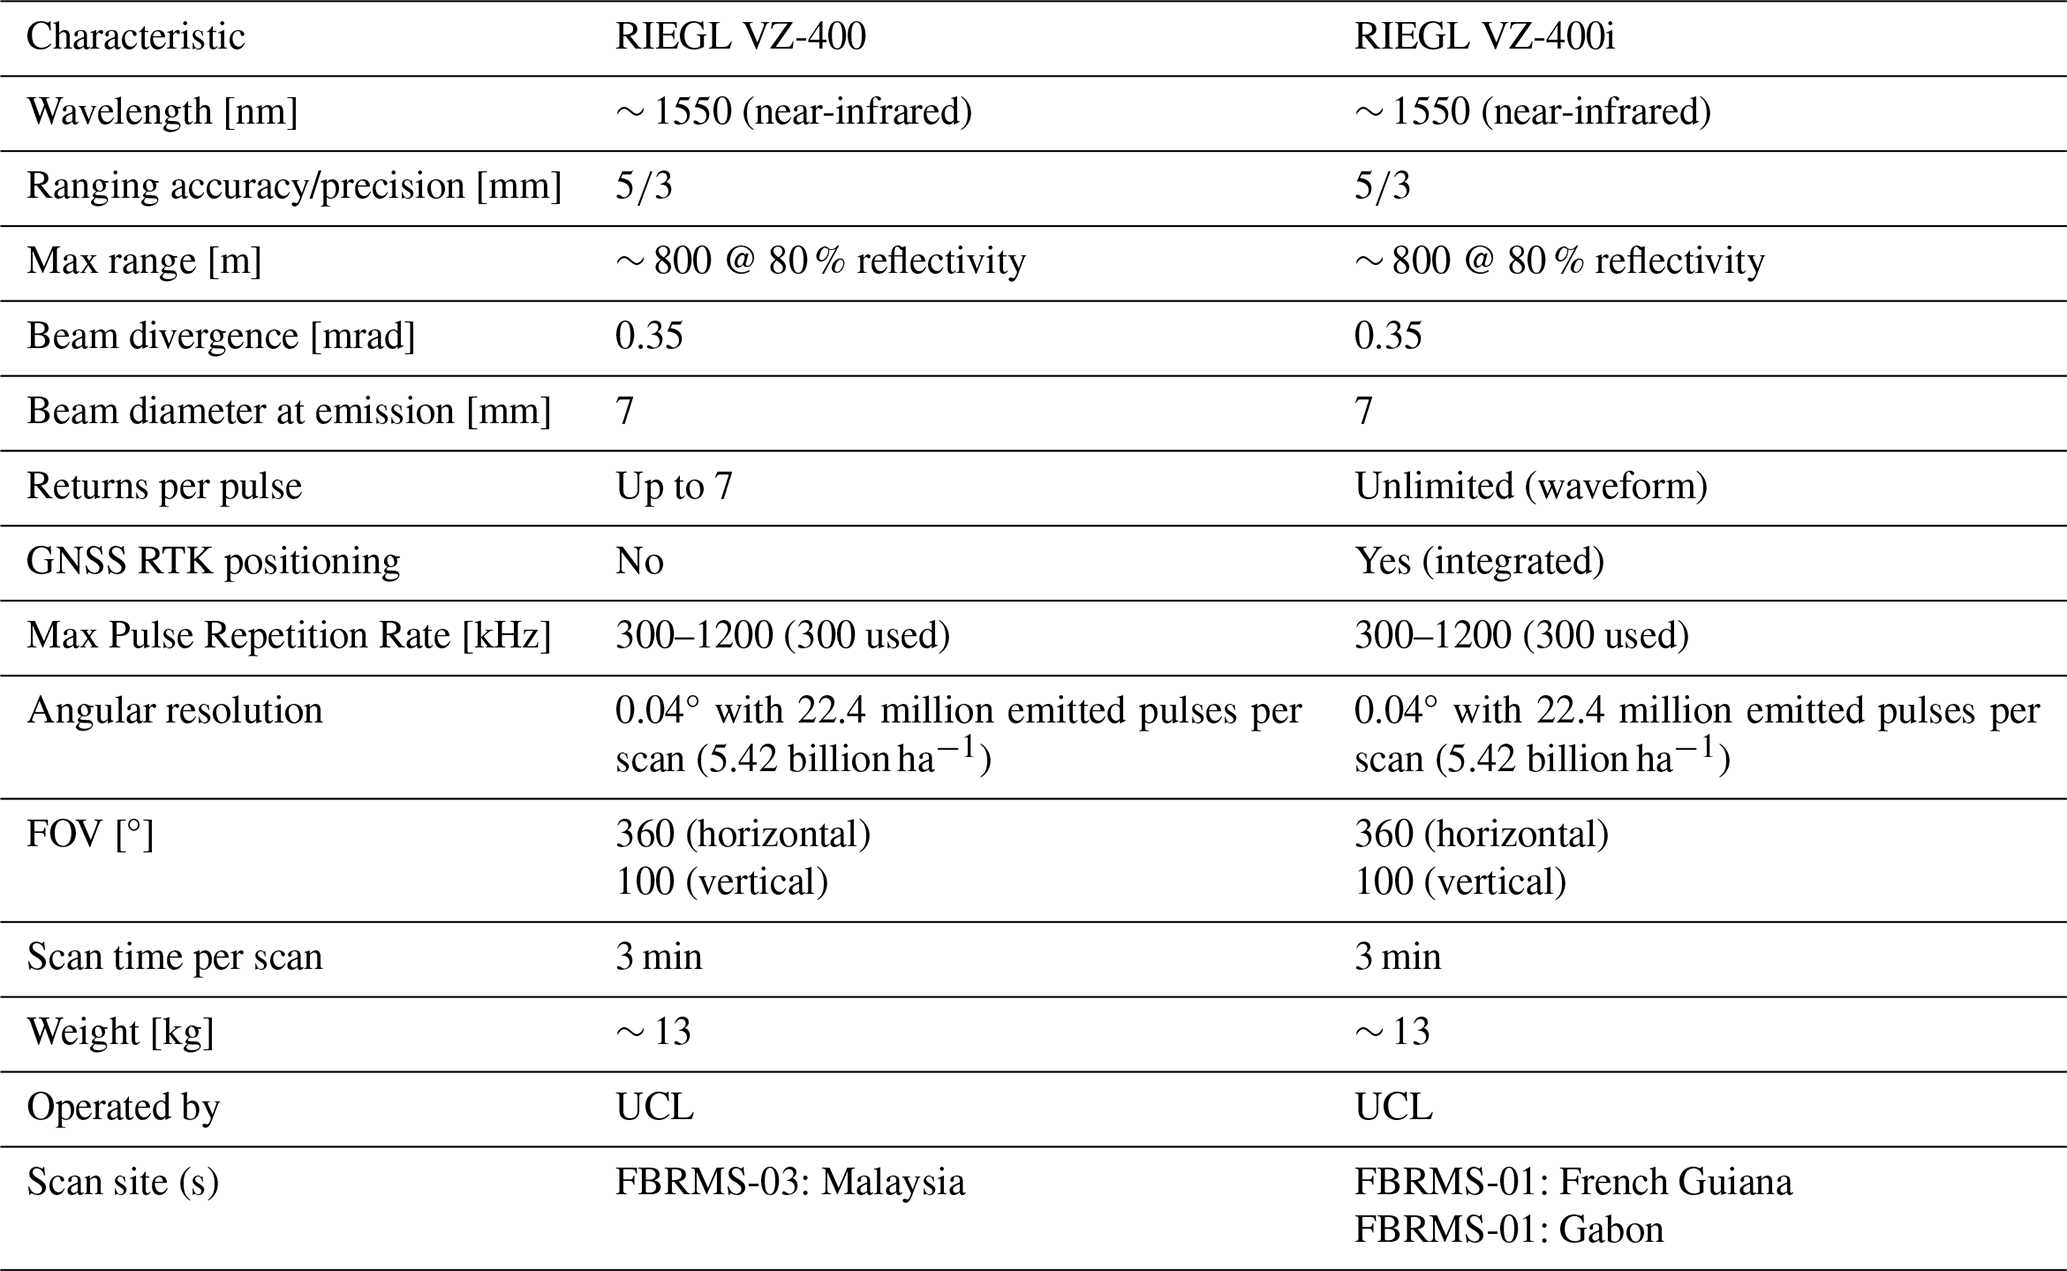
TLS data for all three FBRMS were collected using a RIEGL VZ-400 laser scanner or its newer model, the VZ-400i, which has very similar technical specifications (see Table 1) and includes Global Navigation Satellite System (GNSS) Real-Time Kinematic (RTK) positioning (RIEGL Laser Measurement Systems GmbH, 2025). RTK GNSS facilitates TLS data acquisition by replacing the labour-intensive and time-consuming task of placing and continuously relocating retro-reflective targets between scan positions as required by the RIEGL VZ-400 scanner. Common targets between adjacent scan locations were later identified and used to create a registration chain that integrates the 3D point cloud of a scanned plot. GNSS RTK has replaced the use of common targets, enabling the absolute (latitude, longitude, and altitude) and relative (between base and rover GNSS) positioning of individual scans with centimetre precision, which makes the auto-registration of scans in real-time possible. This GNSS-enabled auto-registration significantly reduces the time and effort required to both collect and register TLS data. Furthermore, data collected with the VZ-400i are backwards compatible with data from the older VZ-400 scanner, allowing for consistent processing and comparison over time.
Table 1RIEGL laser scanners (RIEGL Laser Measurement Systems GmbH, 2025) and user-defined characteristics for TLS data acquisition at ForestScan FBRMS.
TLS: FBRMS-01: Paracou, French Guiana
TLS data was collected in Paracou over two separate periods due to interruptions caused by the COVID-19 pandemic. The first campaign took place in 2019, censused plot FG6c2 was scanned with a RIEGL VZ-400 scanner during October and November (Brede et al., 2022a). The scanning was conducted over a 200×200 m2 area (i.e. two 1 ha plots) covering two of plot 6 subplots – 2 and 4 – (see Panel c in Fig. 1), resulting in 21 × 21 scan lines with 10 m grid spacing. Retro-reflective targets were placed between scan positions to facilitate coarse registration (Wilkes et al., 2017).
The second TLS campaign took place in 2022, three 1 ha censused plots (see Fig. 1) were scanned during September and October using a RIEGL VZ-400i scanner with GNSS RTK-enabled auto-registration. These plots were selected to represent the disturbance gradient found at this site, as shown in Table 2. All three plots were also scanned with ALS and plot FG6c2 additionally scanned with UAV-LS.
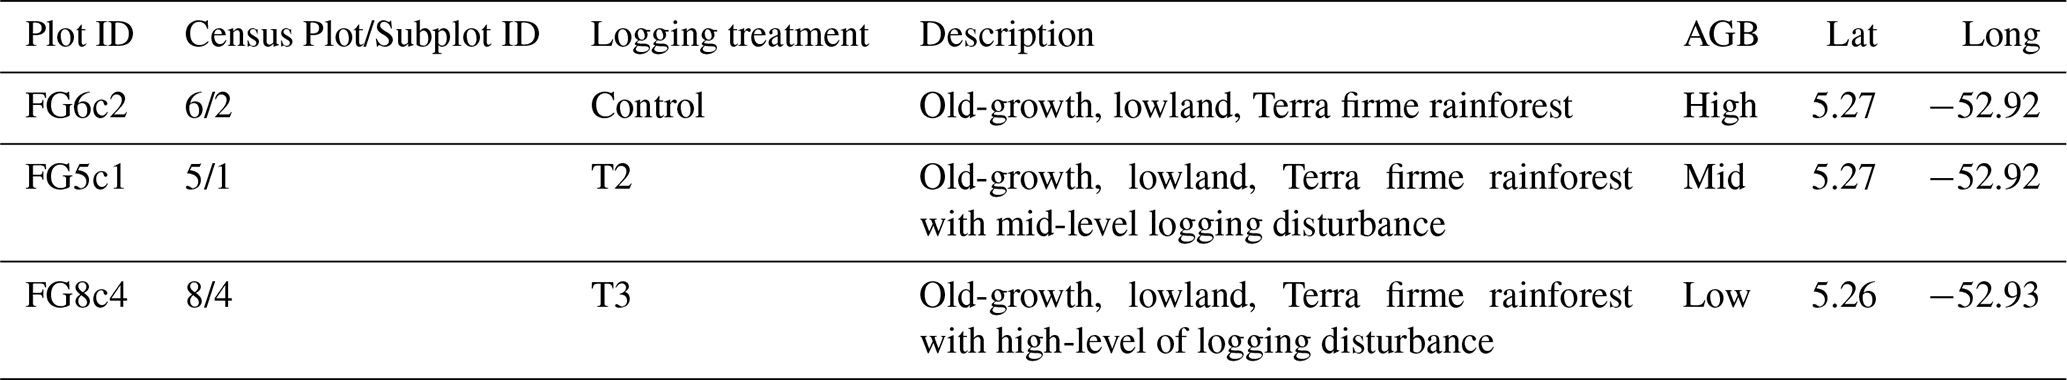
Table 2Overview of plots scanned in 2022 with TLS in Paracou, French Guiana. We provide both ForestScan plot IDs and their corresponding census plot and subplot IDs used by the census internet-based data repositories.
TLS: FBRMS-02: Lopé, Gabon
TLS data was collected in 2022, four 1 ha plots were scanned using a RIEGL VZ-400i with GNSS RTK-enabled auto-registration, eliminating the need for retro-reflective targets between scan positions. The four sampled plots, shown in Table 3, were selected to represent the diversity of forest types found within this site.
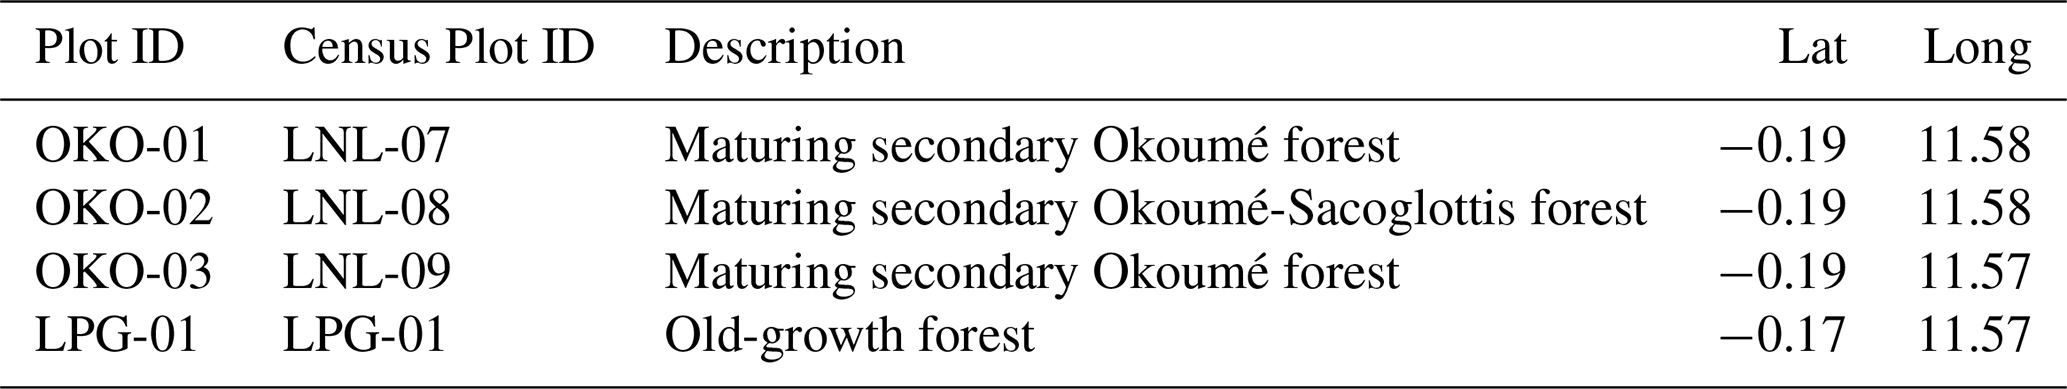
Table 3Overview of plots scanned with TLS in Lopé National Park, Gabon. We provide both the ForestScan plot IDs and their corresponding census plot and subplot IDs used by the census internet-based data repositories.
TLS: FBRMS-03: Kabili-Sepilok, Malaysian Borneo
TLS data was collected for three 1 ha forest plots at this FBRMS during March 2017. The three sampled plots, shown in Table 4, were selected to represent the three distinct forest types found within this site. A RIEGL VZ-400 scanner was used, with retro-reflective targets positioned between scan locations to facilitate coarse registration (Wilkes et al., 2017).
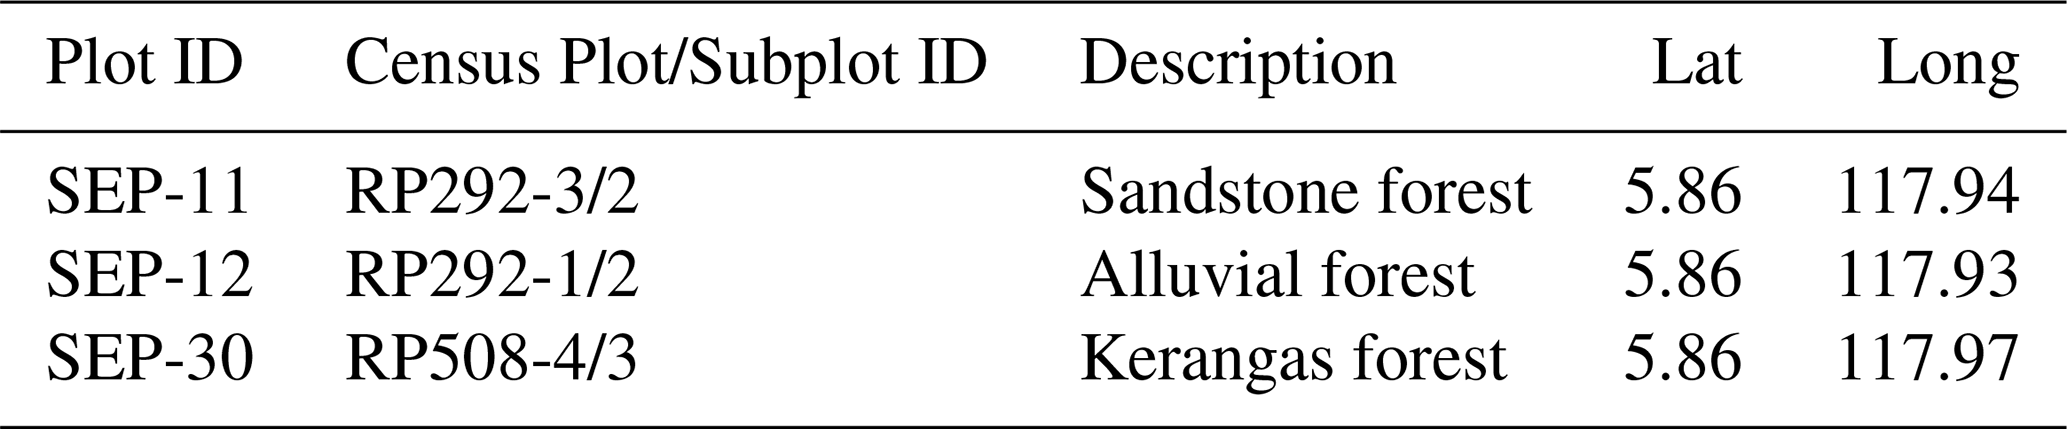
Table 4Overview of plots scanned with TLS in Kabili-Sepilok Forest Reserve, Malaysia. We provide both the ForestScan plot IDs and their corresponding census plot and subplot IDs used by the census internet-based data repositories.
2.2.3 TLS data processing
TLS data was collected and processed to provide state-of-the-art estimates of tree- and plot-scale structural attributes and AGB for each ForestScan FBRMS. Five main processing steps are required to retrieve structural attributes from the acquired TLS data are described below. These processing steps demand significant computational resources – a full 1 ha plot can take 3.4 to 4 d to process from start to finish on a high performance computing (HPC) cluster, running on multiple central processing units (CPUs; general-purpose processors optimised for sequential tasks and complex logic) and graphics processing units (GPUs; highly parallel processors ideal for deep learning, point cloud processing and simulations tasks that can be broken into thousands of simultaneous operations).
Individual scan registration into plot-level point cloud
This process was carried out using retro-reflective targets positioned between scan locations to facilitate coarse registration for data collected with the RIEGL VZ-400 or in a near-automated manner using the RIEGL VZ-400i's GNSS RTK positioning capabilities in conjunction with the enhanced RIEGL RiSCAN Pro software (versions 2.14–2.17). The integrated Auto Registration 2 (AR2) function employs GNSS RTK data to update the scanner's position and orientation, including in tilt mode, thereby enabling real-time automated coarse registration during scanning without the use of retro-reflective targets. Major registration errors are easily detected, typically occurring during pre-processing in RiSCAN Pro when individual scans fail to register (i.e., no coherent solution is found) or are incorrectly positioned, which is visually apparent. In cases where coarse registration/auto-registration fails, unregistered scans can be identified, adjusted, and refined using Multi Station Adjustment 2 (MSA2), which is also used for final precise registration of data initially coarse-registered using retro-reflective targets. The registered plot point cloud is provided in the project's local coordinate system. Following this workflow, the co-registration of all TLS point clouds achieves sub-centimetre accuracy, as confirmed through post-registration inspection. Wind and occlusion are key sources of uncertainty for the scan registration process, highlighting the necessity of scanning under low or zero wind conditions and capturing both tilt and upright scans at each location.
The use of GNSS significantly enhances the utility and accessibility of TLS by drastically reducing both data acquisition and processing time. This is achieved by (1) as previously mentioned, replacing the previous labour-intensive and time-consuming practice of using common retro-reflective targets to link adjacent scan positions into a registration chain (Wilkes et al., 2017), and (2) reducing the manual processing registration time by an experienced user to 1–2 d ha−1, which is less than half the time required when using retro-reflective targets.
Registration results in a plot-level point cloud, comprising 242 individual scan-level point clouds, potentially containing more than 5.42 billion points.
The subsequent four processing steps were performed in a semi-automated manner using the rxp-pipeline (Wilkes and Yang, 2025a) and TLS2trees processing pipelines (Wilkes et al., 2023) and TreeQSM version 2.3 (Raumonen et al., 2013), as described below.
Pre-processing of plot-level point clouds
Pre-processing is carried out in three steps using the open-source tool rxp-pipeline (Wilkes and Yang, 2025a), which operates directly on the raw RIEGL scan data. First, the co-registered RIEGL point clouds are filtered to remove points with a deviation greater than 15 and reflectance outside the range [−20, 5], The data are then clipped to the plot extent with an additional 20 m buffer around the plot, segmented into 10 m × 10 m tiles, and converted from the RIEGL proprietary .rxp to .ply format to enable further processing. Second, to reduce computing load, the tiled point clouds are downsampled using a voxelisation approach with a voxel size of 0.02 m, implemented via PDAL VoxelCenterNearestNeighbor filter (PDAL Contributors, 2025). Finally, a tile index mapping the spatial location of each tile is generated. In a HPC system, preprocessing of a 1 ha plot can take 1.58 to 4.17 h to complete.
Semantic segmentation: wood-leaf separation
TLS2trees is an open-source Python command-line pipeline (Wilkes et al., 2025) designed to automate tree extraction from TLS point clouds by utilising GPUs for parallel computation, making it fully scalable on HPC systems (Wilkes et al., 2023). The first of the two-step TLS2trees workflow employs a deep-learning based approach, implementing a modified version of the Forest Structural Complexity Tool (FSCT) deep learning semantic segmentation method by Krisanski et al. (2021) to classify points within tiled point clouds into homogeneous classes representing distinct biophysical components: leaf, wood, coarse woody debris, or ground. An example of the wood and leaf classes extracted from tree-level point clouds is illustrated in Fig. 5. In a HPC system, semantic segmentation of a 1 ha plot can take 4 to 12 h to complete.
A comparison of the leaf-wood separation between TLS2trees and manual labelling showed a Jaccard index of between 54 %–87 % across varying tropical sites (Wilkes et al., 2023). Several TLS leaf-wood separation approaches have been developed, using deep learning, or geometric approaches. Unsurprisingly, they all tend to perform worse for taller trees, higher in the canopy (Arrizza et al., 2024). In TLS2trees, the impact of misclassifying (or missing) leaves, is to truncate smaller branches (Wilkes et al., 2023), reducing the contribution to volume (and hence biomass). This tends to have less impact on tall tropical trees, than on smaller more dense crowns of deciduous woodland (Calders et al., 2022).
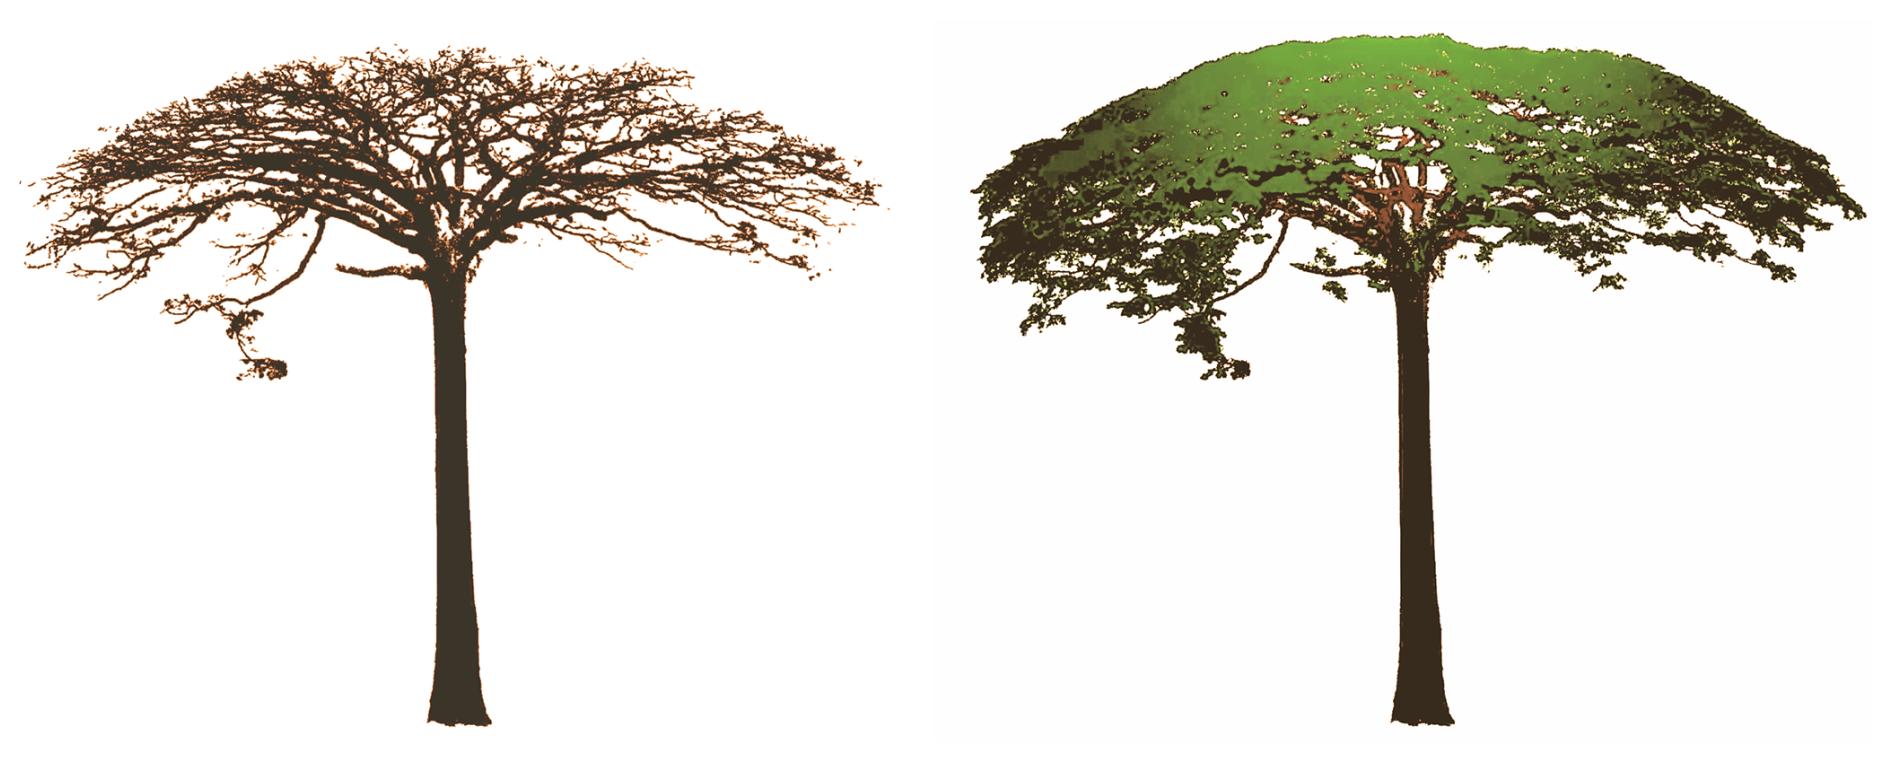
Figure 5Tree-level point cloud of the largest Baillonella toxisperma (Maobi) tree (∼ 40 m tall with an almost circular canopy ∼ 50 m wide) in plot LPG-01, FBRMS-02: Lopé, Gabon. Points are classified and displayed by category only: wood points in brown and leaf points in green.
Instance segmentation: individual tree separation
The second step in the TLS2trees workflow identifies and segments individual trees via a 2-step process. The Dijksta's shortest path method first groups all points identified as wood into a set of individual woody stems to which points identified as leaf are then assigned. A small group of trees automatically segmented from a plot in Gabon are shown in Fig. 6. In a HPC system, instance segmentation of a 1 ha plot can take 15–20 h to complete.
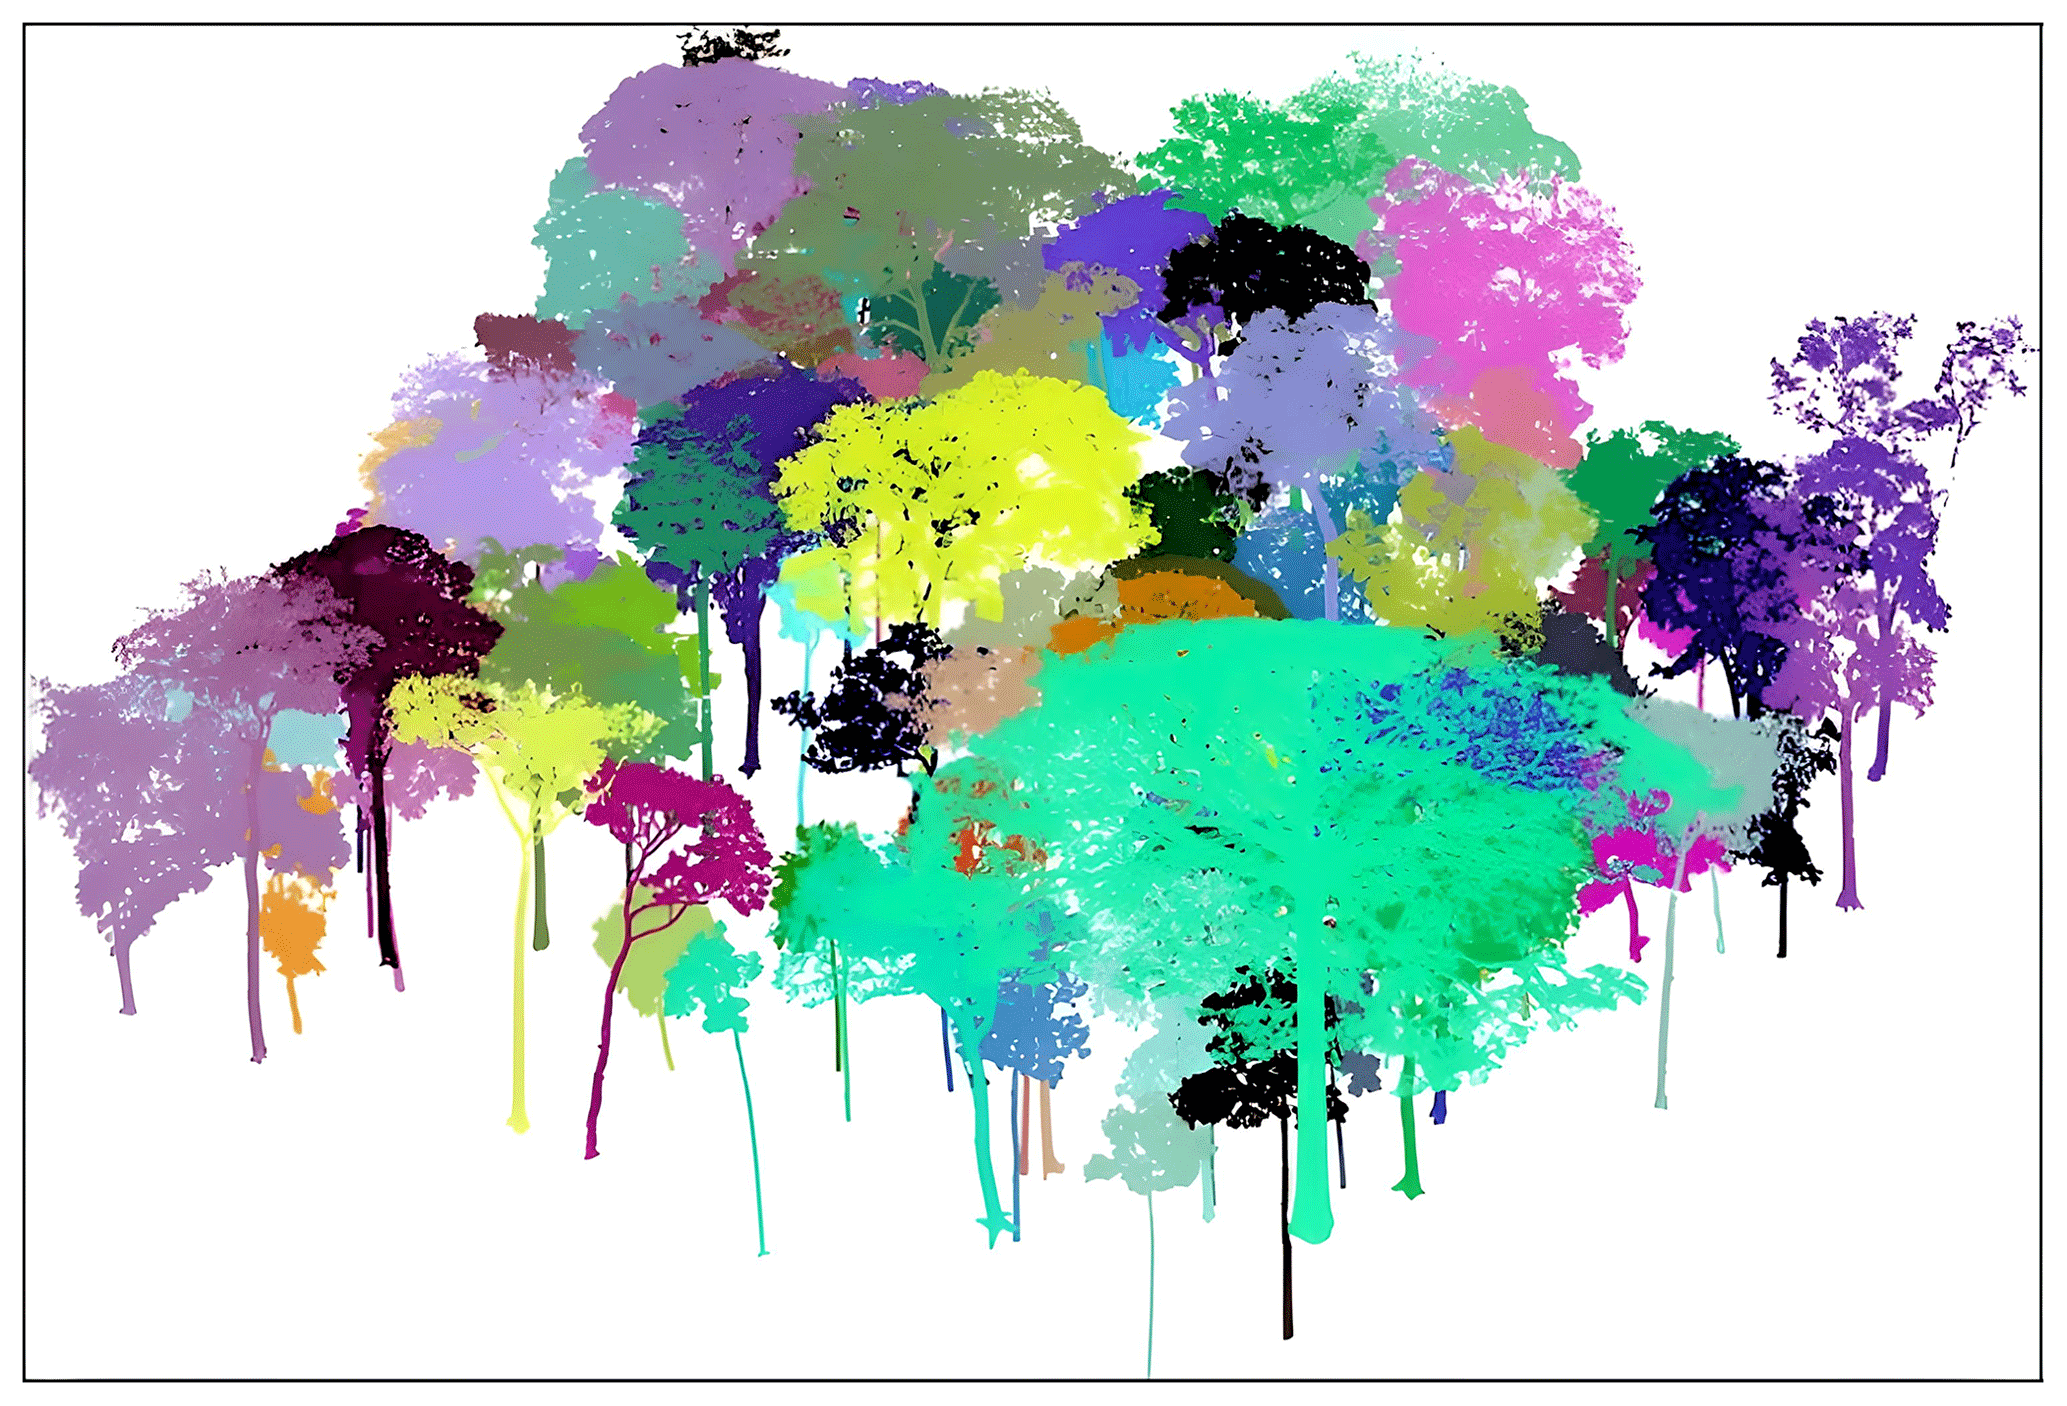
Figure 6Individual tree-level point clouds acquired from plot LPG-01 in FBRMS-02: Lopé, Gabon.
TreeQSM: quantitative structural models and results
Quantitative structural models (QSMs) were constructed in a near-automated manner from each individually segmented tree point cloud (woody components only) with a DBH ≥ 10 cm within each ForestScan FBRMS plot. This was achieved using the TreeQSM software package (version 2.3; Raumonen et al., 2013), which reconstructs underlying woody surfaces by fitting cylinders, as illustrated in Fig. 7. The QSM fitting process involves three steps: (i) reducing each point cloud to a series of patches, (ii) analysing the spatial arrangement and neighbour relationships among patches, and (iii) robustly fitting cylinders to common patches.
The overall QSM fit is controlled by three parameters, which are iterated into 125 different parameter sets, each generating five models. This yields a total of 625 candidate models per segmented tree. The optimal model is then selected by minimising the point-to-cylinder surface distance (Burt et al., 2019; Martin-Ducup et al., 2021). Estimates of morphological and topological traits such as volume, length, and surface area metrics, along with their mean and standard deviation, are derived from the five models that share the same parameters as the optimal model. This approach provides an estimate of the uncertainty associated with the resulting volume (Wilkes et al., 2023). In a HPC system, QSMs for a 1 ha plot can take up to 2 d to complete.
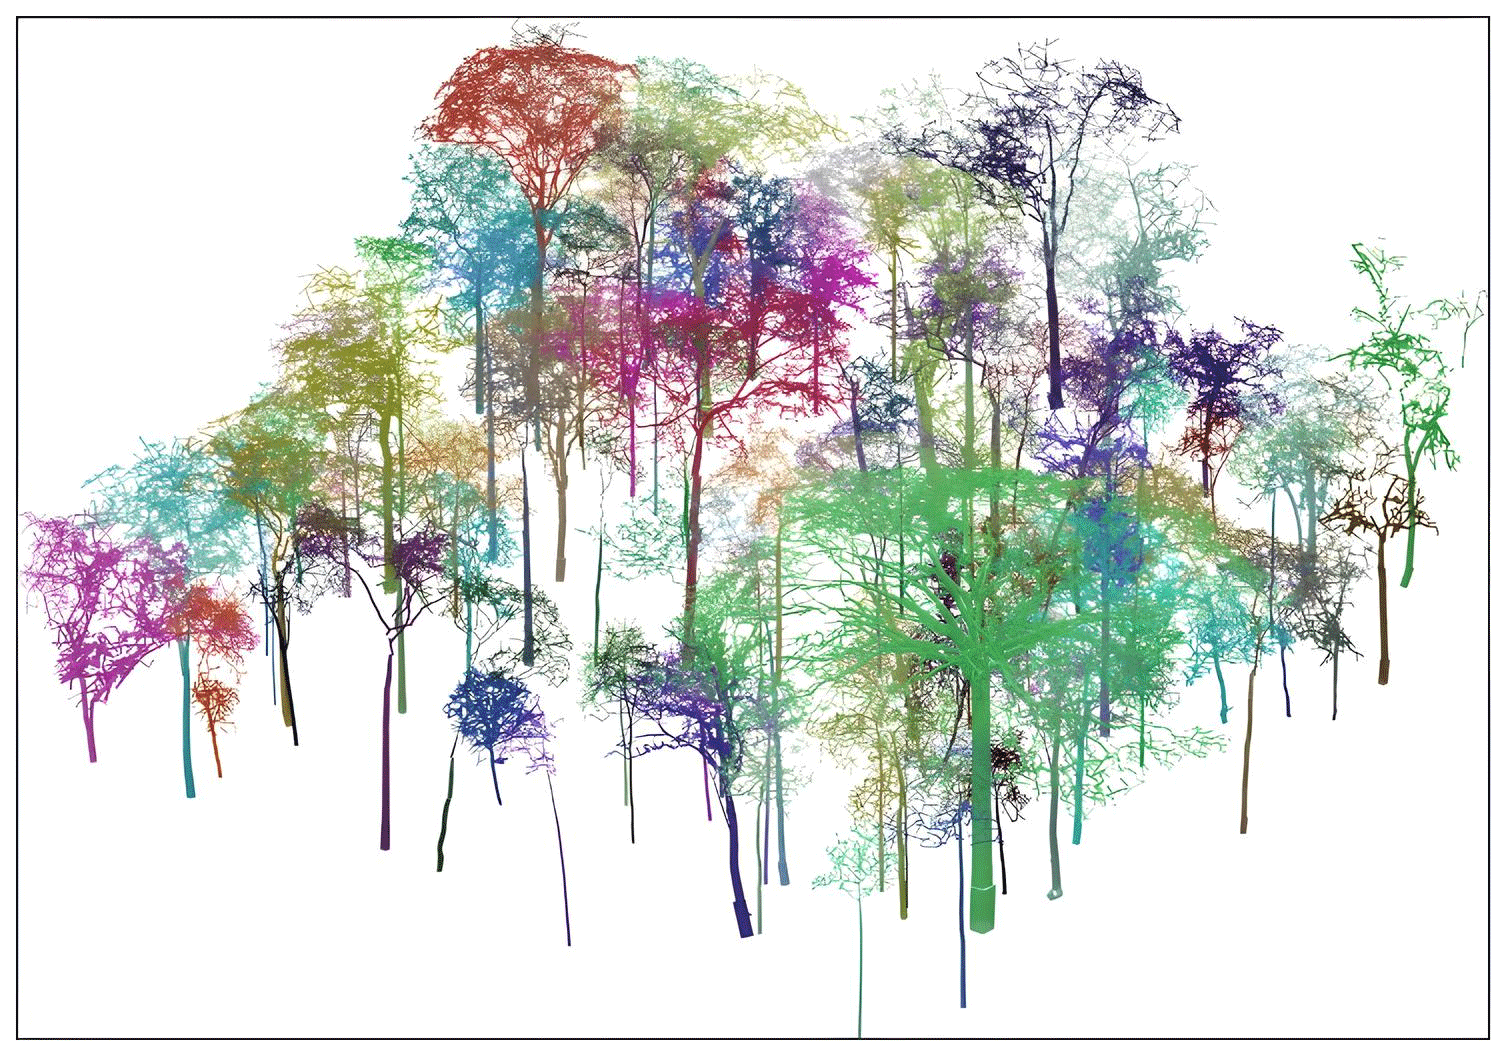
Figure 7QSMs derived from individual tree-level point clouds acquired from plot LPG-01 in FBRMS-02: Lopé, Gabon.
Uncertainty estimates are reported for each ForestScan FBRMS plot and included alongside the final modelling outputs for every tree in a “tree-attributes.csv” file, generated at the end of the modelling process. Sources of error in QSM fitting can arise from data acquisition (e.g., wind, leaf occlusion, understory vegetation) and from assumptions inherent in segmentation and fitting processes. Wilkes et al. (2017) discuss issues related to data acquisition and methodological choices, while Morhart et al. (2024) quantify their effects on branch size and volume under controlled conditions. Although these impacts are difficult to assess without reference (harvest) data, Demol et al. (2022) show that, where TLS and harvest data have been compared, agreement is generally within a few percent of AGB per tree. The report CVS file also includes tree- and plot-level carbon and AGB estimates, the latter based on a mean pantropical wood density value of 0.5 g cm−3 derived from the DRYAD global database of tropical forest wood density (2009). Plot-level AGB was also estimated using DRYAD-derived regional mean wood densities and is presented in Table 5.
Figures of all individually segmented trees arranged by tree DBH size (largest to smallest DBH) are also generated for each FBRMS plot, examples of which can be seen in Fig. 8. In a HPC system, tree figure for a 1 ha plot can take ∼ 30 min to complete. Figure 9 provides a comparison of the distribution of DBH measurements collected by tree census and TLS methods at each of the 10 ForestScan FBRMS 1 ha plots.
TLS datasets
The following terrestrial LiDAR-derived products are available for each of the 10 ForestScan FBRMS plots:
-
Raw terrestrial LiDAR data from each scan (no filtering was applied in RiSCAN PRO), stored in the RXP data stream format developed by RIEGL.
-
Transformation matrices necessary for rotating and translating the coordinate system of each scan, into the coordinate system of the first scan. Stored in DAT format.
-
Pre-processed terrestrial LiDAR data:
- –
full-resolution 10 m tiled plot point clouds including attributes such as XYZ coordinates, scan position index, reflectance, deviation, etc. stored in polygon PLY format.
- –
downsampled 10 m tiled plot point clouds including attributes such as XYZ coordinates, scan position index, reflectance, deviation, etc. stored in polygon PLY format.
- –
A tile_index file (maps the spatial location of the tiled point clouds) stored in DAT format.
- –
Bounding geometry files setting plot boundaries with and without a buffer surrounding the plot. Stored in shapefile SHP, DBF, SHX and CPG formats.
- –
-
Downsampled 10 m tiled plot point clouds segmented into leaf, wood, ground points or coarse woody debris. Stored in polygon file format PLY format.
-
Wood-leaf separated tree-level point clouds including segmentation results and classification probabilities for each point are stored in polygon PLY format.
-
QSM files:
- –
in_plot CSV (for plots processed with TLS2trees) lists all trees to be modelled with QSMs as they are located inside the plot boundary.
- –
out_plot CSV (for plots processed with TLS2trees) lists all trees NOT to be modelled as they are located outside the plot boundary.
- –
plot_boundary CSV (for plots processed with TLS2trees) shows the location of all in_plot trees within each plot boundary.
- –
QSM processing files (.MAT Matlab).
- –
QSMs derived from each woody tree-level point cloud, (.MAT Matlab).
- –
-
We provide pre-processed and segmented terrestrial LiDAR data in PLY format as it supports full 3D object representation, including polygons and geometric primitives, in addition to point data. This is essential for storing quantitative structure models (QSMs), which go beyond point clouds to describe tree geometry. The PLY format is open, widely supported in Python and R, and can be converted to LAS/LAZ when only point data are required.
-
Tree-attributes file (.CSV) containing biophysical parameters derived from both the point clouds and QSMs: DBH, tree height, tree-level volume and AGB with uncertainty, plot-level AGB and associated uncertainty.
-
Figures of all individually segmented trees arranged by tree DBH size (largest to smallest DBH) for each FBRMS plot (see Fig. 8) (PNG image format).
-
GNSS coordinates (geographical coordinate system: WGS84 Cartesian) for all scan positions stored in KMZ zip-compressed format. These files are available for the seven French Guiana and Gabon FBRMS plots.
These TLS ForestScan FBRMS 1 ha plot datasets are freely available via the Centre for Environmental Data Analysis (CEDA) with URLs and DOIs provided in Sect. 4 and are accompanied by the ForestScan_example_directory_structure.pdf document for guidance on dataset organisation.
QSMs can be converted to PLY format using open-source tools such as mat2ply (Wilkes and Yang, 2025b) and then read by various tools such as the widely-used free GUI tool CloudCompare (http://www.cloudcompare.org, last access: November 2025), via Python using PDAL (PDAL Contributors, 2025; https://doi.org/10.5281/zenodo.4031609) or Open3D (https://www.open3d.org/docs/0.9.0/tutorial/Basic/file_io.html#mesh, access: November 2025), or via the R Geomorph package (Adams et al., 2025). In the Geomorph R package, the function Read mesh data (vertices and faces) from PLY files can be used to read three-dimensional surface data in the form of a single PLY file (Polygon File Format; ASCII format, from 3D scanners). Vertices of the surface may then be used to digitise three-dimensional points. The surface may also be used as a mesh for visualising 3D deformations, which refer to changes or displacements in the geometry of the object compared to a reference state. This is achieved using the warpRefMesh function. The function opens the PLY file and plots the mesh, with faces rendered if file contains faces, and coloured if the file contains vertex colour. Vertex normals allow better visualisation and more accurate digitising with digit.fixed. The KMZ files containing the GNSS scan position coordinates can be uploaded to Google Earth or read into a GIS tool such as QGIS (https://qgis.org, last access: November 2025).
Table 5Summary statistics for 10 FBRMS ForestScan TLS plot datasets. AGB estimates use wood density values from the DRYAD global database (Zanne et al., 2009): (1) TLS2Trees pantropical mean, (2) Tropical Africa mean (TAF, Gabon), (3) South-East Asia mean (TS-EA, Malaysia), (4) Tropical South America mean (TSA, French Guiana), (5) Guyana community mean (GF, French Guiana), and (6) allometric AGB estimates based on Chave et al. (2014).


Figure 8Examples of the largest trees (up to 30 trees) arranged in decreasing DBH size (1.3 m trunk height) for each of the 10 ForestScan FBRMS plots. The upper limit of the y axis varies and ranges from 30 to 60 m maximum tree size between plots.
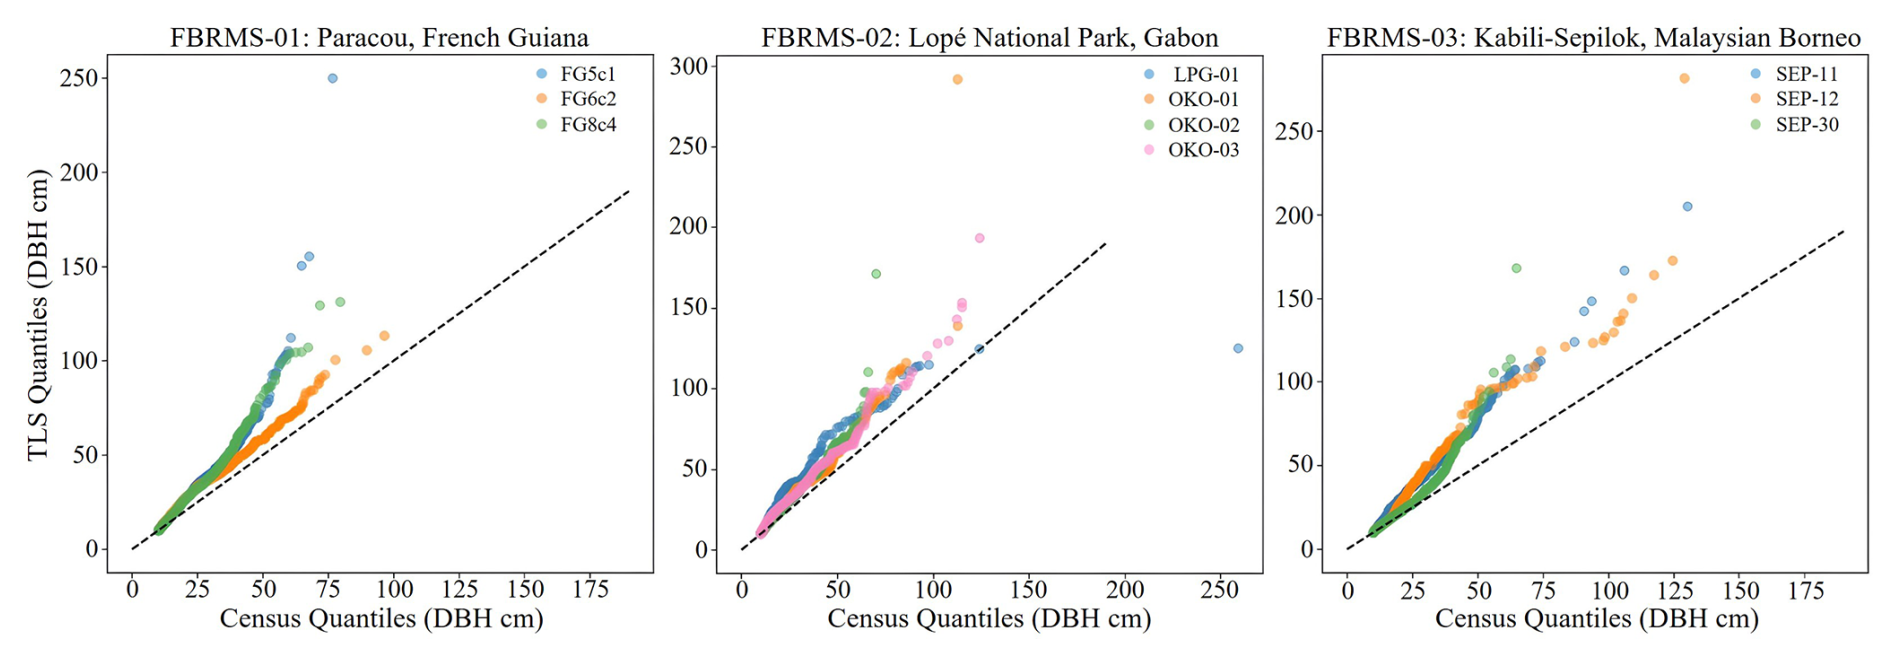
Figure 9Quantile–Quantile (Q–Q) plots comparing the distribution of DBH measurements collected by tree census and TLS methods at each of the 10 ForestScan FBRMS 1 ha plots. TreeQSM measures DBH at the standard height of 1.3 m for each TLS-extracted tree, whereas census DBH measurements are routinely adapted to account for tree buttresses found among larger trees. Generally, census and TLS DBH measurements are in good agreement but consistently overestimated by TLS. Deviations for larger DBH values can be improved by adapting the DBH extraction of large, buttressed trees once these trees are matched to their census counterparts. The 1:1 reference line (dotted black line) represents perfect agreement between census and TLS-extracted DBH measurements.
2.2.4 Unpiloted Aerial Vehicle laser scanning (UAV-LS)
Unlike TLS, there are currently no best practice guidelines for UAV-LS data acquisition for forest characterisation. Therefore, flight plans and parameters were implemented on a case-by-case basis, considering the site, instrument, sensor, and application. An important consideration in this respect is whether VLOS needs to be maintained, i.e., the visibility of the platform by the pilot throughout the mission. Regulations on this vary nationally and are changing rapidly as technology evolves and the use of UAVs expands. In Europe, for example, a risk-based approach has been introduced, allowing beyond VLOS when risks are negligible.
Another important consideration is the availability of take-off and landing areas. Vertical take-off and landing (VTOL) platforms (e.g., quadcopters and octocopters) require smaller areas and are more flexible, while fixed-wing platforms may require substantial take-off and landing sites, although they offer greater area coverage and flight duration. The actual take-off area for VTOL platforms is highly dependent on the skills and confidence of the pilot. However, a very small take-off area surrounded by tree crowns typically also means low chances for VLOS operation, unless an above-canopy platform such as a cherry-picker is available.
In the context of VTOL and VLOS operations, viewshed analysis based on already acquired ALS data has proved useful. ALS point clouds can be used to derive initial Digital Surface Models (DSM), which can identify possible take-off positions. Viewshed analysis can then use the DSM to simulate the visibility of the UAV from the take-off position.
During data collection, attention should also be paid to acquiring access to GNSS observables from permanent base stations (e.g., CORS network) or to collecting observables with a temporary base station (e.g., Emlid Reach RS+ or RS2). A base station should be positioned less than 15 km from the survey area. For some platforms, Real-Time Kinematic (RTK), and therefore radio connection, between the UAV and base station can be an added constraint.
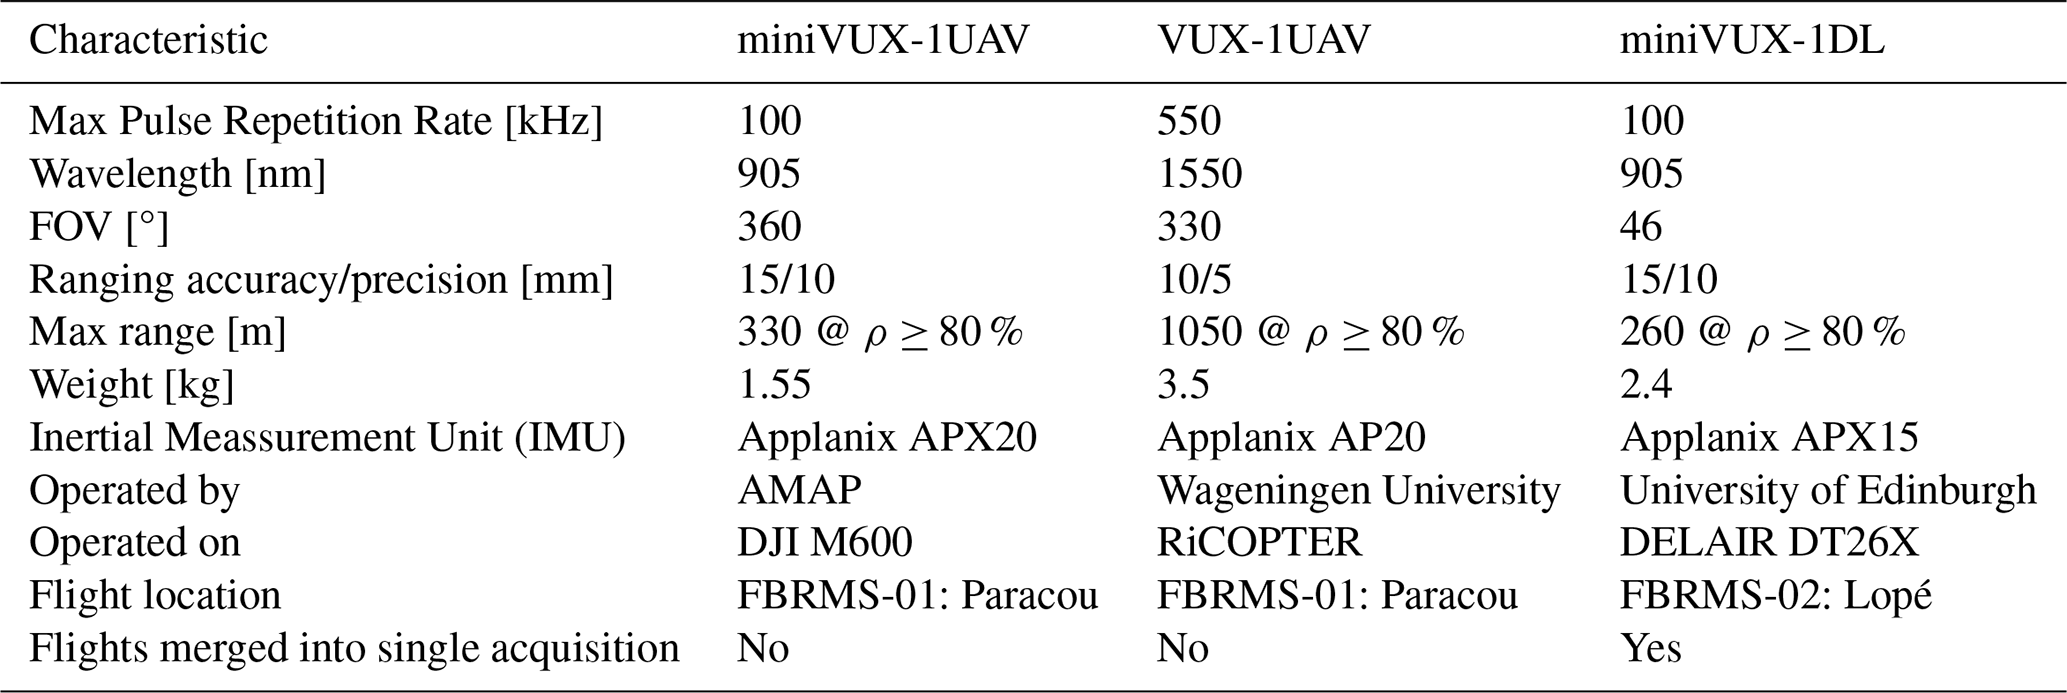
Our UAV-LS data collections used three different LiDAR systems built by RIEGL at FBRMS-01 and FBRMS-02. All systems are based on the time-of-flight principle and capable of multi-return registration with the miniVUX-1DL being a specific downward-looking sensor designed for fixed-wing UAVs. Technical specifications for all three UAV-LS sensor systems are provided in Table 6.
Table 6UAV-LS sensor systems used at ForestScan FBRMS-01 and FBRMS-02.
UAV-LS: FBRMS-01: Paracou, French Guiana
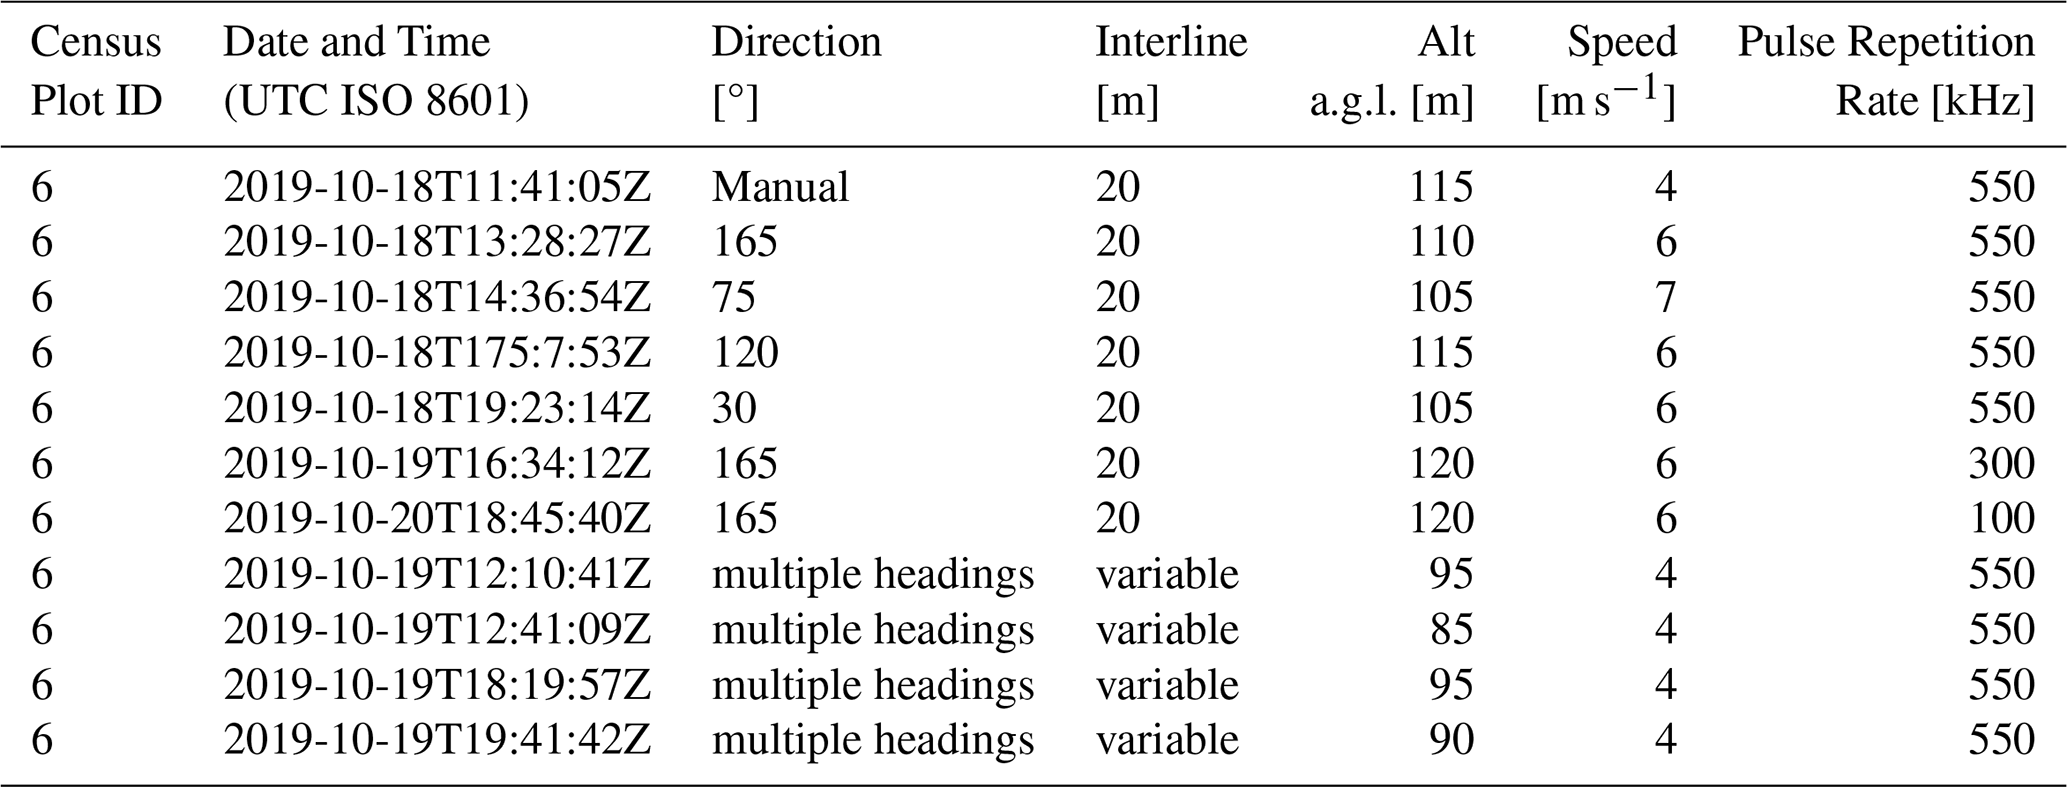
UAV-LS data was collected in October 2019 using two different scanning systems as shown in Tables 7 and 8. The first set of 11 flights listed in Table 7 were conducted using the RIEGL VUX-1UAV mounted on a RIEGL RiCOPTER UAV and flown over the same 200 × 200 m2 area that was scanned with TLS covering subplots 2 and 4 in plot 6. Six of these flights covered the entire 200 × 200 m2 area with 20 m spacing between flight lines at an altitude of 120 m above ground level (a.g.l.). The remaining five flights covered only the north-east 100 × 100 m2 area covering subplot 2 (i.e. FG6c2) with a criss-cross pattern to maximise the diversity of viewing angles into the canopy. These latter flights were conducted at a lower altitude of 90 m a.g.l. to increase point density; however, the entire plot could not be covered without losing VLOS.

Figure 10UAV-LS flight trajectories over the FBRMS-01 site at Paracou, showing coverage of the experimental 4 ha plot 6 (red dashed outline) and the area of interest (AOI; yellow dashed outline). The criss-cross flight pattern results from multiple flight lines oriented in different directions (e.g., N–S, E–W, NE–SW) to improve point density and reduce occlusion in dense tropical forest canopies. The background shows a digital surface model (DSM) with elevation values (m), colour-coded by elevation classes as indicated in the figure legend (−23 to 50 m). The inset map shows the regional location of Paracou within French Guiana (© OpenStreetMap).
Table 7Overview of the 2019 VUX-1 UAV-LS flights at FBRMS-01 (Paracou), including Census Plot ID (see Table 2), acquisition date/time, flight height above ground level (AGL), speed, and pulse repetition rate. Flight patterns refer to the orientation of flight lines: N–S (north–south), E–W (east–west), NE–SW (northeast–southwest), and “criss-cross” indicates multiple orientations flown over the same area as seen in Fig. 10. All flights listed can be considered part of one acquisition and are provided as individual point clouds in this dataset. Users may merge them according to their needs.
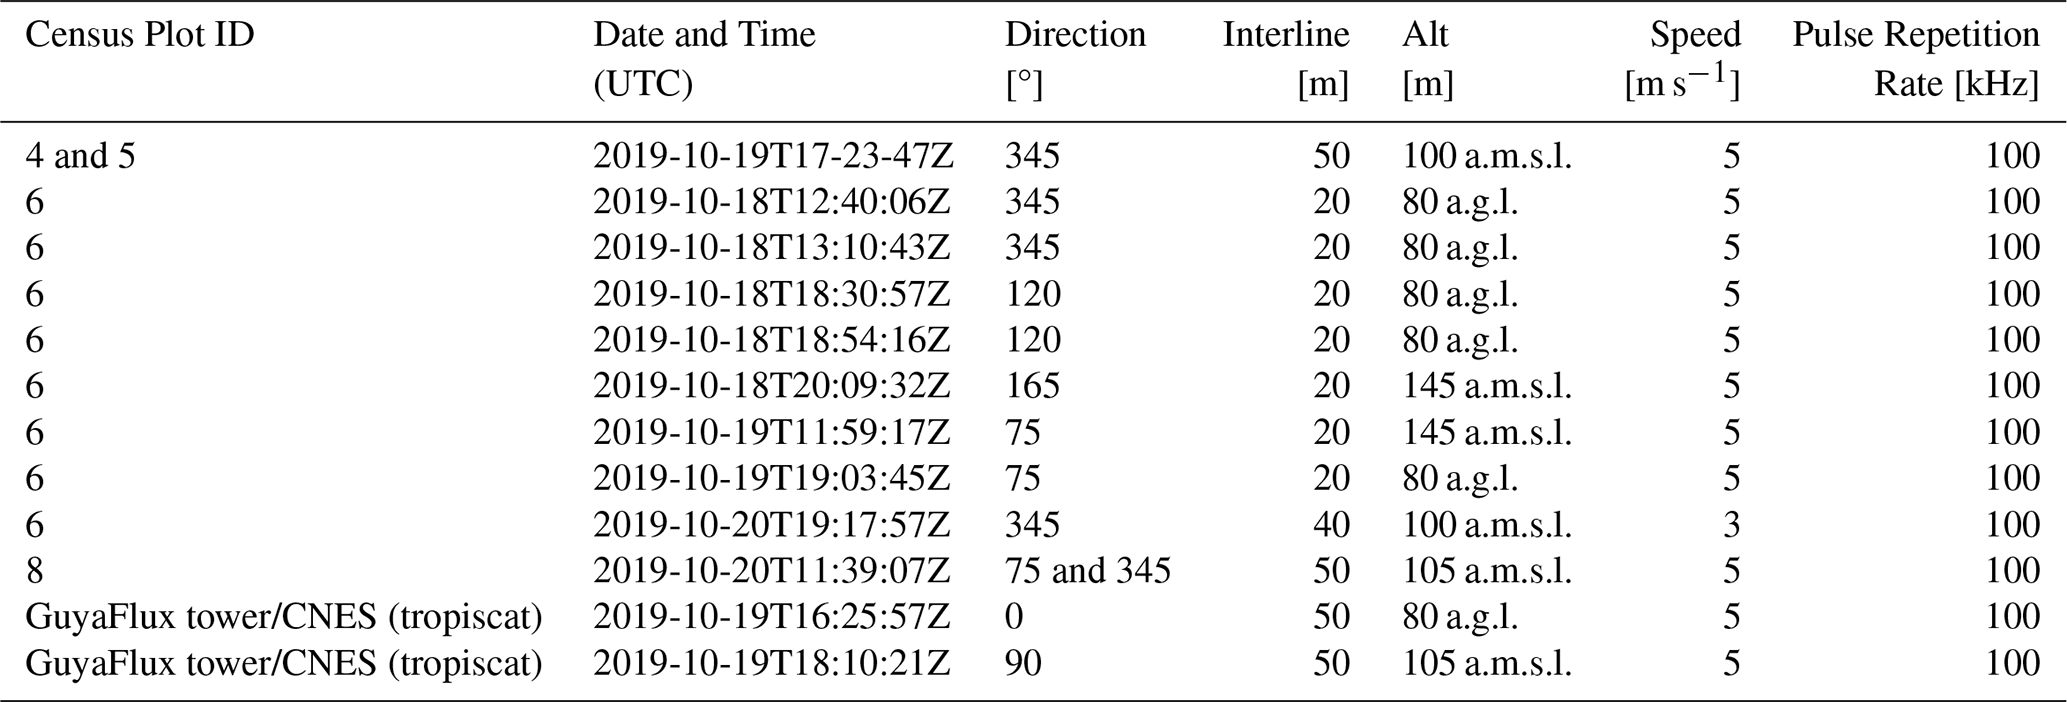
UAV-LS data was also collected over several plots using a different UAV-LS system – a Yellowscan Vx20 containing a RIEGL Mini-VUX scanner and Applanix 20 IMU – mounted on a DJI M600. Details for a second set of 12 flights can be found in Table 8. To allow for comparisons with the VUX system, coincident acquisitions were performed over experimental plot 6 (covering all four subplots) and several others within the Paracou Research Site (see Table 8). A full description of the UAV-LS data collection for this UAV-LS data is provided in Brede et al. (2022b).
Table 8Overview of UAV-LS flights using a YellowScan Vx20 system (RIEGL Mini-VUX scanner and Applanix 20 IMU) mounted on a DJI M600 during the 2019 mission at the FBRMS-01 site. Automated flight plans were performed using flight plans with the UgCS route planning software in grid mode. The table lists plot ID, acquisition date/time, flight parameters (direction, interline spacing, altitude and speed). Altitude values are reported as specified during flight planning with some missions using Above Ground Level (a.g.l.), while others used Above Mean Sea Level (a.m.s.l.) due to differences in mission planning and operational requirements. These original specifications are retained to accurately reflect acquisition parameters. Pulse repetition for the RIEGL Mini-VUX scanner is fixed at 100 kHz. Flights cover multiple experimental plots: 4 and 5 (single flight), 6 (8 flights), 7, 8, 10, 15, and the Tower plot (two flights) within the Paracou Research Site. All listed flights are provided individually; users may merge flights covering the same plot if needed for analysis.
UAV-LS data processing
All collected raw data underwent processing with standard tools. For VUX-1UAV data, this included processing recorded global navigation satellite system (GNSS) and base station data to flight trajectories with POSPac Mobile Mapping Suite 8.3 (Applanix, Richmond Hill, Ontario, Canada), laser waveform processing to discrete returns and geolocation in world coordinates with RIEGL RiProcess 1.8.6. For miniVUX-1UAV, waveform processing is performed online in the sensor. Point cloud processing and geolocation was performed with the CloudStation software (Yellowscan, Montpellier, France), using the Strip Adjustment option. For all UAV-LS data, only points with a reflectance larger than −20 dB were kept for further processing. Points with reflectance smaller than −20 dB consist mainly of spurious points caused by water droplets under high humidity conditions.
LiDAR point clouds were processed using the LAStools suite (rapidlasso GmbH). First, a 1 m resolution digital surface model (DSM) was generated with lasgrid using the highest return within each cell. Ground points were then classified with lasground (wilderness settings, 15 m step), and a 1 m digital terrain model (DTM) was derived from ground-classified points using las2dem. Heights were normalized by subtracting ground elevation with lasheight, producing a set of height-normalized point clouds. A 1 m canopy height model (CHM) was computed with lascanopy, retaining the maximum height in each grid cell after removing noise and low-confidence classes. Finally, a point density map (1 m resolution) was created using lasgrid with the counter option. This workflow produced consistent DSM, DTM, CHM, and density layers suitable for subsequent ecological analyses. These UAV-LS datasets are provided in the WGS84 coordinate reference system (EPSG:4326) and freely available via the Centre for Environmental Data Analysis (CEDA) with DOIs provided in Sect. 4.
UAV-LS: FBRMS-02: Lopé, Gabon
UAV-LS data was collected in June 2022, concurrently with TLS data acquisition at this FBRMS. Data was acquired using a DELAIR DT26X drone platform equipped with a RIEGL miniVUX-1DL (McNicol et al., 2021, 2025) as seen in Fig. 11. This platform differs from the one used at FBRMS-01: Paracou in that it is designed for large-scale data acquisitions (thousands of hectares) and is capable of operating beyond the VLOS, with an average flight speed of 17 m s−1 (61 km h−1). Flights were conducted in perpendicular lines at a nominal altitude of 120 m above the ground surface, with an average flight line spacing of 20 m (based on 70 %–80 % overlap). Each one-hour flight covered approximately 120–200 ha with an estimated point density of 400 points km−2. To obtain the required densities, several flights were conducted over the core plots from different angles (depending on wind conditions) to maximise the diversity of viewing angles into the canopy.

Figure 11UAV-LS acquisitions at FBRMS-02: Lopé using a fixed-wing system. This UAV employs a conventional take-off and landing (CTOL) procedure, with launch aided by a catapult (top). Once airborne, the UAV is controlled from a laptop connected to the UAV via an antenna (middle). The flight trajectory is corrected to centimetre precision using data collected from a static GNSS receiver placed within 10 km of the UAV operating area (lower left). Additional refinements and corrections are possible via ground control points located across the study area (lower middle), the positions of which are measured using a “rover GNSS receiver (lower right). Image originally published in McNicol et al. (2021).
UAV-LS data processing
Flight trajectories were reconstructed using GNSS/IMU measurements and adjusted with differentially corrected base station data in Applanix POSPac software. The corrected flight paths and laser data were then integrated using the RIEGL software package, RiPROCESS, to generate the initial three-dimensional point cloud. Residual trajectory errors – such as discrepancies in GPS tracking and elevation – were corrected by using small buildings as reference points to refine the relative position and orientation of individual flight lines and scans. Further adjustments were made using ground control points: square targets (1–2 m2) composed of alternating black and white material arranged in a checkerboard pattern. Geometric accuracy refers to the absolute positional accuracy of the final point cloud after these corrections, quantified by the residuals between LiDAR points and surveyed ground control points. This process resulted in a LiDAR-derived point cloud with a geometric accuracy of 1.8 cm. All elevation data were calculated as ellipsoidal heights (m) within the UTM 32S coordinate system. Each flight was processed separately, and all datasets were merged prior to export. Subsequent point cloud processing was carried out using elements of the lidR package (v3.1.0; Roussel et al., 2020). This UAV-LS dataset is freely available via the Centre for Environmental Data Analysis (CEDA) with DOIs provided in Sect. 4. Data acquisition characteristics can be found in Table 6.
2.2.5 Airborne Laser Scanning (ALS)
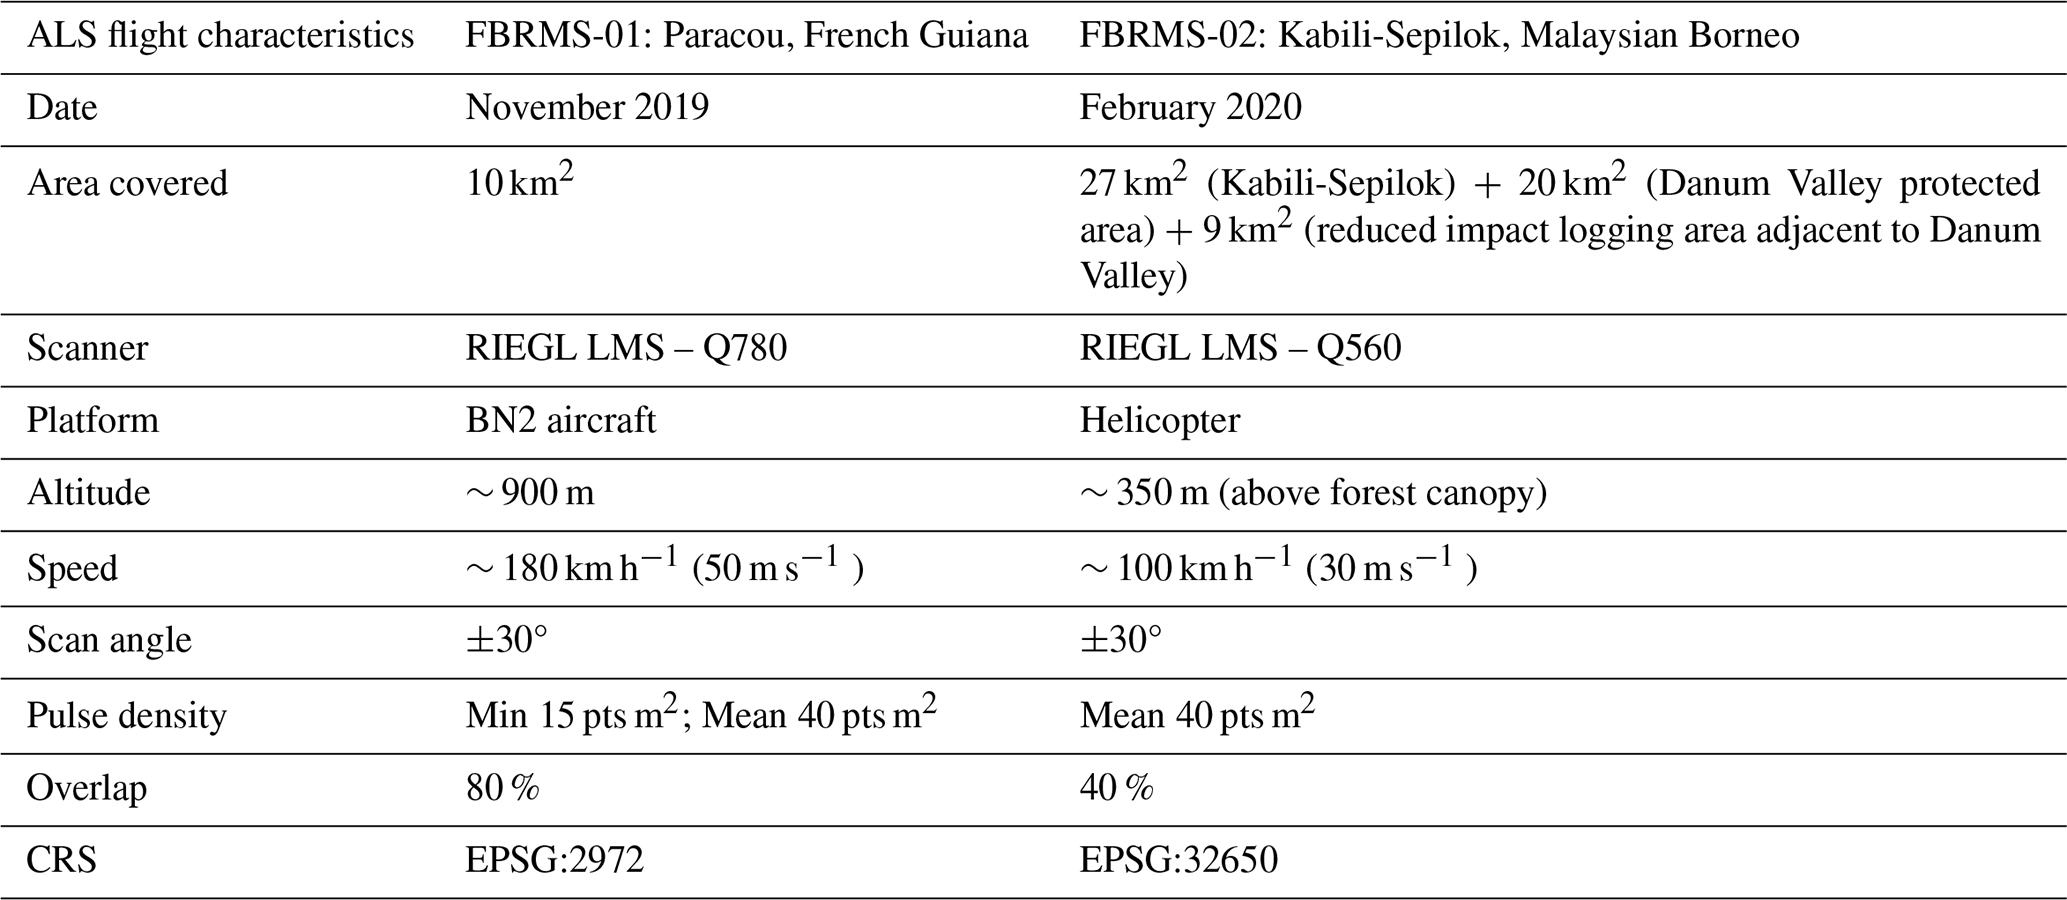
Table 9Comparison of ALS acquisition characteristics for two ForestScan sites: FBRMS-01: Paracou, French Guiana and FBRMS-03: Kabili-Sepilok, Malaysian Borneo. These key flight and sensor characteristics can support alignment and comparability across sites.
FBRMS-01: Paracou, French Guiana
ALS data were acquired over Paracou in November 2019. The data covers 10 km2, including all experimental plots and areas covered by TLS and UAV-LS (see Fig. 1). During the same campaign, additional data was gathered over Nouragues Research Station in French Guiana. This supplementary data was collected using identical scanning characteristics (provided in Table 9) and has been incorporated into the ForestScan data archive.
ALS data for Paracou are freely available via the Centre for Environmental Data Analysis (CEDA) with DOIs provided in Sect. 4. Canopy height models for both Paracou and Sepilok are described in Jackson et al. (2024a) and available at https://doi.org/10.5281/zenodo.10908679 (Jackson et al., 2024b).
FBRMS-03: Kabili-Sepilok, Malaysia
ALS data were acquired at Kabili-Sepilok in February 2020. This dataset includes LiDAR and RedGreenBlue (RGB) imagery data collected from a helicopter over the Kabili-Sepilok Forest Reserve and an additional non-ForestScan site – Danum Valley Forest Reserve. These areas were selected due to the availability of prior ALS data collected in 2013 and 2014. The complete collection and processing details for these datasets are detailed in Jackson et al. (2024a).
The point cloud data for this FBRMS are available in LAS (LASer) format, as well as RGB data summary rasters in .tif format. The raster images were processed with LAStools using default parameters. Canopy Height Model (CHM), Digital Surface Model (DSM), Digital Terrain Model (DTM), and pulse density (pd) data are also included. The RGB data are provided in .jpg format and organised by flight date. The data was georeferenced using ground control points. This ALS dataset is freely available via the Centre for Environmental Data Analysis (CEDA) with DOIs provided in Sect. 4.
We provide data that are internally consistent in terms of pre-processing, geo-referencing, and exported in formats compatible with open-source tools. Any further processing will depend largely on the intended application, such as individual tree analysis or plot-level studies.
For TLS data, all point clouds within a single plot are co-registered into one unified point cloud. These are subsequently processed into individual tree point clouds, to which quantitative structural models (QSMs) are fitted to estimate volume. Datasets for FBRMS-01 and FBRMS-02 were acquired using a RIEGL VZ-400i equipped with GNSS RTK positioning. However, as GNSS performance is often compromised beneath dense tropical canopies, positional accuracy for these datasets should be interpreted with caution.
UAV-LS and ALS datasets are geo-referenced, with positional accuracy determined by IMU and GNSS measurements. These measurements can introduce errors that manifest as height biases between individual flight lines. Although no such discrepancies were observed in our data, a definitive assessment would require a rigorous comparison with ground control points – a step we have not undertaken. These datasets have not been explicitly aligned or matched to one another. Alignment is possible but requires manual identification of control points within each dataset, as noted above, should be undertaken only if necessary for the intended application of the data.
3.1 Matching TLS to census data: stem maps
A key step in estimating AGB from tree-level terrestrial laser scanning (TLS) point clouds is the selection of wood density for converting volume to mass. Wood density represents a significant source of uncertainty in the indirect estimation of AGB, whether through allometry and census DBH, EO-derived canopy height, TLS-estimated volume, or other methods (Phillips et al., 2019). If the censused trees in each plot can be matched to their TLS counterparts, literature estimates of species-specific WD (or field-measured values, if available) can be used. In the absence of such a match, plot-level mean WD values are employed, as is common in most EO-derived estimates that rely on large-scale allometric models (e.g. Chave et al., 2014). Research by Momo et al. (2020), Burt et al. (2020), and Demol et al. (2021) has demonstrated that significant bias can occur in TLS-derived AGB estimates due to within-tree WD variations when literature-derived species average WD values are used. However, Momo et al. (2020) suggest there is sufficient correlation between vertical gradients and basal WD to allow for empirical corrections.
While it is preferable to match TLS trees to census trees, this process is not straightforward and is currently only possible manually (if at all) after TLS data acquisition and co-registration. Once registered, a slice through the TLS plot-level point cloud can be generated, enabling the identification of individual trees from their stem profiles. This stem map can be provided in hard copy or digital format (e.g., high-resolution PDF) to the census team, who can then revisit the plot, moving through it in the same manner as during the census – starting at the plot's southeast corner or 0,0 and moving up and down by 10 m quadrants – annotating the TLS stem map with each tree census ID. This process can be conducted separately or as part of an existing census but is best performed simultaneously or as soon as possible after TLS collection to minimise changes and facilitate collaboration between TLS and census teams. Despite success with this approach in some plots (e.g., Gabon 2016), experience has shown that significant understory, terrain variation, and/or changes and tree falls between census and TLS data collection (e.g., ∼ 2 years between census and TLS data collection for FBRMS-03 plots, and significant tree falls and changes due to a storm between census and TLS data collection in FBRMS plot LPG-01 in Gabon) make this process very challenging, particularly for smaller stems (in the 10–20 cm DBH range).
3.2 Aligning TLS to UAV-LS data (and other spatial data)
Through its accurate global registration via PPK processing, UAV-LS can be regarded as a high-quality geometric reference for registration. For the purpose of comparison with accurate ALS data or satellite observations, a registration of TLS to the UAV-LS point cloud is highly recommended. The integration of GNSS directly into TLS data collection now ensures that registered plot-level point clouds are aligned within a global coordinate system. This significantly facilitates the co-registration of TLS and UAV-LS point clouds, given that GNSS accuracy is typically within 1 m. Historically, placing all LiDAR point clouds within accurate global coordinate systems necessitated dedicated survey measurements of plot corners or TLS locations via GNSS, a process often hindered by signal attenuation in dense forests. Consequently, GNSS surveying of plot corner locations is not a standard component of forest census protocols, although it should be considered essential for plots intended for EO calibration and validation purposes. The reduced cost of RTK GNSS equipment and its subsequent routine integration into TLS workflows have made this more feasible, despite the challenges in obtaining fixed positions, and maintaining radio link with a base positioned on a well-known point under deep forest canopy cover. While this may not benefit ALS directly, UAV-LS is likely to serve as a valuable intermediary between TLS (and census data) and ALS. The requirement for global GNSS positioning also extends to other spatial datasets.
3.3 Aligning TLS and UAV-LS to ALS data
Aligning ALS data with TLS and UAV-LS datasets presents significant challenges. Despite the use of high-quality GNSS positioning, meter-scale geolocation discrepancies between sensors can occur. Co-locating LiDAR datasets acquired at different scales – TLS, UAV-LS, and ALS – remains complex, with no standard or “turn-key” solution currently available. Manual intervention is often required, and the approach varies by site and sensor combination. While plot-level AGB estimation is relatively tolerant to these discrepancies, finer-scale applications (e.g., matching to tree-level census data) demand more precise alignment. This can be partially addressed through manual co-registration using common tie points across datasets.
Achieving meaningful alignment also depends on the internal characteristics of ALS point clouds. Acquisition parameters such as point density, scan angle distribution, and footprint size influence comparability and should be controlled as far as possible. Post-processing can regularise point density and scan angles within or across campaigns, improving consistency. Homogeneous scanning geometry enables more stable structural metrics and enhances AGB prediction performance. Similarly, parameters such as transmitted pulse power (which co-varies with pulse repetition rate) and flight altitude (affecting footprint size and canopy penetration) should be standardised across acquisitions to minimise bias (Vincent et al., 2023). These steps are critical for reducing alignment errors and ensuring robust comparisons between TLS, UAV-LS, and ALS datasets.
This paper presents 30 datasets, comprising LiDAR and tree census data for all three ForestScan FBRMS. All datasets are archived and publicly accessible through established data repositories. LiDAR datasets, including TLS, UAV-LS and ALS are freely available from the CEDA Archive (https://archive.ceda.ac.uk, last access: 4 February 2026) under the ForestScan data collection (https://doi.org/10.5285/88a8620229014e0ebacf0606b302112d, Chavana-Bryant et al., 2025l). This collection serves as an umbrella repository linking all individual LiDAR datasets by site and acquisition type. All tree census datasets are provided as curated data packages made available by the ForestPlots consortium and the French Agricultural Research Centre for International Development (CIRAD) open-access portal.
Tree census data packages for all three FBRMS are made available via two archival platforms: the CIRAD DataVerse portal for French Guiana (https://doi.org/10.18167/DVN1/94XHID, Derroire et al., 2025a), while Gabon and Malaysian Borneo data are available through ForestPlots.net (https://doi.org/10.5521/forestplots.net/2025_2, Chavana-Bryant et al., 2025k). An additional census dataset for a non-ForestScan plot at FBRMS-01 is included in Table 10 and made available via the CEDA archive.
Both tree census archival platforms operate under a fair use policy, governed by the Creative Commons Attribution-NonCommercial-ShareAlike 4.0 International Licence (CC BY-NC-SA 4.0) (see https://forestplots.net/en/join-forestplots/working-with-data and https://dataverse.org/best-practices/dataverse-community-norms, last access: 4 February 2026). These policies reflect a strong commitment to equitable and inclusive data collection, funding, and sharing practices, as outlined in the ForestPlots code of conduct (https://forestplots.net/en/join-forestplots/code-of-conduct, last access: 4 February 2026). Tropical forest plot census data provide unique insights into forest structure and dynamics but are challenging and often hazardous to collect, requiring sustained investment and logistical support in remote regions with limited infrastructure. A persistent challenge to equitable research is that those who collect these data are often least able to exploit the resulting large-scale datasets. This issue is particularly acute in the context of commercial data exploitation, including by artificial intelligence and large-scale data mining enterprises. To address this, the ForestPlots community has developed data-sharing agreements that promote fairness and inclusivity, as detailed in de Lima et al. (2022).
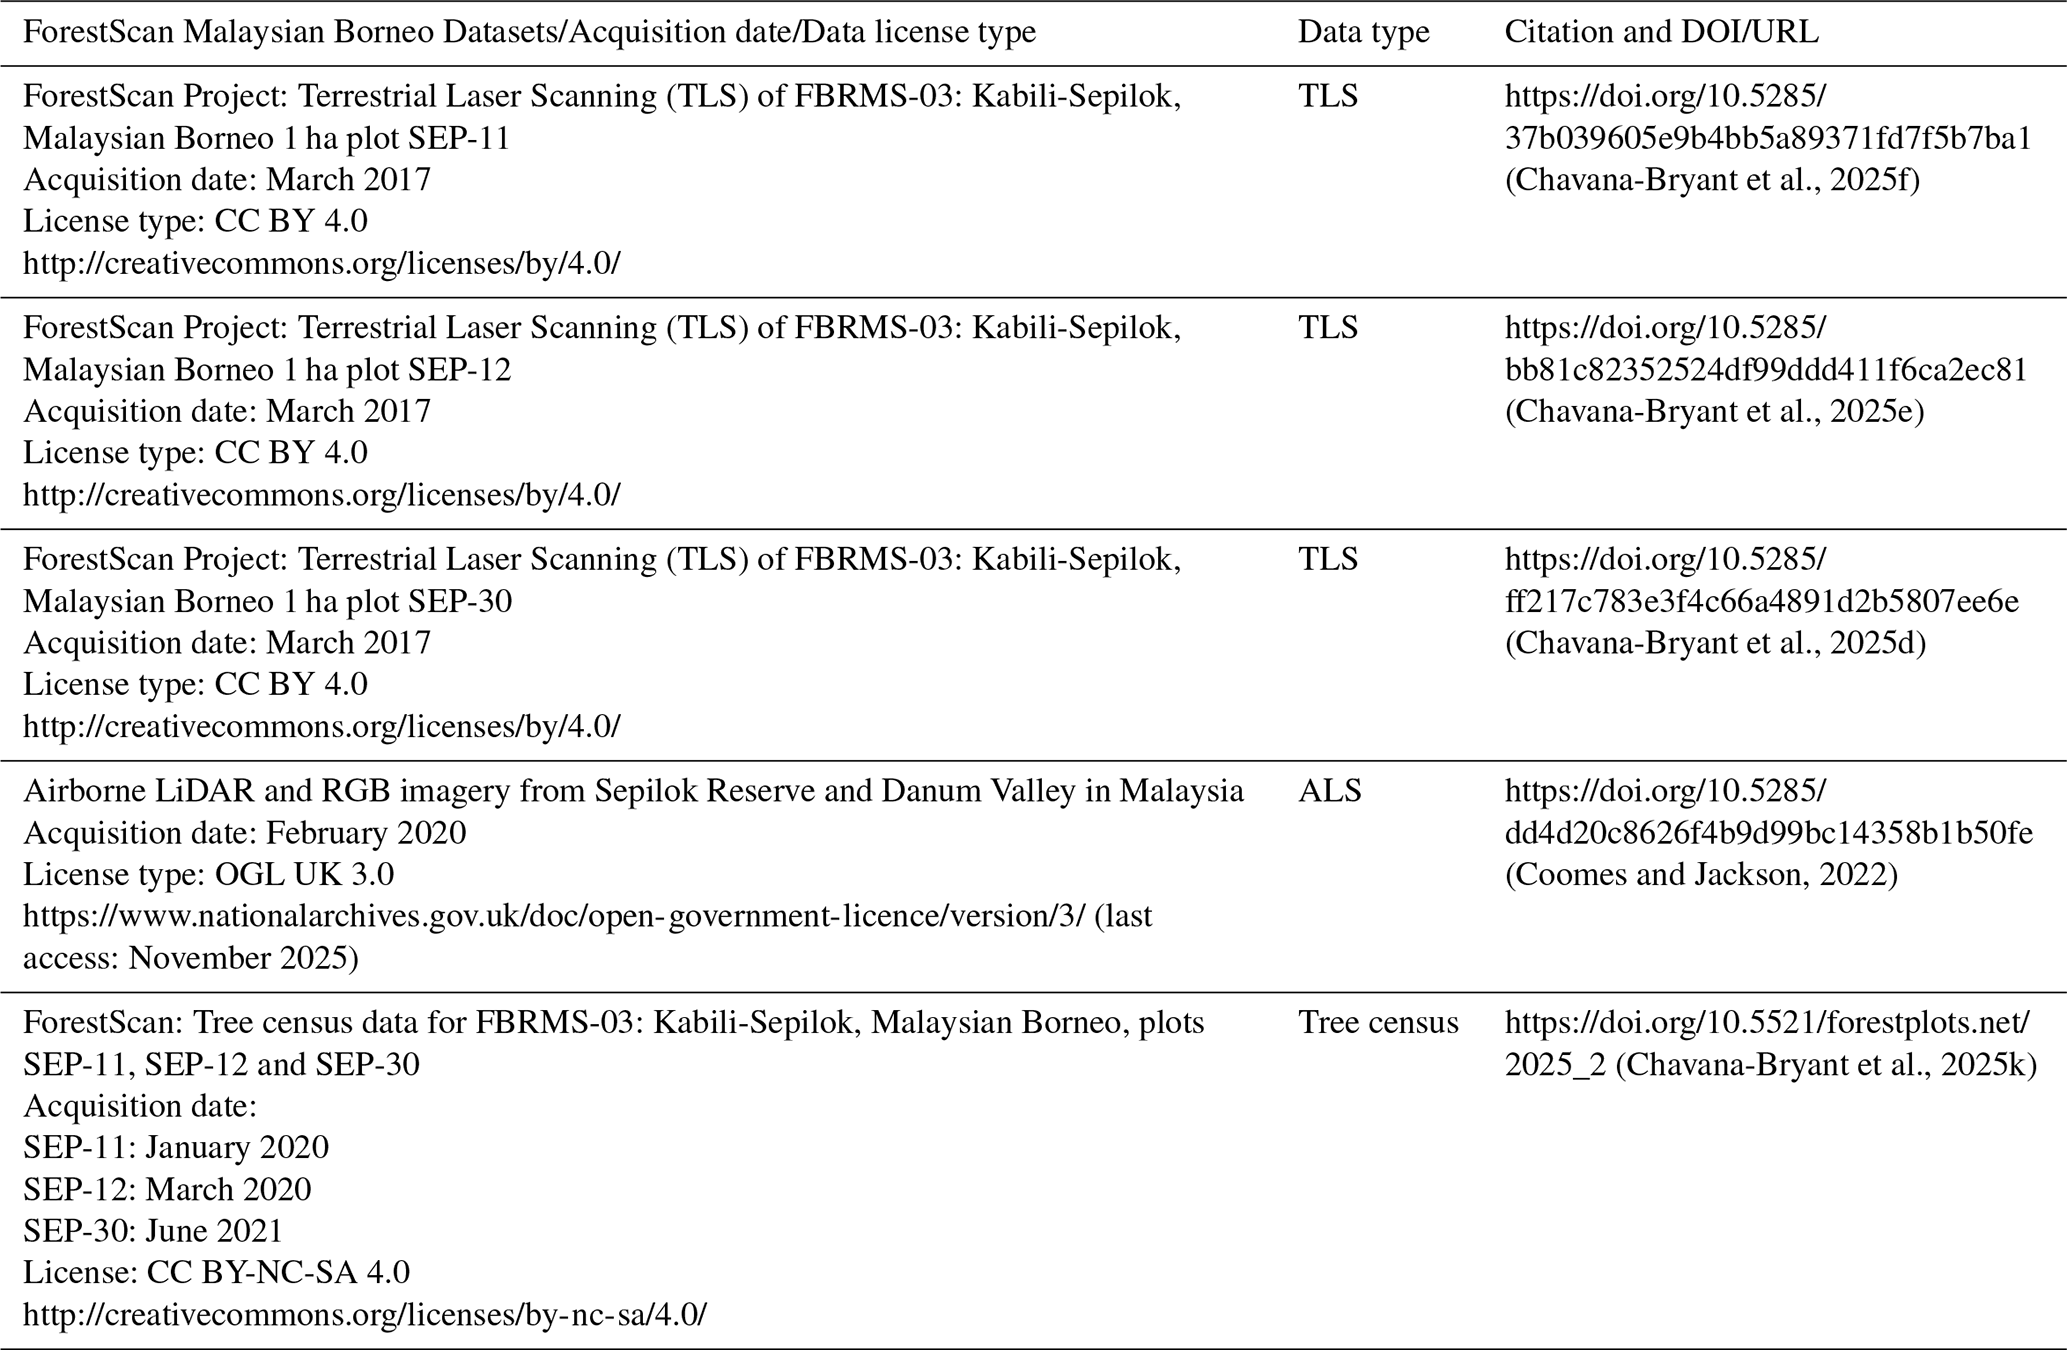
Access and citation details for all ForestScan datasets are organised by site in Tables 10, 11, and 12 for FBRMS-01: Paracou, French Guiana, FBRMS-02: Lopé National Park, Gabon, and FBRMS-03: Sepilok-Kabili, Malaysian Borneo, respectively. Each table provides the specific data type, acquisition date, license type and citation format including DOI and URL for each individual ForestScan dataset.
Table 10Dataset type, acquisition date, license type, and citation format including DOI and URL details for LiDAR (TLS, UAV-LS and ALS) and tree census datasets available for FBRMS-01: Paracou, French Guiana. When using any of the ForestScan datasets, this paper must also be cited.
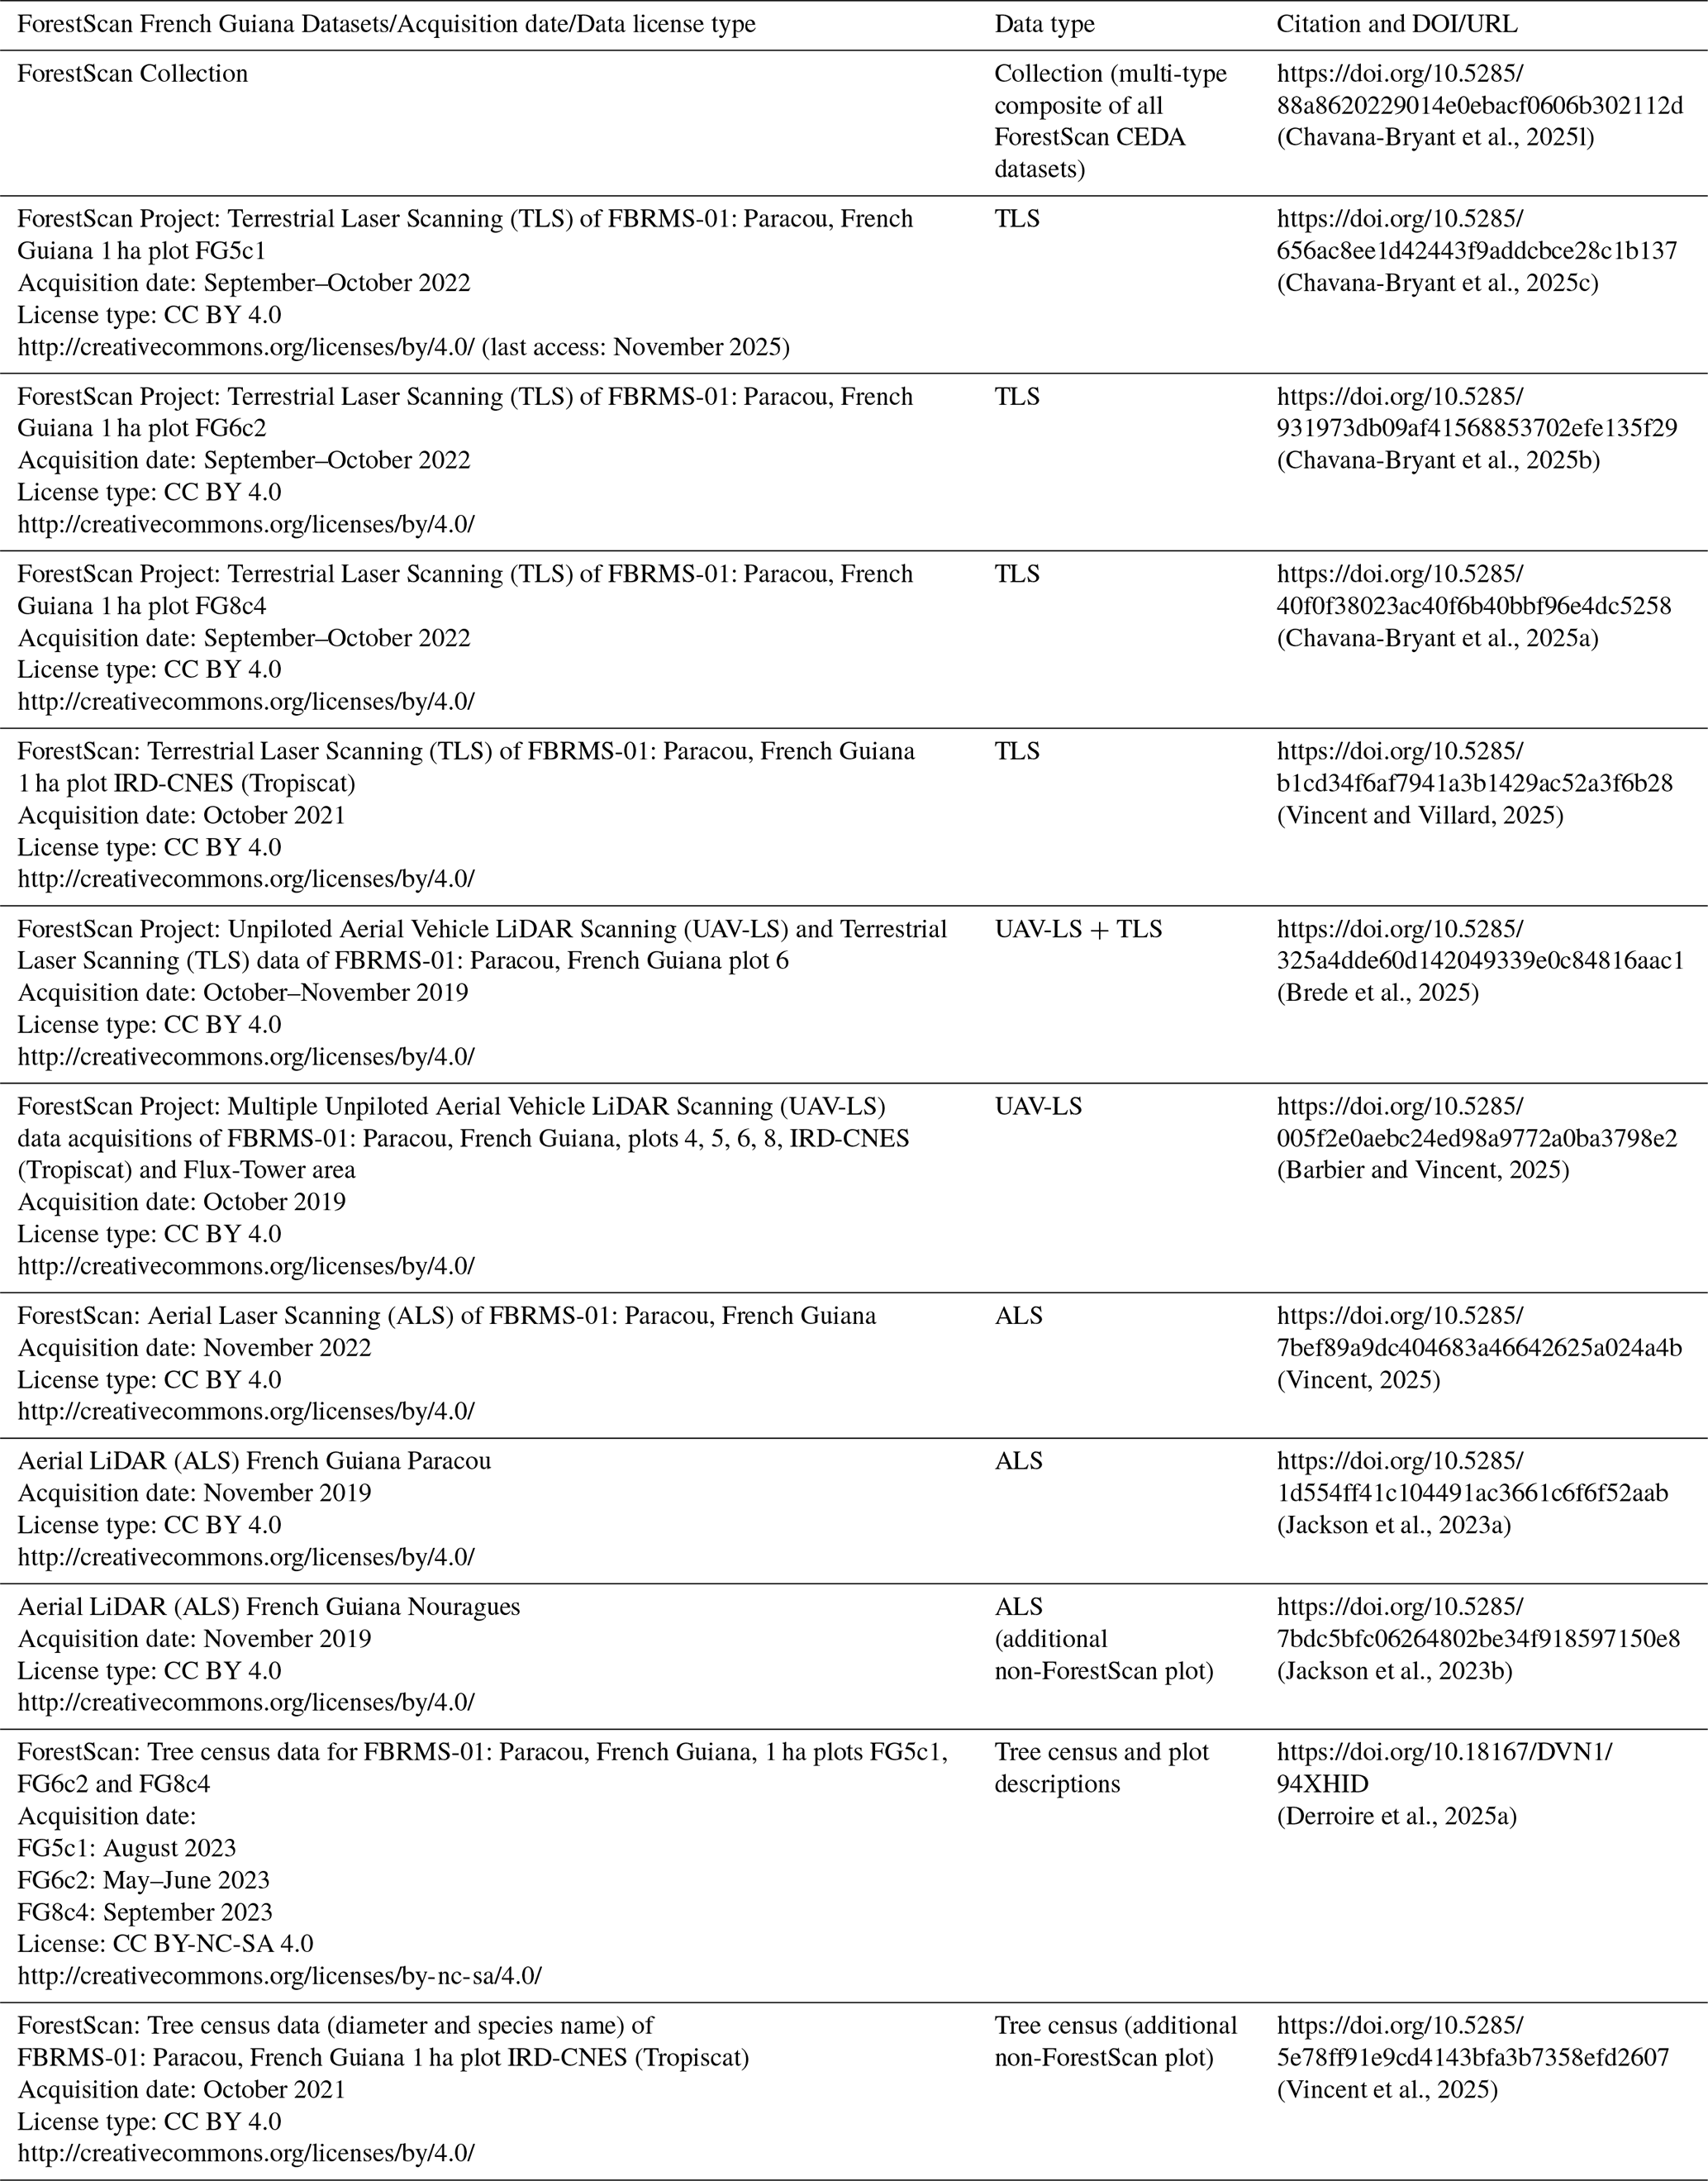
Table 11Dataset type, acquisition date, license type, and citation format including DOI and URL details for LiDAR (TLS, UAV-LS and ALS) and tree census datasets available for FBRMS-02: Lopé, Gabon. When using any of the ForestScan datasets, this paper must also be cited.

Table 12Dataset type, acquisition date, license type, and citation format including DOI and URL details for LiDAR (TLS, UAV-LS and ALS) and tree census datasets available for FBRMS-03: Kabili-Sepilok, Malaysian Borneo. When using any of the ForestScan datasets, this paper must also be cited.
Building on this first case study, we make the following general recommendations for data collection of tropical forest plot census, TLS, UAV-LS and ALS data for the specific application of estimating AGB and upscaling to EO estimates. These recommendations follow from the CEOS LPV AGB protocol and subsequent requirements identified for the GEO-TREES initiative.
-
Consistent data acquisition and processing: in order to facilitate the comparison of AGB estimates between sites, dates, teams, etc. care should be taken to collect and process data as consistently as possible. This might seem obvious but is particularly important as the use of TLS and UAV-LS for AGB estimation (and even ALS in some cases) are currently primarily research-led (as opposed to fully operational). As new methods and tools are developed, including newer versions of existing software, care should be taken to ensure backwards compatibility of the resulting AGB estimates. This means either re-processing older data, or at the very least, some form of cross-comparison of original and new methods. In our experience, listed below are some of the areas where care is needed to ensure data consistency and reduce bias and uncertainty:
- –
TLS data acquisition – comparison between sites and plots is made much easier by using the same census, TLS, UAV-LS and ALS data acquisition and processing protocols. Even within the forest plot census community there are slightly different protocols and processes between different plot networks. This is even more variable for different sources of LiDAR data. We note that much of the TLS work in tropical forests aimed at volume reconstruction and AGB estimation has been carried out with RIEGL VZ series TLS instruments. We make no comment as to what is “the best” instrument – there are various cost/benefit trade-offs to be made. Equipment has to be robust to withstand tropical forest work (and humidity). LiDAR range needs to be in the 100s of metres to ensure points are returned from tall canopies. Phase-shift TLS systems can be light and have very rapid scan rates but suffer from “ghosting” of multiple returned hits along a beam path. Mobile Laser Scanning (MLS) systems offer rapid coverage and require minimal input for registration by using simultaneous location and mapping (SLAM) but tend to have lower range and precision due to the uncertainty in absolute location resulting from SLAM. It is likely that these systems will become more powerful and precise, offering a possible alternative to static tripod-mounted TLS in the future for AGB applications. Specific issues to consider are TLS power. For example, the RIEGL VZ-400 and newer VZ-400i systems (both used here) have different recording sensitivities i.e. down to −30 dB for the newer VZ-400i, whereas the VZ-400 only recorded to −20 dB. This can have a significant impact on the number of returns, particularly from further away and higher in the canopy and should be taken into consideration when comparing results between older and newer TLS instruments. Choices are also possible in terms of power settings: lower power settings reduce scan times and extend battery time, but also significantly reduce the quality of resulting point clouds, particularly higher in the canopy. TLS data were collected using a pulse repetition rate (PRR) of 300 kHz on RIEGL VZ-400 and VZ-400i scanners, trading longer scan times for a fixed angular resolution to maximise coverage at the tops of tall trees. In the RIEGL configuration, PRR and emitted laser power are intrinsically linked: increasing the PRR reduces the available power, which in turn decreases the maximum range of the scanner. At very high PRR settings, this reduction in range means that the tops of tall trees may not be captured effectively. Therefore, selecting a lower PRR (300 kHz) ensures sufficient power and range to cover the full canopy height of forests, while maintaining the desired angular resolution. However, recent work by Verhelst et al. (2024) suggests that using lower power, but with higher angular resolution, can achieve better coverage in tall forests for the same scan duration (3 min per scan). More generally, comparing measurements made with scanners of varying power, sensitivity, resolution etc. will compound uncertainties (particularly biases) in the resulting estimates of AGB and so should be avoided or minimised as far as possible. This is particularly important for large-scale site-to-site comparison required for EO biomass product cal/val (e.g. for global FBRMS comparisons).
- –
TLS processing – broadly, TLS data acquisition and processing in tropical forests has gradually converged towards something of a consensus, albeit this is still an active area of research and will vary depending on the team, site and application. Specific issues to consider are the way in which trees are extracted from plot-scale point clouds. Currently, the most accurate method for doing this is by manual cleaning of each tree using a tool such as CloudCompare (http://www.cloudcompare.org, access: November 2025). However, this is a time-consuming and somewhat subjective process that is not fully replicable – different people will produce slightly different results. Automated pipelines using machine learning/deep learning (ML/DL) offer a more rapid and repeatable approach (e.g. Krisanski et al., 2021; Wilkes et al., 2023), however, their resulting tree extraction accuracy is harder to assess given that the “true” structure of trees is unknown. Manually extracted trees can be used to assess automated tree extraction accuracy, as well as forming the training data to enable improvements in the underlying ML/DL approaches. Developing locally trained/optimised ML/DL models is likely to improve this approach further. Moving from individual tree point clouds to volume estimates it is also important to use consistent QSM-fitting approaches. For example, there are systematic differences between older and newer versions of TreeQSM, currently the most widely used QSM fitting software (Demol et al., 2024; Raumonen et al., 2013). Quantifying the uncertainty in tree-level estimates of volume will depend on this processing chain, which will then determine the plot-level uncertainty when upscaling.
- –
UAV-LS acquisition and processing – due to the wide range of platforms and LiDAR payloads being used (as well as local UAV and safety regulations), there is currently little consensus in terms of both acquisition and processing of UAV-LS data. There are a wide range of flight choices (particularly altitude), instrument settings (scan angle), and survey systems (overlap, duration, etc.) that are a function of platform performance, cost, etc. The impact of some of these choices is discussed in Brede et al. (2022b) where the benefits of higher power, multiple returns and overlapping flights in detecting canopy structure are highlighted. UAV-LS is not a like-for-like replacement for TLS, thus, the ability to compare these two different sources of LiDAR data will be facilitated by accurate geo-location (see above). This can be achieved by using ground targets with surveyed locations that can be identified in the UAV-LS data (e.g. reflective sheets/tarps, umbrellas, commercial UAV targets etc). This presupposes that there are sufficient gaps in the canopy for targets to be seen, which is not always true. During data collection attention should be paid to also either have access to GNSS observables from permanent base stations (e.g. CORS network) or collect observables with a temporary base station (e.g. Emlid Reach RS+ or RS2). A base station should be positioned less than 15 km away from the survey area. An important consideration for UAV-LS data collection is whether visual line of sight VLOS needs to be maintained, i.e. visibility of the platform by the pilot during the whole mission. If so, this can impact the choice of take-off, flight plan, etc. which in turn may influence the choice of platform. Fixed-wing platforms have a much greater area coverage and flight duration than VTOL platforms, but by necessity, must operate beyond VLOS (BVLOS). They also require far more space to take off and land than VTOL platforms.
- –
ALS acquisition and processing – while ALS has been used operationally for forest applications for several decades, its application for AGB estimates specifically is still less well-defined. In particular, this is true when considering tree-scale rather than plot-level estimates. Practically, ALS surveys are almost always outsourced (from the plot PIs, census and TLS, UAV teams) to commercial or agency (e.g. NASA, ESA, NERC) providers. In the former case, there may be limited input from the end user over the platform, instrument and acquisition parameters, or the way in which the data are processed to the resulting final delivery. In ESA, NERC, NASA acquisitions, there tends to be more input from the users, but there may be other restrictions in terms of when and where flights can be made. We recommend a pulse density of 10 m−2 or higher and a swath angle of ±15° or smaller. Most importantly, consistency over time of the other acquisition parameters should be sought to enable meaningful temporal analysis of ALS point cloud. In most cases, the 3D point cloud will be processed to generate a 2D canopy height model for further analysis. This post-processing can have important effects on the results, we therefore, recommend users follow a standardized procedure such as Fischer et al. (2024).
- –
-
Accurate (cm-scale) GNSS locations for 1 ha FBRMS plot corners (or at the least the nominal origin 0, 0 coordinate for each plot): this makes comparison and merging of any subsequent measurements much easier. It is important to note that this is not a standard requirement of forest census measurements and requires specialist surveying equipment e.g. GNSS RTK base station + rover configuration. It is also challenging under heavy forest cover. Given that such setups are required (ideally) for TLS and UAV-LS, plot corner surveying is potentially best carried out by these teams.
-
Linking TLS trees to their census counterparts: ideally, a permanent 10 × 10 m subplot grid would be established within each 1 ha forest plot. Census teams can then follow the same chain sampling pattern used in TLS data collection (see Fig. 4a and b) and identify the tree IDs found within each 10 × 10 m quadrants as they move through the plot. However, placing a 10 × 10 m sub-grid is not always straightforward (or even desirable) as it may require rebar posts, which can be expensive and are likely to be removed or damaged by e.g. elephants in West African plots particularly. An alternative approach is to label some trees with temporary numbered QR-type markers that can be read automatically from the lidar point cloud data. The markers can be printed on A4 waterproof paper, attached to trees with known census ID, and then identified in the TLS data using a tool such as qrDAR (Wilkes et al., 2017). If the 20 or so largest trees are labelled in this way, distributed across a 1 ha plot, this makes subsequent tree matching between census and TLS data much easier as there are known “anchor trees” for the survey team to work from.
All authors provided input towards the writing of this manuscript. CCh-B wrote the manuscript with significant input from MD.
CCh-B developed the TLS data processing pipeline.
CCh-B collected, cleaned, processed and curated TLS data.
CCh-B developed the data repositories and ensured data integrity with support from MD, the CEDA data management team and the ForestPlots and DataVerse database management teams.
PW developed the TLS data processing pipeline, assisted in the collection of TLS data in FBRMS-02: Lopé, Gabon and its processing.
WY developed the TLS data processing pipeline, assisted in the collection of TLS data in FBRMS-01 Paracou, French Guiana and its processing.
AB and TJ collected TLS data in FBRMS-03: Kabili-Sepilok, Malaysian Borneo.
HOMN and LM provided field logistics and assisted in the collection of TLS data in FBRMS-02: Lopé, Gabon.
LS and VD helped collect TLS in FBRMS-02: Lopé, Gabon.
KA, SN and AN provided logistics and research permit support for FBRMS-02: Lopé, Gabon.
PV assisted in the processing of TLS data and developing the TLS2trees Processing Scripts.
ACB collected census data in FBRMS-01 Paracou, French Guiana and in FBRMS-02: Lopé, Gabon with assistance from DLMC.
VM, PD, HOMN and KJ collected the field census data for LPG-01.
NL, PD, HOMN and KJ collected the field census data for OKO-01, OKO-02 and OKO-03 in Lopé, Gabon.
TJ, DC and GV planned and funded the ALS data collection in FBRMS-01, Paracou French Guiana.
TJ and DC planned and funded the ALS data collection in FBRMS-03, Kabili-Sepilok, Malaysian Borneo.
IMM arranged, collected and processed the UAV-LS data collected over FBRMS-02: Lopé, Gabon.
BB, AL and HB collected, cleaned, processed and curated TLS and UAV-LS data collected at Paracou, French Guiana.
NB, GV collected, cleaned, processed and curated TLS and UAV-LS data collected at Paracou, French Guiana.
Andrew Burt is an employee and/or shareowner of Sylvera Ltd. All other authors declare that they have no conflict of interest.
Publisher's note: Copernicus Publications remains neutral with regard to jurisdictional claims made in the text, published maps, institutional affiliations, or any other geographical representation in this paper. The authors bear the ultimate responsibility for providing appropriate place names. Views expressed in the text are those of the authors and do not necessarily reflect the views of the publisher.
We are indebted to the long-term work of many researchers in funding, establishing and maintaining the field plots that were used in this study. It is not possible to carry out meaningful cal/val measurements of tropical forest biomass for earth observation studies without the logistical support and expertise of the plot PIs and their teams. We thank Noreen Majalap for logistical and research permit support in FBRMS-03, Kabili-Sepilok, Malaysian Borneo. We also thank the Sabah Biodiversity Council for their support with airborne laser scanning data collection in Kabili-Sepilok, access license number: JKM/MBS.1000-2/2 JLD.9 (122). We thank Esther Conway and her team for their outstanding support in developing the ForestScan CEDA dataset collection. We thank Aurora Levesley and Gaëlle Jaouen for their generous support in developing the ForestPlots and DataVerse tree census data packages.
Specific data collection activities were funded by the European Space Agency under ESA/ contract No. 4000126857/20/NL/AI. M.D., P.W., C.Ch-B., W.Y. acknowledge Capital Infrastructure Funding (CIF) for TLS equipment from UCL Geography and the Natural Environment Research Council (NERC) National Centre for Earth Observation (NCEOT.J. and D.C. acknowledge the funding for ALS data collection over FBRMS-01: Paracou, French Guiana in 2019 and FBRMS-03: Kabili-Sepilok, Malaysian Borneo during February 2020 as part of a NERC project grant (NE/S010750/1).). I.M.M. was partly funded by a European Research Council Starting Grant (757526) awarded to E.T.A.M. Work in Lopé was supported by core funding from Total Gabon and the 40 EU-ACP ECOFAC VI grant to the Gabon National Parks Agency for logistics, staff and site operations. Work in French Guiana benefited from the 30 Investissement d’Avenir grants of the ANR, France (CEBA: ANR-10-LABX-0025).
This paper was edited by Sibylle K. Hassler and reviewed by Hannah Weiser and Jonathan P. Sheppard.
Adams, D. C., Collyer, M. L., Kaliontzopoulou, A., and Baken, E.: Geomorph: Geometric Morphometric Analyses of 3D Data (4.0.10), CRAN [code], https://doi.org/10.32614/CRAN.package.geomorph, 2025.
Agence Nationale des Parcs Nationaux (ANPN): Parcs Gabon, Recherche Scientifique, https://scienceparcsgabon.weebly.com/, last access: November 2025.
Arrizza, S., Marras, S., Ferrara, R., and Pellizzaro, G.: Terrestrial Laser Scanning (TLS) for tree structure studies: a review of methods for wood-leaf classifications from 3D point clouds, Remote Sens. Appl., 36, 101364, https://doi.org/10.1016/j.rsase.2024.101364, 2024.
Askne, J. and Santoro, M.: Experiences in boreal forest stem volume estimation from multitemporal C-band InSAR, in: Recent Interferometry Applications in Topography and Astronomy, 169–194, https://doi.org/10.5772/35102, 2012.
Avitabile, V., Herold, M., Henry, M., and Schmullius, C.: Mapping biomass with remote sensing: a comparison of methods for the case study of Uganda, Carbon Balance and Management, 6, 1–14, https://doi.org/10.1186/1750-0680-6-7, 2011.
Avitabile, V., Herold, M., Heuvelink, G. B., Lewis, S. L., Phillips, O. L., Asner, G. P., Armston, J., Ashton, P. S., Banin, L., and Bayol, N.: An integrated pan-tropical biomass map using multiple reference datasets, Global Change Biology, 22, 1406–1420, https://doi.org/10.1111/gcb.13139, 2016.
Barbier, N. and Vincent, G.: ForestScan Project: Multiple Unpiloted Aerial Vehicle LiDAR Scanning (UAV-LS) data acquisitions of FBRMS-01: Paracou, French Guiana, plots 4, 5, 6, 8, IRD-CNES and Flux-Tower area, October 2019, NERC EDS Centre for Environmental Data Analysis [data set], https://doi.org/10.5285/005F2E0AEBC24ED98A9772A0BA3798E2, 2025.
Brede, B., Terryn, L., Barbier, N., Bartholomeus, H. M., Bartolo, R., Calders, K., Derroire, G., Moorthy, S. M. K., Lau, A., and Levick, S. R.: Non-destructive estimation of individual tree biomass: Allometric models, terrestrial and UAV laser scanning, Remote Sensing of Environment, 280, 113180, https://doi.org/10.1016/j.rse.2022.113180, 2022a.
Brede, B., Bartholomeus, H. M., Barbier, N., Pimont, F., Vincent, G., and Herold, M.: Peering through the thicket: Effects of UAV LiDAR scanner settings and flight planning on canopy volume discovery, International Journal of Applied Earth Observation and Geoinformation, 114, 103056, https://doi.org/10.1016/j.jag.2022.103056, 2022b.
Brede, B., Barbier, N., Bartholomeus, H., Derroire, G., Lau, A., Lusk, D., and Herold, M.: ForestScan Project: Unpiloted Aerial Vehicle LiDAR Scanning (UAV-LS) and Terrestrial Laser Scanning (TLS) data of FBRMS-01: Paracou, French Guiana plot 6, 10th October to 15th November 2019, NERC EDS Centre for Environmental Data Analysis [data set], https://doi.org/10.5285/325A4DDE60D142049339E0C84816AAC1, 2025.
Burt, A., Disney, M., and Calders, K.: Extracting individual trees from lidar point clouds using treeseg, Methods in Ecology and Evolution, 10, 438-445, https://doi.org/10.1111/2041-210x.13121, 2019.
Burt, A., Calders, K., Cuni-Sanchez, A., Gómez-Dans, J., Lewis, P., Lewis, S. L., Malhi, Y., Phillips, O. L., and Disney, M.: Assessment of bias in pan-tropical biomass predictions, Frontiers in Forests and Global Change, 3, 12, https://doi.org/10.3389/ffgc.2020.00012, 2020.
Calders, K., Verbeeck, H., Burt, A., Origo, N., Nightingale, J., Malhi, Y., Wilkes, P., Raumonen, P., Bunce, R. G., and Disney, M.: Laser scanning reveals potential underestimation of biomass carbon in temperate forest, Ecological Solutions and Evidence, 3, e12197, https://doi.org/10.1002/2688-8319.12197, 2022.
Chavana-Bryant, C., Wilkes, P., Yang, W., Burt, A., Vines, P., Bennett, A. C., Pickavance, G. C., Cooper, D. L. M., Lewis, S. L., Phillips, O. L., Brede, B., Lau, A., Herold, M., McNicol, I. M., Mitchard, E. T. A., Coombes, D., Jackson, T. D., Makaga, L., Milamizokou Napo, H. O., Ngomanda, A., Ntie, S., Medjibe, V., Dimbonda, P., Soenens, L., Daelemans, V., Proux, L., Nilus, R., Labrière, N., Jeffery, K., Burslem, D. F. R. P., Clewley, D., Moffat, D., Qie, L., Bartholomeus, H., Vincent, G., Barbier, N., Derroire, G., Abernethy, K., Scipal, K., and Disney, M.: ForestScan Project: Terrestrial Laser Scanning (TLS) of FBRMS-01: Paracou, French Guiana 1 ha plot FG8c4, September to October 2022, NERC EDS Centre for Environmental Data Analysis [data set], https://doi.org/10.5285/40F0F38023AC40F6B40BBF96E4DC5258, 2025a.
Chavana-Bryant, C., Wilkes, P., Yang, W., Burt, A., Vines, P., Bennett, A. C., Pickavance, G. C., Cooper, D. L. M., Lewis, S. L., Phillips, O. L., Brede, B., Lau, A., Herold, M., McNicol, I. M., Mitchard, E. T. A., Coombes, D., Jackson, T. D., Makaga, L., Milamizokou Napo, H. O., Ngomanda, A., Ntie, S., Medjibe, V., Dimbonda, P., Soenens, L., Daelemans, V., Proux, L., Nilus, R., Labrière, N., Jeffery, K., Burslem, D. F. R. P., Clewley, D., Moffat, D., Qie, L., Bartholomeus, H., Vincent, G., Barbier, N., Derroire, G., Abernethy, K., Scipal, K., and Disney, M.: ForestScan Project: Terrestrial Laser Scanning (TLS) of FBRMS-01: Paracou, French Guiana 1 ha plot FG6c2, September to October 2022, NERC EDS Centre for Environmental Data Analysis [data set], https://doi.org/10.5285/931973DB09AF41568853702EFE135F29, 2025b.
Chavana-Bryant, C., Wilkes, P., Yang, W., Burt, A., Vines, P., Bennett, A. C., Pickavance, G. C., Cooper, D. L. M., Lewis, S. L., Phillips, O. L., Brede, B., Lau, A., Herold, M., McNicol, I. M., Mitchard, E. T. A., Coombes, D., Jackson, T. D., Makaga, L., Milamizokou Napo, H. O., Ngomanda, A., Ntie, S., Medjibe, V., Dimbonda, P., Soenens, L., Daelemans, V., Proux, L., Nilus, R., Labrière, N., Jeffery, K., Burslem, D. F. R. P., Clewley, D., Moffat, D., Qie, L., Bartholomeus, H., Vincent, G., Barbier, N., Derroire, G., Abernethy, K., Scipal, K., and Disney, M.: ForestScan Project: Terrestrial Laser Scanning (TLS) of FBRMS-01: Paracou, French Guiana 1 ha plot FG5c1, September to October 2022, NERC EDS Centre for Environmental Data Analysis [data set], https://doi.org/10.5285/656AC8EE1D42443F9ADDCBCE28C1B137, 2025c.
Chavana-Bryant, C., Wilkes, P., Yang, W., Burt, A., Vines, P., Bennett, A. C., Pickavance, G. C., Cooper, D. L. M., Lewis, S. L., Phillips, O. L., Brede, B., Lau, A., Herold, M., McNicol, I. M., Mitchard, E. T. A., Coombes, D., Jackson, T. D., Makaga, L., Milamizokou Napo, H. O., Ngomanda, A., Ntie, S., Medjibe, V., Dimbonda, P., Soenens, L., Daelemans, V., Proux, L., Nilus, R., Labrière, N., Jeffery, K., Burslem, D. F. R. P., Clewley, D., Moffat, D., Qie, L., Bartholomeus, H., Vincent, G., Barbier, N., Derroire, G., Abernethy, K., Scipal, K., and Disney, M.: ForestScan Project: Terrestrial Laser Scanning (TLS) of FBRMS-03: Kabili-Sepilok, Malaysian Borneo 1 ha plot SEP-30, March 2017, NERC EDS Centre for Environmental Data Analysis [data set], https://doi.org/10.5285/FF217C783E3F4C66A4891D2B5807EE6E, 2025d.
Chavana-Bryant, C., Wilkes, P., Yang, W., Burt, A., Vines, P., Bennett, A. C., Pickavance, G. C., Cooper, D. L. M., Lewis, S. L., Phillips, O. L., Brede, B., Lau, A., Herold, M., McNicol, I. M., Mitchard, E. T. A., Coombes, D., Jackson, T. D., Makaga, L., Milamizokou Napo, H. O., Ngomanda, A., Ntie, S., Medjibe, V., Dimbonda, P., Soenens, L., Daelemans, V., Proux, L., Nilus, R., Labrière, N., Jeffery, K., Burslem, D. F. R. P., Clewley, D., Moffat, D., Qie, L., Bartholomeus, H., Vincent, G., Barbier, N., Derroire, G., Abernethy, K., Scipal, K., and Disney, M.: ForestScan Project: Terrestrial Laser Scanning (TLS) of FBRMS-03: Kabili-Sepilok, Malaysian Borneo 1 ha plot SEP-12, March 2017, NERC EDS Centre for Environmental Data Analysis [data set], https://doi.org/10.5285/BB81C82352524DF99DDD411F6CA2EC81, 2025e.
Chavana-Bryant, C., Wilkes, P., Yang, W., Burt, A., Vines, P., Bennett, A. C., Pickavance, G. C., Cooper, D. L. M., Lewis, S. L., Phillips, O. L., Brede, B., Lau, A., Herold, M., McNicol, I. M., Mitchard, E. T. A., Coombes, D., Jackson, T. D., Makaga, L., Milamizokou Napo, H. O., Ngomanda, A., Ntie, S., Medjibe, V., Dimbonda, P., Soenens, L., Daelemans, V., Proux, L., Nilus, R., Labrière, N., Jeffery, K., Burslem, D. F. R. P., Clewley, D., Moffat, D., Qie, L., Bartholomeus, H., Vincent, G., Barbier, N., Derroire, G., Abernethy, K., Scipal, K., and Disney, M.: ForestScan Project: Terrestrial Laser Scanning (TLS) of FBRMS-03: Kabili-Sepilok, Malaysian Borneo 1 ha plot SEP-11, March 2017, NERC EDS Centre for Environmental Data Analysis [data set], https://doi.org/10.5285/37B039605E9B4BB5A89371FD7F5B7BA1, 2025f.
Chavana-Bryant, C., Wilkes, P., Yang, W., Burt, A., Vines, P., Bennett, A. C., Pickavance, G. C., Cooper, D. L. M., Lewis, S. L., Phillips, O. L., Brede, B., Lau, A., Herold, M., McNicol, I. M., Mitchard, E. T. A., Coombes, D., Jackson, T. D., Makaga, L., Milamizokou Napo, H. O., Ngomanda, A., Ntie, S., Medjibe, V., Dimbonda, P., Soenens, L., Daelemans, V., Proux, L., Nilus, R., Labrière, N., Jeffery, K., Burslem, D. F. R. P., Clewley, D., Moffat, D., Qie, L., Bartholomeus, H., Vincent, G., Barbier, N., Derroire, G., Abernethy, K., Scipal, K., and Disney, M.: ForestScan ProjecT: Terrestrial Laser Scanning (TLS) of FBRMS-02: Station d'Etudes des Gorilles et Chimpanzés, Lopé National Park, Gabon 1 ha plot OKO-03, June to July 2022, NERC EDS Centre for Environmental Data Analysis [data set], https://doi.org/10.5285/8ED3DDEC76B8470285BDB2EA643F54BC, 2025g.
Chavana-Bryant, C., Wilkes, P., Yang, W., Burt, A., Vines, P., Bennett, A. C., Pickavance, G. C., Cooper, D. L. M., Lewis, S. L., Phillips, O. L., Brede, B., Lau, A., Herold, M., McNicol, I. M., Mitchard, E. T. A., Coombes, D., Jackson, T. D., Makaga, L., Milamizokou Napo, H. O., Ngomanda, A., Ntie, S., Medjibe, V., Dimbonda, P., Soenens, L., Daelemans, V., Proux, L., Nilus, R., Labrière, N., Jeffery, K., Burslem, D. F. R. P., Clewley, D., Moffat, D., Qie, L., Bartholomeus, H., Vincent, G., Barbier, N., Derroire, G., Abernethy, K., Scipal, K., and Disney, M.: ForestScan Project: Terrestrial Laser Scanning (TLS) of FBRMS-02: Station d'Etudes des Gorilles et Chimpanzés, Lopé National Park, Gabon 1 ha plot OKO-02, June to July 2022, NERC EDS Centre for Environmental Data Analysis [data set], https://doi.org/10.5285/FF4B43475C9641CCA1DAD2C8BE8DADAF, 2025h.
Chavana-Bryant, C., Wilkes, P., Yang, W., Burt, A., Vines, P., Bennett, A. C., Pickavance, G. C., Cooper, D. L. M., Lewis, S. L., Phillips, O. L., Brede, B., Lau, A., Herold, M., McNicol, I. M., Mitchard, E. T. A., Coombes, D., Jackson, T. D., Makaga, L., Milamizokou Napo, H. O., Ngomanda, A., Ntie, S., Medjibe, V., Dimbonda, P., Soenens, L., Daelemans, V., Proux, L., Nilus, R., Labrière, N., Jeffery, K., Burslem, D. F. R. P., Clewley, D., Moffat, D., Qie, L., Bartholomeus, H., Vincent, G., Barbier, N., Derroire, G., Abernethy, K., Scipal, K., and Disney, M.: ForestScan Project: Terrestrial Laser Scanning (TLS) of FBRMS-02: Station d'Etudes des Gorilles et Chimpanzés, Lopé National Park, Gabon 1 ha plot OKO-01, June to July 2022, NERC EDS Centre for Environmental Data Analysis [data set], https://doi.org/10.5285/45AE3437F82F4E4FB75F9A5C26A194BA, 2025i.
Chavana-Bryant, C., Wilkes, P., Yang, W., Burt, A., Vines, P., Bennett, A. C., Pickavance, G. C., Cooper, D. L. M., Lewis, S. L., Phillips, O. L., Brede, B., Lau, A., Herold, M., McNicol, I. M., Mitchard, E. T. A., Coombes, D., Jackson, T. D., Makaga, L., Milamizokou Napo, H. O., Ngomanda, A., Ntie, S., Medjibe, V., Dimbonda, P., Soenens, L., Daelemans, V., Proux, L., Nilus, R., Labrière, N., Jeffery, K., Burslem, D. F. R. P., Clewley, D., Moffat, D., Qie, L., Bartholomeus, H., Vincent, G., Barbier, N., Derroire, G., Abernethy, K., Scipal, K., and Disney, M.: ForestScan Project: Terrestrial Laser Scanning (TLS) of FBRMS-02: Station d'Etudes des Gorilles et Chimpanzés, Lopé National Park, Gabon 1 ha plot LPG-01, June to July 2022, NERC EDS Centre for Environmental Data Analysis [data set], https://doi.org/10.5285/8EA2C697EE53430A84825384BFDCF06A, 2025j.
Chavana-Bryant, C., Wilkes, P., Yang, W., Burt, A., Vines, P., Bennett, A. C., Pickavance, G. C., Cooper, D. L. M., Lewis, S. L., Phillips, O. L., Brede, B., Lau, A., Herold, M., McNicol, I. M., Mitchard, E. T. A., Coomes, D. A., Jackson, T. D., Makaga, L., Milamizokou Napo, H. O., Ngomanda, A., Ntie, S., Medjibe, V., Dimbonda, P., Soenens, L., Daelemans, V., Proux, L., Nilus, R., Labrière, N., Jeffery, K., Burslem, D. F. R. P., Clewley, D., Moffat, D., Qie, L., Bartholomeus, H., Vincent, G., Barbier, N., Derroire, G., Abernethy, K., Scipal, K., and Disney, M.: ForestScan: tree census data of FBRMS-02: Station d'Etudes des Gorilles et Chimpanzés, Lopé National Park, Gabon and FBRMS-03: Kabili-Sepilok, Malaysian Borneo, ForestPlots.net [data set], https://doi.org/10.5285/88a8620229014e0ebacf0606b302112d, 2025k.
Chavana-Bryant, C., Wilkes, P., Yang, W., Burt, A., Vines, P., Bennett, A. C., Pickavance, G. C., Cooper, D. L. M., Lewis, S. L., Phillips, O. L., Brede, B., Lau, A., Herold, M., McNicol, I. M., Mitchard, E. T. A., Coomes, D. A., Jackson, T. D., Makaga, L., Milamizokou Napo, H. O., Ngomanda, A., Ntie, S., Medjibe, V., Dimbonda, P., Soenens, L., Daelemans, V., Proux, L., Nilus, R., Labrière, N., Jeffery, K., Burslem, D. F. R. P., Clewley, D., Moffat, D., Qie, L., Bartholomeus, H., Vincent, G., Barbier, N., Derroire, G., Abernethy, K., Scipal, K., and Disney, M.: ForestScan Project Data Collection [data set], https://doi.org/10.5285/88a8620229014e0ebacf0606b302112d, 2025l.
Chave, J., Réjou-Méchain, M., Búrquez, A., Chidumayo, E., Colgan, M. S., Delitti, W. B., Duque, A., Eid, T., Fearnside, P. M., and Goodman, R. C.: Improved allometric models to estimate the aboveground biomass of tropical trees, Global Change Biology, 20, 3177–3190, https://doi.org/10.1111/gcb.12629, 2014.
Coomes, D. and Jackson, T.: Airborne LiDAR and RGB imagery from Sepilok Reserve and Danum Valley in Malaysia in 2020, NERC EDS Centre for Environmental Data Analysis [data set], https://doi.org/10.5285/DD4D20C8626F4B9D99BC14358B1B50FE, 2022.
Cuni-Sanchez, A., White, L. J., Calders, K., Jeffery, K. J., Abernethy, K., Burt, A., Disney, M., Gilpin, M., Gomez-Dans, J. L., and Lewis, S. L.: African savanna-forest boundary dynamics: a 20-year study, PLoS One, 11, e0156934, https://doi.org/10.1371/journal.pone.0156934, 2016.
de Lima, R. A., Phillips, O. L., Duque, A., Tello, J. S., Davies, S. J., de Oliveira, A. A., Muller, S., Honorio Coronado, E. N., Vilanova, E., and Cuni-Sanchez, A.: Making forest data fair and open, Nature Ecology and Evolution, 6, 656-658, https://doi.org/10.1038/s41559-022-01738-7, 2022.
Demol, M., Calders, K., Krishna Moorthy, S. M., Van den Bulcke, J., Verbeeck, H., and Gielen, B.: Consequences of vertical basic wood density variation on the estimation of aboveground biomass with terrestrial laser scanning, Trees, 35, 671–684, https://doi.org/10.1007/s00468-020-02067-7, 2021.
Demol, M., Verbeeck, H., Gielen, B., Armston, J., Burt, A., Disney, M., Duncanson, L., Hackenberg, J., Kukenbrink, D., Lau, A., Ploton, P., Sewdien, A., Stovall, A., Takoudjou, S. M., Volkova, L., Weston, C., Wortel, V., and Calders, K.: Estimating forest above-ground biomass with terrestrial laser scanning: Current status and future directions, Methods in Ecology and Evolution, 13, 1628-1639, https://doi.org/10.1111/2041-210x.13906, 2022.
Demol, M., Aguilar-Amuchastegui, N., Bernotaite, G., Disney, M., Duncanson, L., Elmendorp, E., Espejo, A., Furey, A., Hancock, S., and Hansen, J.: Multi-scale lidar measurements suggest miombo woodlands contain substantially more carbon than thought, Communications Earth and Environment, 5, 366, https://doi.org/10.1038/s43247-024-01448-x, 2024.
Derroire, G., Hérault, B., Rossi, V., Blanc, L., Gourlet- Fleury, S., and Schmitt, L.: ForestScan: tree census data and plot descriptions of FBRMS-01: Paracou, French Guiana (V3), CIRAD Dataverse [data set], https://doi.org/10.18167/DVN1/94XHID, 2025a.
Derroire, G., Hérault, B., Rossi, V., Blanc, L., Gourlet-Fleury, S., and Schmitt, L.: ForestScan (DRAFT VERSION), CIRAD Dataverse [data set], https://doi.org/10.18167/DVN1/94XHID, 2025b.
Duncanson, L., Armston, J., Disney, M., Avitabile, V., Barbier, N., Calders, K., Carter, S., Chave, J., Herold, M., and Crowther, T. W.: The importance of consistent global forest aboveground biomass product validation, Surveys in Geophysics, 40, 979–999, https://doi.org/10.1007/s10712-019-09538-8, 2019.
Duncanson, L., Kellner, J. R., Armston, J., Dubayah, R., Minor, D. M., Hancock, S., Healey, S. P., Patterson, P. L., Saarela, S., and Marselis, S.: Aboveground biomass density models for NASA's Global Ecosystem Dynamics Investigation (GEDI) lidar mission, Remote Sensing of Environment, 270, 112845, https://doi.org/10.1016/j.rse.2021.112845, 2022.
Fischer, F. J., Jackson, T., Vincent, G., and Jucker, T.: Robust characterisation of forest structure from airborne laser scanning – A systematic assessment and sample workflow for ecologists, Methods in Ecology and Evolution, 15, 1873–1888, https://doi.org/10.1111/2041-210x.14416, 2024.
ForestPlots.net, Blundo, C., Carilla, J., Grau, R., Malizia, A., Malizia, L., Osinaga-Acosta, O., Bird, M., Bradford, M., Catchpole, D., and Ford, A.: Taking the pulse of Earth's tropical forests using networks of highly distributed plots, Biological Conservation, 260, 108849, https://doi.org/10.1016/j.biocon.2020.108849, 2021.
Goodman, R. C., Phillips, O. L., and Baker, T. R.: The importance of crown dimensions to improve tropical tree biomass estimates, Ecological Applications, 24, 680–698, https://doi.org/10.1890/13-0070.1, 2014.
Jackson, T., Vincent, G., and Coomes, D.: Aerial LiDAR data from French Guiana, Paracou, November 2019, NERC EDS Centre for Environmental Data Analysis [data set], https://doi.org/10.5285/1D554FF41C104491AC3661C6F6F52AAB, 2023a.
Jackson, T., Vincent, G., and Coomes, D.: Aerial LiDAR data from French Guiana, Nouragues, November 2019, NERC EDS Centre for Environmental Data Analysis [data set], https://doi.org/10.5285/7BDC5BFC06264802BE34F918597150E8, 2023b.
Jackson, T. D., Fischer, F. J., Vincent, G., Gorgens, E. B., Keller, M., Chave, J., Jucker, T., and Coomes, D. A.: Tall Bornean forests experience higher canopy disturbance rates than those in the eastern Amazon or Guiana shield, Global Change Biology, 30, e17493, https://doi.org/10.1111/gcb.17493, 2024.
Jackson, T., Fischer, F., Vincent, G., Gorgens, E., Keller, M., Chave, J., Jucker, T., and Coomes, D.: Repeat LiDAR canopy height models for Borneo, eastern Amazon and Guiana Shield, Zenodo [data set], https://doi.org/10.5281/zenodo.10908679, 2024.
Jucker, T., Caspersen, J., Chave, J., Antin, C., Barbier, N., Bongers, F., Dalponte, M., van Ewijk, K. Y., Forrester, D. I., and Haeni, M.: Allometric equations for integrating remote sensing imagery into forest monitoring programmes, Global Change Biology, 23, 177–190, https://doi.org/10.1111/gcb.13388, 2017.
Kellner, J. R., Armston, J., Birrer, M., Cushman, K., Duncanson, L., Eck, C., Falleger, C., Imbach, B., Král, K., and Krůček, M.: New opportunities for forest remote sensing through ultra-high-density drone lidar, Surveys in Geophysics, 40, 959–977, https://doi.org/10.1007/s10712-019-09529-9, 2019.
Krisanski, S., Taskhiri, M. S., Gonzalez Aracil, S., Herries, D., and Turner, P.: Sensor agnostic semantic segmentation of structurally diverse and complex forest point clouds using deep learning, Remote Sensing, 13, 1413, https://doi.org/10.3390/rs13081413, 2021.
Labrière, N., Davies, S. J., Disney, M. I., Duncanson, L. I., Herold, M., Lewis, S. L., Phillips, O. L., Quegan, S., Saatchi, S. S., and Schepaschenko, D. G.: Toward a forest biomass reference measurement system for remote sensing applications, Global Change Biology, 29, 827–840, https://doi.org/10.1111/gcb.16497, 2023.
Lopez-Gonzalez, G., Lewis, S. L., Burkitt, M., and Phillips, O. L.: ForestPlots.net: a web application and research tool to manage and analyse tropical forest plot data, Journal of Vegetation Science, 22, 610–613, https://doi.org/10.1111/j.1654-1103.2011.01312.x, 2011.
Malhi, Y., Girardin, C., Metcalfe, D. B., Doughty, C. E., Aragão, L. E., Rifai, S. W., Oliveras, I., Shenkin, A., Aguirre-Gutiérrez, J., and Dahlsjö, C. A.: The Global Ecosystems Monitoring network: Monitoring ecosystem productivity and carbon cycling across the tropics, Biological Conservation, 253, 108889, https://doi.org/10.1016/j.biocon.2020.108889, 2021.
Martin-Ducup, O., Mofack, G., Wang, D., Raumonen, P., Ploton, P., Sonké, B., Barbier, N., Couteron, P., and Pélissier, R.: Evaluation of automated pipelines for tree and plot metric estimation from TLS data in tropical forest areas, Annals of Botany, 128, 753–766, https://doi.org/10.1093/aob/mcab051, 2021.
McNicol, I. M., Mitchard, E. T., Aquino, C., Burt, A., Carstairs, H., Dassi, C., Modinga Dikongo, A., and Disney, M. I.: To what extent can UAV photogrammetry replicate UAV LiDAR to determine forest structure? A test in two contrasting tropical forests, Journal of Geophysical Research: Biogeosciences, 126, e2021JG006586, https://doi.org/10.1029/2021JG006586, 2021.
McNicol, I. M., Mitchard, E. T. A., Chavana-Bryant, C., Wilkes, P., and Disney, M.: ForestScan project: Unpiloted Aerial Vehicle LiDAR Scanning (UAV-LS) data of FBRMS-02: Station d'Etudes des Gorilles et Chimpanzés, Lopé National Park, Gabon, June 2022, Version 2.0, NERC EDS Centre for Environmental Data Analysis [data set], https://doi.org/10.5285/A79FCB9AB0C443FC86D453CC064759B1, 2025.
Momo, S. T., Ploton, P., Martin-Ducup, O., Lehnebach, R., Fortunel, C., Sagang, L. B. T., Boyemba, F., Couteron, P., Fayolle, A., and Libalah, M.: Leveraging signatures of plant functional strategies in wood density profiles of African trees to correct mass estimations from terrestrial laser data, Scientific Reports, 10, 2001, https://doi.org/10.1038/s41598-020-58733-w, 2020.
Morhart, C., Schindler, Z., Frey, J., Sheppard, J. P., Calders, K., Disney, M., Morsdorf, F., Raumonen, P., and Seifert, T.: Limitations of estimating branch volume from terrestrial laser scanning, European Journal of Forest Research, 143, 687-702, https://doi.org/10.1007/s10342-023-01651-z, 2024.
Nature Editorial Team: Editorial: We must get a grip on forest science-before it's too late, Nature, 608, 449, https://doi.org/10.1038/d41586-022-02182-0, 2022.
Ochiai, O., Poulter, B., Seifert, F. M., Ward, S., Jarvis, I., Whitcraft, A., Sahajpal, R., Gilliams, S., Herold, M., and Carter, S.: Towards a roadmap for space-based observations of the land sector for the UNFCCC global stocktake, Iscience, 26, 106489, https://doi.org/10.1016/j.isci.2023.106489, 2023.
PDAL Contributors: PDAL VoxelCenterNearestNeighbor filter, PDAL Point Data Abstraction Library, Zenodo [code], https://doi.org/10.5281/zenodo.10884408, 2025.
Phillips, O. L., Sullivan, M. J., Baker, T. R., Monteagudo Mendoza, A., Vargas, P. N., and Vásquez, R.: Species matter: wood density influences tropical forest biomass at multiple scales, Surveys in geophysics, 40, 913–935, https://doi.org/10.1007/s10712-019-09540-0, 2019.
Quegan, S., Le Toan, T., Chave, J., Dall, J., Exbrayat, J.-F., Minh, D. H. T., Lomas, M., D'alessandro, M. M., Paillou, P., and Papathanassiou, K.: The European Space Agency BIOMASS mission: Measuring forest above-ground biomass from space, Remote Sensing of Environment, 227, 44–60, https://doi.org/10.1016/j.rse.2019.03.032, 2019.
Ramachandran, N., Saatchi, S., Tebaldini, S., d'Alessandro, M. M., and Dikshit, O.: Mapping tropical forest aboveground biomass using airborne SAR tomography, Scientific Reports, 13, 6233, https://doi.org/10.1038/s41598-023-33311-y, 2023.
Raumonen, P., Kaasalainen, M., Åkerblom, M., Kaasalainen, S., Kaartinen, H., Vastaranta, M., Holopainen, M., Disney, M., and Lewis, P.: Fast automatic precision tree models from terrestrial laser scanner data, Remote Sensing, 5, 491–520, https://doi.org/10.3390/rs5020491, 2013.
RIEGL Laser Measurement Systems GmbH: RIEGL Laser measurement Systems GmbH, https://www.riegl.co.uk/, last access: 1 January 2025.
Roussel, J.-R., Auty, D., Coops, N. C., Tompalski, P., Goodbody, T. R. H., Sánchez Meador, A., Bourdon, J.-F., de Boissieu, F., and Achim, A.: lidR: An R package for analysis of Airborne Laser Scanning (ALS) data, Remote Sensing of Environment, 251, 112061, https://doi.org/10.1016/j.rse.2020.112061, 2020.
Saatchi, S., Chave, J., Labriere, N., Barbier, N., Réjou-Méchain, M., Ferraz, A., and Tao, S.: AfriSAR: Aboveground Biomass for Lope, Mabounie, Mondah, and Rabi Sites, Gabon [data set], https://doi.org/10.3334/ORNLDAAC/1681, 2019.
Saatchi, S. S., Harris, N. L., Brown, S., Lefsky, M., Mitchard, E. T., Salas, W., Zutta, B. R., Buermann, W., Lewis, S. L., and Hagen, S.: Benchmark map of forest carbon stocks in tropical regions across three continents, Proceedings of the National Academy of Sciences, 108, 9899–9904, https://doi.org/10.1073/pnas.1019576108, 2011.
Sabah Forestry Department: Official Website: https://forest.sabah.gov.my/, last access: 14 January 2025.
Schepaschenko, D., Chave, J., Phillips, O. L., Lewis, S. L., Davies, S. J., Réjou-Méchain, M., Sist, P., Scipal, K., Perger, C., and Herault, B.: The Forest Observation System, building a global reference dataset for remote sensing of forest biomass, Scientific Data, 6, 198, https://doi.org/10.1038/s41597-019-0196-1, 2019.
Verhelst, T. E., Calders, K., Burt, A., Demol, M., D'hont, B., Nightingale, J., Terryn, L., and Verbeeck, H.: Implications of Pulse Frequency in Terrestrial Laser Scanning on Forest Point Cloud Quality and Individual Tree Structural Metrics, Remote Sensing, 16, 4560, https://doi.org/10.3390/rs16234560, 2024.
Vincent, G.: ForestScan: Aerial Laser Scanning (ALS) of FBRMS-01: Paracou, French Guiana, November 2022, NERC EDS Centre for Environmental Data Analysis [data set], https://doi.org/10.5285/7BEF89A9DC404683A46642625A024A4B, 2025.
Vincent, G. and Villard, L.: ForestScan: Terrestrial Laser Scanning (TLS) of FBRMS-01: Paracou, French Guiana 1 ha plot IRD-CNES, October 2021, NERC EDS Centre for Environmental Data Analysis [data set], https://doi.org/10.5285/B1CD34F6AF7941A3B1429AC52A3F6B28, 2025.
Vincent, G., Verley, P., Brede, B., Delaitre, G., Maurent, E., Ball, J., Clocher, I., and Barbier, N.: Multi-sensor airborne lidar requires intercalibration for consistent estimation of light attenuation and plant area density, Remote Sensing of Environment, 286, 113442, https://doi.org/10.1016/j.rse.2022.113442, 2023.
Vincent, G., Martin, O., and Engel, F.: ForestScan: Tree census data (diameter and species name) of FBRMS-01: Paracou, French Guiana 1 ha plot IRD-CNES, October 2021, NERC EDS Centre for Environmental Data Analysis [data set], https://doi.org/10.5285/5E78FF91E9CD4143BFA3B7358EFD2607, 2025.
White, L., Rogers, M. E., Tutin, C. E., Williamson, E. A., and Fernandez, M.: Herbaceous vegetation in different forest types in the Lopé Reserve, Gabon: implications for keystone food availability, African Journal of Ecology, 33, 124-141, https://doi.org/10.1111/j.1365-2028.1995.tb00788.x, 1995.
Wilkes, P. and Yang, W.: rxp-pipeline: Tools to transform RIEGL terrestrial LiDAR, Zenodo [code], https://doi.org/10.5281/zenodo.15196452, 2025a.
Wilkes, P. and Yang, W.: mat2ply: Tools for converting QSM data to 3D PLY models., Zenodo [code], https://doi.org/10.5281/zenodo.17752998, 2025b.
Wilkes, P., Lau, A., Disney, M., Calders, K., Burt, A., de Tanago, J. G., Bartholomeus, H., Brede, B., and Herold, M.: Data acquisition considerations for terrestrial laser scanning of forest plots, Remote Sensing of Environment, 196, 140–153, https://doi.org/10.1016/j.rse.2017.04.030, 2017.
Wilkes, P., Disney, M., Armston, J., Bartholomeus, H., Bentley, L., Brede, B., Burt, A., Calders, K., Chavana-Bryant, C., Clewley, D., Duncanson, L., Forbes, B., Krisanski, S., Malhi, Y., Moffat, D., Origo, N., Shenkin, A., and Yang, W. X.: TLS2trees: A scalable tree segmentation pipeline for TLS data, Methods in Ecology and Evolution, 14, 3083–3099, https://doi.org/10.1111/2041-210x.14233, 2023.
Wilkes, P., Krisanski, S., Clewley, D., Moffat, D., and Yang, W.: TLS2trees (Version 0.1) Zenodo [code], https://doi.org/10.1111/2041-210X.14233, 2025.
Zanne, A. E., Lopez-Gonzalez, G., Coomes, D. A., Ilic, J., Jansen, S., Lewis, S. L., Miller, R. B., Swenson, N. G., Wiemann, M. C., and Chave, J.: Global wood density database [data set], https://doi.org/10.5061/dryad.234, 2009.