the Creative Commons Attribution 4.0 License.
the Creative Commons Attribution 4.0 License.
 | 11 Feb 2026
A database of databases for Common Era paleoclimate applications
Lucie J. Lücke
Kevin J. Fan
We present a merged database of five curated databases (DoD2k version 2.0.0) developed for Common Era (1–2000 A.D.) paleoclimate research. A toolkit to create the database is also provided and leverages codebases developed by individual database developers and the paleoclimate data informatics communities over the past decade. It includes Python notebooks for (1) loading each database from its public repository, using a common, compact set of terms for metadata and data management; (2) their merger using that common set of dictionary terms; (3) a multistage algorithm to identify candidate duplicates; (4) an operator-supervised, semiautomated decisionmaking procedure, checking against a common set of metadata and comparison metrics; and (5) creation and checking of the finalized, duplicate-free database across 22 dictionary terms. Each of the curated databases, which arise from individual, community and PAGES (Past Global Changes) 2k working groups, represent a range of development approaches, from single archive, single observation datasets with a range of reported environmental responses, to multiarchive-multiobservation collections which target a specific climate response.
The resulting DoD2k spans 13 archive types, 37 data types, and 4781 records within the Common Era. We illustrate the value of the DoD2k with two applications. In the first, we extract the moisture (M) and temperature (T) sensitive subset of records and perform an empirical orthogonal function (EOF) analysis on the resulting multi-archive, multi-observation MT-sensitive dataset. In the second, we show that calcite speleothem oxygen isotopic composition is consistent with that simulated using simple models of this proxy system. DoD2k may also be useful for paleoclimatic detection and attribution analysis using proxy system modeling, data assimilation, and deep learning for the development and testing of improved proxy system models. The database can be accessed at https://doi.org/10.25921/sptp-g618 (Evans et al., 2025). The toolkit can be accessed at https://doi.org/10.5281/zenodo.15676255 (Luecke et al., 2026).
- Article
(5456 KB) - Full-text XML
- BibTeX
- EndNote


The climate is changing, forced primarily by human-caused increases in greenhouse gas concentrations, aerosols and land use change, toward a warmer and more moisture-inequitable state, in which extreme events are more likely, and more extreme, than observed during the 20th century (Arias et al., 2021). Superimposed on that are other causes of forced climate variation and change, for instance, arising from volcanic activity, solar and orbital variations (Huybers and Curry, 2006; Miller et al., 2012; McGregor et al., 2015; Abram et al., 2016; Gebbie and Huybers, 2019). In addition, there is the tendency of the climate system, broadly defined as the coupled ocean, atmosphere, land surface, land and sea ice, biota, and solid earth, to vary on a broad range of timescales under stochastic forcing (Hasselmann, 1976). How then, to define both the spatial imprint and the amplitude of the climate change that arises from such forcings, and distinguish it from the human-driven forcings? The answers are important: first, for defining the equilibrium and transient climate change in response to a unit of forcing, over time and in different parts of the world (Forster et al., 2021); second, for detecting and projecting the impacts of both anthropogenic and natural climate forcing over past and future decades and centuries (Fox-Kemper et al., 2021; Marvel et al., 2019b, a). For such goals we need realistically forced paleoclimate simulations and observations (Neukom et al., 2019a).
The development of the observational target for such work is the focus of the present contribution, in particular for the so-called Common Era (1–2000 CE), for which observations from paleoclimatic archives are most dense and diverse, and permit an approximate 10-fold increase in the time interval of study relative to the historical record. More specifically, we would desire the most dense and random sampling in space and time, of all possible observations, imprinted with a diverse set of climatic information, and resolving timescales of variation from subannual to multicentennial with similar observational temporal resolution, and with well-characterized chronological uncertainty. The natural starting point for such an effort would be public repositories of individual paleoenvironmental datasets and databases, such as at the National Center for Environmental Information (https://www.ncei.noaa.gov/products/paleoclimatology, last access: 15 January 2026) and PANGAEA (https://pangaea.de, last access: 15 January 2026). However, this is impractical for multiple reasons, including some nonuniformity in dataset submissions and metadata, changes in repository submission templates and requirements over time, and the presence of multiple versions of datasets in repositories whose prime directive is preservation and availability (Anderson et al., 2019).
An alternate foundation for the development of such a database is in existing databases, many of them compiled by years-long efforts by PAGES (Past Global Changes; https://pastglobalchanges.org/, last access: 15 January 2026) Working Groups. PAGES databases are the result of leveraging community-level specialist expertise that is difficult for any single research group to assemble or maintain. The work of many individuals in multiple groups has enabled the development of publicly available observational datasets, the metadata that describes them, and most recently, the open semantic formalisms (Emile-Geay and Eshleman, 2013) and codebases (McKay and Emile-Geay, 2016) that enable their re-use. However, each such database, although rich in metadata, metadata uniformity, error checking and quality control, is generally assembled for a specific purpose. For example, the PAGES 2k Consortium (PAGES 2K Consortium, 2013; Emile-Geay et al., 2017) originally planned development of a multiarchive database (wood, coral, ice, documents, lake and marine sediments) of many different temperature-sensitive observations in these archives for the purpose of global mean and spatially resolved surface temperature reconstructions (Neukom et al., 2019a, b). The SISAL Working Group (Kaushal et al., 2024a) developed a single (speleothem) archive of multiple observations (e.g. δ18O, ) made in that particular archive. The Iso2k Working Group (Konecky et al., 2020a) produced a multiarchive (marine sediment, lake sediment, marine carbonate, speleothem carbonate, wood, ice) database of solely δ18O and δD observations in those archives, agnostic of climatic interpretation. For facilitating the repurposing of these databases for other scientific goals, such as the reconstruction of hydroclimatic variability (Falster et al., 2023) and the detection and attribution of climate change in both moisture and temperature via paleoclimatic data modeling (Franke et al., 2022a), we might need to combine multiple existing databases.
There are multiple challenges to creating a unified database of databases for Common Era paleoclimate applications. These include differences in the metadata and terminology for describing datasets across databases but within even the same proxy observation types and biogeochemical archival materials; differences between databases of the required metadata, sampling resolution, age model development, time resolution, level of replication, descriptions of observational uncertainty, and interpretational notes; and the problem of duplicate detection across combined databases (Anderson et al., 2019; Tardif et al., 2019; Steiger et al., 2022). Unfortunately, differences in metadata and terminology for defining properties across different curated databases, as well as differences in database terminology, structure, management, make merging databases and cleaning them for duplicates difficult. For instance, PAGES2K (Emile-Geay et al., 2017) has 173 dictionary terms, and as it happens, SISALv3 (Kaushal et al., 2024a) has 173 unique dictionary terms linking its 21 constituent csv files into a database. However, these are not the same 173 dictionary terms as for PAGES2k. Although there is common overlap in metadata, such as site identification name, they have different keys ('paleoData_TSid' in PAGES2K, 'site_id' in SISALv3).
Here we describe a unified Database of Common Era paleoclimate Databases (hereinafter, DoD2k) that addresses these challenges. We also provide a flexible and open framework, hereinafter called dt2k, implemented as Python functions, scripts and Jupyter notebooks, in which databases to be merged are loaded along with a standard set of metadata by which to merge existing databases may be specified (McKay and Emile-Geay, 2016), and in which duplicates across merged datasets may be identified and removed. The framework is extensible and can incorporate new databases or updates to existing ones. It provides methodical and comprehensive testing for duplicate records and can be easily attached to paleoclimatic analysis and reconstruction toolsets (Zhu et al., 2023, 2024).
The existing Common Era paleoclimate datasets to be merged, and the process by which they are merged into DoD2k, are described in Sect. 2. DoD2k is described in Sect. 3. Some applications using DoD2k are illustrated in Sect. 4. An outlook for future development is in Sect. 5 conclusions are in Sect. 8.
An overview of the workflow for creating DoD2k is shown in Fig. 1. DoD2k the product, as well as dt2k, the codebase for its production are supplied in a GitHub repository (https://www.github.com/lluecke/dod2k, last access: 15 January 2026). The codebase is written in Python 3. We provide a virtual environment (dod2k-env) and dt2k in a series of Jupyter notebooks and python scripts.
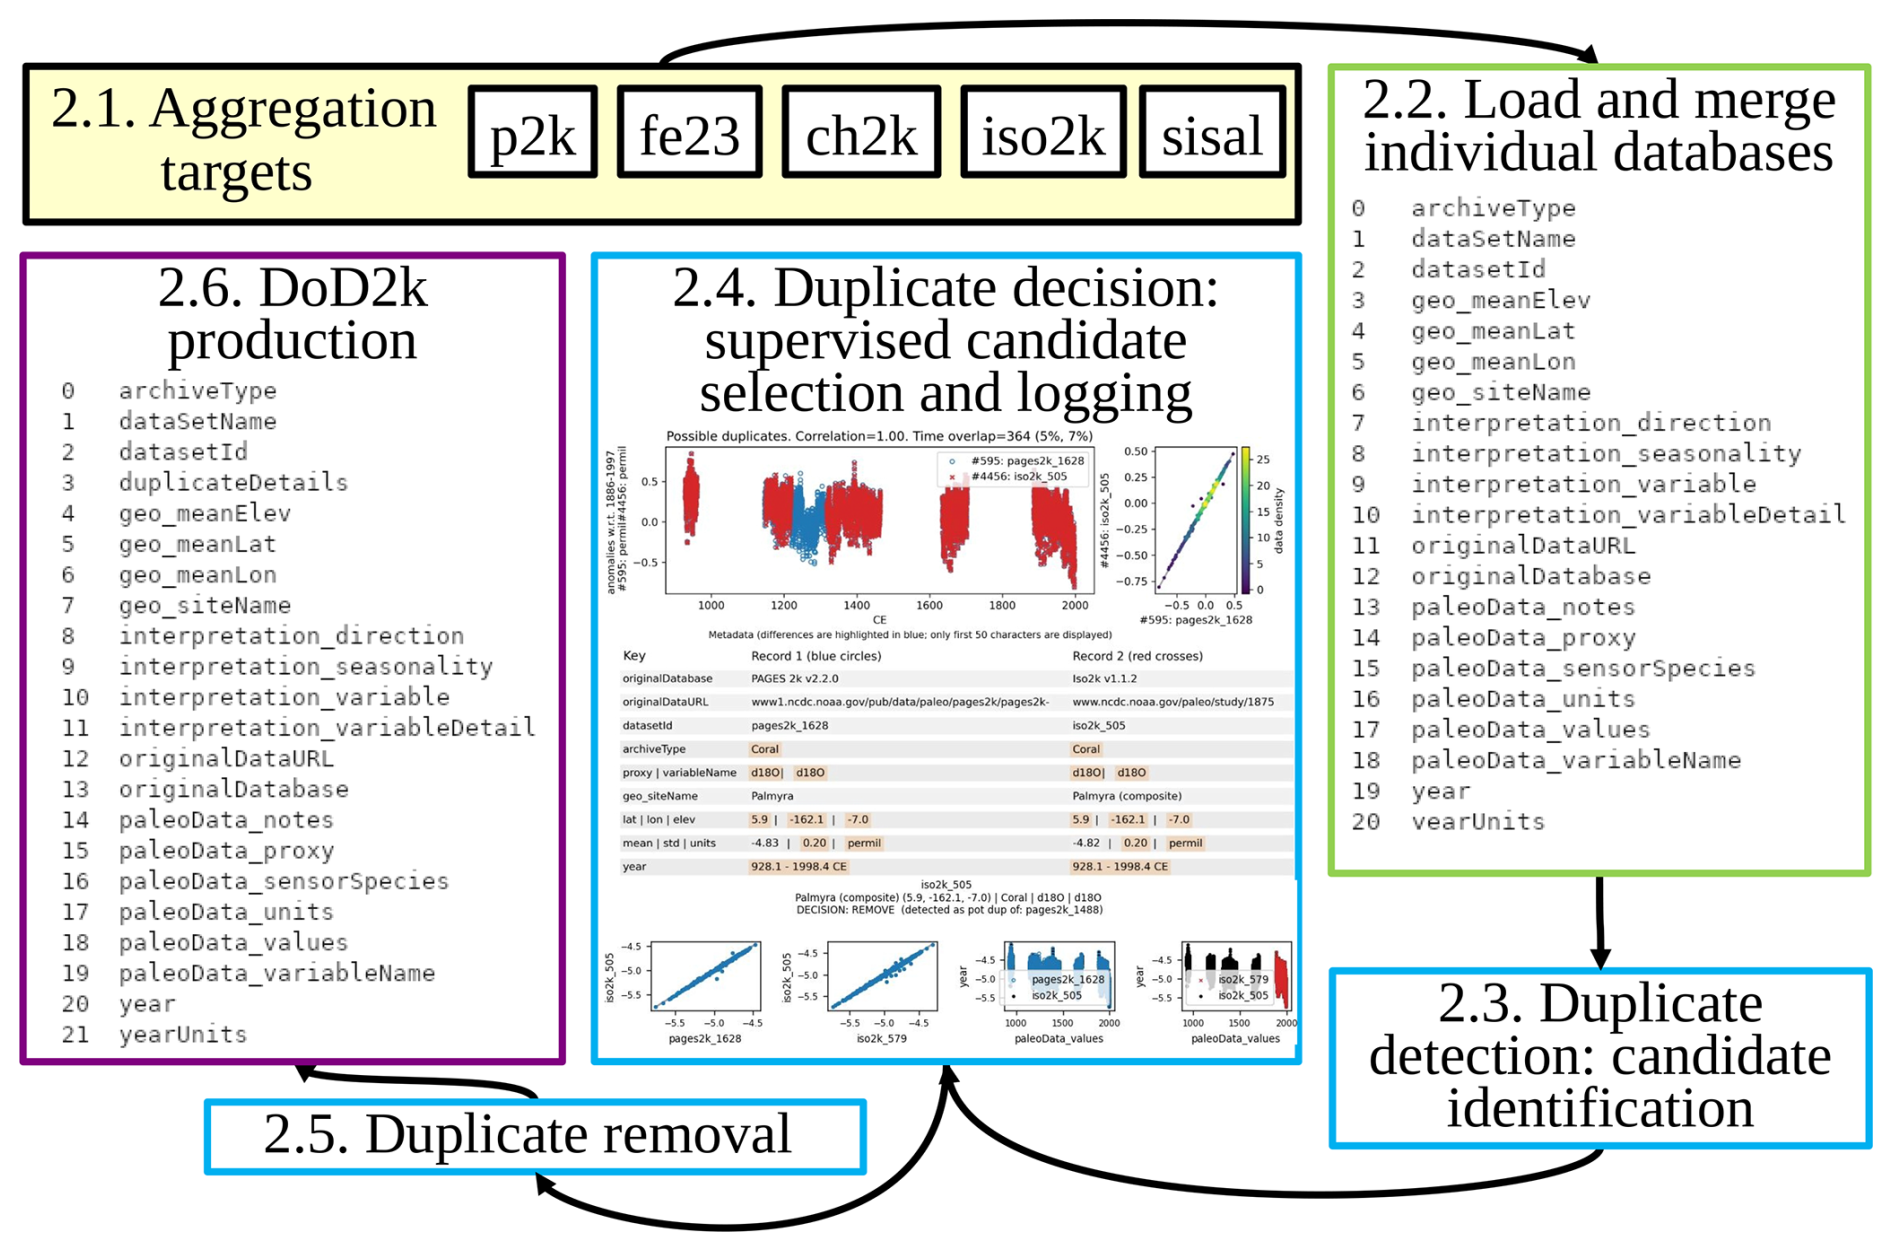
Figure 1Schematic overview of the DoD2k workflow, following Sect. 2. From upper left: starting with the (2.1) databases to be aggregated, we (2.2) load each dataset as a compact common subset of the metadata and data using a standard set of dictionary terms, if necessary translating from the original terms, concatenating the data. We then (2.3) detect duplicates using an automated scheme before (2.4) performing an operator-supervised, journaled duplicate management decision on each candidate set (see text). Step (2.5) is the removal of the duplicates, with a second check for copies than might appear accross more than one database (not shown in figure), before (2.6) the DoD2k is written and commented, for subsequent review, reproducibility of processing and decisionmaking, and traceability back to original databases and their entries (Bush et al., 2020).
A thorough documentation of the toolkit, including a series of tutorials (https://lluecke.github.io/dod2k/, last access: 15 January 2026) guides the user in the loading and visualizing of DoD2k and the application of dt2k to produce DoD2k (this section). Separately the user can examine the steps of loading and merging databases and duplicate detection and removal for other applications. Thus, we introduce here not only DoD2k, but also the opportunity for users to modify dt2k based on their specific requirements, including but not limited to, add data, add variables, and make their own expert decisions regarding the potential duplicate candidates.
2.1 Data
We assemble five curated databases of Common Era paleoclimate records from which we obtain DoD2k (Fig. 1). These are:
-
Breitenmoser et al. (2014) (hereinafter, fe23): restandardization of tree-ring width (TRW) chronologies for comparison with their 20th century simulation using the VS-Lite data model (Tolwinski-Ward et al., 2011), with data available within the interval 850–2000 CE and with climatic interpretations re-estimated as published in a subsequent study (Franke et al., 2022a), served from https://www.ncei.noaa.gov/metadata/geoportal/rest/metadata/item/noaa-model-36773/html (last access: 15 January 2026);
-
Emile-Geay et al. (2017): PAGES2k v2.0.0 (hereinafter, p2k): multiproxy, multiarchive compilation of temperature-sensitive proxies for the Common Era, updated and served from https://lipdverse.org/Pages2kTemperature/2_2_0/ (last access: 15 January 2026);
-
Konecky et al. (2020a): Iso2k v1.1.2 (hereinafter, iso2k): multiarchive compilation of oxygen and deuterium isotopic records extending through the Common Era and into previous periods, updated and served from https://lipdverse.org/iso2k/current_version/ (last access: 15 January 2026);
-
Walter et al. (2023): CoralHydro2k v1.0.1 (hereinafter, ch2k): single archive, multiproxy compilation of records from coral carbonates, within the Common Era, updated and served from https://lipdverse.org/iso2k/1_1_2/ (last access: 15 January 2026);
-
Kaushal et al. (2024a, b): SISAL2k v3 (hereinafter, sisal): single archive, multiproxy compilation of cave carbonate records, extending from the present through the Common Era and into previous periods, served from https://lipdverse.org/CoralHydro2k/1_0_1/ (last access: 15 January 2026).
2.2 Load and merge databases
To assemble a database of databases, we identified a set of 19 metadata fields (Table 1) which satisfy the following criteria across all the individual databases. Apart from a few fields specific to DoD2k, the nomenclature of the fields was largely adapted from Emile-Geay et al. (2017) and the PAGES2k v2.0.0 temperature-sensitive database, and then expanded through the adoption of the PAGES2k v2.2.0 update and additional reviewer-suggested fields (this study). Criteria were that the metadata is commonly used within the community, and the majority of the original databases have non-missing entries within the field. For a description of how the individual metadata parameters were collected, we refer back to the original databases and their development by teams of specialist researchers. Note, however, that this set of fields is subjective and by no means exhaustive; if desired by the community or by an individual user, may be expanded with modification of the load notebooks provided. For example, the p2k v2.0.0 database had 173 metadata fields. However, half of these fields were missing for 85% of entries, making it more difficult for users to identify and extract relevant metadata across all concatenated databases. We have selected fields that are a balance between essential data such as location, “least common metadata” available across most individual databases, and metadata such interpretation_variable. Three additional fields were added in response to reviewer comments to an earlier version of the load notebooks. The resulting 21 fields are illustrated in Fig. 1 and listed in Table 1; a 22nd field, duplicateDetails, is added following the duplicate detection, decision and removal process (Sect. 2.3).
Table 1Metadata and data parameters of DoD2k, by common compact dictionary key. Note that the Key duplicateDetails is added as a result of the duplicate screening process (Sect. 2.3).
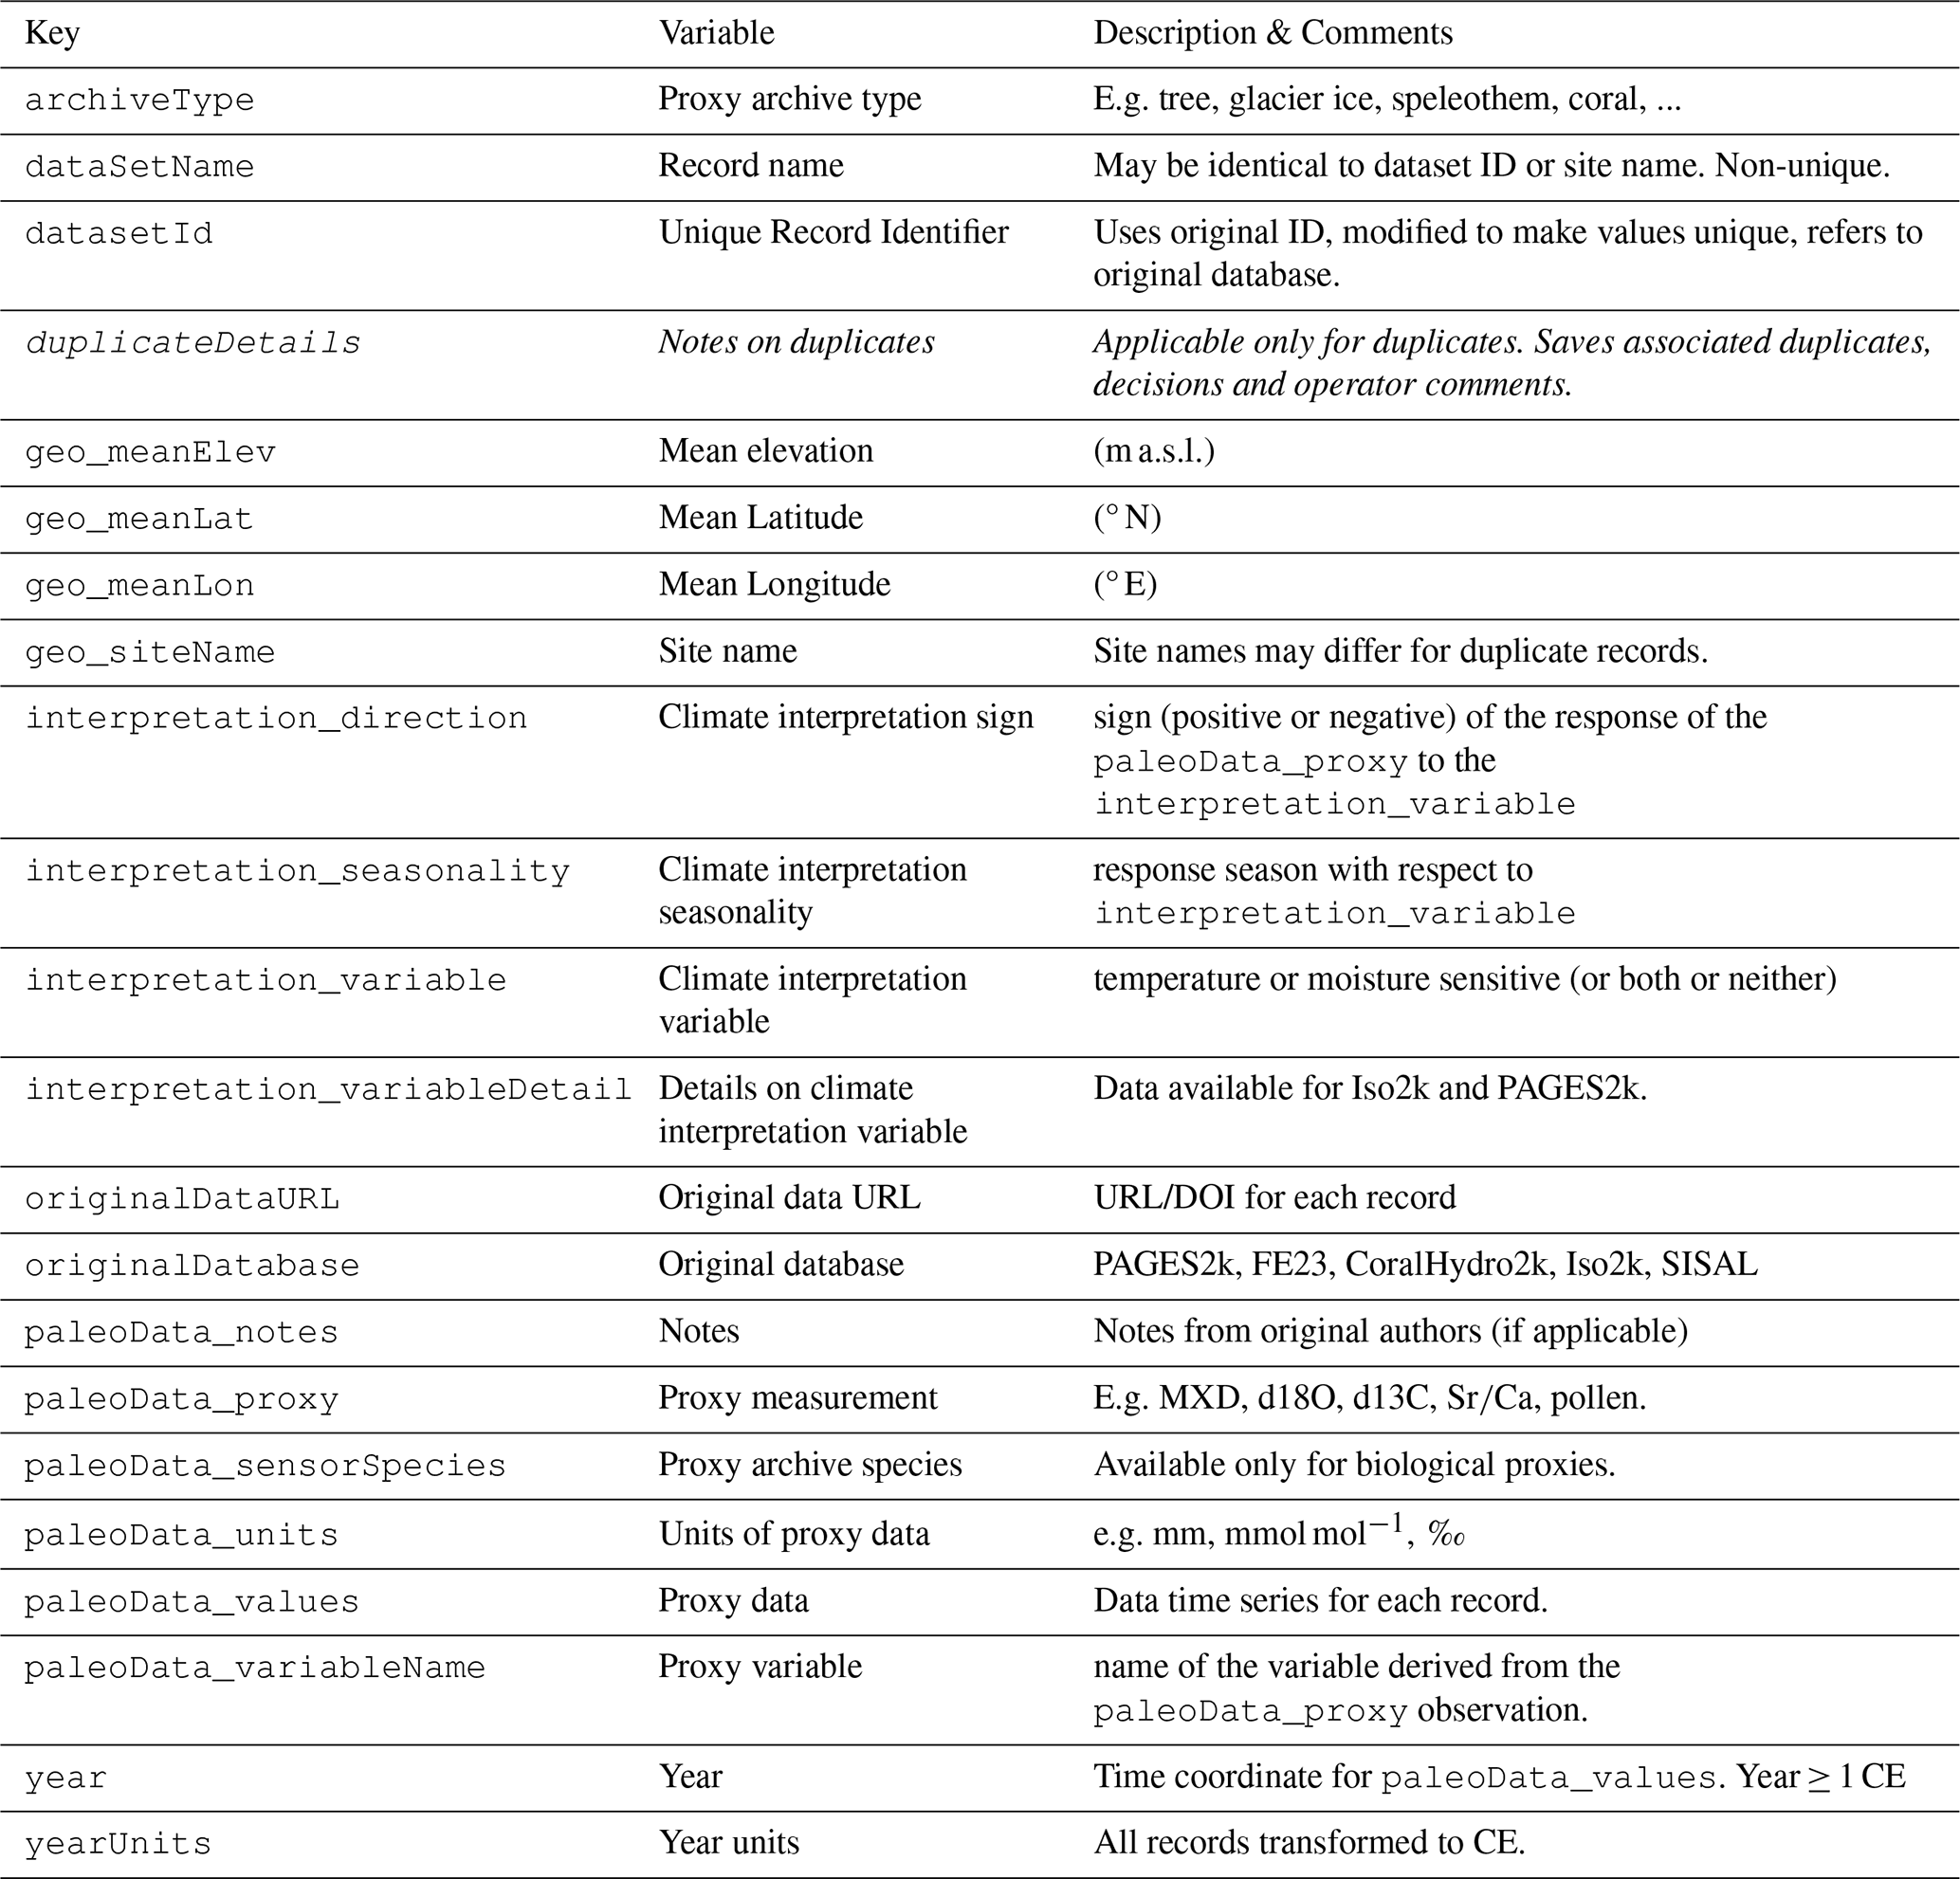
Table 2Notebooks for the creation of DoD2k, their input data sources and output files. INITIALS: Operator's initials as specified in the notebook; YY-MM-DD: datestamp of operator decisions.
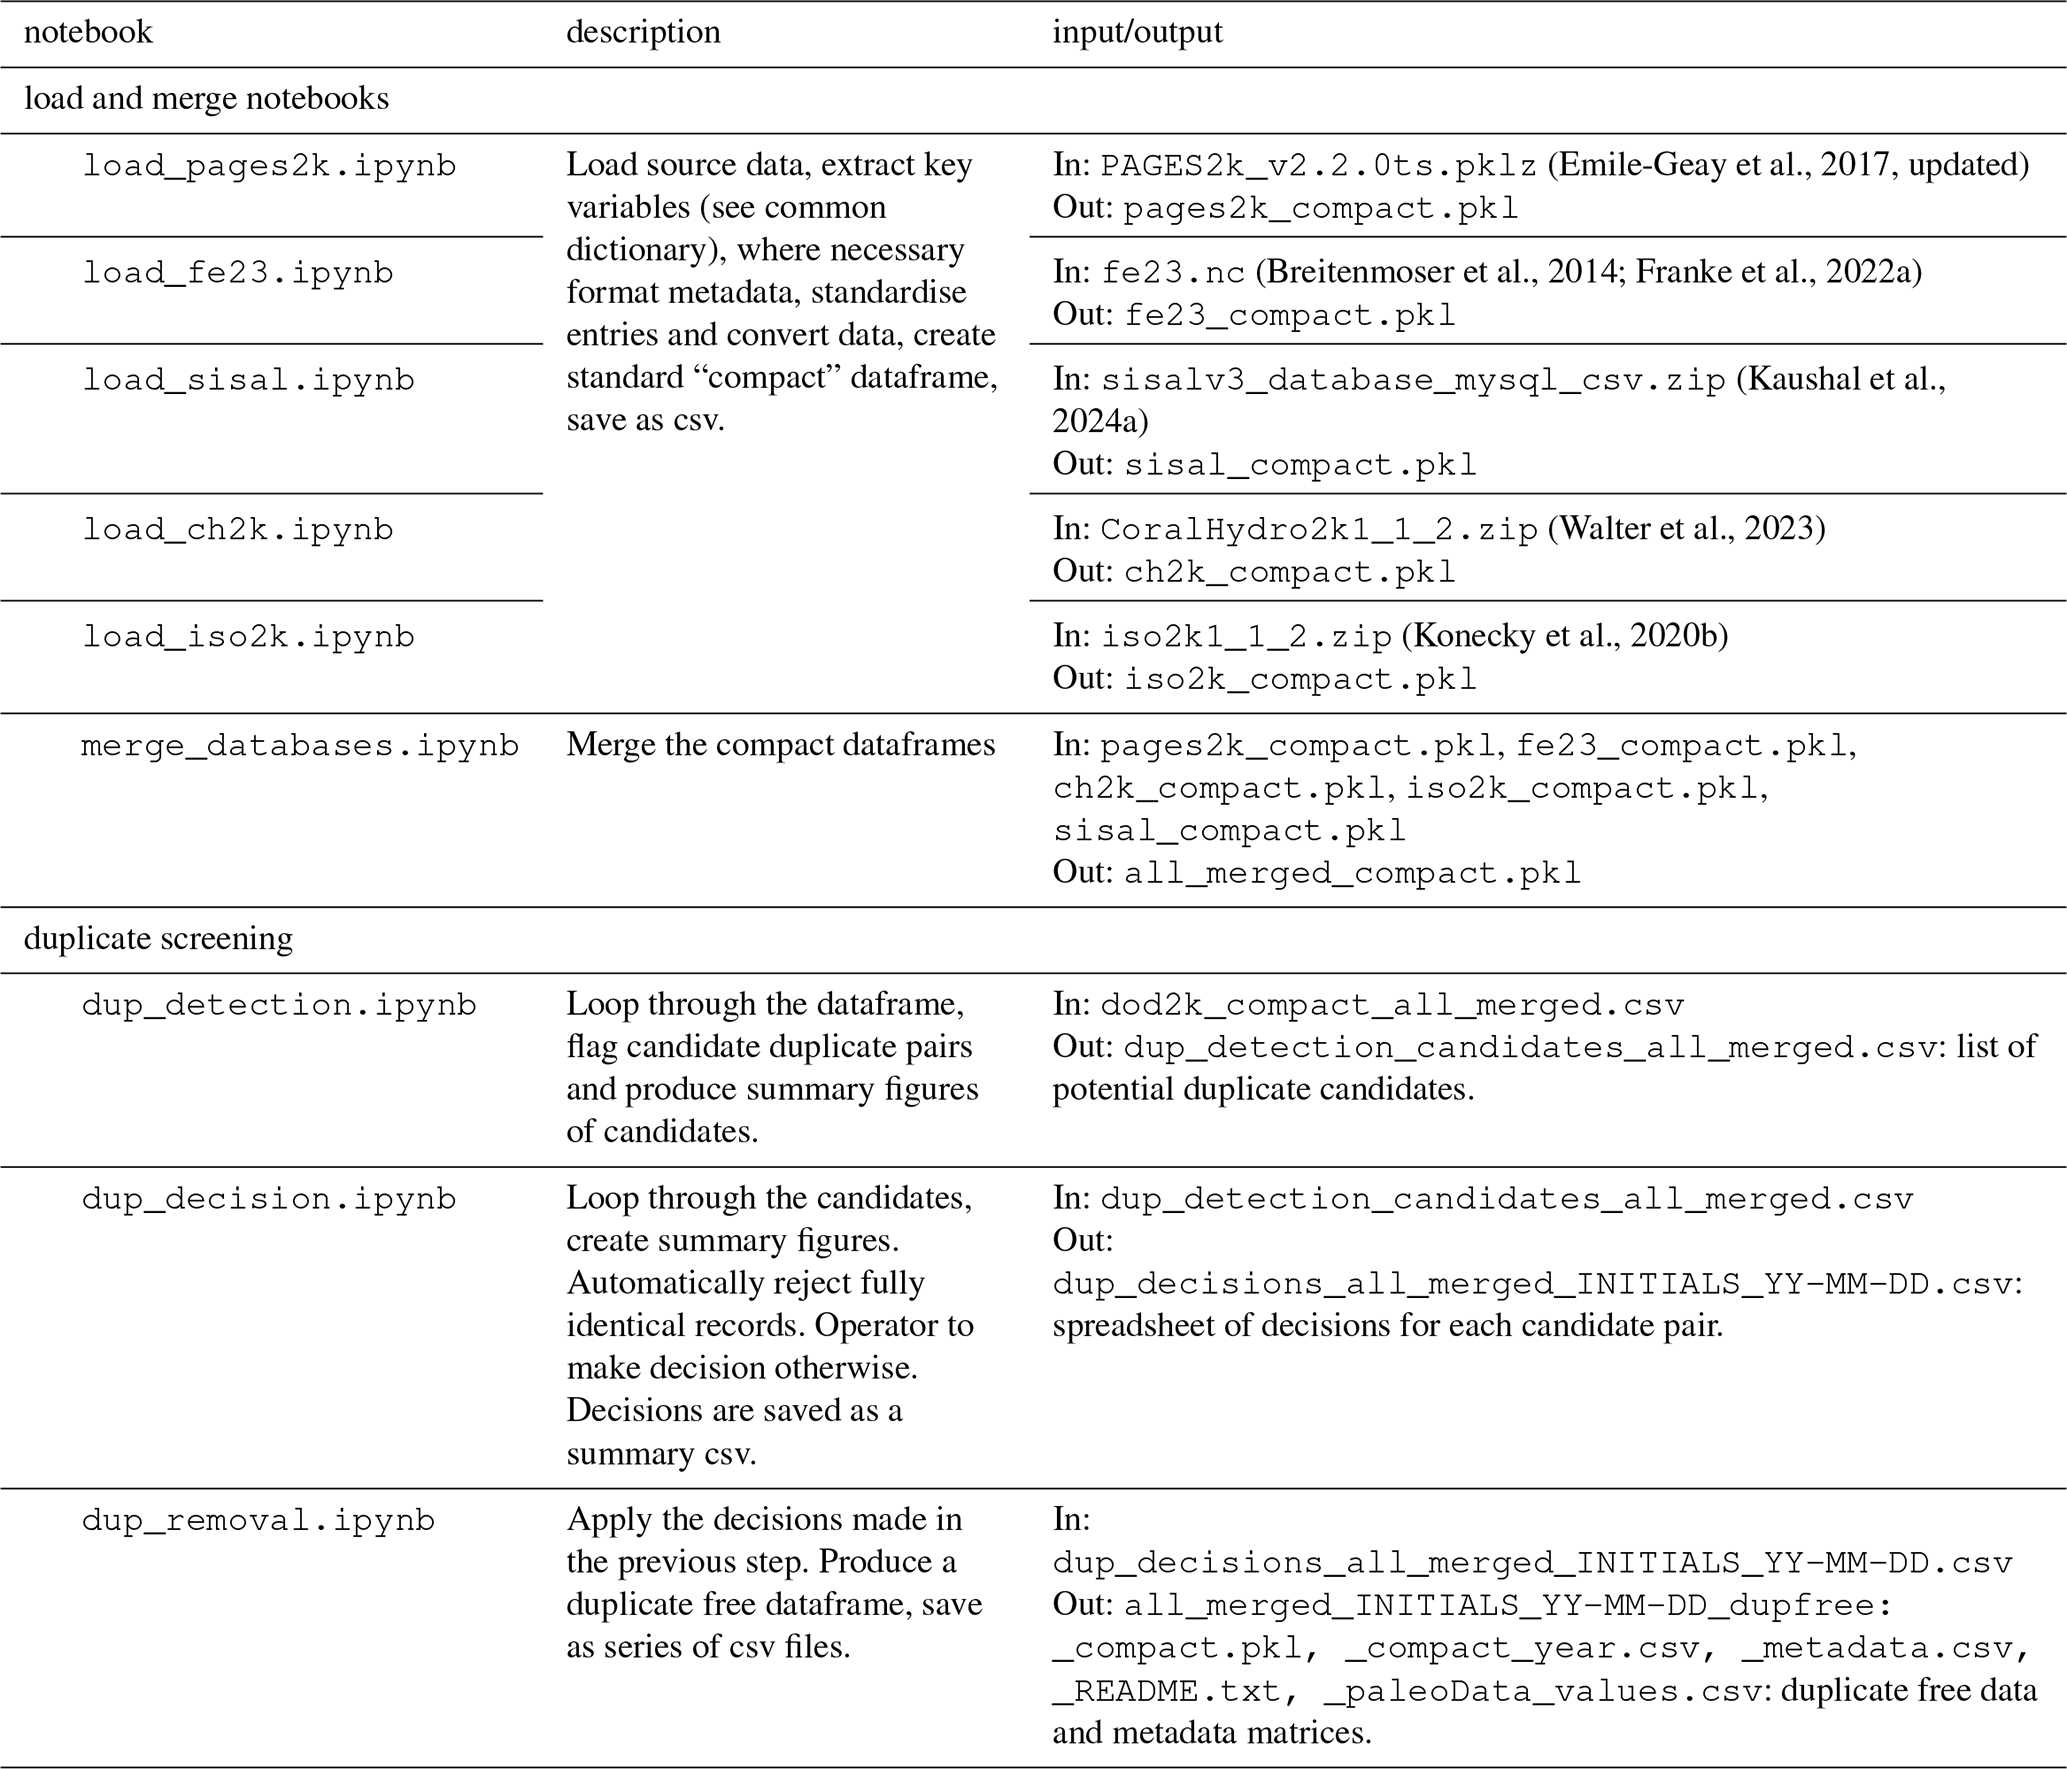
The load notebooks read the five original databases (ch2k, fe23, iso2k, p2k and sisal), extract a number of shared variables, and concatenate the databases. Each notebook (Table 2) follows the structure:
-
set up environment, load source data retrieved by user from the source public repository.
-
potentially process data according to database provider (may use code supplied by authors of the original database) to obtain a
pandasdataframe. -
identify and extract the relevant variables.
-
convert metadata and data to the correct format, using standard terminology where applicable (following the LiPDverse controlled vocabulary).
-
save output as a “compact”
pandasdataframe with standardized metadata.
The output of each load notebook is a standardized “compact” set of 21 metadata and data fields (Table 1). Output is saved in pickle (.pkl) format, as well as a series of comma separated value files. A unique datasetId is pulled from the identifier used in the curated dataset of components. Each additional metadata field contains either information from the original dataset as published, or has been added for the purpose of improving data identification. In the case of the former, some information has been homogenized to a standard set of values across the databases, e.g. in case of the archiveType: “Wood” to identify all tree-ring type proxies, or for interpretation_variable: “T” to identify all temperature sensitive proxies. Thus, some of the information may slightly differ from the original authors in terms of nomenclature. Our nomenclature closely adheres to the LiPDverse controlled vocabulary (https://lipdverse.org/vocabulary/, last access: 15 January 2026) where applicable, to promote a more standardized language within the paleoclimate community. This allows filtering of the database for individual values, and thus easy access to e.g. a database for an individual archive type. We have also transformed chronological assignments such that they are all provided in units of years CE, and we have restricted the data to the Common Era, 1–2000 CE.
The resulting homogenized original databases are subsequently assembled into DoD2k, using the notebook merge_databases.ipynb, after which the merged database is ready for duplicate screening.
2.3 Duplicate detection
The duplicate screening process consists of three separate steps (Fig. 1, steps 2.3–2.5), each implemented as a separate notebook. This process uses the output of any of the load notebooks; here we describe its application to the merged database of databases.
The first step, duplicate detection (dup_detection.ipynb), identifies the potential duplicate candidates. Duplicate detection begins with a simple threshold correlation coefficient test between any two records with paleoData_values x and y. We choose , which we consider sufficient to find exact duplicates, but also allows detection of records which, for example, might differ by only a few points at the beginning or end of the observed time interval, have a limited number of missing values, or contain a different number of retained significant digits. However, this criterion is not sufficient on its own (as discovered in analysis of the Steiger et al. (2022) database) to identify duplicates that might arise from standardization choices, compositing, truncation, and metadata differences that might differ across databases. We therefore add multiple additional diagnostics, metadata comparison, and operator screening of candidates. Here, any two records with paleoData_values x and y, and their associated z-scores zx and zy, are scanned according to the following necessary criteria:
-
data type: archive type (
archiveType) and proxy type (paleoData_proxy) must be identical, -
site: there must be an overlap in the site name (
geo_siteName), e.g. at least one shared expression, -
location: distance between the point coordinates (
geo_meanLatandgeo_meanLon) ≤ 8 km, -
correlation:
-
overlap: time intersect (
year) at least ≥ 10 points, unless one of the records is overall shorter than that, in which case the other criteria are sufficient, -
URL: the data identifier (
originalDataURL) are identical if both candidates originate from the same database (originalDatabase), otherwise the other criteria are sufficient.
The so-detected candidate pairs are flagged, and their summary figures as well as a list of the candidate pairs are saved. In addition to the 21 fields previously described, the assembled and duplicate-screened database DoD2k contains the field duplicateDetails (Table 1). This field is populated during the duplicate screening process and includes information on the detected duplicates and any choices made by the user, such as the selection of one record or the other of the candidates, and whether a composite record has been created (see below).
2.4 Duplicate decision
The second step, the decision process implemented in the notebook dup_decision.ipynb, uses the output generated in the previous step to perform a decision process on each candidate pair. In order to make this process more operator-friendly, we have implemented a mixture of automated and user-operated decisions. For candidate pairs which are evidently true duplicates, no user input is necessary. Instead, a record is removed, based on a user-specified database hierarchy (see next paragraph). The evidently true duplicate records satisfy the following criteria:
- 7.
geo_meanLatandgeo_meanLonagree up to a decimal place, - 8.
geo_meanElevagrees up to 1 unit, - 9.
archiveType,paleoData_proxy,originalDataURLandgeo_siteNameare identical.
These user-specific criteria were empirically determined during the decision process and are thus tailored to our purposes. They were based on a number of true duplicates, where the geographical location differed slightly due to different authors' precision in the specification of coordinates.
We also specify a hierarchy for adoption of duplicate records from databases, with the assumption that newer databases were improvements over older ones, i.e. p2k > sisal > ch2k > iso2k > fe23. In addition, no user input is needed either for cases in which one of the candidates is evidently a recollection/update of the other record. Here, the geo_siteName is scanned for the keywords “update” and “recollection”, and to determine if the location criterion (see #3 in the list above) is satisfied. We also include the capacity to automatically choose one candidate over another in a consistent way for series whose metadata is identical, but the records are nonidentical. In DoD2k, this is used to automatically select fe23 AR-standardized tree-ring width records over the same p2k records. This was done because in fe23, n≥8 replicate observations are required and the 1901–1970 interval is complete to produce a chronology estimate (Breitenmoser et al., 2014). This results in different and generally shorter record lengths.
For any remaining candidate pair, the notebook operator is required to make a manual decision based on a summary figure of the duplicates (Fig. 1, step 4). The manual decision encompasses the following choices: keep record #1 and remove record #2 (and vice versa); keep both records; remove both records; or normalize and composite both records. The last choice is useful for individual records which were either composited by the original data producer, or represent a site-local concentrated data collection which represents paleoclimatic information from a particular site over time (Mann et al., 1999; Cobb et al., 2013). The detection algorithm also flags cases in which there may be more than two duplicate records, such that the operator can consistently select the best of the candidate duplicates. In the case of manual decisions, the operator is encouraged to leave a comment regarding the decision made for each candidate pair, in order to ensure that the decision process remains in retrospect comprehensible, consistent and reproducible. This note is later saved in the field duplicateDetail (Table 1).
2.5 Duplicate removal
The final step of the duplicate screening process consists in the removal of the duplicates using notebook dup_removal.ipynb. Here, duplicate records are removed or composited from the database according to the operator's decisions. For the compositing process, the duplicate pair is standardized to z-scores and averaged over their intersecting time period, and their metadata is joined. Note that the duplicate workflow works on identifying potential duplicate candidate pairs, and is thus not optimized for records which appear as duplicates multiple times. However, there are a number of records which appear in more than one database. In particular, there is a significant overlap between p2k, ch2k and iso2k. To make sure no duplicates remain in the final output database, we have therefore implemented a loop of the entire duplicate workflow among the records which appear more than once in the duplicate detection algorithm. The resulting database is finally subject to another duplicate detection workflow to confirm no duplicate records remain.
2.6 DoD2k production
After the removal and/or compositing of duplicates is complete, the duplicate screened database is saved as a pkl file. It is also saved as three comma separated value (csv) files, respectively: year, paleoData_values and metadata (20 fields). A README file contains further information about the duplicate screening process, such as operator name and correspondence details, date and operator's comments. Because the decision process is dependent on the operator's choices, the operator details should always be provided alongside the database to ensure transparency and traceability.
3.1 Spatial and temporal coverage
DoD2k v2.0.0 consists of 4781 records (5147 before duplicate screening). It is composed of records from p2k: 969 (1191 records before screening), sisal: 528 (546 records before screening), ch2k: 145 (221 records before screening), iso2k: 410 (435 records before screening), and fe23: 2728 (2754 records before screening). As is true for the parent databases, the spatial distribution (Fig. 2) is heterogeneous and represents mid and high northern latitude terrestrial regions more densely than the oceans, Saharan Africa, subtropical Eurasia, the tropical oceans, the Pacific Ocean and the Southern Ocean.
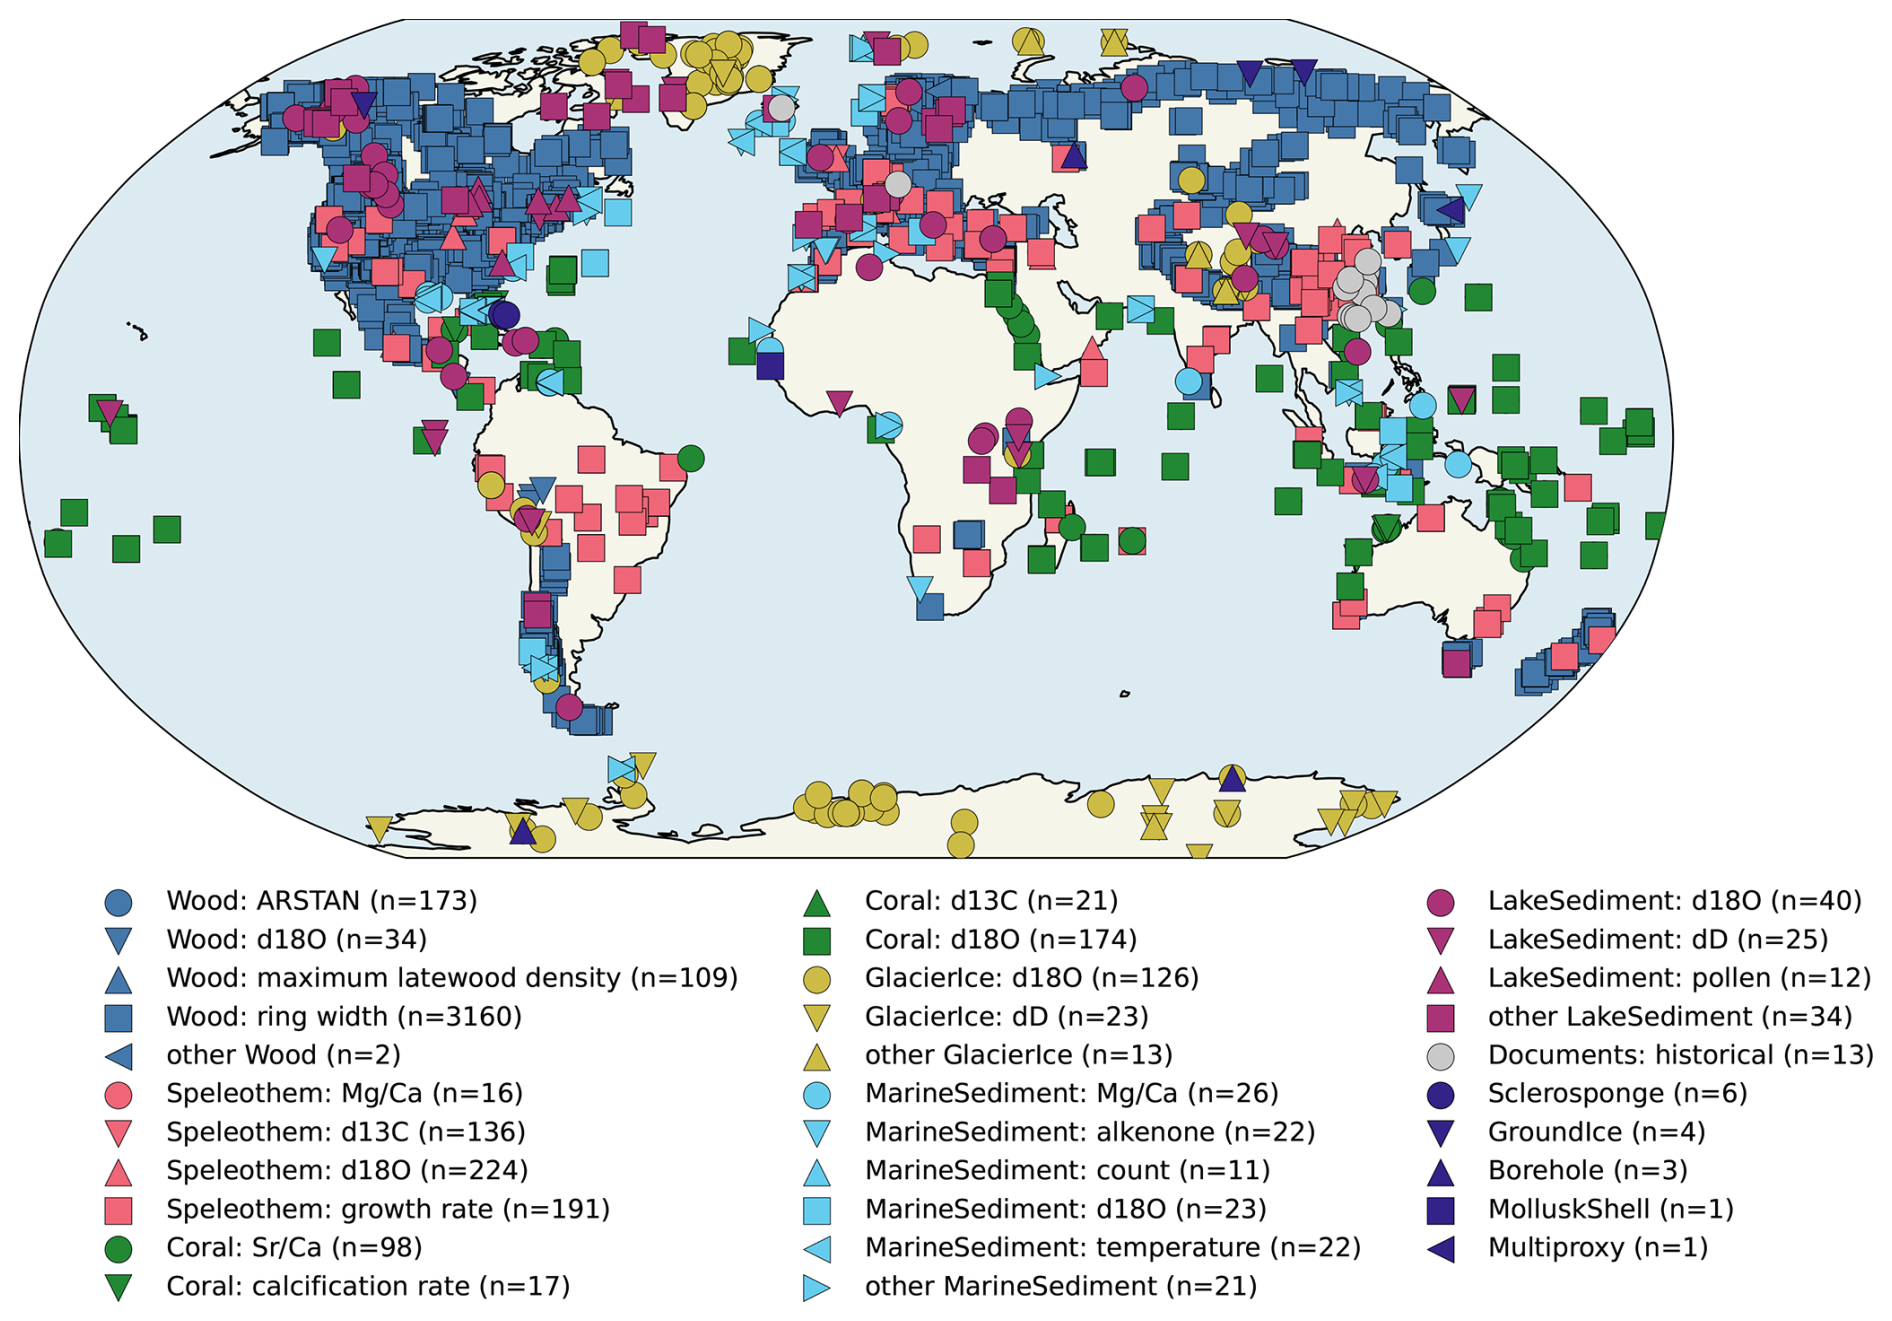
Figure 2Spatial distribution of all available proxy records after execution of load, concatenation, duplicate detection and operator supervised decision and removal notebooks. Symbols indicate archive types and legend captions indicate proxy types. “Other” includes n(paleoData_proxy) ≤ 10 for each archiveType. The archiveType “Other” is listed as such in the source originalDatabase.
Although the total number of records available are about 4 times those available in p2k, p2k patterns in temporal availability persist (Emile-Geay et al., 2017, Fig. 3). The total DoD2k record number is highly dominated by the wood (tree) archive, in which the vast majority of observations are tree-ring width (TRW), a subset of which are described in p2k as paleoData_proxy chronologies formed using ARSTAN processing (Cook, 1985), compared to 109 maximum latewood density records (MXD) and 34 δ18O isotope records. Tree/wood archives in particular represent the most dominant record type after around 1500 CE, when the number of available tree samples rapidly increases. Before this, other archive types are more abundant, especially speleothems, followed by marine and lake sediments and glacier ice. Speleothem records include 16 , 136 δ13C, 224 δ18O isotope and 191 growth rate type proxies. Speleothems and marine and lake sediments, in addition to a wider range of observation types included in DoD2k relative to p2k, supply data records on longer timescales, often reaching even further back than the Common Era, and therefore offer a relatively constant coverage over the Common Era, relative to that afforded by p2k (Fig. 3). Although the total number of coral records is also relatively high, these, like records from trees, drop out relatively quickly when moving back in time, and primarily are available in the second half of the most recent millennium. Other rarer archive types include documents and sclerosponges as well as boreholes, hybrid, bivalve, ground ice, mollusk shells, and terrestrial sediments.
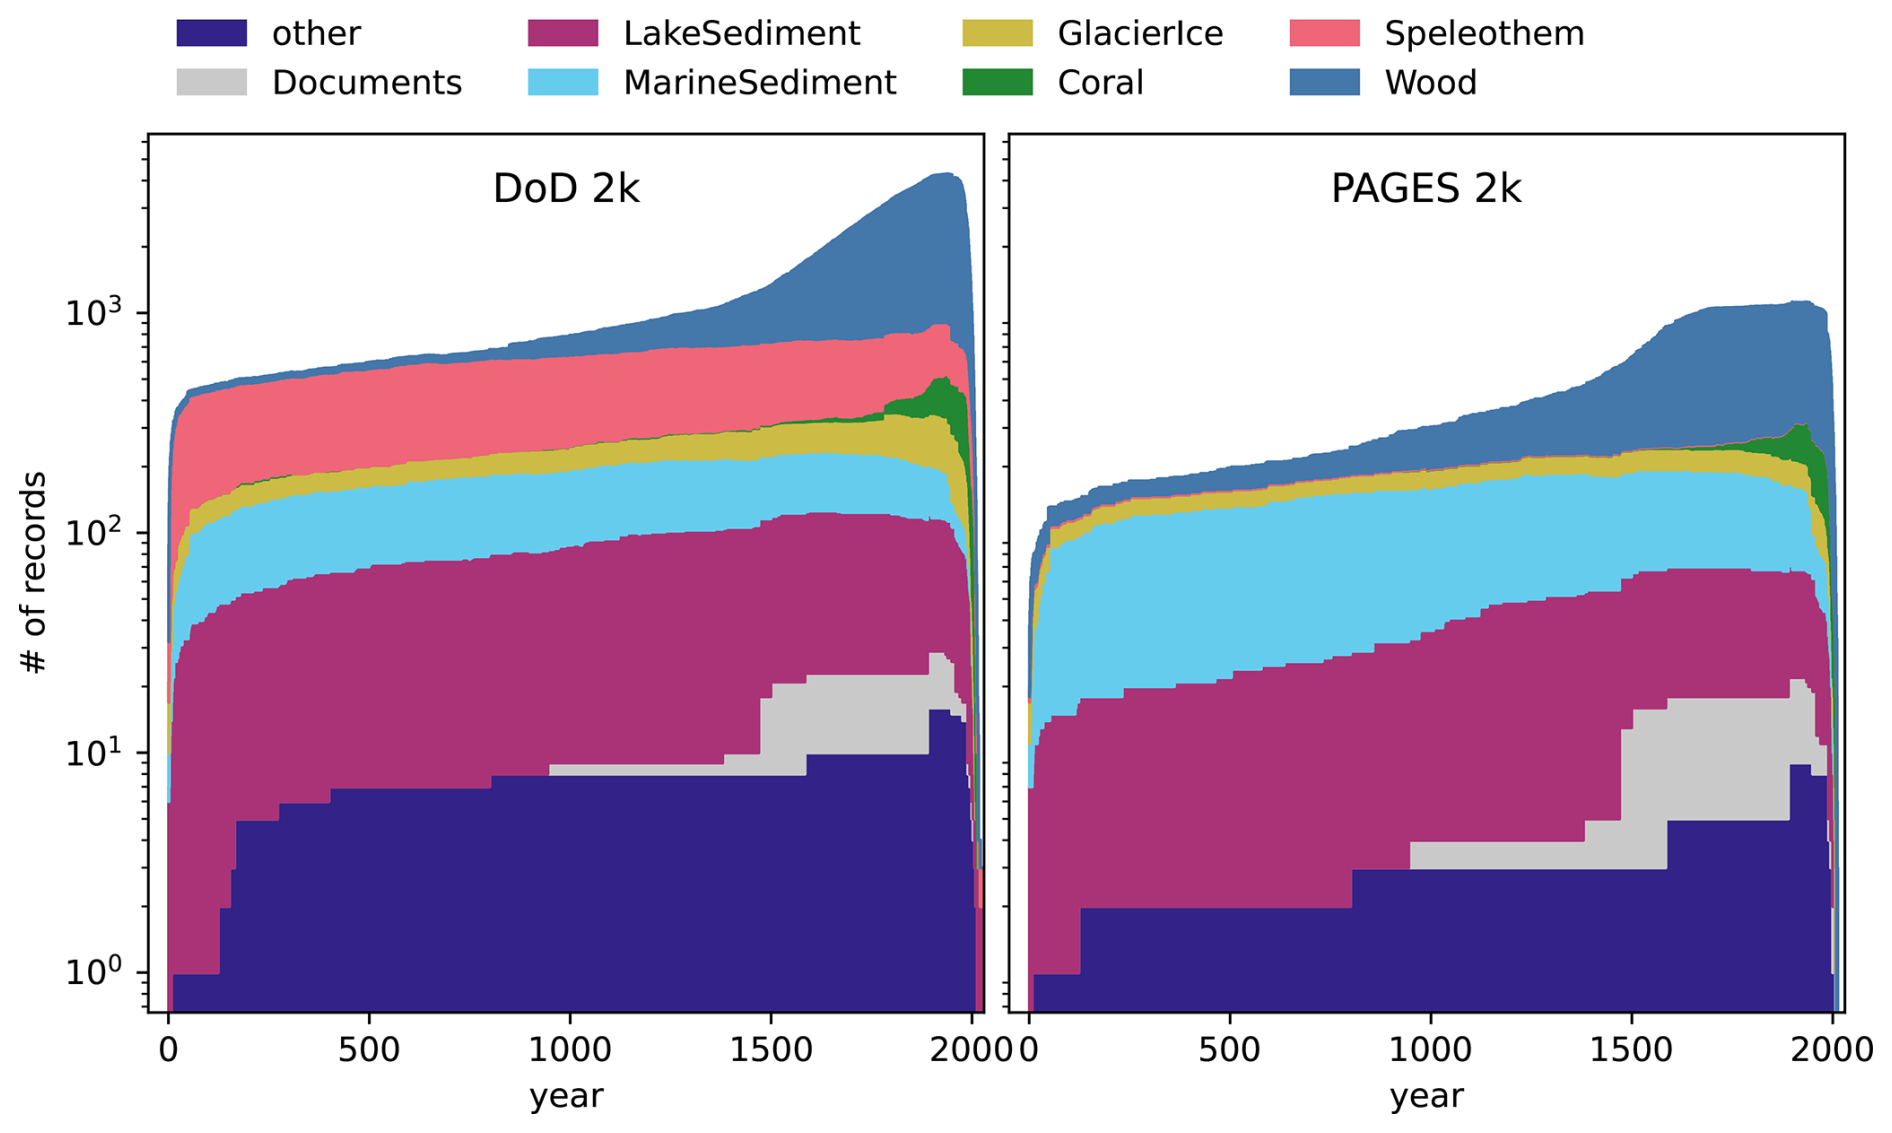
Figure 3Temporal distribution of the DoD2k records by archive type. Records from boreholes, hybrid, bivalve, ground ice, mollusk shells, and terrestrial sediment archives, including all such observations made in those archives, as shown in Fig. 2, are grouped for plotting as “other” for simplicity of presentation. For comparison, right panel shows record availability by archive type from the p2k T-sensitive database (Emile-Geay et al., 2017). Note the log scale for total numbers over time.
3.2 Applications
The development of DoD2k via open-source Python notebooks and functions not only allows for future growth of the aggregate database, but also extraction of subsets of data for specific paleoclimatic analysis. Here we illustrate this with two applications, one utilizing interpretation_variable to filter the data, and the second, utilizing archiveType and paleoData_proxy to provide a target for data modeling (Evans et al., 2013).
3.2.1 Hydroclimate record selection
For the analysis of specific climate conditions, the database can be filtered for interpretation_variable. Approximately two thirds of DoD2k records have non-missing entries. In the Python notebook entitled df_filter.ipynb, we have coded these from the original entries to be listed in DoD2k as “temperature” (T), “moisture” (M), “temperature+moisture” (T+M) and “NOT temperature NOT moisture” (). For hydroclimatic reconstruction purposes (Kaushal et al., 2022), we can filter the database for M-only or T-only records, but find that only a small subset of records are available and suitable for PCA analysis from a small subset of archives and observation types (see notebooks M_analysis.ipynb, M_analysis.ipynb, results not shown here).
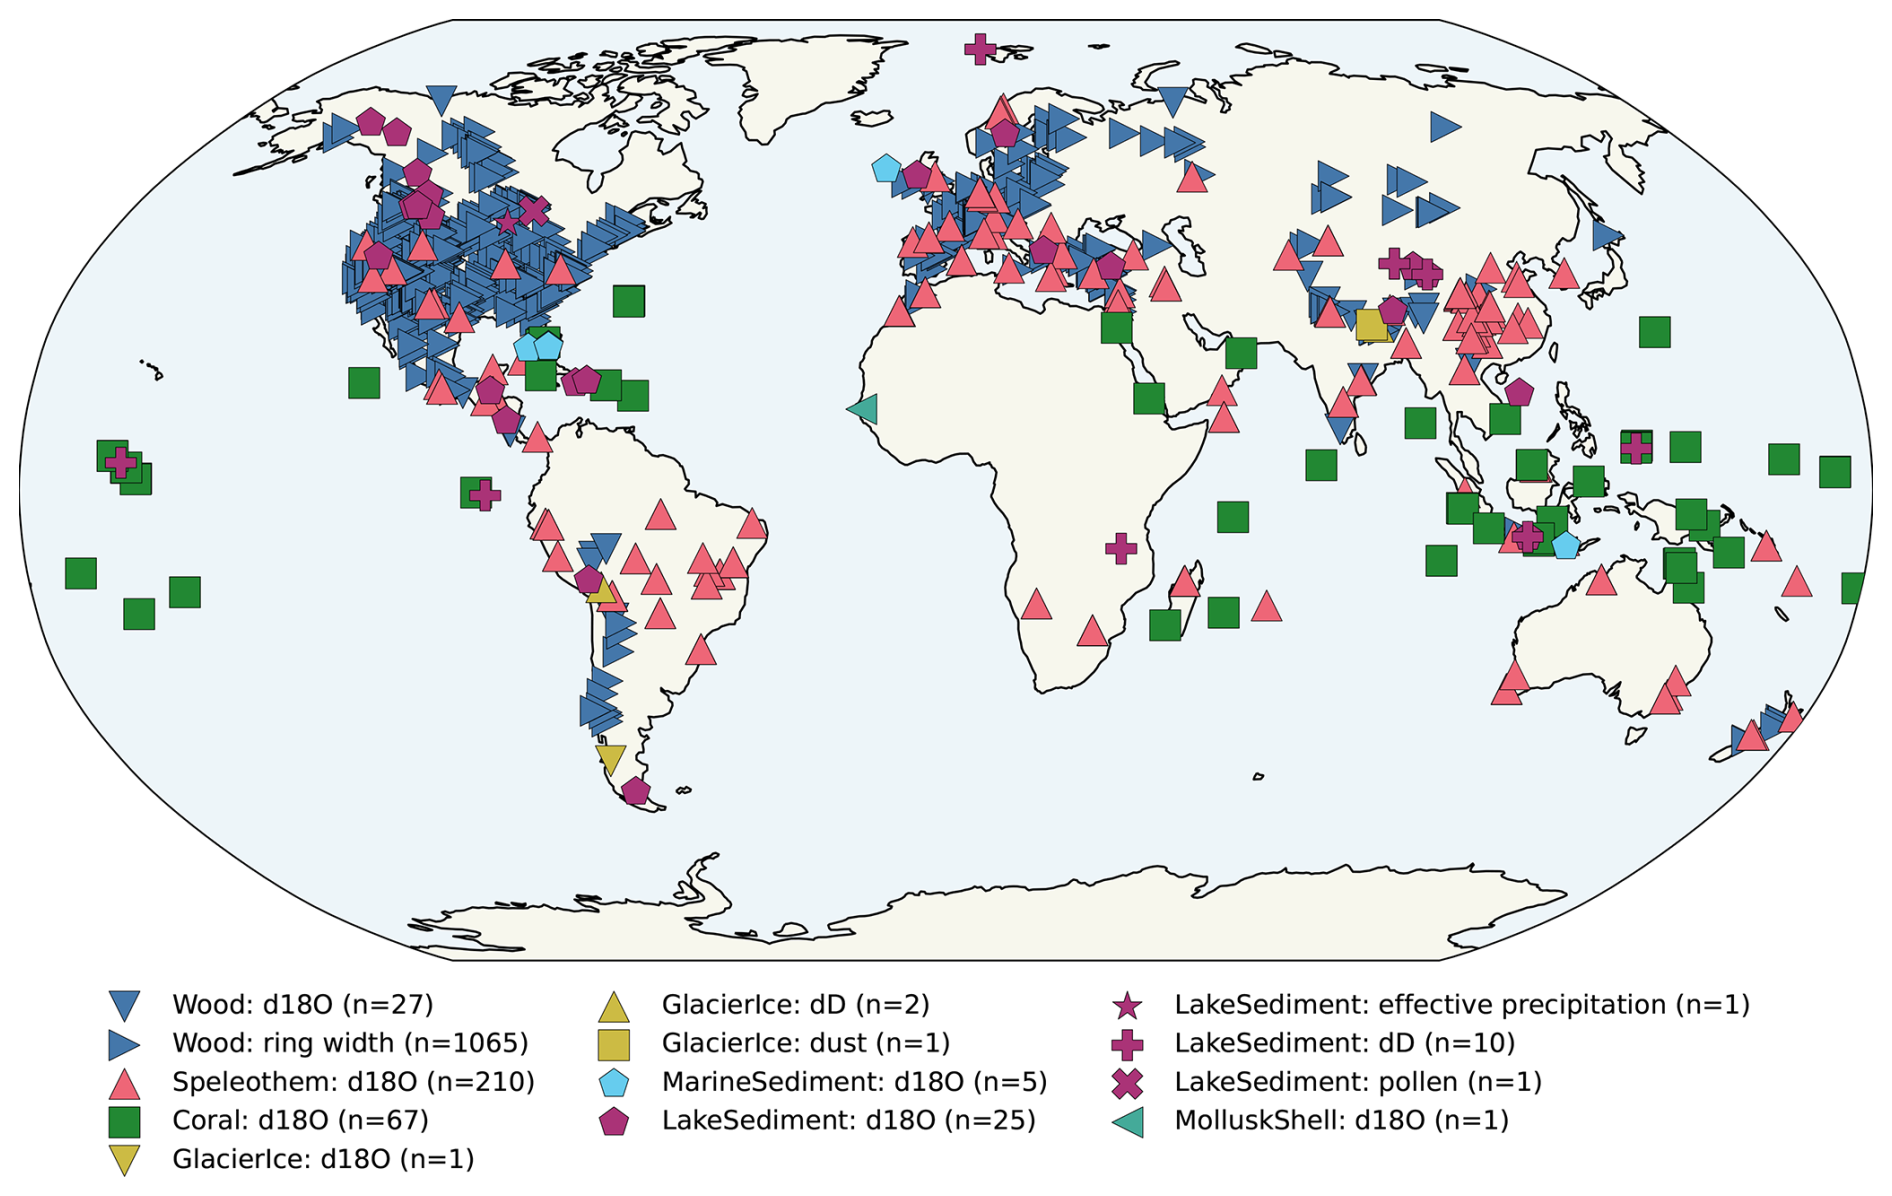
Figure 4Spatial distribution of the available proxy records with interpretation_variable of moisture (M) or moisture and temperature sensitive (MT). These data are drawn from all 5 component databases forming DoD2k.
For M and T+M records, resulting in 1416 hydroclimate sensitive records, a subset we designate as “MT”, data are available primarily in the Northern Hemisphere, but also in the tropics and at lower latitudes in the Southern hemisphere (Fig. 4). Of these records, 179 are from sisal, 60 are from ch2k, 103 are from iso2k, and 1065 are from fe23. Although the possibility that some p2k records are temperature but also moisture sensitive cannot be excluded, as noted by Emile-Geay et al. (2017), none of these records are taken from the PAGES2k temperature-sensitive database, by its own definition, unless those records were replaced by duplicate records tagged as T+M in the other component databases.
3.2.2 Speleothem δ18O record modeling
We provide a second application for data modeling within a specific archive and observation type, the oxygen isotopic composition (δ18O) of cave carbonates (speleothems). We first filter DoD2k for only speleothem δ18O records. We then simulate δ18O of speleothem calcite using the sensor model of Partin et al. (2013) as implemented in PRYSM (Dee et al., 2015), which takes as inputs observed δ18O of precipitation, surface temperature, and mean transit time τ between the surface and the speleothem drip, assuming a well-mixed aquifer source. The archive model is a simple rescaling of the temperature-mediated dripwater δ18O to account for the difference in scales for the precipitation source (SMOW reference) to the calcite observation (PDB reference). We compare results across the spatial gradients in climatological environmental inputs to assess the null of no difference between simulated and observed speleothem calcite δ18O (δ18Ocs and δ18Oc, respectively). Thus in some ways, this is an extension of the approach taken by Okazaki and Yoshimura (2019) to speleothem calcite δ18O observations, but without the intermediate step of using an isotope-enabled atmospheric model nudged to observed sea surface temperatures; it is similarly an approach simplified relative to that of Bühler et al. (2021), who compared past millennium (850–1850 CE) climate model simulations of δ18Op to air temperature-corrected δ18Oc observations from 85 calcite speleothem records from 71 sites, using the PRYSM speleothem sensor model to estimate transit times from surface conditions to cave calcification.
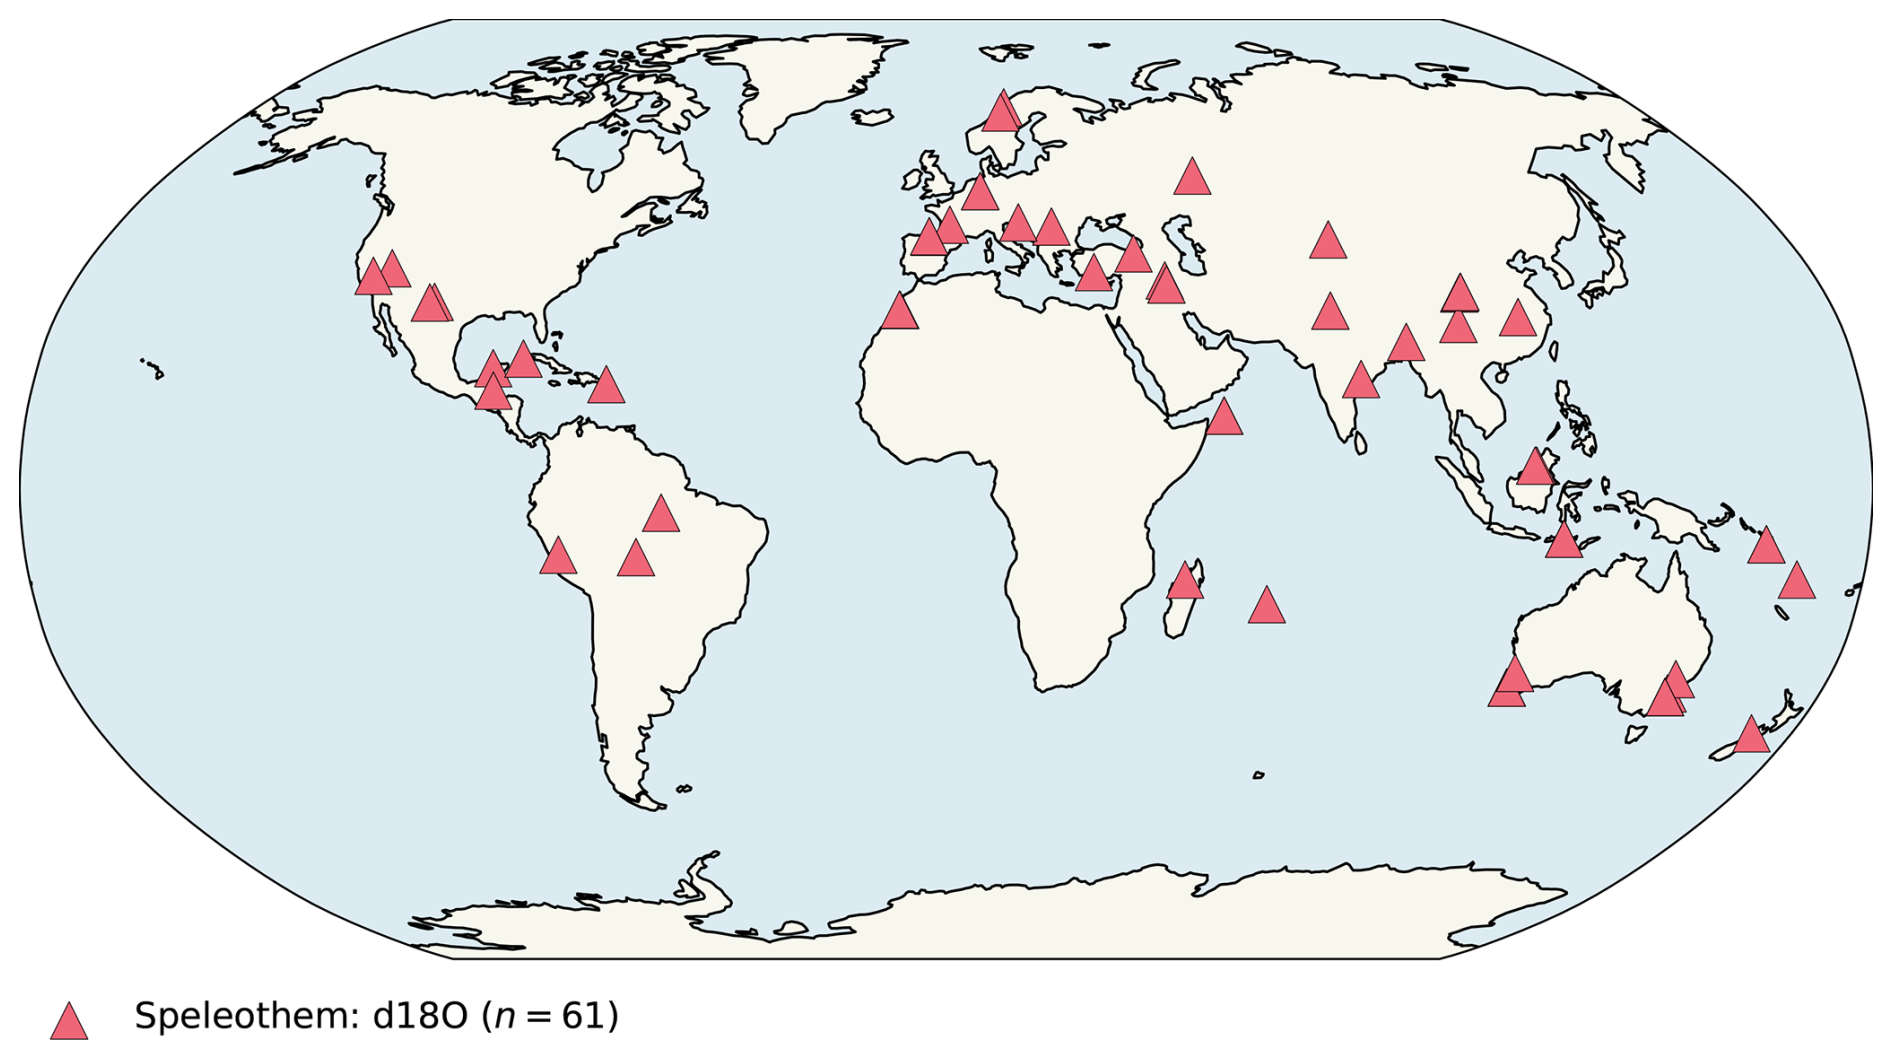
Figure 5Map of locations for which speleothem calcite δ18O observations are available from the DoD2k within the period 1960–2005 CE.
We perform this exercise in the Jupyter notebook analysis_speleothem.ipynb. When we filter DoD2k for paleoData_proxy and archiveType, we find that the paleoData_values come primarily from the SISALv3 database but also the PAGES2k and Iso2k compilations. Within the comparison period with simulations, 1960–2005 (see below), there are 61 such records available (Fig. 5) from all continents except Antarctica.
For speleothem calcite δ18O modeling, we import the psm and cfr python packages (Dee et al., 2015; Zhu et al., 2024). We use as inputs the gridded mean annual precipitation amount-weighted climatologically averaged and interpolated terrestrial δ18O product of Bowen et al. (2005), with estimates taken from the product grid point nearest to the observations (Fig. 5). As this product is based on precipitation amount and δ18O for 1960–2005, we use this time interval for averaging of other environmental inputs and for the estimation of climatological mean δ18O of observed speleothem calcite. For surface temperature we use similar nearest gridpoint estimates from the 0.5°×0.5° CRUTS v4.07 surface temperature product (Harris et al., 2020), and average to the same time interval. Because the time interval is short and we average over time, we specify a mean transit time τ of 1 year and we specify constant δ18Op for the period of simulation, then average the resulting δ18Ocs over time. As might be expected the temporal averages of δ18Ocs are not sensitive to specification of τ.
4.1 Analysis of the multiarchive, multi-observation MT subset
We perform principal component analysis (PCA) in the Jupyter notebook analysis_moisttemp.ipynb to assess the extent to which there are large scale patterns with and across observational archives and observational types, for the major classes of archives and observations in this subset of data. As opposed to composite averaging, a PCA on standardized proxy observations in their native variable simply identifies patterns of correlation, which could be either positive or negative in sign, between records. Our analysis did so by both archive and observation type in the largest subsets (Table 3). We perform separate PCA on the following five archive and observation subsets of the complete dataset: wood ring width; wood δ18O; coral δ18O; speleothem δ18O and lake sediment δ18O and δD. Because of the potential for PCA to be influenced by large changes in record availability over time, for each subset we subjectively identify a smaller set of records with a common temporal resolution and a relatively constant data availability over some time period determined by the balance between record length and data availability. For the archive/data subsets described above, the record numbers and temporal availability are given in Table 3. For instance, we gathered TRW records from tree archives at annual time resolution, and found PCA could be performed with 71 records all available over the time interval 1400–1963 for the covariance estimation, and for a time interval spanning 1000–2000, from a 71 record subset. All identified subsets are standardized prior to calculation of their covariance (correlation) matrices and covariance eigendecompositions. Note that information in originalDatabase records for marine sediment archives and δ18O observations indicate interpretation_variable is either temperature or moisture, not moisture and/or moisture and temperature. Application of the M or MT filter in analysis_moisttemp.ipynb produces only five marine δ18O records, without a sufficiently long common period of overlap to calculate means and covariances, so we do not perform their PCA.
Table 3Parameters on the PCA for MT sensitivity subset archive and observation types. Remaining columns are the time resolution at which data were averaged to provide a common resolution across available records, the period of overlap for all records included for covariance estimation, the complete time interval covered by the data subset, and the number of available records entered into each PCA.
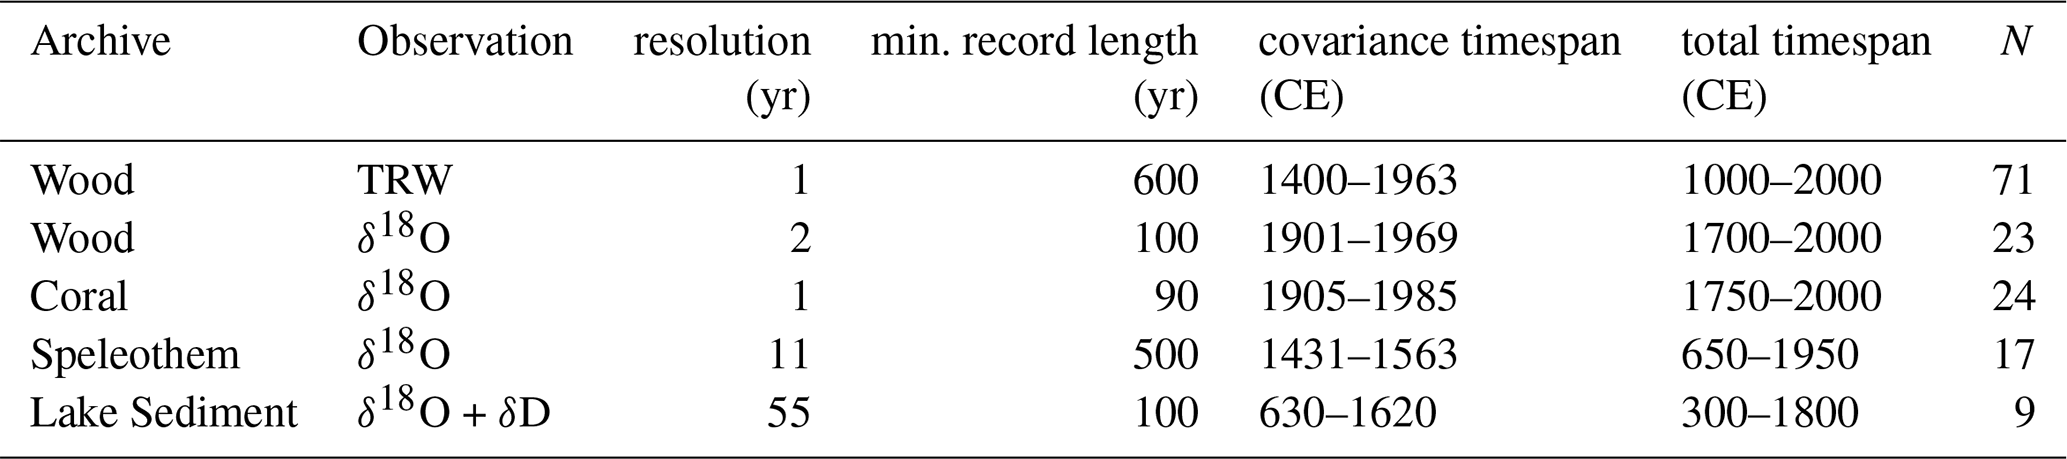
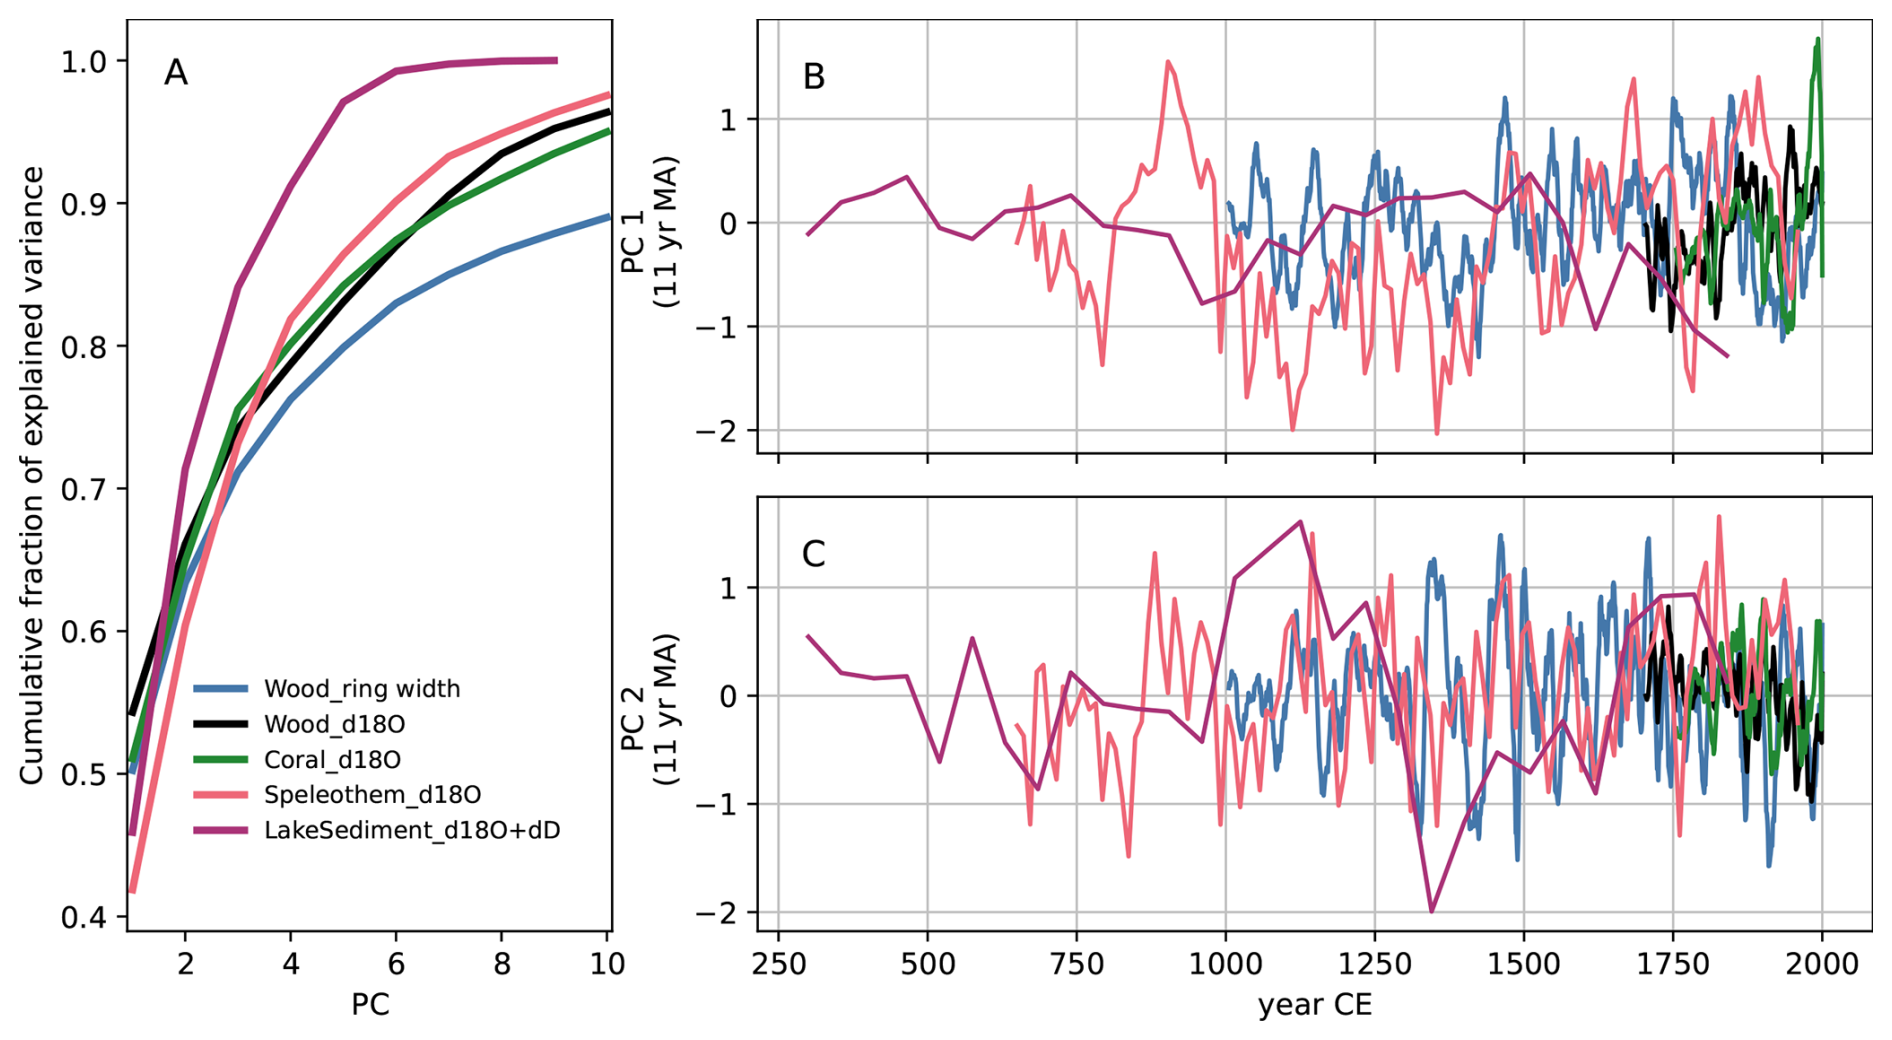
Figure 6Results of the PCA on wood TRW, tree δ18O, coral δ18O, speleothem δ18O and lake sediment δ18O + δD. (A) Cumulative fraction of explained variance as the sum of normalized eigenvalues corresponding to PCs 1–10. Note: for PCA with dimension >10, only first 10 cumulative fractional eigenvalues are shown. (B, C) 1st and 2nd time series expansion for all 6 PCA. All series with resolution higher than 11 years per timepoint (see Table 3) have been averaged to 11 years per timepoint plotted. PCs of wood δ18O and coral δ18O have been multiplied by −1 for the influence of warming on isotopic composition in these archives (Barbour et al., 2004; Konecky et al., 2020a; Walter et al., 2023).
Results of the PCA are shown in Figs. 6 and 7, respectively. All PCA have a leading pattern which explains from about 40 %–55 % of the variance, with cumulative explained variance from 60 %–75% for PCs 1 and 2 (Fig. 6A). However, perhaps because of differences in observational networks, time resolution and/or covariance estimation interval, there appears to be little agreement between PC1 and PC2 across archive and observation subsets. Although timeseries of the mean of PC1 show, at times, some agreement for certain archives (Fig. 6B), there is no agreement regarding PC2. We acknowledge that there might be differences in sign of linear regression coefficients across, for example, lake sediment δ18O records (McKay, 2025). In addition, the comparison of sign across the different PCAs shown is problematic, because the sign of each EOF pattern is arbitrary, requiring careful comparison of sign and amplitude of both the spatial patterns and the temporal loadings with the records from which the PCA was developed. We also believe the results may disagree within and possibly across the possible comparison subsets, because there might not be a simple linear mapping or scaling from one environmental variable to the proxy observation, especially for observations which are influenced by both moisture and temperature in different ways and proportions. All this suggests further careful additional analysis is needed before a multi-archive, multi-observational analysis is performed and interpreted.
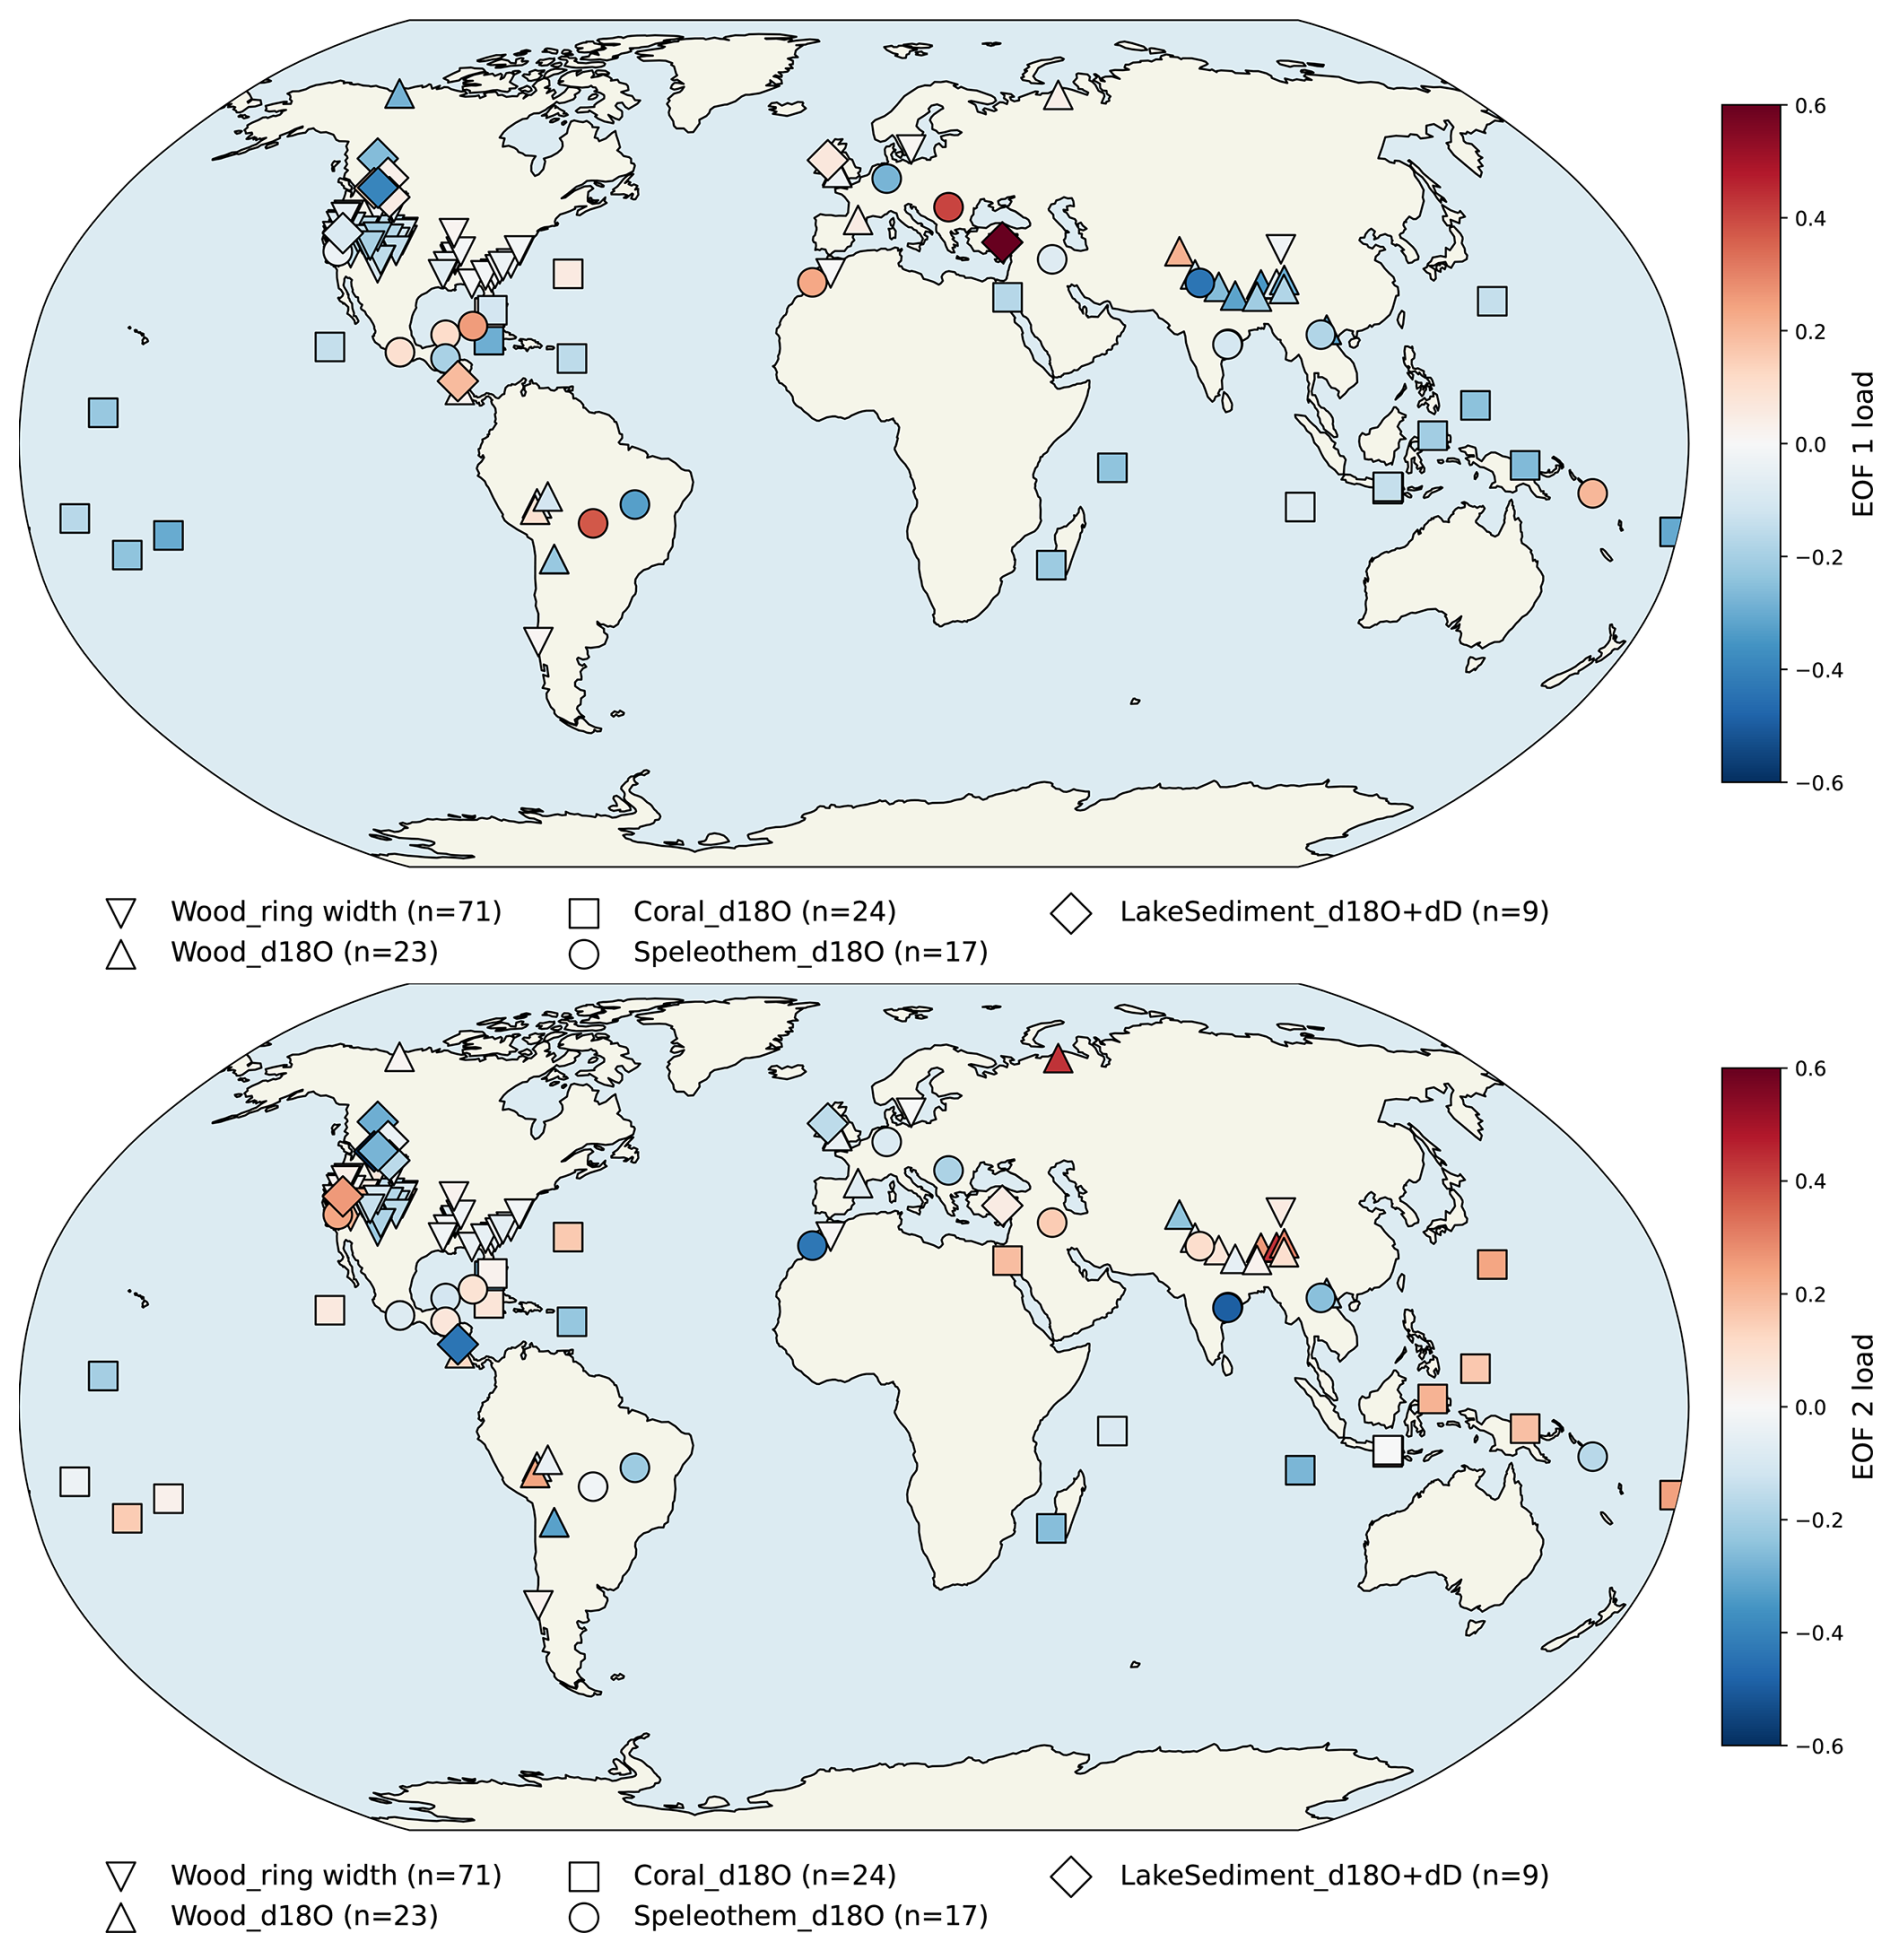
Figure 7 shows the EOF1 and EOF2 loadings from the 6 independent PCA as a function of their map location. Although there is some degree of regional spatial agreement of EOF sign within and across archives and observations, there are also many instances of disagreement of EOF sign within and across archives and observation types. Because spatial patterns may also be sensitive to observational network and the potential for both T and M influences in this subset, as noted above, we again assess that more analysis within these archives and data types is needed before we can identify large scale patterns across the multi-archive and multi-observation database.
4.2 Speleothem proxy system modeling
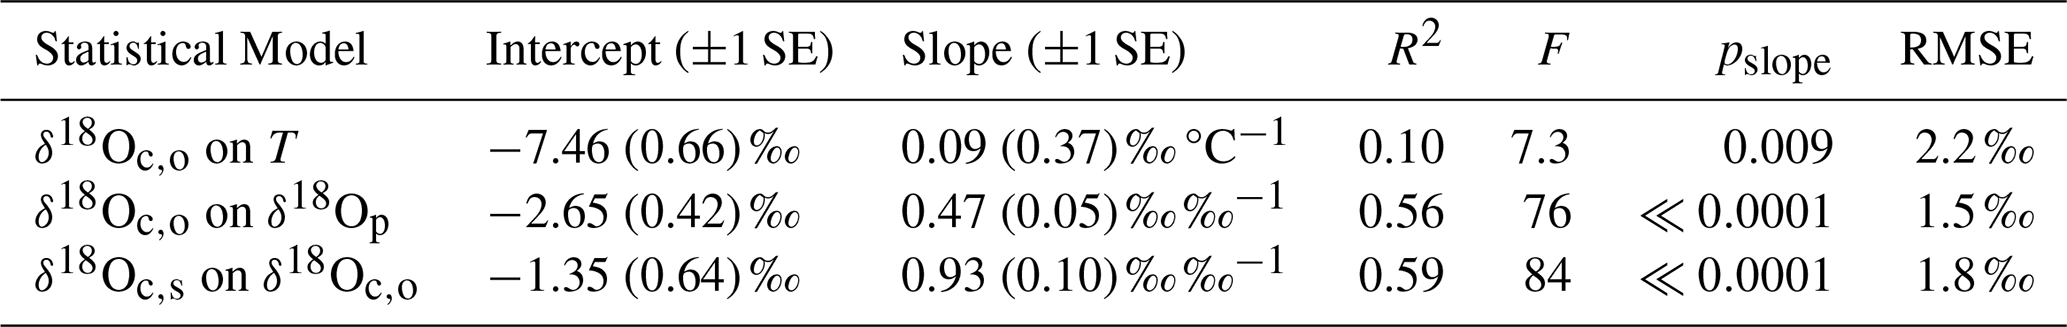
We develop and analyze results of the speleothem modeling application in notebook Sanalysis.ipynb. We find an agreement between observed (δ18Oc,o) and simulated δ18Oc,s) speleothem calcite isotopic composition that is significantly different from zero (Table 4). This result arises primarily from the regression of calcite δ18O on precipitation δ18O, and to a much lesser extent, on the dependence of calcite δ18O on temperature. The regression of δ18Oc,o on δ18Oc,s has a slope of 0.93±0.10 (≪0.0001). The slope is not different from 1:1 by t-test (; p=0.50). The mean difference δ18OOc,o is significantly less than zero by t-test (−0.95 ‰) with p=0.04. That value of −0.95 ‰ is about 9 % of the range in observed calcite δ18O. This mean difference might arise from either the estimated environmental controls or the translation of surface into karst conditions, or the archive model effects, or all of these factors together. Overall, these results demonstrate that simulated and observed mean calcite δ18O are broadly consistent across a spatial gradient, but with no reduction of true variance across the spatial gradient (Dee et al., 2015; Hu et al., 2017; Okazaki and Yoshimura, 2019; Bühler et al., 2021).
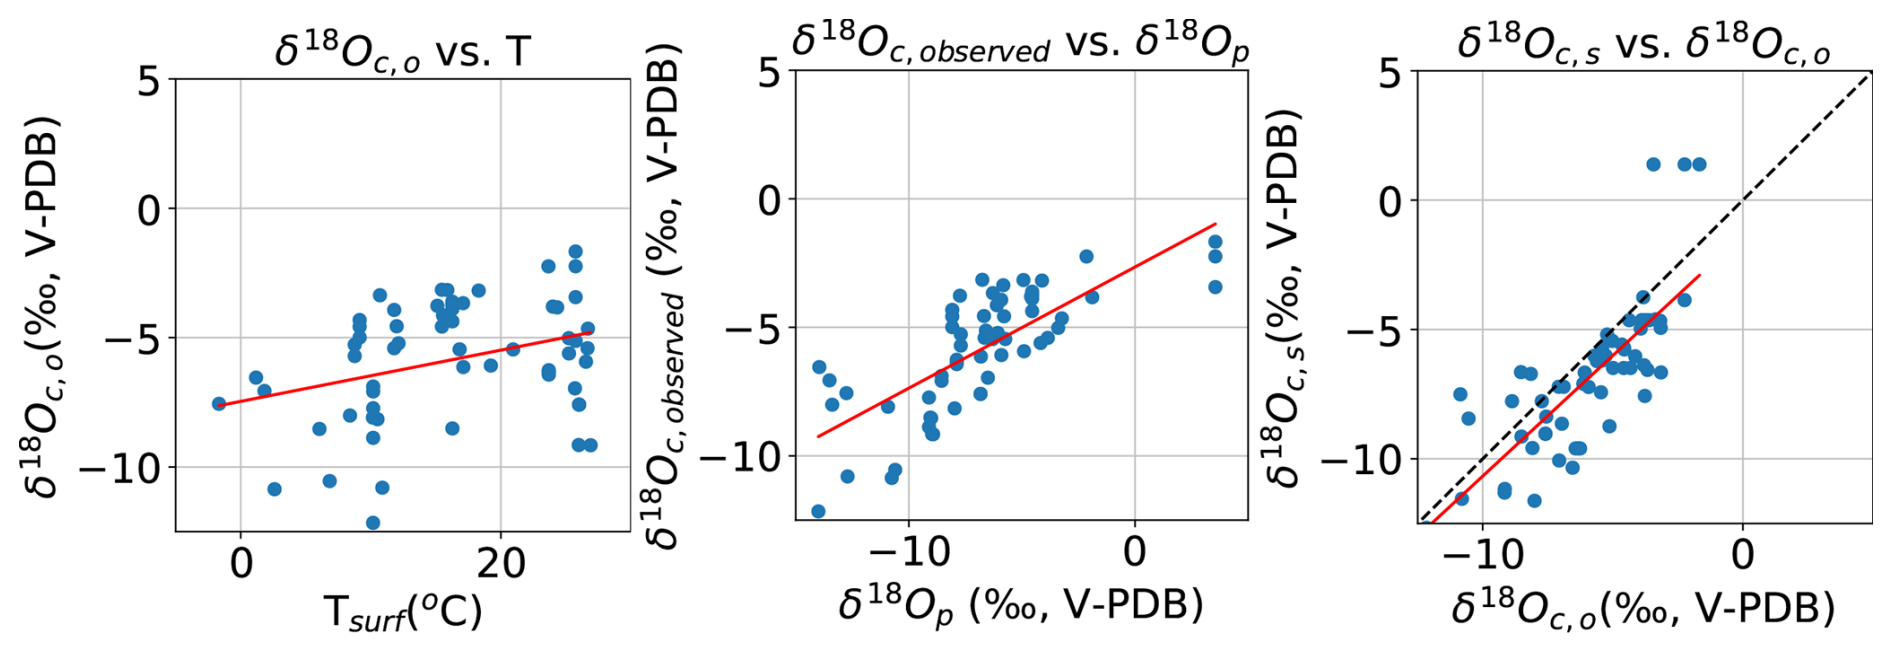
Figure 8Left: regression of observed calcite oxygen isotopic composition (δ18Oc) on T, Middle: regression of δ18Oc on mean annual amount-weighted oxygen isotopic composition (δ18Op); Right: regression of simulated (δ18Ocs) on δ18Oc. Dashed line is 1:1.
Table 4Regression diagnostics for regression of observed calcite oxygen isotopic composition (δ18Oc) on T, on mean annual amount-weighted oxygen isotopic composition (δ18Op), and for regression of simulated (δ18Ocs) on observed calcite oxygen isotopic composition (δ18Oc). In all cases, N=61 and df = 60.
If including all mineralogies (calcite, aragonite, mixed) from the SISALv3 database, we would obtain a slope of regression of δ18Oc,s on δ18Oc,o significantly smaller than unity, and simulated δ18Oc,s lower than δ18Oc,o (results not shown). This demonstrates the importance of including that metadata in the original database (Kaushal et al., 2024a) and retaining it in the DoD2k as paleoData_notes. If confirmed with downcore time series and spectral comparisons, this result might be used to either improve the sensor model, by including differential temperature fractionation associated with aragonite vs calcite (Bühler et al., 2021), or construct a more realistic, location-specific archive model (Dee et al., 2015; Bühler et al., 2021).
Additional challenges that should be carefully considered by adopters and modifiers of the DoD2k begin with the choice and definition of compact dictionary terms by which the aggregation across datasets is performed. We begin with 17 dictionary terms, primarily following a subset of the LiPDverse controlled vocabulary (https://lipdverse.org/vocabulary/, last access: 15 January 2026), but this could and should be expanded, contracted or modified to fit other purposes. For instance, the development of a moisture and temperature subset (Sect. 3.2.1) requires revising original expert interpretation_variable metadata into either moisture or temperature keywords for filtering. There may be cases in which filtering by dictionary terms we have employed could result in ambiguous results. This can be the case when a desired observation type is found in multiple archive types but with different proxy models and climatic interpretations (for instance: in speleothems and foraminifera; δ18O in wood, marine carbonates, lacustrine carbonates, ice cores). In the case of the SISAL v3 database integration and speleothem analysis (Sect. 3.2.2), there are many other metadata fields than might be useful for successfully leveraging all the information included in that archive (Kaushal et al., 2024a) but which we have neglected in our compact dictionary. More generally, user-supervised choices about selecting and adapting dictionary terms, and managing candidate duplicates may vary according to the application of the DoD2k.
Databases used to construct the DoD2k are available online (https://lipdverse.org/Pages2kTemperature/2_2_0/, last access: 15 January 2026, updated from Emile-Geay et al., 2017; https://lipdverse.org/CoralHydro2k/1_0_1/, last access: 15 January 2026, updated from Walter et al., 2023; https://lipdverse.org/iso2k/1_1_2/, last access: 15 January 2026, updated from Konecky and McKay, 2020; https://doi.org/10.25921/8HPF-A451, Franke et al., 2022b; https://doi.org/10.5287/ORA-2NANWP4RK, Kaushal et al., 2024b). The DoD2k database is available on GitHub at https://github.com/lluecke/dod2k (last access: 15 January 2026), Zenodo at https://doi.org/10.5281/zenodo.15676255 (Luecke et al., 2026), and at the NOAA/NCEI World Data Service for Paleoclimatology (https://www.ncei.noaa.gov/access/paleo-search/study/41981, last access: 15 January 2026) with https://doi.org/10.25921/sptp-g618 (Evans et al., 2025).
Jupyter notebooks, Python functions, scripts and tutorials are on GitHub, at https://github.com/lluecke/dod2k (last access: 15 January 2026), with https://doi.org/10.5281/zenodo.15676255 (Luecke et al., 2026).
We have developed a compilation of publicly available notebooks and functions, which transform five expert-curated, community sourced Common Era paleoclimate datasets into a database of databases (DoD2k). We demonstrate the utility of the DoD2k with two applications which permit analysis of the DoD2k by paleoclimatic interpretation and by a small subset of archive and observation type. Challenges to this approach include the need to produce a common set of metadata categories, here implemented as dictionary terms, by which to aggregate the component databases within specific groupings by metadata characteristic. The toolkit, consisting of notebooks, utility scripts, and database are available on GitHub. Being user-customizable, they can be used to produce specific DoD2k versions for particular applications.
MNE conceived the database of databases, designed the duplicate detection algorithm, developed the plans for applications, wrote the first draft of the manuscript, and revised functions and notebooks. LJL implemented the database aggregation, duplicate detection and underlying python functions for analysis and visualization and drafted Sect. 2 with input and minor code modifications from MNE; she wrote the moisture/temperature sensitive data analysis notebook. KJF, MNE and FZ wrote the speleothem analysis application notebook and developed visualization of the results, and MNE wrote the associated subsection of Sect. 4 with input from KJF and FZ. FZ gave important suggestions and direction to initial stages of the manuscript drafting. MNE, LJL, KJF and FZ all contributed to development of the submitted manuscript, response to reviewer comments, and the revised manuscript.
The contact author has declared that none of the authors has any competing interests.
Publisher's note: Copernicus Publications remains neutral with regard to jurisdictional claims made in the text, published maps, institutional affiliations, or any other geographical representation in this paper. The authors bear the ultimate responsibility for providing appropriate place names. Views expressed in the text are those of the authors and do not necessarily reflect the views of the publisher.
MNE is grateful to the PReSTo https://paleopresto.com/about.html (last access: 15 January 2026) data informatics working group for a February 2023 meeting in which the need for this work became evident, and to Julien Emile-Geay in particular who suggested using existing curated databases instead of raw records from the NOAA/NCEI/WDS repository for Paleoclimatology. The wisdom of this becoming clearer during some windy and wet bicycling and subsequent sipping on Islay. Dylan Jones (University of Edinburgh) undertook the initial efforts to identify a compact set of common dictionary terms across databases. MNE thanks the University of Edinburgh Geosciences community and in particular Gabi Hegerl, Andrew Schurer, Simon Tett, Patrick Meir and their research groups for support and constructive feedback. All the authors thank the individuals and working groups who painstakingly created the individual datasets and made them publicly available. We thank the individuals and working groups organized and supported by PAGES for then producing the component databases without which this work would have been impossible. The revised manuscript, the database and the toolkit and documentation were improved, and the tutorials developed, thanks to constructive criticism from Julien Emile-Geay, Nick McKay and an anonymous reviewer.
This work was supported by a Royal Society of London/Wolfson Visiting Fellowship grant Award \RSWVF\R1\221018 to MNE, which partly supported LJL, US NSF/P4CLIMATE Award AGS2303530 to MNE, which supported KJF and FZ, and by the University of Maryland, College Park and the University of Edinburgh, School of Geosciences, for funding and hosting MNE during a sabbatical year visit.
This paper was edited by Qingxiang Li and reviewed by Julien Emile-Geay, Nicholas McKay, and one anonymous referee.
Abram, N. J., McGregor, H. V., Tierney, J. E., Evans, M. N., McKay, N. P., Kaufman, D. S., and the PAGES2k Consortium: Early onset of industrial-era warming across the oceans and continents, Nature, 536, 411–418, https://doi.org/10.1038/nature19082, 2016. a
Anderson, D. M., Tardif, R., Horlick, K., Erb, M. P., Hakim, G. J., Noone, D., Perkins, W. A., and Steig, E.: Additions to the Last Millennium Reanalysis Multi-Proxy Database, Data Sci. J., 18, 2–11, https://doi.org/10.5334/dsj-2019-002, 2019. a, b
Arias, P., Bellouin, N., Coppola, E., Jones, R., Krinner, G., Marotzke, J., Naik, V., Palmer, M., Plattner, G.-K., Rogelj, J., Rojas, M., Sillmann, J., Storelvmo, T., Thorne, P., Trewin, B., Achuta Rao, K., Adhikary, B., Allan, R., Armour, K., Bala, G., Barimalala, R., Berger, S., Canadell, J., Cassou, C., Cherchi, A., Collins, W., Collins, W., Connors, S., Corti, S., Cruz, F., Dentener, F., Dereczynski, C., Di Luca, A., Diongue Niang, A., Doblas-Reyes, F., Dosio, A., Douville, H., Engelbrecht, F., Eyring, V., Fischer, E., Forster, P., Fox-Kemper, B., Fuglestvedt, J., Fyfe, J., Gillett, N., Goldfarb, L., Gorodetskaya, I., Gutierrez, J., Hamdi, R., Hawkins, E., Hewitt, H., Hope, P., Islam, A., Jones, C., Kaufman, D., Kopp, R., Kosaka, Y., Kossin, J., Krakovska, S., Lee, J.-Y., Li, J., Mauritsen, T., Maycock, T., Meinshausen, M., Min, S.-K., Monteiro, P., Ngo-Duc, T., Otto, F., Pinto, I., Pirani, A., Raghavan, K., Ranasinghe, R., Ruane, A., Ruiz, L., Sallée, J.-B., Samset, B., Sathyendranath, S., Seneviratne, S., Sörensson, A., Szopa, S., Takayabu, I., Tréguier, A.-M., van den Hurk, B., Vautard, R., von Schuckmann, K., Zaehle, S., Zhang, X., and Zickfeld, K.: Technical Summary, Cambridge University Press, Cambridge, United Kingdom and New York, NY, USA, 33−144, https://doi.org/10.1017/9781009157896.002, 2021. a
Barbour, M. M., Roden, J. S., Farquhar, G. D., and Ehleringer, J. R.: Expressing leaf water and cellulose oxygen isotope ratios as enrichment above source water reveals evidence of a Péclet effect, Oecologia, 138, 426–435, https://doi.org/10.1007/s00442-003-1449-3, 2004. a
Bowen, G. J., Wassenaar, L. I., and Hobson, K. A.: Global application of stable hydrogen and oxygen isotopes to wildlife forensics, Oecologia, 143, 337–348, https://doi.org/10.1007/s00442-004-1813-y, 2005. a
Breitenmoser, P., Brönnimann, S., and Frank, D.: Forward modelling of tree-ring width and comparison with a global network of tree-ring chronologies, Clim. Past, 10, 437–449, https://doi.org/10.5194/cp-10-437-2014, 2014. a, b, c
Bühler, J. C., Roesch, C., Kirschner, M., Sime, L., Holloway, M. D., and Rehfeld, K.: Comparison of the oxygen isotope signatures in speleothem records and iHadCM3 model simulations for the last millennium, Clim. Past, 17, 985–1004, https://doi.org/10.5194/cp-17-985-2021, 2021. a, b, c, d
Bush, R., Dutton, A., Evans, M., Loft, R., and Schmidt, G. A.: Perspectives on Data Reproducibility and Replicability in Paleoclimate and Climate Science, Harvard Data Science Review, 2, https://doi.org/10.1162/99608f92.00cd8f85, 2020. a
Cobb, K. M., Westphal, N., Sayani, H., Watson, J. T., Di Lorenzo, E., Cheng, H., Edwards, R. L., and Charles, C. D.: Highly variable El Niño-Southern Oscillation throughout the Holocene, Science, 339, 67–70, https://doi.org/10.1126/science.1228246, 2013. a
Cook, E. R.: A Time Series Approach to Tree-Ring Standardization, Ph.D. thesis, University of Arizona, OCLC number: 696817622, 1985. a
Dee, S. G., Emile-Geay, J., Evans, M., Allam, A., Stei, E. J., and Thompson, D. M.: PRYSM: An open-source framework for PRoxY System Modeling, with applications to oxygen-isotope systems, J. Adv. Model. Earth Sy., 07, https://doi.org/10.1002/2015MS000447, 2015. a, b, c, d
Dee, S. G., Cobb, K. M., Emile-Geay, J. E., Ault, T. R., Edwards, R. L., Cheng, H., and Charles, C. D.: No consistent ENSO response to volcanic forcing over the last millennium, Science, 367, 1477–1481, https://doi.org/10.1126/science.aax200, 2020.
Emile-Geay, J. and Eshleman, J. A.: Toward a semantic web of paleoclimatology, Geochem. Geophy. Geosy., 14, 457–469, https://doi.org/10.1002/ggge.20067, 2013. a
Emile-Geay, J., McKay, N. P., Kaufman, D. S., von Gunten, L., Wang, J., Anchukaitis, K., Abram, N., Addison, J. A., Curran, M. A. J., Evans, M. N., Henley, B. J., Hao, Z., Martrat, B., McGregor, H. V., Neukom, R., Pederson, G. T., Stenni, B., Thirumalai, K., Werner, J. P., Xu, C., Divine, D. V., Dixon, B. C., Gergis, J., Mundo, I. A., Nakatsuka, T., Phipps, S. J., Routson, C. C., Steig, E. J., Tierney, J. E., Tyler, J. E., Allen, K. J., Bertler, N. A. N., Bjórklund, J., Chase, B. M., Chen, M.-T., Cook, E. R., De Jong, R., DeLong, K. L., Dixon, D. A., Ekaykin, A. A., Ersek, V., Filipsson, H. L., Francus, P., Freund, M. B., Frezzotti, M., Gaire, N. P., Gajewski, K., Ge, Q., Goosse, H., Gornostaeva, A., Grosjean, M., Horiuchi, K., Hormes, A., Husum, K., Isaksson, E., Kandasamy, S., Kawamura, K., Kilbourne, K. H., Koć, N., Leduc, G., Linderholm, H. W., Lorrey, A. M., Mikhalenko, V., Mortyn, P. G., Motoyama, H., Moy, A. D., Mulvaney, R., Munz, P. M., Nash, D. J., Oerter, H., Opel, T., Orsi, A. J., Ovchinnikov, D. V., Porter, T. J., Roop, H. A., Saenger, C., Sano, M., Sauchyn, D., Saunders, K. M., Seidenkrantz, M.-S., Severi, M., Shao, X., Sicre, M.-A., Sigl, M., Sinclair, K., St. George, R. S., St. Jacques, J. M., Thamban, M., Kuwar Thapa, U., Thomas, E. R., Turney, C., Uemura, R., Viau, A. E., Vladimirova, D. O., Wahl, E. R., White, J. W. C., Yu, Z., Zinke, J., and the PAGES2k Consortium: A global multiproxy database for temperature reconstructions of the Common Era, Sci. Data, 4, 170088, https://doi.org/10.1038/sdata.2017.88, 2017. a, b, c, d, e, f, g, h, i
Evans, M. N., Tolwinski-Ward, S. E., Thompson, D. M., and Anchukaitis, K. J.: Applications of proxy system modeling in high resolution paleoclimatology, Quat. Sci. Rev., 76, 16–28, https://doi.org/10.1016/j.quascirev.2013.05.024, 2013. a
Evans, M. N., Lücke, L. J., Fan, K. J., and Zhu, F.: NOAA/WDS Paleoclimatology – DoD2k Database of Databases for Common Era Paleoclimatology, NOAA National Centers for Environmental Information [data set], https://doi.org/10.25921/sptp-g618, 2025. a, b
Falster, G., Konecky, B., Coats, S., and Stevenson, S.: Forced changes in the Pacific Walker circulation over the past millennium, Nature, 622, 93–100, https://doi.org/10.1038/s41586-023-06447-0, 2023. a
Forster, P., Storelvmo, T., Armour, K., Collins, W., Dufresne, J.-L., Frame, D., Lunt, D., Mauritsen, T., Palmer, M., Watanabe, M., Wild, M., and Zhang, H.: The Earth’s Energy Budget, Climate Feedbacks, and Climate Sensitivity, Cambridge University Press, Cambridge, United Kingdom and New York, NY, USA, 923–1054, https://doi.org/10.1017/9781009157896.009, 2021. a
Fox-Kemper, B., Hewitt, H., Xiao, C., Aðalgeirsdóttir, G., Drijfhout, S., Edwards, T., Golledge, N., Hemer, M., Kopp, R., Krinner, G., Mix, A., Notz, D., Nowicki, S., Nurhati, I., Ruiz, L., Sallée, J.-B., Slangen, A., and Yu, Y.: Ocean, Cryosphere and Sea Level Change,, Cambridge University Press, Cambridge, United Kingdom and New York, NY, USA, 1211–1362 https://doi.org/10.1017/9781009157896.011, 2021. a
Franke, J., Evans, M. N., Schurer, A., and Hegerl, G. C.: Climate change detection and attribution using observed and simulated tree-ring width, Clim. Past., 18, 2583–2597, https://doi.org/10.5194/cp-18-2583-2022, 2022a. a, b, c
Franke, J., Evans, M. N., Schurer, A. P., and Hegerl, G. C.: NOAA/WDS Paleoclimatology – Northern Hemisphere Observed and Simulated Tree Ring Width Data 1401–2000 CE, NOAA National Centers for Environmental Information [data set], https://doi.org/10.25921/8HPF-A451, 2022b. a
Gebbie, G. and Huybers, P.: The Little Ice Age and 20th-century deep Pacific cooling, Science, 363, 70–74, 2019. a
Harris, I., Osborn, T. J., Jones, P. D., and Lister, D.: Version 4 of the CRU TS monthly high-resolution gridded multivariate climate dataset, Sci. Data, 7, 109, https://doi.org/10.1038/s41597-020-0453-3, 2020. a
Hasselmann, K.: Stochastic climate models. Part I: Theory, Tellus, XXVIII, 473–485, 1976. a
Hu, J., Emile-Geay, J., and Partin, J.: Correlation-based interpretations of paleoclimate data – where statistics meet past climates, Earth and Planet. Sci. Lett., 459, 362–371, https://doi.org/10.1016/j.epsl.2016.11.048, 2017. a
Huybers, P. and Curry, W.: Links between annual, Milankovitch, and continuum temperature variability, Nature, 441, 329–332, https://doi.org/10.1038/nature04745, 2006. a
Kaushal, N., Atwood, A., Bothe, O., Eggleston, S., Falster, G., Henley, B. J., Jones, M., Jonkers, L., Martrat, B., McGregor, H. V., Orsi, A., Phipps, S. J., and Sayani, H.: Phase 4 of the PAGES 2k Network: Hydroclimate of the Common Era, PAGES Magazine, 30, 52, https://doi.org/10.22498/pages.30.1.52, 2022. a
Kaushal, N., Lechleitner, F. A., Wilhelm, M., Azennoud, K., Bühler, J. C., Braun, K., Ait Brahim, Y., Baker, A., Burstyn, Y., Comas-Bru, L., Fohlmeister, J., Goldsmith, Y., Harrison, S. P., Hatvani, I. G., Rehfeld, K., Ritzau, M., Skiba, V., Stoll, H. M., Szűcs, J. G., Tanos, P., Treble, P. C., Azevedo, V., Baker, J. L., Borsato, A., Chawchai, S., Columbu, A., Endres, L., Hu, J., Kern, Z., Kimbrough, A., Koç, K., Markowska, M., Martrat, B., Masood Ahmad, S., Nehme, C., Novello, V. F., Pérez-Mejías, C., Ruan, J., Sekhon, N., Sinha, N., Tadros, C. V., Tiger, B. H., Warken, S., Wolf, A., Zhang, H., and SISAL Working Group members: SISALv3: a global speleothem stable isotope and trace element database, Earth Syst. Sci. Data, 16, 1933–1963, https://doi.org/10.5194/essd-16-1933-2024, 2024a. a, b, c, d, e, f
Kaushal, N., Lechleitner, F. A., Wilhelm, M., and Members of the SISAL Working Group: SISALv3: Speleothem Isotopes Synthesis and AnaLysis database version 3.0, University of Oxford [data set], https://doi.org/10.5287/ORA-2NANWP4RK, 2024b. a, b
Konecky, B. L. and McKay, N. P.: NOAA/WDS Paleoclimatology – Iso2k Database Global Common Era Paleo-d18O and d2H Records, NOAA National Centers for Environmental Information [data set], https://doi.org/10.25921/57j8-vs18, 2020. a
Konecky, B. L., McKay, N. P., Churakova (Sidorova), O. V., Comas-Bru, L., Dassié, E. P., DeLong, K. L., Falster, G. M., Fischer, M. J., Jones, M. D., Jonkers, L., Kaufman, D. S., Leduc, G., Managave, S. R., Martrat, B., Opel, T., Orsi, A. J., Partin, J. W., Sayani, H. R., Thomas, E. K., Thompson, D. M., Tyler, J. J., Abram, N. J., Atwood, A. R., Cartapanis, O., Conroy, J. L., Curran, M. A., Dee, S. G., Deininger, M., Divine, D. V., Kern, Z., Porter, T. J., Stevenson, S. L., von Gunten, L., and Iso2k Project Members: The Iso2k database: a global compilation of paleo-δ18O and δ2H records to aid understanding of Common Era climate, Earth Syst. Sci. Data, 12, 2261–2288, https://doi.org/10.5194/essd-12-2261-2020, 2020a. a, b, c
Konecky, B. L., McKay, N. P., Churakova (Sidorova), O. V., Comas-Bru, L., Dassié, E. P., DeLong, K. L., Falster, G. M., Fischer, M. J., Jones, M. D., Jonkers, L., Kaufman, D. S., Leduc, G., Managave, S. R., Martrat, B., Opel, T., Orsi, A. J., Partin, J. W., Sayani, H. R., Thomas, E. K., Thompson, D. M., Tyler, J. J., Abram, N. J., Atwood, A. R., Cartapanis, O., Conroy, J. L., Curran, M. A., Dee, S. G., Deininger, M., Divine, D. V., Kern, Z., Porter, T. J., Stevenson, S. L., von Gunten, L., and Iso2k Project Members: The Iso2k database: a global compilation of paleo-δ18O and δ2H records to aid understanding of Common Era climate, Earth Syst. Sci. Data, 12, 2261–2288, https://doi.org/10.5194/essd-12-2261-2020, 2020b. a
Luecke, L., Evans, M., Zhu, F., and Fan, K: lluecke/dod2k: DoD2k version 2.0 (v2.0), Zenodo [code and data set], https://doi.org/10.5281/zenodo.18152672, 2026. a, b, c
Mann, M. E., Bradley, R. S., and Hughes, M. K.: Northern hemisphere temperatures during the past millennium: Inferences, uncertainties and limitations, Geophys. Res. Lett., 26, 759–762, 1999. a
Marvel, K., Biasutti, M., Bonfils, C., Durack, P. J., Kushnir, Y., and Cook, B. I.: Observed and Projected Changes to the Precipitation Annual Cycle, J. Clim., 30, 4983–4995, https://doi.org/10.1175/JCLI-D-16-0572.1, 2019a. a
Marvel, K., Cook, B. I., Bonfils, C. J. W., Taylor, K. E., Smerdon, J. E., and Williams, A. P.: Twentieth-century hydroclimate changes consistent with human influence, Nature, 569, 59–65, https://doi.org/10.1038/s41586-019-1149-8, 2019b. a
McGregor, H. V., Evans, M. N., Goosse, H., Leduc, G., Martrat, B., Addison, J. A., Mortyn, P. G., Oppo, D. W., Seidenkrantz, M.-S., Sicre, M.-A., Phipps, S. J., Selvaraj, K., Thirumalai, K., Filipsson, H. L., and Ersek, V.: Robust global ocean cooling trend for the pre-industial Common Era, Nat. Geosci., https://doi.org/10.1038/ngeo2510, 2015. a
McKay, N. P.: Referee comment 3, RC3: “Comment on essd-2025-364”, https://doi.org/10.5194/essd-2025-364-RC3, 2025. a
McKay, N. P. and Emile-Geay, J.: Technical note: The Linked Paleo Data framework – a common tongue for paleoclimatology, Clim. Past, 12, 1093–1100, https://doi.org/10.5194/cp-12-1093-2016, 2016. a, b
Miller, G. H., Geirsdóttir, A., Zhong, Y., Larsen, D. J., Otto-Bliesner, B. L., Holland, M. M., Bailey, D. A., Refsnider, K. A., Lehman, S. J., Southon, J. R., Anderson, C., Bj ornsson, H., and T., T.: Abrupt onset of the Little Ice Age triggered by volcanismand sustained by sea-ice/ocean feedbacks, Geophys. Res. Lett., 39, L02 708, https://doi.org/10.1029/2011GL050168, 2012. a
Neukom, R., Barboza, L. A., Erb, M. P., Shi, F., Emile-Geay, J., Evans, M. N., Franke, J., Kaufman, D. S., Lücke, L., Rehfeld, K., Schurer, A., Zhu, F., Brönnimann, S., Hakim, G. J., Henley, B. J., Ljungqvist, F. C., McKay, N., Valler, V., and von Gunten, L.: Consistent multidecadal variability in global temperature reconstructions and simulations over the Common Era, Nat. Geosci., 12, 643–649, https://doi.org/10.1038/s41561-019-0400-0, 2019a. a, b
Neukom, R., Steiger, N., Gómez-Navarro, J. J., Wang, J., and Werner, J.: No evidence for globally coherent warm and cold periods over the preindustrial Common Era, Nature, 571, 550–554, https://doi.org/10.1038/s41586-019-1401-2, 2019b. a
Okazaki, A. and Yoshimura, K.: Global Evaluation of Proxy System Models for Stable Water Isotopes With Realistic Atmospheric Forcing, J. Geophys. Res.-Atmos., 124, 8972–8993, https://doi.org/10.1029/2018JD029463, 2019. a, b
PAGES 2K Consortium: Continental-scale temperature variability during the past two millennia, Nat. Geosci., 6, 339–346, https://doi.org/10.1038/ngeo1797, 2013. a
Partin, J. W., Quinn, T. M., Shen, C.-C., Emile-Geay, J., Taylor, F. W., Maupin, C. R., Lin, K., Jackson, C. S., Banner, J. L., Sinclair, D. J., and Huh, C.-A.: Multidecadal rainfall variability in South Pacific Convergence Zone as revealed by stalagmite geochemistry, Geology, 41, 1143–1147, 2013. a
Steiger, N., Horlick, K., Tardif, R., Erb, M., Emile-Geay, J., Steig, E., and Hakim, G.: A global collection of paleoclimate proxy time series over the Common Era (1.0.0), Nov 2022 Update, Zenodo [data set], https://doi.org/10.5281/zenodo.1189006, 2022. a, b
Tardif, R., Hakim, G. J., Perkins, W. A., Horlick, K. A., Erb, M. P., Emile-Geay, J., Anderson, D. M., Steig, E. J., and Noone, D.: Last Millennium Reanalysis with an expanded proxy database and seasonal proxy modeling, Clim. Past, 15, 1251–1273, https://doi.org/10.5194/cp-15-1251-2019, 2019. a
Tolwinski-Ward, S. E., Evans, M. N., Hughes, M. K., and Anchukaitis, K. J.: An efficient forward model of the climatic controls on interannual variation in tree-ring width, Clim. Dyn., 36, 2419–2439, https://doi.org/10.1007/s00382-010-0945-5, 2011. a
Walter, R. M., Sayani, H. R., Felis, T., Cobb, K. M., Abram, N. J., Arzey, A. K., Atwood, A. R., Brenner, L. D., Dassié, E. P., DeLong, K. L., Ellis, B., Emile-Geay, J., Fischer, M. J., Goodkin, N. F., Hargreaves, J. A., Kilbourne, K. H., Krawczyk, H., McKay, N. P., Moore, A. L., Murty, S. A., Ong, M. R., Ramos, R. D., Reed, E. V., Samanta, D., Sanchez, S. C., Zinke, J., and PAGES CoralHydro2k Project Members: The CoralHydro2k database: a global, actively curated compilation of coral δ18O and Sr/Ca proxy records of tropical ocean hydrology and temperature for the Common Era, Earth Sys. Sci. Dat., 15, 2081–2116, https://doi.org/10.5194/essd-15-2081-2023, 2023. a, b, c, d
Walter, R. M., Sayani, H. R., Felis, T., Cobb, K. M., Abram, N. J., Arzey, A. K., Atwood, A., Brenner, L. D., Dassié, E. P., DeLong, K. L., Ellis, B., Fischer, M. J., Goodkin, N. F., Hargreaves, J. A., Kilbourne, K. H., Krawczyk, H. A., McKay, N. P., Murty, S. A., Ramos, R. D., Reed, E. V., Samanta, D., Sanchez, S. C., Zinke, J., and PAGES CoralHydro2k Project Members: OAA/WDS Paleoclimatology – CoralHydro2k Database (Common Era coral d18O and Sr/Ca data compilation), NOAA National Centers for Environmental Information [data set], https://doi.org/10.25921/YP94-V135, 2022.
Zhu, F., Emile-Geay, J., Anchukaitis, K. J., McKay, N. P., Stevenson, S., and Meng, Z.: A Pseudoproxy Emulation of the PAGES 2k Database Using a Hierarchy of Proxy System Models, Scientific Data, 10, 624, https://doi.org/10.1038/s41597-023-02489-1, 2023. a
Zhu, F., Emile-Geay, J., Hakim, G. J., Guillot, D., Khider, D., Tardif, R., and Perkins, W. A.: cfr (v2024.1.26): a Python package for climate field reconstruction, Geosci. Model Dev., 17, 3409–3431, https://doi.org/10.5194/gmd-17-3409-2024, 2024. a, b