the Creative Commons Attribution 4.0 License.
the Creative Commons Attribution 4.0 License.
 | 18 Feb 2025
High-resolution carbon cycling data from 2019 to 2021 measured at six Austrian long-term ecosystem research sites
Thomas Dirnböck
Michael Bahn
Eugenio Diaz-Pines
Ika Djukic
Michael Englisch
Karl Gartner
Günther Gollobich
Johannes Ingrisch
Barbara Kitzler
Karl Knaebel
Johannes Kobler
Andreas Maier
Armin Malli
Ivo Offenthaler
Johannes Peterseil
Gisela Pröll
Sarah Venier
Christoph Wohner
Sophie Zechmeister-Boltenstern
Anita Zolles
Stephan Glatzel
Seven long-term observation sites have been established in six regions across Austria, covering major ecosystem types such as forests, grasslands, and wetlands across a wide bioclimatic range. The purpose of these observations is to measure key ecosystem parameters serving as baselines for assessing the impacts of extreme climate events on the carbon cycle. The datasets collected include meteorological variables, soil microclimate, CO2 fluxes, and tree stem growth, all recorded at high temporal resolution (15–60 min) between 2019 and 2021 (including 1 year of average climate conditions and 2 comparatively dry years). The DOIs of the dataset can be found in the “Data availability” section. The sites will be integrated into the European Research Infrastructure for Integrated European Long-Term Ecosystem, Critical Zone, and Socio-Ecological Research (eLTER RI). Subsequently, new data covering the variables presented here will be continuously available through the data integration portal. This step will allow the data to reach their full potential for research on drought-related ecosystem carbon cycling.
- Article
(1832 KB) - Full-text XML
- BibTeX
- EndNote


Climate change has been affecting ecosystems globally, with serious implications for the terrestrial carbon (C) cycle, which in turn feeds back into the climate system (Heimann and Reichstein, 2008). As an emerging feature of climate change, extreme climate events (ECEs) are expected to occur with increasing frequency and intensity in the coming decades (IPCC, 2021). ECEs are considered to exert higher impacts on ecosystems and the services they provide to humankind than gradual changes in the climate (Frank et al., 2015; Reichstein et al., 2013; Grünzweig et al., 2022; Anderegg et al., 2020). Understanding, predicting, and managing extreme climate events and their consequences for ecosystems and societies will therefore be one of the big challenges in the coming decades. To detect and attribute the impacts of ECEs on ecosystem processes and services, they need to be evaluated against the background of the typical interannual range of these processes (Ciais et al., 2005; Bernal et al., 2012; Fu et al., 2020; Schindlbacher et al., 2012), and analyses of ecosystem resilience to ECEs require robust quantification of baselines of ecosystem functioning (Bahn and Ingrisch, 2018; Ingrisch and Bahn, 2018). To derive such baselines and the interannual variability of ecosystem carbon cycling, coordinated and representative observation networks need to be in place to enable data retrieval and rapid-response scientific campaigns to study the after-effects and post-disturbance trajectories resulting from ECEs (Kulmala, 2018; Mahecha et al., 2017; Mirtl et al., 2018; Dirnböck et al., 2019; Müller and Bahn, 2022). Datasets obtained through such observation networks are also essential for benchmarking models (Futter et al., 2023; Baatz et al., 2021; Wu et al., 2018) and for comparison with ecosystem experiments (Kröel-Dulay et al., 2022).
Within a research infrastructure project focusing on ecosystem carbon, nitrogen, and water fluxes, i.e., Long-Term Ecosystem Research for Carbon, Water, and Nitrogen (LTER-CWN, https://www.lter-austria.at/cwn/, last access: 1 March 2024), we equipped seven long-term observation sites in six regions, which are part of the existing Long-Term Ecological Research Network of Austria (LTER-Austria), with high temporal resolution (30–60 min) C cycle measurements. The sites cover three major ecosystem types occurring across Austria (forests, managed mountain grassland, and wetlands), and most of them are part of socio-ecological research platforms for transdisciplinary studies (Fig. 1). Here, we provide observational ecosystem response data capturing naturally occurring ECEs from the first 3 years after the creation of the infrastructure (2019 to 2021). These datasets include meteorological variables, soil microclimate, CO2 flux measurements using automated chambers (soil CO2 efflux), eddy covariance techniques (net ecosystem exchange), and tree stem radial increments and shrinkage in forested plots.
The sites are key research infrastructures for ecosystem-related greenhouse gas observations in Austria. They include forests (Klausen-Leopoldsdorf and Rosalia in Lower Austria, Zöbelboden in Upper Austria, and Stubai in Tyrol), mountain grassland (Stubai and Tyrol), and wetlands (Pürgschachen Moor, Styria and the Lake Neusiedl reed belt, and Burgenland). This network of sites covers typical forest, alpine, and wetland ecosystems of central Europe (Fig. 1). Furthermore, the sites represent different geological characteristics, from crystalline rock in the central Alps to limestone in the northern Alps to unconsolidated Holocene sediments in the lowlands. All of the sites are part of the LTER-Austria network and, once officially launched, will be included in the European eLTER RI (https://elter-ri.eu/, last access: 1 March 2024). For a detailed description of the sites, we refer the reader to the Dynamic Ecological Information Management System – Site and dataset registry (DEIMS-SDR) (Table 1).
2.1 Rosalia Forest Demonstration Centre (mixed beech forest)
The Rosalia Forest Demonstration Centre was established in 1972 as a collaboration between the BOKU University, Vienna, Austria, and Austrian Federal Forests, and it covers approximately 1000 ha on the western slopes of the Rosalia Mountains (Rosaliengebirge) in Lower Austria (Fig. 1 and Table 1). The forest contains all the major tree species occurring in Austria, i.e., European beech (Fagus sylvatica L.), Norway spruce (Picea abies (L.) H. Karst.), Scots pine (Pinus sylvestris L.), larch (Larix decidua Mill.), and fir (Abies alba Mill.). The altitude ranges from 320 to 725 m a.s.l., and the mean annual temperature and mean annual precipitation are 6.5 °C and 796 mm, respectively. The substrate is mainly composed of crystalline rocks, and the soils are predominantly Cambisols (Working Group WRB, 2015) sporadically combined with Planosols (in plains and on moderate slopes), Fluvisols (in valleys), or podzolic Cambisols (on steep slopes) (Fürst et al., 2021).
The demonstration forest has several experimental and observation sites distributed along its area, including for water, soil, vegetation, and air observations (e.g., Gillespie et al., 2023). A watershed (220 ha) is subject to hydrological observations (Fürst et al., 2021), and the forest is regularly monitored on permanent plots (Gollob et al., 2020). The meteorological data presented here originate from three stations located at 385 (Mehlbeerleiten), 500 (Kuhwald), and 640 m a.s.l. (Heuberg). The C cycle data were measured at a long-term experimental site launched in 2012. The site is located in a pure mature beech stand at 600 m a.s.l. (47° 42′26′′ N, 16°17′59′′ E). It faces northwest, with a slope of approximately 20 %. This experiment focuses on investigating the effect of changing precipitation patterns on soil nitrogen fluxes, soil microbial changes, greenhouse gas efflux, and soil water processes (Leitner et al., 2017; Liu et al., 2019; Schwen et al., 2015; Gillespie et al., 2024). Monitoring is performed on control and manipulated plots. The data from both natural and manipulated plots are published in this paper. Manipulation involves the use of rainout shelters (for simulating drought periods of different lengths) and an irrigation system (for recreating rainfall events of different intensities). The monitoring infrastructure involves measurements of greenhouse gas (GHG) (N2O, CH4, and CO2) fluxes, soil nutrients (suction cups), and microclimate parameters.
2.2 Klausen-Leopoldsdorf (beech forest)
This site, Klausen-Leopoldsdorf, is located about 40 km southwest of Vienna on a NNE-facing slope and was founded in the 1990s as one of Austria's sites contributing to the International Co-operative Programme on Assessment and Monitoring of Air Pollution Effects on Forests (ICP Forests) (Neumann and Starlinger, 2001). The site is divided into four different subareas within a small catchment: (1) the ICP Forests site, (2) a weather station located 2.7 km from the ICP Forests intensive plots at 398 m a.s.l., (3) a catchment runoff weir (475 m a.s.l.), and (4) the LTER-CWN measurement plot (520 m a.s.l.), where the C cycle data presented here were measured (Fig. 1 and Table 1). The forest within the measurement plot is a pure beech (Fagus sylvatica L.) stand. The mean annual temperature is 8 °C, and the mean annual precipitation is 801 mm (2010–2022). The geological substrate is sandstone, and the soil type is mainly stagnic Cambisol or dystric Cambisol (Working Group WRB, 2015). Instruments installed in the LTER-CWN measurement area include a sap flow and dendrometer measurement system on 10 trees, 12 GHG automated measurement chambers for CO2 respiration, and soil moisture and soil temperature sensors at different soil depths (5–30 cm).
In addition to the data presented here, many other datasets are available. Soil GHG fluxes (manual sampling) were measured starting in the year 2001 (Kitzler et al., 2006). At the ICP Forests site, instruments for long-term monitoring (since 1996) such as soil moisture, air temperature and relative humidity, soil temperature, soil solution with suction cups, throughfall deposition, litterfall traps, stemflow, and manual and automatic dendrometers have been installed, and the data are available at https://bfw.ac.at/lims/level2.daten (last access: 1 March 2024) or the ICP Forests Program Centre.
2.3 Lake Neusiedl (reed belt)
The measurement site is located in the eastern reed belt of this lake and as such is inside the Lake Neusiedl–Seewinkel National Park (Fig. 1 and Table 1). The region (average altitude 120 m a.s.l.) is characterized by a (sub)continental Pannonian climate with a mean annual precipitation of 576 mm (2013–2022). The reed belt is a dynamic ecosystem consisting of a mosaic of reed stocks (Phragmites australis (Cav.) Trin. ex Steud.), sediment, and open-water areas. Increasing dry periods and thus successive drying of the reed belt since 2018 have led to an increase in reed stocks within the belt, an increase in the sediment areas, and a sharp decline in the open-water areas, according to a 2021 study that investigated the spatial and temporal variations within the reed ecosystem at Lake Neusiedl (Buchsteiner et al., 2023). Processes driving CH4 emissions from the reed belt were recently investigated in detail (Baur et al., 2024).
The data presented here stem from devices permanently installed at the site. They include an eddy covariance tower for CO2, CH4, water vapor fluxes, and relevant accompanying meteorological parameters as well as soil heat flux, soil moisture, and soil temperature sensors.
2.4 Pürgschachen Moor (peat bog)
The Pürgschachen Moor is located at the bottom of the Styrian Enns Valley at an altitude of 632 m a.s.l. (Fig. 1 and Table 1). It is a pine peat bog with an area of about 62 ha. Thus, it is the largest (by some distance) intact valley peat bog in Austria, with closed peat moss cover and a good example of the formerly widely distributed peatlands of inner-alpine valleys of the European Alps. The mean average temperature is 8.2 °C, and the mean annual precipitation is 1233 mm (2013–2022). The typical vegetation of the peat bog is constituted of three associations of plants, i.e., Pino mugo-Sphagnetum magellanici (pine peat bog association), Sphagnetum magellanici (colored bog moss association), and Caricetum limosae (bog sedge association), depending on the prevailing hydrological site conditions. The current mean water table depth is about 14 cm below the soil surface in the central peat bog area. Peat decomposition and the related CO2 and CH4 fluxes were the subject of a series of research studies (Drollinger et al., 2019; Knierzinger et al., 2020; Müller et al., 2022; Glatzel et al., 2023).
The data presented here stem from devices permanently installed at roughly the center of the peat bog. They include an eddy covariance tower for CO2, CH4, and water vapor fluxes and the relevant accompanying meteorological parameters as well as for soil heat flux, soil moisture, and soil temperature sensors.
2.5 Stubai (subalpine hay meadow, larch and spruce forest)
The two observation plots used in this study are part of the LTER site Stubai (Table 1), which is located in the Stubai Alps in Tyrol, Austria (Fig. 1). Research at the study site began in 1993. The two observation plots are a mountain grassland and a subalpine forest in an alpine pasture area called Kaserstattalm. The underlying rock is siliceous and calcareous. The average air temperature is about 3 °C, and the precipitation is about 1100 mm. About 35 % of the annual precipitation occurs as snow during the winter months.
The grassland site is located at an altitude of 1810–1850 m a.s.l. on a southeast-facing slope with an inclination of about 20°. The site is an extensively managed meadow that is harvested once a year in early August and grazed lightly in late summer. The soil is a dystric Cambisol (Working Group WRB, 2015). The vegetation type is Trisetetum flavenscensis and consists of perennial grasses and forbs dominated by Agrostis capillaris L., Festuca rubra L., Anthoxanthum odoratum L., Ranunculus montanus Willd., Leontodon hispidus L., Trifolium repens L., and T. pretense L. (Bahn et al., 2009; Schmitt et al., 2010).
The forested observation plot is located close to the treeline at 1960 m a.s.l. on a slope with an inclination of 20–35°. It is dominated by the two common tree species European larch (Larix decidua Mill.) and Norway spruce (Picea abies (L.) H. Karst.). In previous years, the plot was a pasture, and it was reforested in the 1980s (Oberleitner et al., 2022).
Both observation plots are equipped with micrometeorological stations, soil environment monitoring (soil moisture and soil temperature), and soil CO2 devices. At both observation plots, we measured soil CO2 fluxes with automated chambers during the summer. The forest plot is additionally equipped with tree dendrometers and tree sap flow sensors. In the grassland, land use and drought-related carbon cycle research was carried out over the last 2 decades (Fuchslueger et al., 2014; Hasibeder et al., 2015; Ingrisch et al., 2020; Ingrisch et al., 2018). Research using the forest plot started only recently (Oberleitner et al., 2022).
2.6 Zöbelboden (mixed beech forest)
The LTER Zöbelboden site is located in Kalkalpen National Park in the Northern Limestone Alps, Austria (Fig. 1). Measurements began in 1992 as part of ICP on Integrated Monitoring of Air Pollution Effects on Ecosystems (ICP IM), covering a 90 ha catchment with an elevation range of 550–956 m a.s.l. (Table 1). The main underlying rock type is Norian dolomite (Hauptdolomit) partly overlain by limestone (Plattenkalk). According to long-term meteorological measurements (1993–2022), the mean annual air temperature and precipitation are 8.2 °C and 1645 mm, respectively. Maximum precipitation occurs in summer and snowfall usually between December and April.
The data presented here were measured at Intensive Plot II, which is located on a steep (36° on average) northwesterly-exposed slope at 880 m a.s.l. The soils of the plot are lithic and rendzic Leptosols (Working Group WRB, 2015). The plot is dominated by beech (Fagus sylvatica L.) with intermixed sycamore (Acer pseudoplatanus L.), European ash (Fraxinus excelsior L.), and spruce (Picea abies (L.) H. Karst.). Since the year 1995, this plot has been equipped with a number of field measurement devices for long-term monitoring (throughfall deposition, litterfall traps, lysimeters, soil moisture and temperature sensors, and manual dendrometers) and supplemented by other monitoring characteristics (tree inventory, needle and leaf chemistry, and soil chemistry; see, e.g., Leitner et al., 2020; Kobler et al., 2019; Dirnböck et al., 2016; Dirnböck et al., 2020). Drought impacts on carbon allocation in the forests of the catchment currently form one of the research foci for which long-term observation data exist (see, e.g., Hartl-Meier et al., 2014), together with experimental plots with rainout shelters.
The instruments and data included here are soil respiration automated chambers, soil water potential, temperature sensors, and automated dendrometers. The meteorological data stem from a station in close proximity to the plateau at 890 m a.s.l. The site is also equipped with an eddy covariance tower, but these data will be published elsewhere.
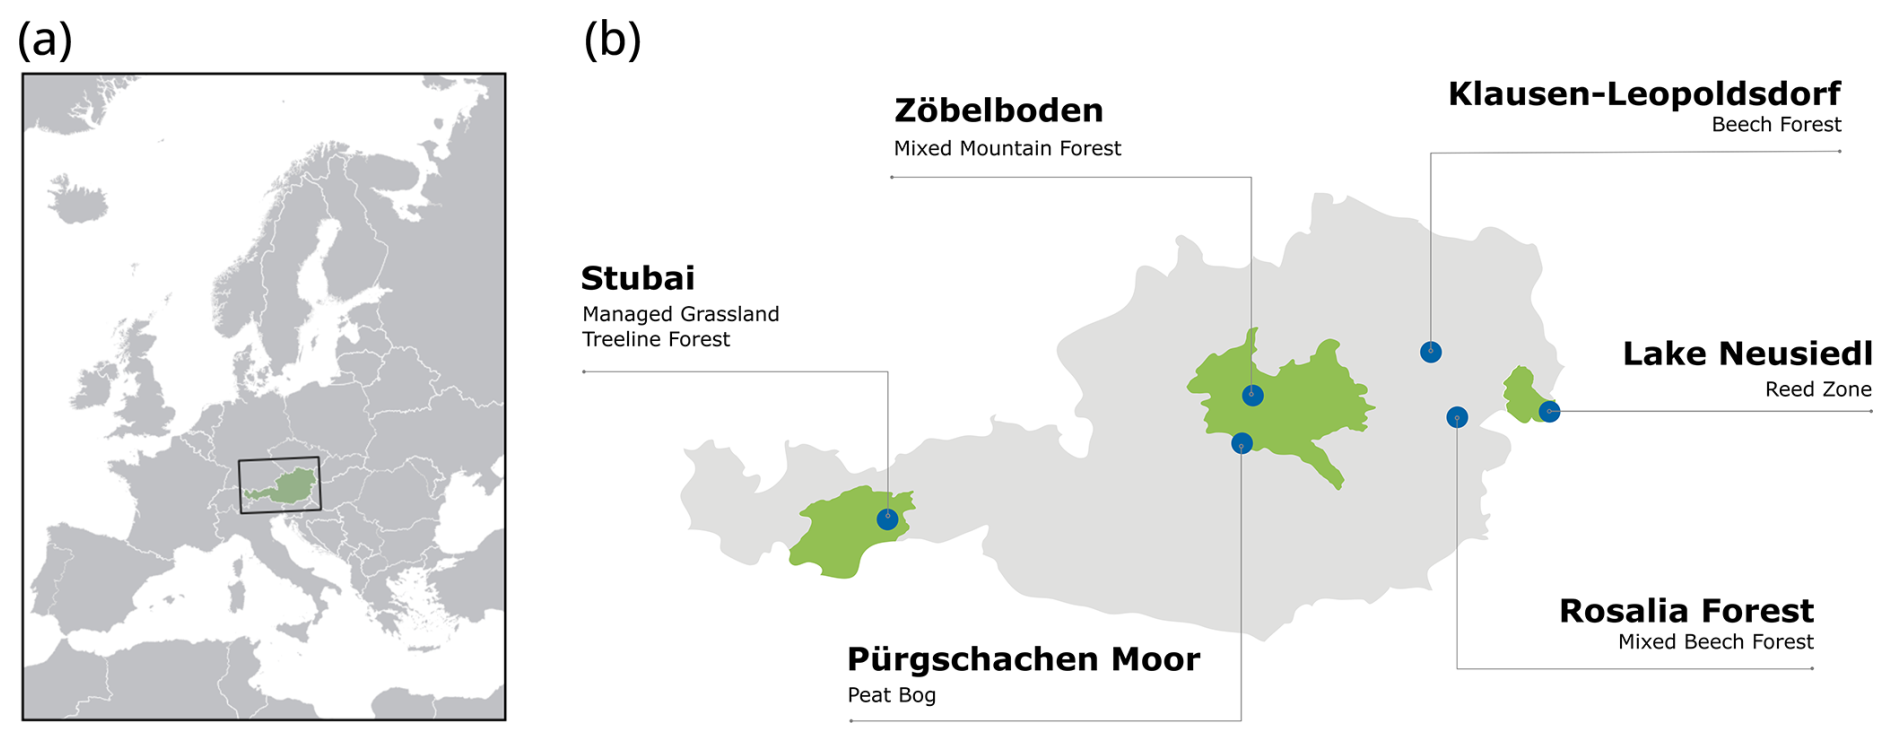
Figure 1Locations of the sites in (a) Europe and (b) Austria. The blue dots indicate the sites; the green areas are long-term socio-ecological research platforms (LTSERs) (from left to right: LTSER Tyrolian Alps, LTSER Eisenwurzen, and LTSER Lake Neusiedl) within the LTER-Austria network. For site information about the altitude and climate, see Table 1.
Table 1Ecosystem type, altitude, climate, and metadata links of the sites and observation plots. Geographic boundaries and linked datasets can be found in the site and dataset registry system (DEIMS-SDR).
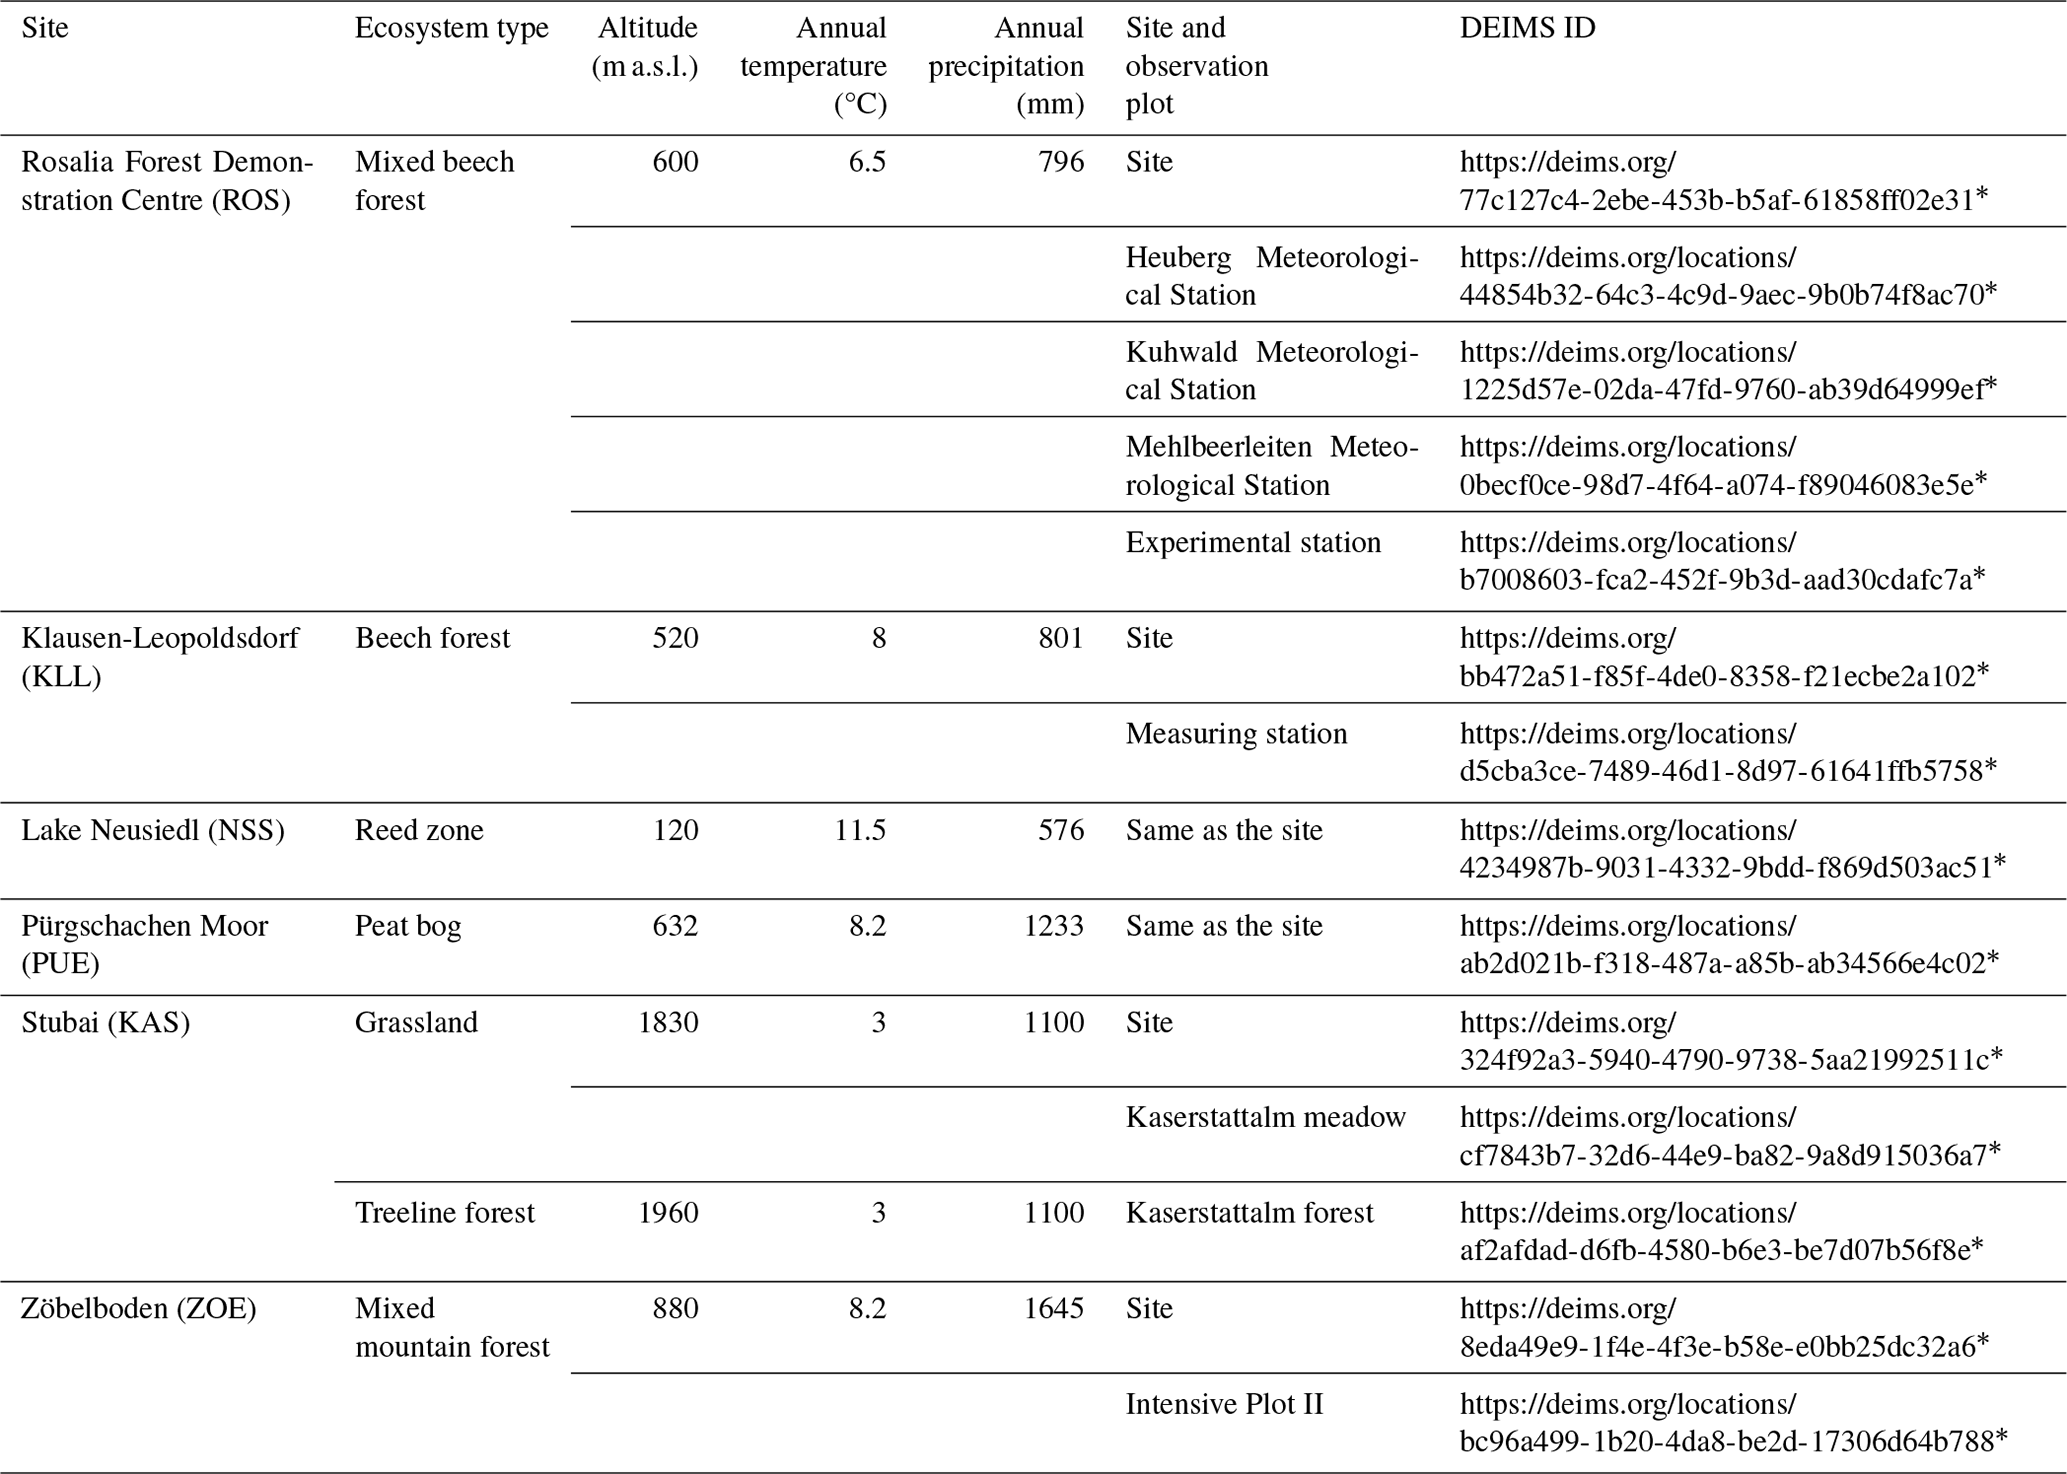
* Last access: 1 March 2024.
We followed routine QA and QC procedures to ensure functionality of the sensors and data quality comprising remote function control, on-site check of sensors and cables, regular sensor calibration, data checks through different quality assurance procedures (e.g., exceedance of thresholds, outlier detection, or deviations from other measurements), and data quality flagging.
3.1 Meteorology, soil temperature, and soil moisture
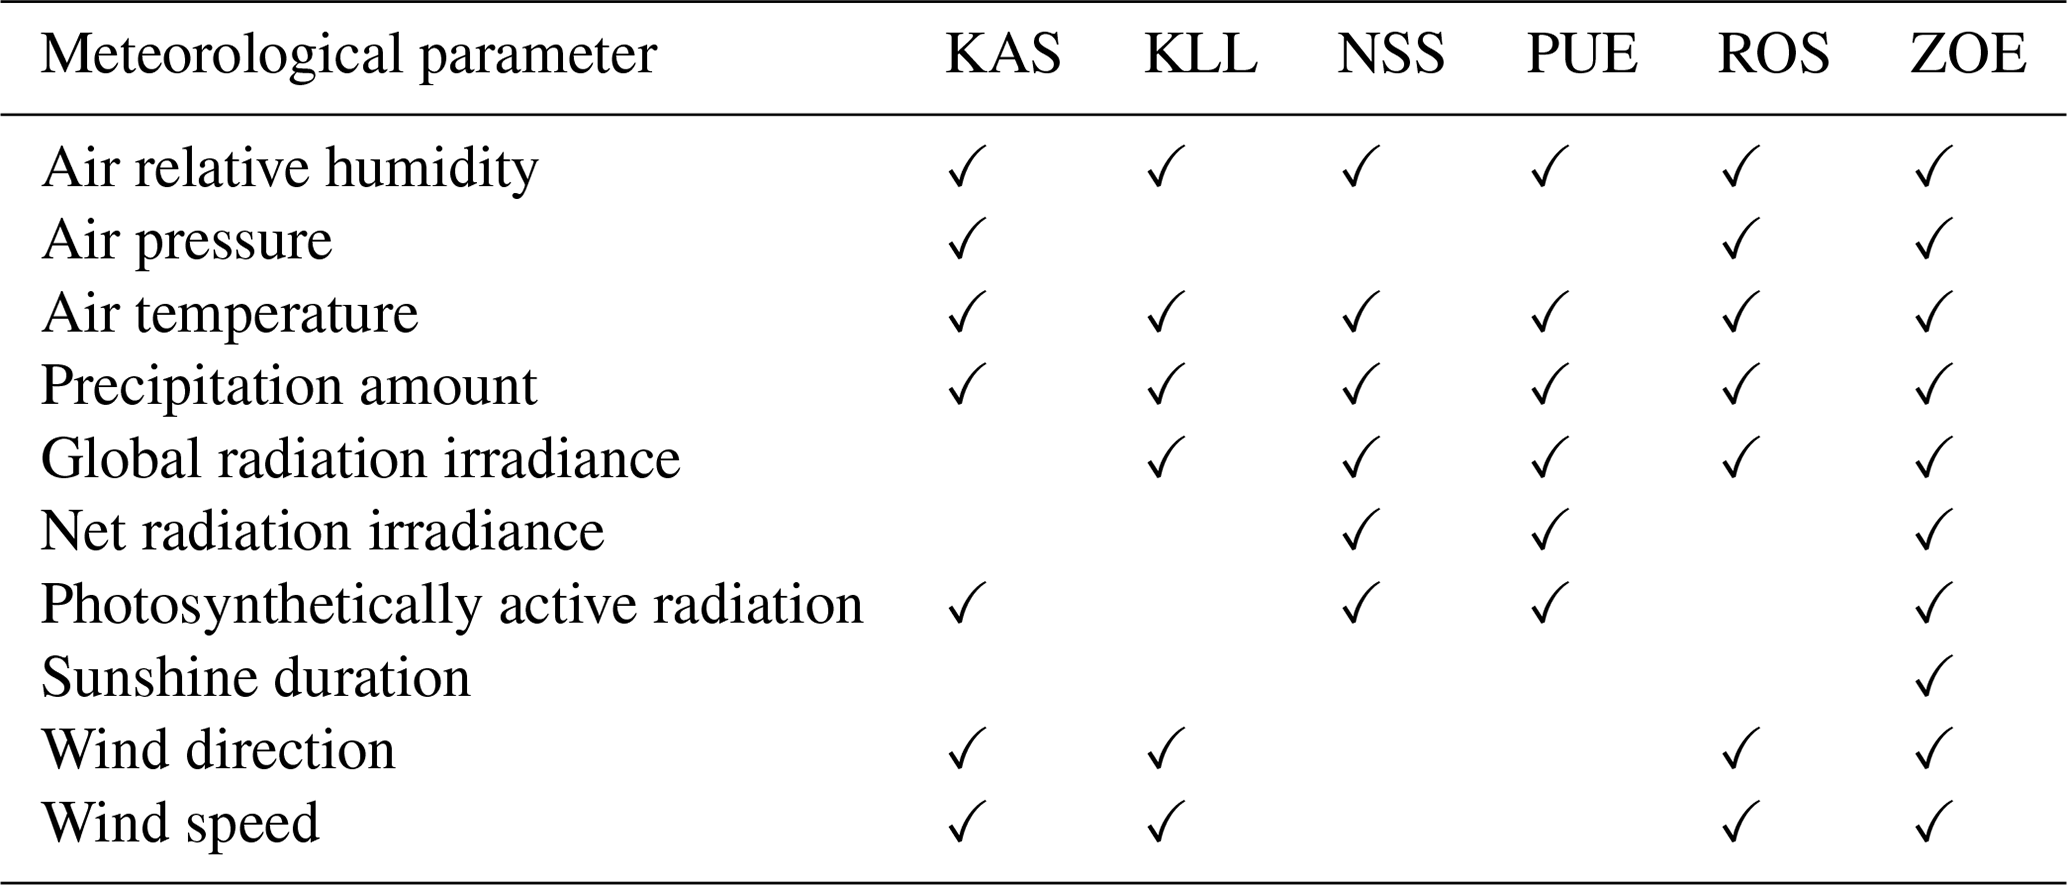
All the meteorological stations are located within the boundaries of the respective sites, except for Klausen-Leopoldsdorf, where the station is a distance of 2.7 km from the site. Meteorological measurements at the wetland sites were implemented next to the eddy covariance tower. In addition to the routine data checks, we compared the measurements with nearby stations where appropriate. Meteorological measurements were detected at a 1 min interval and averaged over half-hour periods, while the rain data were summed. The measurements include air temperature, precipitation, relative humidity, wind speed and direction, air pressure, and several radiation variables (at least global radiation but also shortwave and longwave radiation and photosynthetically active radiation).
Table 2Meteorological parameters measured at the six sites during 2019–2021. Availability is indicated using the ticks. For the parameter names, we refer to the thesaurus at http://vocabs.lter-europe.net/EnvThes/ (last access: 1 March 2024).
We used different types of soil temperature and soil moisture or soil water potential sensors (PT100 or thermoelements for soil temperature, TDR or FDR sensors for soil moisture, and soil water potential sensors). Before we buried the soil temperature or soil moisture and soil water potential sensors in the soil, they had been calibrated or at least tested for consistency. Mostly, we used gravimetric samples to calibrate the TDR and FDR soil moisture sensors. At Zöbelboden, where stony, organic-rich soils are found, we corrected the TDR values using water potential sensor data installed in the same soil profiles together with soil water retention functions derived from undisturbed soil cores. In addition to the regular QC procedures, we checked the data for consistency of the values across the sensors (e.g., along the soil profiles) and compared them with other measurements (air temperature and precipitation). Half-hourly to hourly values are presented.
3.2 Carbon fluxes
3.2.1 Soil CO2 efflux
We measured soil CO2 efflux at five of the seven observation plots. The automated soil CO2 respiration measurement systems are capable of operating autonomously during the snow-free periods. The measurement chambers and measurement systems collected air continuously from the chamber headspace to determine the exchange of CO2 between the soil and atmosphere at the observation plots. At all the sites, we used non-steady-state, non-throughflow chambers (Pumpanen et al., 2004). The chambers at each site measured consecutively every half-hour to hour. In addition to the automated systems, manual flux measurements were also performed, which served to validate the automated measurement systems. Table 3 provides detailed information on the measurement systems used at the sites.
Two different automated chamber systems were used: a LI-COR system and custom-made chambers in combination with LI-COR trace gas analyzers (Table 3). The custom-made soil chambers are equipped with a fan and a thermometer. The controlling unit and the gas analyzer (a CH4 and CO2 LI-COR 7810, a LI-COR 840, or a LI-COR 8100A; LI-COR Biosciences, USA) are located in already existing measurement containers. Remote access to the devices allows the plausibility of the data and chamber leakage to be checked in real time. We visited the instruments at weekly to monthly intervals, with maintenance and supervision work that included checks of the tightness of the gas lines, connections, and chamber lids; correct closing and opening of the chambers; and the functioning of ventilation fans inside the chambers, the ingrowth of the plants, and the gas analyzers. The gas analyzers were calibrated once a year in the laboratory with calibration gases. We uninstalled and serviced the chambers during winter, but the frames stayed permanently on site to avoid disturbance of the soil.
At Klausen-Leopoldsdorf, the gas fluxes of readings were determined using the R package gasfluxes (Fuss, 2020). At Rosalia, a custom-made Python script was used. Zöbelboden and Kaserstattalm processed the data with SoilFluxPro software (LI-COR Biosciences, 2019). We used the R2 values of the fitted empirical models to select valid data. We refer the reader to Table 3 and the metadata published with the data for detailed specifications.
Table 3Specifications of the different soil CO2 flux systems following the standard of Bond-Lamberty et al. (2021).
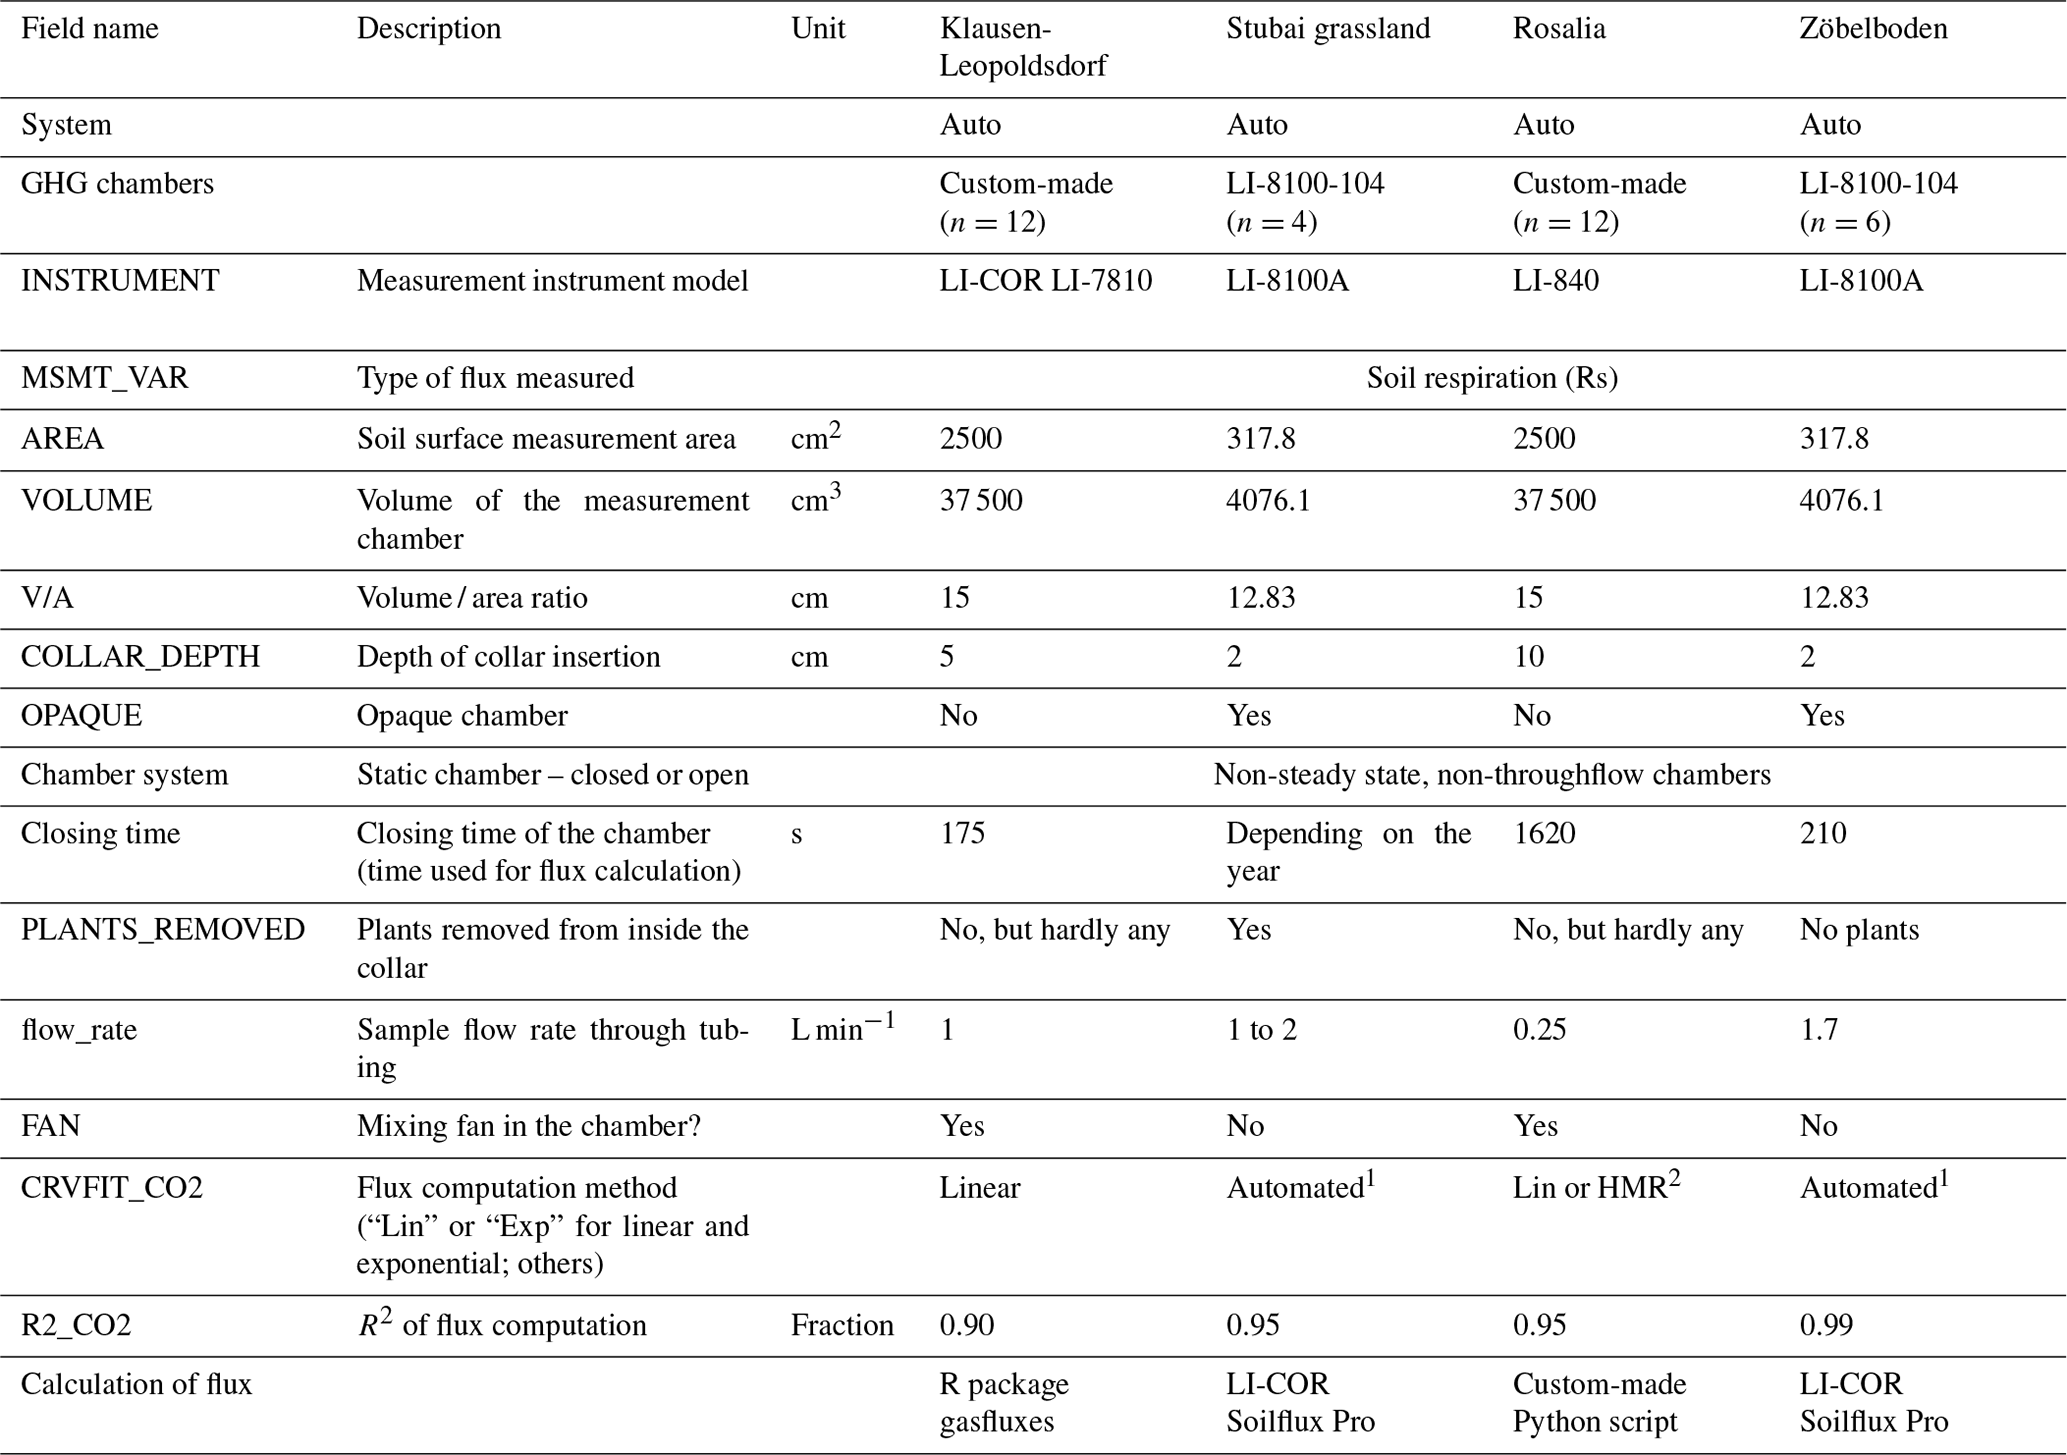
1 “Exp” in the data indicates that the exponential fit was better than the linear fit (Exp_SSN < Lin_SSN). “Lin” indicates that the linear fit was better after the maximum number of iterations; the nonlinear coefficients have therefore been derived from the linear fit. 2 Hutchinson and Mosier (1981).
3.2.2 Eddy covariance measurements at the wetland sites
At both wetland sites, Pürgschachen Moor and Lake Neusiedl, fully equipped eddy covariance systems are in place. Wind speed and direction were measured using a three-axis ultrasonic anemometer (WindMaster Pro, Gill Instruments; Lymington, UK). CO2 and H2O mixing ratios were measured using the closed-path infrared gas analyzer LI-7200, and CH4 was detected with the open-path gas analyzer LI-7700 (both LI-COR Inc; Lincoln, USA). The measurements were taken with a sampling rate of 10 Hz. We installed the devices at vegetation-dependent heights, i.e., 3.05 m a.g.l. in Pürgschachen Moor and 8.6 m a.g.l. in the reed belt of Lake Neusiedl. The eddy covariance devices were checked daily via remote access and calibrated once a year in the lab and monthly in the field.
The data contain half-hourly eddy covariance flux measurements for CO2, CH4, and water vapor. We calculated the fluxes with the EddyPro® software package in express mode with default settings (double rotation, block averaging, and covariance maximization) as part of the SmartFlux® 2 system, providing fully corrected and valid fluxes with quality flags ranging from 0 to 2. The final flags are based on a combination of partial flags accounting for steady-state and turbulent conditions. Only fluxes flagged with 0 (best-quality fluxes) or 1 (fluxes suitable for general analysis, such as annual budgets) are shown in the data. Gaps in the dataset result from missing micrometeorological conditions from data cleaning due to the quality flags or power breakdowns.
3.3 Radial tree stem growth at forest sites
Zöbelboden, Klausen-Leopoldsdorf, and Rosalia used the DR26 sensor (EMS; Brno, Czech Republic), and Stubai used Ecomatic DC2 (Germany) to register the radial stem increment in a 15 to 30 min interval. Maintenance involved avoiding any shift of the sensor during the operation. Concerning data quality and control methods, the Mini32 software (EMS; Brno, Czech Republic) includes graphical features for processing the measured stem increment data. Data processing comprises outlier detection by visual assessment based on expert knowledge. Ecomatic raw data were treated with custom-made R scripts. In both cases, unrealistic values beyond the slowly increasing linear growth rates were assessed visually and deleted.
We used the eLTER RI data specification that is available on Zenodo (https://www.doi.org/10.5281/zenodo.6373409, Peterseil and Geiger, 2020). Apart from the data files, the measurement locations (station files) and sensors (methods) are included.
Table 4Comparison between the long-term (1980–2010) meteorological drought (SPEI – Standardized Precipitation Evapotranspiration Index) and the measurement years during the growing season (May–September). Significant differences between these years and the long-term averages are shown: p<0.001, p<0.005, and * p<0.01 according to the Mann–Whitney U test. The SPEI was calculated using a 30 d window at daily resolution using gridded data: https://data.hub.geosphere.at/dataset/winfore-v2-1d-1km (last access: 1 September 2024) (Haslinger and Bartsch, 2016). Negative values indicate dry years.
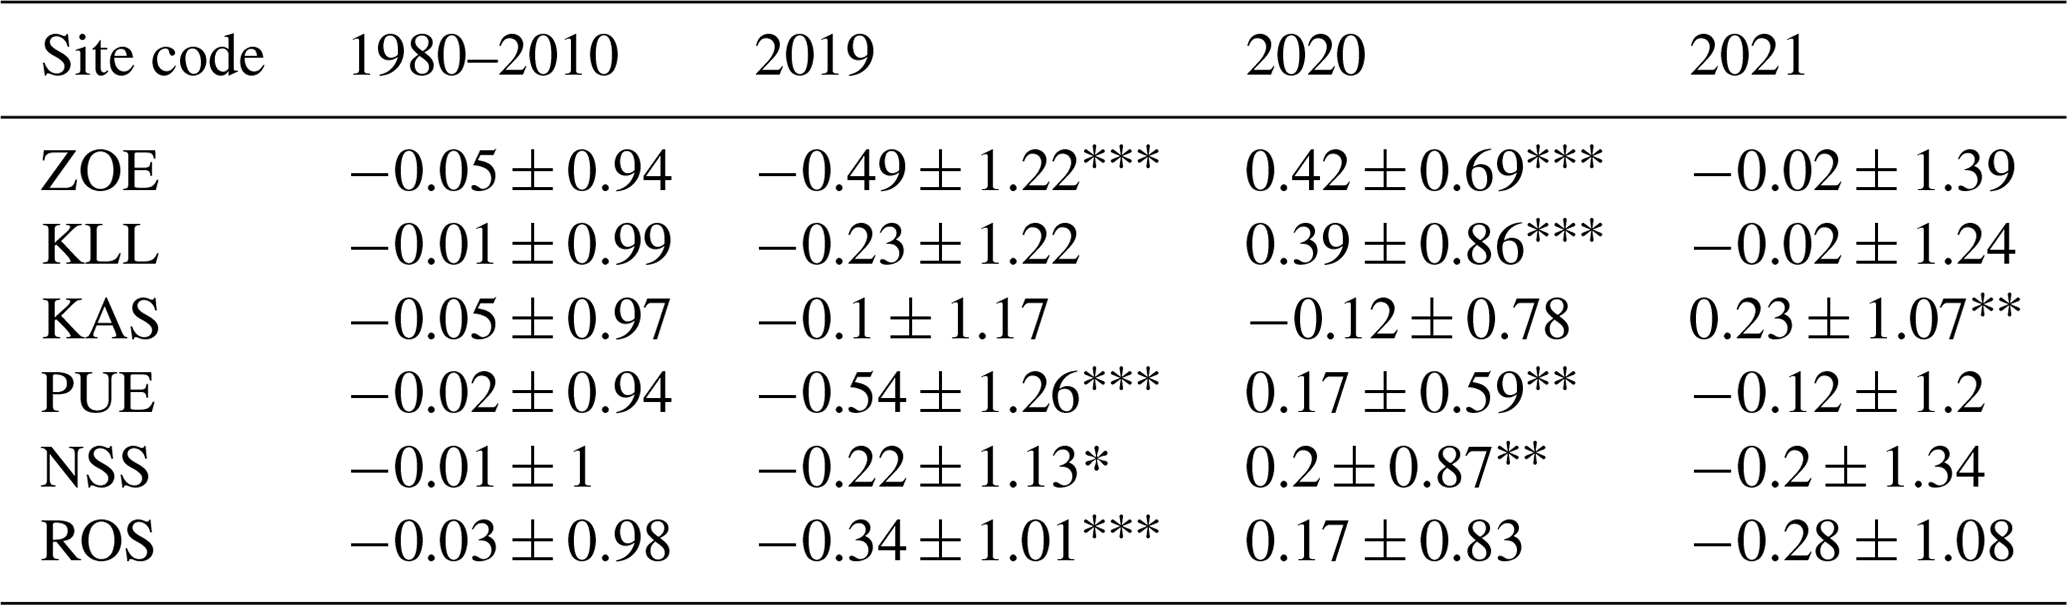
We used the gridded SPEI (Standardized Precipitation Evapotranspiration Index) from the Austrian Meteorological Service (https://data.hub.geosphere.at/dataset/winfore-v2-1d-1km; Haslinger and Bartsch, 2016) to compare the long-term average water availability during the growing season (1980–2010; May to September) with those in the measurement years (Table 4). The advantage of the SPEI is that it accounts for precipitation and temperature via evapotranspiration and integrates this over a given temporal window (we used 30 d) (Vicente-Serrano et al., 2010). Note that the gridded SPEI dataset is based on meteorological data for the period 1960 to 2021. Accordingly, the year 2021 was closest to the long-term average, the year 2020 was a particularly wet year, and the year 2019 was drier than the average. However, there were differences between the sites: in particular, the mountain station in the Tyrolian Alps (Kaserstattalm forest – KAS) did not experience significant deviations from the SPEI compared to the long-term average, apart from a wet growing season in 2021. The SPEI at the site in the Viennese Forest (Klausen-Leopoldsdorf – KLL) does not indicate that, in 2019, the growth period was particularly dry.
The monthly precipitation and temperature patterns are shown in Fig. 2, and the soil water content and soil temperatures are shown in Figs. 3 and 5. Differences in the seasonal precipitation patterns between the measurement years vary a lot between the sites. In summary, lower precipitation occurred in 2019 and 2021 than in 2020 at all the sites. The mean annual temperature maxima (90th percentile) were 0.3 (KAS) and 2.3 °C (ZOE) higher in the year 2019 than in 2020. These differences were lower when comparing the year 2021 with 2019 (≤0.6 °C). In accordance with the SPEI, precipitation, and temperature, the soil water content showed the lowest values during the year 2019, followed by the year 2021, and the soil temperatures were higher during these years (Figs. 3 and 4).
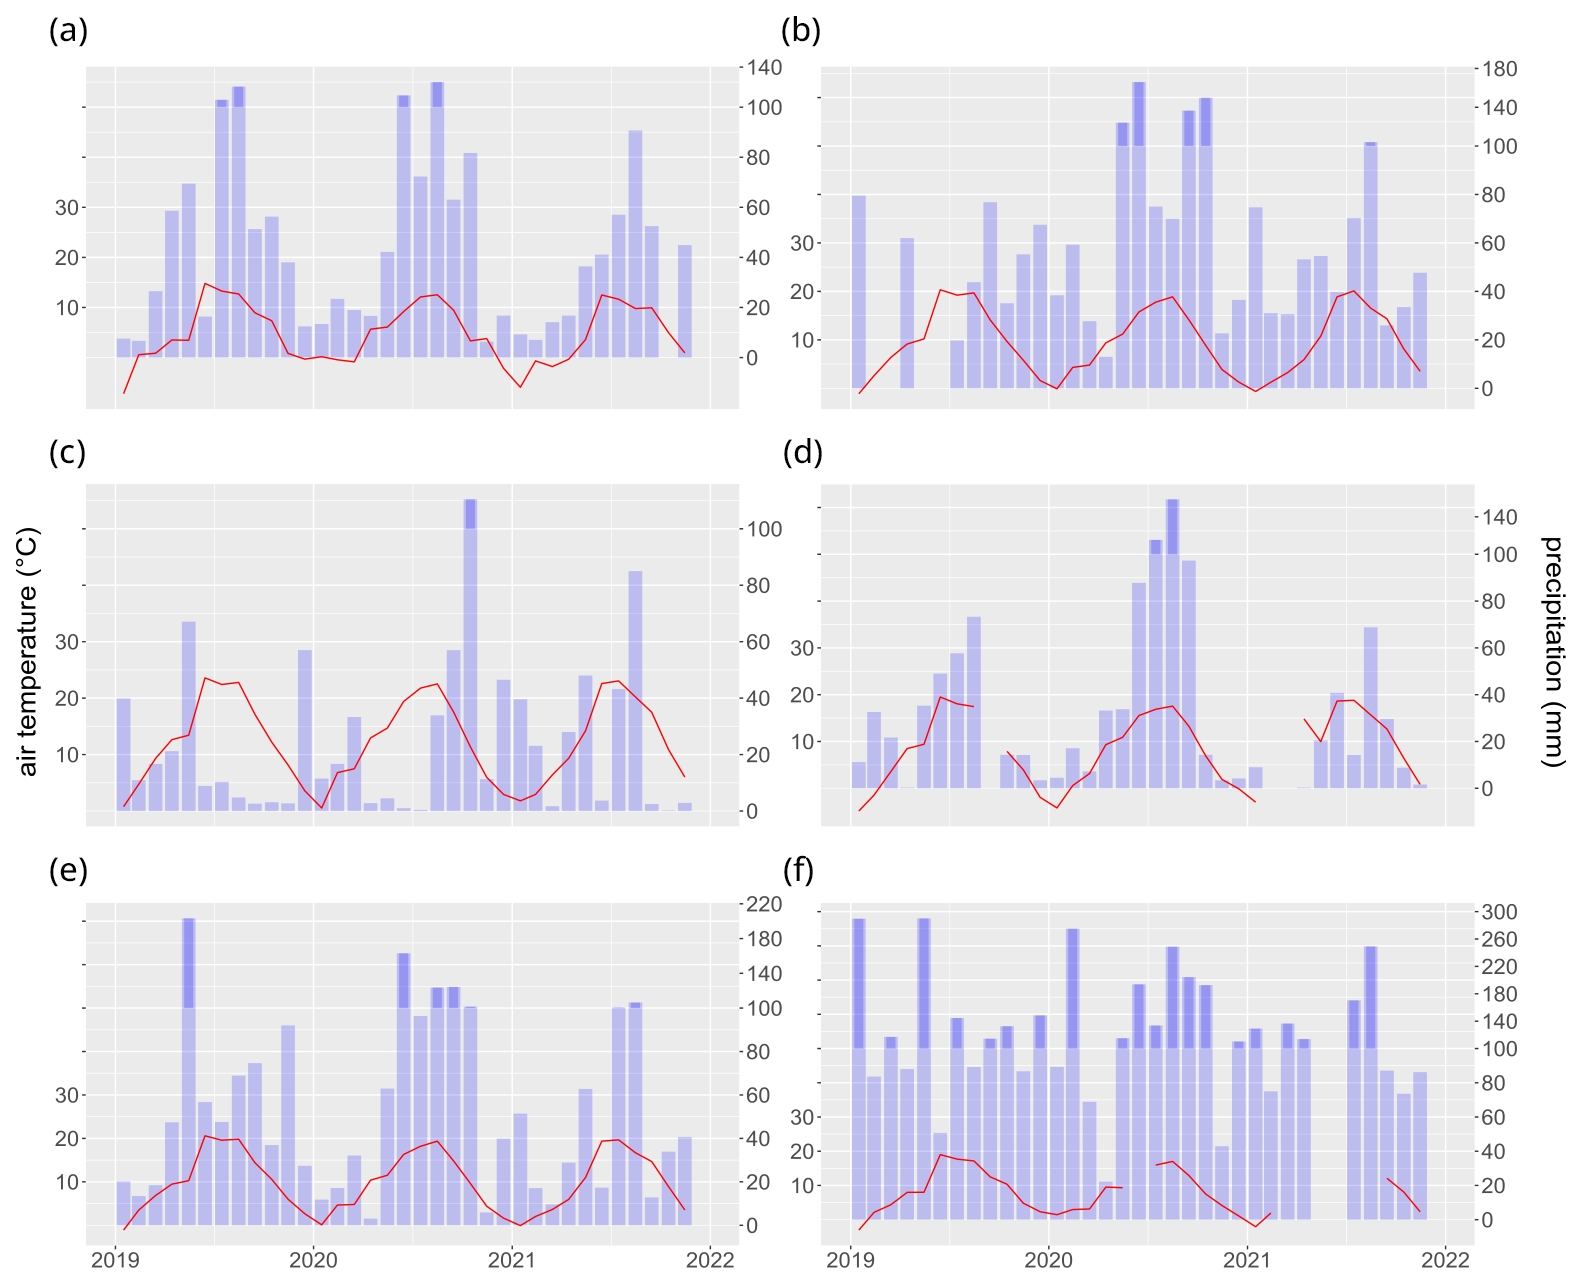
Figure 2Monthly mean air temperature (red line) and monthly precipitation sums (blue bars; different scales >100 mm) in the six regions.
We measured soil CO2 respiration at four sites (Fig. 4). The complexity of automated chamber measurements resulted in some data gaps at KAS and ROS during the years 2019 and 2021, respectively. At KLL and ZOE, the respiration data cover most of the snow-free period (see Table 2).
At KLL and ZOE, we compared the automatically measured soil CO2 flux rates with manual measurements. For both sites, we used a portable infrared gas analyzer (EGM-4) connected to a manual soil respiration chamber (SRC) (PP Systems International Inc., Amesbury, MA, USA). The two measurement sites were equipped with permanently installed collars (KLL: randomly distributed within the site in the immediate vicinity of the automated chambers (n=12), area = 284 cm2, and insertion depth 2 cm; ZOE: regular grid covering the entire plot (n=30), area = 78 cm2, and insertion depth 1.5 cm). The chamber closure times were 60 and 100 s at KLL and ZOE, respectively. Manual measurements were taken in monthly intervals from October 2019 to June 2020 at KLL as well as from June 2019 to October 2019 (monthly interval) and in July 2020 (diurnal variation) at ZOE. Soil respiration (Rs) was calculated automatically by fitting a linear (KLL) or quadratic (ZOE: quadratic fit for flow rates >0.2 ppm s−1, or a linear fit was used) function to the increasing CO2 headspace concentration.
The mean CO2 fluxes of the automated chambers correlated well with the manually measured fluxes during the measurement campaigns (Fig. 3). At KLL, the R2 value was 0.95 (p value < 0.05, t test), and at ZOE it was 0.85 (p value < 0.05, t test). At both sites, neither the intercept nor the slope was significantly different from 0 (p value > 0.2, t test) or 1 (p value > 0.49, t test), respectively. At ZOE, the spatial flux variation was much higher than at KLL (Fig. 3a and b). This reflects the heterogeneity of the soil conditions (shallow rendzic Leptosols with interspersed fine-scale patches of deeper soils), the canopy gaps (with lower root density), and the uneven distribution of litter due to the steep slope of the plot (Kobler et al., 2019). This heterogeneity is more effectively captured by the manual measurement (n=30) than by the automated chambers (n=6). In summary, we conclude that the spatial variation in CO2 fluxes was higher at both sites than the difference in fluxes caused by the measurement devices (Fig. 3).
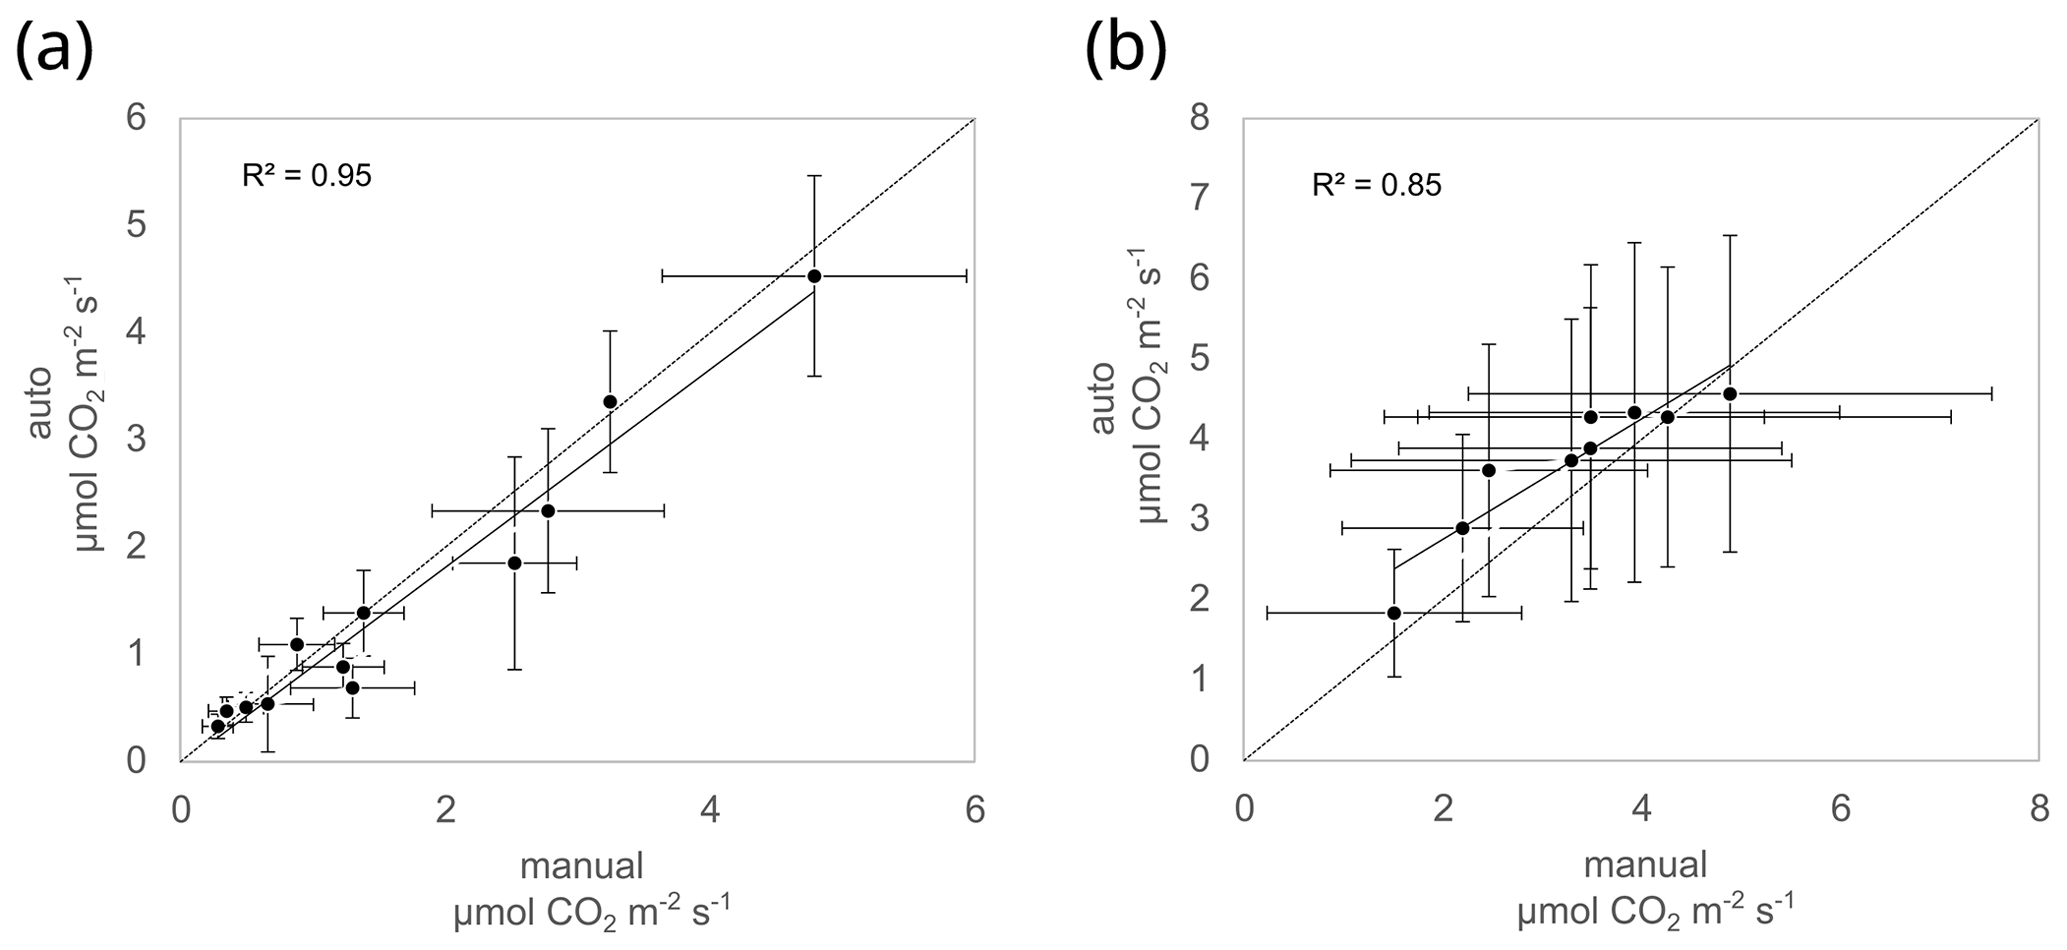
Figure 3Comparison of automated and manual soil CO2 fluxes at (a) Klausen-Leopoldsdorf and (b) Zöbelboden. See Table 3 for the specification of the automated chamber data. The error bars indicate the spatial variation (standard deviations).
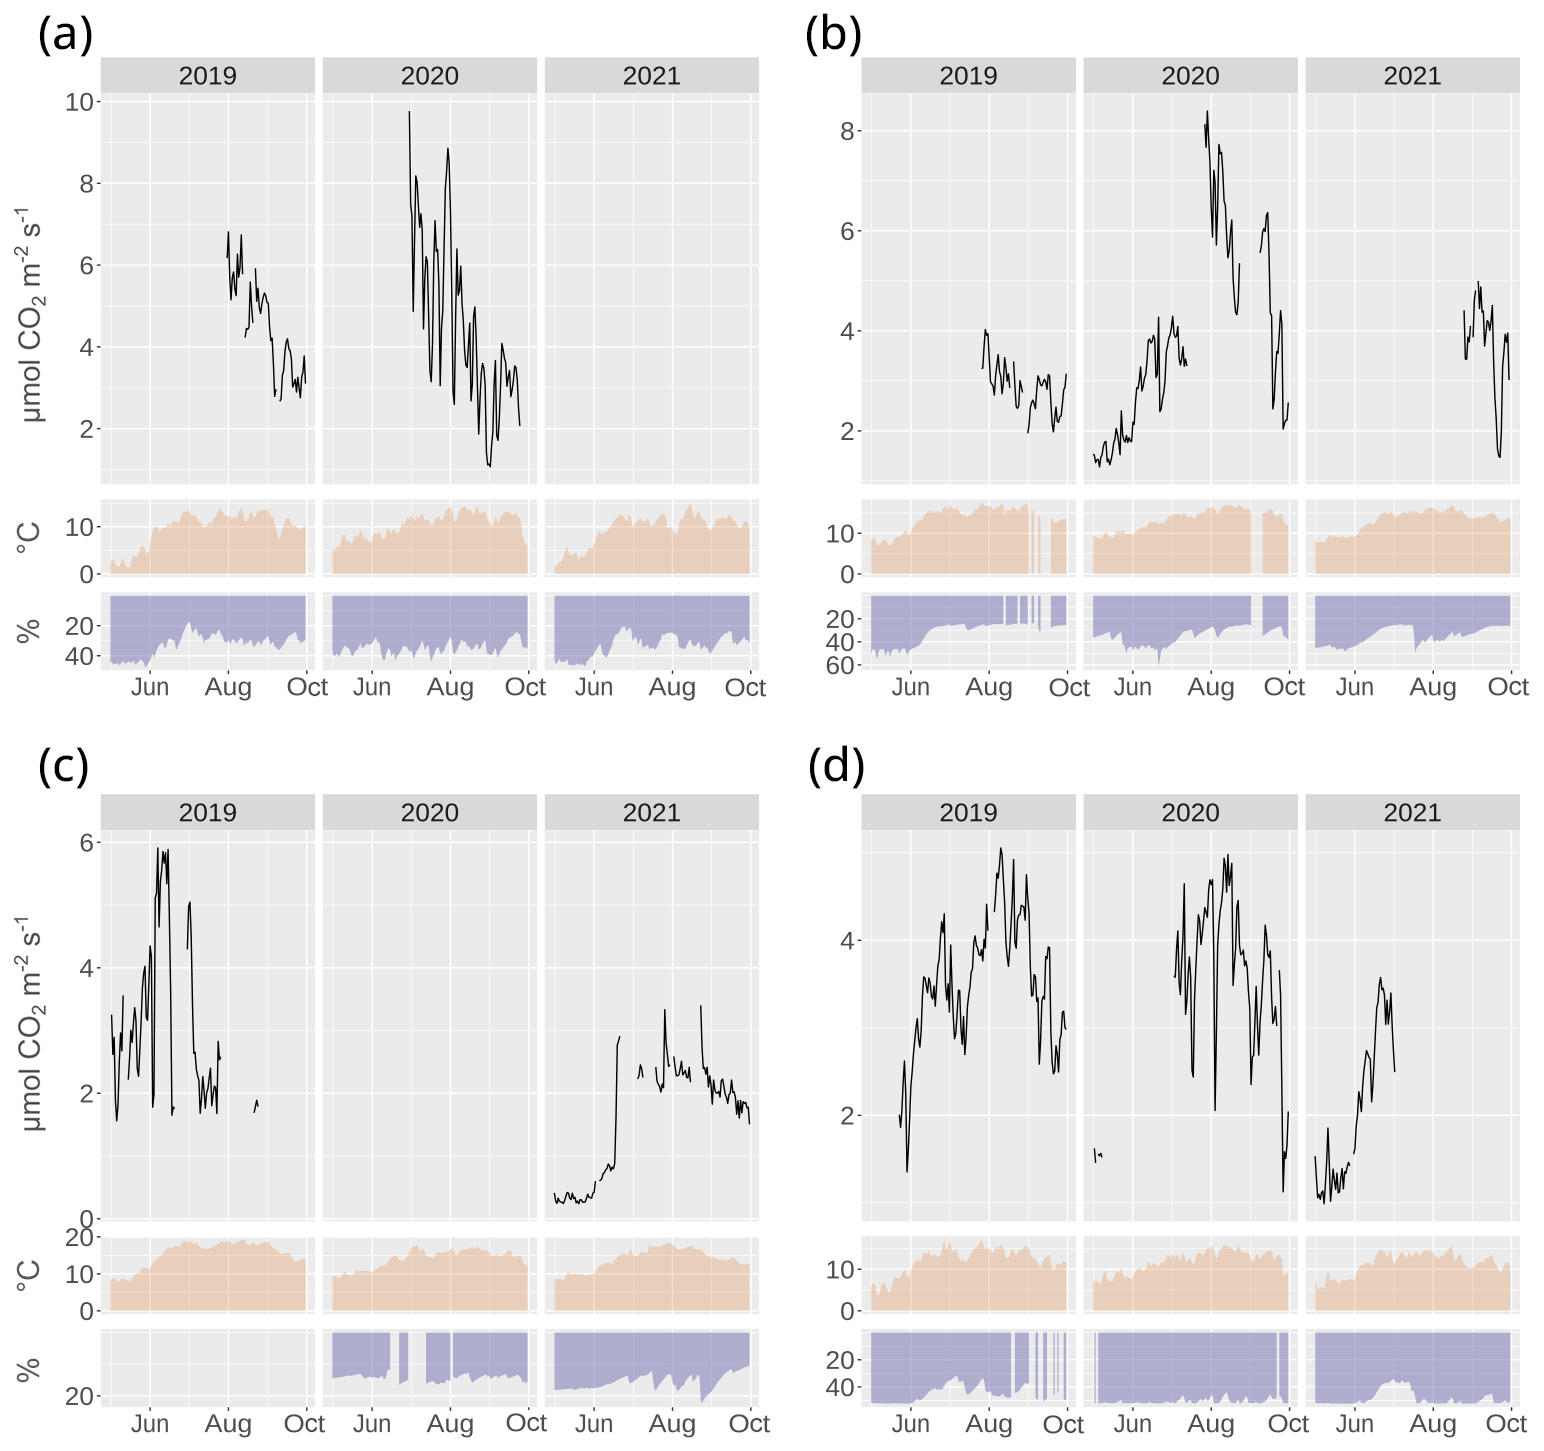
Figure 4Soil CO2 respiration (mean of all the chambers), soil temperature (mean of the sensors at 5–15 cm depth), and soil water content (mean of the sensors at 5–15 cm depth) at the forested sites Kaserstattalm forest (KAS), Klausen-Leopoldsdorf (KLL), Rosalia (ROS), and Zöbelboden (ZOE).
Soil CO2 fluxes are temperature-dependent and thus follow the seasonal changes in soil temperature (Fig. 4). Their additional limitation through soil water availability for plant metabolism and microbial activity is usually much less pronounced in these temperate-zone ecosystems (Bahn et al., 2008; Chen et al., 2014). For a detailed interpretation of the CO2 respiration fluxes and their limiting factors, we refer the reader to the citations listed in the “Site descriptions” section. Drollinger et al. (2019) provide interpretations of the patterns of CO2 and CH4 fluxes, measured using eddy covariance techniques at the bog site Pürgschachen Moor (PUE). Likewise, Baur et al. (2024) provide interpretations for the reed belt of Lake Neusiedl (NSS). Stem growth limitations can, on the other hand, be closely related to soil water content, particularly at sites with relatively low precipitation, such as KLL (Fig. 6). For an in-depth study of drought-related effects on tree growth at the treeline forest at Kaserstattalm (KAS), we refer the reader to Oberleitner et al. (2022).
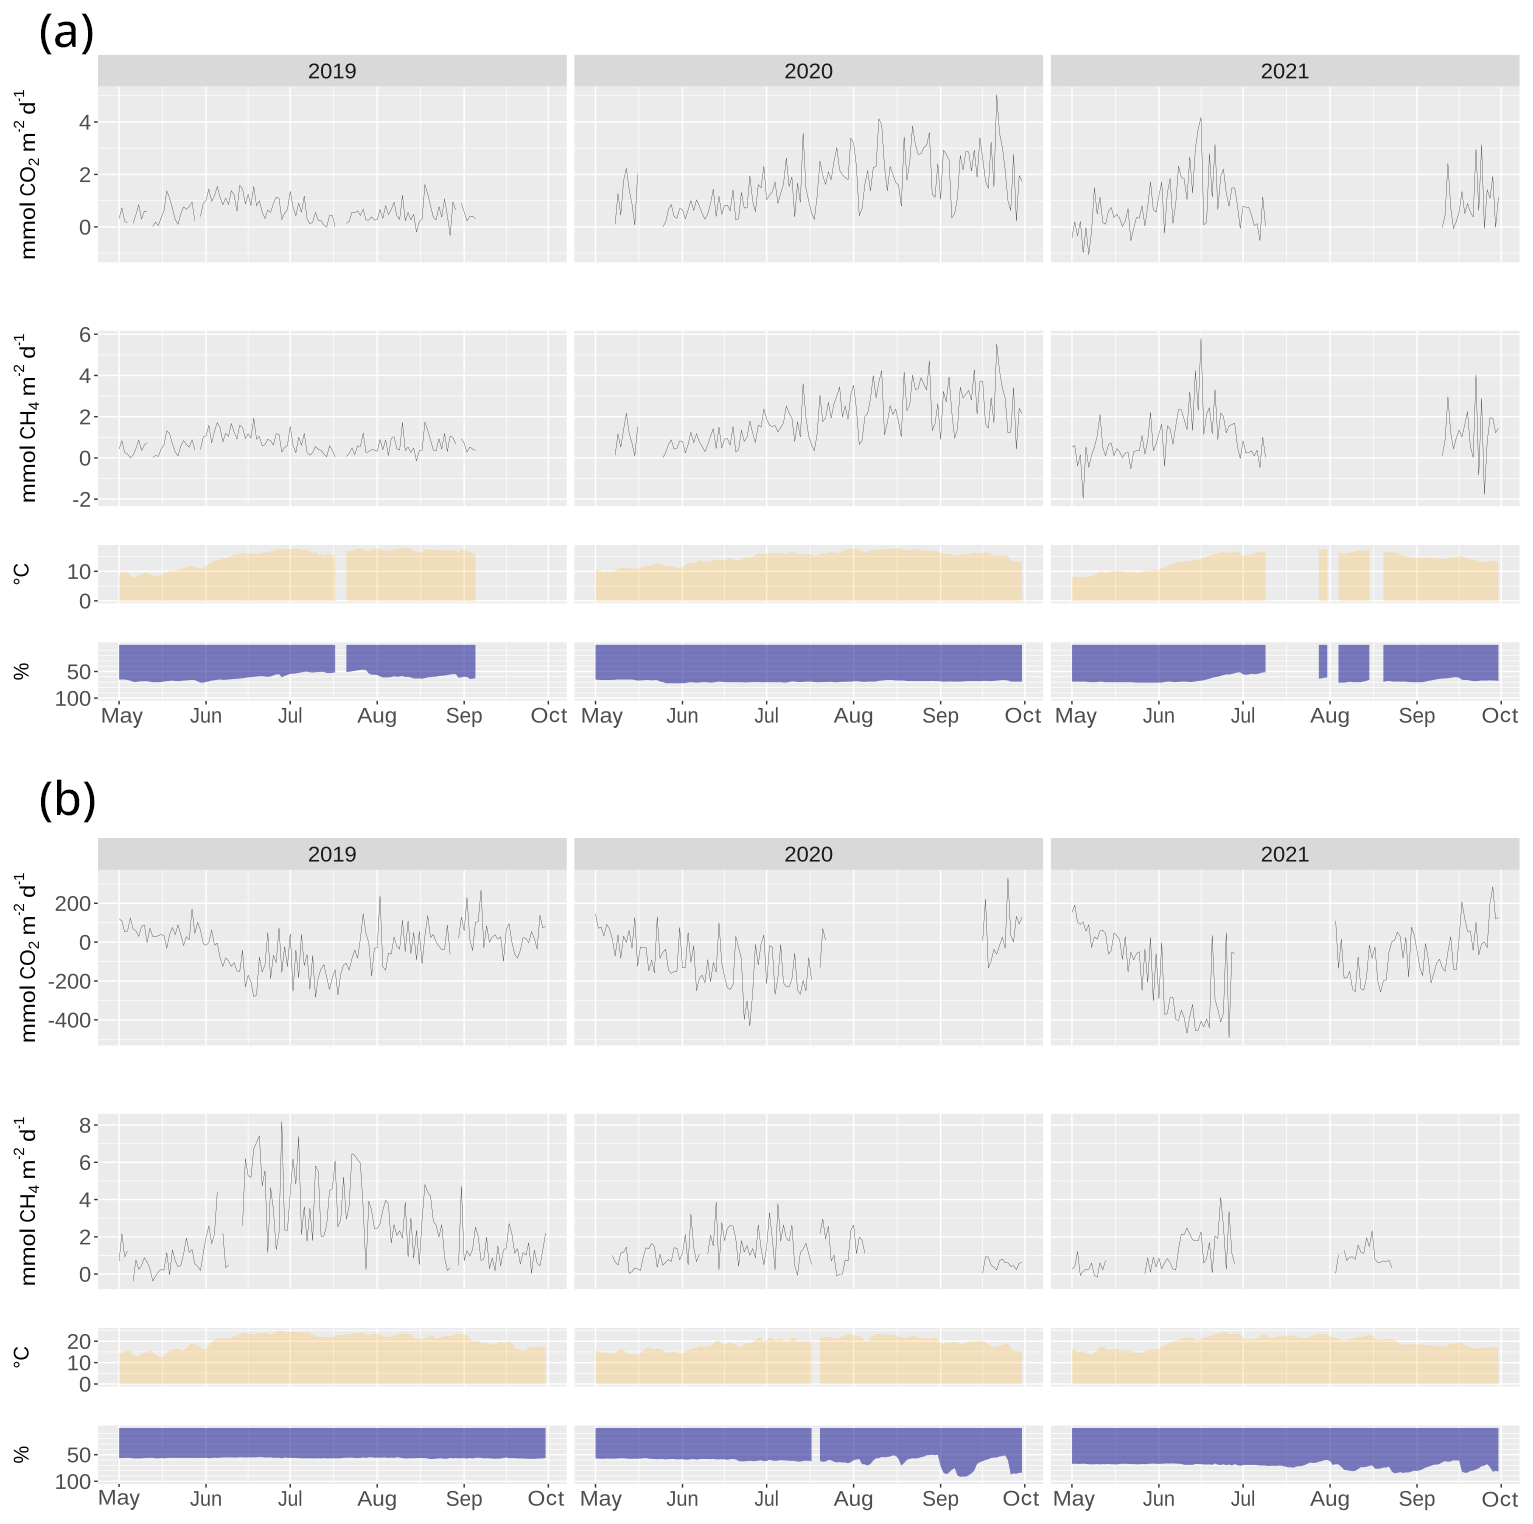
Figure 5CO2 and CH4 fluxes at the sites Pürgschachen Moor peat bog (PUE) and Lake Neusiedl reed zone (NLL), together with their temperature and soil water content.
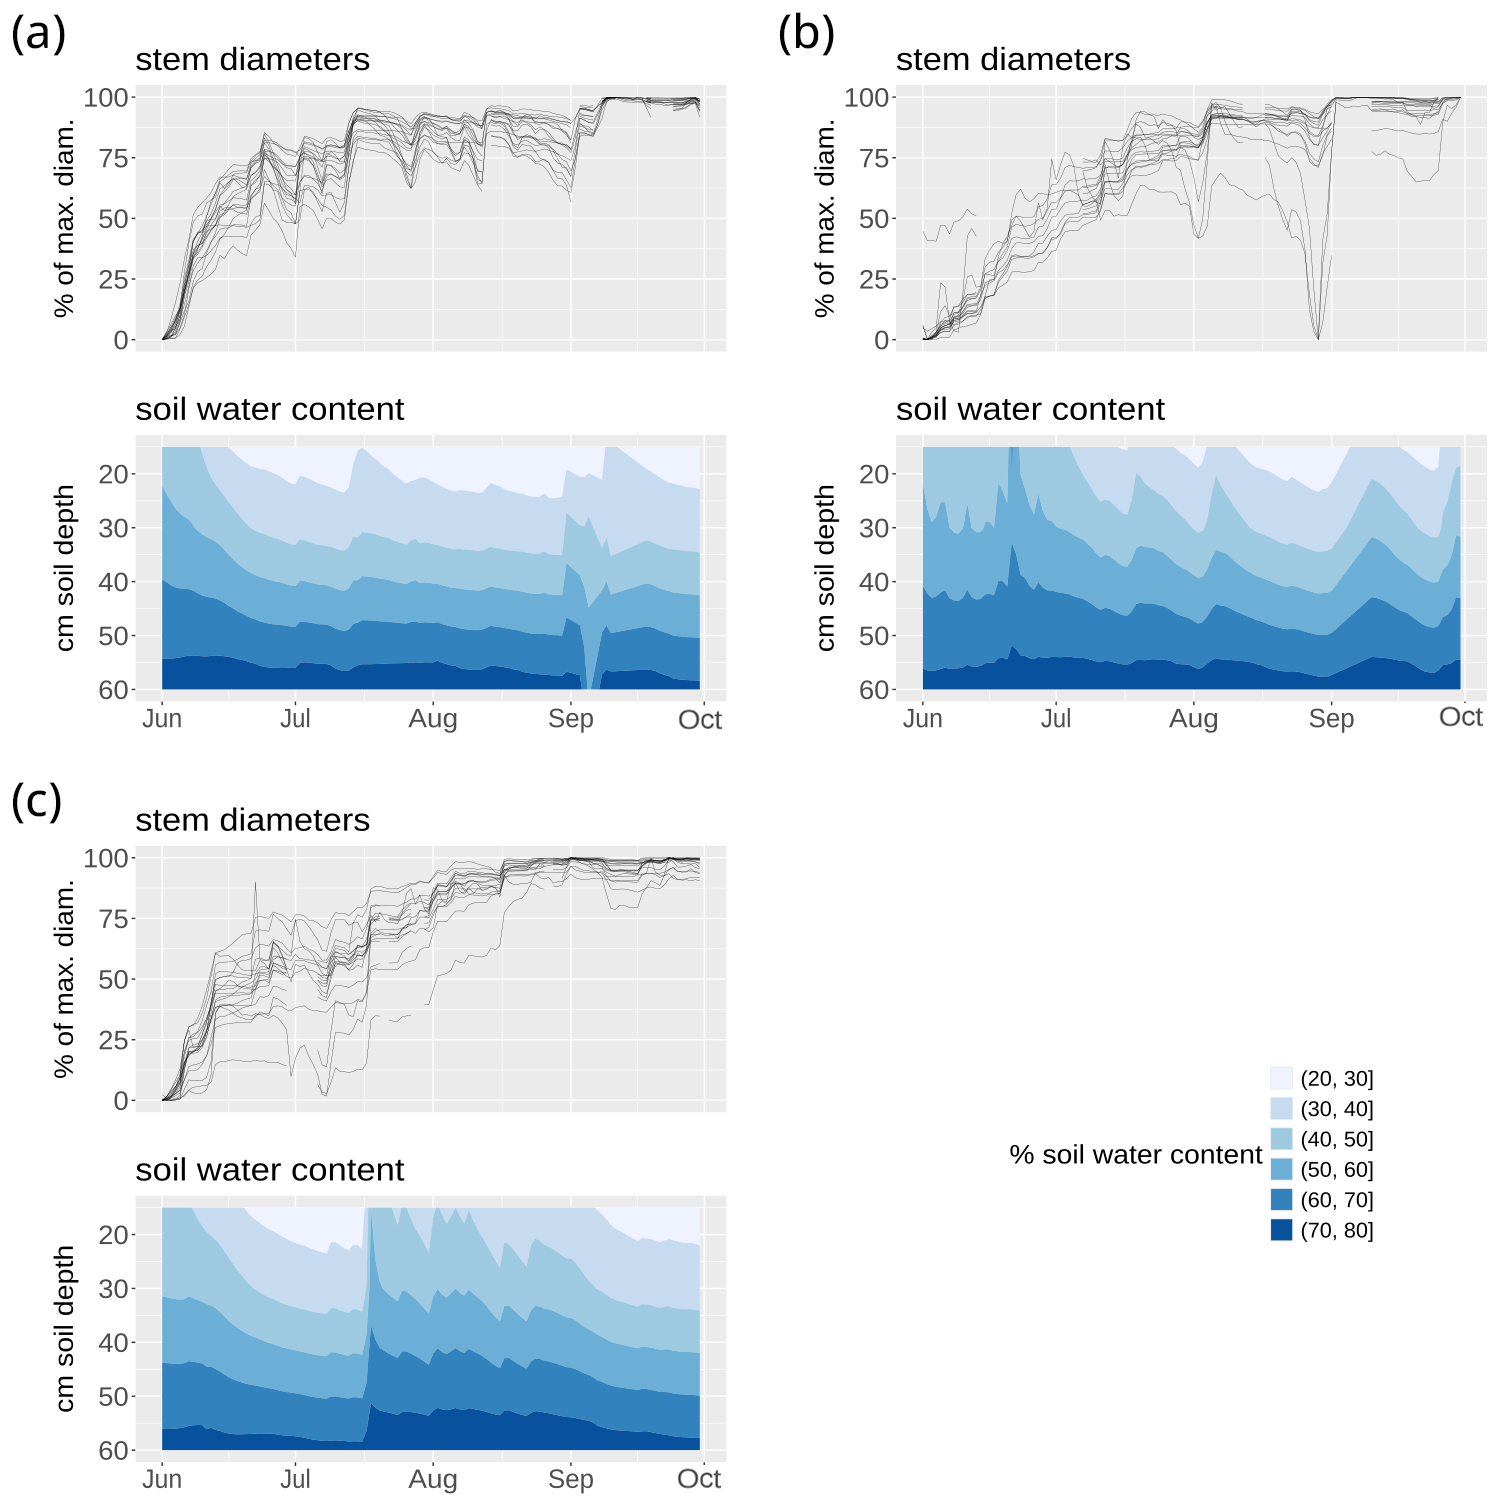
Figure 6Relative stem diameters and soil moisture at the site Klausen-Leopoldsdorf (KLL) during the years 2019–2021. Stem diameter values were scaled to an annual amplitude of 100.
6.1 Data access
The data and metadata are accessible at B2SHARE (https://b2share.eudat.eu/, last access: 1 March 2024), a service provided by the EUDAT Collaborative Data Infrastructure. The DOIs of the datasets are listed in Table 5. The site metadata in DEIMS-SDR (Table 1) are part of the data, so the site information can be accessed easily. In chapter 8, we provide a Jupyter notebook to download and merge the single datasets and to visualize the parameters.

6.2 Data visualization and workflow integration
The software stack used to store, import, and quality-control the data provided is built in a PostgreSQL database with a post-GIS extension. The database structure is derived from the Time Series Management (TSM) system developed by the Research Center Jülich (Wohner et al., 2021) and was originally deployed within the LTER-CWN project, but it was re-purposed to better fit the needs of the data management and working group. Now, to import and quality-control the data, a number of Python scripts deployed in a Jupyter environment are used. This also includes scripts for visualizing the data on the fly in Jupyter.
We provide baseline ecosystem data related to the carbon cycle and capture naturally occurring ECEs across various ecosystem types typical of Austria and other regions of central Europe. Such datasets are scarce because the measurements are demanding in terms of maintenance and funding. Automated soil respiration data at a high temporal resolution, as we report here, are rare too owing to a lack of dedicated monitoring or research infrastructures (Bond-Lamberty et al., 2021). However, soil CO2 respiration constitutes the second-largest flux in the global carbon cycle and hence is key in estimating ecosystem responses to ECEs (Bond-Lamberty and Thomson, 2010). In addition, we provide soil temperature and moisture measurements at the same resolution, these being key variables determining soil respiration (Pumpanen et al., 2015). High-resolution measurements of tree stem circumference have been developed as complementary data to relate drought stress to changes in carbon allocation in trees (Zweifel, 2016; Zweifel et al., 2021). The microclimatic, soil, and tree physiological data are complemented by CO2 and CH4 fluxes between the vegetation and the atmosphere measured with eddy covariance techniques of the two wetland sites.
Our data are particularly useful for drought-related research. Triggered by the pan-European drought of 2003 (Ciais et al., 2005), a key scientific question has been how droughts affect greenhouse gas sinks and sources in ecosystems (Rödenbeck et al., 2020; Reichstein et al., 2013; Anderegg et al., 2020). Droughts usually reduce soil respiration due to the decrease in autotrophic respiration but also because soil microbial activity drops due to water limitation (Grünzweig et al., 2022). Furthermore, rewetting can result in pulses of high soil respiration (Borken and Matzner, 2009). Drought effects on the ecosystem C cycle can persist for years (Kannenberg et al., 2020; Müller and Bahn, 2022), and novel approaches are being developed to assimilate high-resolution data for understanding and quantifying such legacies (Yu et al., 2022; Fu et al., 2020). In this context, the availability of long-term, high-resolution measurements of key ecosystem parameters is key to understanding and quantifying the effects of recurrent droughts (Oberleitner et al., 2022). While the 3-year data with the usual measurement gaps occurring in field campaigns in rather difficult terrain can only capture aspects of drought-related effects to some extent, they represent a valuable baseline.
The sites presented here are currently being upgraded for implementation in the European Research Infrastructure for Integrated European Long-Term Ecosystem, critical zone and socio-ecological Research (eLTER RI), together with another ∼ 200 sites in Europe (Mirtl et al., 2018). Climate change impacts on ecosystem processes, including the carbon cycle, are among the targeted research areas that eLTER RI will focus on. The measurements resulting in the data presented here will continue in the future under the umbrella of eLTER RI. Compiling longer-term data series depends on the availability of already validated datasets – as presented here – before eLTER RI is operational. Furthermore, long-term ecosystem observations already exist at these sites with regard to water and the nitrogen cycle, allowing for a contextual interpretation of the trends seen in C-related parameters.
Combining several research and monitoring activities at already heavily instrumented sites not only saves money but also enlarges the data analysis portfolio (Futter et al., 2023; Kulmala, 2018). Even though we provide eddy covariance data for two of our sites, Austria is not part of the Integrated Carbon Observation System (ICOS). A combination of data capturing long-term boundary layer exchange of C with soil C fluxes, microclimate, and, in forests, tree physiological data obviously has great potential (Zweifel et al., 2023; Ramonet et al., 2020). Hence, using the sites simultaneously with other research infrastructures such as ICOS that provide high-quality eddy covariance measurements would obviously be ideal, the more so because European research infrastructures follow findable, accessible, interoperable, and reusable (FAIR) data principles (Wilkinson et al., 2016).
While the eLTER RI data infrastructure is still in development, we comply with the standards already implemented. We used DEIMS-SDR (https://deims.org/, last access: 1 March 2024) as the catalog documenting the sites (Wohner et al., 2019, 2022). It issues persistent identifiers for sites (see Table 1) that allow us to uniquely identify sites across research projects and networks. Tools are being developed to query available information about sites programmatically (Oggioni et al., 2023; Wohner, 2023), thus providing contextual ecosystem information.
A Jupyter notebook for accessing, merging, and visualizing the data from all the sites is available at https://gist.github.com/1O/9bbe44a03f12801c6c742202b005db57 (Offenthaler, 2024).
TD, MB, EDP, ID, ME, KG, GG, AnM, JI, BK, JK, ArM, GP, SV, SZB, AZ, and SG designed the measurements and carried them out. CW and JP designed and constructed the database. KK, SV, and GP customized and filled the database. IO developed the Jupyter notebook. TD prepared the manuscript with contributions from all the co-authors.
The contact author has declared that none of the authors has any competing interests.
Publisher’s note: Copernicus Publications remains neutral with regard to jurisdictional claims made in the text, published maps, institutional affiliations, or any other geographical representation in this paper. While Copernicus Publications makes every effort to include appropriate place names, the final responsibility lies with the authors.
We want to thank Manfred Bogner, Thomas Lehner, Christian Holtermann, Thomas Kager, and Josef Gasch for their technical implementation and assistance.
The infrastructure and its implementation were funded by the Austrian Research Promotion Agency (FFG, project LTER-CWN: Long-Term Ecosystem Research for Carbon, Water, and Nitrogen; grant no. 858024). The Austrian Academy of Sciences (ÖAW) supported all the authors in the data compilation and writing of the manuscript through its eLTER 2022 Call (Earth System Sciences – ESS). Thomas Dirnböck, Johannes Kobler, Karl Knaebel, Johannes Peterseil, Christoph Wohner, and Eugenio Diaz-Pines received additional funding from the EU Horizon 2020 project eLTER PLUS (grant no. 871128), and Eugenio Diaz-Pines received funding from the EXAFOR project (Austrian Climate Research Programme's 12th Call; grant no. KR19AC0K17557).
This paper was edited by Hanqin Tian and reviewed by two anonymous referees.
Anderegg, W. R. L., Trugman, A. T., Badgley, G., Anderson, C. M., Bartuska, A., Ciais, P., Cullenward, D., Field, C. B., Freeman, J., Goetz, S. J., Hicke, J. A., Huntzinger, D., Jackson, R. B., Nickerson, J., Pacala, S., and Randerson, J. T.: Climate-driven risks to the climate mitigation potential of forests, Science, 368, eaaz7005, https://doi.org/10.1126/science.aaz7005, 2020.
Baatz, R., Hendricks Franssen, H. J., Euskirchen, E., Sihi, D., Dietze, M., Ciavatta, S., Fennel, K., Beck, H., Lannoy, G. de, Pauwels, V. R. N., Raiho, A., Montzka, C., Williams, M., Mishra, U., Poppe, C., Zacharias, S., Lausch, A., Samaniego, L., van Looy, K., Bogena, H., Adamescu, M., Mirtl, M., Fox, A., Goergen, K., Naz, B. S., Zeng, Y., and Vereecken, H.: Reanalysis in Earth System Science: Toward Terrestrial Ecosystem Reanalysis, Rev. Geophys., 59, e2020RG000715, https://doi.org/10.1029/2020RG000715, 2021.
Bahn, M. and Ingrisch, J.: Accounting for Complexity in Resilience Comparisons: A Reply to Yeung and Richardson, and Further Considerations, Trends Ecol. Evol., 33, 649–651, https://doi.org/10.1016/j.tree.2018.06.006, 2018.
Bahn, M., Rodeghiero, M., Anderson-Dunn, M., Dore, S., Gimeno, C., Drösler, M., Williams, M., Ammann, C., Berninger, F., Flechard, C., Jones, S., Balzarolo, M., Kumar, S., Newesely, C., Priwitzer, T., Raschi, A., Siegwolf, R., Susiluoto, S., Tenhunen, J., Wohlfahrt, G., and Cernusca, A.: Soil Respiration in European Grasslands in Relation to Climate and Assimilate Supply, Ecosystems, 11, 1352–1367, https://doi.org/10.1007/s10021-008-9198-0, 2008.
Bahn, M., Schmitt, M., Siegwolf, R., Richter, A., and Brüggemann, N.: Does photosynthesis affect grassland soil-respired CO2 and its carbon isotope composition on a diurnal timescale?, New Phytol., 182, 451–460, https://doi.org/10.1111/j.1469-8137.2008.02755.x, 2009.
Baur, P. A., Henry Pinilla, D., and Glatzel, S.: Is ebullition or diffusion more important as methane emission pathway in a shallow subsaline lake?, Sci. Total Environ., 912, 169112, https://doi.org/10.1016/j.scitotenv.2023.169112, 2024.
Bernal, S., Hedin, L. O., Likens, G. E., Gerber, S., and Buso, D. C.: Complex response of the forest nitrogen cycle to climate change, P. Natl. Acad. Sci. USA, 109, 3406–3411, https://doi.org/10.1073/pnas.1121448109, 2012.
Bond-Lamberty, B. and Thomson, A.: Temperature-associated increases in the global soil respiration record, Nature, 464, 579–582, 2010.
Bond-Lamberty, B., Christianson, D. S., Crystal-Ornelas, R., Mathes, K., and Pennington, S. C.: A reporting format for field measurements of soil respiration, Ecol. Inform., 62, 101280, https://doi.org/10.1016/j.ecoinf.2021.101280, 2021.
Borken, W. and Matzner, E.: Reappraisal of drying and wetting effects on C and N mineralization and fluxes in soil, Glob. Change Biol., 15, 808–824, 2009.
Buchsteiner, C., Baur, P. A., and Glatzel, S.: Spatial Analysis of Intra-Annual Reed Ecosystem Dynamics at Lake Neusiedl Using RGB Drone Imagery and Deep Learning, Remote Sensing, 15, 3961, https://doi.org/10.3390/rs15163961, 2023.
Chen, S., Zou, J., Hu, Z., Chen, H., and Lu, Y.: Global annual soil respiration in relation to climate, soil properties and vegetation characteristics: Summary of available data, Agr. Forest Meteorol., 198–199, 335–346, https://doi.org/10.1016/j.agrformet.2014.08.020, 2014.
Ciais, P., Reichstein, M., Viovy, N., Granier, A., Ogée, J., Allard, V., Aubinet, M., Buchmann, N., Bernhofer, C., Carrara, A., Chevallier, F., Noblet, N. de, Friend, A. D., Friedlingstein, P., Grünwald, T., Heinesch, B., Keronen, P., A. Knohl, A., Krinner, G., Loustau, D., Manca, G., Matteucci, G., Miglietta, F., Ourcival, J. M., Papale, D., Pilegaard, K., Rambal, S., Seufert, G., Soussana, J. F., M. J. Sanz, Schulze, E.-D., Vesala, T., and Valentini, R.: Europe-wide reduction in primary productivity caused by the heat and drought in 2003, Nature, 437, 529–533, 2005.
Diaz-Pines, E.: Rosalia forest (Austria) – meteorological data (2020–2021), EUDAT [data set], https://doi.org/10.23728/b2share.96c52c247eb846deb2a3ec5e2c27b4f1, 2024a.
Diaz-Pines, E.: Rosalia forest (Austria) – soil CO2 respiration (2019–2021), EUDAT [data set], https://doi.org/10.23728/b2share.d167e727abe947abbc8efc04057557f6, 2024b.
Diaz-Pines, E.: Rosalia forest (Austria) – soil temperature and soil moisture (2019–2021), EUDAT [data set], https://doi.org/10.23728/b2share.c68143fc11224c44ae5529bd6a35a76d, 2024c.
Diaz-Pines, E.: Rosalia forest (Austria) – tree increments (2019–2021), EUDAT [data set], https://doi.org/10.23728/b2share.d0d185f1eb184ae48f6d06ea9aa8dbdf, 2024d.
Dirnböck, T., Kobler, J., Kraus, D., Grote, R., and Kiese, R.: Impacts of management and climate change on nitrate leaching in a forested karst area, J. Environ. Manage., 165, 243–252, https://doi.org/10.1016/j.jenvman.2015.09.039, 2016.
Dirnböck, T., Haase, P., Mirtl, M., Pauw, J., and Templer, P. H.: Contemporary International Long-Term Ecological Research (ILTER) – from biogeosciences to socio-ecology and biodiversity research, Reg. Environ. Change, 19, 309–311, https://doi.org/10.1007/s10113-018-1445-0, 2019.
Dirnböck, T., Brielmann, H., Djukic, I., Geiger, S., Hartmann, A., Humer, F., Kobler, J., Kralik, M., Liu, Y., Mirtl, M., and Pröll, G.: Long- and Short-Term Inorganic Nitrogen Runoff from a Karst Catchment in Austria, Forests, 11, 1112, https://doi.org/10.3390/f11101112, 2020.
Drollinger, S., Maier, A., and Glatzel, S.: Interannual and seasonal variability in carbon dioxide and methane fluxes of a pine peat bog in the Eastern Alps, Austria, Agr. Forest Meteorol., 275, 69–78, https://doi.org/10.1016/j.agrformet.2019.05.015, 2019.
Frank, D., Reichstein, M., Bahn, M., Thonicke, K., Frank, D., Mahecha, M. D., Smith, P., van der Velde, M., Vicca, S., Babst, F., Beer, C., Buchmann, N., Canadell, J. G., Ciais, P., Cramer, W., Ibrom, A., Miglietta, F., Poulter, B., Rammig, A., Seneviratne, S. I., Walz, A., Wattenbach, M., Zavala, M. A., and Zscheischler, J.: Effects of climate extremes on the terrestrial carbon cycle: concepts, processes and potential future impacts, Glob. Change Biol., 21, 2861–2880, https://doi.org/10.1111/gcb.12916, 2015.
Fu, Z., Ciais, P., Bastos, A., Stoy, P. C., Yang, H., Green, J. K., Wang, B., Yu, K., Huang, Y., Knohl, A., Šigut, L., Gharun, M., Cuntz, M., Arriga, N., Roland, M., Peichl, M., Migliavacca, M., Cremonese, E., Varlagin, A., Brümmer, C., La Gourlez de Motte, L., Fares, S., Buchmann, N., El-Madany, T. S., Pitacco, A., Vendrame, N., Li, Z., Vincke, C., Magliulo, E., and Koebsch, F.: Sensitivity of gross primary productivity to climatic drivers during the summer drought of 2018 in Europe, Philos. T. R. Soc. Lon. B, 375, 20190747, https://doi.org/10.1098/rstb.2019.0747, 2020.
Fuchslueger, L., Bahn, M., Fritz, K., Hasibeder, R., and Richter, A.: Experimental drought reduces the transfer of recently fixed plant carbon to soil microbes and alters the bacterial community composition in a mountain meadow, New Phytol., 201, 916–927, https://doi.org/10.1111/nph.12569, 2014.
Fürst, J., Nachtnebel, H. P., Gasch, J., Nolz, R., Stockinger, M. P., Stumpp, C., and Schulz, K.: Rosalia: an experimental research site to study hydrological processes in a forest catchment, Earth Syst. Sci. Data, 13, 4019–4034, https://doi.org/10.5194/essd-13-4019-2021, 2021.
Fuss, R.: gasfluxes: greenhouse gas flux calculation from chamber measurements, Thünen GitLab – DMZ [code], https://git-dmz.thuenen.de/fuss/gasfluxes (last access: 1 December 2020), 2020.
Futter, M. N., Dirnböck, T., Forsius, M., Bäck, J. K., Cools, N., Diaz-Pines, E., Dick, J., Gaube, V., Gillespie, L. M., Högbom, L., Laudon, H., Mirtl, M., Nikolaidis, N., Poppe Terán, C., Skiba, U., Vereecken, H., Villwock, H., Weldon, J., Wohner, C., and Alam, S. A.: Leveraging research infrastructure co-location to evaluate constraints on terrestrial carbon cycling in northern European forests, Ambio, 52, 1819–1831, https://doi.org/10.1007/s13280-023-01930-4, 2023.
Gartner, K. and Gollobich, G.: Klausen-Leopoldsdorf (Austria) – tree increments (2019–2021), EUDAT [data set], https://doi.org/10.23728/b2share.68d84a913f0c4875be5c680ad4d6959e, 2024.
Gartner, K., Gollobich, G., and Zolles, A.: Klausen-Leopoldsdorf (Austria) – meteorological data (2019–2021), EUDAT [data set], https://doi.org/10.23728/b2share.8f872a37513c4768b16ce755eca4bb57, 2024a.
Gartner, K., Gollobich, G., and Zolles, A.: Klausen-Leopoldsdorf (Austria) – soil temperature and soil moisture (2019–2021), EUDAT [data set], https://doi.org/10.23728/b2share.8d49c0b557f1455a9e66689e035b8cce, 2024b.
Gillespie, L. M., Triches, N. Y., Abalos, D., Finke, P., Zechmeister-Boltenstern, S., Glatzel, S., and Díaz-Pinés, E.: Land inclination controls CO2 and N2O fluxes, but not CH4 uptake, in a temperate upland forest soil, SOIL, 9, 517–531, https://doi.org/10.5194/soil-9-517-2023, 2023.
Gillespie, L. M., Kolari, P., Kulmala, L., Leitner, S. M., Pihlatie, M., Zechmeister-Boltenstern, S., and Díaz-Pinés, E.: Drought effects on soil greenhouse gas fluxes in a boreal and a temperate forest, Biogeochemistry, 167, 155–175, https://doi.org/10.1007/s10533-024-01126-2, 2024.
Glatzel, S., Worrall, F., Boothroyd, I. M., and Heckman, K.: Comparison of the transformation of organic matter flux through a raised bog and a blanket bog, Biogeochemistry, 167, 443–459, https://doi.org/10.1007/s10533-023-01093-0, 2023.
Gollob, C., Ritter, T., and Nothdurft, A.: Comparison of 3D Point Clouds Obtained by Terrestrial Laser Scanning and Personal Laser Scanning on Forest Inventory Sample Plots, Data, 5, 103, https://doi.org/10.3390/data5040103, 2020.
Grünzweig, J. M., Boeck, H. J. de, Rey, A., Santos, M. J., Adam, O., Bahn, M., Belnap, J., Deckmyn, G., Dekker, S. C., Flores, O., Gliksman, D., Helman, D., Hultine, K. R., Liu, L., Meron, E., Michael, Y., Sheffer, E., Throop, H. L., Tzuk, O., and Yakir, D.: Dryland mechanisms could widely control ecosystem functioning in a drier and warmer world, Nat. Ecol. Evol., 6, 1064–1076, https://doi.org/10.1038/s41559-022-01779-y, 2022.
Hartl-Meier, C., Zang, C., Büntgen, U., Esper, J., Rothe, A., Göttlein, A., Dirnböck, T., and Treydte, K.: Uniform climate sensitivity in tree-ring stable isotopes across species and sites in a mid-latitude temperate forest, Tree Physiol., 35, 4–15, https://doi.org/10.1093/treephys/tpu096, 2014.
Hasibeder, R., Fuchslueger, L., Richter, A., and Bahn, M.: Summer drought alters carbon allocation to roots and root respiration in mountain grassland, New Phytol., 205, 1117–1127, https://doi.org/10.1111/nph.13146, 2015.
Haslinger, K. and Bartsch, A.: Creating long-term gridded fields of reference evapotranspiration in Alpine terrain based on a recalibrated Hargreaves method, Hydrol. Earth Syst. Sci., 20, 1211–1223, https://doi.org/10.5194/hess-20-1211-2016, 2016.
Heimann, M. and Reichstein, M.: Terrestrial ecosystem carbon dynamics and climate feedbacks, Nature, 451, 289–292, 2008.
Hutchinson, G. L. and Mosier, A. R.: Improved Soil Cover Method for Field Measurement of Nitrous Oxide Fluxes, Soil Sci. Soc. Am. j., 45, 311–316, https://doi.org/10.2136/sssaj1981.03615995004500020017x, 1981.
Ingrisch, J. and Bahn, M.: Towards a Comparable Quantification of Resilience, Trends Ecol. Evol., 33, 251–259, https://doi.org/10.1016/j.tree.2018.01.013, 2018.
Ingrisch, J. and Bahn, M.: Kaserstattalm (Austria) – forest soil CO2 respiration (2019–2020), EUDAT [data set], https://doi.org/10.23728/b2share.cfe8c7ad1965433484650ea9026512ca, 2024a.
Ingrisch, J. and Bahn, M.: Kaserstattalm (Austria) – forest tree increments (2019–2021), EUDAT [data set], https://doi.org/10.23728/b2share.0e3eed54ff30418f8720806b5f05cca9, 2024b.
Ingrisch, J. and Bahn, M.: Kaserstattalm (Austria) – meteorological data (2019–2021), EUDAT [data set], https://doi.org/10.23728/b2share.77462914dc0b43cb8c24a967e6851665, 2024c.
Ingrisch, J. and Bahn, M.: Kaserstattalm (Austria) – soil temperature and soil moisture (2019–2021), EUDAT [data set], https://doi.org/10.23728/b2share.026d76094e8f4512b09b35b7a0d2a9d7, 2024d.
Ingrisch, J., Karlowsky, S., Anadon-Rosell, A., Hasibeder, R., König, A., Augusti, A., Gleixner, G., and Bahn, M.: Land Use Alters the Drought Responses of Productivity and CO2 Fluxes in Mountain Grassland, Ecosystems, 21, 689–703, https://doi.org/10.1007/s10021-017-0178-0, 2018.
Ingrisch, J., Karlowsky, S., Hasibeder, R., Gleixner, G., and Bahn, M.: Drought and recovery effects on belowground respiration dynamics and the partitioning of recent carbon in managed and abandoned grassland, Glob. Change Biol., 26, 4366–4378, https://doi.org/10.1111/gcb.15131, 2020.
IPCC: Climate Change 2021: The Physical Science Basis: Contribution of Working Group I to the Sixth Assessment Report of the Intergovernmental Panel on Climate Change, Cambridge University Press, Cambridge, United Kingdom and New York, NY, USA, https://www.ipcc.ch/report/ar6/wg1/downloads/ (last access: 1 March 2024), 2021.
Kannenberg, S. A., Schwalm, C. R., and Anderegg, W. R. L.: Ghosts of the past: how drought legacy effects shape forest functioning and carbon cycling, Ecol. Lett., 23, 891–901, https://doi.org/10.1111/ele.13485, 2020.
Kitzler, B. and Hofbauer, A.: Klausen-Leopoldsdorf (Austria) – soil CO2 respiration for the years (2019–2020), EUDAT [data set], https://doi.org/10.23728/b2share.5286bd1bc6aa491f874b9bb12d1c5673, 2024.
Kitzler, B., Zechmeister-Boltenstern, S., Holtermann, C., Skiba, U., and Butterbach-Bahl, K.: Controls over N2O, NOx and CO2 fluxes in a calcareous mountain forest soil, Biogeosciences, 3, 383–395, https://doi.org/10.5194/bg-3-383-2006, 2006.
Knierzinger, W., Drescher-Schneider, R., Knorr, K.-H., Drollinger, S., Limbeck, A., Brunnbauer, L., Horak, F., Festi, D., and Wagreich, M.: Anthropogenic and climate signals in late-Holocene peat layers of an ombrotrophic bog in the Styrian Enns valley (Austrian Alps), E&G Quaternary Sci. J., 69, 121–137, https://doi.org/10.5194/egqsj-69-121-2020, 2020.
Kobler, J., Zehetgruber, B., Dirnböck, T., Jandl, R., Mirtl, M., and Schindlbacher, A.: Effects of aspect and altitude on carbon cycling processes in a temperate mountain forest catchment, Landscape Ecol., 34, 325–340, https://doi.org/10.1007/s10980-019-00769-z, 2019.
Kobler, J., Dirnböck, T., and Pröll, G.: Zöbelboden (Austria) – meteorological data (2019–2021), EUDAT [data set], https://doi.org/10.23728/b2share.762e665273234b129d09ef017416bcfb, 2024a.
Kobler, J., Dirnböck, T., and Pröll, G.: Zöbelboden (Austria) – soil CO2 respiration for the years (2019–2021), EUDAT [data set], https://doi.org/10.23728/b2share.4f44006b932142e68981106a016f1f56, 2024b.
Kobler, J., Dirnböck, T., and Pröll, G.: Zöbelboden (Austria) – soil temperature and soil moisture (2019–2021), EUDAT [data set], https://doi.org/10.23728/b2share.46e19191ce9c427d90f48ce38f56a0e1, 2024c.
Kröel-Dulay, G., Mojzes, A., Szitár, K., Bahn, M., Batáry, P., Beier, C., Bilton, M., Boeck, H. J. de, Dukes, J. S., Estiarte, M., Holub, P., Jentsch, A., Schmidt, I. K., Kreyling, J., Reinsch, S., Larsen, K. S., Sternberg, M., Tielbörger, K., Tietema, A., Vicca, S., and Peñuelas, J.: Field experiments underestimate aboveground biomass response to drought, Nature Ecology & Evolution, 6, 540–545, https://doi.org/10.1038/s41559-022-01685-3, 2022.
Kulmala, M.: Build a global Earth observatory, Nature, 553, 21–23, https://doi.org/10.1038/d41586-017-08967-y, 2018.
Leitner, S., Minixhofer, P., Inselsbacher, E., Keiblinger, K. M., Zimmermann, M., and Zechmeister-Boltenstern, S.: Short-term soil mineral and organic nitrogen fluxes during moderate and severe drying–rewetting events, Appl. Soil Ecol., 114, 28–33, https://doi.org/10.1016/j.apsoil.2017.02.014, 2017.
Leitner, S., Dirnböck, T., Kobler, J., and Zechmeister-Boltenstern, S.: Legacy effects of drought on nitrate leaching in a temperate mixed forest on karst, J. Environ. Manage., 262, 110338, https://doi.org/10.1016/j.jenvman.2020.110338, 2020.
LI-COR Biosciences: SoilFluxPro Software: Instruction manual, https://www.licor.com/support/SoilFluxPro/software.html (last access: 1 January 2022), 2019.
Liu, D., Keiblinger, K. M., Leitner, S., Wegner, U., Zimmermann, M., Fuchs, S., Lassek, C., Riedel, K., and Zechmeister-Boltenstern, S.: Response of Microbial Communities and Their Metabolic Functions to Drying–Rewetting Stress in a Temperate Forest Soil, Microorganisms, 7, 129, https://doi.org/10.3390/microorganisms7050129, 2019.
Mahecha, M. D., Gans, F., Sippel, S., Donges, J. F., Kaminski, T., Metzger, S., Migliavacca, M., Papale, D., Rammig, A., and Zscheischler, J.: Detecting impacts of extreme events with ecological in situ monitoring networks, Biogeosciences, 14, 4255–4277, https://doi.org/10.5194/bg-14-4255-2017, 2017.
Maier, A. and Glatzel, S.: Lake Neusiedl (Austria) – eddy flux data (2019–2021), EUDAT [data set], https://doi.org/10.23728/b2share.b83caca3efe44868a1ed49129b4a576a, 2024a.
Maier, A. and Glatzel, S.: Lake Neusiedl (Austria) – meteorological data (2019–2021), EUDAT [data set], https://doi.org/10.23728/b2share.f7176c9ee982464f947d2fe9fb8f389d, 2024b.
Maier, A. and Glatzel, S.: Lake Neusiedl (Austria) – soil temperature and soil moisture (2019–2021), EUDAT [data set], https://doi.org/10.23728/b2share.4e6474cd55f9487d97e3d31e83baa530, 2024c.
Maier, A. and Glatzel, S.: Puergschachen Bog (Austria) – eddy covariance data (2019–2021), EUDAT [data set], https://doi.org/10.23728/b2share.4f783e3ff2884abca5c59960db0b7955, 2024d.
Maier, A. and Glatzel, S.: Puergschachen Bog (Austria) – meteorological data (2019–2021), EUDAT [data set], https://doi.org/10.23728/b2share.5442510ad03e4968afb4e2108e85a64d, 2024e.
Maier, A. and Glatzel, S.: Puergschachen Bog (Austria) – soil temperature and soil moisture (2019–2021), EUDAT [data set], https://doi.org/10.23728/b2share.9380364098d14978b876a87517652d62, 2024f.
Mirtl, M., T. Borer, E., Djukic, I., Forsius, M., Haubold, H., Hugo, W., Jourdan, J., Lindenmayer, D., McDowell, W. H., Muraoka, H., Orenstein, D. E., Pauw, J. C., Peterseil, J., Shibata, H., Wohner, C., Yu, X., and Haase, P.: Genesis, goals and achievements of Long-Term Ecological Research at the global scale: A critical review of ILTER and future directions, Sci. Total Environ., 626, 1439–1462, https://doi.org/10.1016/j.scitotenv.2017.12.001, 2018.
Müller, L. M. and Bahn, M.: Drought legacies and ecosystem responses to subsequent drought, Glob. Change Biol., 28, 5086–5103, https://doi.org/10.1111/gcb.16270, 2022.
Müller, R., Maier, A., Inselsbacher, E., Peticzka, R., Wang, G., and Glatzel, S.: 13C-Labeled Artificial Root Exudates Are Immediately Respired in a Peat Mesocosm Study, Diversity, 14, 735, https://doi.org/10.3390/d14090735, 2022.
Neumann, M. and Starlinger, F.: The significance of different indices for stand structure and diversity in forests, Forest Ecol. Manag., 145, 91–106, 2001.
Oberleitner, F., Hartmann, H., Hasibeder, R., Huang, J., Losso, A., Mayr, S., Oberhuber, W., Wieser, G., and Bahn, M.: Amplifying effects of recurrent drought on the dynamics of tree growth and water use in a subalpine forest, Plant Cell Environ., 45, 2617–2635, https://doi.org/10.1111/pce.14369, 2022.
Offenthaler, I.: data-paper.ipynb, Github [code], https://gist.github.com/1O/9bbe44a03f12801c6c742202b005db57 (last access: 1 September 2024), 2024.
Oggioni, A., Silver, M., Ranghetti, L., and Tagliolato, P.: ReLTER: An Interface for the eLTER Community, GitHub [code], https://github.com/ropensci/ReLTER (last access: 1 March 2024), 2023.
Peterseil, J. and Geiger, S.: Field Specification for data reporting (1.0), Zenodo [data set], https://doi.org/10.5281/zenodo.6373410, 2020.
Pröll, G., Venier, S., and Dirnböck, T.: Zöbelboden (Austria) – tree increments (2019–2021), EUDAT [data set], https://doi.org/10.23728/b2share.2de5b37a0cad4f82a19f477531d6af24, 2024.
Pumpanen, J., Kolari, P., Ilvesniemi, H., Minkkinen, K., Vesala, T., Niinistö, S., Lohila, A., Larmola, T., Morero, M., Pihlatie, M., Janssens, I., Yuste, J. C., Grünzweig, J. M., Reth, S., Subke, J.-A., Savage, K., Kutsch, W., Østreng, G., Ziegler, W., Anthoni, P., Lindroth, A., and Hari, P.: Comparison of different chamber techniques for measuring soil CO2 efflux, Agr. Forest Meteorol., 123, 159–176, https://doi.org/10.1016/j.agrformet.2003.12.001, 2004.
Pumpanen, J., Kulmala, L., Lindén, A., Kolari, P., Nikinmaa, E., and Hari, P.: Seasonal dynamics of autotrophic respiration in boreal forest soil estimated by continuous chamber measurements, Boreal Environ. Res., 20, 637–650, 2015.
Ramonet, M., Ciais, P., Apadula, F., Bartyzel, J., Bastos, A., Bergamaschi, P., Blanc, P. E., Brunner, D., Di Caracciolo Torchiarolo, L., Calzolari, F., Chen, H., Chmura, L., Colomb, A., Conil, S., Cristofanelli, P., Cuevas, E., Curcoll, R., Delmotte, M., Di Sarra, A., Emmenegger, L., Forster, G., Frumau, A., Gerbig, C., Gheusi, F., Hammer, S., Haszpra, L., Hatakka, J., Hazan, L., Heliasz, M., Henne, S., Hensen, A., Hermansen, O., Keronen, P., Kivi, R., Komínková, K., Kubistin, D., Laurent, O., Laurila, T., Lavric, J. V., Lehner, I., Lehtinen, K. E. J., Leskinen, A., Leuenberger, M., Levin, I., Lindauer, M., Lopez, M., Myhre, C. L., Mammarella, I., Manca, G., Manning, A., Marek, M. V., Marklund, P., Martin, D., Meinhardt, F., Mihalopoulos, N., Mölder, M., Morgui, J. A., Necki, J., O'Doherty, S., O'Dowd, C., Ottosson, M., Philippon, C., Piacentino, S., Pichon, J. M., Plass-Duelmer, C., Resovsky, A., Rivier, L., Rodó, X., Sha, M. K., Scheeren, H. A., Sferlazzo, D., Spain, T. G., Stanley, K. M., Steinbacher, M., Trisolino, P., Vermeulen, A., Vítková, G., Weyrauch, D., Xueref-Remy, I., Yala, K., and Yver Kwok, C.: The fingerprint of the summer 2018 drought in Europe on ground-based atmospheric CO2 measurements, Philos. T. R. Soc. Lon. B, 375, 20190513, https://doi.org/10.1098/rstb.2019.0513, 2020.
Reichstein, M., Bahn, M., Ciais, P., Frank, D., Mahecha, M. D., Seneviratne, S. I., Zscheischler, J., Beer, C., Buchmann, N., Frank, D. C., Papale, D., Rammig, A., Smith, P., Thonicke, K., van der Velde, M., Vicca, S., Walz, A., and Wattenbach, M.: Climate extremes and the carbon cycle, Nature, 500, 287–295, https://doi.org/10.1038/nature12350, 2013.
Rödenbeck, C., Zaehle, S., Keeling, R., and Heimann, M.: The European carbon cycle response to heat and drought as seen from atmospheric CO2 data for 1999–2018, Philos. T. R. Soc. Lon. B, 375, 20190506, https://doi.org/10.1098/rstb.2019.0506, 2020.
Schindlbacher, A., Wunderlich, S., Borken, W., Kitzler, B., Zechmeister-Boltenstern, S., and Jandl, R.: Soil respiration under climate change: prolonged summer drought offsets soil warming effects, Glob. Change Biol., 18, 2270–2279, https://doi.org/10.1111/j.1365-2486.2012.02696.x, 2012.
Schmitt, M., Bahn, M., Wohlfahrt, G., Tappeiner, U., and Cernusca, A.: Land use affects the net ecosystem CO2 exchange and its components in mountain grasslands, Biogeosciences, 7, 2297–2309, https://doi.org/10.5194/bg-7-2297-2010, 2010.
Schwen, A., Zimmermann, M., Leitner, S., and Woche, S. K.: Soil Water Repellency and its Impact on Hydraulic Characteristics in a Beech Forest under Simulated Climate Change, Vadose Zone J., 14, 1–11, https://doi.org/10.2136/vzj2015.06.0089, 2015.
Vicente-Serrano, S. M., Beguería S, and López-Moreno, J. I.: A Multiscalar Drought Index Sensitive to Global Warming: The Standardized Precipitation Evapotranspiration Index, J. Climate, 23, 1696–1718, https://doi.org/10.1175/2009JCLI2909.1, 2010.
Wilkinson, M. D., Dumontier, M., Aalbersberg, I. J. J., Appleton, G., Axton, M., Baak, A., Blomberg, N., Boiten, J.-W., da Silva Santos, L. B., Bourne, P. E., Bouwman, J., Brookes, A. J., Clark, T., Crosas, M., Dillo, I., Dumon, O., Edmunds, S., Evelo, C. T., Finkers, R., Gonzalez-Beltran, A., Gray, A. J. G., Groth, P., Goble, C., Grethe, J. S., Heringa, J., Hoen, P. A. C., Hooft, R., Kuhn, T., Kok, R., Kok, J., Lusher, S. J., Martone, M. E., Mons, A., Packer, A. L., Persson, B., Rocca-Serra, P., Roos, M., van Schaik, R., Sansone, S.-A., Schultes, E., Sengstag, T., Slater, T., Strawn, G., Swertz, M. A., Thompson, M., van der Lei, J., van Mulligen, E., Velterop, J., Waagmeester, A., Wittenburg, P., Wolstencroft, K., Zhao, J., and Mons, B.: The FAIR Guiding Principles for scientific data management and stewardship, Scientific data, 3, 160018, https://doi.org/10.1038/sdata.2016.18, 2016.
Wohner, C.: deimsPy, Pypi [code], https://pypi.org/project/deims/, 2023.
Wohner, C., Peterseil, J., Poursanidis, D., Kliment, T., Wilson, M., Mirtl, M., and Chrysoulakis, N.: DEIMS-SDR – A web portal to document research sites and their associated data, Ecol. Inform., 51, 15–24, https://doi.org/10.1016/j.ecoinf.2019.01.005, 2019.
Wohner, C., Dirnböck, T., Peterseil, J., Pröll, G., and Geiger, S.: Providing high resolution data for the long-term ecosystem research infrastructure on the national and European scale, in: Umweltinformationssysteme – Wie verändert die Digitalisierung unsere Gesellschaft?, edited by: Freitag, U., Fuchs-Kittowski, F., Abecker, A., Hosenfeld, F., Springer Vieweg, Wiesbaden, https://www.springerprofessional.de/umweltinformationssysteme-wie-veraendert-die-digitalisierung-uns/18729482#TOC (last access: 1 March 2024), 2021.
Wohner, C., Peterseil, J., and Klug, H.: Designing and implementing a data model for describing environmental monitoring and research sites, Ecol. Inform., 70, 101708, https://doi.org/10.1016/j.ecoinf.2022.101708, 2022.
Working Group WRB: World Reference Base for Soil Resources 2014, update 2015 International soil classification system for naming soils and creating legends for soil maps, World Soil Resources Reports No. 106. FAO, Rome, https://openknowledge.fao.org/server/api/core/bitstreams/bcdecec7-f45f-4dc5-beb1-97022d29fab4/content (last access: 1 March 2024), 2015.
Wu, D., Ciais, P., Viovy, N., Knapp, A. K., Wilcox, K., Bahn, M., Smith, M. D., Vicca, S., Fatichi, S., Zscheischler, J., He, Y., Li, X., Ito, A., Arneth, A., Harper, A., Ukkola, A., Paschalis, A., Poulter, B., Peng, C., Ricciuto, D., Reinthaler, D., Chen, G., Tian, H., Genet, H., Mao, J., Ingrisch, J., Nabel, J. E. S. M., Pongratz, J., Boysen, L. R., Kautz, M., Schmitt, M., Meir, P., Zhu, Q., Hasibeder, R., Sippel, S., Dangal, S. R. S., Sitch, S., Shi, X., Wang, Y., Luo, Y., Liu, Y., and Piao, S.: Asymmetric responses of primary productivity to altered precipitation simulated by ecosystem models across three long-term grassland sites, Biogeosciences, 15, 3421–3437, https://doi.org/10.5194/bg-15-3421-2018, 2018.
Yu, X., Orth, R., Reichstein, M., Bahn, M., Klosterhalfen, A., Knohl, A., Koebsch, F., Migliavacca, M., Mund, M., Nelson, J. A., Stocker, B. D., Walther, S., and Bastos, A.: Contrasting drought legacy effects on gross primary productivity in a mixed versus pure beech forest, Biogeosciences, 19, 4315–4329, https://doi.org/10.5194/bg-19-4315-2022, 2022.
Zweifel, R.: Radial stem variations – a source of tree physiological information not fully exploited yet, Plant Cell Environ., 39, 231–232, https://doi.org/10.1111/pce.12613, 2016.
Zweifel, R., Etzold, S., Basler, D., Bischoff, R., Braun, S., Buchmann, N., Conedera, M., Fonti, P., Gessler, A., Haeni, M., Hoch, G., Kahmen, A., Köchli, R., Maeder, M., Nievergelt, D., Peter, M., Peters, R. L., Schaub, M., Trotsiuk, V., Walthert, L., Wilhelm, M., and Eugster, W.: TreeNet–The Biological Drought and Growth Indicator Network, Front. For. Glob. Change, 4, 776905, https://doi.org/10.3389/ffgc.2021.776905, 2021.
Zweifel, R., Pappas, C., Peters, R. L., Babst, F., Balanzategui, D., Basler, D., Bastos, A., Beloiu, M., Buchmann, N., Bose, A. K., Braun, S., Damm, A., D'Odorico, P., Eitel, J. U., Etzold, S., Fonti, P., Rouholahnejad Freund, E., Gessler, A., Haeni, M., Hoch, G., Kahmen, A., Körner, C., Krejza, J., Krumm, F., Leuchner, M., Leuschner, C., Lukovic, M., Martínez-Vilalta, J., Matula, R., Meesenburg, H., Meir, P., Plichta, R., Poyatos, R., Rohner, B., Ruehr, N., Salomón, R. L., Scharnweber, T., Schaub, M., Steger, D. N., Steppe, K., Still, C., Stojanović, M., Trotsiuk, V., Vitasse, Y., Arx, G. von, Wilmking, M., Zahnd, C., and Sterck, F.: Networking the forest infrastructure towards near real-time monitoring – A white paper, Sci. Total Environ., 872, 162167, https://doi.org/10.1016/j.scitotenv.2023.162167, 2023.
- Abstract
- Introduction
- Site descriptions
- Dataset description, measuring methods, quality assurance (QA), and quality control (QC)
- Data file structure
- Data validation
- Data availability
- Discussion
- Interactive computing environment (ICE)
- Author contributions
- Competing interests
- Disclaimer
- Acknowledgements
- Financial support
- Review statement
- References