the Creative Commons Attribution 4.0 License.
the Creative Commons Attribution 4.0 License.
 | 03 Dec 2025
EURO-SUPREME: sub-daily precipitation extremes in the EURO-CORDEX ensemble
Anouk Dierickx
Wout Dewettinck
Bert Van Schaeybroeck
Lesley De Cruz
Steven Caluwaerts
Piet Termonia
Extreme precipitation events can lead to devastating floods, loss of life and severe infrastructure damage and are expected to increase in a warming world, highlighting the urgent need to quantify current-day and future extremes. Although intense precipitation extremes are generally better represented by high-resolution climate models, large ensemble datasets are lacking. Yet, these are very essential for estimating uncertainties of future trends. Here, the EURO-SUPREME (EURO-SUb-daily PRecipitation extrEMEs) dataset, with DOI: https://doi.org/10.26050/WDCC/EUCOR_prec_v2 (Van de Vyver et al., 2025), is presented that includes extreme precipitation events from the EURO-CORDEX regional climate model (RCM) ensemble (downscaling CMIP5 GCMs), for accumulated precipitation amounts ranging from 1 to 72 h. Specifically, the data are based on a small ensemble of evaluation runs and a 35-member ensemble of historical and future (RCP8.5) annual-maxima on the EURO-CORDEX EUR-11 (0.11°) domain, covering 4984 simulation years in total. The resource is designed to enable climate-model comparison and support various state-of-the-art scientific research efforts and climate-change risk assessments. We provide a validation of the EURO-SUPREME dataset for various countries in Europe and disentangle the RCM and GCM contributions to the biases. Furthermore, we provide a practical application of using EURO-SUPREME as a benchmark for high-resolution convection-permitting models for Belgium. Finally, we investigate the changes in intensity and frequency of extreme precipitation under different global warming levels.
- Article
(8177 KB) - Full-text XML
-
Supplement
(600 KB) - BibTeX
- EndNote


Extreme precipitation events are catastrophic by nature and often cause flooding, infrastructure damage and agricultural losses, with significant socio-economic impacts and threats to human security (Tradowsky et al., 2023; Kimutai et al., 2024). In 2023 alone, 1.6 million people in Europe were affected by floods (Copernicus Climate Change Service (C3S), 2024). The sixth assessment report of the Intergovernmental Panel on Climate Change (IPCC, 2023) indicates that both the frequency and intensity of extreme precipitation events have increased since the 1950s in most regions around the world, as shown in e.g. Westra et al. (2013). This trend is expected to continue as global temperatures continue to rise (Rajczak and Schär, 2017).
Sub-daily extreme precipitation, mainly caused by convective events, has significant impacts on various sectors, including agriculture and water management. In urban areas, for example, heavy rainfall within short periods can lead to flash floods. In recent years, there has been mounting evidence that the intensity of short-term precipitation events is increasing worldwide (Westra et al., 2014; Fowler et al., 2021; Cannon et al., 2024).
It is essential to develop climate models that can adequately represent these events. High-resolution regional climate models (RCMs) are generally considered more accurate for simulating precipitation extremes than global circulation models (GCMs) (Jones et al., 1995; Durman et al., 2001; Doblas-Reyes et al., 2021). The Coordinated Regional Climate Downscaling Experiment (CORDEX) aims to advance and coordinate the science and application of regional climate downscaling and has led to the production of large ensembles of coordinated RCM simulations, including simulations at 0.11° (12.5 km) resolution over Europe (Jacob et al., 2014, 2020, EURO-CORDEX). However, the ability of climate and weather models with resolution above 5 km to accurately simulate sub-daily precipitation extremes is limited because they rely on parameterisations of deep convection.
Convection-permitting regional climate models (CPRCMs), which operate at higher resolutions (typically 1–4 km), partly resolve convective processes and produce more realistic short-duration extremes (Prein et al., 2015; Lucas-Picher et al., 2021). However, the computational resources are greater than that of coarse-resolution RCMs (Schär et al., 2020), making simulations over a large area exceptional (Kendon et al., 2021) and multi-model ensembles over smaller areas rare (Pichelli et al., 2021). Also, the length of the simulations (so far) is quite short apart from the ensemble and domain size.
However, the EURO-CORDEX extremes are not readily available because processing the full hourly dataset and extracting the extremes is time-consuming, technically complicated, computationally demanding and requires a huge storage capacity. To alleviate these problems, we introduce the EURO-SUPREME dataset of annual maximum hourly to 72 h rainfall across Europe from evaluation simulations and a 35-member ensemble of EURO-CORDEX simulations at a spatial resolution of 0.11° on both the original and on a common regular grid. Similar datasets over the European domain were produced from a large multi-model ensemble of EURO-CORDEX simulations for extreme wind and 5 d precipitation (Outten and Sobolowski, 2024), and for extreme sub-daily precipitation from a single model (CRCM5) initial-condition large ensemble (Poschlod et al., 2021).
The here-presented EURO-SUPREME dataset can be used for several purposes and by different communities. A first important application is to serve as a benchmark set for extreme value statistics, and in addition to the usual bias analysis, physically-based metrics (such as daily/seasonal cycle, spatial organisation) can also be involved to gain more confidence in the simulations (Cortés-Hernández et al., 2016; Van de Vyver et al., 2021). Comparative studies between the EURO-CORDEX 0.11° ensemble and convection-permitting simulations of hourly extreme precipitation can be found in Meredith et al. (2021) for Germany, and in Dierickx (2024) for the UK. Secondly, the dataset can support further research efforts, e.g. inter-model cross-validation of bias-correction techniques (Schmith et al., 2021; Van de Vyver et al., 2023), or attribution of heavy precipitation events (Kimutai et al., 2024). Finally, the dataset can be used for climate risk assessment. Indeed, EURO-CORDEX is included as the reference dataset in the technical screening criteria of the EU Taxonomy Regulations (European Commission, 2022) for undertakings to evaluate climate-related risk (Canepa, 2023).
In Sect. 2 of this work, we describe the EURO-CORDEX ensemble and the EURO-SUPREME dataset structure and its accessibility. In Sect. 3, the data quality is assessed by comparing 10-year return levels of EURO-SUPREME to observations for different regions over Europe, and the GCM–RCM contributions herein are further explored. In Sect. 4, we discuss the EURO-SUPREME dataset usability by providing potential applications, including benchmarking for CPRCMs, and analysis of changes in intensity and frequency of simulated precipitation extremes influenced by global warming. Finally, in Sect. 7, conclusions are drawn and possible limitations and possibilities for further research are discussed.
2.1 EURO-CORDEX ensemble
EURO-CORDEX is a collaborative initiative aimed at providing coordinated high-resolution climate projections for Europe (Jacob et al., 2014, 2020; Kotlarski et al., 2014), launched as part of the larger Coordinated Regional Climate Downscaling Experiment (CORDEX) project of the World Climate Research Program (WCRP) (Gutowski et al., 2016). RCM-simulations for the European domain were performed at two spatial resolutions: the standard CORDEX resolution of 0.44° (EUR-44, ∼ 50 km) and a higher resolution of 0.11° (EUR-11, ∼ 12.5 km). The GCMs that provide the lateral boundary conditions for the RCMs are from the CMIP5 ensemble, with historical simulations for the period 1850–2005 and future projections from 2006 to 2100 using different emission scenarios (e.g. RCP4.5, RCP8.5). CMIP6-CORDEX, which follows SSP scenarios, is currently being implemented and is expected to progress in the coming years (Katragkou et al., 2024).
EURO-CORDEX data are publicly available on Earth System Grid Federation (ESGF) nodes, and of the total 69 GCM-RCM pairs in the 0.11° ensemble, only 27 pairs contain precipitation with a temporal resolution of one hour (see Table 1), from which we selected the historical and RCP8.5 experiments with the aim of obtaining the largest signal-to-noise ratio. There are in total six different RCMs and six different GCMs. Reanalysis-driven evaluation runs (downscaled from ERA-Interim) are also available for four of the six RCMs. Some GCM-RCM pairs are represented by multiple realisations (ensemble members), ultimately resulting in an ensemble of 35 members. The disadvantage of having a relatively limited number of pairs is that they have been selected solely on the basis of availability, rather than plausibility, climate sensitivity, and independence as were for instance considered in the CMIP6 EURO-CORDEX Balanced Ensemble Design (Katragkou et al., 2024). Table S1 in the Supplement provides more technical dataset details such as spatial domain and simulation periods associated with each RCM. Note that there is no standard EUR-11 grid and different RCMs may have different grids.
2.2 EURO-SUPREME dataset description
2.2.1 Description of the files and variables
The EURO-SUPREME files include annual-maximum rainfall data and are available in Network Common Data Format (NetCDF) on the World Data Center for Climate (WDCC) via: https://doi.org/10.26050/WDCC/EUCOR_prec_v2 (Van de Vyver et al., 2025). More specifically, within each file, we provide for each grid point and for each year, the annual maximum of d-hour accumulated precipitation over a 1 h moving window on the native RCM grid. The rainfall durations are and 72 h. We have chosen to define extreme events based on annual maxima, as there is a strong mathematical basis for the statistical modelling of block maxima (see Appendix A). In addition, the annual maximum values of all simulations were re-gridded to a common regular 0.11°×0.11° grid using nearest-neighbour interpolation with spatial coverage 28–70° N and 13–35° E.
The data are organised in a hierarchical structure with layers: Projects, Experiments (with above DOI), and datasets grouped per RCM. NetCDF files containing annual maxima on the native grid of one RCM downscaling of one GCM, are named according to the CORDEX nomenclature:
AM_pr_EUR-11_[GCM name and version]_[period]_[member]_[RCM name and version].nc
where period is either “hist” or “rcp85”, and member follows the RIP-nomenclature (RIP = realisation, initialisation, physics). The file names of NetCDFs containing the regridded annual maximum values end with “_regular_grid”. Similarly, the evaluation runs are referred to as:
AM_pr_EUR-11_ECMWF-ERAINT_evaluation_[member]_[RCM name and version].nc
The variable names in the NetCDF files are: “am[d]h”, with rainfall duration d equal to “1”, “2”, …, “72”. The spatial dimensions (longitude/latitude) are adapted from the original RCM data. The time dimension represents the year of the annual maximum. For practical purposes, we have also added two auxiliary variables to all NetCDF files: “orog” (surface height) and “sftlf” (land_area_fraction). Similar to rainfall, they have been regridded using nearest-neighbour interpolation for the data on the common grid.
In total, the dataset consists of 148 files, resulting from 35 simulations, each with 2 periods, and 4 evaluation runs. The dataset contains 4984 years of simulated annual maxima, and 133 years of reanalysis-driven simulated annual maxima, and has a total size of 31 GB.
2.2.2 Outliers
First, the presence of outliers in the dataset is investigated by checking in the full dataset for values of annual maxima of hourly precipitation above the threshold of 100 mm. In most of the simulations values above this threshold appear sporadically, and for instance for simulations with RegCM4-6 there are even thousands of annual maxima above 100 mm in the full domain. We systematically checked the hourly precipitation data for unrealistic values by identifying exceedances above a threshold value of 100 mm h−1, that could be attributed to the occurrence of non-physical “grid point storms” (Kendon et al., 2023). Such anomalies occur, for instance, in RegCM4-6, where we found rainfall in excess of 8000 mm over North Africa. Hourly values up to 300–350 mm are seen in HadREM3-GA7-05 and REMO2015 over the Mediterranean Sea, often at the coast. Hourly values of 150–200 mm are also found very sporadically in COSMO-crCLIM and to an even lesser extent in RCA4. However, a strict separation between a grid point storm and a physically-realistic value is not always clear, as extreme hourly values of up to 305 mm have already been observed (WMO, 2024). Therefore, these extremely high values are not excluded for the following parts of the analysis. ALADIN63, on the other hand, did not produce values in excess of 80 mm.
2.2.3 Preliminary visualisation of the dataset
As a first visualisation of the dataset, Fig. 1 shows the annual maximum of hourly precipitation in 2005 for COSMO-crCLIM downscaling CNRM-CERFACS-CNRM-CM5. Figures 2–3 show maps with 10-year return levels of hourly and 24 h precipitation, respectively, for the EURO-SUPREME ensemble for the historical period. The return levels were calculated with the annual-maximum method described in Appendix A. It is clear that the 10-year return-level maps for hourly precipitation are very similar per column, i.e. for simulations which use the same RCM but a different forcing GCM. On average, HadREM3-GA7-05 shows higher return levels of hourly precipitation than all other RCMs, especially over the northern part of the Mediterranean. ALADIN63 and RegCM4-6, on the contrary, generally have lower return levels. For daily precipitation extremes, the differences between the RCMs are less clear (Fig. 3). For all simulations, the highest return levels appear over the Mediterranean coasts. Again, the lowest and highest daily return levels are found for RegCM4-6 and HadREM3-GA7-05, respectively, but their difference is strongly reduced with respect to hourly precipitation.
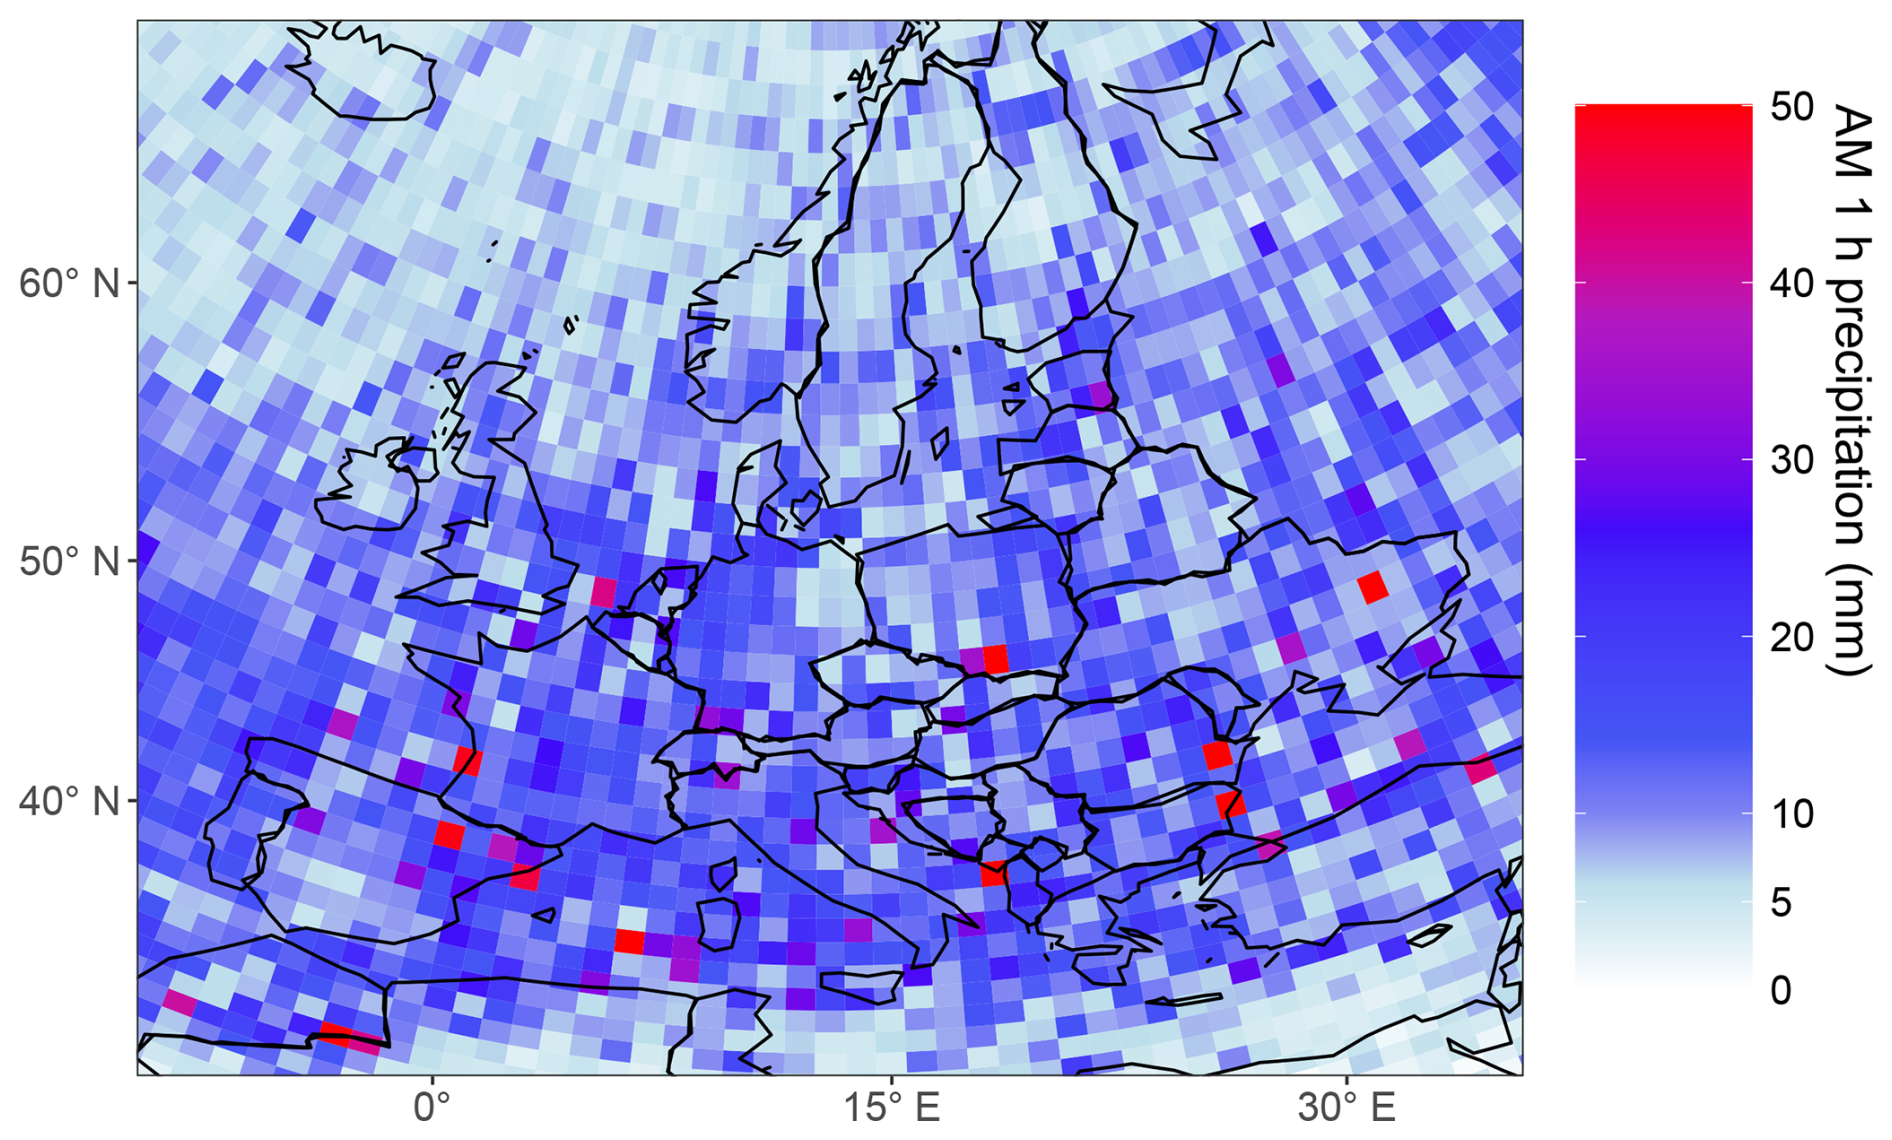
Figure 1An example of the dataset content: the hourly maximum precipitation in 2005 for one model, namely COSMO-crCLIM downscaling CNRM-CERFACS-CNRM-CM5 for a large part of the EURO-CORDEX domain. The data were downsampled to a 1° resolution.
Table 1Summary of the 27 EURO-CORDEX GCM-RCM pairs that are included in the EURO-SUPREME dataset.* The reanalysis-driven evaluation run, downscaled from ERA-Interim (ECMWF), is available.
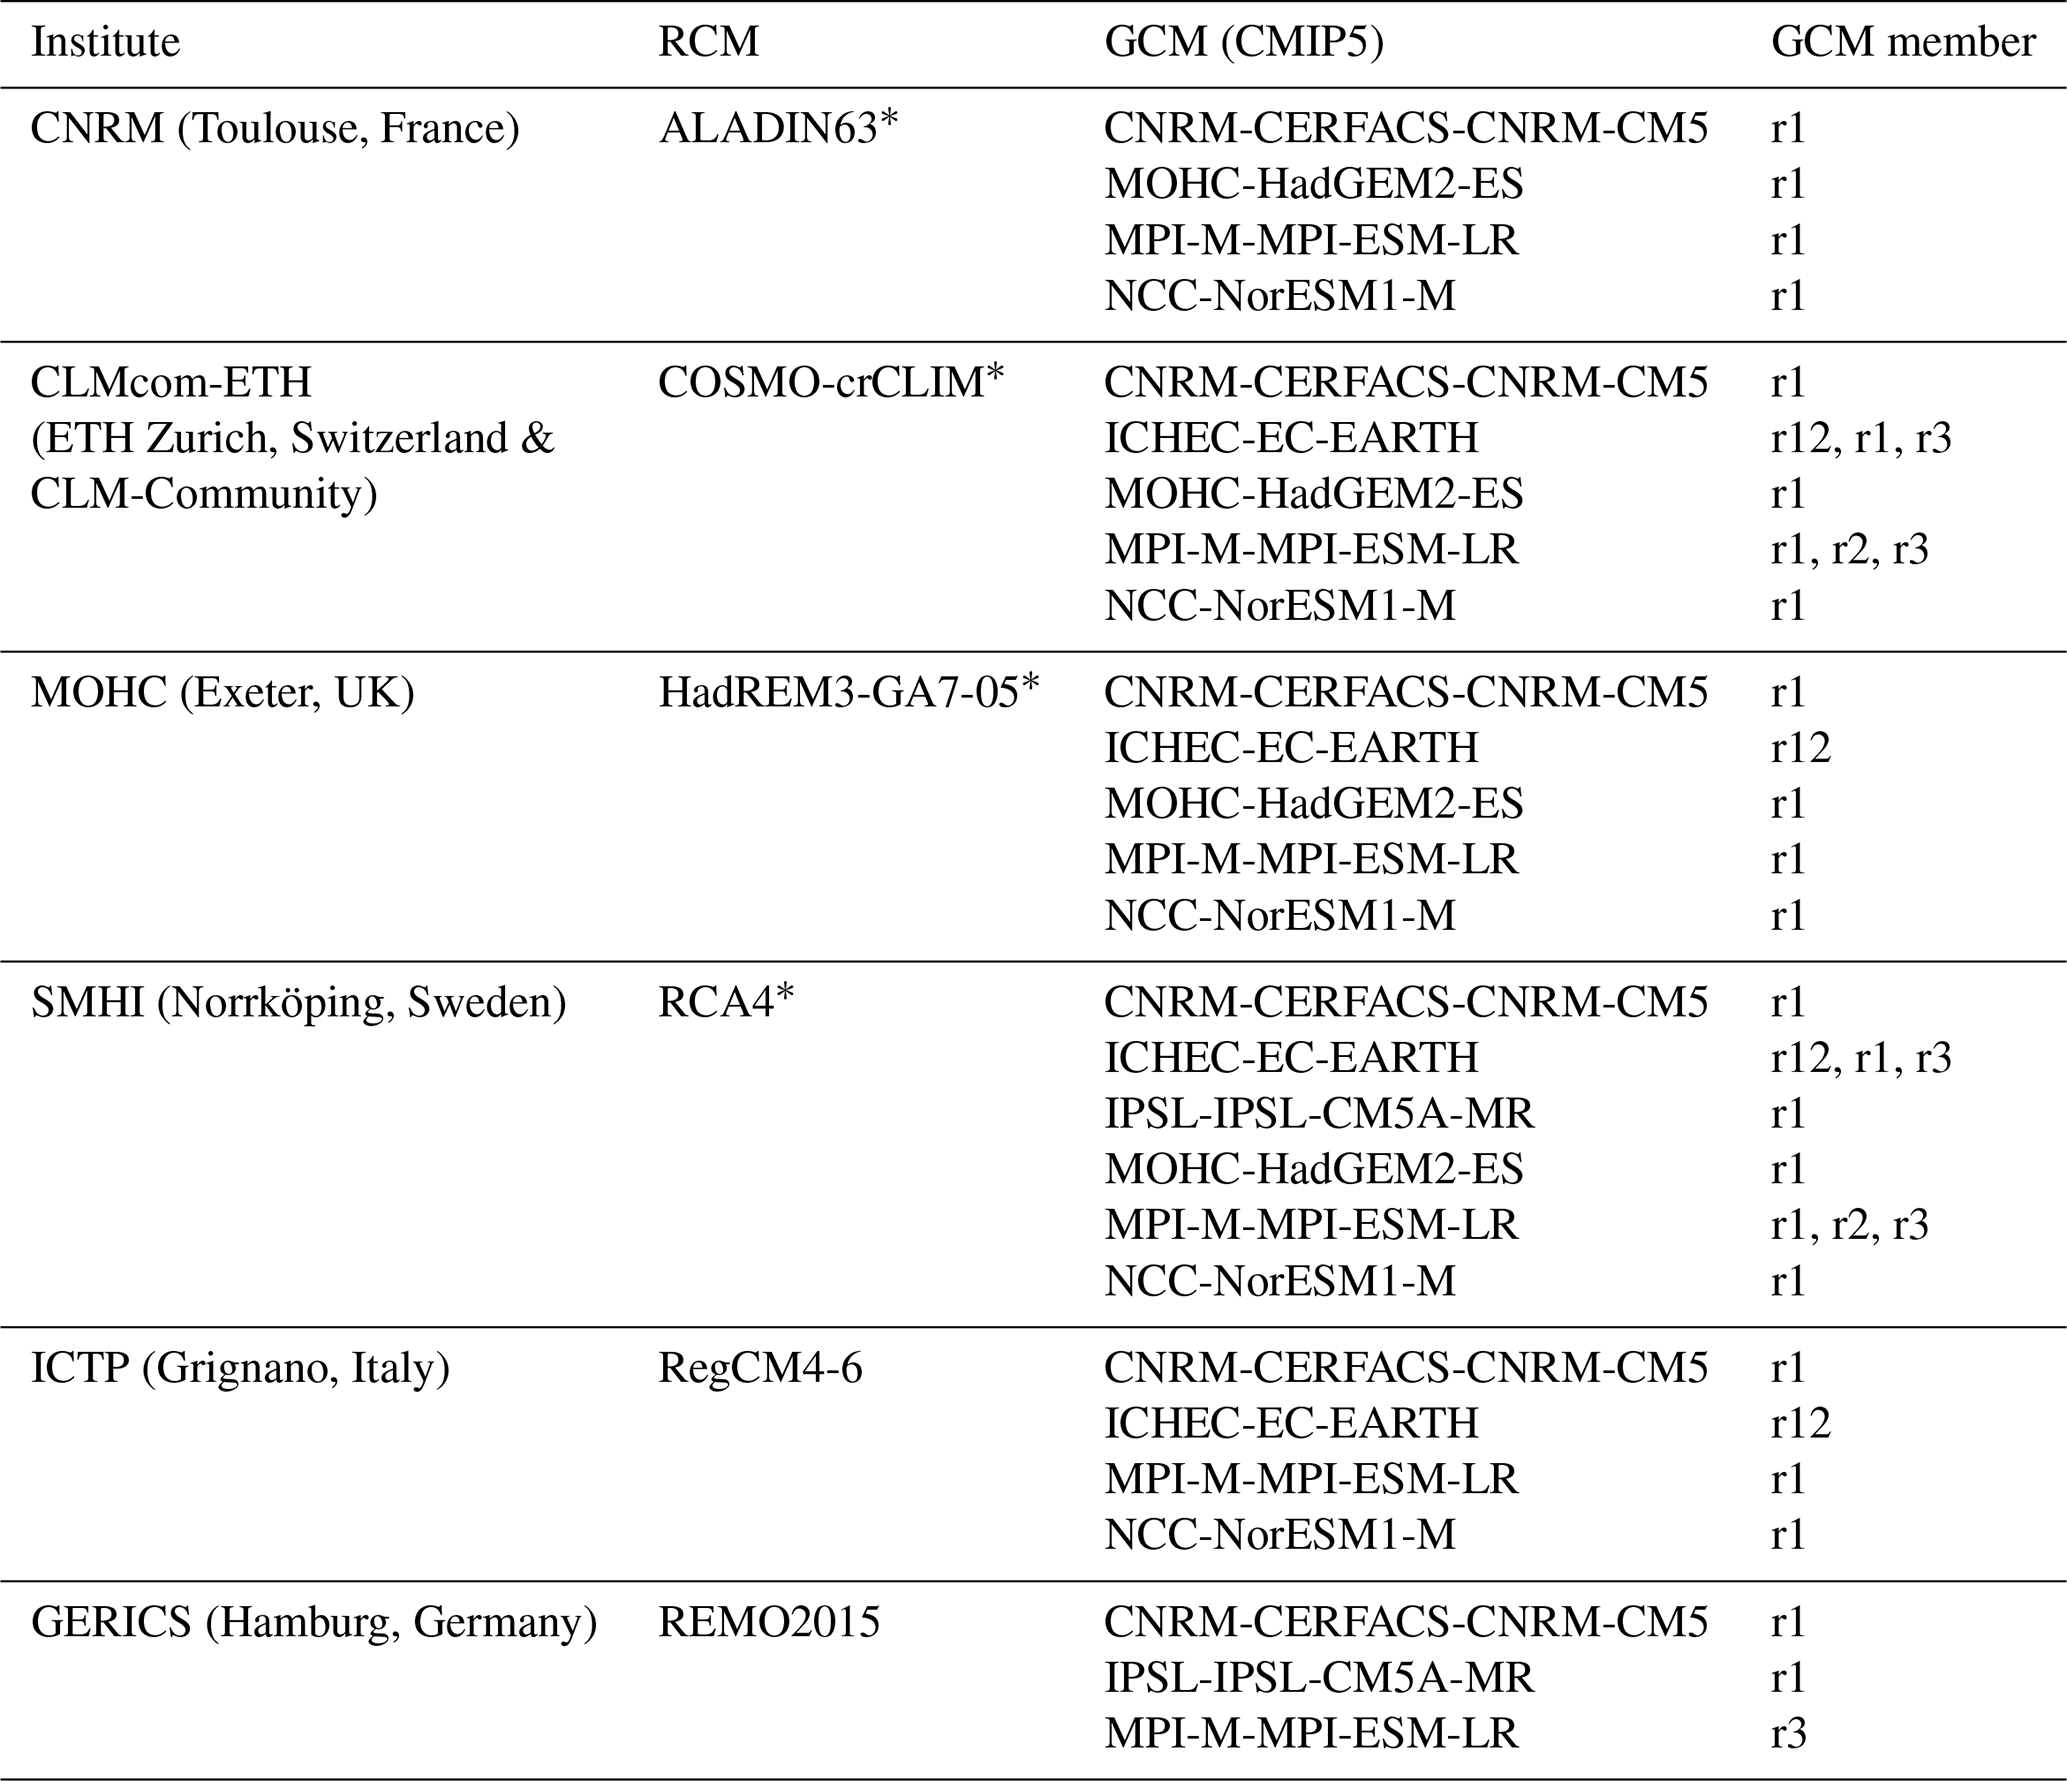
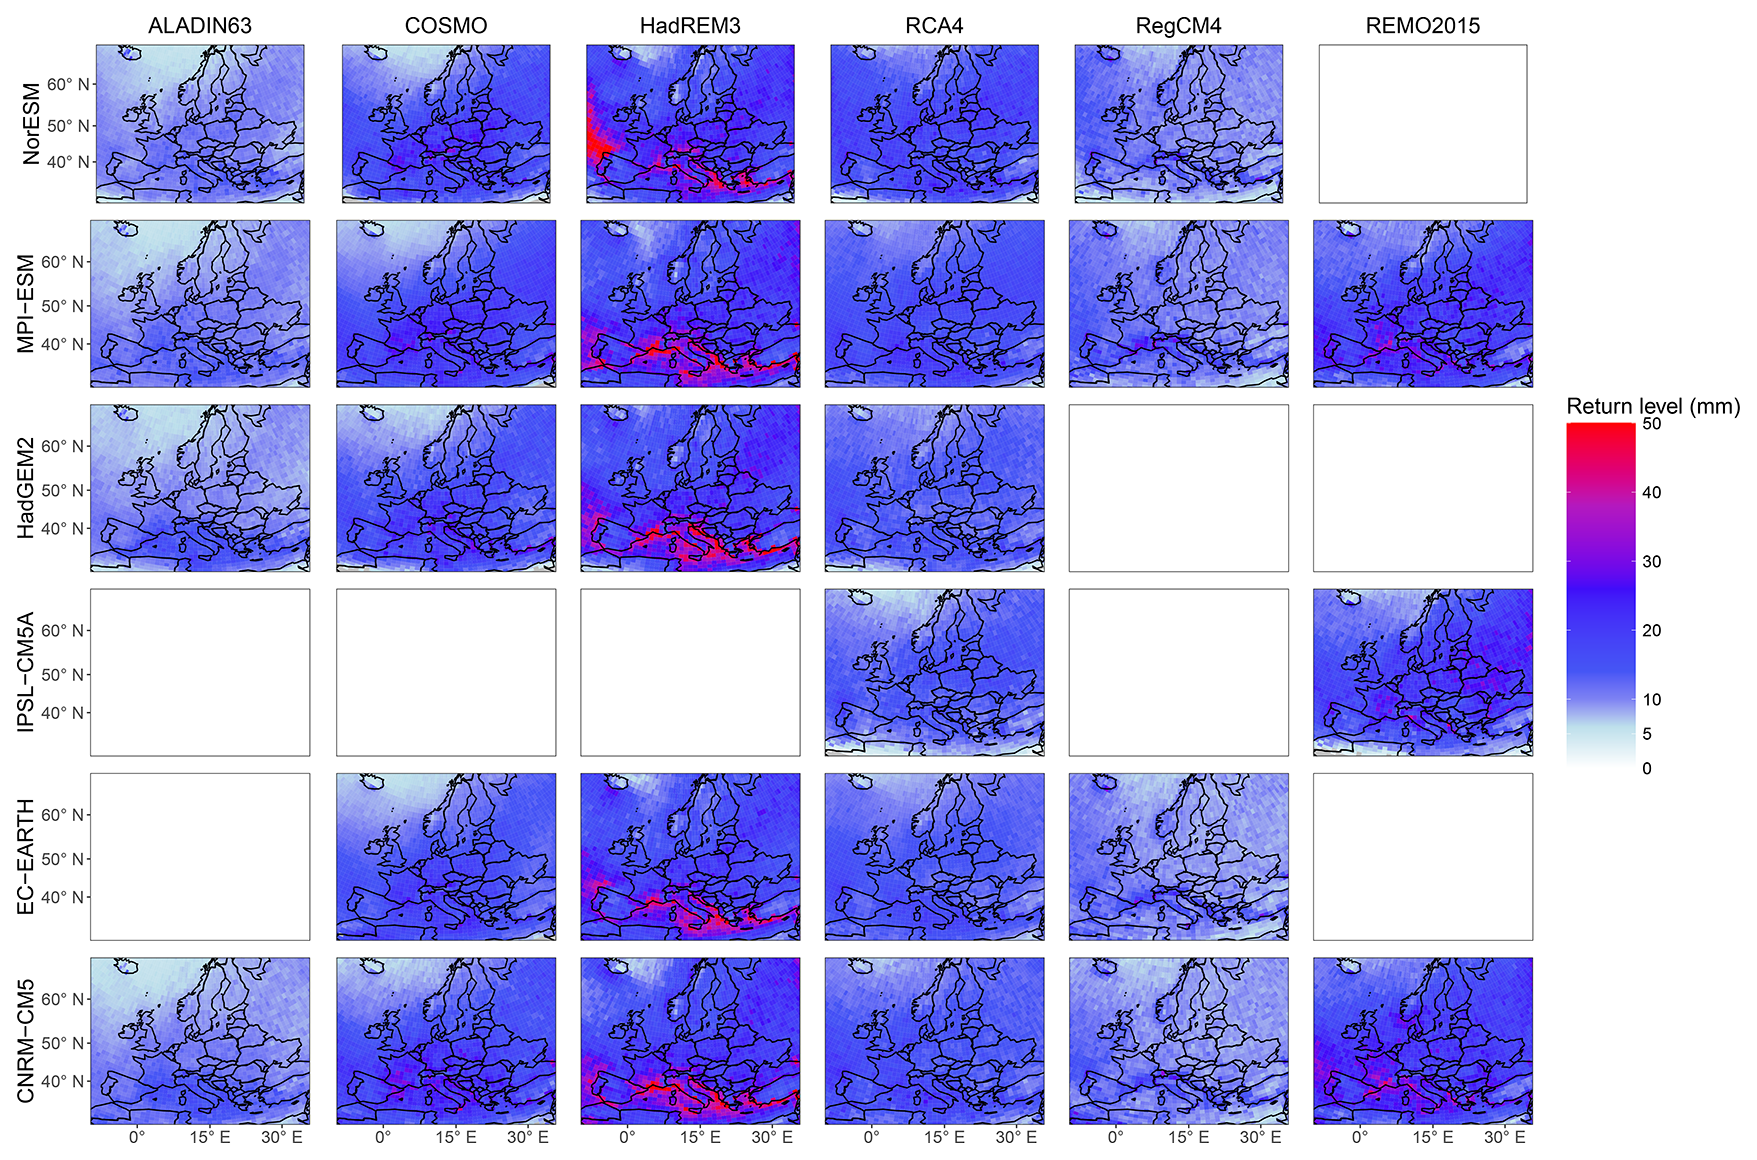
Figure 210-year return level maps of hourly precipitation in the historical EURO-SUPREME dataset for a large part of the EUR-11 CORDEX domain. Each row corresponds to a GCM and each column to an RCM. The GCM names are shortened: CNRM-CM5 stands for CNRM-CERFACS-CNRM-CM5, EC-EARTH for ICHEC-EC-EARTH, IPSL-CM5A for IPSL-IPSL-CM5A-MR, HadGEM2 for MOHC-HadGEM2-ES, MPI-ESM for MPI-M-MPI-ESM-LR and NorESM for NCC-NorESM1-M. Some of the RCM names are shortened as well: COSMO stands for COSMO-crCLIM and HadREM3 for HadREM3-GA7-05. The red colour is used for all values above 50 mm and the maximum value found is 77.8 mm.
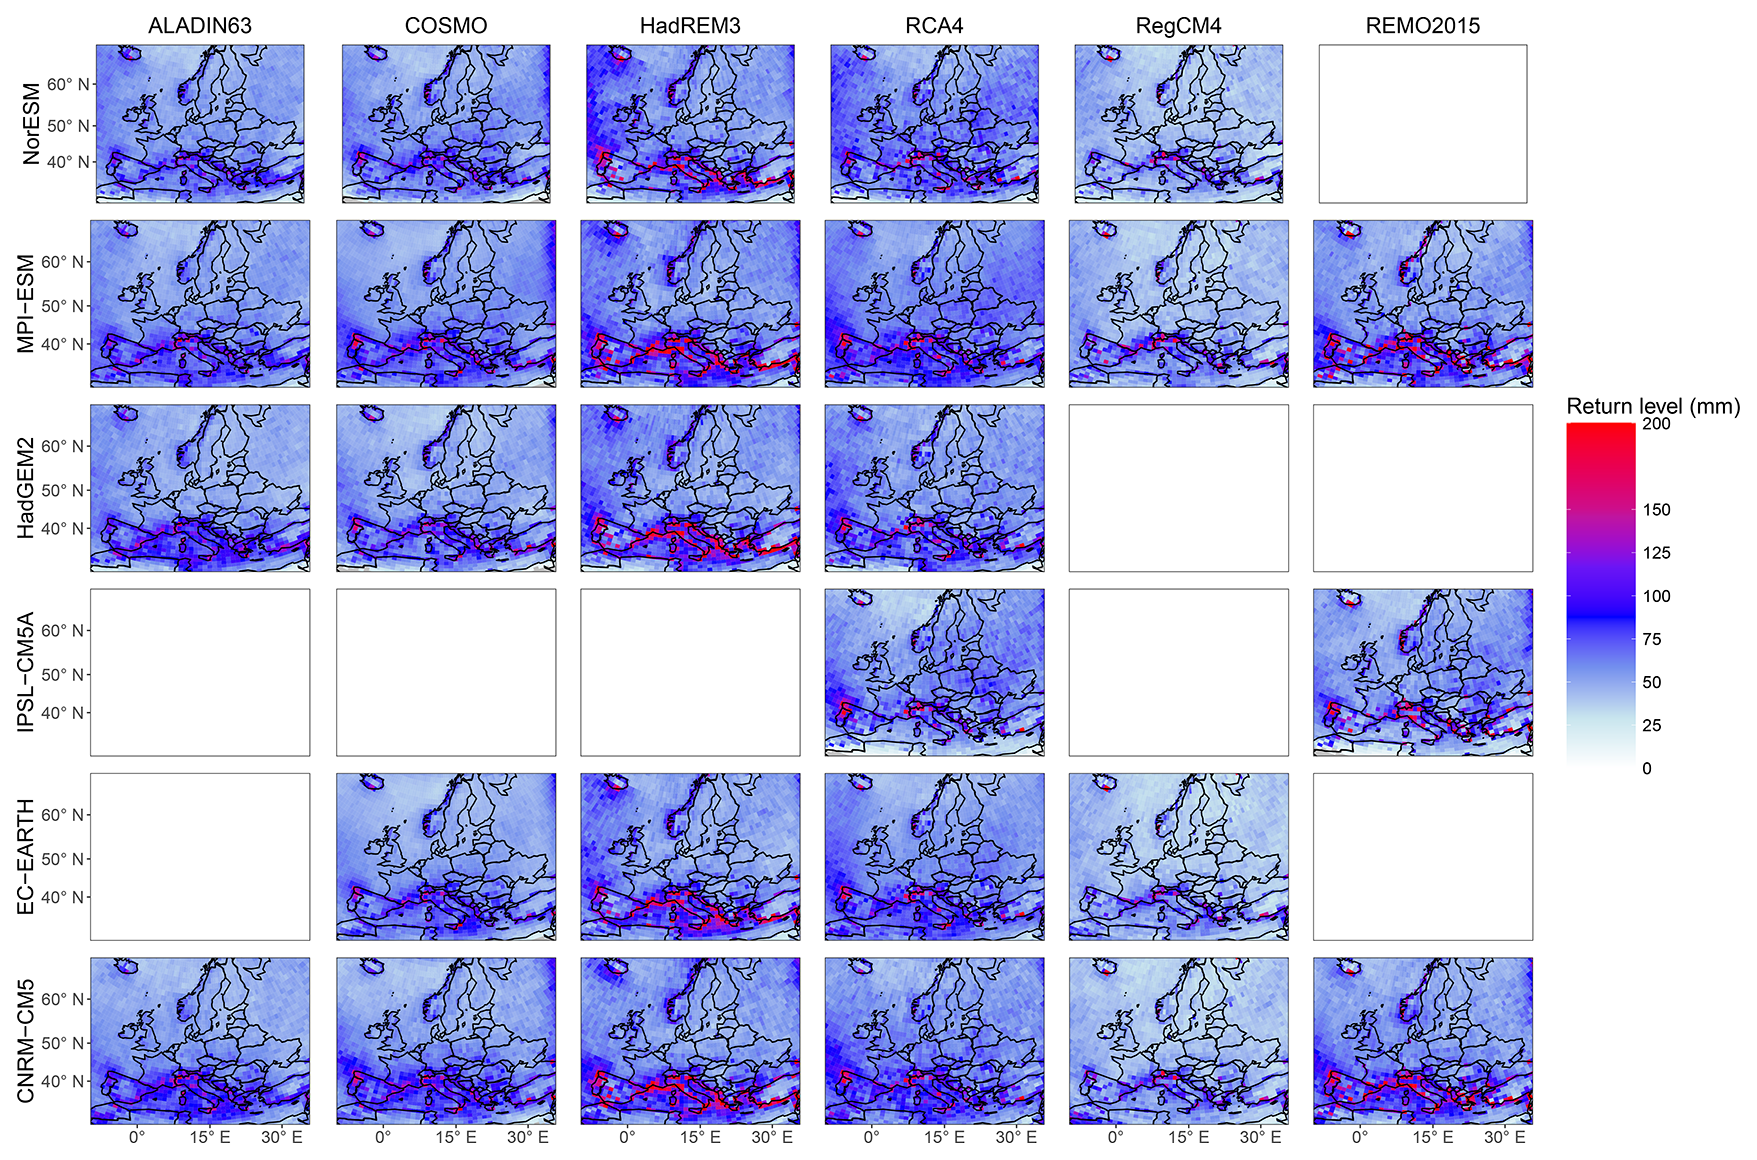
Figure 3Same as Fig. 2, but for daily instead of hourly precipitation. The red colour shade is used for all values above 200 mm and the maximum value found is 385.8 mm.
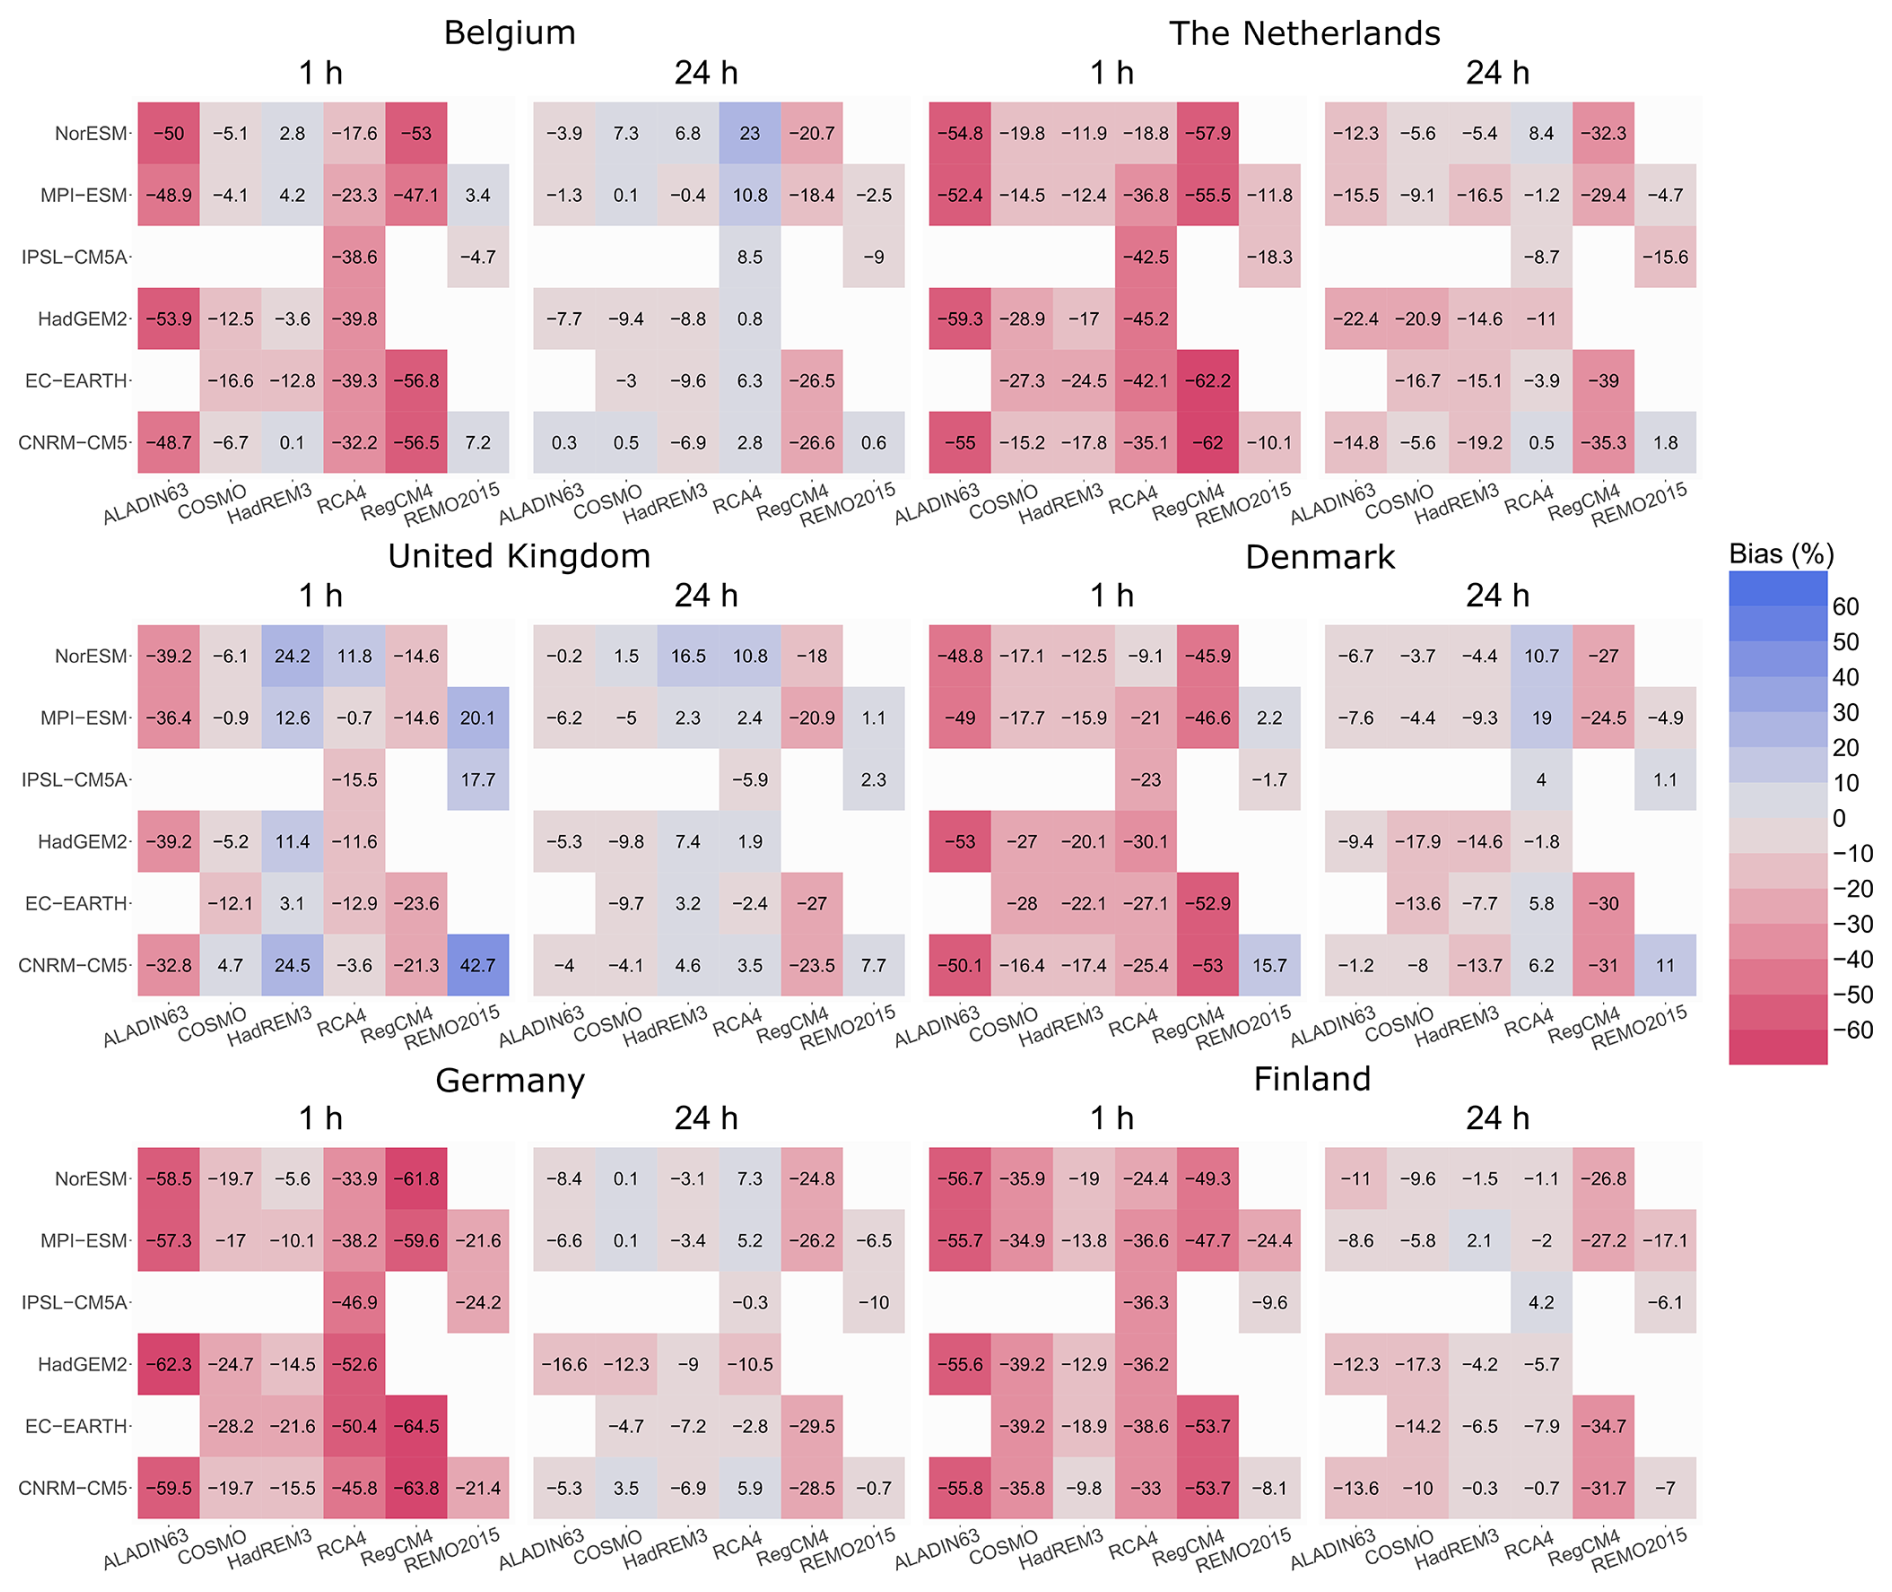
Figure 4Now averaging over the area before computing the relative bias instead of the other way around. Relative bias (%) of the 10-year return levels in the EURO-SUPREME ensemble, for hourly and daily precipitation for different RCM-GCM combinations and for six countries (Belgium, The Netherlands, United Kingdom, Denmark, Germany and Finland). Both colours and numbers indicate the relative bias.
Many studies have already validated precipitation in the EURO-CORDEX ensemble, both in terms of mean and extreme precipitation (Kotlarski et al., 2014; Rajczak and Schär, 2017; Vautard et al., 2021; Barnes et al., 2024). We validate the EURO-SUPREME dataset by comparing 10-year return levels from historical simulations with observed return levels. Due to the limited availability of hourly observation data, we used national extreme-value statistics from six European countries that were also already included in the validation of Berg et al. (2019) and Poschlod and Ludwig (2021). More specifically, gridded observational return levels are available for Belgium (Van de Vyver, 2012, 2013) and Germany (DWD Climate Data Center (CDC), 2020; Malitz and Ertel, 2015; Junghänel et al., 2017). Even though no gridded observational return levels are available for the Netherlands, Denmark and Finland, country-averaged return levels for each duration exist for these countries (Table S2). Finally, for Britain (UK), return levels were calculated based on CEH-GEAR1hr (Lewis et al., 2018, 2022), a gridded dataset of observed hourly precipitation with a resolution of 1 km.
Since RCM simulations represent areal rather than point precipitation (with an area of 0.11° × 0.11°) and are also stored with hourly resolution, a fair comparison with station-based observed return levels is established by dividing them by the temporal-areal reduction factors of Berg et al. (2019, Table 2), also given in our Table S3. Figure 4 summarises the relative biases of the countrywide means of the 10-year return level in six countries, for all GCM-RCM combinations for hourly and daily precipitation. Again, as noted in Sect. 2.2, biases from simulations with the same RCM are more similar than those with the same forcing GCM. For all countries except the United Kingdom (UK), almost all simulations severely underestimate the return levels of hourly precipitation by up to 60 %. RCMs ALADIN63 and RegCM4-6 do so most strongly, while HadREM3-GA7-05 and REMO2015 usually feature a higher, less negative bias and sometimes even a positive bias. For the UK, 10 of the simulations underestimate the return levels, while the remaining simulations overestimate them. The simulations are clearly more accurate for return levels of daily precipitation extremes than for hourly precipitation. RegCM4-6 and RCA4 gave the strongest underestimations and overestimations of the daily return levels, respectively. The biases are mostly negative for all countries except the UK.
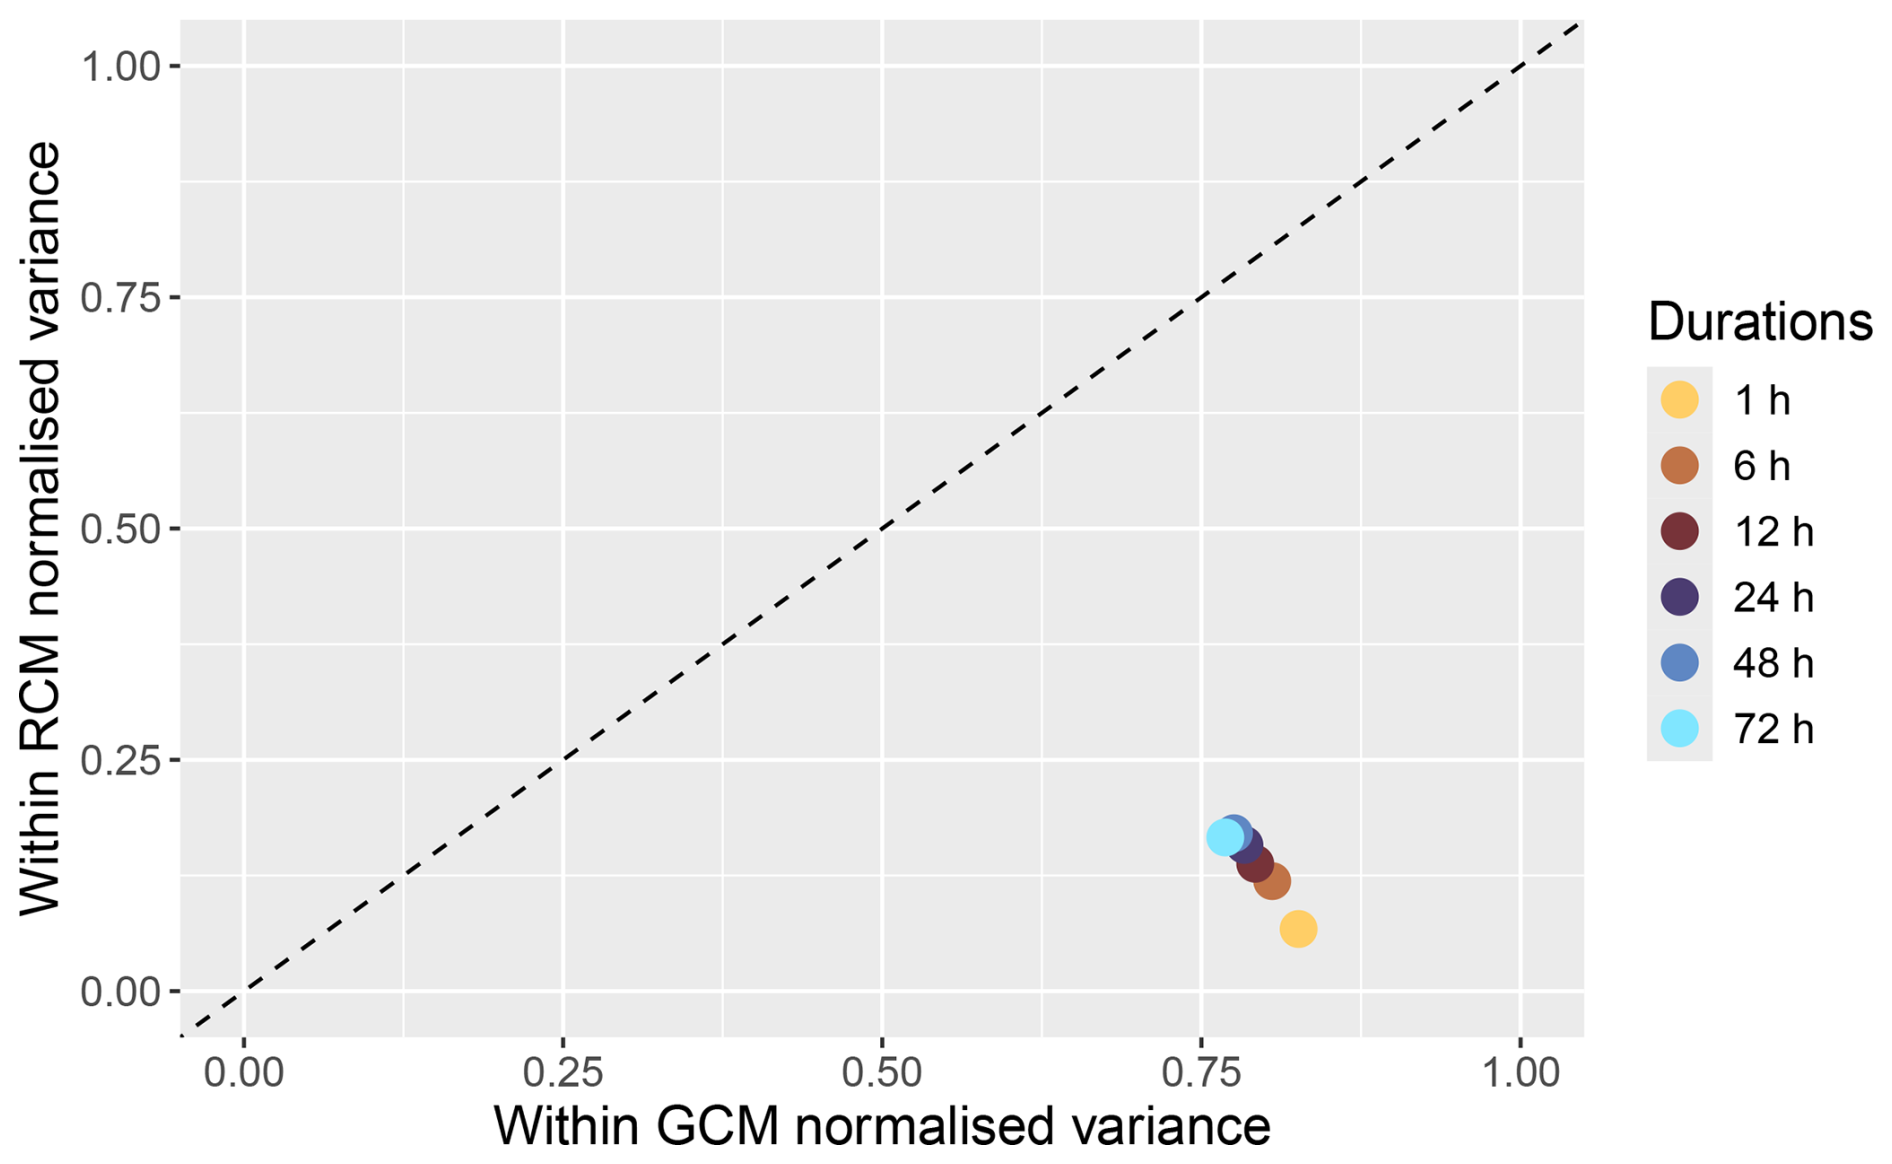
Figure 5Relative variance of the historical bias of the 10-year return levels of d-hourly precipitation in the EURO-CORDEX ensemble, split in contribution by RCM and GCM using the mean “within-GCM normalised variance” (WGNV) and mean “within-RCM normalised variance” (WRNV), see Appendix B. Colours indicate the rainfall duration.
In line with the method proposed by Vautard et al. (2021), the RCM and GCM contributions to the return level bias are disentangled by calculating the mean “within-GCM normalised variance” (WGNV) and the mean “within-RCM normalised variance” (WRNV) and we refer to Appendix B for technical details. The case WGNV ≈ WRNV indicates similar RCM and GCM contributions. If WGNV > WRNV, the contribution of the RCM to the bias dominates, while WGNV < WRNV signifies that the contribution of the GCM is more significant. The ensemble averaged results for the bias (Fig. 5) clearly confirm our earlier conclusion that the RCM is by far the largest contributor to the model bias of the rainfall extremes for all durations.
This section focuses on two main applications of the EURO-SUPREME dataset: the benchmarking of other simulations and climate-change analysis. First CPRCM runs are compared to the dataset, and afterwards the effect of climate change on the return levels of extreme precipitation is investigated in terms of frequency and intensity changes.
4.1 Benchmarking CPRCMs
Here we show how EURO-SUPREME can be used in a benchmarking experiment for the evaluation of extreme precipitation simulated by high-resolution convection-permitting models (CPRCMs). We provide an example by using CPRCM runs over Belgium, performed in the framework of the CORDEX.be project (Termonia et al., 2018; Van de Vyver et al., 2021), and comparing them to EURO-SUPREME and ground station data. We consider three historical CPRCM simulations: ALARO-0 (4 km, 1 run) and COSMO-CCLM (2.8 km, two runs with COSMO v5.0 and v6.0) of which more technical details can be found in Termonia et al. (2018, Table 2). The ground-station data consist of hourly precipitation observations at 176 stations in Belgium (Fig. S1 in the Supplement). The CPRCM biases are indicated by blue squares in Fig. 6a and can be compared with the EURO-SUPREME biases, shown as boxplots. The CPRCMs significantly reduce the bias wrt EURO-SUPREME for the hourly extremes as they fall (well) outside the ensemble quartile of EURO-SUPREME. This reduction gradually disappears as rainfall duration increases, and for 24 h extremes, the CPRCMs no longer add value.
Producing an acceptable bias may be considered a necessary but not a sufficient condition for adequate confidence in future projections. Enhanced reliability may come from the consideration of physically-meaningful performance metrics, such as the correct simulation of the diurnal cycle, the temperature and humidity dependency or the spatial structure (Westra et al., 2014; Cortés-Hernández et al., 2016; Van de Vyver et al., 2021; Dierickx, 2024). Here, we investigate whether the models can adequately reproduce the relationship between orography and extreme precipitation. Figure 6b shows the Spearman’s rank correlation between the 10-year return levels and elevation. The low correlations associated with the observations (black dots) with duration d≤12 h indicate a very limited orographic influence. The models, on the contrary, feature a much higher correlation, which is remarkably higher for CPRCMs. Consistent with this, it was noted that orographic effects in the Alps are not fully accounted for in CPRCMs (Dallan et al., 2023), although the elevation range over (southern) Belgium is much smaller than over the Alps.
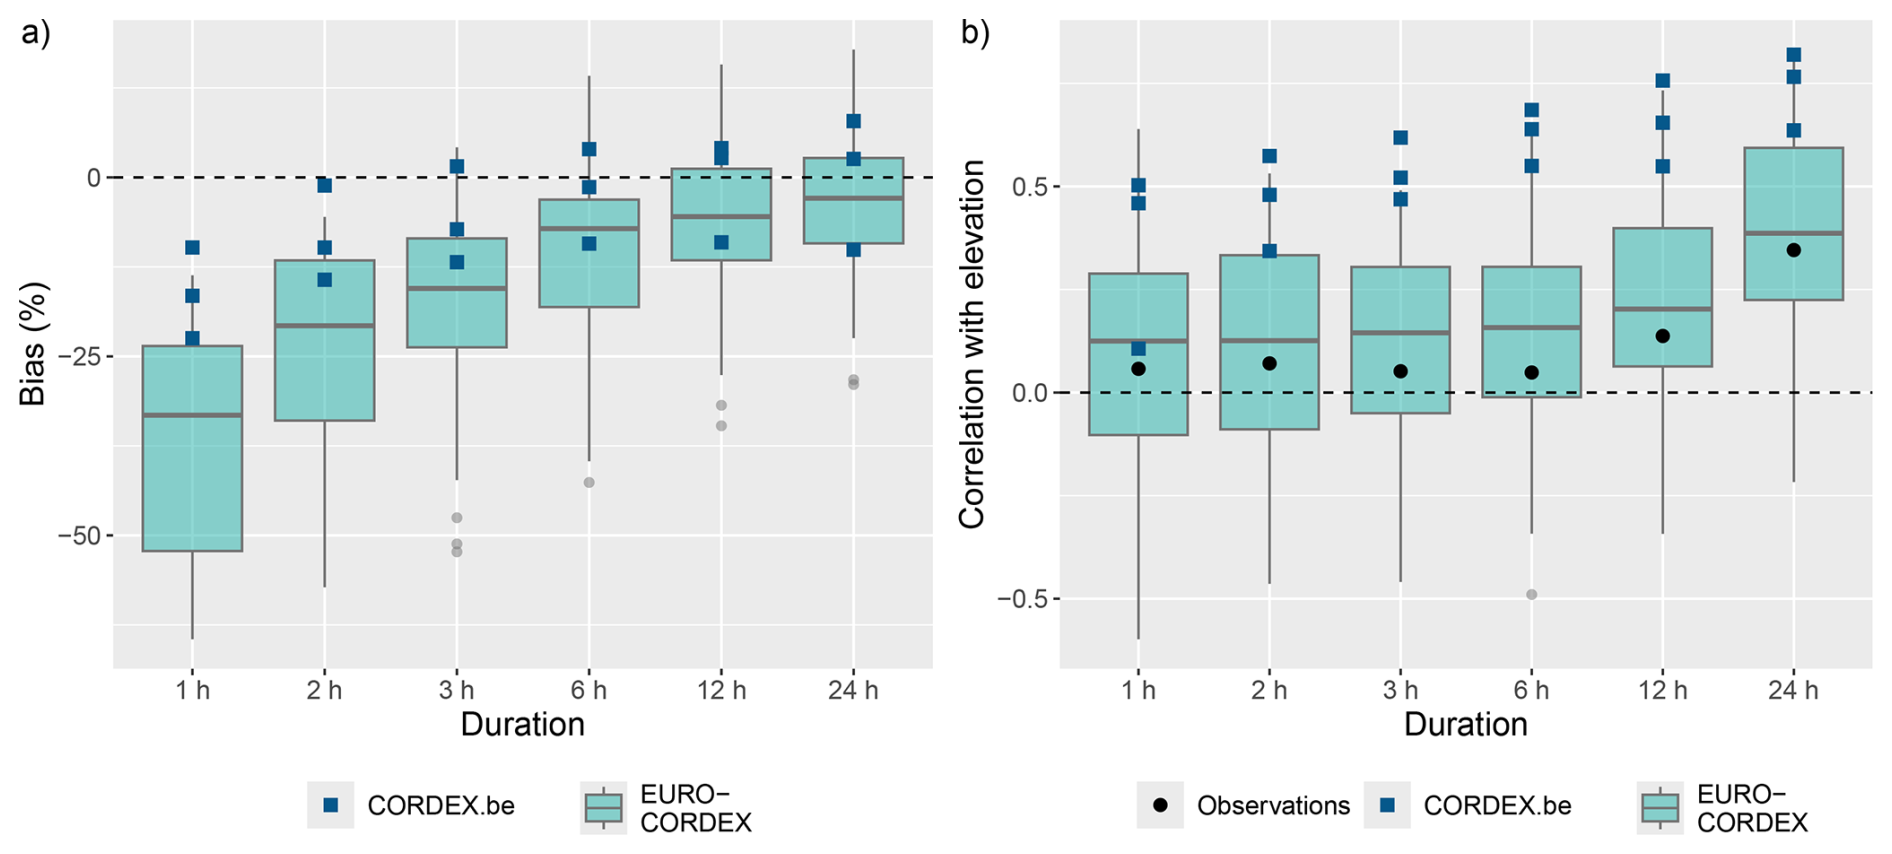
Figure 6(a) Relative bias (%) in the 10-year return levels based on EURO-SUPREME (boxplots) and the three high-resolution CPRCM runs of CORDEX.be. (b) Spearman's rank correlation of elevation versus 10-year return levels for EURO-SUPREME (boxplots), observations (black dots) and the CORDEX.be CPRCM runs (blue squares).
4.2 Changes in EURO-CORDEX rainfall extremes under global warming
Changes in intensity and frequency of precipitation extremes between global warming levels (GWLs) of 1.5 and 3 °C in the EURO-CORDEX simulations were investigated. Periods corresponding to a particular GWL are identified as the first 30-year period for which the global average near-surface temperature of the forcing GCM reaches the GWL as compared to the pre-industrial period 1881–1910 (Vautard et al., 2014; Jacob et al., 2018). The periods are taken from Vautard et al. (2014) and are listed in Table S4.Vautard et al. (2014) argue that this methodology with fixed global warming levels is more robust than using fixed time periods as some uncertainty from the climate sensitivity of the GCMs is removed.
For the eight European “PRUDENCE” subregions (Christensen et al., 2007), we calculate (i) the change in intensity using changes in 10-year return levels, similar to Vautard et al. (2014), and, (ii) the change in frequency using changes in the annual exceedance probability of fixed reference thresholds, similar to Fischer and Knutti (2016).
4.2.1 Change in intensity
The relative intensity difference per degree warming is obtained using the T-year return levels for 1.5 °C GWL (denoted ) and 3 °C GWL (denoted ), as follows:
where 𝔼[.] is the average over all gridpoints of the domain. Figure 7 shows the boxplots of the relative change in 10-year return levels, for hourly and daily precipitation extremes. There is a clear increase in the return-level intensities between GWL 1.5 and 3°C. Moreover, the (median) increases for hourly precipitation are consistently larger than for daily precipitation and, in most regions, the ensemble spread is larger for hourly than for daily precipitation. The ensemble spread for the hourly extremes is the largest over the Alps, France and Mid-Europe. The ensemble median for all regions ranges between 5.5 % over the Iberian Peninsula, in line with a general drying in that region (Coppola et al., 2021), and around 7 % over the Alps, agreeing with Giorgi et al. (2016). The median increase in the return level of daily precipitation extremes is lower than for hourly mean precipitation extremes, with only the upper whiskers of the boxplots crossing the 7 % reference line.
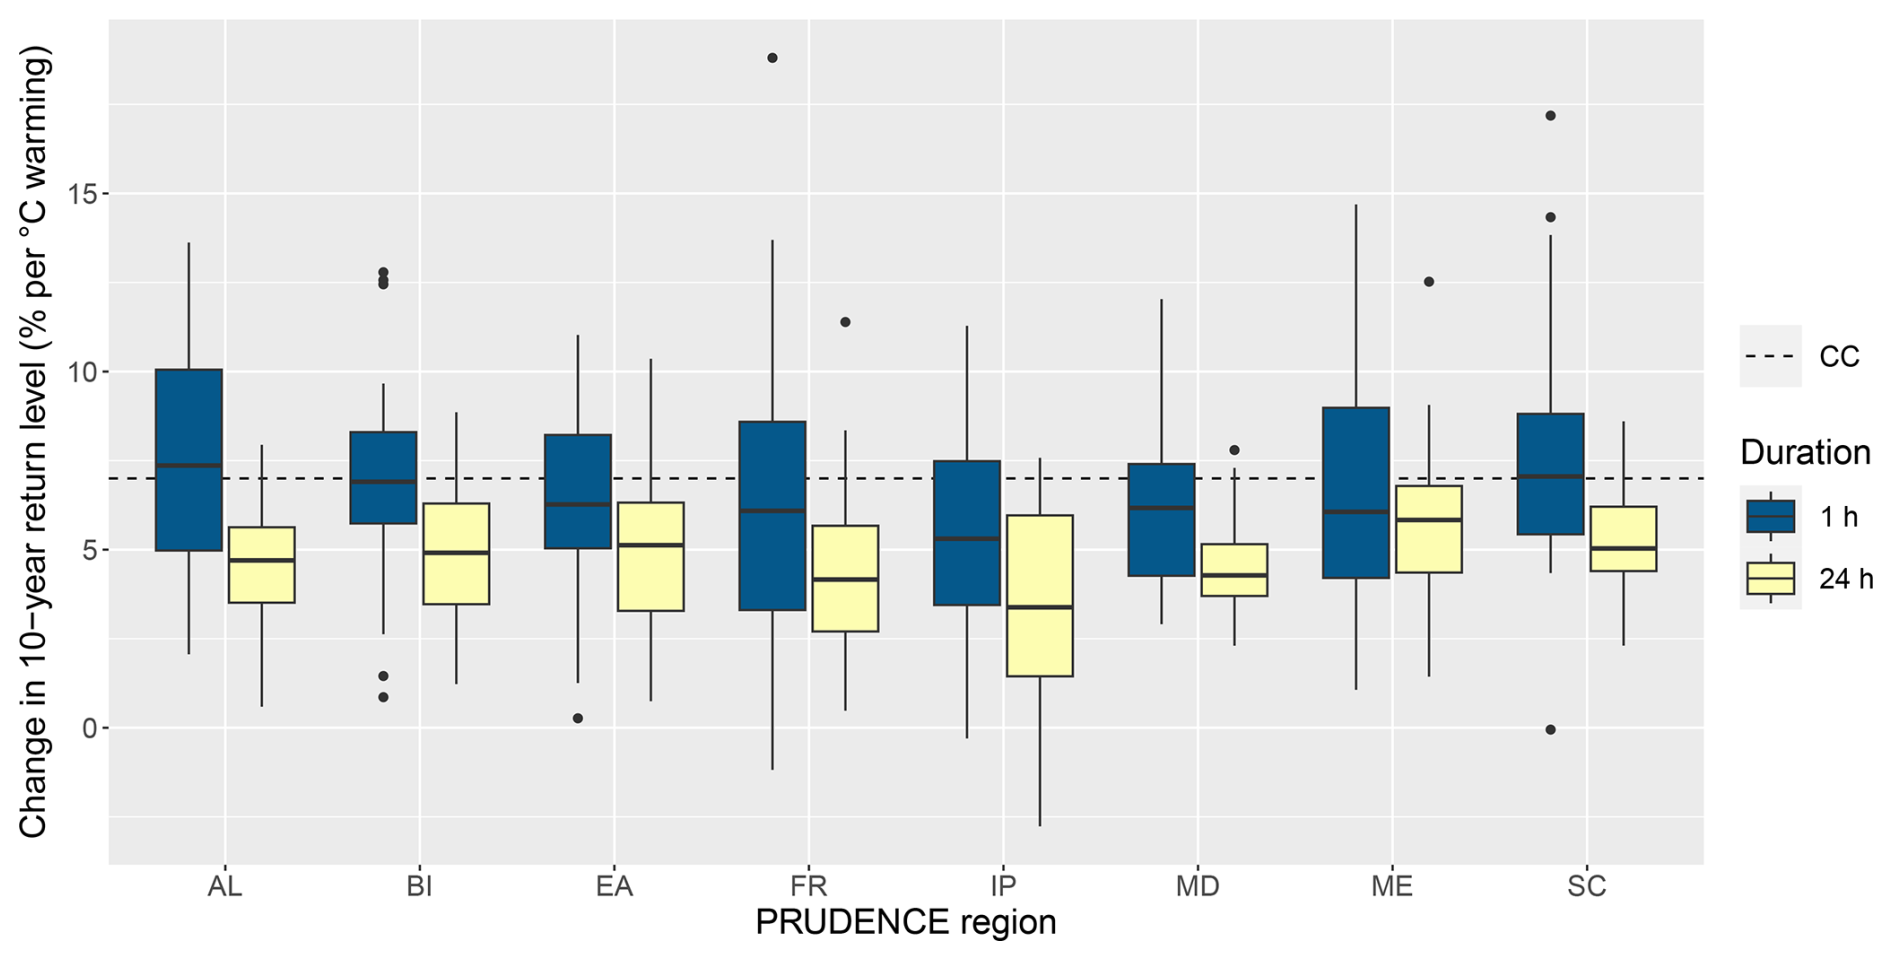
Figure 7Boxplots showing the change in 10-year return levels of hourly and daily precipitation at 3 °C GWL compared to 1.5 °C GWL in the EURO-CORDEX ensemble, grouped by PRUDENCE region. SC stands for Scandinavia, BI for the British Isles, ME for Mid-Europe, EA for Eastern Europe, FR for France, AL for the Alps, IP for the Iberian Peninsula and MD for the Mediterranean. The colour of each boxplot indicates the rainfall duration. The CC-rate of 7 % is indicated with the horizontal dashed line.
An alternative averaging approach to the relative change of the domain-averaged intensities (Eq. 1) is to use the domain averages of the relative intensity change. This amounts to slightly different results, namely a lower ensemble mean in the second case, but the general conclusions still hold (Dierickx, 2024, their Fig. 5.27–5.28).
4.2.2 Change in frequency
Figure 8 shows the annual exceedance probabilities (upper panels) and their changes (lower panels) for 1 and 24 h-precipitation extremes over Mid-Europe. In the top panels, the black dots represent the reference, which is the obvious relationship between return period T (year) and annual exceedance probability of the T-year return level, i.e. (%). The green shading and dotted line, on the other hand, correspond to the domain-averaged exceedance probability at 3 °C GWL, calculated by how often the 3 °C GWL annual maxima are expected to exceed the 1.5 °C return levels. More specifically:
Annual exceedance probability of
with G(3) the fitted GEV-distribution at 3 °C GWL.
The relative changes of the domain-averaged annual exceedance probability between 3 and 1.5 °C are shown in the lower panels of Fig. 8. For example, for a return period of T=100 years, the return level of hourly precipitation at 1.5 °C GWL is three times more likely to be exceeded at 3 °C GWL according to the ensemble mean. The models unanimously agree on a frequency increase for all return periods. The longer the return period, the higher the relative frequency increase for both hourly and daily precipitation. The ensemble spread, represented by the shading, also increases with the return period.
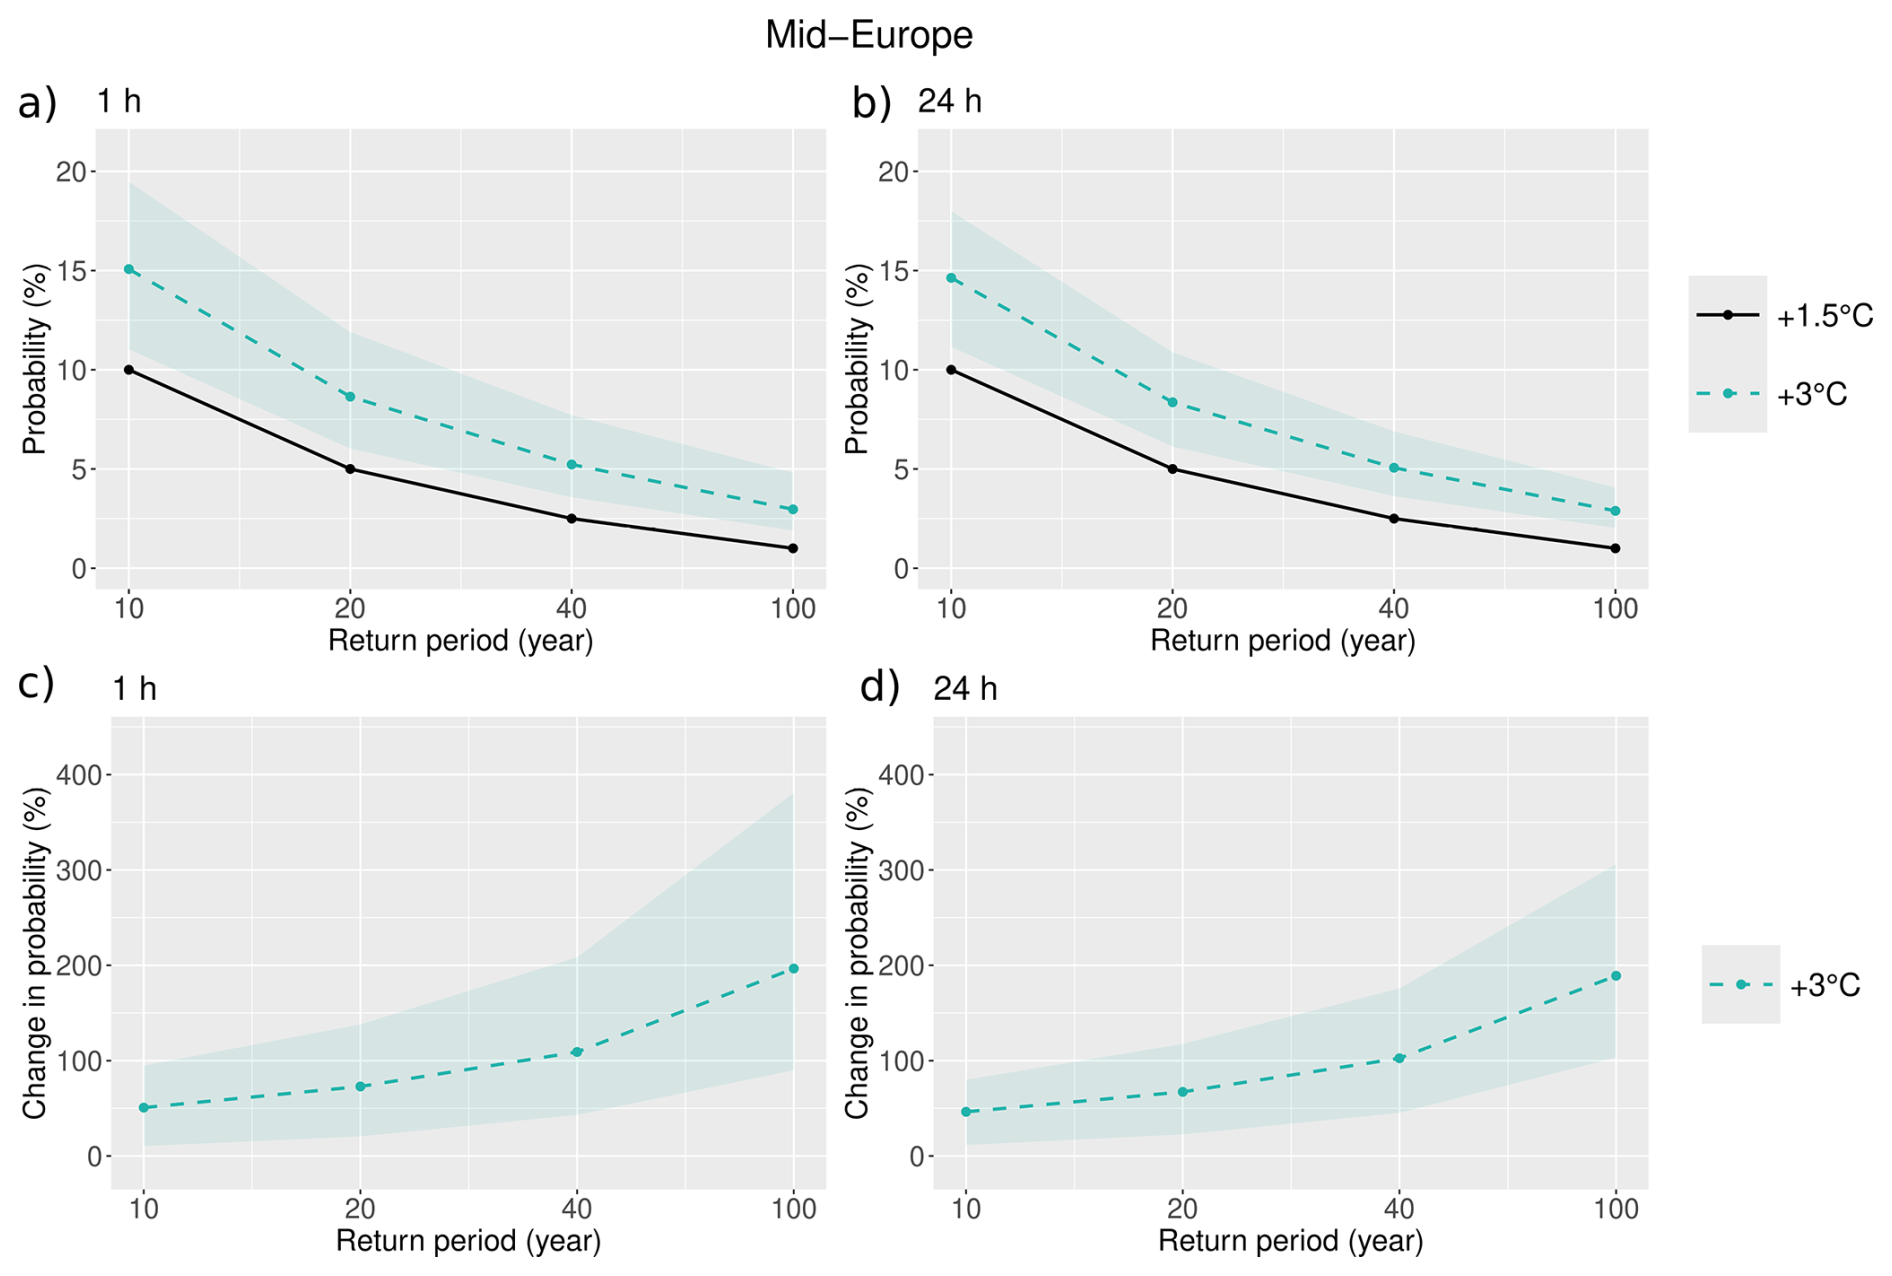
Figure 8(a–b) annual exceedance probability (%) of the T-year return levels for 1.5 °C GWL () as a function of return period T (year), for Mid-Europe. The black line shows this probability at 1.5 °C GWL, and acts as a reference. Shading represents the minimum-maximum range in the EURO-CORDEX ensemble of the annual exceedance probability at 3 °C GWL, and the dashed line is the associated ensemble mean. (c–d) the corresponding relative change of this probability between GWLs 3 and 1.5 °C. Results for hourly and daily precipitation extremes can be seen in the left and right column, respectively.
The EURO-SUPREME dataset is made available under CC-BY-4.0 licence through the German Climate Computing Centre (DKRZ) and can be accessed via https://doi.org/10.26050/WDCC/EUCOR_prec_v2 (Van de Vyver et al., 2025).
The high-resolution convection-permitting simulations over Belgium used in Sect. 4 were developed in the CORDEX.be project (Termonia et al., 2018) and are available at https://www.geo.be/catalog/details/22dc62f0-ca7f-11ee-9a71-847b573ec00f?l=en (Belgian Climate Center, 2025).
The hourly station observations of precipitation used in Sect. 4 come from several Belgian monitoring networks managed by:
-
Royal Meteorological Institute (RMI). Data available at https://opendata.meteo.be/download (Royal Meteorological Institute of Belgium, 2025).
-
Vlaamse Milieumaatschappij (VMM). Data available at https://waterinfo.vlaanderen.be/ (Flemish Governement, 2025)
-
Service Public de Wallonie (SPW) – Mobilité et Infrastructures. The data may be requested from the Service public de Wallonie – Mobilité et Infrastructures, Direction de la Gestion hydrologique, PEREX, Rue Del’Grête, 22, 5020 NAMUR (Daussoulx).
-
Bruxelles Environnement – Leefmilieu Brussel. The IBGE rainfall monitoring network is set up by the Ministry of the Brussels-Capital Region and managed since 2007 by the IBGE (Dehem et al., 2010; Journée et al., 2014) and the data can be obtained upon request at https://environnement.brussels (last access: 3 December 2025).
The code used to calculate the return levels and create the figures can be found in the following GitHub repository: https://github.com/anodieri/extreme-precipitation-figures (Dierickx, 2025). Specifically, statistical modelling in Appendix A was performed with R packages for extreme value analysis. In particular, probability-weighted estimation was made with function gevFit of package fExtremes, and return level computation was made with function qgev of package evd.
The EURO-SUPREME dataset introduced here contains sub-daily extreme precipitation events derived from a 35-member EURO-CORDEX 0.11° ensemble that includes both historical and future (RCP8.5) scenarios. The dataset contains accumulated precipitation depths over periods ranging from 1 to 72 h, for each grid point of the EURO-CORDEX domain. Among the many potential uses of this dataset, we illustrated how the dataset can serve as a benchmark for evaluating high-resolution CPRCMs.
Validation of the models within the EURO-SUPREME dataset using observations shows that, for all countries investigated, EURO-CORDEX models produce return levels of daily rainfall extremes more accurately than for hourly extremes and biases are mainly determined by the RCM. Hourly extremes are often severely underestimated, while daily extremes are sometimes overestimated. The validation results are reasonably similar between countries, with the UK differing slightly more from the others. The significant model biases motivate the need to apply appropriate bias-adjustment techniques (Schmith et al., 2021; Van de Vyver et al., 2023).
The EURO-CORDEX models unanimously project an increase in the 10-year return levels between GWLs 1.5 and 3 °C. On a relative basis, return levels for shorter rainfall durations will increase more than those for longer durations. There is, however, a large model spread in the relative increase of the return levels, which is fairly similar between the PRUDENCE regions. For hourly precipitation, the ensemble median for each region lies slightly below the CC rate, while it is systematically smaller for daily than for hourly extremes. Moreover, the frequency of exceeding the return levels at 1.5 °C GWL will rise at 3 °C GWL. A larger relative increase in frequency is seen for more intense extreme precipitation events, cf. Fischer and Knutti (2016).
As in Berg et al. (2019) and Poschlod et al. (2021), simulated precipitation extremes were validated by comparing 10-year return values between simulations and observations. Due to the limited ensemble sizes per model, the uncertainties may be large (Wehner, 2010). Poschlod and Ludwig (2021), for instance, show that the impact of internal variability is reduced within a 50-member ensemble of single RCM initial-condition simulations. On the other hand, the EURO-SUPREME dataset may provide a more complete picture of model errors using a 35-member multi-model ensemble consisting of 27 different GCM-RCM pairs, which is also considerably larger than the 9-member ensemble of Berg et al. (2019). In addition, uncertainty of observed return levels may be determined by the statistical method used to obtain national precipitation statistics which may differ from country to country. However, a comparative study in Poschlod et al. (2021) shows that the observed return levels show smooth transitions between the borders of neighbouring countries, and the reference can therefore be considered reliable. The recently released GSDR-I dataset (Pritchard et al., 2023) of extreme indices of observed sub-daily precipitation may be used to extend our model-validation efforts.
The EURO-SUPREME dataset contains only annual maxima and no return levels. This offers more flexibility for the user, for example when choosing the fitting period or performing more advanced assessments, such as intensity-duration-frequency (IDF) analysis (Hosseinzadehtalaei et al., 2020) or extremal dependence over space based on variogram analysis (Cooley et al., 2006; Cortés-Hernández et al., 2016; Van de Vyver et al., 2021; Yang et al., 2023). In fact, there are numerous user-friendly software packages for extreme-value analyses (Belzile et al., 2023).
For the selection of extreme events, we chose annual maxima of accumulated precipitation, because there is a well-founded theory for modelling them statistically (Coles, 2001; Beirlant et al., 2004). The alternative to the block-maxima method, the peaks-over-threshold method, includes more data and can therefore reduce uncertainty but it has the disadvantage that the choice of the optimal threshold (e.g. in the form of a high quantile of non-zero precipitation) is subjective and can vary spatially. On the other hand, there is a strong theoretical relationship between block maxima and threshold models (Coles, 2001). Also, the uncertainty of the block maxima method can be reduced by combining data spatially in a spatial regression model for extremes (Casson and Coles, 1999; Cooley et al., 2007; Van de Vyver, 2012).
In addition to benchmarking, the simulated return levels of daily precipitation can be used in areas with little data (although with some caution for orographically complex regions) because validation shows a fairly good agreement with observations, an idea already suggested by Poschlod et al. (2021). Assuming the models are equally plausible, the multi-model ensemble average can be considered, which is generally known to provide better estimates than a single model (Tebaldi and Knutti, 2007). Alternatively, a weighted multi-model simulation based on model quality or climate sensitivity can be taken into account (Knutti et al., 2017; Massoud et al., 2023). Finally, extreme-event attribution studies are usually made more robust by complementing observations with multi-model simulations (Philip et al., 2020; Tradowsky et al., 2023; Kimutai et al., 2024) such as our EURO-SUPREME dataset.
The T-return level, zT, corresponds to the value that is expected to be exceeded on average once per T years, and can be computed by means of an extreme-value distribution. Annual maxima are commonly modelled with the generalised extreme value (GEV) distribution where the cumulative probability distribution has the form (Coles, 2001):
where μ is the location parameter, σ>0 is the scale parameter and ξ is the shape parameter. For each grid point and rainfall duration, we fit the GEV distribution to the annual maximum series using the probability-weighted method (Hosking et al., 1985). This estimator has the advantage of low variance and is less sensitive to outliers compared to the maximum-likelihood estimator, especially for small sample sizes (Martins and Stedinger, 2000). The output of the GCM-RCM simulations using multiple GCM members (see Table 1) was combined into a long time series for each grid point.
After the GEV parameters are fitted to an annual maximum series, the return levels can be computed by inverting the equation: , with G given in Eq. (A1). We get:
The contributions of the GCM and RCM to the total simulation error can be disentangled by calculating the mean “within-GCM normalised variance” (WGNV) and the mean “within-RCM normalised variance” (WGRV), similar to Vautard et al. (2021). For each GCM i and RCM j, the following definitions are used for decomposing the variance of the historical bias B:
where Bij,k is the bias of RCM j downscaling GCM i in country k. Furthermore, the mean bias per RCM and GCM and the normalisation factor per country are given by:
where is the number of simulations forced with GCM i, is the number of simulations with RCM j and N is the total number of (available) simulations. Note that this definition is slightly different from the one used in Vautard et al. (2021), who use a single normalization factor for all countries (or subdomains) and may therefore exceed the value of one.
If, for example, the bias is solely determined by the GCM i, the associated WGNVi would be zero, as Bij,k would not depend on the RCM j ( for every RCM j). Similarly, if the bias only depends on the RCM j, the WRNVj would be zero. The maximum value for WRNVj and WGNVi, on the other hand, can be easily proven to be one. These quantities can thus be used to see whether the GCM or the RCM dominates the bias.
Finally, we calculate the mean WGNV and mean WRNV as the weighted averages over all GCMs and RCMs, respectively:
The supplement related to this article is available online at https://doi.org/10.5194/essd-17-6747-2025-supplement.
AD, BVS and HVDV wrote the manuscript with contributions from all co-authors. Formal data analysis, validation, interpretation, and visualization were performed by AD, under supervision of WD, BVS, SC and HVDV. BVS, SC and HVDV conceptualised the study. HVDV, BVS and LD did the data processing. HVDV liaised with supporting organisations (notably DKRZ). PT, SC and BVS were responsible for the project administration.
The contact author has declared that none of the authors has any competing interests.
Publisher’s note: Copernicus Publications remains neutral with regard to jurisdictional claims made in the text, published maps, institutional affiliations, or any other geographical representation in this paper. While Copernicus Publications makes every effort to include appropriate place names, the final responsibility lies with the authors. Views expressed in the text are those of the authors and do not necessarily reflect the views of the publisher.
This research was supported by the Belgian Science Policy (BELSPO) under Contract B2/223/P1/CORDEXbeII. We also acknowledge the Earth System Grid Federation infrastructure, an international effort led by the U.S. Department of Energy's Program for Climate Model Diagnosis and Intercomparison, the European Network for Earth System Modelling and other partners in the Global Organisation for Earth System Science Portals (GO-ESSP).
This research has been supported by the Belgian Federal Science Policy Office (grant no. B2/223/P1/CORDEXbeII).
This paper was edited by Martina Stockhause and reviewed by two anonymous referees.
Barnes, C. R., Chandler, R. E., and Brierley, C. M.: A comparison of regional climate projections with a range of climate sensitivities, J. Geophys. Res.-Atmos., 129, e2023JD038917, https://doi.org/10.1029/2023JD038917, 2024. a
Beirlant, J., Goegebeur, Y., Segers, J., and Teugels, J.: Statistics of Extremes, John Wiley & Sons, Ltd, https://doi.org/10.1002/0470012382, 2004. a
Belgian Climate Center: Climate projections for Belgium, Belgian Climate Center [data set], https://www.geo.be/catalog/details/22dc62f0-ca7f-11ee-9a71-847b573ec00f?l=en, last access: 16 October 2025. a
Belzile, L. R., Dutang, C., Northrop, P. J., and Opitz, T.: A modeler’s guide to extreme value software, Extremes, 26, 595–638, https://doi.org/10.1007/s10687-023-00475-9, 2023. a
Berg, P., Christensen, O. B., Klehmet, K., Lenderink, G., Olsson, J., Teichmann, C., and Yang, W.: Summertime precipitation extremes in a EURO-CORDEX 0.11° ensemble at an hourly resolution, Nat. Hazards Earth Syst. Sci., 19, 957–971, https://doi.org/10.5194/nhess-19-957-2019, 2019. a, b, c, d
Canepa, L.: Methodology for the assessment of climate-related risks in Private Equity investment portfolios, Ph.D. thesis, Politecnico di Torino, https://webthesis.biblio.polito.it/28274/ (last access: 3 December 2025), 2023. a
Cannon, A. J., Jeong, D.-I., and Yau, K.-H.: Updated observations provide stronger evidence for increases in subhourly to hourly extreme rainfall in Canada, J. Clim., 37, 3393–3411, https://doi.org/10.1175/JCLI-D-23-0501.1, 2024. a
Casson, E. and Coles, S.: Spatial regression models for extremes, Extremes, 1, 449–468, https://doi.org/10.1023/A:1009931222386, 1999. a
Christensen, J. H., Carter, T. R., Rummukainen, M., and Amanatidis, G.: Evaluating the performance and utility of regional climate models: the PRUDENCE project, Clim. Change, 81, 1–6, https://doi.org/10.1007/s10584-006-9211-6, 2007. a
Coles, S.: An Introduction to Statistical Modeling of Extreme Values, Springer-Verlag, London Ltd, https://doi.org/10.1007/978-1-4471-3675-0, 2001. a, b, c
Cooley, D., Naveau, P., and Poncet, P.: Variograms for spatial max-stable random fields, in: Dependence in Probability and Statistics, edited by: Bertail, P., Soulier, P., and Doukhan, P., 373–390, Springer, https://doi.org/10.1007/0-387-36062-X, 2006. a
Cooley, D., Nychka, D., and Naveau, P.: Bayesian Spatial Modeling of Extreme Precipitation Return Levels, J. Am. Stat. Assoc., 102, 824–840, https://doi.org/10.1198/016214506000000780, 2007. a
Copernicus Climate Change Service (C3S): European State of the Climate 2023, summary, https://doi.org/10.24381/bs9v-8c66, 2024. a
Coppola, E., Nogherotto, R., Ciarlò, J. M., Giorgi, F., van Meijgaard, E., Kadygrov, N., Iles, C., Corre, L., Sandstad, M., Somot, S., Nabat, P., Vautard, R., Levavasseur, G., Schwingshackl, C., Sillmann, J., Kjellström, E., Nikulin, G., Aalbers, E., Lenderink, G., Christensen, O. B., Boberg, F., Sørland, S. L., Demory, M.-E., Bülow, K., Teichmann, C., Warrach-Sagi, K., and Wulfmeyer, V.: Assessment of the European climate projections as simulated by the large EURO-CORDEX regional and global climate model ensemble, J. Geophys. Res.-Atmos., 126, e2019JD032356, https://doi.org/10.1029/2019JD032356, 2021. a
Cortés-Hernández, V. E., Zheng, F., Evans, J., Lambert, M., Sharma, A., and Westra, S.: Evaluating regional climate models for simulating sub-daily rainfall extremes, Clim. Dyn., 47, 1613–1628, https://doi.org/10.1007/s00382-015-2923-4, 2016. a, b, c
Dallan, E., Marra, F., Fosser, G., Marani, M., Formetta, G., Schär, C., and Borga, M.: How well does a convection-permitting regional climate model represent the reverse orographic effect of extreme hourly precipitation?, Hydrol. Earth Syst. Sci., 27, 1133–1149, https://doi.org/10.5194/hess-27-1133-2023, 2023. a
Dehem, D., Tricot, C., Wylleman, P., and Rafiq, H.: Validation des données du réseau pluviométrique géré par l’IBGE, répartition des précipitations, analyse qualitative des sites de mesure et projet de micro-climatologie en Région bruxelloise, Tech. rep., Bruxelles Environnement / Leefmilieu Brussel, https://document.environnement.brussels/opac_css/index.php?lvl=notice_display&id=9393 (last access: 16 October 2025), 2010. a
Dierickx, A.: Precipitation extremes in regional and convection-permitting climate models: validation and future projections, Master thesis, Ghent University, https://lib.ugent.be/catalog/rug01:003202690 (last access: 16 October 2025), 2024. a, b, c
Dierickx, A.: anodieri/extreme-precipitation-figures: v1.0 (v1.0), Zenodo [code], https://doi.org/10.5281/zenodo.17375883, 2025. a
Doblas-Reyes, F., Sörensson, A., Almazroui, M., Dosio, A., Gutowski, W., Haarsma, R., Hamdi, R., Hewitson, B., Kwon, W.-T., Lamptey, B., Maraun, D., Stephenson, T., Takayabu, I., Terray, L., Turner, A., and Zuo, Z.: Linking Global to Regional Climate Change, in: Climate Change 2021: The Physical Science Basis. Contribution of Working Group I to the Sixth Assessment Report of the Intergovernmental Panel on Climate Change, edited by Masson-Delmotte, V., Zhai, P., Pirani, A., Connors, S. L., Péan, C., Berger, S., Caud, N., Chen, Y., Goldfarb, L., Gomis, M. I., Huang, M., Leitzell, K., Lonnoy, E., Matthews, J. B. R., Maycock, T. K., Waterfield, T., Yelekçi, O., Yu, R., and Zhou, B., book section 10, Cambridge University Press, Cambridge, UK and New York, NY, USA, 1363–1512, https://doi.org/10.1017/9781009157896.012, 2021. a
Durman, C. F., Gregory, J. M., Hassell, D. C., Jones, R. G., and Murphy, J. M.: A comparison of extreme European daily precipitation simulated by a global and a regional climate model for present and future climates, Q. J. Roy. Meteor. Soc., 127, 1005–1015, https://doi.org/10.1002/qj.49712757316, 2001. a
DWD Climate Data Center (CDC): Grids of return periods of heavy precipitation (design precipitation) over Germany (KOSTRA-DWD), version 2010R, https://opendata.dwd.de/climate_environment/CDC/grids_germany/return_periods/precipitation/KOSTRA/KOSTRA_DWD_2010R/asc/ (last access: 16 October 2025), 2020. a
European Commission: Climate Delegated Act, Annex I, Appendix A, Official Journal of the European Union, https://eur-lex.europa.eu/eli/C/2023/267/oj (last access: 16 October 2025), 2022. a
Fischer, E. M. and Knutti, R.: Observed heavy precipitation increase confirms theory and early models, Nature Clim. Change, 6, 986–991, https://doi.org/10.1038/nclimate3110, 2016. a, b
Flemish Governement: Waterinfo, Flemish Governement [data set], https://waterinfo.vlaanderen.be/, last access: 16 October 2025. a
Fowler, H. J., Lenderink, G., Prein, A. F., Westra, S., Allan, R. P., Ban, N., Barbero, R., Berg, P., Blenkinsop, S., Do, H. X., Guerreiro, S., Haerter, J. O., Kendon, E. J., Lewis, E., Schaer, C., Sharma, A., Villarini, G., Wasko, C., and Zhang, X.: Anthropogenic intensification of short-duration rainfall extremes, Nat. Rev. Earth Environ., 2, 107–122, https://doi.org/10.1038/s43017-020-00128-6, 2021. a
Giorgi, F., Torma, C., Coppola, E., Ban, N., Schär, C., and Somot, S.: Enhanced summer convective rainfall at Alpine high elevations in response to climate warming, Nature Geosci., 9, 584–589, https://doi.org/10.1038/ngeo2761, 2016. a
Gutowski Jr., W. J., Giorgi, F., Timbal, B., Frigon, A., Jacob, D., Kang, H.-S., Raghavan, K., Lee, B., Lennard, C., Nikulin, G., O'Rourke, E., Rixen, M., Solman, S., Stephenson, T., and Tangang, F.: WCRP COordinated Regional Downscaling EXperiment (CORDEX): a diagnostic MIP for CMIP6, Geosci. Model Dev., 9, 4087–4095, https://doi.org/10.5194/gmd-9-4087-2016, 2016. a
Hosking, J. R. M., Wallis, J. R., and Wood, E. F.: Estimation of the generalized extreme-value distribution by the method of probability-weighted moments, Technometrics, 27, 251–261, https://doi.org/10.1080/00401706.1985.10488049, 1985. a
Hosseinzadehtalaei, P., Tabari, H., and Willems, P.: Climate change impact on short-duration extreme precipitation and intensity–duration–frequency curves over Europe, J. Hydrol., 590, 125 249, https://doi.org/10.1016/j.jhydrol.2020.125249, 2020. a
IPCC: Climate Change 2023: Synthesis Report. Contribution of Working Groups I, II and III to the Sixth Assessment Report of the Intergovernmental Panel on Climate Change, edited by: Lee, H. and Romero, J., IPCC, Geneva, Switzerland, https://doi.org/10.59327/IPCC/AR6-9789291691647, 2023. a
Jacob, D., Petersen, J., Eggert, B., Alias, A., Christensen, O. B., Bouwer, L. M., Braun, A., Colette, A., Déqué, M., Georgievski, G., Georgopoulou, E., Gobiet, A., Menut, L., Nikulin, G., Haensler, A., Hempelmann, N., Jones, C., Keuler, K., Kovats, S., Kröner, N., Kotlarski, S., Kriegsmann, A., Martin, E., van Meijgaard, E., Moseley, C., Pfeifer, S., Preuschmann, S., Radermacher, C., Radtke, K., Rechid, D., Rounsevell, M., Samuelsson, P., Somot, S., Soussana, J.-F., Teichmann, C., Valentini, R., Vautard, R., Weber, B., and Yiou, P.: EURO-CORDEX: new high-resolution climate change projections for European impact research, Reg. Environ. Change, 14, 563–578, https://doi.org/10.1007/s10113-013-0499-2, 2014. a, b
Jacob, D., Kotova, L., Teichmann, C., Sobolowski, S. P., Vautard, R., Donnelly, C., Koutroulis, A. G., Grillakis, M. G., Tsanis, I. K., Damm, A., Sakalli, A., and van Vliet, M. T. H.: Climate impacts in Europe under+ 1.5 °C global warming, Earth's Future, 6, 264–285, 2018. a
Jacob, D., Teichmann, C., Sobolowski, S., Katragkou, E., Anders, I., Belda, M., Benestad, R., Boberg, F., Buonomo, E., Cardoso, R. M., Casanueva, A., Christensen, O. B., Christensen, J. H., Coppola, E., De Cruz, L., Davin, E. L., Dobler, A., Domínguez, M., Fealy, R., Fernandez, J., Gaertner, M. A., García-Díez, M., Giorgi, F., Gobiet, A., Goergen, K., Gómez-Navarro, J. J., Alemán, J. J. G., Gutiérrez, C., Gutiérrez, J. M., Güttler, I., Haensler, A., Halenka, T., Jerez, S., Jiménez-Guerrero, P., Jones, R. G., Keuler, K., Kjellström, E., Knist, S., Kotlarski, S., Maraun, D., van Meijgaard, E., Mercogliano, P., Montávez, J. P., Navarra, A., Nikulin, G., de Noblet-Ducoudré, N., Panitz, H.-J., Pfeifer, S., Piazza, M., Pichelli, E., Pietikäinen, J.-P., Prein, A. F., Preuschmann, S., Rechid, D., Rockel, B., Romera, R., Sánchez, E., Sieck, K., Soares, P. M. M., Somot, S., Srnec, L., Sørland, S. L., Termonia, P., Truhetz, H., Vautard, R., Warrach-Sagi, K., and Wulfmeyer, V.: Regional climate downscaling over Europe: perspectives from the EURO-CORDEX community, Reg. Environ. Change, 20, 51, https://doi.org/10.1007/s10113-020-01606-9, 2020. a, b
Jones, R. G., Murphy, J. M., and Noguer, M.: Simulation of climate change over Europe using a nested regional-climate model. I: Assessment of control climate, including sensitivity to location of lateral boundaries, Q. J. Roy. Meteor. Soc., 121, 1413–1449, https://doi.org/10.1002/qj.49712152610, 1995. a
Journée, M., Tricot, C., Verhumst, K., Hamdi, R., and Dehem, D.: Réseau de pluviomètres: validation des données, répartition des précipitations et projet d’étude “ changement climatique et ressources en eau” en Région bruxelloise, Tech. rep., Bruxelles Environnement / Leefmilieu Brussel, https://document.environnement.brussels/opac_css/elecfile/RAP_ValidationDonneesReseauPluvio2014 (last access: 16 October 2025), 2014. a
Junghänel, T., Ertel, H., and Deutschländer, T.: Bericht zur Revision der koordinierten Starkregenregionalisierung und -auswertung des Deutschen Wetterdienstes in der Version 2010 (Report on the revision of the German Weather Service's coordinated heavy rain regionalisation and evaluation in version 2010), Tech. rep., KOSTRA-DWD-2010, 2017. a
Katragkou, E., Sobolowski, S. P., Teichmann, C., Solmon, F., Pavlidis, V., Rechid, D., Hoffmann, P., Fernandez, J., Nikulin, G., and Jacob, D.: Delivering an improved framework for the new generation of CMIP6-driven EURO-CORDEX regional climate simulations, B. Am. Meteorol. Soc., 105, E962–E974, https://doi.org/10.1175/BAMS-D-23-0131.1, 2024. a, b
Kendon, E., Short, C., Cotterill, D., Pirret, J., Chan, S., and Pope, J.: UK Climate Projections: UKCP Local (2.2km) Transient Projections, Tech. rep., Met Office, https://www.metoffice.gov.uk/binaries/content/assets/metofficegovuk/pdf/research/ukcp/ukcp_local_report_2023.pdf (last access: 16 October 2025), 2023. a
Kendon, E. J., Prein, A. F., Senior, C. A., and Stirling, A.: Challenges and outlook for convection-permitting climate modelling, Philos. Trans. R. Soc. A, 379, 20190547, https://doi.org/10.1098/rsta.2019.0547, 2021. a
Kimutai, J., Vautard, R., Zachariah, M., Tolasz, R., Šustková, V., Cassou, C., Skalák, P., Clarke, B., Haslinger, K., Vahlberg, M., Singh, R., Stephens, E., Cloke, H., Raju, E., Baumgart, N., Thalheimer, L., Chojnicki, B., Otto, F., Koren, G., Philip, S., Kew, S. and, H. P., Vibert, J., and von Weissenberg, A.: Climate change and high exposure increased costs and disruption to lives and livelihoods from flooding associated with exceptionally heavy rainfall in Central Europe, Tech. rep., World Weather Attribution, http://hdl.handle.net/10044/1/114694 (last access: 16 October 2025), 2024. a, b, c
Knutti, R., Sedláček, J., Sanderson, B. M., Lorenz, R., Fischer, E. M., and Eyring, V.: A climate model projection weighting scheme accounting for performance and interdependence, Geophys. Res. Lett., 44, 1909–1918, https://doi.org/10.1002/2016GL072012, 2017. a
Kotlarski, S., Keuler, K., Christensen, O. B., Colette, A., Déqué, M., Gobiet, A., Goergen, K., Jacob, D., Lüthi, D., van Meijgaard, E., Nikulin, G., Schär, C., Teichmann, C., Vautard, R., Warrach-Sagi, K., and Wulfmeyer, V.: Regional climate modeling on European scales: a joint standard evaluation of the EURO-CORDEX RCM ensemble, Geosci. Model Dev., 7, 1297–1333, https://doi.org/10.5194/gmd-7-1297-2014, 2014. a, b
Lewis, E., Quinn, N., Blenkinsop, S., Fowler, H. J., Freer, J., Tanguy, M., Hitt, O., Coxon, G., Bates, P., and Woods, R.: A rule based quality control method for hourly rainfall data and a 1 km resolution gridded hourly rainfall dataset for Great Britain: CEH-GEAR1hr, J. Hydrol., 564, 930–943, https://doi.org/10.1016/j.jhydrol.2018.07.034, 2018. a
Lewis, E., Quinn, N., Blenkinsop, S., Fowler, H., Freer, J., Tanguy, M., Hitt, O., Coxon, G., Bates, P., Woods, R., Fry, M., Chevuturi, A., Swain, O., and White, S.: Gridded estimates of hourly areal rainfall for Great Britain 1990–2016 [CEH-GEAR1hr] v2, NERC EDS Environmental Information Data Centre [data set], https://doi.org/10.5285/fc9423d6-3d54-467f-bb2b-fc7357a3941f, 2022. a
Lucas-Picher, P., Argüeso, D., Brisson, E., Tramblay, Y., Berg, P., Lemonsu, A., Kotlarski, S., and Caillaud, C.: Convection-permitting modeling with regional climate models: Latest developments and next steps, WIREs Climate Change, 12, e731, https://doi.org/10.1002/wcc.731, 2021. a
Malitz, G. and Ertel, H.: Starkniederschlagshöhen für Deutschland (Bezugszeitraum 1951 bis 2010) (Extreme precipitation levels for Germany (reference period 1951 to 2010)), Tech. rep., KOSTRA-DWD-2010, 2015. a
Martins, E. S. and Stedinger, J. R.: Generalized maximum-likelihood generalized extreme-value quantile estimators for hydrologic data, Water Resour. Res., 36, 737–744, https://doi.org/10.1029/1999WR900330, 2000. a
Massoud, E. C., Lee, H. K., Terando, A., and Wehner, M.: Bayesian weighting of climate models based on climate sensitivity, Commun. Earth Environ., 4, 365, https://doi.org/10.1038/s43247-023-01009-8, 2023. a
Meredith, E. P., Ulbrich, U., Rust, H. W., and Truhetz, H.: Present and future diurnal hourly precipitation in 0.11° EURO-CORDEX models and at convection-permitting resolution, Environ. Res. Commun., 3, 055002, https://doi.org/10.1088/2515-7620/abf15e, 2021. a
Outten, S. and Sobolowski, S.: Extreme wind and five-day precipitation dataset based on the 0.11° daily EURO-CORDEX regional climate simulations for 1976 to 2100, Data in Brief, 55, 110708, https://doi.org/10.1016/j.dib.2024.110708, 2024. a
Philip, S., Kew, S., van Oldenborgh, G. J., Otto, F., Vautard, R., van der Wiel, K., King, A., Lott, F., Arrighi, J., Singh, R., and van Aalst, M.: A protocol for probabilistic extreme event attribution analyses, Adv. Stat. Clim. Meteorol. Oceanogr., 6, 177–203, https://doi.org/10.5194/ascmo-6-177-2020, 2020. a
Pichelli, E., Coppola, E., Sobolowski, S., Ban, N., Giorgi, F., Stocchi, P., Alias, A., Belušić, D., Berthou, S., Caillaud, C., Cardoso, R. M., Chan, S., Christensen, O. B., Dobler, A., de Vries, H., Goergen, K., Kendon, E. J., Keuler, K., Lenderink, G., Lorenz, T., Mishra, A. N., Panitz, H.-J., Schär, C., Soares, P. M. M., Truhetz, H., and Vergara-Temprado, J.: The first multi-model ensemble of regional climate simulations at kilometer-scale resolution part 2: historical and future simulations of precipitation, Clim. Dyn., 56, 3581–3602, https://doi.org/10.1007/s00382-021-05657-4, 2021. a
Poschlod, B. and Ludwig, R.: Internal variability and temperature scaling of future sub-daily rainfall return levels over Europe, Environ. Res. Lett., 16, 064097, https://doi.org/10.1088/1748-9326/ac0849, 2021. a, b
Poschlod, B., Ludwig, R., and Sillmann, J.: Ten-year return levels of sub-daily extreme precipitation over Europe, Earth Syst. Sci. Data, 13, 983–1003, https://doi.org/10.5194/essd-13-983-2021, 2021. a, b, c, d
Prein, A. F., W. Langhans, G. Fosser, A. Ferrone, N. Ban, K. Goergen, M. Keller, M. Tölle, O. Gutjahr, F. Feser, Brisson, E., Kollet, S., Schmidli, J., van Lipzig, N. P. M., and Leung, R.: A review on regional convection-permitting climate modeling: Demonstrations, prospects, and challenges, Rev. Geophys., 53, 323–361, https://doi.org/10.1002/2014RG000475, 2015. a
Pritchard, D., Lewis, E., Blenkinsop, S., Patino Velasquez, L., Whitford, A., and Fowler, H. J.: An observation-based dataset of global sub-daily precipitation indices (GSDR-I), Sci. Data, 10, https://doi.org/10.1038/s41597-023-02238-4, 2023. a
Rajczak, J. and Schär, C.: Projections of future precipitation extremes over Europe: A multimodel assessment of climate simulations, Journal of Geophysical Research: Atmospheres, 122, 10–773, 2017. a, b
Royal Meteorological Institute of Belgium: https://opendata.meteo.be/download [data set], last access: 16 October 2025. a
Schmith, T., Thejll, P., Berg, P., Boberg, F., Christensen, O. B., Christiansen, B., Christensen, J. H., Madsen, M. S., and Steger, C.: Identifying robust bias adjustment methods for European extreme precipitation in a multi-model pseudo-reality setting, Hydrol. Earth Syst. Sci., 25, 273–290, https://doi.org/10.5194/hess-25-273-2021, 2021. a, b
Schär, C., Fuhrer, O., Arteaga, A., Ban, N., Charpilloz, C., Girolamo, S. D., Hentgen, L., Hoefler, T., Lapillonne, X., Leutwyler, D., Osterried, K., Panosetti, D., Rüdisühli, S., Schlemmer, L., Schulthess, T. C., Sprenger, M., Ubbiali, S., and Wernli, H.: Kilometer-Scale Climate Models: Prospects and Challenges, Bulletin of the American Meteorological Society, 101, E567–E587, https://doi.org/10.1175/BAMS-D-18-0167.1, 2020. a
Tebaldi, C. and Knutti, R.: The use of the multi-model ensemble in probabilistic climate projections, Phil. Trans. R. Soc. A, 365, 2053–2075, https://doi.org/10.1098/rsta.2007.2076, 2007. a
Termonia, P., Van Schaeybroeck, B., De Cruz, L., De Troch, R., Caluwaerts, S., Giot, O., Hamdi, R., Vannitsem, S., Duchêne, F., Willems, P., Tabari, H., Van Uytven, E., Hosseinzadehtalaei, P., Van Lipzig, N., Wouters, H., Vanden Broucke, S., van Ypersele, J.-P., Marbaix, P., Villanueva-Birriel, C., Fettweis, X., Wyard, C., Scholzen, C., Doutreloup, S., De Ridder, K., Gobin, A., Lauwaet, D., Stavrakou, T., Bauwens, M., Müller, J.-F., Luyten, P., Ponsar, S., Van den Eynde, D., and Pottiaux, E.: The CORDEX.be initiative as a foundation for climate services in Belgium, Clim. Serv., 11, 49–61, https://doi.org/10.1016/j.cliser.2018.05.001, 2018. a, b, c
Tradowsky, J. S., Philip, S. Y., Kreienkamp, F., Kew, S. F., Lorenz, P., Arrighi, J., Bettmann, T., Caluwaerts, S., Chan, S. C., De Cruz, L., de Vries, H., Demuth, N., Ferrone, A., Fischer, E. M., Fowler, H. J., Goergen, K., Heinrich, D., Henrichs, Y., Kaspar, F., Lenderink, G., Nilson, E., Otto, F. E. L., Ragone, F., Seneviratne, S. I., Singh, R. K., Skålevåg, A., Termonia, P., Thalheimer, L., van Aalst, M., Van den Bergh, J., Van de Vyver, H., Vannitsem, S., van Oldenborgh, G. J., Van Schaeybroeck, B., Vautard, R., Vonk, D., and Wanders, N.: Attribution of the heavy rainfall events leading to severe flooding in Western Europe during July 2021, Clim. Change, 176, 90, https://doi.org/10.1007/s10584-023-03502-7, 2023. a, b
Van de Vyver, H.: Spatial regression models for extreme precipitation in Belgium, Water Resour. Res., 48, W09549, https://doi.org/10.1029/2011WR011707, 2012. a, b
Van de Vyver, H.: Practical return level mapping for extreme precipitation in Belgium, Tech. rep., Royal Meteorological Institute Belgium, 2013. a
Van de Vyver, H., Van Schaeybroeck, B., De Troch, R., De Cruz, L., Hamdi, R., Villanueva-Birriel, C., Marbaix, P., van Ypersele, J.-P., Wouters, H., Vanden Broucke, S., van Lipzig, N., Doutreloup, S., Wyard, C., Scholzen, C., Fettweis, X., Caluwaerts, S., and Termonia, P.: Evaluation framework for subdaily rainfall extremes simulated by regional climate models, J. Appl. Meteorol. Climatol., 60, 1423–1442, https://doi.org/10.1175/JAMC-D-21-0004.1, 2021. a, b, c, d
Van de Vyver, H., Van Schaeybroeck, B., De Cruz, L., Hamdi, R., and Termonia, P.: Bias-adjustment methods for future subdaily precipitation extremes consistent across durations, Earth Space Sci., 10, e2022EA002798, https://doi.org/10.1029/2022EA002798, 2023. a, b
Van de Vyver, H., Van Schaeybroeck, B., and De Cruz, L.: Subdaily Precipitation Extremes in the EURO-CORDEX 0.11° Ensemble (Version 2), World Data Center for Climate (WDCC) at DKRZ [data set], https://doi.org/10.26050/WDCC/EUCOR_prec_v2, 2025. a, b, c
Vautard, R., Gobiet, A., Sobolowski, S., Kjellström, E., Stegehuis, A., Watkiss, P., Mendlik, T., Landgren, O., Nikulin, G., Teichmann, C., and Jacob, D.: The European climate under a 2 °C global warming, Environ. Res. Lett., 9, 034006, https://doi.org/10.1088/1748-9326/9/3/034006, 2014. a, b, c, d
Vautard, R., Kadygrov, N., Iles, C., Boberg, F., Buonomo, E., Bülow, K., Coppola, E., Corre, L., van Meijgaard, E., Nogherotto, R., Sandstad, M., Schwingshackl, C., Somot, S., Aalbers, E., Christensen, O. B, Ciarlo, J. M., Demory, M-E, Giorgi, F., Jacob, D., Jones, R. G., Keuler, K., Kjellström, E., Lenderink, G., Levavasseur, G., Nikulin, G., Sillmann, J., Solidoro, C., Sørland, S. L., Steger, C., Teichmann, C., Warrach-Sagi, K., and Wulfmeyer, V.: Evaluation of the large EURO-CORDEX regional climate model ensemble, J. Geophys. Res. Atmos., 126, https://doi.org/10.1029/2019JD032344, 2021. a, b, c, d
Wehner, M.: Sources of uncertainty in the extreme value statistics of climate data, Extremes, 13, 205–217, https://doi.org/10.1007/s10687-010-0105-7, 2010. a
Westra, S., Alexander, L. V., and Zwiers, F. W.: Global increasing trends in annual maximum daily precipitation, J. Clim., 26, 3904–3918, https://doi.org/10.1175/JCLI-D-12-00502.1, 2013. a
Westra, S., Fowler, H., Evans, J., Alexander, L., Berg, P., Johnson, F., Kendon, E., Lenderink, G., and Roberts, N.: Future changes to the intensity and frequency of short-duration extreme rainfall, Rev. Geophys., 52, 522–555, https://doi.org/10.1002/2014RG000464, 2014. a, b
WMO: Records of Weather and Climate Extremes Table, Tech. rep., World Meteorological Organization, https://wmo.int/files/records-of-weather-and-climate-extremes-table (last access: 16 October 2025), 2024. a
Yang, L., Franzke, C. L. E., and Duan, W.: Evaluation and projections of extreme precipitation using a spatial extremes framework, Int. J. Climatol., 43, 3453–3475, https://doi.org/10.1002/joc.8038, 2023. a
- Abstract
- Introduction
- Data
- Validation
- Example applications
- Data availability
- Code availability
- Discussion and Conclusion
- Appendix A: Statistical modelling of annual maxima with the generalised extreme value distribution
- Appendix B: Variance decomposition by GCM and RCM
- Author contributions
- Competing interests
- Disclaimer
- Acknowledgements
- Financial support
- Review statement
- References
- Supplement