the Creative Commons Attribution 4.0 License.
the Creative Commons Attribution 4.0 License.
 | 28 Nov 2025
Dheed: an ERA5 based global database of compound dry and hot extreme events from 1950 to 2023
Mélanie Weynants
Chaonan Ji
Nora Linscheid
Ulrich Weber
Miguel D. Mahecha
Fabian Gans
The intensification of climate extremes is one of the most immediate effects of global climate change. Heatwaves and droughts have uneven impacts on ecosystems that can be exacerbated in case of compound events. To comprehensively study these events, e.g. with local high-resolution remote sensing or in-situ data, a global catalogue of compound dry and hot (CDH) events is essential. Here, we propose a database of large-scale dry and hot extreme events based on ERA5 climate reanalysis data. Drought indicators are constructed based on the daily balance between reference evapotranspiration and precipitation averaged over the previous 30, 90 and 180 d. Extreme events are detected with absolute local thresholds for the 1950–2023 period. CDH extremes are defined as daily maximum temperature at 2 m exceeding a 99 % absolute local threshold based on the empirical probability distribution, combined with any of the three drought indicators falling short of the 1 % threshold. Unique labels are assigned to CDH events lasting at least three days using a connected component analysis. Their spatiotemporal extent and summary statistics are extracted for all labelled events. The identified CDH events are validated against extreme events reported in the literature. Out of 40 events listed a priori, 38 could be associated with labelled CDH events. All 10 largest and 10 longest labelled CDH events could be linked to droughts and/or heatwaves reported in the scientific or grey literature. The Dheed database of connected compound dry and hot extreme events is available at https://doi.org/10.5281/zenodo.11044871 (Weynants et al., 2025b).
- Article
(6395 KB) - Full-text XML
- BibTeX
- EndNote


Extreme weather and climate events can induce stress on ecosystems and thereby have negative impacts on society, e.g. via yield losses with unclear implications (Frank et al., 2015; Sippel et al., 2018; Mahecha et al., 2024). Increased heat and drought stress on vegetation challenges the role of ecosystems as carbon sinks, e. g. through contributing to altered primary productivity (Bastos et al., 2020b), increases in forest mortality (International Tree Mortality Network, 2025), risk of intensifying wildfires (Cunningham et al., 2024; Jain et al., 2022), and long-lasting impacts on above-ground biomass (Yang et al., 2022).
With the current anthropogenic-driven climate change, the intensity and frequency of heat and hydroclimatic extremes are increasing (Seneviratne et al., 2023; Rodell and Li, 2023). Specifically, concerns about compound extreme weather and climate events – when multiple types of climate extremes occur simultaneously – have been raised for over a decade (IPCC, 2012). A typology to guide studies on those types of occurrences has recently been proposed (Zscheischler et al., 2020). Analysing model results and future emissions scenarios from 1950 to 2100, De Luca and Donat (2023) showed that “hot, dry, and compound hot-dry extremes are projected to increase over large parts of the globe by the end of the 21st century” and that “dry extreme changes are sensitive to the index used”. Compound climate extremes often have more detrimental effects on vegetation growth than univariate extremes (Yang et al., 2023; Bastos et al., 2023). For instance, global increased drought and heat induced tree mortality has been highlighted in 2010 (Allen et al., 2010) and investigated ever since. Vegetation is indeed more susceptible to damage during heat extremes after exposure to drought stress, as less water is available to buffer the physiological consequences of the heat extreme (Marchin et al., 2022). The complex physiological mechanisms of increased tree mortality under a warming and drying atmosphere richer in CO2 are, however, still debated (McDowell et al., 2022). Strong negative impacts of concurrent heat and drought as compared to univariate extremes are also evident in agricultural losses, e.g. in soybean yields (Hamed et al., 2021). The cascading processes triggered by CDH extremes also impact society as a whole (Niggli et al., 2022), and require particular focus given the expected increasing burden on society by CDH in many parts of the world under anthropogenic climate change (Zhang et al., 2024; Ridder et al., 2022; Vicedo-Cabrera et al., 2021). For example, 35 %–61 % of the world's population is likely to experience a significant shift in precipitation amounts by the end of the century under continued emission scenarios (Trancoso et al., 2024), and CDH extremes are projected to increasingly impact global food security (Biess et al., 2024; Kornhuber et al., 2020). Global, open data on CDH events thus also form an important basis in providing information for guiding policy decisions (Raymond et al., 2020).
To study the impacts of CDH events globally, a unified database of such events is needed. Yet, definitions of heatwaves and droughts are not standardized in the literature, often depending on the purposes of the study, the considered region and the time of the year. On the one hand, the World Meteorological Organisation (WMO) describes heatwaves as “periods where local excess heat accumulates over a sequence of unusually hot days and nights” (https://wmo.int/topics/heatwave, last access: 21 November 2025), but it defines no universal indicator. The scientific literature abounds with heatwave indicators, often sector oriented (Perkins and Alexander, 2013). Many define a heatwave as a period of at least three consecutive days with maximum temperature exceeding a certain threshold (e.g., Perkins and Alexander, 2013; Russo et al., 2015; Lavaysse et al., 2018; Russo and Domeisen, 2023), either absolute or percentile based. These probabilistic thresholds can be regional or local and relative to reference periods ranging from calendar day to season or year, over spans of ten to thirty years. Given the non-stationarity of the time series due to ongoing global warming, Zampieri et al. (2024) preconise the use of dynamic reference periods for risk assessments in adaptive sectors of society. However, they recommend stationary reference periods for studying the impacts of CDH on natural systems. Perkins (2015) recognises the difficulty to settle on a universal definition of heatwaves that fits all sectors, but also highlights the need to reduce the large number of metrics currently used. On the other hand, the WMO describes a drought as “a prolonged dry period in the natural climate cycle […] characterized by the lack of precipitation, resulting in a water shortage” (https://www.who.int/health-topics/drought, last access: 21 November 2025). Their typology depends on their duration and intensity, with diverse impacts on ecosystems. One generally distinguishes between meteorological, hydrological, agricultural and socio-economic droughts (Mishra and Singh, 2010). Various indicators have been developed to characterize drought conditions. The commonly used Standard Precipitation Evaporation Index (SPEI) is a “multi-scalar drought index used to determine the onset, duration and magnitude of drought conditions” (Vicente-Serrano et al., 2010). It is generally calculated from monthly climate data, which then require adjustments to reconcile the monthly time scale of the drought indicator with the daily time scale of the heat indicator. De Luca and Donat (2023) converted SPEI monthly time series into daily time series by setting the daily values to the same value over all days in a month. Some authors have used the SPEI with daily data to characterize drought dynamics at a finer temporal resolution (Wang et al., 2021). Indeed, Li et al. (2021) highlight the need for sub-monthly scale indices to monitor short-term compound dry and hot conditions. A short drought, e.g. a four-week drought, happening across two months might remain undetected in monthly data. A recent study proposes to calculate the daily SPEI using non-parametric Kernel Density Estimation (KDE) and then transform the KDE based quantiles into standardized normal scores, thereby avoiding fitting a parametric distribution to the data (Pohl et al., 2023). As sub-monthly dry and hot conditions – or even a few hot days – can cause substantial stress to vegetation and ecosystems in general, and heatwaves and droughts evolve on different time scales, we find it advantageous to work on data with daily resolution, and with multi-scalar drought indicators representing water budgets for different temporal windows.
Studies on the impacts of drought and heat on the biosphere, primary productivity or ecosystems have often focused on single compound events (e.g., Flach et al., 2018; Ciais et al., 2005; Bastos et al., 2020a). Daily drought indices have been computed for specific regions or measurement stations (e.g., Li et al., 2021; Pohl et al., 2023). Liu et al. (2024) recently produced the first global multi-timescale daily SPEI dataset from 1982 to 2021. Mukherjee and Mishra (2021) combined a weekly drought index with daily heat to quantify the spatio-temporal changes in CDH during the period 1983 to 2016. Yin et al. (2025) recently published a Compound Events Toolbox and Dataset, which provides annual statistics of threshold exceedance for dry and hot days based on total daily precipitation and maximum daily temperature, but lacks an explicit spatio-temporal delineation of the detected extreme events allowing to browse through individual events. To the best of our knowledge no global gridded database of CDH events at daily scale has been published so far. In this study we introduce Dheed, a global database of large-scale dry and hot extreme events, product of an extensive analysis of long-term ERA5 global climate reanalysis data (Hersbach et al., 2020, 2023) provided by the European Centre for Medium Range Weather Forecasts (ECMWF). Many studies on drought and/or heatwaves rely on ERA5 data. A Google Scholar search within citing articles of Hersbach et al. (2020) reveals that out of 19 587 hits, about 5510 contain the keyword drought and 10 500 contain the keywords heat or heatwave. Searching for drought AND (heat OR heatwave) reveals about 3600 citing articles (https://scholar.google.com/scholar?hl=en&as_sdt=2005&sciodt=0%2C5&cites=18403910731188548420&scipsc=1&q=drought+AND+%28heat+OR+heatwave%29&btnG=, last access: 12 March 2025). Reanalysis data have the advantage of being globally available and consistent and allow for the computation of various climatic indices, up to hourly time resolution. A reliable spatiotemporal identification of past CDH events offers several advantages. (i) Understanding the historical patterns and frequency of these events can help in assessing the risk and potential impact on ecosystems, water resources, and human health. (ii) Policymakers can use this information to develop strategies for mitigation and adaptation, such as water management plans and heat action plans. (iii) Identifying regions most affected by these events allows for targeted allocation of resources and emergency services. (iv) Educating the public about the likelihood and potential impact of these events can enhance community preparedness and resilience. (v) An analysis-ready dataset of past CDH events is useful for researchers studying climate change and its impacts on extreme weather patterns. For example, it can guide the sampling of small data cubes of high-resolution satellite imagery – e.g., Copernicus Sentinel-2 data (Ji et al., 2025) – to train models predicting ecosystem states (Requena-Mesa et al., 2021; Benson et al., 2024) under extreme climate conditions, with a particular focus on permanent vegetation. Dheed can also be used to assess the capacity of ecological monitoring networks to detect impacts of CDH events (Mahecha et al., 2017). Further potential applications encompass site selection for studying the effects of extreme dry and hot conditions on specific species or targeted sampling of high-resolution Earth Observation data for impact research, e.g., assess and forecast carbon sequestration loss in permanent vegetation during extremes, or cropland productivity loss. Overall, Dheed can help in building resilience against future climate extremes. Hereafter, we describe the data and methods employed to build Dheed, we present a brief global and continental analysis of trends in drought, heat and CDH and we benchmark detected CDH events against events reported in the literature.
Our approach draws on the concept of analysis-ready data cube, particularly useful in Earth system science to access and analyse multiple data dimensions, such as variable, spatial and temporal (Mahecha et al., 2020; Montero et al., 2024). The first step in building Dheed involves the pre-processing of the hourly climate reanalysis data into daily data. In a second step, we perform a temporal analysis of the daily data to detect extreme values in time series of heat and drought indices, which we further refer to as Discrete Extreme Occurrences (DEOs). The third step is a spatio-temporal connected component analysis to group DEOs connected in space and time into uniquely labelled compound dry and hot (CDH) extreme events (Zscheischler et al., 2013; Lloyd-Hughes, 2012). In a final step, we extract summary statistics for all labelled events and validate them against events reported in the literature. The workflow, detailed below and illustrated in Fig. 1, runs entirely in Julia, relying largely on the YAXArrays.jl package (Gans et al., 2023; Bezanson et al., 2017). Figures are created with Makie.jl (Danisch and Krumbiegel, 2021).
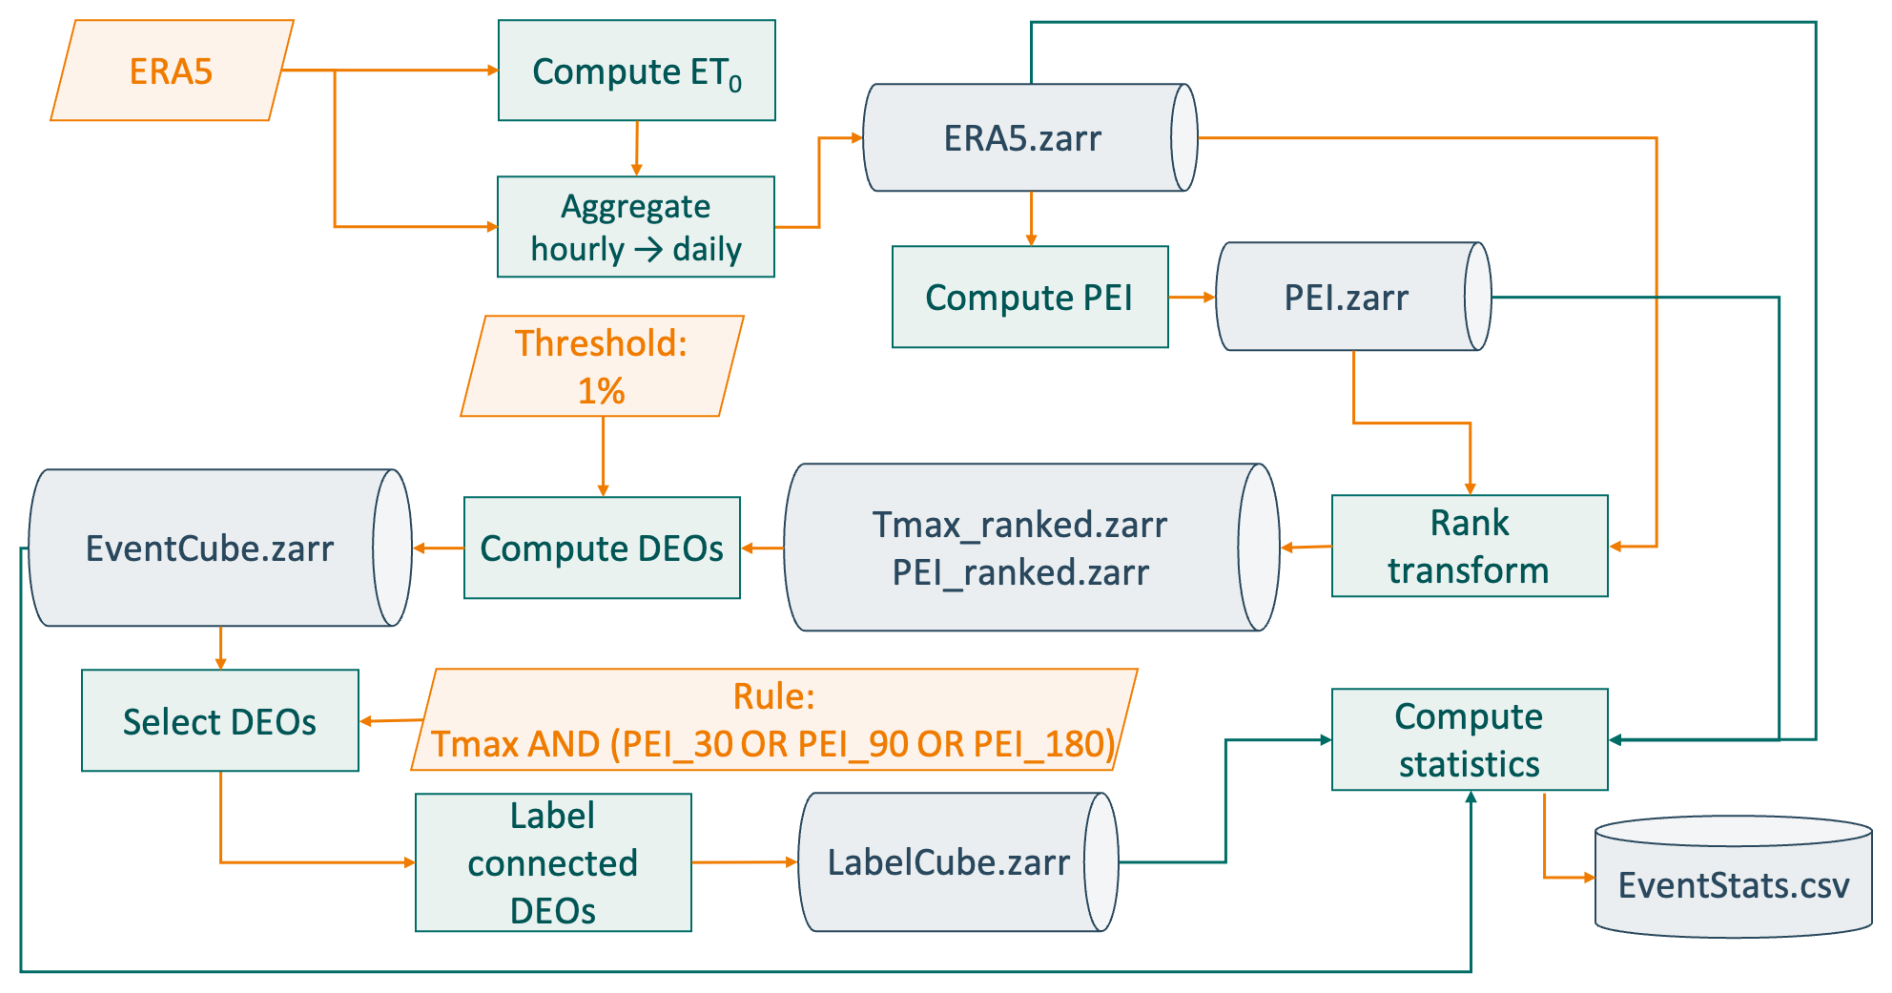
Figure 1Workflow for the detection of dry and hot extreme events. ET0 is the reference evapotranspiration, PEI is a Precipitation–Evapotranspiration based indicator, Tmax is the daily maximum temperature at 2 m. DEOs are Discrete Extreme Occurrences, i.e., extreme values in the time series of temperature and drought indices. Dheed, the resulting dry and hot extreme events database consists of the EventCube, the LabelCube and the EventStats table.
2.1 Climate data pre-processing
The workflow exploits the hourly gridded ERA5 data, from 1950 to 2023 (Hersbach et al., 2023). Specifically, the following variables are used:
-
temperature at 2 m (T2) [K],
-
10 m wind speed: zonal (u10) and meridional (v10) components [m s−1],
-
atmospheric surface pressure (Ps) [Pa],
-
surface net solar and thermal radiation (S and L) [J m−2],
-
saturation water vapour pressure (es) [hPa],
-
vapour pressure (ea) [hPa] and
-
total precipitation (PT) [m].
Grid cells from the ERA5 land mask with a value greater than 0.5 are considered land. Data are aggregated over time from hourly to daily time steps, by calculating the daily mean, minimum, and maximum for T2, and the cumulative values for PT and the reference evapotranspiration ET0 (see hereafter). When aggregating to daily time steps, a day includes all time steps from 00:00 to 23:00 UTC for any grid cell. Hence, aggregation windows do not correspond to local calendar days. The resulting data are stored in a multi-dimensional analysis-ready data structure, also known as data cube, in Zarr format with chunk sizes suited for time series analysis (longitude = 60, latitude = 60, time = 5844). As in the original gridded ERA5 data, the longitude axis ranges from 0 to 360° and the spatial resolution is 0.25° in both latitude and longitude, i.e., the longitude and latitude dimensions are 1440 and 721 respectively. After aggregation of the hourly data to daily temporal resolution, each time series has 27 028 data points over the period going from 1 January 1950 to 31 December 2023.
The hourly reference evapotranspiration for a well watered grass cover (ET0) [mm h−1] is calculated with the FAO's Penman-Monteith equation (Allen et al., 1998) from the above mentioned ERA5 variables, following appropriate units adjustments and assumptions (Singer et al., 2021):
where Rn is the surface net radiation []), calculated as , G is the soil heat flux density at the soil surface [] conditioned on the time step, with values differing between daytime and nighttime ( if Rn<0.0, otherwise) and set to 0 where water covers more than 50 % of the spatial grid cell, is the air temperature at 2 m height [°C], u2 is the wind speed at 2 m height [m s−1], calculated from u10 and v10 using the log wind profile (Eq. 2) following FAO recommendations (Allen et al., 1998), Δ is the slope of the vapour pressure curve [kPa °C−1], γ is the psychrometric constant [kPa °C−1] and Cd is a time step dependent coefficient. According to Walter et al. (2001), Cd should vary between daytime (0.24) and nighttime (0.96), but adopting the constant value for daily calculation (0.34) has a negligible effect on ET0 when values are aggregated by day ( mm d−1). Δ and γ are calculated from Ps and θ2 according to FAO recommendations (Allen et al., 1998) with Eqs. (3) and (4).
where λ=2.45 is the latent heat of vaporization [MJ kg−1] (simplification in the FAO PenMon (latent heat of about 20 °C), is the specific heat at constant pressure [MJ kg−1 °C−1] and ϵ=0.622 is the ratio between molecular weight of water vapour and dry air.
In this study, we assess daily drought conditions to allow for the detection of short term droughts and to bring the drought indicators to a time resolution comparable to that of heatwaves. Therefore, the daily average water balance PEIN,i for day i in the time series over the N antecedent days is calculated as an indicator of drought (Li et al., 2021), accounting for different hydrological compartments of ecosystems:
with to obtain PEI30, PEI90, and PEI180. Following the convention used in ERA5, downward fluxes have positive values. Extreme dry values are hence those for which PEIN is small. The daily maximum temperature (Tmax) is used as heat indicator.
2.2 Event detection
Discrete Extreme Occurrences (DEO) are detected through a temporal analysis at the grid cell level independently for each indicator of heat and drought. They are then combined in Compound Dry and Hot (CDH) extreme events through a spatio-temporal connected component analysis. The detection of DEOs is based on a purely probabilistic threshold applied to the empirical distribution of the indicators, considering the full time series at each location, without removing the mean seasonal cycle, nor any trend. We use a static threshold specific to each spatial grid cell to focus on extreme hot or extreme dry conditions, and do not consider here winter warm spells nor relative droughts. The database resulting from this study being primarily intended to explore the impacts of the CDH extreme conditions on permanent vegetation, the rationale behind the choice of local static threshold is twofold. First, in a fast changing climate, seasons may be shifting in time and analysing extremes on the anomalies may introduce biases. Second, the physiological impacts of combined extreme temperatures and dryness are more absolute than relative, i.e. when critical conditions are reached. While the physiological impacts of heat stress on plants depend on the development stage (Jagadish et al., 2021), critical plant tissue temperatures at which the physiological functions are altered depend on the plant species and therefore vary across biomes (O'sullivan et al., 2017). The level of heat stress experienced by plants when exposed to the same air temperature differs among species and genotypes, also affected by soil moisture, plant hydraulic conductance and atmospheric vapour pressure deficit (Jagadish et al., 2021). Leaf temperature can be greater than air temperature, especially when vapour pressure deficit is high and plants reduce stomatal conductance (Reichstein et al., 2013). In regions with a strong hydrological seasonal cycle, adopting a static threshold will lead to the detection of extreme dryness in the dry season, which does not correspond to the growing season. While annual plants may not be affected by these dry episodes outside the growing season, they may have important physiological effects on permanent vegetation. The critical level of heat and dryness provoking a negative physiological impact hence depends on the local plant community and local management. Therefore, we perform a spatial normalization that takes into account the natural adaptation of plant communities and local agricultural or silvicultural practices.
For each spatial grid cell, we first examine the temporal distribution of each of the four indicators independently (Tmax, PEI30, PEI90, and PEI180). It is a common procedure to fit a parametric distribution to the PEI data to generate a standardised index (SPEI) with values comparable across space and time. However, in this study, we do not remove the effect of seasonality, which leads to distributions poorly described by a log-logistic function, especially where hydrological seasons are strongly distinct (see Appendix A). In any case, the identification of extreme events is ultimately based on quantiles. Given the length of the time series used in this study, quantiles can reliably be estimated directly from the data, without assuming a parametric distribution. Therefore, we decided to omit the parameter estimation and directly estimated thresholds based on empirical quantiles.
The values were rank-transformed to obtain their empirical distribution function, as an estimate of the cumulative distribution function at each spatial grid cell. We applied the same rank-transformation to −Tmax. This means that values of Tmax larger than the 99 % quantile will have corresponding values <0.01 in the rank-transformed data. Heatwaves as well as drought events are therefore characterized by low values in their corresponding rank-transformed indicators. Different local percentile-based thresholds were tested for detecting extreme conditions (lowest 10 %, 5 %, 2.5 %, 1 %, 0.5 % of the empirical cumulative distributions). Most studies on extreme events use a threshold of 5 % (resp. 95 %) on monthly anomalies based on a 30 year reference period, corresponding to a return period for a specific location and month of about 20 years, which sums up to less than one event per year on average. In this study, we use a longer reference period (74 years) and daily data, which, for a specific grid cell and a threshold of 1 %, leads to an annual average of 3 to 4 d flagged as extremes for a single indicator.
We synthesize the DEOs of the four indicators in a single variable encoded as an 8-bit integer by assigning a specific bit to each indicator, keeping the information relative to all four indicators for later analysis. DEOs of Tmax activate the first (smallest) bit (0000000012), PEI30 the second (0000000102), PEI90 the third (0000001002), and PEI180 the fourth (0000010002). The fifth bit (000100002) encodes for all values that lie outside the tails of all four distributions, i.e., that have rank-transformed values between 0.1 and 0.9. The five indicators are combined with a bitwise OR and the resulting values are stored in a data cube named EventCube (Fig. 1). In the following sections, we will focus on the first four bits.
From the EventCube, we extract CDH events as labelled groups of connected dry and hot DEOs (Zscheischler et al., 2013; Lloyd-Hughes, 2012). We restrict the connected component analysis to spatio-temporal grid cells of the EventCube that are both hot (0000000012) and dry (0000000102 OR 0000001002 OR 000010002), i.e. have uneven values greater than 1, if expressed in base 10. Moreover, using ImageFiltering.jl (v0.7.8) on the time dimension, we filter for events that last at least three consecutive days. The connected component labelling algorithm assigns a unique label to each group of connected DEOs, looking for six way connections. Each grid cell with coordinates , or is connected to the grid cell at , with x, y and z the longitude, latitude and time, respectively. We modify the ImageMorphology.label_components function from ImageMorphology.jl (v0.4.5) (https://juliaimages.org/ImageMorphology.jl/v0.4/reference/#ImageMorphology.label_components, last access: 21 November 2025) to group DEOs connecting across the globe along the longitude dimension, allowing for events to connect across the grid longitudinal edge, between 0 and 360°. The connection at high latitudes across the poles is not specifically guaranteed. We store the resulting labelled dry and hot extreme events in a data cube named LabelCube. Figure 2 illustrates the entire workflow with the example of the 2003 summer heatwave in Europe (Event 33 in Table B1).
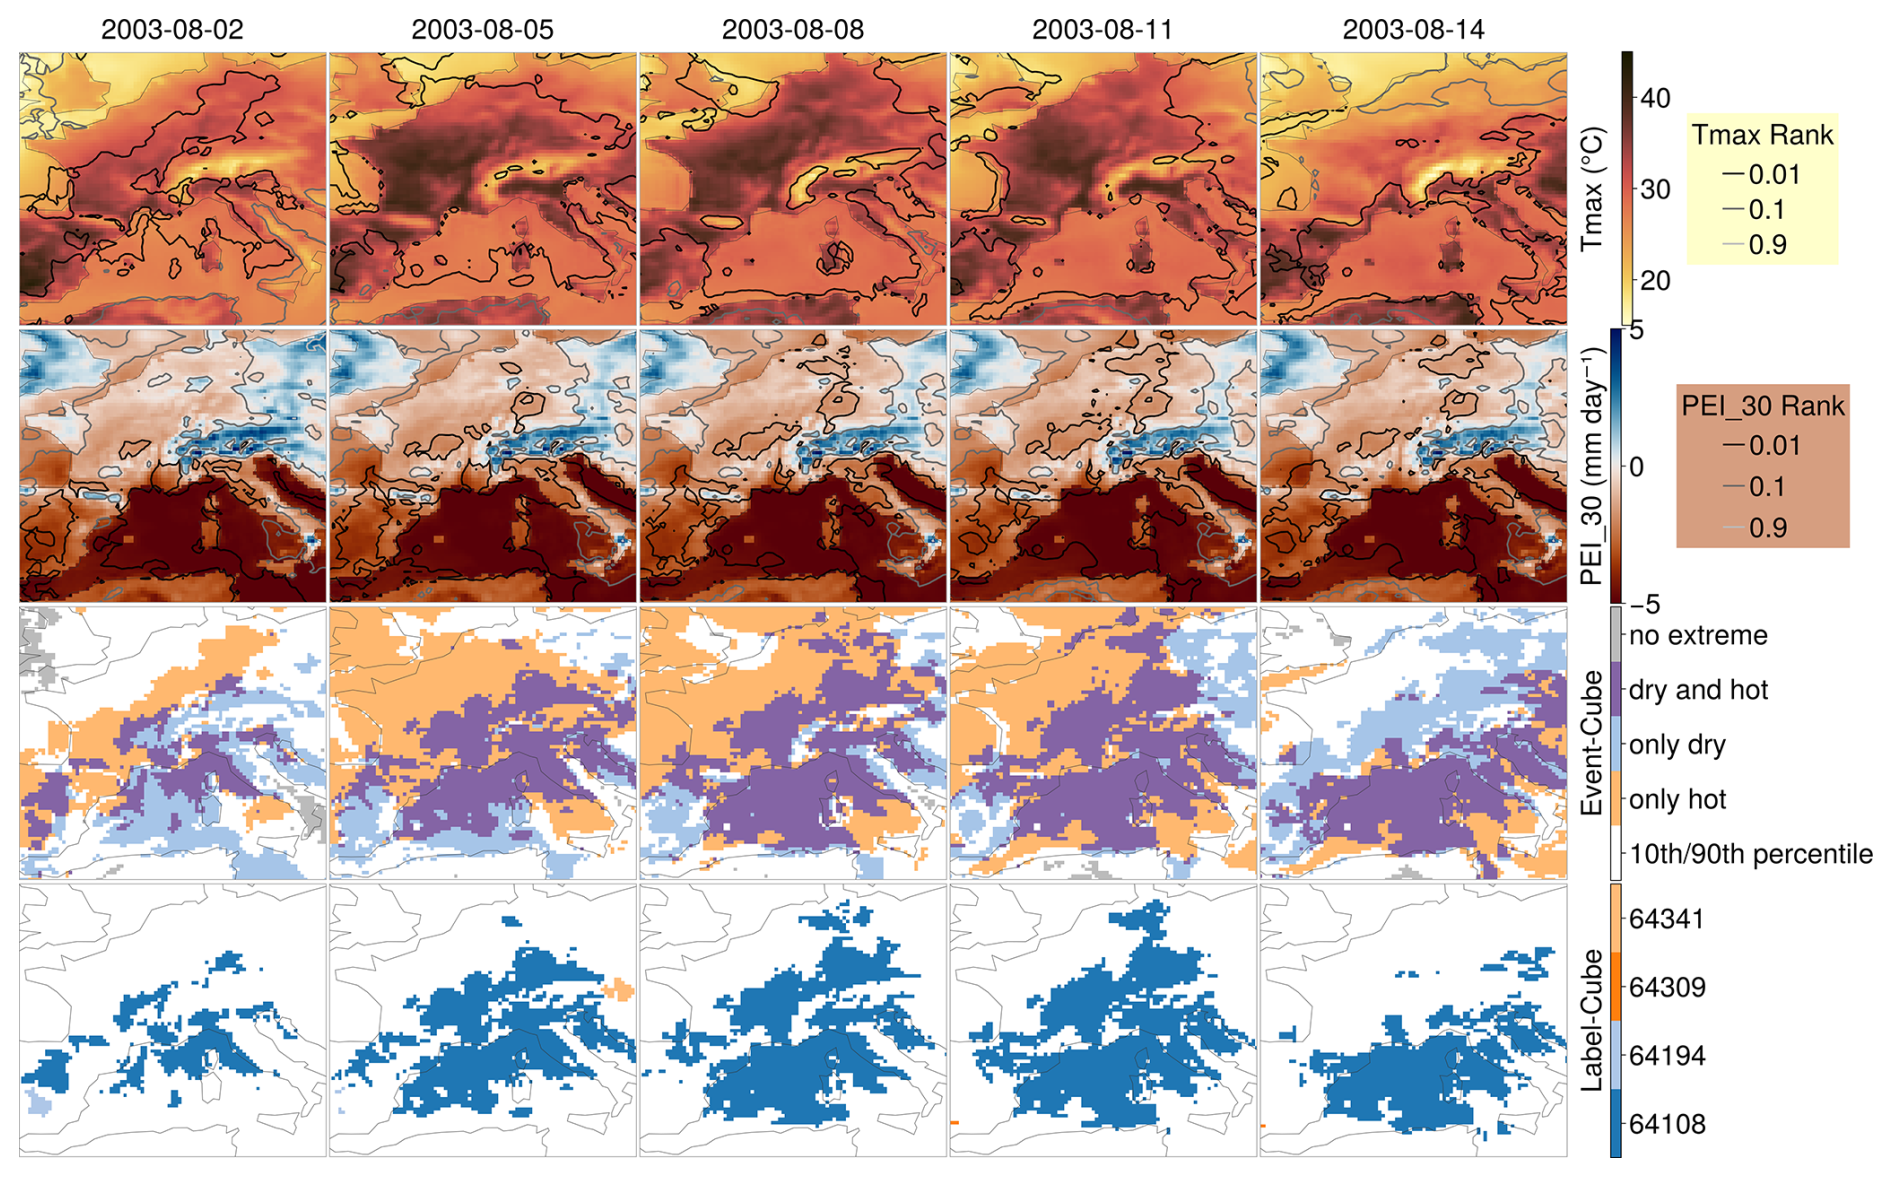
Figure 2Example of dry and hot extreme event detection workflow over the 2003 summer heatwave in Europe. Columns show the time evolution of the data sampled at every 4th time step from 2 to 14 August 2003. Rows 1 and 2 show the raw daily maximum 2 m air temperature and PEI30 with isolines linking the ranked values at 1 %, 10 % and 90 %. Row 3 shows the encoding into the EventCube where single voxels can be marked as only extremely dry, only extremely hot, a combination of both or none of them. Voxels shown in grey are in a regime of normal conditions. Those shown in white are are in the tails of the distributions, with values smaller than the 10th or greater than the 90th percentile. Row 4 shows the labelled events obtained from the spatio-temporal connected component analysis on the EventCube. Only voxels that are both dry and hot, and are connected, are registered with a unique label in the Dheed database of dry and hot extreme events.
For each labelled CDH event, we compute the following properties:
-
spatio-temporal bounding box (
start_time,end_time,longitude_min,longitude_max,latitude_min,latitude_max), -
statistics on the the indicators (
t2mmax_mean,t2mmax_min,t2mmax_max,pei_30_mean,pei_30_min,pei_30_max,pei_90_mean,pei_90_min,pei_90_max,pei_180_mean,pei_180_min,pei_180_max), -
percentage of the event for which each indicator is below the extreme threshold(
heat,drought30,drought90,drought180,compound), -
percentage of the event that occurred over land (
land_share), -
a proxy of the total volume of the event as the number of voxels weighted by cos(latitude) (
volume), -
the event duration as (
duration), -
a proxy of the event total affected area as the ratio between
volumeandduration(area).
These statistics are stored in a csv table named EventStats (Fig. 1) and constitute the core of Dheed, along with EventCube and LabelCube. It is worth noting that, given the criteria chosen for the connected component analysis, labelled events are always extremely hot (heat = 100 %) and have a minimum duration of three days. Users can retrieve the proportion of a labelled event incurred to the different drought indicators. For example, a user interested in short droughts while excluding longer ones would select entries with a large coverage of PEI_30 and a small coverage of PEI_90 and PEI_180. This allows for a finer use of the database respective on the accumulation period. In the next section, we present a brief analysis of these labelled CDH events and track the ten largest in volume and the ten longest in duration in the scientific literature. To assess the reliability of the event detection method, we also compare a set of historical events reported in the scientific literature or the media with the Dheed. All labelled events that intersect with the spatio-temporal window reported in Table B1 are selected from the LabelCube. Their statistics are extracted from the EventStats and evaluated.
3.1 Indicators of dry and hot conditions
Different local percentile-based thresholds were tested for detecting extreme conditions (not shown). Larger thresholds led to connected compound events that were spanning the whole globe and/or lasting more than a year. Therefore, we adopted the largest threshold that was creating blobs of reasonable size. We chose the lowest 1 % as a compromise between the number of data points and the size of the spatio-temporally connected events. All detected daily time points of extreme heat or drought (DEOs) from 1950–2023 are recorded in the EventCube. This data cube can be used to analyse time series of DEOs at specific locations. For example, Fig. 3 shows the event type along with Tmax from the ERA5 daily data cube and the PEIs for a few days in the summer of 2021 at Lytton, British Columbia, Canada. Longer time series can also be easily analysed (Figs. C1 and C2). Beyond analysing single locations, the dataset allows to draw a general overview of the regional or global trends in dry and hot extremes. Figure 4 shows DEOs globally aggregated by year and by type of extreme, over land only, from 1970 to 2023. The y axis represents the percentage of land area and days affected by an event of a certain type in a given year. The further back in time, the larger the uncertainties in the reanalysis data, due to a lack of observations to be assimilated with the numerical model results, especially in the southern hemisphere (Hersbach et al., 2020). No satellite data were used in ERA5 before 1970 (Hersbach, 2023), leading to yet larger uncertainties in the southern hemisphere. Therefore, we do not include the years 1950–1969 in the trend analysis. Nevertheless, the Dheed database contains the labelled events from those earlier years.
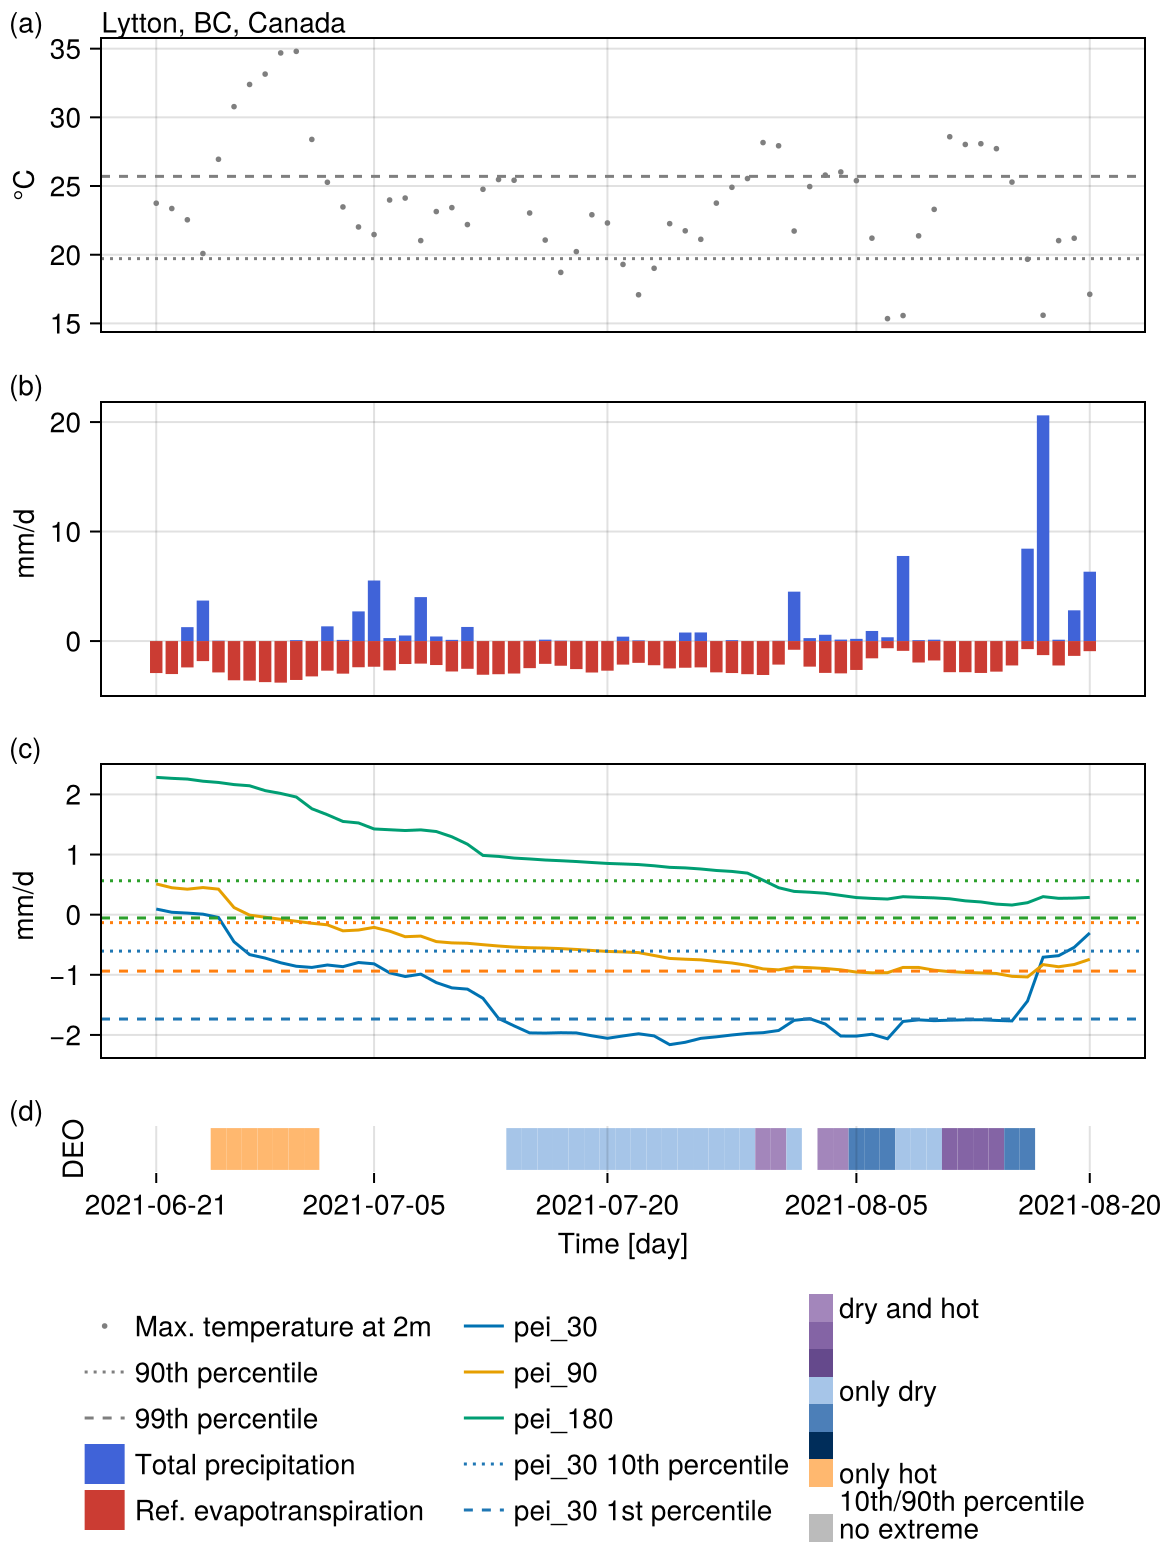
Figure 3Heat and drought indicators during a reported compound dry and hot extreme event in the summer of 2021 in British Colombia. Panels show (a) the maximum daily temperature, (b) the daily precipitation and reference evapotranspiration, (c) the three drought indicators (PEI) and (d) the Discrete Extreme Occurrences (DEO). A first heatwave starting 25 June 2021 is not associated with a drought. A second (30 July 2021) and third (3 August 2021) heatwaves are associated with extremely dry conditions but last only two days each. A fourth heatwave starting 11 August 2021 and lasting four days is associated with extremely dry conditions (PEI_30 and PEI_90) and is hence part of a labelled event from the proposed database.
Figure 4 shows the DEO values as they are encoded in EventCube (from 00012=110 to 11112=1510) aggregated globally over land by year. The compound dry and hot DEOs shown in shades of purple represent only a small fraction of the extreme dry or hot conditions. The inter-annual variability is large, but there seems to be a positive trend in the global annual number of extremely dry or hot days. The trends can be further analysed by type of event.
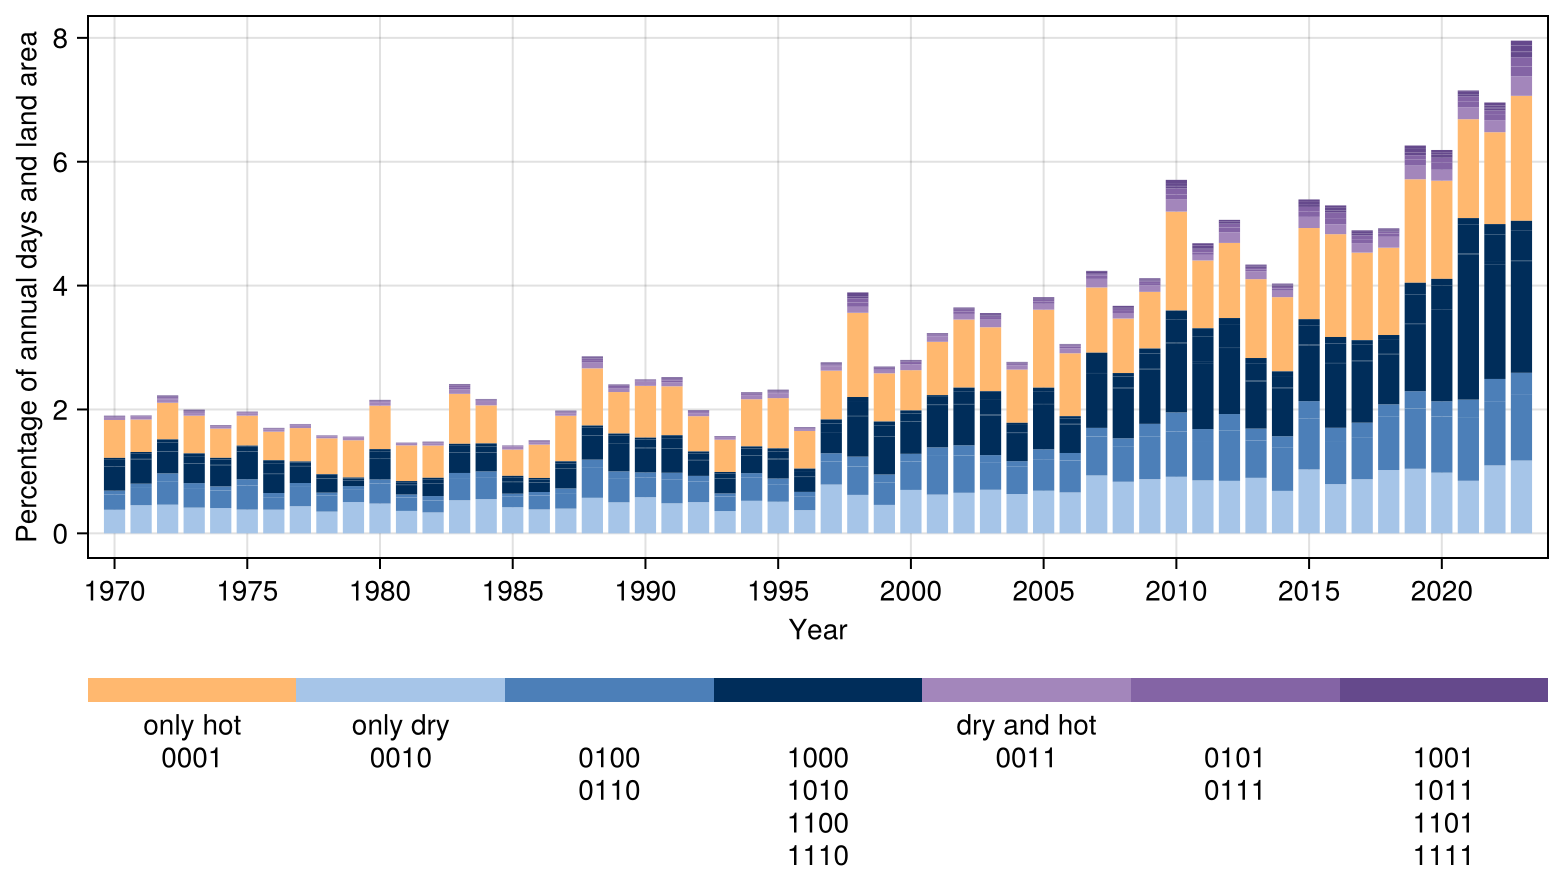
Figure 4Annual spatiotemporal extent of extremely dry and hot days, by the value of data in EventCube. The count of voxels with a Discrete Extreme Occurrences (DEO) of a given value (00012=110 to 11112=1510), weighted by the cosine of the grid cell latitude, is divided by the weigthed count of all land voxels in a given year, expressed as percentage. The shades of blue and purple show the accumulation period of the water balance. The darker the shade the longer the accumulation period: a water balance accumulated over 180 d which is below the 1 % threshold is rendered in the darkest shade. The 90 d accumulation period is shown in the medium shade. The 30 d accumulation period has the lightest shade. The bit strings associated with each colour are shown below the colour bar.
Figure 5 shows the DEOs aggregated for each individual indicator, which means that the bars may not be cumulated. For example, if a voxel has DEO =10012, the same voxel will be counted as a heat extreme (Fig. 5, Row 1), with DEO & 00012=00012 (where & is the bitwise AND operator) and as a drought with a 180 d accumulation period (Fig. 5, Row 4), with DEO & . By our definition of the extremes, since we applied a 1 % threshold on the time series, the relative annual number of days and area affected by these extremes expressed in percentage for each individual indicator is 1 % on average over the complete time series (1950–2023). Values vary however from year to year. A Theil-Sen approximation of the trend (Sen, 1968) over time shows that all four indicators have a positive trend, with a similar slope coefficient. This suggests that the extents of extreme heat, short term (d30), midterm (d90) and longer term (d180) droughts are increasing at a similar pace.
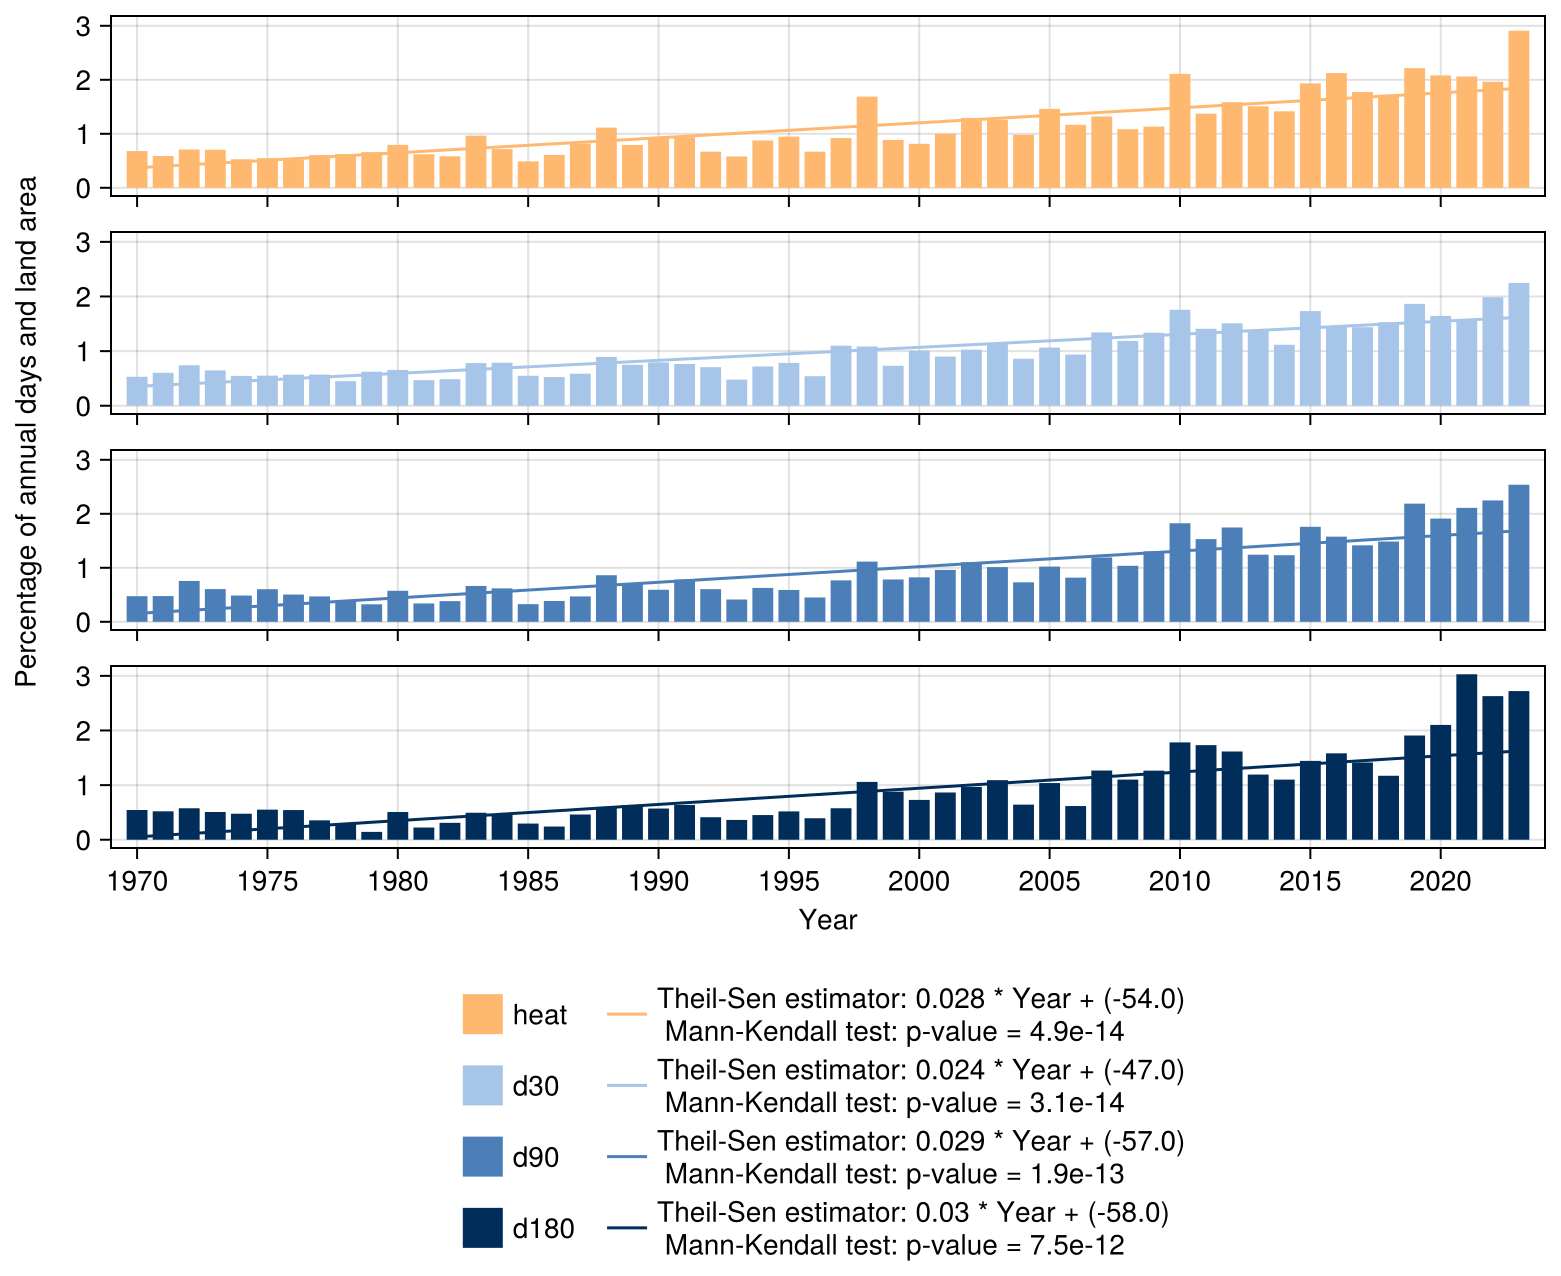
Figure 5Annual spatiotemporal extent of extremely dry and hot days, by type of extreme. The sum of Discrete Extreme Occurrences (DEO) combined by type of event and weighted by the cosine of the grid cell latitude is divided by the sum of all land voxels in a given year, expressed as percentage. The indicator of heat is the daily maximum temperature at 2 m. The indicators of drought are the daily difference between precipitation and reference evapotranspiration, averaged over the previous 30, 90 and 180 d.
Figure 6 counts only DEO that are both hot and dry, i.e. where (DEO & ) AND ((DEO & ) OR (DEO & ) OR (DEO & ), in which & denotes the bitwise AND operator and AND and OR denote the boolean AND and OR operators. DEO values of compound dry and hot extremes are aggregated globally by year. The values are an order of magnitude smaller than with the univariate extremes, but there is a highly significant positive trend in the global annual days and land area affected by extremely dry and hot condition over the period 1970–2023 (Theil-Sen estimator: 0.0066 % per year). Splitting this 54-year period into two periods of 27 years reveals a drastic change in the trend, with the Theil-Sen estimator in recent years (1998–2023) an order of magnitude larger than in former years (1998–2023). The strong ENSO/El Niño years 1983, 1988 and 1998 stand out from the trend, along with years 2010, 2012, 2015 and 2019 to 2023. Year 2023 clearly shows up as the one with the largest percentage of extremely dry and hot annual days and land area.
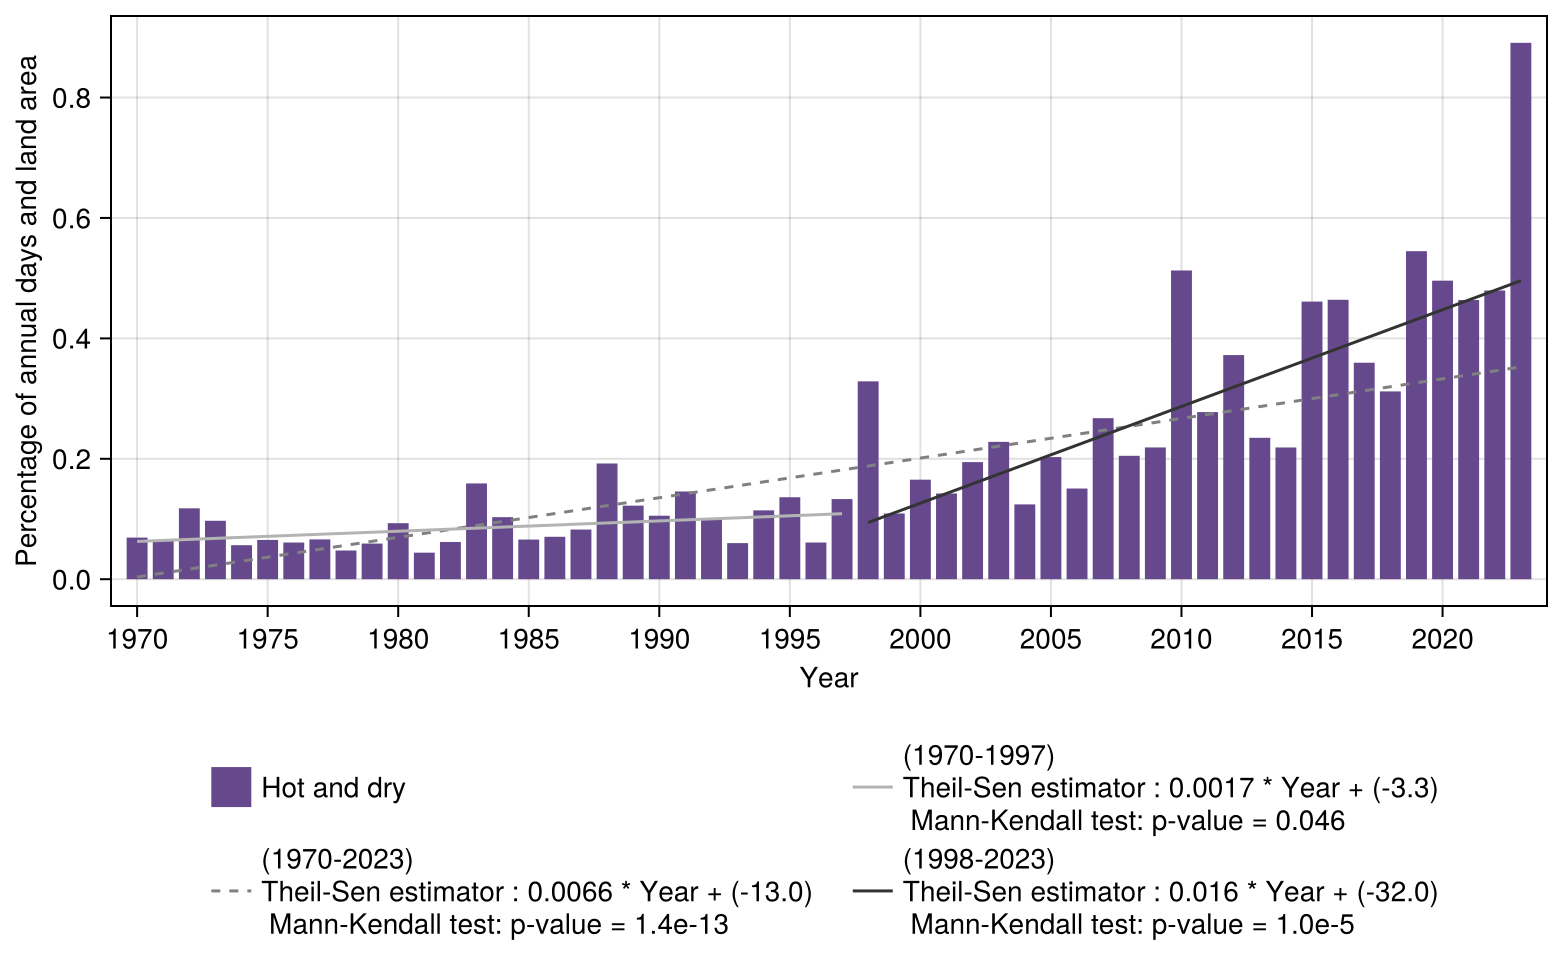
Figure 6Annual spatiotemporal extent of extreme compound dry and hot days. The sum of Discrete Extreme Occurrences (DEO) that are both dry and hot weighted by the cosine of the grid cell latitude is divided by the sum of all land voxels in a given year, expressed as percentage.
Figure 7 and Table 1 show a continental aggregation of the annual percentage of extremely dry and hot days and land area affected by compound dry and hot DEOs. The trends and average values are not uniform across continents. With an average of 0.05 %, Antarctica is the least affected continent, well below the global average of 0.20 %. The trends in Antarctica and Oceania are not significant (Mann–Kendall test p-value >0.01). Europe is the continent most affected by CDH extremes, followed by Africa and South America. Africa is the continent that has experienced the steepest increase in annual cumulative area subject to CDH days. Figure 8 shows the pixel-wise decadal Theil-Sen trend in the number of extremely dry and hot days. Six decades are considered, centred on the years 1970 to 2020. The last decade is incomplete, since records in the EventCube only go until 2023. Our analysis reveals that, while most land grid cells have a positive trend, some areas show a negative one.
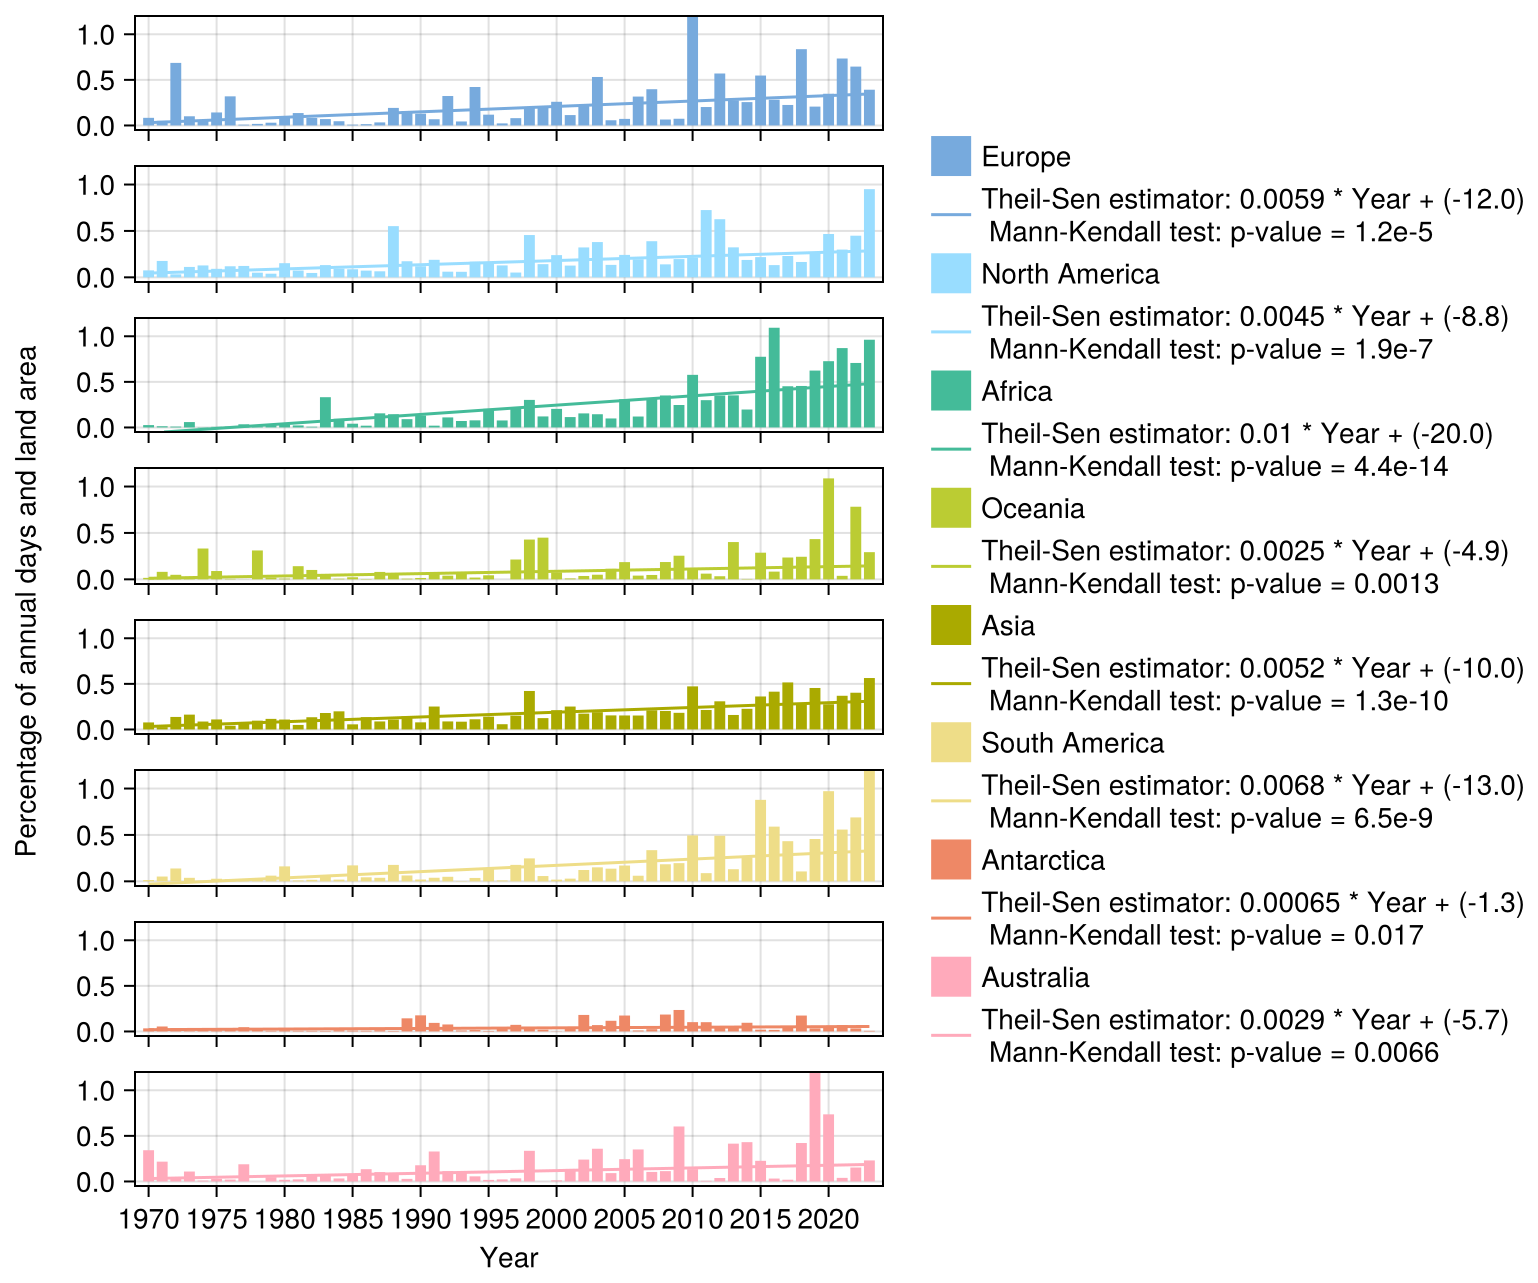
Figure 7Annual spatiotemporal extent of extreme dry and hot days, by continent. The sum of both dry and hot Discrete Extreme Occurrences (DEO) weighted by the cosine of the grid cell latitude is divided by the sum of all land voxels in a given continent and year, expressed as percentage. The y axis is limited to 1.0 %, but the bar extents to 2.1 % for the year 2010 in Europe, to 3.1 % for the year 2019 in Australia and to 2.7 % for the year 2023 in South America.
Table 1Average percentage of annual extremely dry and hot days and area by continent and globally, over the total trend analysis period (1970–2023), over older years (1970–1997) and over recent years (2000–2023).
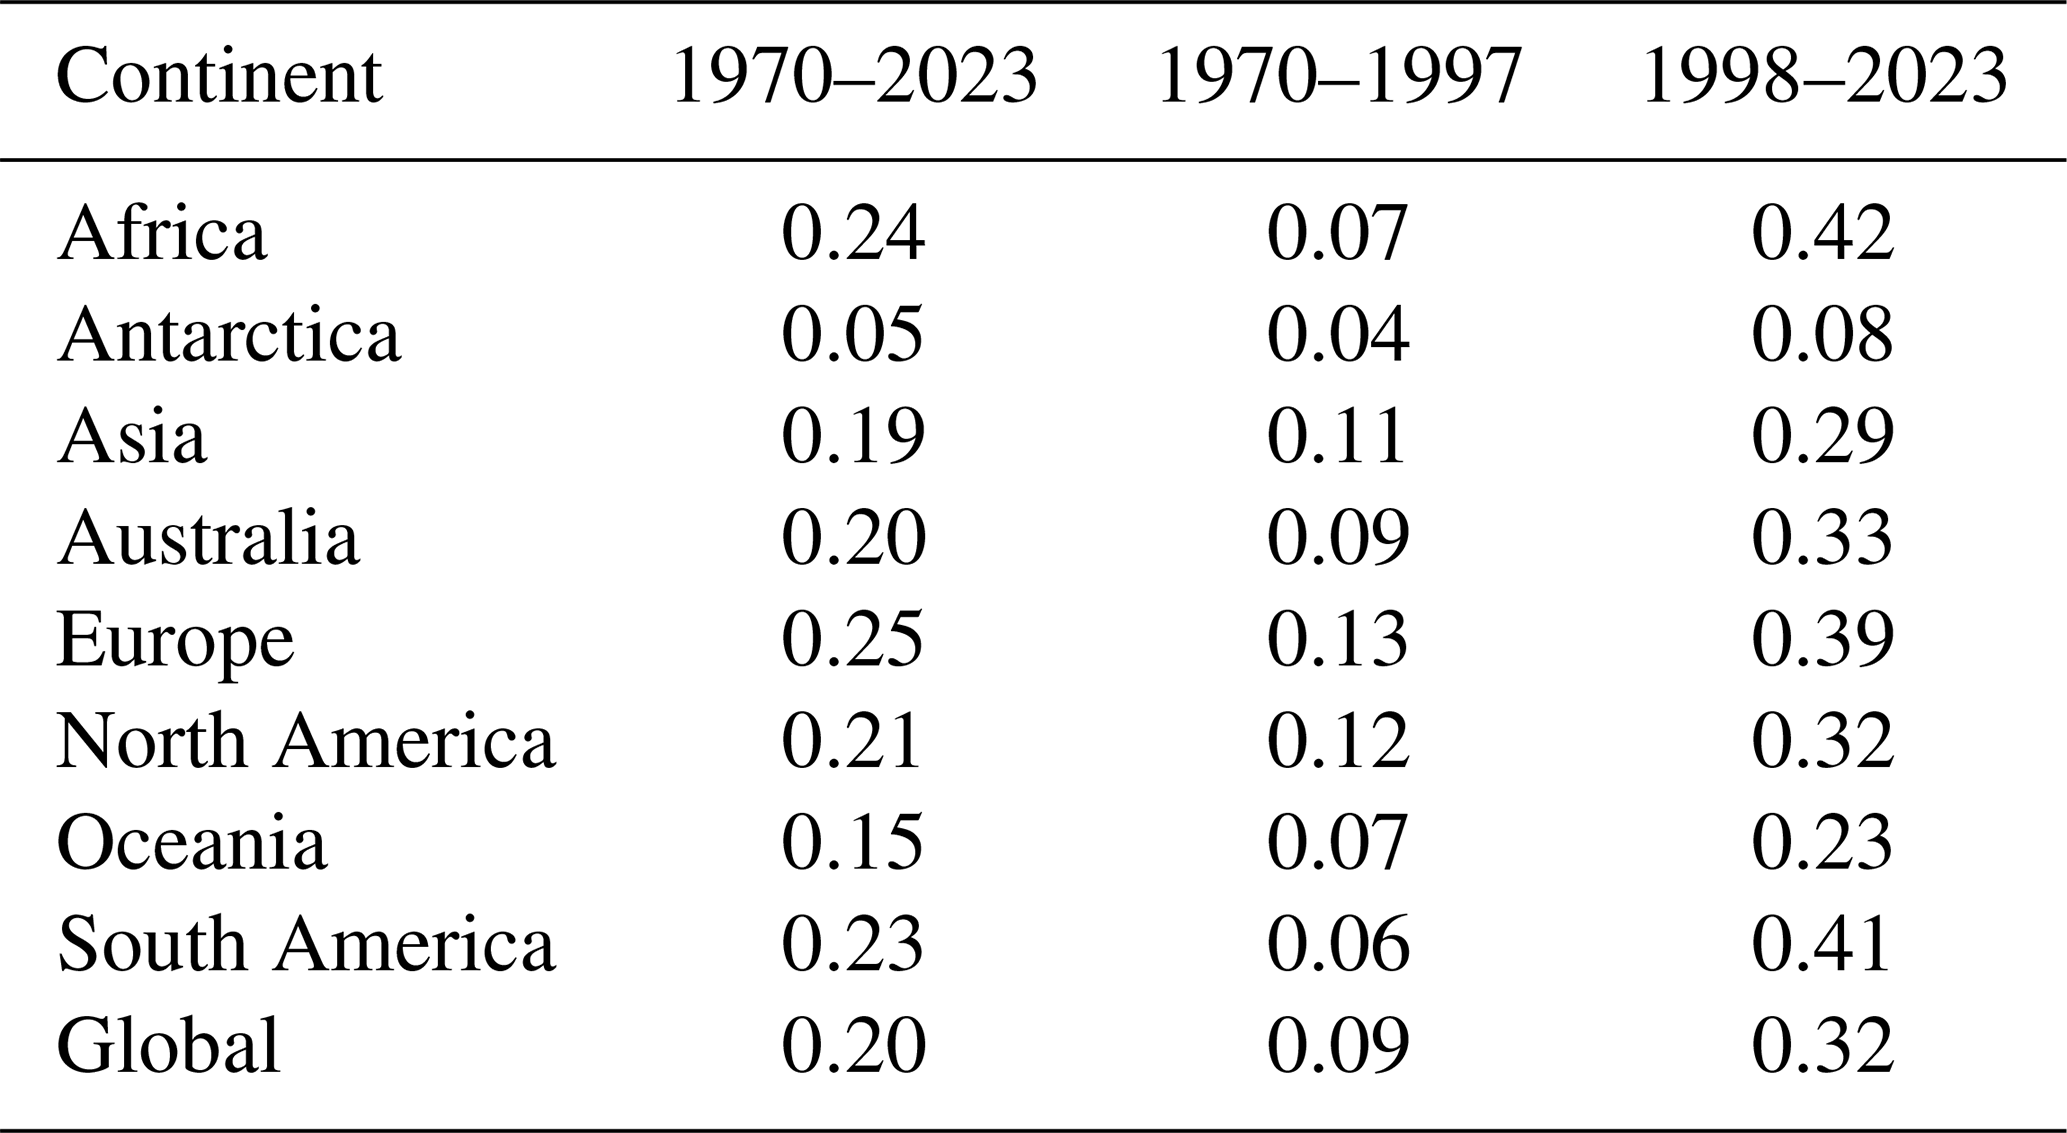
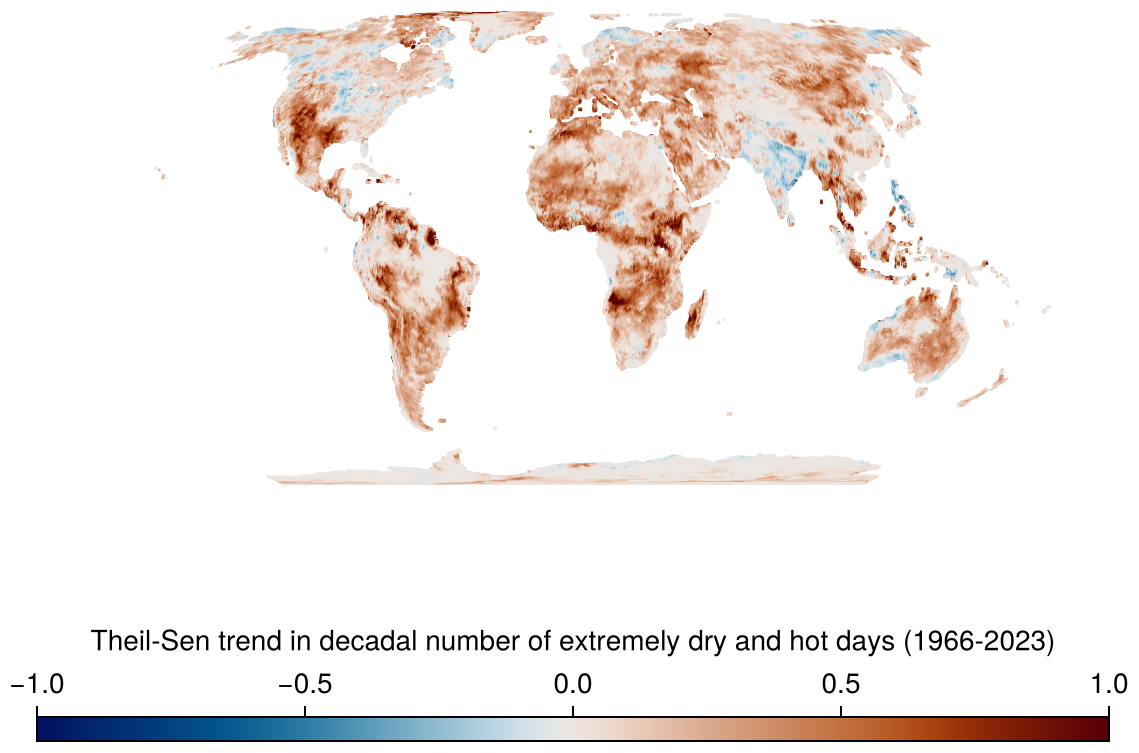
Figure 8Decadal Theil-Sen trend in the number of extremely dry and hot days for each grid cell.
3.2 Database of compound dry and hot extreme events
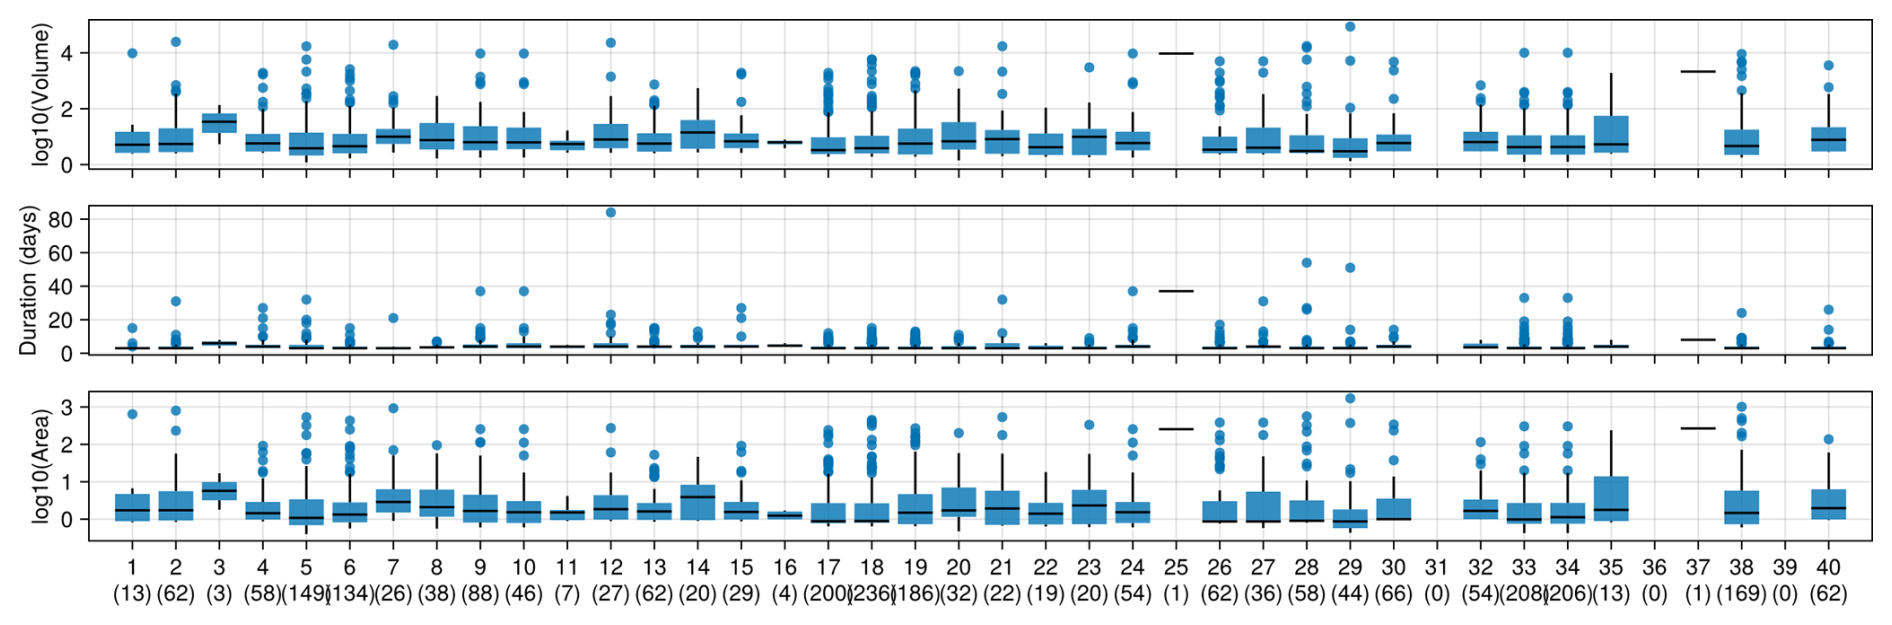
Extreme events in which heat and drought coincided were labelled and further characterized. The labelled extreme events include only DEOs where dry and hot extreme conditions were observed for at least three consecutive days. Although the connected components algorithm was run over all grid cells, the statistics for the labelled events were computed over land only. In total, the database contains 26 351 unique labelled CDH events for the years 1970 to 2023. Most events have a duration of four days and a spatial extent smaller than a grid cell at the equator (area) (Fig. 9, left). In recent years, there were not only more CDH events (Fig. 9, right), but the distribution of their spatiotemporal volume consistently shifted towards larger events. Indeed, all ten largest events occurred after the year 2000. They are listed in Table 2 (top) along with the ten longest events (bottom). The distribution of the duration of CDH events is stable over time, except for the top 5 % that tend to last longer.
Table 2Biggest labelled dry and hot extreme events in the period 1970–2023 over land only: Ten largest in volume and ten longest in duration. The area is an adimensional proxy of the spatial land area affected by an event obtained by counting the number of land voxels in an event multiplied by the cosine of their respective latitude (volume) divided by the number of days between the start and the end of the event (duration). An area of 1 is the size of a 0.1×0.1° grid cell at the equator or about 122 km2.
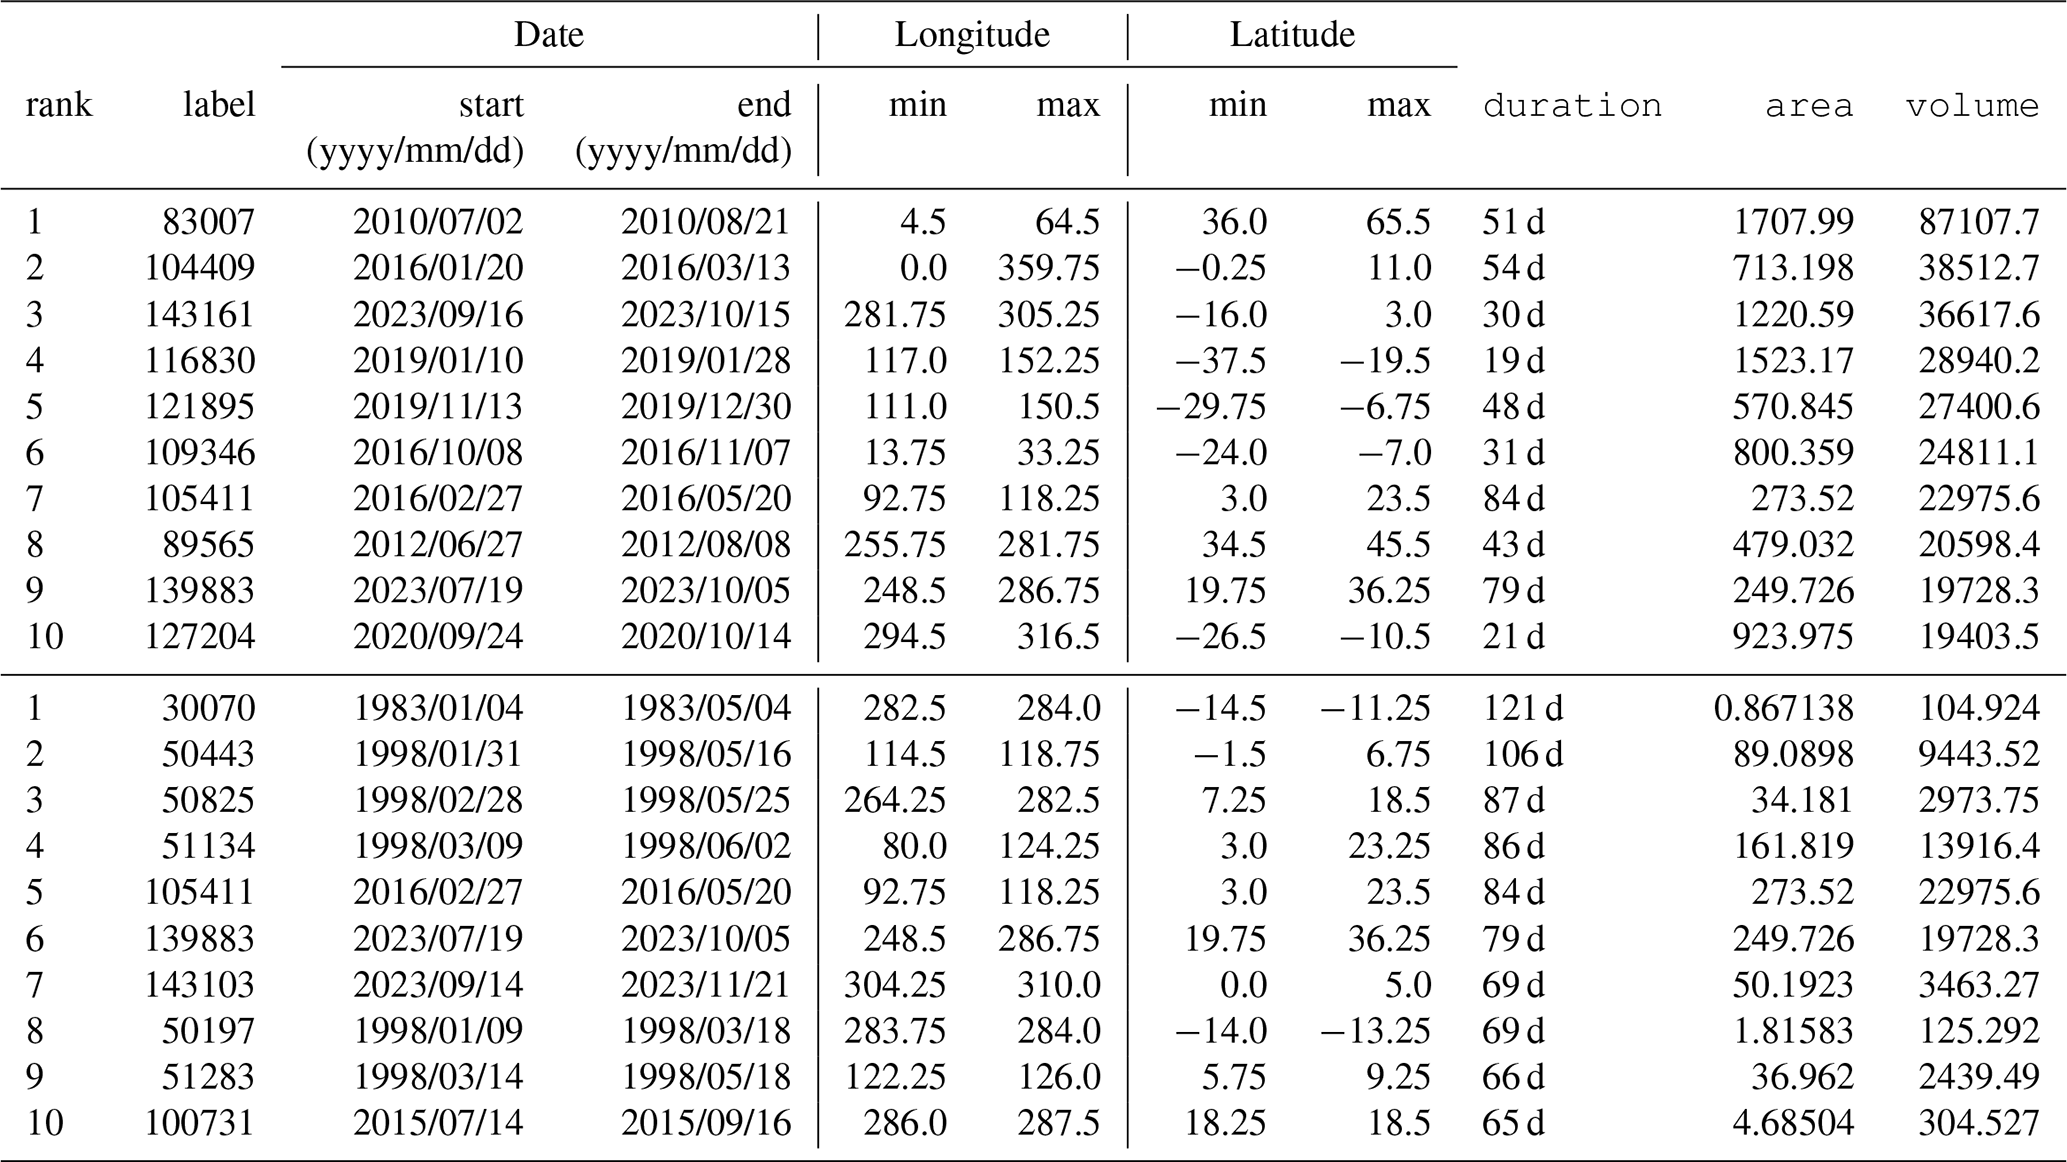
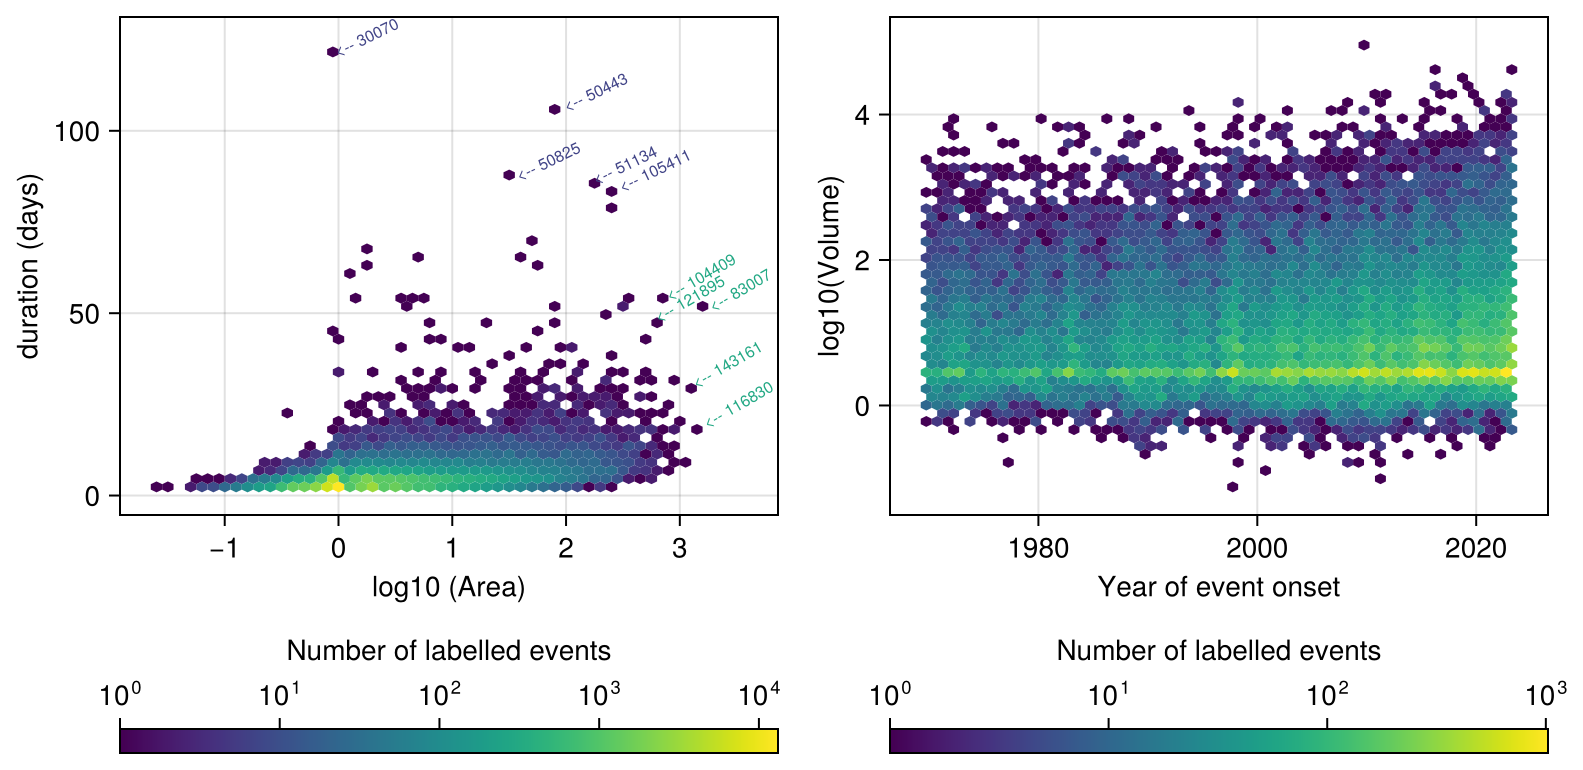
Figure 9Two-dimensional histograms of labelled events over land only in the years 1970 to 2023. Left: Duration versus area of events. Labels indicate the five events with the largest volume (green) and the longest duration (blue); Right: Volume of event versus year of event's onset.
Figure 10 shows the ten largest labelled events that occurred in the years 1970 to 2023. The largest event overall – labelled 83007 – relates to the Russian heatwave of 2010 (e.g. Flach et al., 2018). In the spring and summer of 2012 (labelled event 89565), the United States of America suffered through their hottest year on record, which complicated and exacerbated the ongoing drought situation (Rippey, 2015).
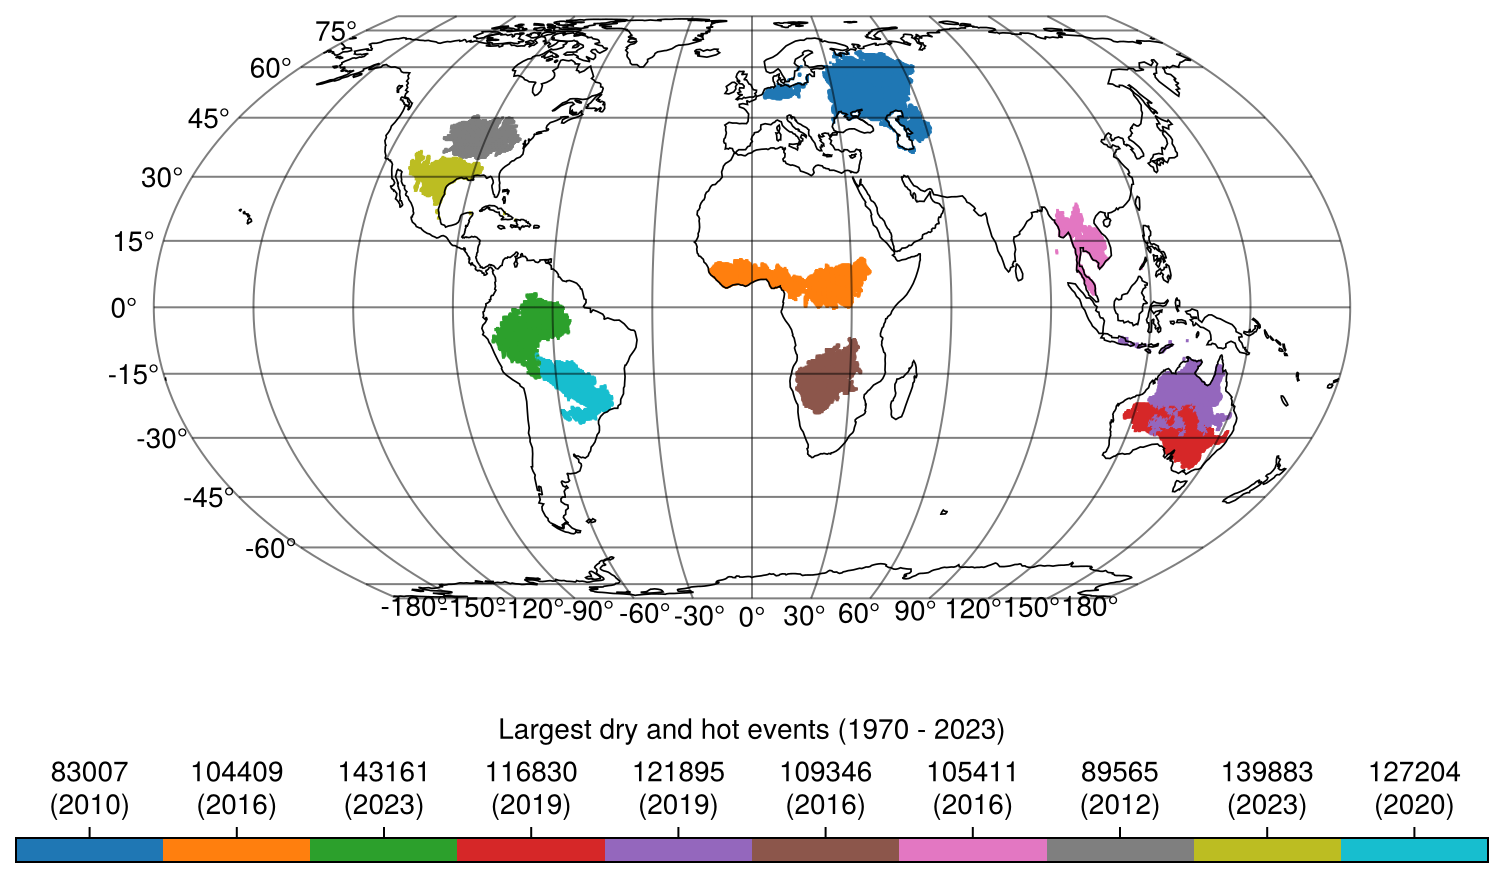
Figure 10Spatial footprint of the ten labelled dry and hot events with the largest land volume (area × duration) detected in this study from 1970 to 2023. The legend indicates the label of the events in the Dheed database and the year in which they started.
The Copernicus Global drought observatory (GDO, https://drought.emergency.copernicus.eu/tumbo/gdo/map, last access: 13 March 2025) identifies a meteorological drought in West Africa from 21 January to 31 March 2016 (ID 109036), corresponding to Dheed's labelled event 104409. The year 2016 broke records of hot days in southern Africa (labelled event 109346, Engdaw et al., 2022). In April 2016, mainland southeast Asia saw record high temperatures and reduced rainfall and cloud cover caused by EL Niño/Southern Oscillation (ENSO) (labelled event 10541, Thirumalai et al., 2017). According to the Australian Bureau of Meteorology1,2,3, January 2019 was Australia's warmest on record with below average precipitation corresponding to labelled event 116830. November and December of that year also broke records of heat and low rainfall (labelled event 121895). A severe drought-complex hit over the Pantanal and other regions in South America in October 2020, increasing fires and impacts on natural and human systems (Marengo et al., 2022), to which labelled event 127204 can be associated. Record drought and warmth in the Amazon in 2023 (labelled event 143161) can be related to regional and global climatic features (Espinoza et al., 2024). The year 2023 also saw a prolonged heatwave event over south-eastern USA and Central America (Event 139883, Perkins-Kirkpatrick et al., 2024).
ENSO–induced droughts in Malaysia/Indonesia (Borneo-Kalimantan Island) in 1997–1998 and 2014–2016 are captured in the longest labelled events 50443, 51134 and 51283 on the one hand and 105411 on the other hand (Table 2, bottom), which contributed to triggering increased forest mortality (Allen et al., 2010). The GDO reports a hydrological dought event (ID 100430) from 11 February to 20 April 1983 on the souther coast of Peru, corresponding to Dheed labelled event 30070. The GDO reports two hydrological drought events (ID 103888 from 21 February to 10 March 1998, Nicaragua, Costa Rica, Honduras; ID 103924 from 11 April to 20 September 1998, Guatemala, Mexico) over Central America which intersect with Dheed labelled event 50825. The GDO reports a large hydrological drought event (ID 111455 from 1 May to 30 November 2023) over Mexico and the southern USA, with which Dheed labelled event 139833 can be associated. Labelled event 143103 in North East Brazil intersects with GDO mega drought event ID 111440 covering large parts of South America from 11 April 2023 to 31 December 2024. The GDO also reports heatwaves lasting up to more than 14 d in the same area. Dheed labelled event 50197 in Peru in January–March 1998 is close to GDO hydrological drought event ID 103850 from 1 January to 20 April 1998. Heatwaves are reported in southern Dominican Republic in July 2015, which can be associated to labelled event 100731.
3.3 Validation
The extremely dry days obtained from the temporal analysis of PEI30, PEI90, and PEI180 with a 1 % threshold were compared with days with a daily SPEI less than −2 at ICOS sites (EOBS based, (Pohl et al., 2023); ERA5 based, Liu et al., 2024) over the period 2000–2021. The three methods only partially agree, with almost 30 % of the days detected as extremely dry in this study having a SPEI greater than −2. Nevertheless, the disagreement between the other two methods is larger than that between Dheed and any of both methods. More details are given at Appendix D.
The results of the trend analysis presented at Sect. 3.1 are consistent with the literature even if no other study relies on the exact same definition of CDH as the one we use here. Using three different combinations of observed and reanalysis-based data sets, Mukherjee and Mishra (2021) noted a significant increase in global drought-related heat waves and their corresponding spatial extent in a recent (warmer) period (2000–2016) compared to a past period (1983–1999). Combining forecasting and reanalysis data and a ten-year return period, Zampieri et al. (2024) also observe a significant increase in area subject to drought (0.5 % of land area per decade), heat risk (7.3 % in recent decades) and their compound (about 0.6 % per decade) over the period 1983–2023 (reference period 1993–2016). They observe similar albeit less pronounced results with stationary thresholds and time-dependent percentiles or thresholds.
Next to the largest and longest extreme dry and hot events discussed in the previous section, the database was validated against a list of extreme events gathered independently and a priori (Table B1). The intersection of the reported approximate footprint and time range of those events with the database proposed here is summarized in Fig. 11. Reported events are generally associated with a few large labelled events and with many small labelled events. This is consistent with the distribution of the size of the labelled events (Fig. 9). However, two reported events from Table B1 (36, 39) intersect with none in the Dheed database. Both are reported droughts. The 1993 drought in North East Brazil (event 36) and the Sahel drought (event 39) of 1983–1984 were not associated with heatwaves, although extreme heat and drought coincided in the previous hydrological year in the Sahel (reported event 40).
The global event detection of compound dry and hot extreme events faces the difficulty of dealing with processes that happen at different time scales. Droughts occur over months and years while heatwaves take place over a few days or weeks. Computing a global standardized drought index based on daily data proved difficult. Instead, we rely on the empirical probability distribution of the drought and heat indicators. The local rank-transformation assumes that the number of extremes is the same in each grid cell, defined by a global probability. Finding a good threshold for defining extreme events on daily data was also challenging. Selecting DEOs that are too frequent leads to connectivity issues and very large labelled events spanning over the whole globe. Part of the problem was that the connected component analysis for the event detection is run on an equi-rectangular grid, which leads to a bias towards more connections and larger events at high latitudes. We tested different thresholds and spatial filtering of extreme event scores respecting the spherical nature of the Earth to find a balance between the detection of documented events and avoiding too large events. Other authors have reported similar difficulties when tuning a clustering algorithm to build a database of drought events (Cammalleri et al., 2023). The 1 % threshold is a compromise between the volume, duration and spatial footprint of the largest labelled extreme events and the effective detection of reported extreme events. We prefer smaller events to very large ones, even if a reported event is then associated with multiple smaller labelled events from our database. The framework presented here concentrates on detecting and labelling droughts and heatwaves and their compound occurrence based on daily meteorological data. Our approach relies on daily data and defines CDH at daily scale, but using 30, 90 and 180 d accumulation periods for assessing dry conditions. Hence, a DEO combines heat on the day with accumulated water stress, allowing to reconcile the differing time scales of drought and heat. Flash droughts are not a focus of this study. Only three consecutive DEOs make it to a labelled CDH, alleviating the overestimation of CDH events. The resulting labelled CDH events can be used to analyze trends at regional, continental and global scales and to drive further research into the impacts of such events on ecosystems, specific species or society. For example, it has been firstly used as a basis for sampling high-resolution satellite imagery (Ji et al., 2025) to investigate how these compound dry and hot extreme events impact the performance of models predicting the ecosystem state. In addition, the combination of the atmospheric extreme event database and the satellite imagery describing the ecosystem responses can help to improve our understanding of the conditions under which a certain atmospheric extreme event will have impacts on the biosphere.
In the present case, the database includes only dry and hot compound events. However, the event detection pipeline is set up to be used in a generic way and could produce event databases for different sorts of events. For example, it would be interesting to investigate other types of meteorological extreme events, e.g. involving heavy precipitation, storms, extreme cold and their combinations with heatwaves and droughts. These databases could then be used on their own or for determining areas of interest where they can be combined with other data streams, e.g. to study time series of high-resolution satellite imagery. In addition to the potential of investigating other event types, methodological improvements to the event detection pipeline are envisioned in future research. The connectivity problem at high latitudes can be addressed using other spatial filtering of extreme event scores respecting the spherical nature of the Earth, or even running the detection pipeline on grid systems with less distortion (DGGS). Besides, the current workflow is based on univariate distributions of indicators of extreme conditions. The compound nature of multi-hazard extreme events could be better apprehended with multivariate distributions. For example, standard multivariate normal kernel has been shown to outperform univariate extreme event detection on synthetic data (Flach et al., 2017) and successfully applied on real Earth system data to detect anomalies (Flach et al., 2021). De Luca et al. (2020) proposed a method based on dynamic systems theory for characterizing dry-hot and wet-cold compound events in terms of the coupling between precipitation and temperature fields, allowing to relate long-term changes in compound events to their underlying physical drivers. Moreover, the addition of new data to the database currently necessitates to run again the complete workflow to update the rank transformed indicators. It also bears the risk that previously detected extremes don't appear as extremes if there is a distribution shift, which seems to be the case as shown in Fig. 6. Besides, the labels would not be consistent across versions. Hence, in future versions, we will determine the thresholds based on a reference period, which will facilitate the addition of updated data and will ensure that previously detected extreme events stay valid. In its current state, the database records the extreme events, but not their intensity. A combined cumulative metric for both dry and hot conditions would need particular attention. In their review, Hao et al. (2022) mention the Dry-Hot Magnitude Index (DHMI) of compound dry and hot extremes (Wu et al., 2019) valid for monthly input data. It could be adapted to deal with the daily data and with the multiple drought indicators used in Dheed.
Code associated with this study, including the full data processing to create the database of dry and hot extreme events, as well as the creation of the figures presented in this article, is available from https://doi.org/10.5281/zenodo.13711288 (Weynants et al., 2025a) under MIT license. The database of connected compound dry and hot extreme events is available from https://doi.org/10.5281/zenodo.11044871 (Weynants et al., 2025b) under Creative Commons Attribution International 4.0 license. With no guarantee of permanent storage, all data cubes generated with the current workflow can currently be accessed on a public s3 bucket at https://s3.bgc-jena.mpg.de:9000/deepextremes?prefix=v4 (last access: 21 November 2025). A ReadMe file details the contents of the data store and how to access the data cubes with Julia or python: https://s3.bgc-jena.mpg.de:9000/deepextremes/v4/ReadMe.md (last access: 21 November 2025).
In this data description paper, we propose Dheed (Weynants et al., 2025b), a daily dry and hot extreme events database based on ERA5 consisting of two data cubes and a table: (i) an EventCube of Discrete Extreme Occurrences (DEOs), i.e. days in which extremely dry and/or hot conditions were detected; (ii) a LabelCube of uniquely labelled compound dry and hot extreme (CDH) events, i.e. blobs of simultaneously dry and hot DEOs connected in space and time lasting at least three days; (iii) StatEvents, a table containing summary statistics for all labelled CDH events. The analysis of the EventCube confirms that the occurrence of both dry and hot extremes as well as their co-occurrence has increased significantly in the past few decades. The trend is not homogeneous across all continents, with Europe and Africa seeing the strongest increase in the annual number of days and areas affected by CDH conditions. Dheed was compared against a list of extreme events reported in the literature and collected a priori. Out of 40 events, 38 could be associated with Dheed CDH events. All 10 largest and 10 longest Dheed events could be linked to events reported in the scientific or grey literature. The LabelCube and its associated table allow the user to easily retrieve in time and space extremely dry and hot conditions, which have occurred, according to climate reanalysis data, between 1950 and 2023, to further study their impact on ecosystems and societies.
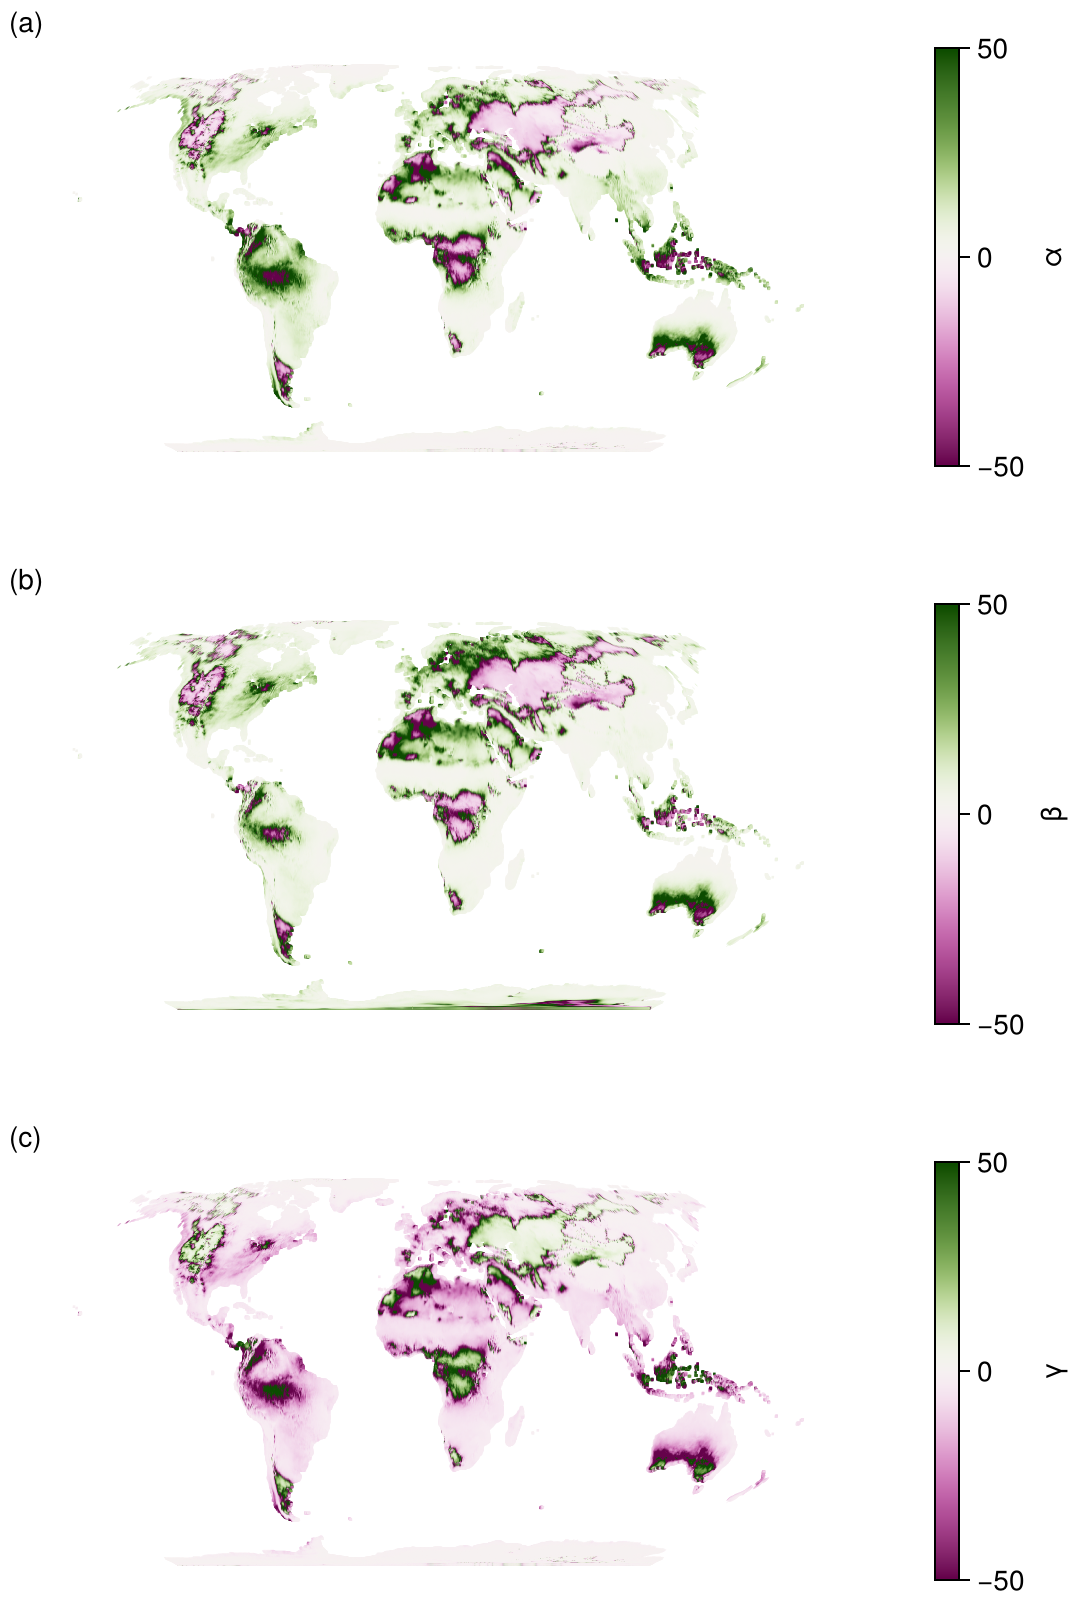
Figure A1Parameters of the log-logistic distribution fitted on PEI30 timeseries: (a) α, (b) β, (c) γ.
In our study we use empirical estimators to derive the 1 % quantile value of PEIx for every grid cell, the value that splits extreme dry data points into non-extreme ones. The SPEI dryness index (Vicente-Serrano et al., 2010) is commonly applied to monthly and deseasonalised data to define a dryness indicator that directly describes the severity of droughts in units of standard deviations (a value of −2 means a 2σ drought). Such an index would be an alternative indicator to split extreme from non-extreme time steps.
So far the SPEI has been demonstrated to work well for monthly and de-seasonlized data, while the DHEED is built on daily and non-deseasonalized moving-average PEI values. Here we investigate the applicability of SPEI to daily PEI values and its robustness compared to a direct quantile estimates.
First, we fit the three parameters of a log-logistic distribution to the daily PEIx data in the time range from 1950 to 2023 to derive a daily SPEI. Distribution parameters are estimated according to https://spei.csic.es/home.html#p7 (last access: 15 March 2022). Figure A1 shows global maps of the derived model parameters. We note that the parameters seem to be highly correlated and suspect some equifinality to exist as the range of possible parameter values varies a lot globally. Based on the estimated parameters we can derive an extreme value threshold for every grid cell that corresponds to the quantile of 1 %. Figure A2 shows the derived threshold that separates extreme from non-extreme events (a) derived from the parametrized distribution and (b) directly derived using empirical quantiles. Both maps show similar patterns. Thresholds derived from empirical quantiles do not seem to be affected by noise. This seems to indicate that a time span of 83 years is sufficient to estimate stable 1 % quantile. Figure A2c shows the difference of the 1 % threshold derived with both methods. Although both methods of threshold estimation result in similar patterns, the difference between the values can be large (exceeding 0.5 mm d−1).
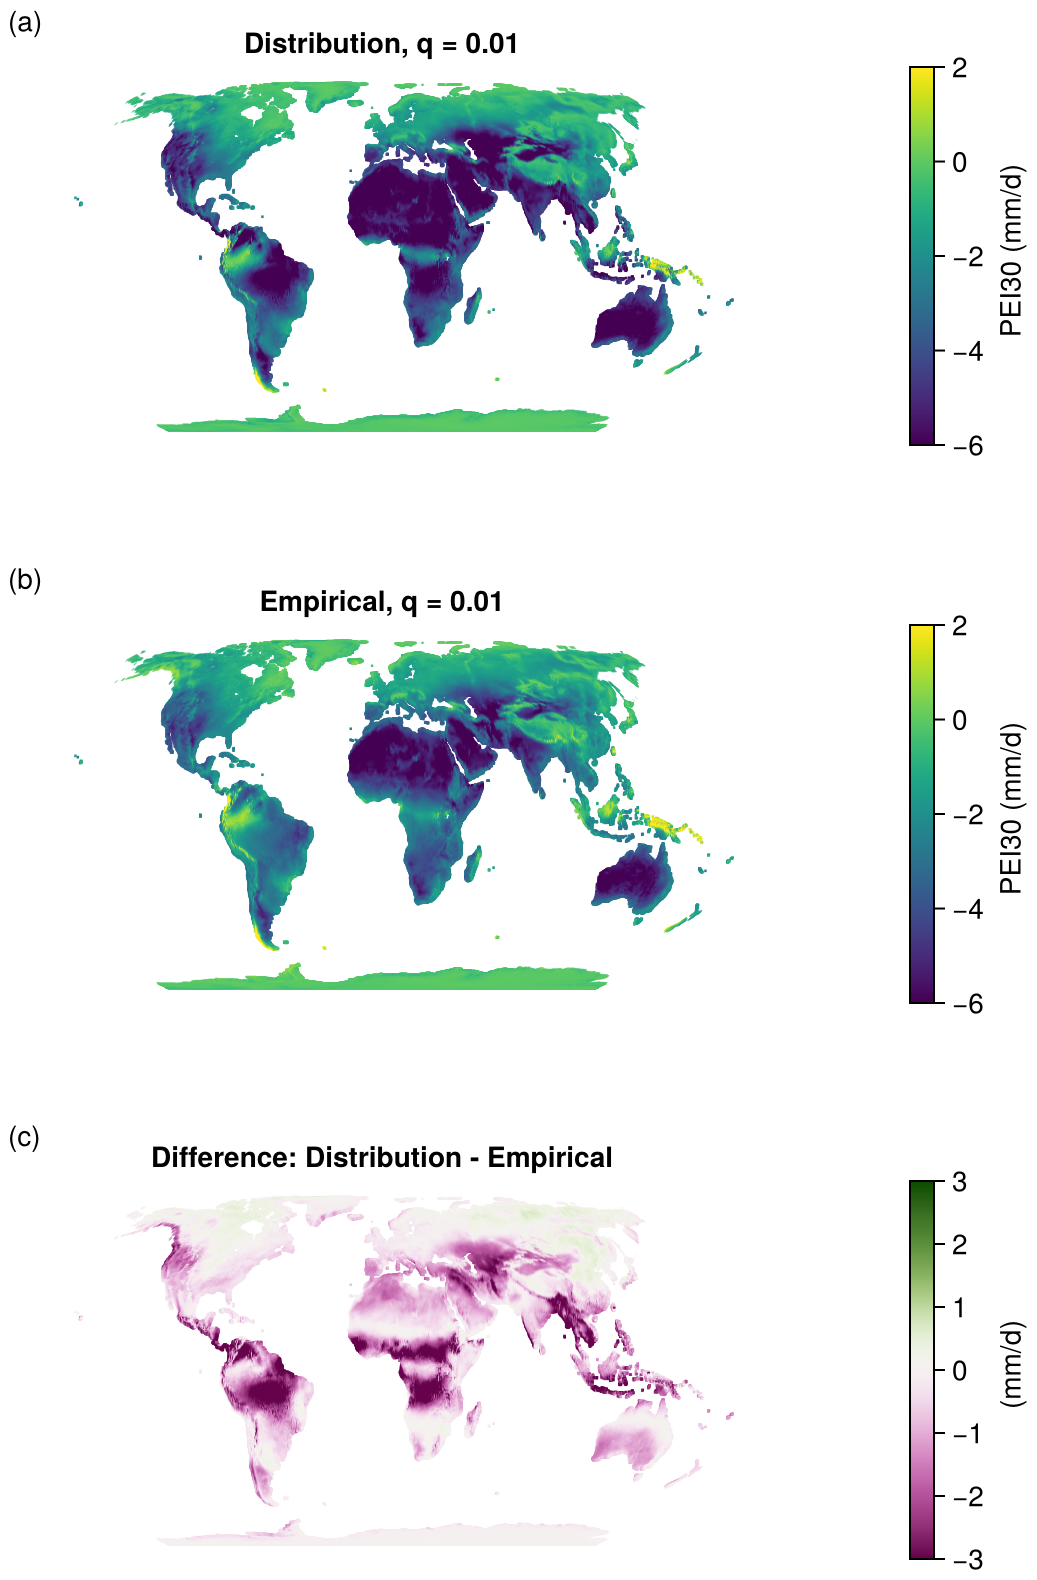
Figure A2PEI30 1 % threshold separating extreme from non-extreme events (a) derived from the parametrized distribution and (b) directly derived using empirical quantiles, and (c) their difference.
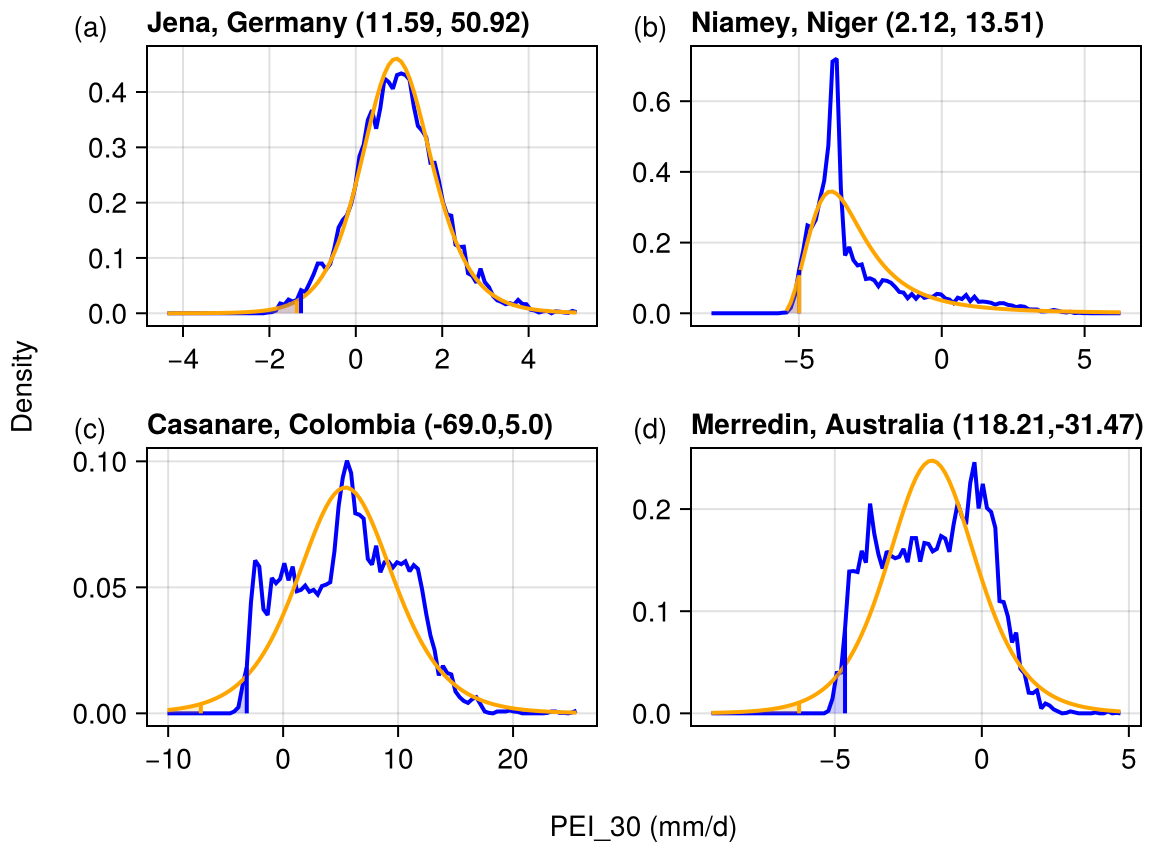
Figure A3Probability density functions of PEI30 values at four locations: in blue the empirical distribution, in orange the fitted distribution. The vertical lines show the 1 % threshold and the shaded area under the curve the probability of extremes.
In order to understand the cause of this difference, we investigate the probability density functions (pdf) of the estimated log-logistic distribution and an empirical pdf for a few example locations. While for some regions like central Europe the log-logistic distribution fits the data reasonably well (Fig. A1a), this is not the case for many other regions in the world. In the example cases (c) and (d) neither in the centre nor at the edges of the distribution, which are most relevant to our study, does the estimated distribution fit well to the data. We suspect that non deseasonalized data that include seasonal effects like dry and wet seasons lead to bi-modal PEI distributions that are not observed in anomalies and therefore make it infeasible to fit a log-logistic distribution that would work for anomalies. We conclude that using empirical quantiles is a more appropriate method to derive an extreme event threshold for our particular study that considers non-deseasonalized daily time series of 83 years length.
Table B1Extreme events reported in the literature or the media used to validate the event detection method.
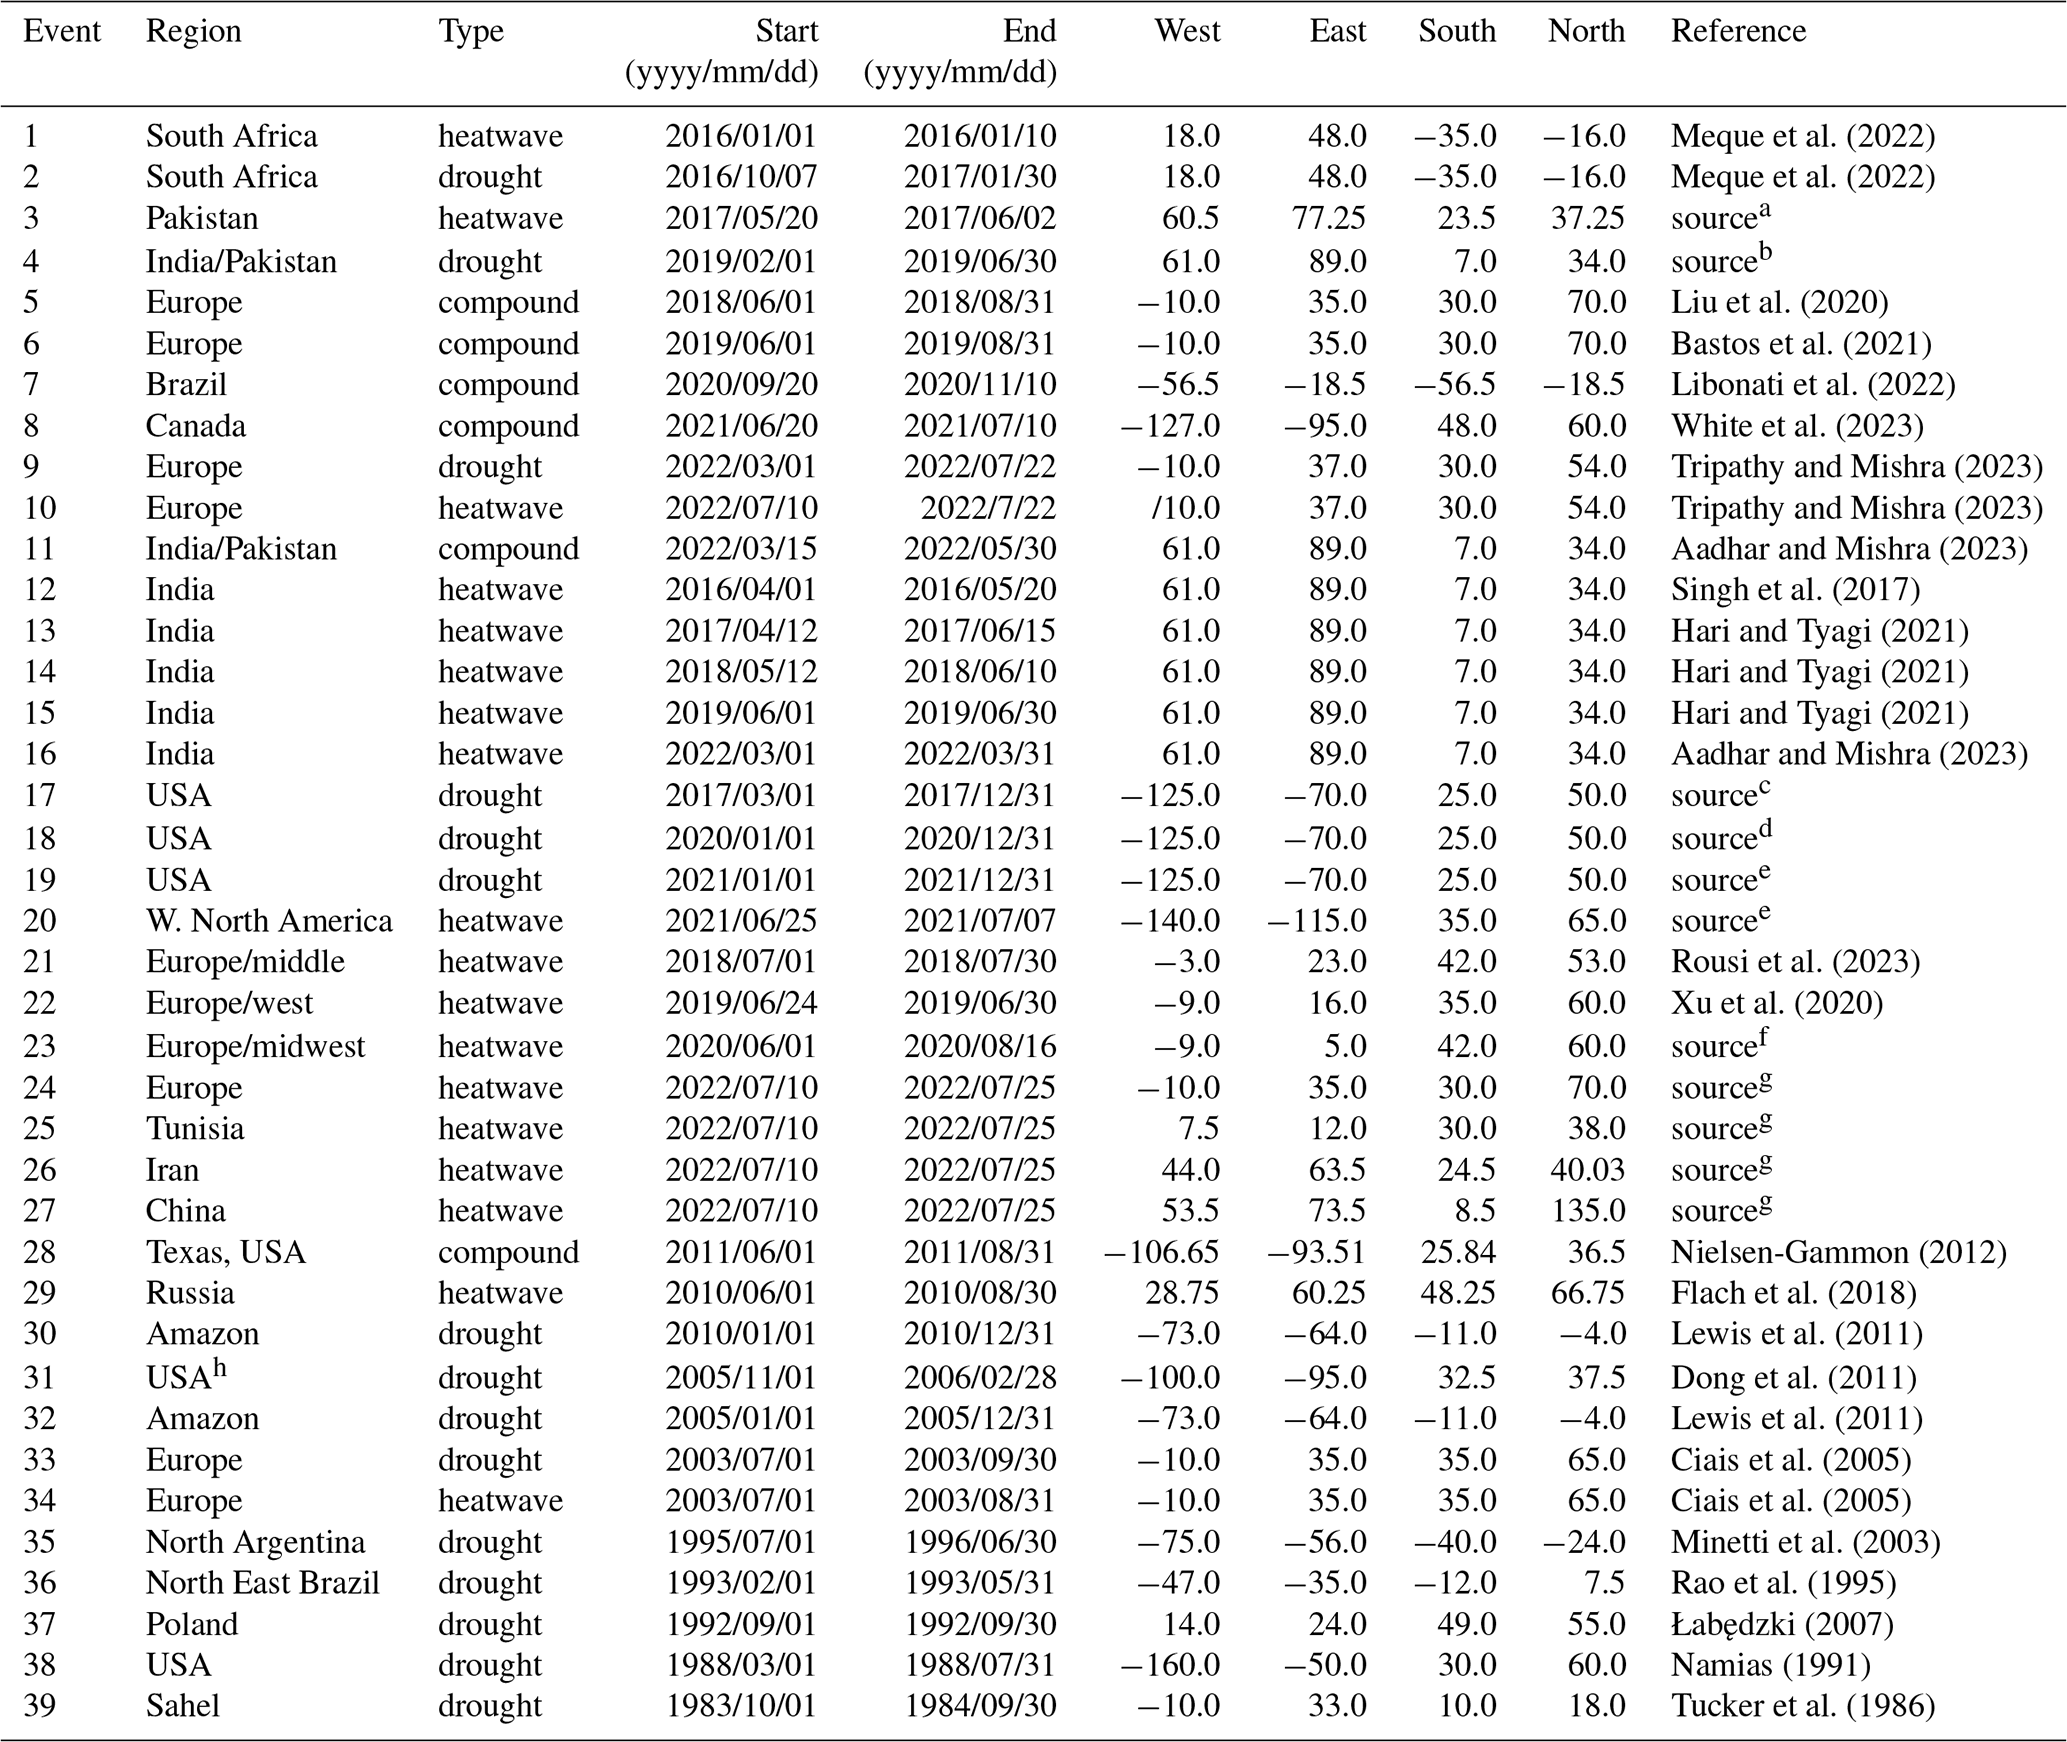
Sources: a https://en.wikipedia.org/wiki/2017_Pakistan_heat_wave (last access: 5 September 2024), b https://en.wikipedia.org/wiki/2019_heat_wave_in_India_and_Pakistan (last access: 5 September 2024), c NOAA Annual 2017 Drought Report. https://www.ncei.noaa.gov/access/monitoring/monthly-report/drought/201713 (last access: 5 September 2024), d NOAA Annual 2020 Drought Report. https://www.ncei.noaa.gov/access/monitoring/monthly-report/drought/202013 (last access: 5 September 2024), e NOAA Annual 2021 Drought Report. https://www.ncei.noaa.gov/access/monitoring/monthly-report/drought/202113 (last access: 5 September 2024), f Heatwaves and warm spells | Copernicus. https://climate.copernicus.eu/esotc/2020/heatwaves-and-warm-spells-during-2020 (last access: 5 September 2024), g Heatwaves and Fires Scorch Europe, Africa, and Asia | NASA Earth Observatory. https://earthobservatory.nasa.gov/images/150083/heatwaves-and-firesscorch-europe-africa-and-asia (last access: 26 August 2024), h Southern Great Plains.
Figure C1 shows the last five years of the time series for the four indicators (T2 m,max, PEI30, PEI90, and PEI180) used in the detection of DEOs around the city of Jena, Germany (50.9° N, 11.59° W). Daily ET0 and P are also shown in the background. At that particular location, the 1 % threshold of maximum daily temperature obtained for the full time series (1950–2022) is 303.85 K, or 30.70 °C. Such a threshold classifies as extremes only the summer hot days. The thresholds for the drought indicators are PEI30= −1.30, PEI90= −0.80 and PEI180= −0.38 mm d−1. 2018, 2019, 2020 and 2022 have been dry, with cumulative water deficit showing for all three PEIs. At a location in a completely different climate zone, the thresholds will also be different. For example, around Niamey, Niger (13.5116° N, 2.1254° E, Fig. C2), the thresholds are: , PEI30= −5.02, PEI90= −4.70 and PEI180= −4.31. In this Sahelian climate, a deficit in water is the norm rather than the exception.
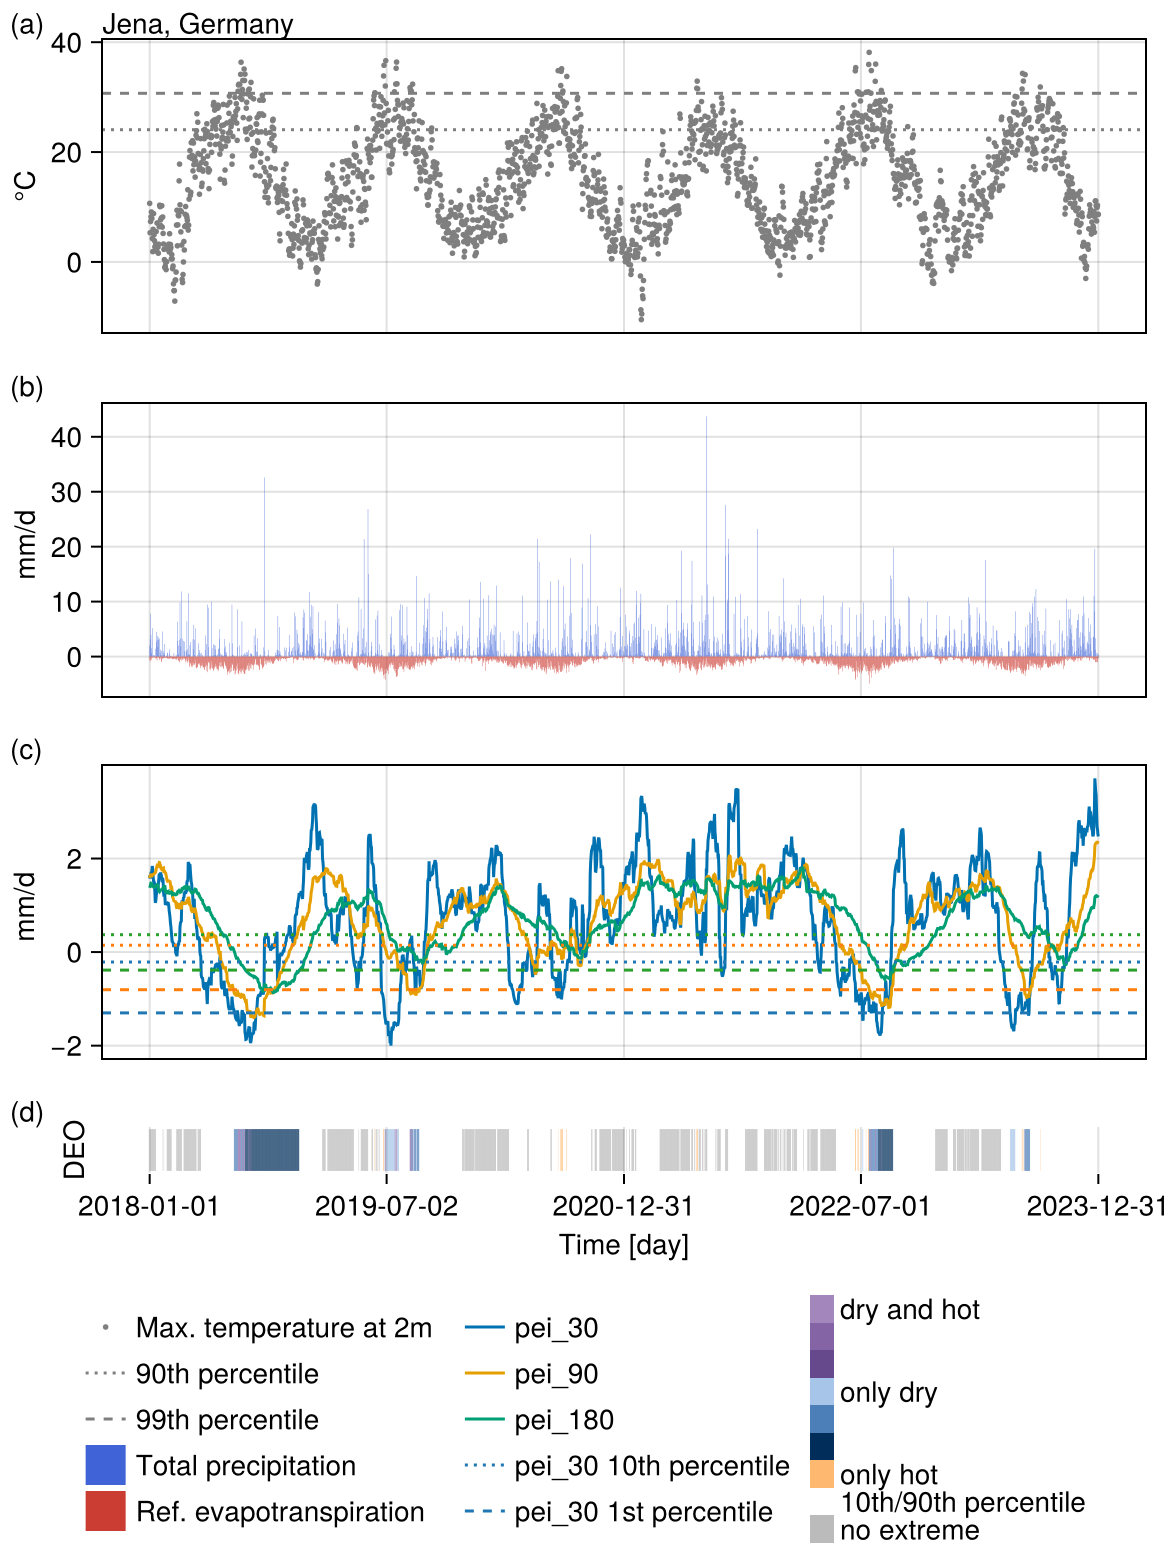
Figure C1Timeseries (2018–2022) of (a) maximum daily temperature, (b) daily precipitation and reference evapotranspiration, (c) the three drought indicators (PEI) and (d) the Discrete Extreme Occurrences (DEO) around the city of Jena, Germany. The summers in those years (except 2021) were relatively dry, with very hot days resulting in compound dry and hot extremes in 2018, 2019 and 2022.
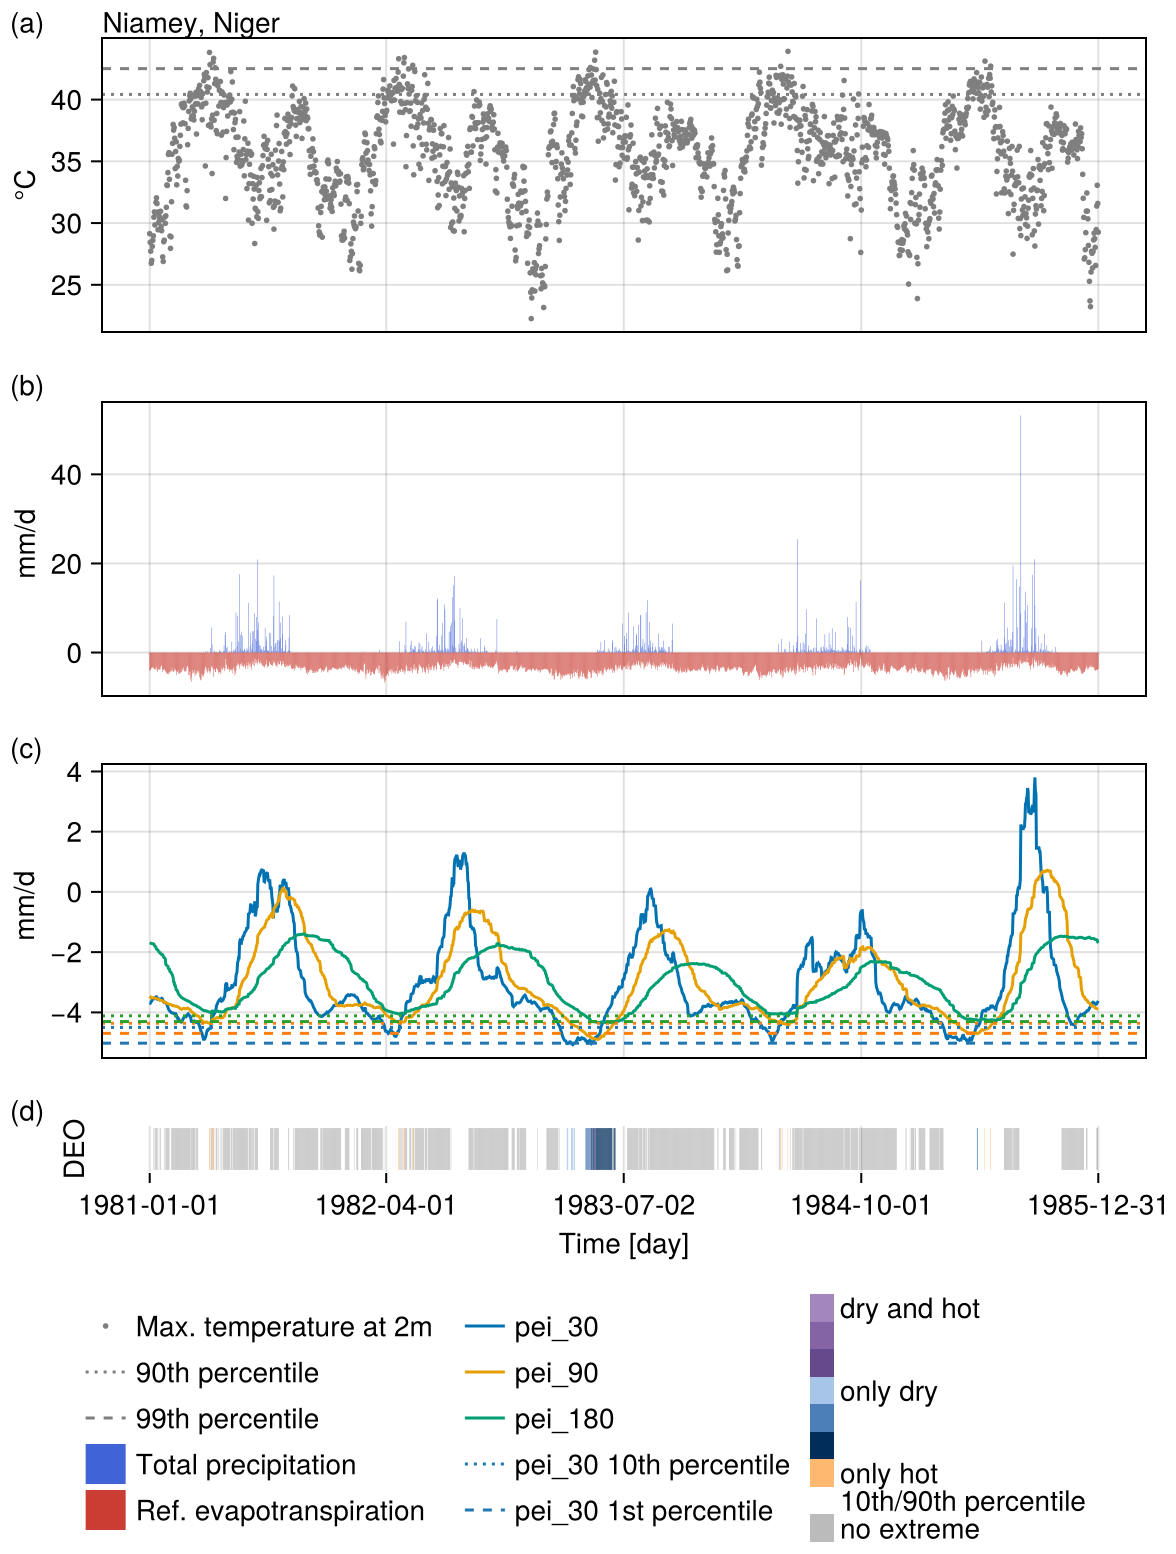
Figure C2Timeseries (1981–1985) of (a) maximum daily temperature, (b) daily precipitation and reference evapotranspiration, (c) the three drought indicators (PEI) and (d) the Discrete Extreme Occurrences (DEO) around the city of Niamey, Niger. The year 1983 was very dry, but it had only one very hot day resulting in a compound dry and hot event that would not be labelled in Dheed, where events must last at least three days.
The extremely dry days obtained from the temporal analysis of PEI30, PEI90, and PEI180 were compared with days with SPEI less than −2 at ICOS sites from two independent datasets (EOBS based, (Pohl et al., 2023); ERA5 based, Liu et al., 2024) over the period 2000–2021. In 10 % of the sites, SPEI from (Liu et al., 2024) was not available, corroborating our observation that standardizing the daily SPEI by fitting a parametric model does not work everywhere. The three methods only partially agree, with 29 % of the days detected as extremes by Dheed having a SPEI greater than −2 in both datasets, i.e. which are not classified as extremely dry based on deseasonalized time series. Out of the total number of days detected as extremely dry in any of the three datasets, almost 14 % were detected by all three methods. The agreement increases with longer accumulation periods. The disagreement between Dheed and the other two datasets is less than the disagreement between the other two. Unsurprisingly, the agreement of Dheed with Liu is greater than with Pohl, which relies on different input data. An example of the comparison of the three datasets is given at Fig. D1.
Table D1Percentage of agreement between the days detected as extremes by three methods at 101 ICOS sites over the period 2000–2021. Dheed: this study; Pohl: EOBS-based daily SPEI (Pohl et al., 2023); Liu: ERA5-based daily SPEI (Liu et al., 2024).
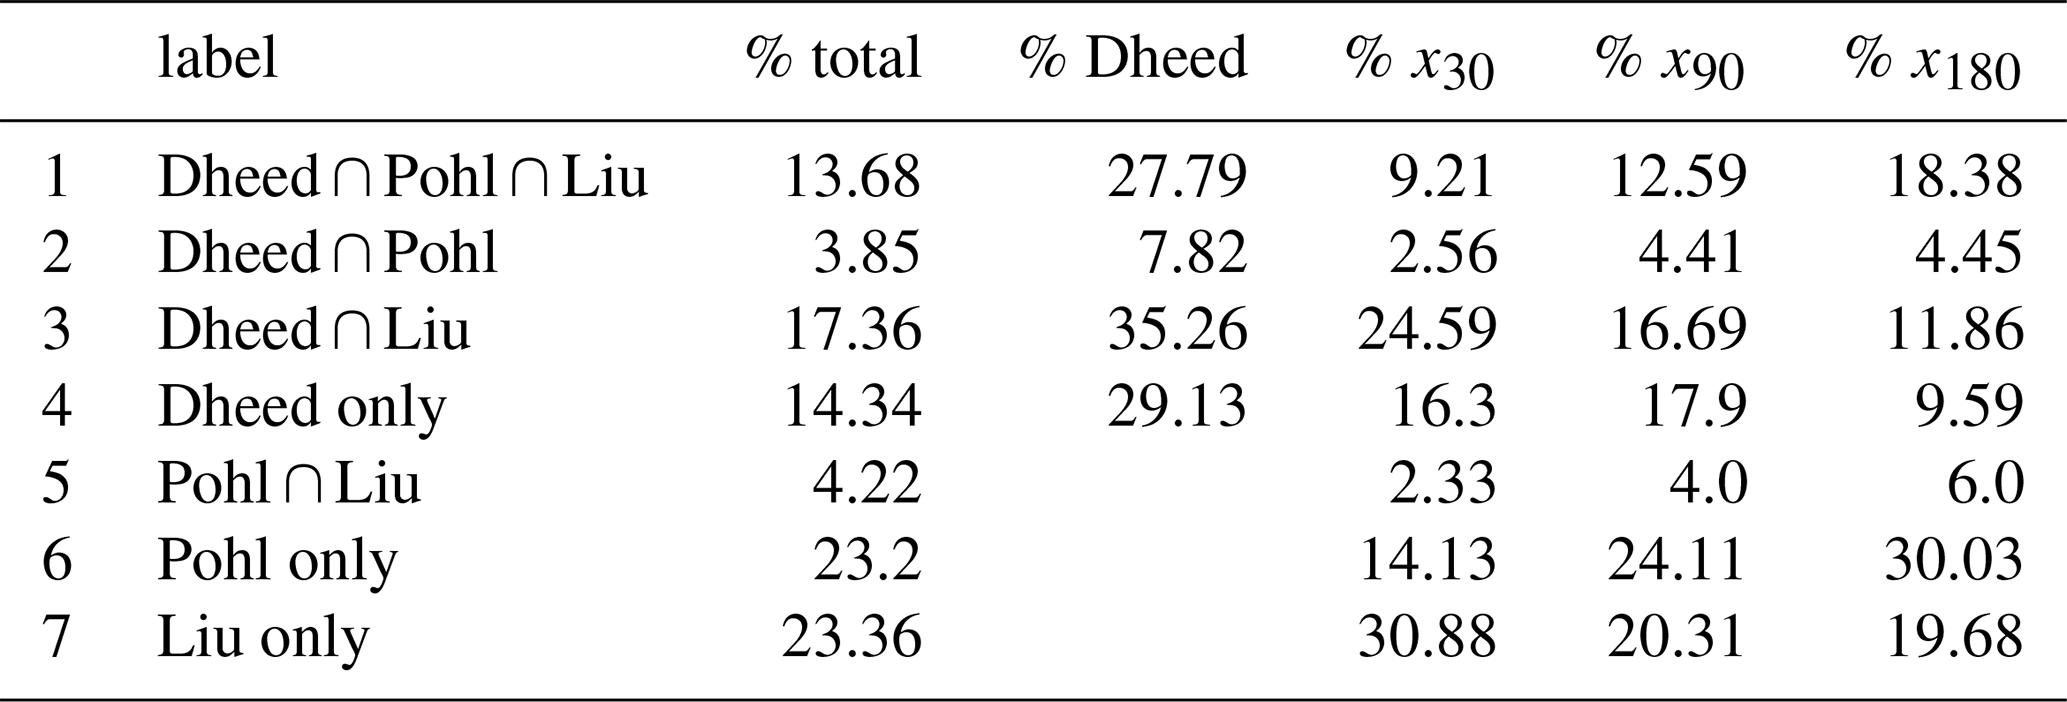
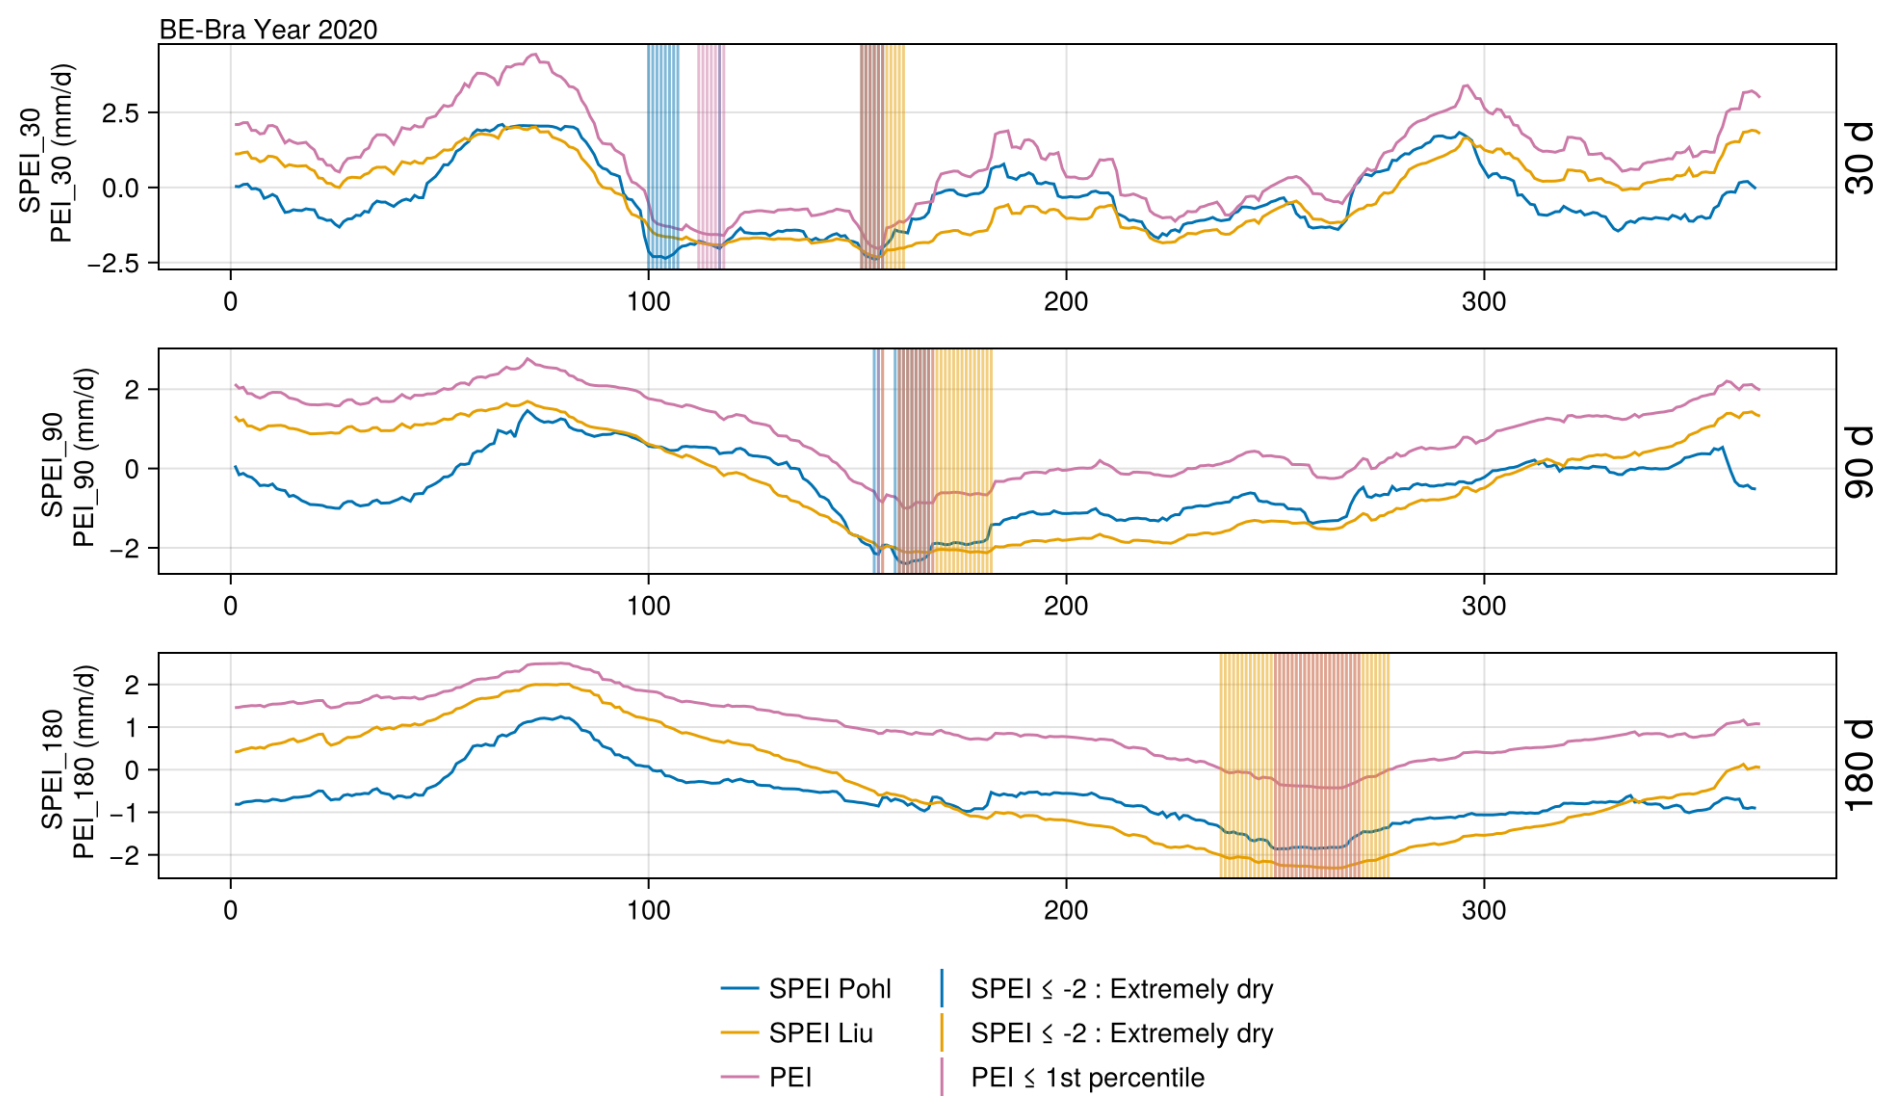
Figure D1Time series of daily PEI30, PEI90, and PEI180 (PEI) and daily SPEI from two independent datasets (Pohl: EOBS based, Pohl et al., 2023; Liu: ERA5 based, Liu et al., 2024) at one ICOS site in Belgium for the year 2020. The vertical lines show the days detected as extremely dry.
MW, FG and NL in conversation with MDM and the Deep Extremes team designed the methodology. NL, FG and MW coded the workflow. UW retrieved and pre-processed the ERA5 data. CJ compiled the table of historic extreme events. MW ran the code, conducted the analyses and wrote the manuscript with contributions from all co-authors.
The contact author has declared that none of the authors has any competing interests.
Publisher’s note: Copernicus Publications remains neutral with regard to jurisdictional claims made in the text, published maps, institutional affiliations, or any other geographical representation in this paper. While Copernicus Publications makes every effort to include appropriate place names, the final responsibility lies with the authors. Views expressed in the text are those of the authors and do not necessarily reflect the views of the publisher.
The authors thank the reviewers and the editor for their comments and suggestions that helped to improve the manuscript.
This research has been supported by the European Space Agency (AI4Science project “Multi-Hazards, Compounds and Cascade events: DeepExtremes”, AI4Science project “Climate Adaptation, Extremes, Multi-Hazards and Geo-Hazards Science: ARCEME” and AI4Science project “The DeepESDL AI-Ready Earth System Data Lab”) and the EU Horizon 2020 Framework Programme, H2020 Societal Challenges (grant no. 101003469).
The article processing charges for this open-access publication were covered by the Max Planck Society.
This paper was edited by Jing Wei and reviewed by Aolin Jia, Paolo De Luca, and two anonymous referees.
Aadhar, S. and Mishra, V.: The 2022 mega heatwave in South Asia in the observed and projected future climate, Environmental Research Letters, 18, 104011, https://doi.org/10.1088/1748-9326/acf778, 2023. a, b
Allen, C. D., Macalady, A. K., Chenchouni, H., Bachelet, D., McDowell, N., Vennetier, M., Kitzberger, T., Rigling, A., Breshears, D. D., Hogg, E. T., Gonzalez, P., Fensham, R., Zhang, Z., Castro, J., Demidova, N., Lim, J.-H., Allard, G., Running, S. W., Semerci, A., and Cobb, N.: A global overview of drought and heat-induced tree mortality reveals emerging climate change risks for forests, Forest Ecology and Management, 259, 660–684, https://doi.org/10.1016/j.foreco.2009.09.001, 2010. a, b
Allen, R. G., Pereira, L. S., Raes, D., and Smith, M.: Crop evapotranspiration – Guidelines for computing crop water requirements, FAO Irrigation and drainage, FAO – Food and Agriculture Organization of the United Nations, Rome, ISBN 92-5-104219-5, https://www.fao.org/3/x0490e/x0490e00.htm#Contents (last access: 21 November 2025), 1998. a, b, c
Bastos, A., Ciais, P., Friedlingstein, P., Sitch, S., Pongratz, J., Fan, L., Wigneron, J. P., Weber, U., Reichstein, M., Fu, Z., Anthoni, P., Arneth, A., Haverd, V., Jain, A. K., Joetzjer, E., Knauer, J., Lienert, S., Loughran, T., McGuire, P. C., Tian, H., Viovy, N., and Zaehle, S.: Direct and seasonal legacy effects of the 2018 heat wave and drought on European ecosystem productivity, Science Advances, 6, eaba2724, https://doi.org/10.1126/sciadv.aba2724, 2020a. a
Bastos, A., Fu, Z., Ciais, P., Friedlingstein, P., Sitch, S., Pongratz, J., Weber, U., Reichstein, M., Anthoni, P., Arneth, A., Haverd, V., Jain, A., Joetzjer, E., Knauer, J., Lienert, S., Loughran, T., McGuire, P. C., Obermeier, W., Padrón, R. S., Shi, H., Tian, H., Viovy, N., and Zaehle, S.: Impacts of extreme summers on European ecosystems: a comparative analysis of 2003, 2010 and 2018, Philosophical Transactions of the Royal Society B: Biological Sciences, 375, 20190507, https://doi.org/10.1098/rstb.2019.0507, 2020b. a
Bastos, A., Orth, R., Reichstein, M., Ciais, P., Viovy, N., Zaehle, S., Anthoni, P., Arneth, A., Gentine, P., Joetzjer, E., Lienert, S., Loughran, T., McGuire, P. C., O, S., Pongratz, J., and Sitch, S.: Vulnerability of European ecosystems to two compound dry and hot summers in 2018 and 2019, Earth Syst. Dynam., 12, 1015–1035, https://doi.org/10.5194/esd-12-1015-2021, 2021. a
Bastos, A., Sippel, S., Frank, D., Mahecha, M. D., Zaehle, S., Zscheischler, J., and Reichstein, M.: A joint framework for studying compound ecoclimatic events, Nature Reviews Earth & Environment, 4, 333–350, https://doi.org/10.1038/s43017-023-00410-3, 2023. a
Benson, V., Robin, C., Requena-Mesa, C., Alonso, L., Carvalhais, N., Cortés, J., Gao, Z., Linscheid, N., Weynants, M., and Reichstein, M.: Multi-Modal Learning for Geospatial Vegetation Forecasting, in: 2024 IEEE/CVF Conference on Computer Vision and Pattern Recognition (CVPR), 27788–27799, https://doi.org/10.1109/CVPR52733.2024.02625, 2024. a
Bezanson, J., Edelman, A., Karpinski, S., and Shah, V. B.: Julia: A fresh approach to numerical computing, SIAM Review, 59, 65–98, https://doi.org/10.1137/141000671, 2017. a
Biess, B., Gudmundsson, L., Windisch, M. G., and Seneviratne, S. I.: Future changes in spatially compounding hot, wet or dry events and their implications for the world’s breadbasket regions, Environmental Research Letters, 19, 064011, https://doi.org/10.1088/1748-9326/ad4619, 2024. a
Cammalleri, C., Acosta Navarro, J. C., Bavera, D., Diaz, V., Di Ciollo, C., Maetens, W., Magni, D., Masante, D., Spinoni, J., and Toreti, A.: An event-oriented database of meteorological droughts in Europe based on spatio-temporal clustering, Scientific Reports, 13, 3145, https://doi.org/10.1038/s41598-023-30153-6, 2023. a
Ciais, P., Reichstein, M., Viovy, N., Granier, A., Ogée, J., Allard, V., Aubinet, M., Buchmann, N., Bernhofer, C., Carrara, A., Chevallier, F., De Noblet, N., Friend, A. D., Friedlingstein, P., Grünwald, T., Heinesch, B., Keronen, P., Knohl, A., Krinner, G., Loustau, D., Manca, G., Matteucci, G., Miglietta, F., Ourcival, J. M., Papale, D., Pilegaard, K., Rambal, S., Seufert, G., Soussana, J. F., Sanz, M. J., Schulze, E. D., Vesala, T., and Valentini, R.: Europe-wide reduction in primary productivity caused by the heat and drought in 2003, Nature, 437, 529–533, https://doi.org/10.1038/nature03972, 2005. a, b, c
Cunningham, C. X., Williamson, G. J., and Bowman, D. M. J. S.: Increasing frequency and intensity of the most extreme wildfires on Earth, Nature Ecology & Evolution, 8, 1420–1425, https://doi.org/10.1038/s41559-024-02452-2, 2024. a
Danisch, S. and Krumbiegel, J.: Makie.jl: Flexible high-performance data visualization for Julia, Journal of Open Source Software, 6, 3349, https://doi.org/10.21105/joss.03349, 2021. a
De Luca, P. and Donat, M. G.: Projected Changes in Hot, Dry, and Compound Hot-Dry Extremes Over Global Land Regions, Geophysical Research Letters, 50, e2022GL102493, https://doi.org/10.1029/2022GL102493, 2023. a, b
De Luca, P., Messori, G., Faranda, D., Ward, P. J., and Coumou, D.: Compound warm–dry and cold–wet events over the Mediterranean, Earth Syst. Dynam., 11, 793–805, https://doi.org/10.5194/esd-11-793-2020, 2020. a
Dong, X., Xi, B., Kennedy, A., Feng, Z., Entin, J. K., Houser, P. R., Schiffer, R. A., L’Ecuyer, T., Olson, W. S., Hsu, K.-l., Liu, W. T., Lin, B., Deng, Y., and Jiang, T.: Investigation of the 2006 drought and 2007 flood extremes at the Southern Great Plains through an integrative analysis of observations, Journal of Geophysical Research: Atmospheres, 116, https://doi.org/10.1029/2010JD014776, 2011. a
Engdaw, M. M., Ballinger, A. P., Hegerl, G. C., and Steiner, A. K.: Changes in temperature and heat waves over Africa using observational and reanalysis data sets, International Journal of Climatology, 42, 1165–1180, https://doi.org/10.1002/joc.7295, 2022. a
Espinoza, J.-C., Jimenez, J. C., Marengo, J. A., Schongart, J., Ronchail, J., Lavado-Casimiro, W., and Ribeiro, J. V. M.: The new record of drought and warmth in the Amazon in 2023 related to regional and global climatic features, Scientific Reports, 14, 8107, https://doi.org/10.1038/s41598-024-58782-5, 2024. a
Flach, M., Gans, F., Brenning, A., Denzler, J., Reichstein, M., Rodner, E., Bathiany, S., Bodesheim, P., Guanche, Y., Sippel, S., and Mahecha, M. D.: Multivariate anomaly detection for Earth observations: a comparison of algorithms and feature extraction techniques, Earth Syst. Dynam., 8, 677–696, https://doi.org/10.5194/esd-8-677-2017, 2017. a
Flach, M., Sippel, S., Gans, F., Bastos, A., Brenning, A., Reichstein, M., and Mahecha, M. D.: Contrasting biosphere responses to hydrometeorological extremes: revisiting the 2010 western Russian heatwave, Biogeosciences, 15, 6067–6085, https://doi.org/10.5194/bg-15-6067-2018, 2018. a, b, c
Flach, M., Brenning, A., Gans, F., Reichstein, M., Sippel, S., and Mahecha, M. D.: Vegetation modulates the impact of climate extremes on gross primary production, Biogeosciences, 18, 39–53, https://doi.org/10.5194/bg-18-39-2021, 2021. a
Frank, D., Reichstein, M., Bahn, M., Thonicke, K., Frank, D., Mahecha, M. D., Smith, P., Van Der Velde, M., Vicca, S., Babst, F., Beer, C., Buchmann, N., Canadell, J. G., Ciais, P., Cramer, W., Ibrom, A., Miglietta, F., Poulter, B., Rammig, A., Seneviratne, S. I., Walz, A., Wattenbach, M., Zavala, M. A., and Zscheischler, J.: Effects of climate extremes on the terrestrial carbon cycle: concepts, processes and potential future impacts, Global Change Biology, 21, 2861–2880, https://doi.org/10.1111/gcb.12916, 2015. a
Gans, F., Cremer, F., Alonso, L., Kraemer, G., Dimens, P. V., Gutwin, M., Pabon-Moreno, D. E., Kong, D., Martin, Martinuzzi, F., Chettouh, M. A., Loos, D., Zehner, M., Roy, P., Zhang, Q., ckrich, Glaser, F., and linamaes: JuliaDataCubes/YAXArrays.jl: v0.5.2, Zenodo [code], https://doi.org/10.5281/zenodo.8414000, 2023. a
Hamed, R., Van Loon, A. F., Aerts, J., and Coumou, D.: Impacts of compound hot–dry extremes on US soybean yields, Earth Syst. Dynam., 12, 1371–1391, https://doi.org/10.5194/esd-12-1371-2021, 2021. a
Hao, Z., Hao, F., Xia, Y., Feng, S., Sun, C., Zhang, X., Fu, Y., Hao, Y., Zhang, Y., and Meng, Y.: Compound droughts and hot extremes: Characteristics, drivers, changes, and impacts, Earth-Science Reviews, 235, 104241, https://doi.org/10.1016/j.earscirev.2022.104241, 2022. a
Hari, M. and Tyagi, B.: Investigating Indian summer heatwaves for 2017–2019 using reanalysis datasets, Acta Geophysica, 69, 1447–1464, https://doi.org/10.1007/s11600-021-00603-8, 2021. a, b, c
Hersbach, H.: ERA5 reanalysis now available from 1940, European Centre for Medium-Range Weather Forecasts, https://www.ecmwf.int/en/newsletter/175/news/era5-reanalysis-now-available-1940 (last access: 21 November 2025), 2023. a
Hersbach, H., Bell, B., Berrisford, P., Hirahara, S., Horányi, A., Muñoz‐Sabater, J., Nicolas, J., Peubey, C., Radu, R., Schepers, D., Simmons, A., Soci, C., Abdalla, S., Abellan, X., Balsamo, G., Bechtold, P., Biavati, G., Bidlot, J., Bonavita, M., Chiara, G., Dahlgren, P., Dee, D., Diamantakis, M., Dragani, R., Flemming, J., Forbes, R., Fuentes, M., Geer, A., Haimberger, L., Healy, S., Hogan, R. J., Hólm, E., Janisková, M., Keeley, S., Laloyaux, P., Lopez, P., Lupu, C., Radnoti, G., Rosnay, P., Rozum, I., Vamborg, F., Villaume, S., and Thépaut, J.: The ERA5 global reanalysis, Quarterly Journal of the Royal Meteorological Society, 146, 1999–2049, https://doi.org/10.1002/qj.3803, 2020. a, b, c
Hersbach, H., Bell, B., Berrisford, P., Biavati, G., Horányi, A., Muñoz‐Sabater, J., Nicolas, J., Peubey, C., Radu, R., Rozum, I., Schepers, D., Simmons, A., Soci, C., Dee, D., and Thépaut, J.: ERA5 hourly data on single levels from 1940 to present, Climate Data Store [data set], https://doi.org/10.24381/cds.adbb2d47, 2023. a, b
International Tree Mortality Network: Towards a global understanding of tree mortality, New Phytologist, 245, 2377–2392, https://doi.org/10.1111/nph.20407, 2025. a
IPCC: Managing the Risks of Extreme Events and Disasters to Advance Climate Change Adaptation – A Special Report of Working Groups I and II of the Intergovernmental Panel on Climate Change, Cambridge University Press, ISBN 978-1-107-60780-4, https://www.ipcc.ch/report/managing-the-risks-of-extreme-events-and-disasters-to-advance-climate-change-adaptation/ (last access: 21 November 2025), 2012. a
Jagadish, S. K., Way, D. A., and Sharkey, T. D.: Plant heat stress: Concepts directing future research, Plant, Cell & Environment, 44, 1992–2005, https://doi.org/10.1111/pce.14050, 2021. a, b
Jain, P., Castellanos-Acuna, D., Coogan, S. C. P., Abatzoglou, J. T., and Flannigan, M. D.: Observed increases in extreme fire weather driven by atmospheric humidity and temperature, Nature Climate Change, 12, 63–70, https://doi.org/10.1038/s41558-021-01224-1, 2022. a
Ji, C., Fincke, T., Benson, V., Camps-Valls, G., Fernández-Torres, M.-A., Gans, F., Kraemer, G., Martinuzzi, F., Montero, D., Mora, K., Pellicer-Valero, O. J., Robin, C., Söchting, M., Weynants, M., and Mahecha, M. D.: DeepExtremeCubes: Earth system spatio-temporal data for assessing compound heatwave and drought impacts, Scientific Data, 12, 149, https://doi.org/10.1038/s41597-025-04447-5, 2025. a, b
Kornhuber, K., Coumou, D., Vogel, E., Lesk, C., Donges, J. F., Lehmann, J., and Horton, R. M.: Amplified Rossby waves enhance risk of concurrent heatwaves in major breadbasket regions, Nature Climate Change, 10, 48–53, https://doi.org/10.1038/s41558-019-0637-z, 2020. a
Łabędzki, L.: Estimation of local drought frequency in central Poland using the standardized precipitation index SPI, Irrigation and Drainage, 56, 67–77, https://doi.org/10.1002/ird.285, 2007. a
Lavaysse, C., Cammalleri, C., Dosio, A., van der Schrier, G., Toreti, A., and Vogt, J.: Towards a monitoring system of temperature extremes in Europe, Nat. Hazards Earth Syst. Sci., 18, 91–104, https://doi.org/10.5194/nhess-18-91-2018, 2018. a
Lewis, S. L., Brando, P. M., Phillips, O. L., van der Heijden, G. M. F., and Nepstad, D.: The 2010 Amazon Drought, Science, 331, 554–554, https://doi.org/10.1126/science.1200807, 2011. a, b
Li, J., Wang, Z., Wu, X., Zscheischler, J., Guo, S., and Chen, X.: A standardized index for assessing sub-monthly compound dry and hot conditions with application in China, Hydrol. Earth Syst. Sci., 25, 1587–1601, https://doi.org/10.5194/hess-25-1587-2021, 2021. a, b, c
Libonati, R., Geirinhas, J. L., Silva, P. S., Russo, A., Rodrigues, J. A., Belém, L. B. C., Nogueira, J., Roque, F. O., DaCamara, C. C., Nunes, A. M. B., Marengo, J. A., and Trigo, R. M.: Assessing the role of compound drought and heatwave events on unprecedented 2020 wildfires in the Pantanal, Environmental Research Letters, 17, 015005, https://doi.org/10.1088/1748-9326/ac462e, 2022. a
Liu, X., He, B., Guo, L., Huang, L., and Chen, D.: Similarities and Differences in the Mechanisms Causing the European Sum- mer Heatwaves in 2003, 2010, and 2018, Earth’s Future, 8, e2019EF001386, https://doi.org/10.1029/2019EF001386, 2020. a
Liu, X., Yu, S., Yang, Z., Dong, J., and Peng, J.: The first global multi-timescale daily SPEI dataset from 1982 to 2021, Scientific Data, 11, 223, https://doi.org/10.1038/s41597-024-03047-z, 2024. a, b, c, d, e, f
Lloyd-Hughes, B.: A spatio-temporal structure-based approach to drought characterisation, International Journal of Climatology, 32, 406–418, https://doi.org/10.1002/joc.2280, 2012. a, b
Mahecha, M. D., Gans, F., Sippel, S., Donges, J. F., Kaminski, T., Metzger, S., Migliavacca, M., Papale, D., Rammig, A., and Zscheischler, J.: Detecting impacts of extreme events with ecological in situ monitoring networks, Biogeosciences, 14, 4255–4277, https://doi.org/10.5194/bg-14-4255-2017, 2017. a
Mahecha, M. D., Gans, F., Brandt, G., Christiansen, R., Cornell, S. E., Fomferra, N., Kraemer, G., Peters, J., Bodesheim, P., Camps-Valls, G., Donges, J. F., Dorigo, W., Estupinan-Suarez, L. M., Gutierrez-Velez, V. H., Gutwin, M., Jung, M., Londoño, M. C., Miralles, D. G., Papastefanou, P., and Reichstein, M.: Earth system data cubes unravel global multivariate dynamics, Earth Syst. Dynam., 11, 201–234, https://doi.org/10.5194/esd-11-201-2020, 2020. a
Mahecha, M. D., Bastos, A., Bohn, F. J., Eisenhauer, N., Feilhauer, H., Hickler, T., Kalesse‐Los, H., Migliavacca, M., Otto, F. E. L., Peng, J., Sippel, S., Tegen, I., Weigelt, A., Wendisch, M., Wirth, C., Al‐Halbouni, D., Deneke, H., Doktor, D., Dunker, S., Duveiller, G., Ehrlich, A., Foth, A., García‐García, A., Guerra, C. A., Guimarães‐Steinicke, C., Hartmann, H., Henning, S., Herrmann, H., Hu, P., Ji, C., Kattenborn, T., Kolleck, N., Kretschmer, M., Kühn, I., Luttkus, M. L., Maahn, M., Mönks, M., Mora, K., Pöhlker, M., Reichstein, M., Rüger, N., Sánchez‐Parra, B., Schäfer, M., Stratmann, F., Tesche, M., Wehner, B., Wieneke, S., Winkler, A. J., Wolf, S., Zaehle, S., Zscheischler, J., and Quaas, J.: Biodiversity and Climate Extremes: Known Interactions and Research Gaps, Earth's Future, 12, e2023EF003963, https://doi.org/10.1029/2023EF003963, 2024. a
Marchin, R. M., Backes, D., Ossola, A., Leishman, M. R., Tjoelker, M. G., and Ellsworth, D. S.: Extreme heat increases stomatal conductance and drought-induced mortality risk in vulnerable plant species, Global Change Biology, 28, 1133–1146, https://doi.org/10.1111/gcb.15976, 2022. a
Marengo, J. A., Ambrizzi, T., Barreto, N., Cunha, A. P., Ramos, A. M., Skansi, M., Molina Carpio, J., and Salinas, R.: The heat wave of October 2020 in central South America, International Journal of Climatology, 42, 2281–2298, https://doi.org/10.1002/joc.7365, 2022. a
McDowell, N. G., Sapes, G., Pivovaroff, A., Adams, H. D., Allen, C. D., Anderegg, W. R. L., Arend, M., Breshears, D. D., Brodribb, T., Choat, B., Cochard, H., De Cáceres, M., De Kauwe, M. G., Grossiord, C., Hammond, W. M., Hartmann, H., Hoch, G., Kahmen, A., Klein, T., Mackay, D. S., Mantova, M., Martínez-Vilalta, J., Medlyn, B. E., Mencuccini, M., Nardini, A., Oliveira, R. S., Sala, A., Tissue, D. T., Torres-Ruiz, J. M., Trowbridge, A. M., Trugman, A. T., Wiley, E., and Xu, C.: Mechanisms of woody-plant mortality under rising drought, CO2 and vapour pressure deficit, Nature Reviews Earth & Environment, 3, 294–308, https://doi.org/10.1038/s43017-022-00272-1, 2022. a
Meque, A., Pinto, I., Maúre, G., and Beleza, A.: Understanding the variability of heatwave characteristics in southern Africa, Weather and Climate Extremes, 38, https://doi.org/10.1016/j.wace.2022.100498, 2022. a, b
Minetti, J. L., Vargas, W. M., Poblete, A. G., Acuña, L. R., and Casagrande, G.: Non-linear trends and low frequency oscillations in annual precipitation over Argentina and Chile, 1931-1999, Atmósfera, 16, 119–135, http://www.scielo.org.mx/scielo.php?script= (last access: 26 November 2025), 2003. a
Mishra, A. K. and Singh, V. P.: A review of drought concepts, Journal of Hydrology, 391, 202–216, https://doi.org/10.1016/j.jhydrol.2010.07.012, 2010. a
Montero, D., Kraemer, G., Anghelea, A., Aybar, C., Brandt, G., Camps-Valls, G., Cremer, F., Flik, I., Gans, F., Habershon, S., Ji, C., Kattenborn, T., Martínez-Ferrer, L., Martinuzzi, F., Reinhardt, M., Söchting, M., Teber, K., and Mahecha, M. D.: Earth System Data Cubes: Avenues for advancing Earth system research, Environmental Data Science, 3, e27, https://doi.org/10.1017/eds.2024.22, 2024. a
Mukherjee, S. and Mishra, A. K.: Increase in Compound Drought and Heatwaves in a Warming World, Geophysical Research Letters, 48, e2020GL090617, https://doi.org/10.1029/2020GL090617, 2021. a, b
Namias, J.: Spring and Summer 1988 Drought over the Contiguous United States–Causes and Prediction, Journal of Climate, 4, 54–65, https://doi.org/10.1175/1520-0442(1991)004<0054:SASDOT>2.0.CO;2, 1991. a
Nielsen-Gammon, J. W.: The 2011 Texas Drought, Texas Water Journal, 3, 59–95, https://doi.org/10.21423/twj.v3i1.6463, 2012. a
Niggli, L., Huggel, C., Muccione, V., Neukom, R., and Salzmann, N.: Towards improved understanding of cascading and interconnected risks from concurrent weather extremes: Analysis of historical heat and drought extreme events, PLOS Climate, 1, e0000057, https://doi.org/10.1371/journal.pclm.0000057, 2022. a
O'sullivan, O. S., Heskel, M. A., Reich, P. B., Tjoelker, M. G., Weerasinghe, L. K., Penillard, A., Zhu, L., Egerton, J. J. G., Bloomfield, K. J., Creek, D., Bahar, N. H. A., Griffin, K. L., Hurry, V., Meir, P., Turnbull, M. H., and Atkin, O. K.: Thermal limits of leaf metabolism across biomes, Global Change Biology, 23, 209–223, https://doi.org/10.1111/gcb.13477, 2017. a
Perkins, S. E.: A review on the scientific understanding of heatwaves – Their measurement, driving mechanisms, and changes at the global scale, Atmospheric Research, 164-165, 242–267, https://doi.org/10.1016/j.atmosres.2015.05.014, 2015. a
Perkins, S. E. and Alexander, L. V.: On the Measurement of Heat Waves, Journal of Climate, 26, 4500–4517, https://doi.org/10.1175/JCLI-D-12-00383.1, 2013. a, b
Perkins-Kirkpatrick, S., Barriopedro, D., Jha, R., Wang, L., Mondal, A., Libonati, R., and Kornhuber, K.: Extreme terrestrial heat in 2023, Nature Reviews Earth & Environment, 5, 244–246, https://doi.org/10.1038/s43017-024-00536-y, 2024. a
Pohl, F., Rakovec, O., Rebmann, C., Hildebrandt, A., Boeing, F., Hermanns, F., Attinger, S., Samaniego, L., and Kumar, R.: Long-term daily hydrometeorological drought indices, soil moisture, and evapotranspiration for ICOS sites, Scientific Data, 10, https://doi.org/10.1038/s41597-023-02192-1, 2023. a, b, c, d, e, f
Rao, V. B., Hada, K., and Herdies, D. L.: On the severe drought of 1993 in north-east Brazil, International Journal of Climatology, 15, 697–704, https://doi.org/10.1002/joc.3370150608, 1995. a
Raymond, C., Horton, R. M., Zscheischler, J., Martius, O., AghaKouchak, A., Balch, J., Bowen, S. G., Camargo, S. J., Hess, J., Kornhuber, K., Oppenheimer, M., Ruane, A. C., Wahl, T., and White, K.: Understanding and managing connected extreme events, Nature Climate Change, 10, 611–621, https://doi.org/10.1038/s41558-020-0790-4, 2020. a
Reichstein, M., Bahn, M., Ciais, P., Frank, D., Mahecha, M. D., Seneviratne, S. I., Zscheischler, J., Beer, C., Buchmann, N., Frank, D. C., Papale, D., Rammig, A., Smith, P., Thonicke, K., van der Velde, M., Vicca, S., Walz, A., and Wattenbach, M.: Climate extremes and the carbon cycle, Nature, 500, 287–295, https://doi.org/10.1038/nature12350,2013. a
Requena-Mesa, C., Benson, V., Reichstein, M., Runge, J., and Denzler, J.: EarthNet2021: A large-scale dataset and challenge for Earth surface forecasting as a guided video prediction task, in: 2021 IEEE/CVF Conference on Computer Vision and Pattern Recognition Workshops (CVPRW), IEEE, Nashville, TN, USA, 1132–1142, https://doi.org/10.1109/cvprw53098.2021.00124, 2021. a
Ridder, N. N., Ukkola, A. M., Pitman, A. J., and Perkins-Kirkpatrick, S. E.: Increased occurrence of high impact compound events under climate change, npj Climate and Atmospheric Science, 5, 1–8, https://doi.org/10.1038/s41612-021-00224-4, 2022. a
Rippey, B. R.: The U.S. drought of 2012, Weather and Climate Extremes, 10, 57–64, https://doi.org/10.1016/j.wace.2015.10.004, 2015. a
Rodell, M. and Li, B.: Changing intensity of hydroclimatic extreme events revealed by GRACE and GRACE-FO, Nature Water, 1, 241–248, https://doi.org/10.1038/s44221-023-00040-5, 2023. a
Rousi, E., Fink, A. H., Andersen, L. S., Becker, F. N., Beobide-Arsuaga, G., Breil, M., Cozzi, G., Heinke, J., Jach, L., Niermann, D., Petrovic, D., Richling, A., Riebold, J., Steidl, S., Suarez-Gutierrez, L., Tradowsky, J. S., Coumou, D., Düsterhus, A., Ellsäßer, F., Fragkoulidis, G.,680 Gliksman, D., Handorf, D., Haustein, K., Kornhuber, K., Kunstmann, H., Pinto, J. G., Warrach-Sagi, K., and Xoplaki, E.: The extremely hot and dry 2018 summer in central and northern Europe from a multi-faceted weather and climate perspective, Nat. Hazard. Earth Syst. Sci., 23, 1699–1718, https://doi.org/10.5194/nhess-23-1699-2023, 2023. a
Russo, E. and Domeisen, D. I. V.: Increasing Intensity of Extreme Heatwaves: The Crucial Role of Metrics, Geophysical Research Letters, 50, e2023GL103540, https://doi.org/10.1029/2023GL103540, 2023. a
Russo, S., Sillmann, J., and Fischer, E. M.: Top ten European heatwaves since 1950 and their occurrence in the coming decades, Environmental Research Letters, 10, 124003, https://doi.org/10.1088/1748-9326/10/12/124003, 2015. a
Sen, P. K.: Estimates of the Regression Coefficient Based on Kendall's Tau, Journal of the American Statistical Association, 63, 1379–1389, https://doi.org/10.1080/01621459.1968.10480934, 1968. a
Seneviratne, S., Zhang, X., Adnan, M., Badi, W., Dereczynski, C., Di Luca, A., Ghosh, S., Iskandar, I., Kossin, J., Otto, F., Pinto, I., Satoh, M., Vicente-Serrano, S. M., Wehner, M., and Zhou, B.: 2021: Weather and Climate Extreme Events in a Changing Climate, in: Climate Change 2021 – The Physical Science Basis: Working Group I Contribution to the Sixth Assessment Report of the Intergovernmental Panel on Climate Change, Cambridge University Press, 1 edn., ISBN 978-1-00-915789-6, https://doi.org/10.1017/9781009157896.013, 2023. a
Singh, H., Arora, K., Ashrit, R., and Rajagopal, E. N.: Verification of pre-monsoon temperature forecasts over India during 2016 with a focus on heatwave prediction, Natural Hazards and Earth System Sciences, 17, 1469–1485, https://doi.org/10.5194/nhess-17-1469-2017, 2017. a
Singer, M. B., Asfaw, D. T., Rosolem, R., Cuthbert, M. O., Miralles, D. G., MacLeod, D., Quichimbo, E. A., and Michaelides, K.: Hourly potential evapotranspiration at 0.1° resolution for the global land surface from 1981–present, Scientific Data, 8, 224, https://doi.org/10.1038/s41597-021-01003-9, 2021. a
Sippel, S., Reichstein, M., Ma, X., Mahecha, M. D., Lange, H., Flach, M., and Frank, D.: Drought, Heat, and the Carbon Cycle: a Review, Current Climate Change Reports, 4, 266–286, https://doi.org/10.1007/s40641-018-0103-4, 2018. a
Thirumalai, K., DiNezio, P. N., Okumura, Y., and Deser, C.: Extreme temperatures in Southeast Asia caused by El Niño and worsened by global warming, Nature Communications, 8, 15531, https://doi.org/10.1038/ncomms15531, 2017. a
Trancoso, R., Syktus, J., Allan, R. P., Croke, J., Hoegh-Guldberg, O., and Chadwick, R.: Significantly wetter or drier future conditions for one to two thirds of the world’s population, Nature Communications, 15, 483, https://doi.org/10.1038/s41467-023-44513-3, 2024. a
Tripathy, K. P. and Mishra, A. K.: How Unusual Is the 2022 European Compound Drought and Heatwave Event?, Geophysical Research Letters, 50, e2023GL105 453, https://doi.org/10.1029/2023GL105453, 2023. a, b
Tucker, C. J., Justice, C. O., and Prince, S. D.: Monitoring the grasslands of the Sahel 1984-1985, International Journal of Remote Sensing, 7, 1571–1581, https://doi.org/10.1080/01431168608948954, 1986. a
Vicedo-Cabrera, A. M., Scovronick, N., Sera, F., Royé, D., Schneider, R., Tobias, A., Astrom, C., Guo, Y., Honda, Y., Hondula, D. M., Abrutzky, R., Tong, S., Coelho, M. d. S. Z. S., Saldiva, P. H. N., Lavigne, E., Correa, P. M., Ortega, N. V., Kan, H., Osorio, S., Kyselý, J., Urban, A., Orru, H., Indermitte, E., Jaakkola, J. J. K., Ryti, N., Pascal, M., Schneider, A., Katsouyanni, K., Samoli, E., Mayvaneh, F., Entezari, A., Goodman, P., Zeka, A., Michelozzi, P., de’Donato, F., Hashizume, M., Alahmad, B., Diaz, M. H., Valencia, C. D. L. C., Overcenco, A., Houthuijs, D., Ameling, C., Rao, S., Di Ruscio, F., Carrasco-Escobar, G., Seposo, X., Silva, S., Madureira, J., Holobaca, I. H., Fratianni, S., Acquaotta, F., Kim, H., Lee, W., Iniguez, C., Forsberg, B., Ragettli, M. S., Guo, Y. L. L., Chen, B. Y., Li, S., Armstrong, B., Aleman, A., Zanobetti, A., Schwartz, J., Dang, T. N., Dung, D. V., Gillett, N., Haines, A., Mengel, M., Huber, V., and Gasparrini, A.: The burden of heat-related mortality attributable to recent human-induced climate change, Nature Climate Change, 11, 492–500, https://doi.org/10.1038/s41558-021-01058-x, 2021. a
Vicente-Serrano, S. M., Beguería, S., and López-Moreno, J. I.: A Multiscalar Drought Index Sensitive to Global Warming: The Standardized Precipitation Evapotranspiration Index, Journal of Climate, 23, 1696–1718, https://doi.org/10.1175/2009JCLI2909.1, 2010. a, b
Walter, I. A., Allen, R. G., Elliott, R., Jensen, M. E., Itenfisu, D., Mecham, B., Howell, T. A., Snyder, R., Brown, P., Echings, S., Spofford, T., Hattendorf, M., Cuenca, R. H., Wright, J. L., and Martin, D.: ASCE's Standardized Reference Evapotranspiration Equation, in: Watershed Management and Operations Management 2000, American Society of Civil Engineers, Fort Collins, Colorado, United States, 11 pp., ISBN 978-0-7844-0499-7, https://doi.org/10.1061/40499(2000)126, 2001. a
Wang, Q., Zeng, J., Qi, J., Zhang, X., Zeng, Y., Shui, W., Xu, Z., Zhang, R., Wu, X., and Cong, J.: A multi-scale daily SPEI dataset for drought characterization at observation stations over mainland China from 1961 to 2018, Earth Syst. Sci. Data, 13, 331–341, https://doi.org/10.5194/essd-13-331-2021, 2021. a
Weynants, M., Linscheid, N., and Gans, F.: DeepExtremes/ExtremeEvents: v4.0.1, Zenodo [code], https://doi.org/10.5281/zenodo.13711288, 2025a. a
Weynants, M., Linscheid, N., and Gans, F.: Dheed : a global database of dry and hot extreme events v4.0, Zenodo [data set], https://doi.org/10.5281/zenodo.11044871, 2025b. a, b, c
White, R. H., Anderson, S., Booth, J. F., Braich, G., Draeger, C., Fei, C., Harley, C. D. G., Henderson, S. B., Jakob, M., Lau, C.-A., Mareshet Admasu, L., Narinesingh, V., Rodell, C., Roocroft, E., Weinberger, K. R., and West, G.: The unprecedented Pacific Northwest heatwave of June 2021, Nature Communications, 14, 727, https://doi.org/10.1038/s41467-023-36289-3, 2023. a
Wu, X., Hao, Z., Hao, F., Singh, V. P., and Zhang, X.: Dry-hot magnitude index: a joint indicator for compound event analysis, Environmental Research Letters, 14, 064017, https://doi.org/10.1088/1748-9326/ab1ec7, 2019. a
Xu, P., Wang, L., Liu, Y., Chen, W., and Huang, P.: The record-breaking heat wave of June 2019 in Central Europe, Atmospheric Science Letters, 21, e964, https://doi.org/10.1002/asl.964, 2020. a
Yang, H., Ciais, P., Wigneron, J.-P., Chave, J., Cartus, O., Chen, X., Fan, L., Green, J. K., Huang, Y., Joetzjer, E., Kay, H., Makowski, D., Maignan, F., Santoro, M., Tao, S., Liu, L., and Yao, Y.: Climatic and biotic factors influencing regional declines and recovery of tropical forest biomass from the 2015/16 El Niño, Proceedings of the National Academy of Sciences, 119, e2101388119, https://doi.org/10.1073/pnas.2101388119, 2022. a
Yang, H., Munson, S. M., Huntingford, C., Carvalhais, N., Knapp, A. K., Li, X., Peñuelas, J., Zscheischler, J., and Chen, A.: The detection and attribution of extreme reductions in vegetation growth across the global land surface, Global Change Biology, 29, 2351–2362, https://doi.org/10.1111/gcb.16595, 2023. a
Yin, C., Ting, M., Kornhuber, K., Horton, R. M., Yang, Y., and Jiang, Y.: CETD, a global compound events detection and visualisation toolbox and dataset, Scientific Data, 12, 356, https://doi.org/10.1038/s41597-025-04530-x, 2025. a
Zampieri, M., Ashok, K., Toreti, A., Bavera, D., and Hoteit, I.: On the Stationarity of the Global Spatial Dependency of Heat Risk on Drought, Geophysical Research Letters, 51, e2024GL111117, https://doi.org/10.1029/2024GL111117, 2024. a, b
Zhang, B., Wang, S., and Slater, L.: Anthropogenic climate change doubled the frequency of compound drought and heatwaves in low-income regions, Communications Earth & Environment, 5, 1–8, https://doi.org/10.1038/s43247-024-01894-7, 2024. a
Zscheischler, J., Mahecha, M. D., Harmeling, S., and Reichstein, M.: Detection and attribution of large spatiotemporal extreme events in Earth observation data, Ecological Informatics, 15, 66–73, https://doi.org/10.1016/j.ecoinf.2013.03.004, 2013. a, b
Zscheischler, J., Martius, O., Westra, S., Bevacqua, E., Raymond, C., Horton, R. M., Van Den Hurk, B., AghaKouchak, A., Jézéquel, A., Mahecha, M. D., Maraun, D., Ramos, A. M., Ridder, N. N., Thiery, W., and Vignotto, E.: A typology of compound weather and climate events, Nature Reviews Earth & Environment, 1, 333–347, https://doi.org/10.1038/s43017-020-0060-z, 2020. a
Monthly Weather Review – Australia – January 2019 (http://www.bom.gov.au/climate/mwr/aus/mwr-aus-201901.pdf, last access: 12 March 2025)
Monthly Weather Review – Australia – November 2019 (http://www.bom.gov.au/climate/mwr/aus/mwr-aus-201911.pdf, last access: 12 March 2025)
Monthly Weather Review – Australia – December 2019 (http://www.bom.gov.au/climate/mwr/aus/mwr-aus-201912.pdf, last access: 12 March 2025)
- Abstract
- Introduction
- Data and methods
- Results
- Discussion and outlook
- Code and data availability
- Conclusions
- Appendix A: Comparison of PEI and SPEI for non-deseasonalised daily time series
- Appendix B: Supplementary table
- Appendix C: Time series from Dheed
- Appendix D: Validation of PEI against daily SPEI
- Author contributions
- Competing interests
- Disclaimer
- Acknowledgements
- Financial support
- Review statement
- References