the Creative Commons Attribution 4.0 License.
the Creative Commons Attribution 4.0 License.
 | 18 Nov 2025
Radon-222 monitoring at German ICOS atmosphere stations
Maksym Gachkivskyi
Ute Karstens
Bernd Fischer
Dagmar Kubistin
Jennifer Müller-Williams
Matthias Lindauer
Ingeborg Levin
Atmospheric measurements of the short-lived radioactive noble gas radon-222 (222Rn) have many applications. Its concentrations are driven by atmospheric mixing as well as seasonal variations, which follow the seasonality of 222Rn exhalation from continental soils, with lower values during the wet winter and spring months compared to more dry summer conditions. Hence, it can be used as a tracer to distinguish marine from continental air masses or for transport model validation. The Heidelberg Radon Monitor (HRM) is a static filter detector measuring atmospheric 214polonium (214Po), which is a progeny of 222Rn. These measurements can be used to infer atmospheric 222Rn activity concentrations if the radioactive disequilibrium between 214Po and 222Rn at the measurement site is known. In this study, 214Po activity concentrations measured with the HRM at eight stations in the Integrated Carbon Observation System (ICOS) Germany network are presented, along with guidelines for evaluating these data to estimate atmospheric 222Rn activity concentrations. In addition to the established line loss and disequilibrium corrections applied when sampling through long tubing or from air intake heights close to the ground, respectively, an upper limit for relative humidity (RH) is suggested, where secular equilibrium can still be assumed. At higher RH, aerosol scavenging effects can cause disequilibrium between 214Po and 222Rn. Using comparison with the model this threshold is determined to be at about 98 % RH and was applied uniformly at all measurement sites. A clear diurnal cycle of 222Rn is observed at all German tower stations during the summer and autumn months as is a seasonal cycle with a maximum during summer and autumn months. Overall, our results demonstrate that the 214Po-based 222Rn measurements with the HRM are reliable if the equilibrium conditions between 214Po and 222Rn can be ensured, i.e., for air intake heights above 80–90 during conditions with RH<98 %. The corrected and ready-to-use dataset of 10-year radon activity concentrations from the eight ICOS stations is published alongside this paper (https://doi.org/10.18160/Q2M8-B1HJ, Fischer et al., 2024).
- Article
(9317 KB) - Full-text XML
- BibTeX
- EndNote


Radon-222 (222Rn) is a short-lived radioactive noble gas (half-life d), and it is a progeny of radium-226 (226Ra), which is a member of the primordial uranium-238 decay series. It is naturally produced in all soils, and as a gas it can escape from the soil air into the atmosphere. The exhalation rate of 222Rn from continental surfaces depends on the soil properties, such as grain size distribution, porosity, and 226Ra content, and it varies with soil moisture and other meteorological parameters (e.g., Nazaroff, 1992; Karstens et al., 2015). The 222Rn flux from (ocean) water surfaces is negligible (Schery and Huang, 2004) compared to that from continental surfaces. Therefore, 222Rn can serve as tracer to distinguish continental from marine air masses (e.g., Dörr et al., 1983; Polian, 1986; Biraud, 2000). While the half-life of radon is short relative to synoptic timescales (approximately 4–12 d), preventing it from accumulating in the atmosphere over longer timescales, it is long compared to mixing timescales in the atmospheric boundary layer (1 h), allowing it to act as a quasi-conservative tracer for studying boundary layer mixing and transport processes. These properties make 222Rn a suitable tracer for atmospheric boundary layer mixing or transport model validation studies (e.g., Jacob and Prather, 1990; Jacob et al., 1997; Taguchi et al., 2011; Williams et al., 2011) and even for estimation of regional fluxes of other soil-borne trace gases by applying the radon tracer method (e.g., Levin, 1987; Levin et al., 1999, 2021; Grossi et al., 2018), assuming that the spatial and temporal distribution of the 222Rn exhalation rate from continental surfaces is known.
Owing to its applicability as an atmospheric transport tracer, 222Rn observations are recommended as a supplementary measurement component at all ICOS atmosphere stations (ICOS RI, 2020). For precise atmospheric 222Rn observations three fundamentally different measurement principles are available: (1) a two-filter dual-flow-loop detector developed by ANSTO, Australia (Whittlestone and Zahorowski, 1998; Chambers et al., 2011), (2) an electrostatic deposition monitor developed by INTE-UPC, Spain (Grossi et al., 2016), both measuring 222Rn directly, and (3) static or moving filter detectors, which accumulate 222Rn progeny on a filter and calculate the atmospheric 222Rn activity concentration based on assumptions about the secular equilibrium between 222Rn and its progeny in the atmosphere (e.g., Stockburger and Sittkus, 1966; Polian, 1986; Paatero et al., 1998; Biraud, 2000; Levin et al., 2002; Schmithüsen et al., 2017). This latter 222Rn measurement principle is applied in the static filter system of the Heidelberg Radon Monitor (HRM, Levin et al., 2002), which measures the atmospheric 222Rn progeny 214Po at German ICOS atmosphere stations and also at sites outside of Germany, including Neumayer station at the Antarctic coast (Weller et al., 2014) and the Amazon Tall Tower Observatory in Brazil (ATTO, Levin et al., 2025).
While the static filter HRM is a compact and easy to handle instrument, it has some important caveats, which arise from the fact that 222Rn progeny and not 222Rn itself is measured. In the atmosphere, newly formed 222Rn progeny, such as 214Po, is attached to aerosols and thus potentially affected by dry or wet deposition processes as well as loss in intake lines if sampling is conducted through long tubing (Levin et al., 2017). Moreover, the state of radioactive equilibrium between progeny and soil-borne 222Rn in the atmosphere depends on the state of atmospheric stability and height above ground (Jacobi and Andre, 1963). There may also be some delay in reaching secular radioactive equilibrium of its progeny after rapid increases in the 222Rn activity concentration. In the past, careful comparison measurements were conducted to evaluate the height dependence of the disequilibrium (Schmithüsen et al., 2017; Grossi et al., 2020), which turned out to be negligible for measurement heights above ca. 80 An empirical correction function to compensate for progeny loss in standard 8 mm inner diameter Decabon tubing was determined by extensive laboratory experiments (Levin et al., 2017) and was applied, e.g., for the HRM progeny measurements at the German ICOS atmosphere stations to estimate 222Rn activity concentrations from the measured 214Po data. A remaining uncertainty is the potential progeny loss due to aerosol scavenging and subsequent wet deposition at very high ambient air humidity, which has not been investigated in detail yet.
In this paper we present the atmospheric activity concentration data from German ICOS stations spanning 11 years, from 2014 to 2024, and evaluate these data with respect to potential aerosol scavenging effects, depending on ambient air humidity. Such effects are most frequent at sites where the air intake can reach into clouds, i.e., when a tall tower is located on the top of a mountain or hill. We have therefore developed a relative humidity (RH) flagging threshold for the HRM that is to be applied to all stations based on re-evaluation of earlier comparison campaign data as well as preliminary regional transport model estimations of the atmospheric 222Rn activity concentration for the individual sites. The 222Rn data published along with this paper are flagged according to these thresholds.
2.1 Radon progeny observations at German ICOS atmosphere stations
Radon progeny observations with the Heidelberg Radon Monitor (HRM) are conducted at eight ICOS atmosphere stations in Germany. All these ICOS atmosphere stations are operated and managed by the Meteorological Observatory Hohenpeißenberg of the German Meteorological Service (DWD), except for the station Schauinsland (SSL), which is run by the German Environment Agency (Umweltbundesamt, UBA). The stations are listed in Table 1 together with their coordinates and intake heights. A map of Germany (Fig. 1) shows their almost even distribution across the country. Except for Schauinsland, a mountain station in the Black Forest (1205 ), where the air intake is about 12 m above ground level (a.g.l.), all other 222Rn progeny measurements are conducted at towers from intake heights between 93–132 . The Torfhaus and Hohenpeißenberg towers are located on top of moderately high hills in the Harz (Torfhaus, 801 ) and in the pre-alpine region of southern Germany (Hohenpeißenberg, 934 ). All other stations are located in flat terrain at altitudes above sea level (a.s.l.) between 29–110 m. Detailed information about all (German) ICOS stations is available at the ICOS Carbon Portal (https://www.icos-cp.eu/observations/atmosphere/stations, last access: 10 September 2025).
Table 1Parameters and locations of German ICOS stations with 214Po measurements.
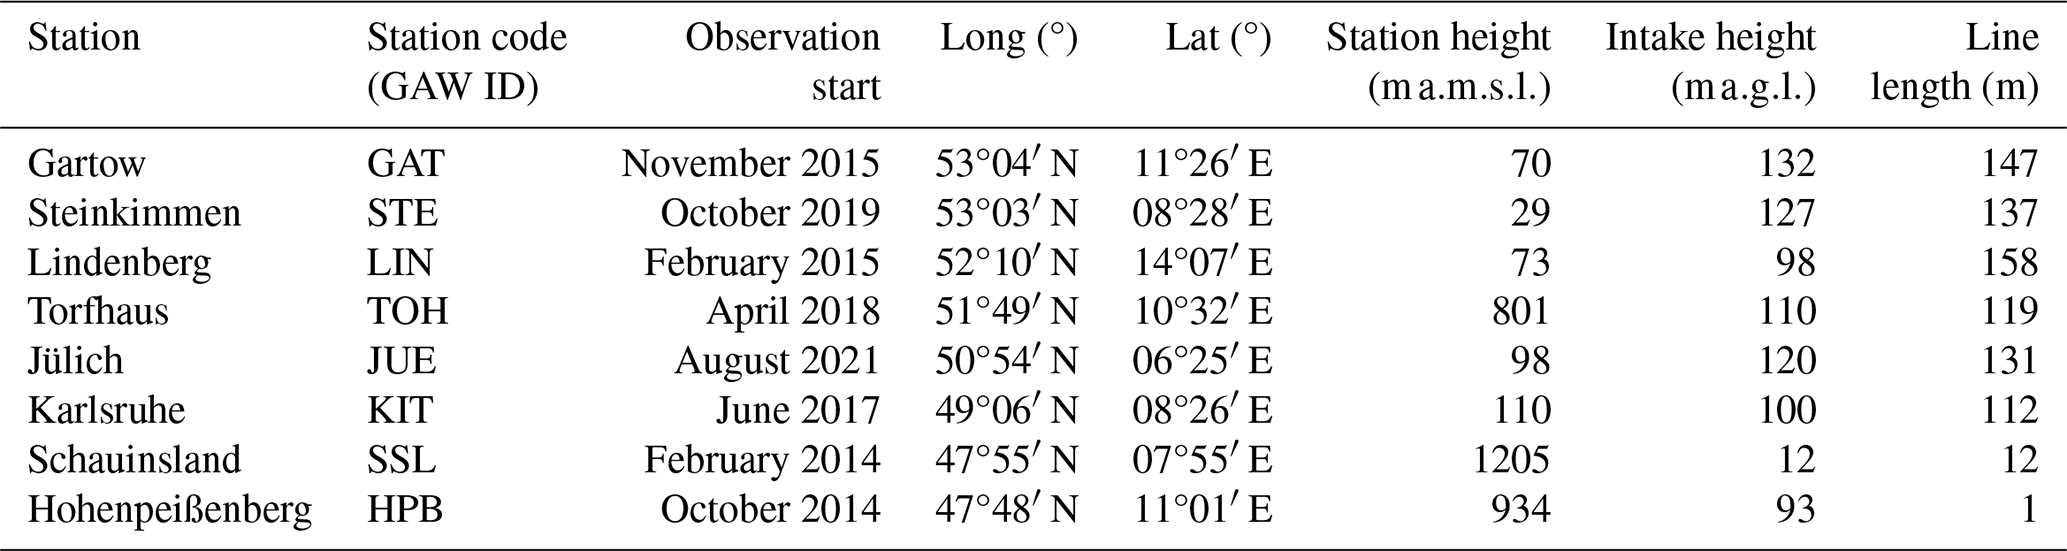
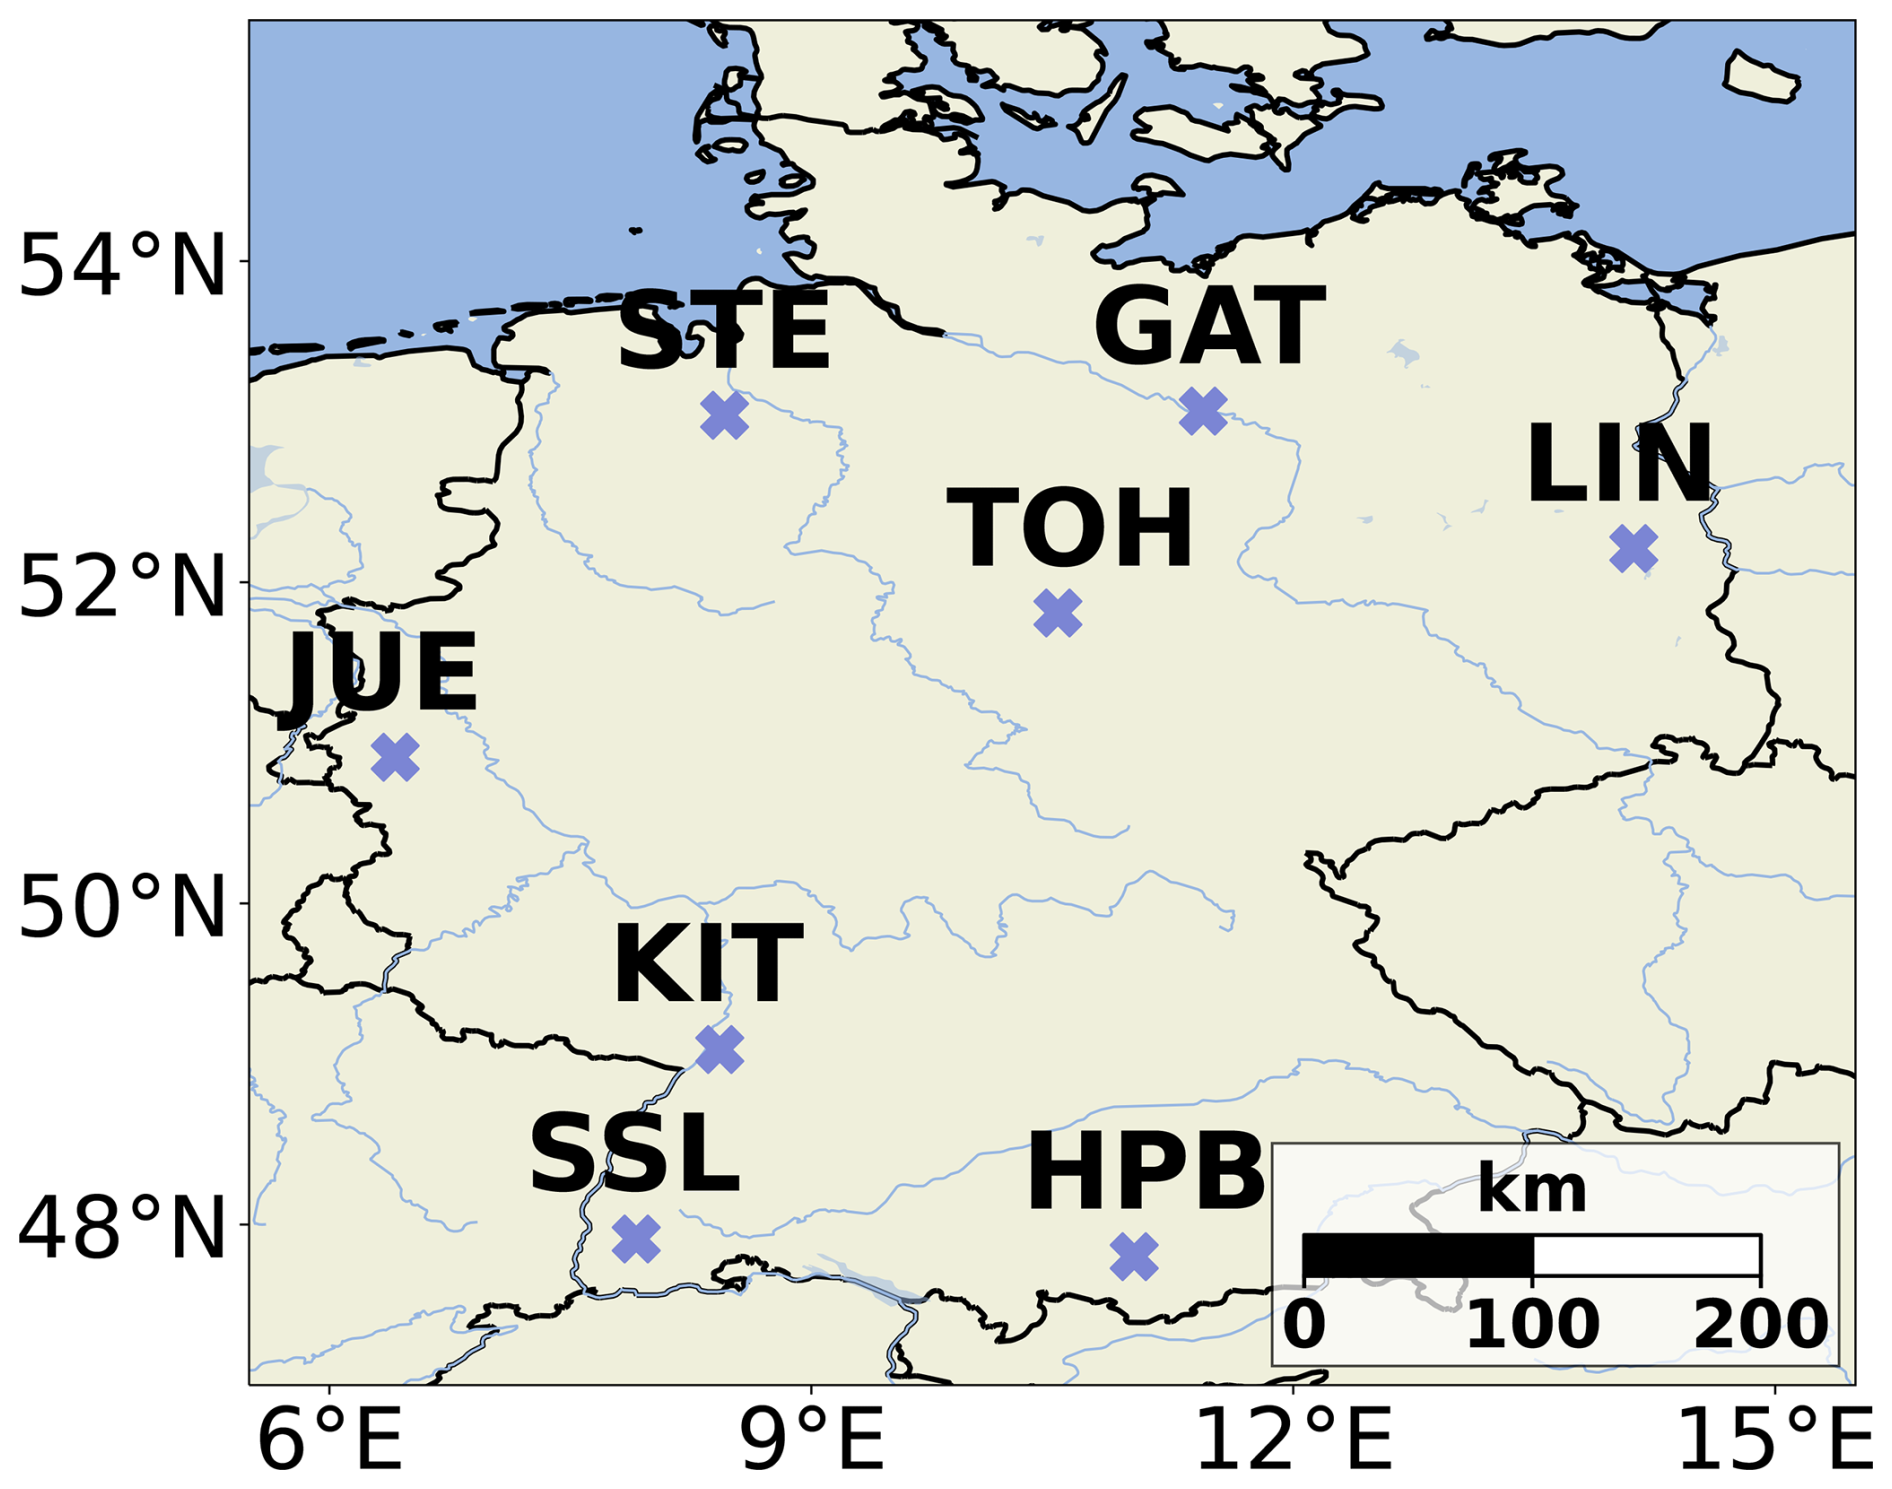
Figure 1Radon measurements in Germany are conducted with the HRM at eight ICOS atmosphere stations. All stations except for SSL are tall towers operated by DWD (radon intake heights between 93–132 ). SSL has its air intake at 12 and is operated by the German Environment Agency.
2.2 Measurement principle and correction for aerosol loss in tubing
The HRM accumulates ambient 222Rn progenies on a static filter and measures their alpha decay in situ with a surface barrier detector. Half-hourly alpha spectra are integrated and evaluated to separate the 214Po activity on the filter from other progeny counts, including those of the short-lived radon isotope radon-220. The methodology and automated algorithm to evaluate the spectra are described in detail by Levin et al. (2002) and Gachkivskyi and Levin (2022). The ambient 214Po activity concentration is then determined from its activity on the filter by considering the filter-detector geometry, the filter efficiency, and the mass flow of air through the filter using the so-called Stockburger algorithm (Stockburger, 1960; Stockburger and Sittkus, 1966). The HRM detection limit of the current generation of monitors is 0.07 Bq m−3 (Grossi et al., 2020), with the detection limit being defined as the ambient radon concentration resulting in a counting error of 30 %. Subsequently, a correction of progeny loss in the intake tubing (Decabon, 8 mm inner diameter), which can be up to 158 m long (Table 1), is then applied following Levin et al. (2017). The length-dependent loss of progeny is approximated by an exponential function,
with L being the length of the tubing and L0 a constant that was experimentally determined in the laboratory. For a given length of tubing, progeny loss was further observed to be dependent on ambient activity concentration. This could be approximated with a saturation curve as follows:
where the experimentally determined empirical parameters A and c0 are constants, and R(L) is calculated from Eq. (1) for line length L. The constants in Eqs. (1) and (2) have been reported by Levin et al. (2017) as L0=415 m, A=0.41, and c0=0.92 Bq m−3. The line loss correction was applied to all stations with air intake lines longer than 15 m, which represents the shortest tested line length for aerosol loss (Levin et al., 2017). No aerosol loss due to the tubing is assumed for lines shorter than 15 m.
2.3 Calibration and disequilibrium
In a theoretical evaluation, Jacobi and Andre (1963) estimated the height dependence of the disequilibrium between 214Po and 222Rn. This disequilibrium depends on atmospheric stability and decreases with height, approaching equilibrium at levels of about 100 In an international comparison experiment of the HRM measuring 214Po with direct 222Rn measurement using an 1500L ANSTO monitor, Schmithüsen et al. (2017) showed that equilibrium between 222Rn and 214Po measurements in ambient air is usually reached at intake heights exceeding 60 However, they found a calibration difference between the two systems of about 10 %. A similar result with a slightly smaller difference between monitors was obtained in a comparison campaign conducted in 2017 at the ICOS station Saclay, France, where parallel measurements at the 100 m intake height were conducted (Grossi et al., 2020). At the time of the comparison campaigns, there was no traceable method of calibrating the ANSTO monitor's absolute measurements, as is now the case since the 19ENV01 traceRadon project (Röttger et al., 2021), which could be accomplished with calibration transfer standard devices (Chambers et al., 2022; Röttger et al., 2025). The absence of this calibration could lead to the 4 %–8 % uncertainties in the absolute values (Chambers et al., 2022; Kikaj et al., 2024). This may be a contributing factor to the discrepancies in the two measurement systems. However, the relative concentration changes measured with the 1500L ANSTO have been shown to be reliable (Chambers et al., 2022). For this reason, we did not apply any scaling factors to our HRM measurements, e.g., to adjust them to the ANSTO scale. Instead, we run each HRM in parallel to our routine monitor in Heidelberg for a few weeks and determine an internal calibration factor that is applied to have comparable measurements within the HRM network. We also did not correct for disequilibrium any of the HRM data from ICOS tower stations with intake heights >90 , assuming that the atmospheric 222Rn activity concentration is equal to that of the measured 214Po activity concentration. For the Schauinsland data, we applied a factor of to the 214Po measurements to estimate ambient 222Rn activity concentrations. This factor corresponds to that reported by Schmithüsen et al. (2017, Table 2).
For the Saclay 2017 comparison campaign, Grossi et al. (2020) showed that the ratio of HRM-measured 214Po and 222Rn measured with the ARMON monitor from Universitat Politècnica de Catalunya (UPC) decreased at relative humidity (RH) values close to 100 %. We have re-evaluated the data from this campaign, also correcting the 222Rn measurements from the ANSTO detector for standard temperature and pressure (STP, T=293.15 K, P=1000 hPa), to make them comparable with the HRM measurements. These re-evaluated HRM and ANSTO data are displayed in Fig. 2a together with the RH measured during that period. The relation between HRM 214Po and ANSTO 222Rn data is displayed in panel (c). Here we selected the HRM data by distinguishing all hourly values by using co-measured RH data. The pink dots in panel (c) with RH>98 % clearly deviate from the regression line, with the values from the HRM being lower than the data from ANSTO. This would be consistent with the 214Po aerosols being scavenged during the high-RH events. Panel (b) shows the Pearson correlation coefficient between the two datasets dependent on the data selection by RH threshold. This means that data measured at a lower RH than the threshold are included in the fit calculation. We use the correlation coefficient as the relevant parameter to be investigated because, as discussed in the previous paragraph, there may be other reasons for discrepancies in absolute concentrations between the two measurement systems, such as uncertainties in calibration or instrumental issues that cause systematic biases. A correlation provides a useful tool for examining the relative differences between datasets. A small decrease in the correlation coefficient is observed from 90 % to 99 % RH, followed by a steep decrease towards 100 % RH. Therefore, for this comparison campaign, a relative humidity threshold of 98 % would be set to determine a potential “calibration factor” between the two instruments accounting for uncertainty of RH data and ensure the compatibility of the data. Excluding data measured at RH>98 %, we obtain excellent agreement of almost 1:1 (0.97±0.01) with no significant offset between the HRM and the ANSTO measurements.
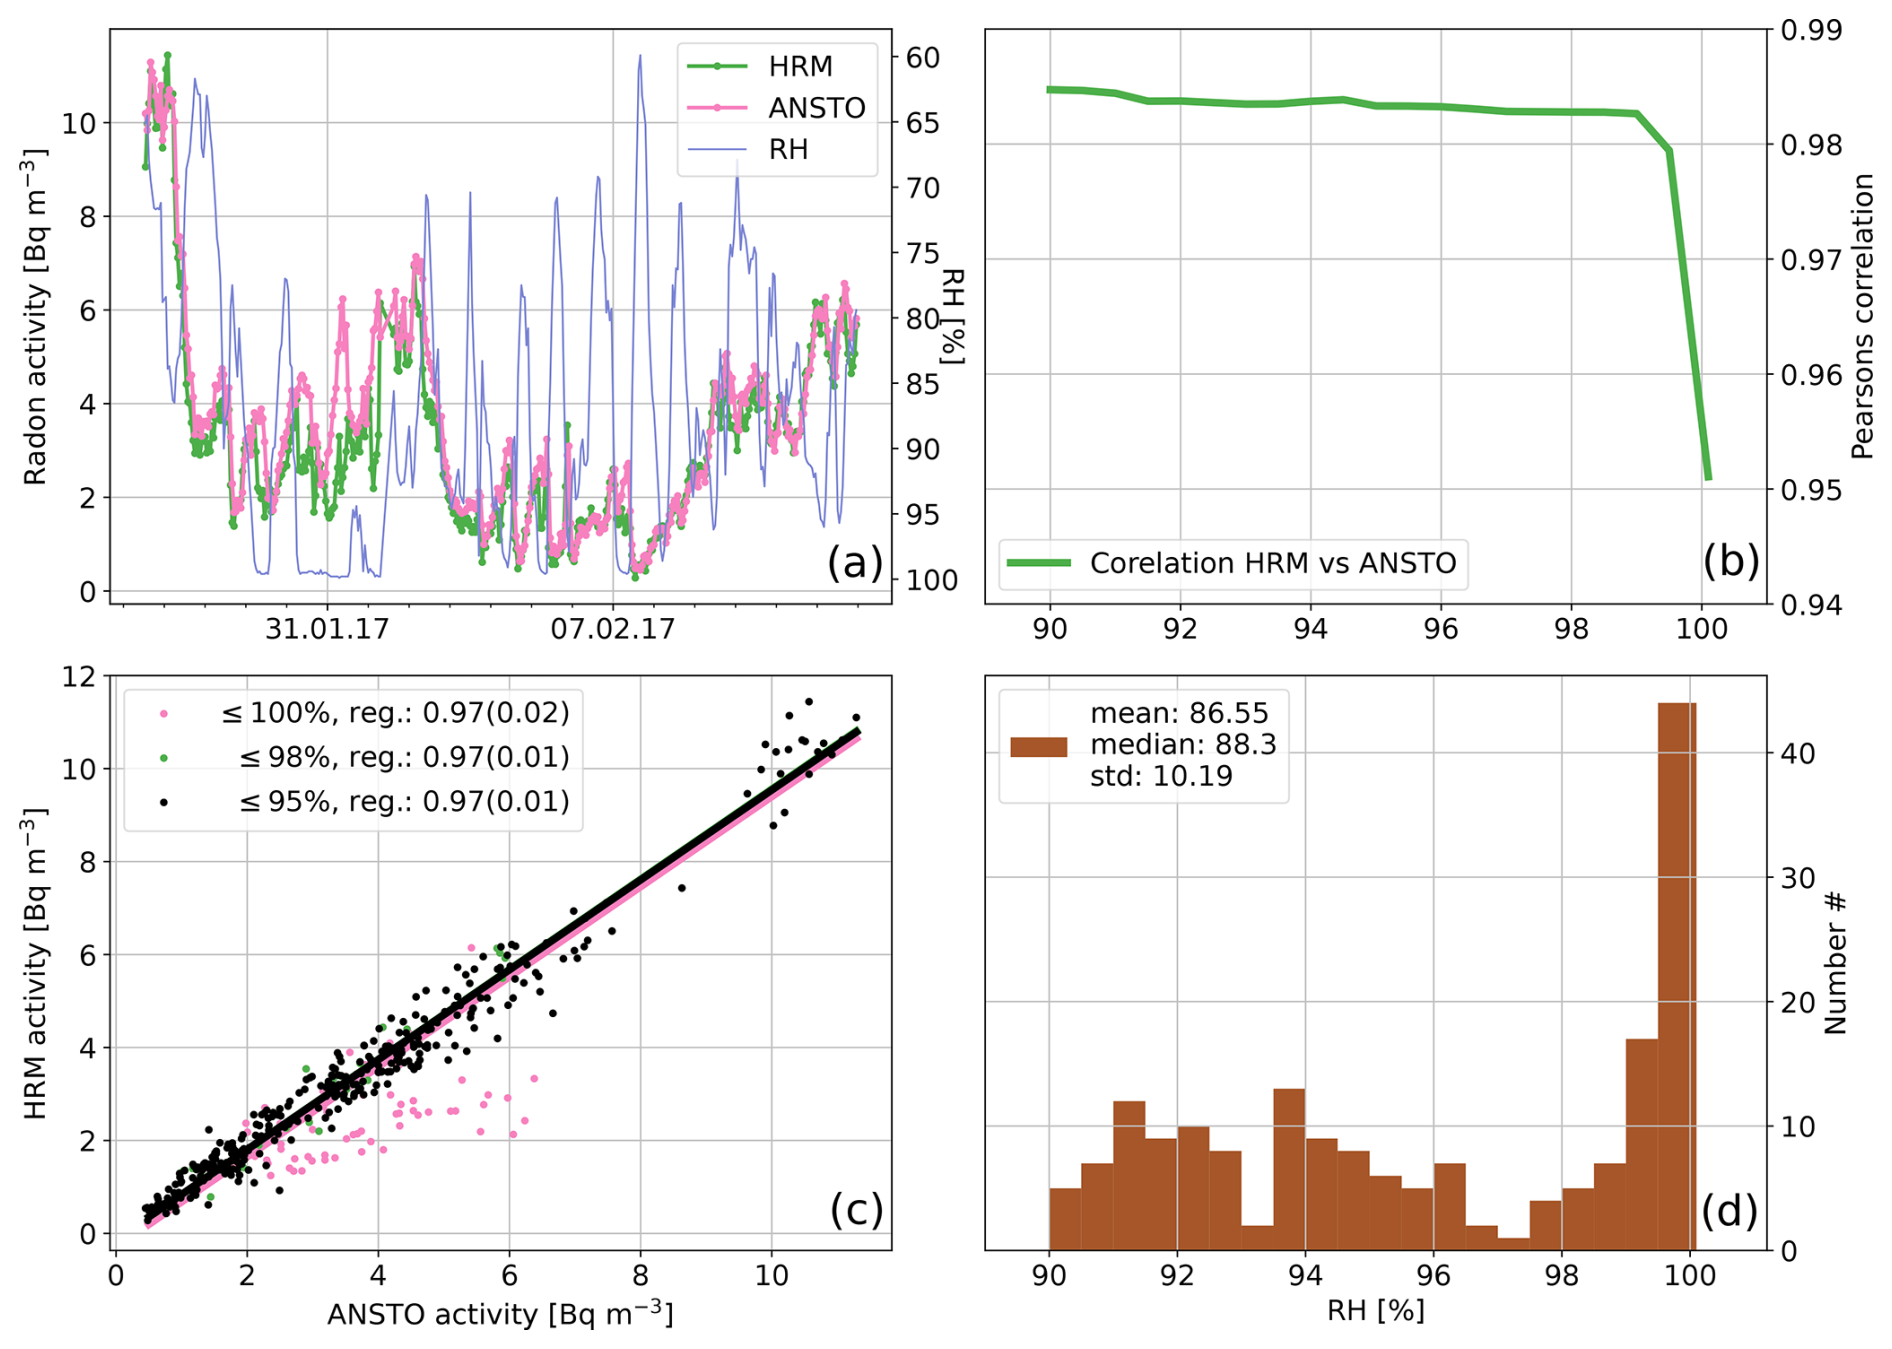
Figure 2Activity concentration measured with the ANSTO monitor and with the HRM during the 2017 comparison campaign at the Saclay tower at the 100 m level. Panel (a) shows the original records together with relative humidity – the frequency distribution of RH is shown in (d). Panel (c) displays the regression lines between the two datasets, with some data being excluded depending on the co-measured RH values. The data are obtained at RH less than or equal to 95 %, and the additions to this set with RH less than or equal to 98 % are highlighted in green. Data measured at RH>98 % up to 100 % are marked in pink. The data with RH>98 % (in pink) clearly fall off the regression line. Panel (b) shows the development of the Pearson correlation coefficient when successively more data measured at higher RH are included in the correlation calculation.
2.4 Humidity threshold for the German network
No direct 222Rn observations are available to determine a relative humidity threshold for the German stations with HRM progeny measurements, as was done for the Saclay 2017 campaign (Sect. 2.3). Therefore, we used a threshold based on the comparison with atmospheric transport model calculations of 222Rn. We used the Stochastic Time-Inverted Lagrangian Transport model (STILT) (Lin et al., 2003) that was implemented at the ICOS Carbon Portal (https://www.icos-cp.eu/about-stilt, last access: 10 September 2025) to calculate footprints and atmospheric 222Rn activity concentrations for all ICOS stations. The radon flux estimates for Europe of Karstens and Levin (2023), providing daily mean 222Rn fluxes for the years 2017–2023, were used to calculate hourly 222Rn activity concentrations. We then calculated month-wise correlation coefficients between observed 214Po and modeled 222Rn activity concentrations by successively adding data at increasing observed RH (Kohler et al., 2018; Kubistin et al., 2024a, b, c, d, e, f, g; Schmidt et al., 2024; UBA, 2024; Deutscher Wetterdienst, 2025), similar to the method used for the Saclay 2017 comparison campaign data (Fig. 2b and d). For this, meteorological data were aggregated to half-hourly values if the measurement frequency was higher than that of 222Rn or interpolated from hourly values. Note that this comparison between measured 214Po and simulated 222Rn activity concentrations was conducted only to diagnose thresholds for potential 214Po loss at the individual stations. Quantitative evaluations, e.g., of the absolute agreement between model simulations and observations, were not the target of this comparison, as we are aware that the 222Rn flux map and transport in the STILT model have significant uncertainties. We also do not expect good correlations and curves as smooth as those obtained from the comparison of the two measured records at Saclay (Fig. 2b). Nevertheless, we assume that a significant and abrupt decrease in the correlation coefficient at high RH should also become visible as a consequence of loss of 214Po. This could then be used to pinpoint a threshold of maximum RH at which the radioactive equilibrium of 222Rn and its progeny 214Po is still valid.
Figure 3 shows typical examples of correlation coefficients between modeled 222Rn and measured 214Po (panels a and e) together with RH distributions at three out of eight stations in the German ICOS network for those hourly situations where 214Po measurements are available. Note that for the mountain stations Schauinsland (SSL, panels d and h), Torfhaus, and Hohenpeißenberg (TOH and HPB, Figs. A1–A12 in the Appendix), we did not use STILT results for the actual tower heights (see Table 1) but for higher elevations of 300 m (TOH, HPB) and 230 m (SSL), as for these virtual heights model results show better agreement with the observations (Geels et al., 2007; Oney et al., 2015; Kountouris et al., 2018). Figure 3b–d show the data from April 2024, a month with a relatively high frequency of RH>95 % at the mountain station of SSL and very few RH values above 90 % at the tower stations in flat terrain. The majority of the RH measurements in this month are centered around 60 % RH or even lower. All stations show a correlation between measured and modeled data higher than 0.6 if enough data are provided. This could be explained by the fact that for the relatively dry conditions the 214Po concentrations represent the 222Rn values quite well. But it can also be clearly seen that at SSL the correlation coefficient steeply decreases from about 0.65 to about 0.51 if values with RH>98 % are included in the calculation and if the number of these high-RH situations becomes significant. The KIT and LIN stations remain largely unchanged in this regard.
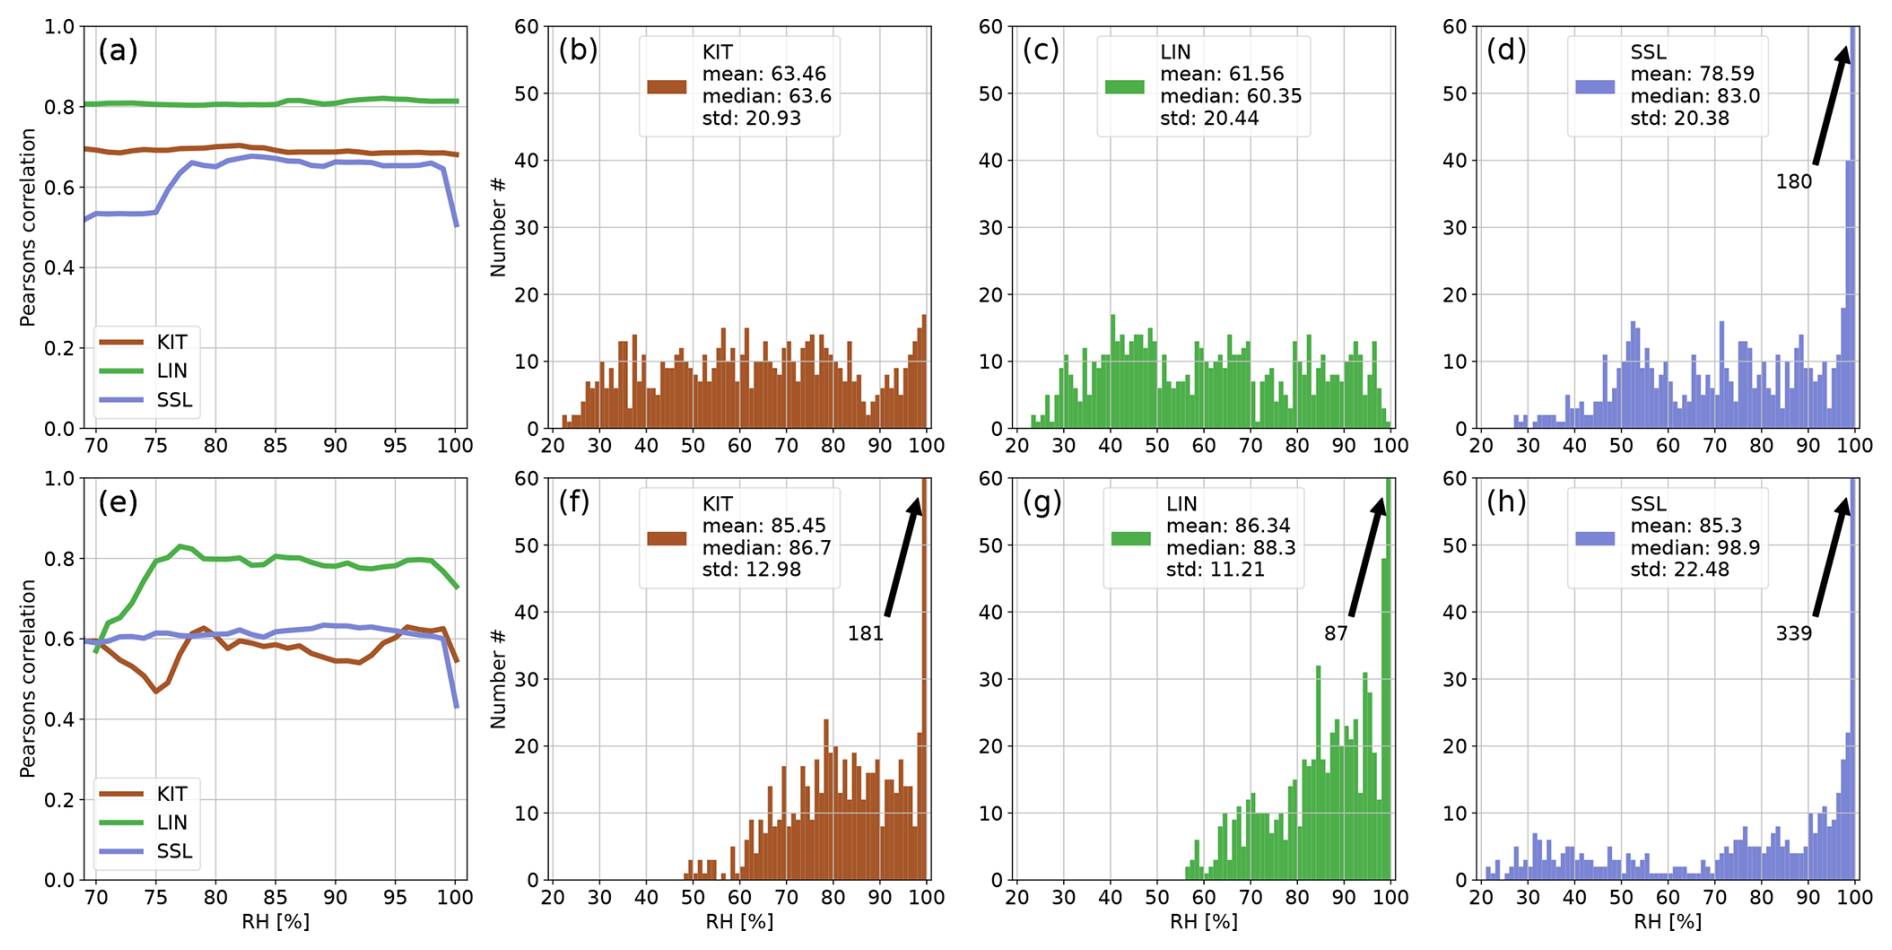
Figure 3Panels (a) and (e) show the development of the correlation coefficient between 214Po observations and simulated 222Rn data at three German ICOS stations (KIT, LIN, SSL) for April and for November 2022, respectively, if data with increasing RH are successively included in the calculation of the correlation. Panels (b–d) and (f–h) show the RH distributions for April and November, respectively, at these stations that were included in the calculations. The arrows with numbers indicate values that exceed the y-axis range (usually for high RH). For each station the correlation coefficient was calculated only if the number of filtered data points was higher than 10 % of all values for the given month to avoid the stochastic behavior of the curves in (a) and (e) associated with small datasets.
In Fig. 3f–h the corresponding data from November 2022 are shown. In this month RH close to saturation is observed at all stations. However, it is only at very high RH>98 % that the correlation coefficient also decreases at the tower stations in flat terrain. Overall, there is a tendency towards higher correlation coefficients between the model and observations at the stations located in flat terrain (GAT, STE, KIT, JUE, and LIN) compared to the mountain sites (TOH, SSL, HPB). This is because trace gas concentrations at mountain stations, due to their complex topography, are generally less well represented in the model than those in flat terrain. A similar behavior is observed for the other stations of the German ICOS network and other months of 2022, where we have good overlap of measurements and STILT model results (Figs. A1–A12 in the Appendix). In some rare cases, where most data were measured at RH>98 %, a sharp increase in correlation can be observed for high RH values for some stations (e.g., December 2022, Fig. A12). Based on these findings, we suggest only using 214Po data for the calculation of 222Rn activity concentrations measured at ambient RH<98 %. Secular equilibrium between 214Po and 222Rn can only be assumed for measurements made at RH lower than this threshold. It should be noted that the collection of data published together with this paper (Deutscher Wetterdienst et al., 2024a, b, c, d, e, f, g, h) contains all valid 214Po measurements, and we provide a value for 222Rn only for conditions where full equilibrium between 214Po and 222Rn based on the measured RH can be assumed.
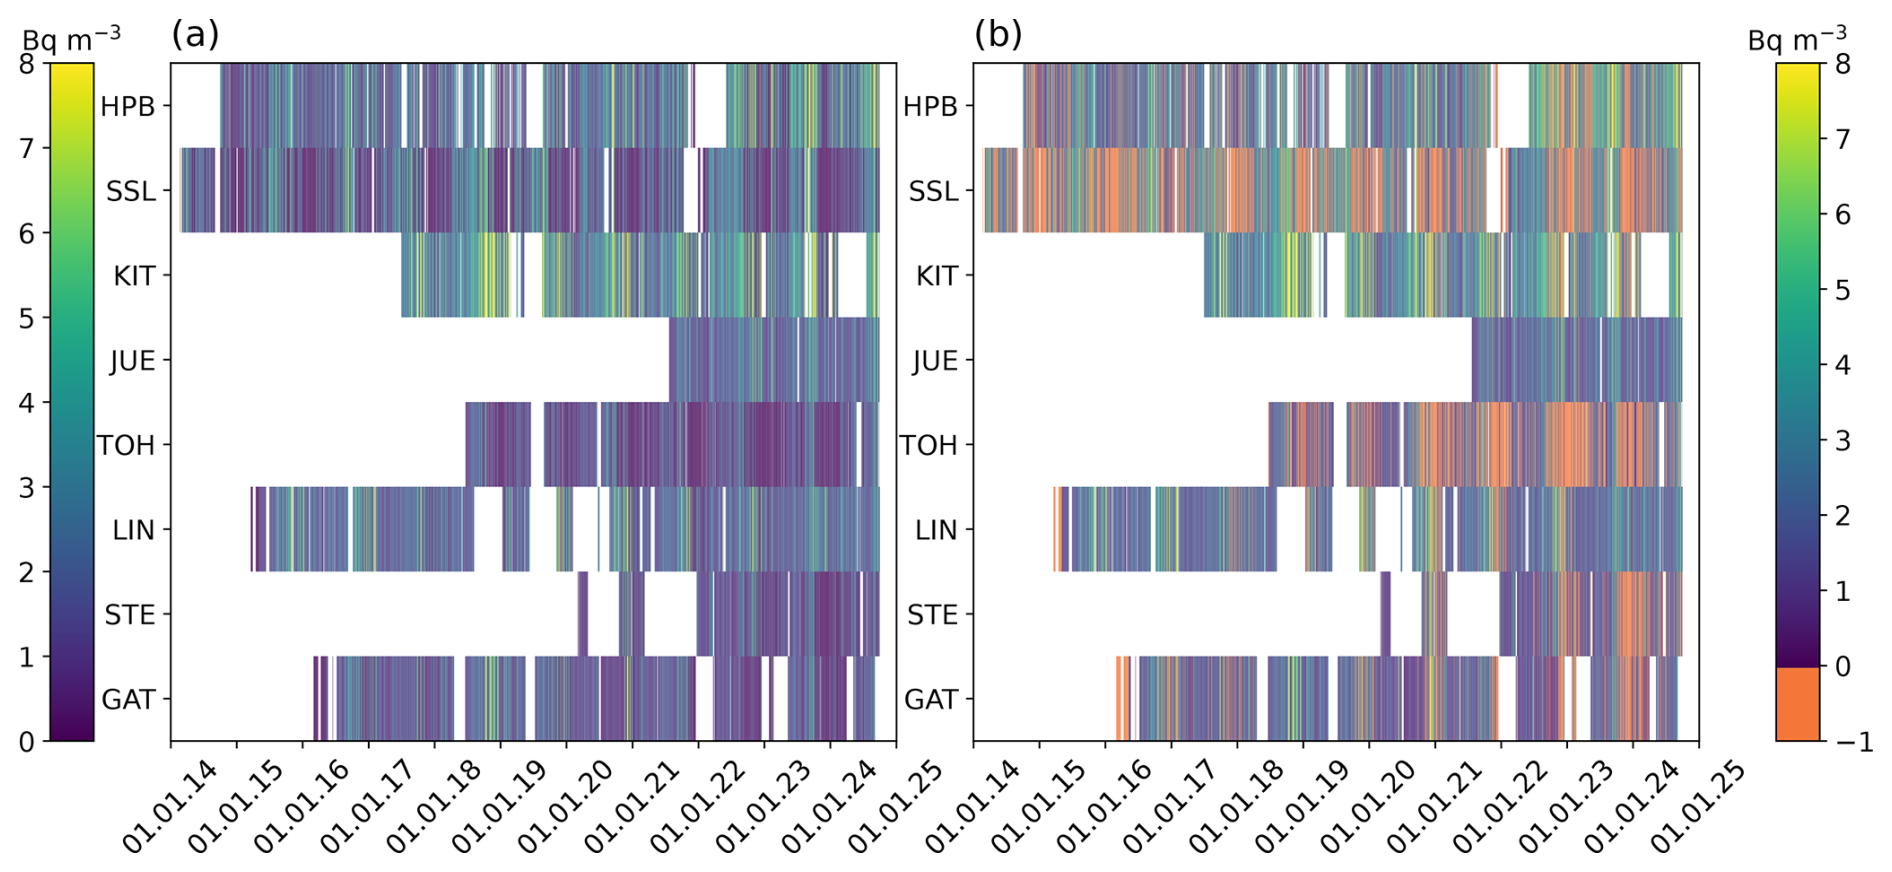
Figure 4Panel (a) shows daily mean atmospheric 214Po activity concentrations in Bq m−3 at German ICOS stations. The daily values are plotted only if more than 70 % of the hourly data were available. Panel (b) shows all valid data where measurements were conducted at RH below the respective thresholds and thus represent the best estimates of the RH-selected 222Rn data. The periods where less than 70 % of the hourly data remained after flagging are shown in orange (with values of −1).
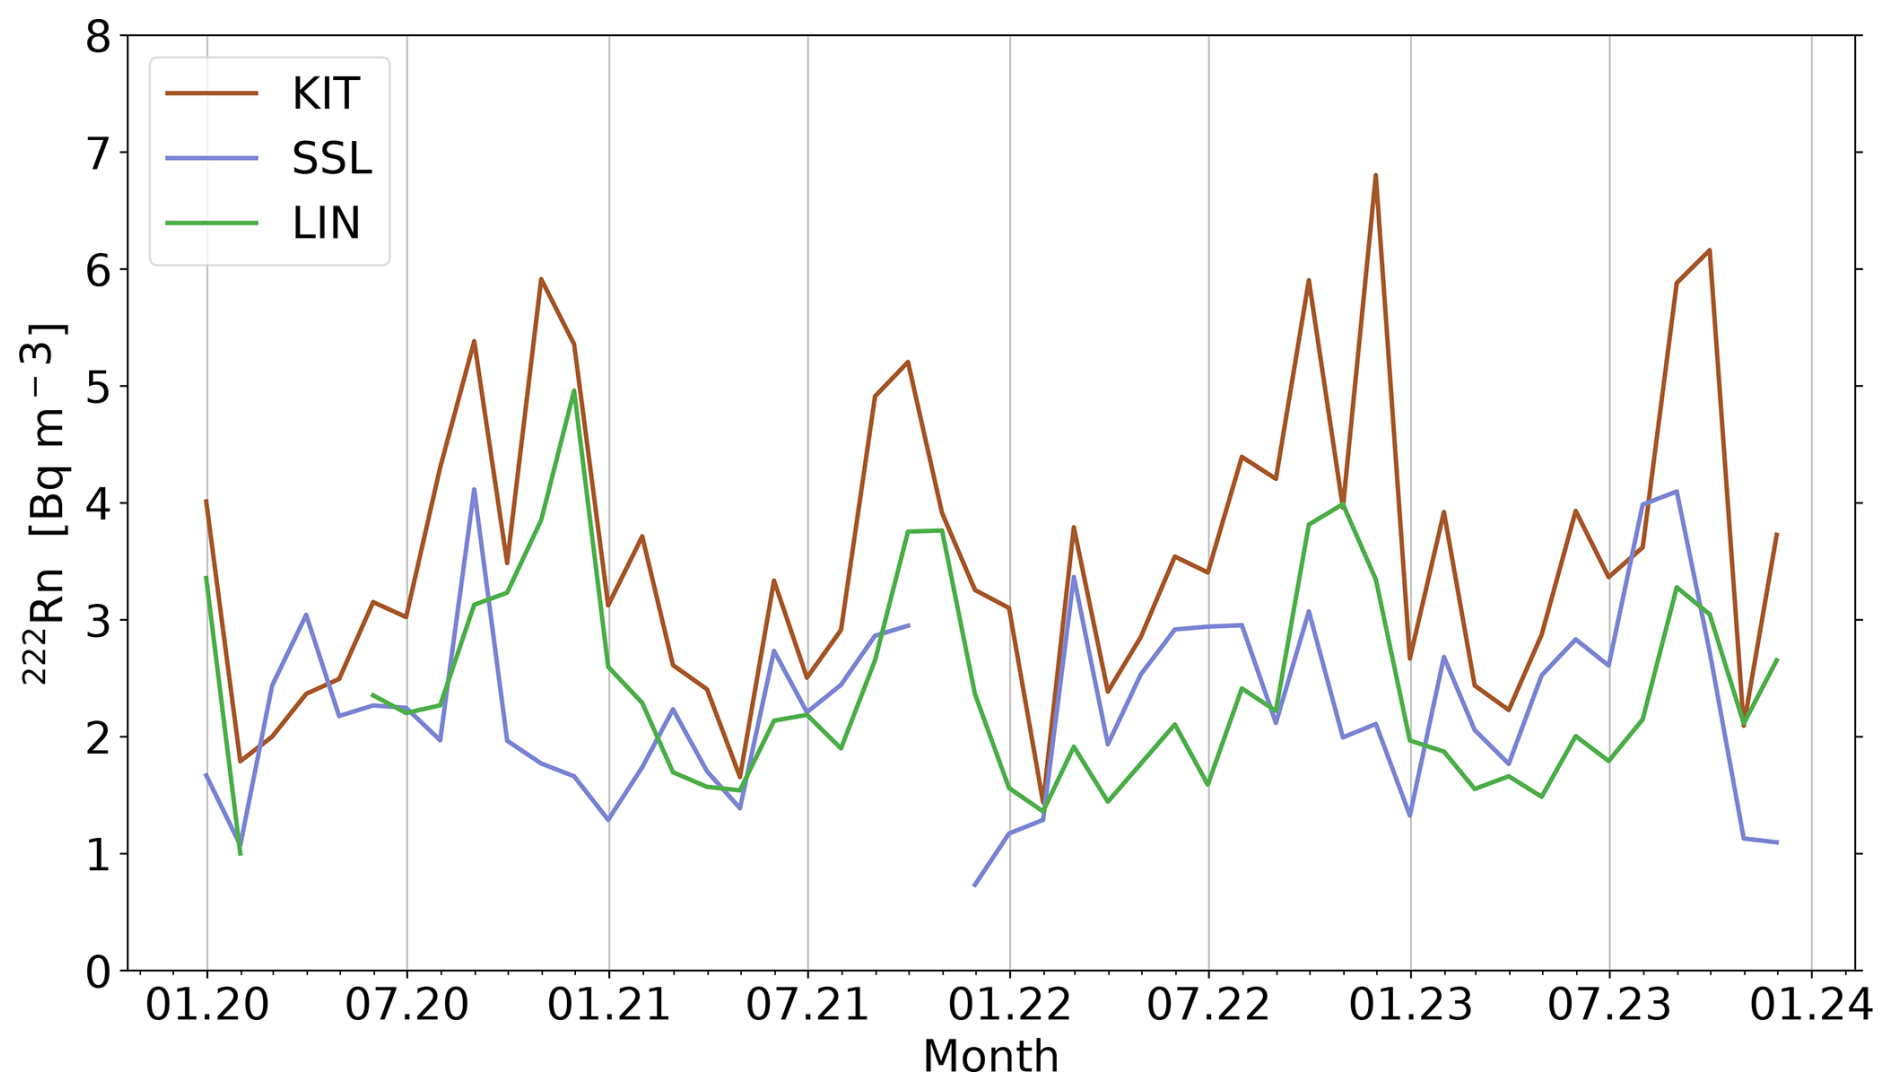
Figure 5Seasonal cycle of 222Rn monthly means at KIT, SSL, and LIN in the time period of 2020–2023. Note that monthly values are only shown if more than 70 % of the daily mean values were available for the respective month.
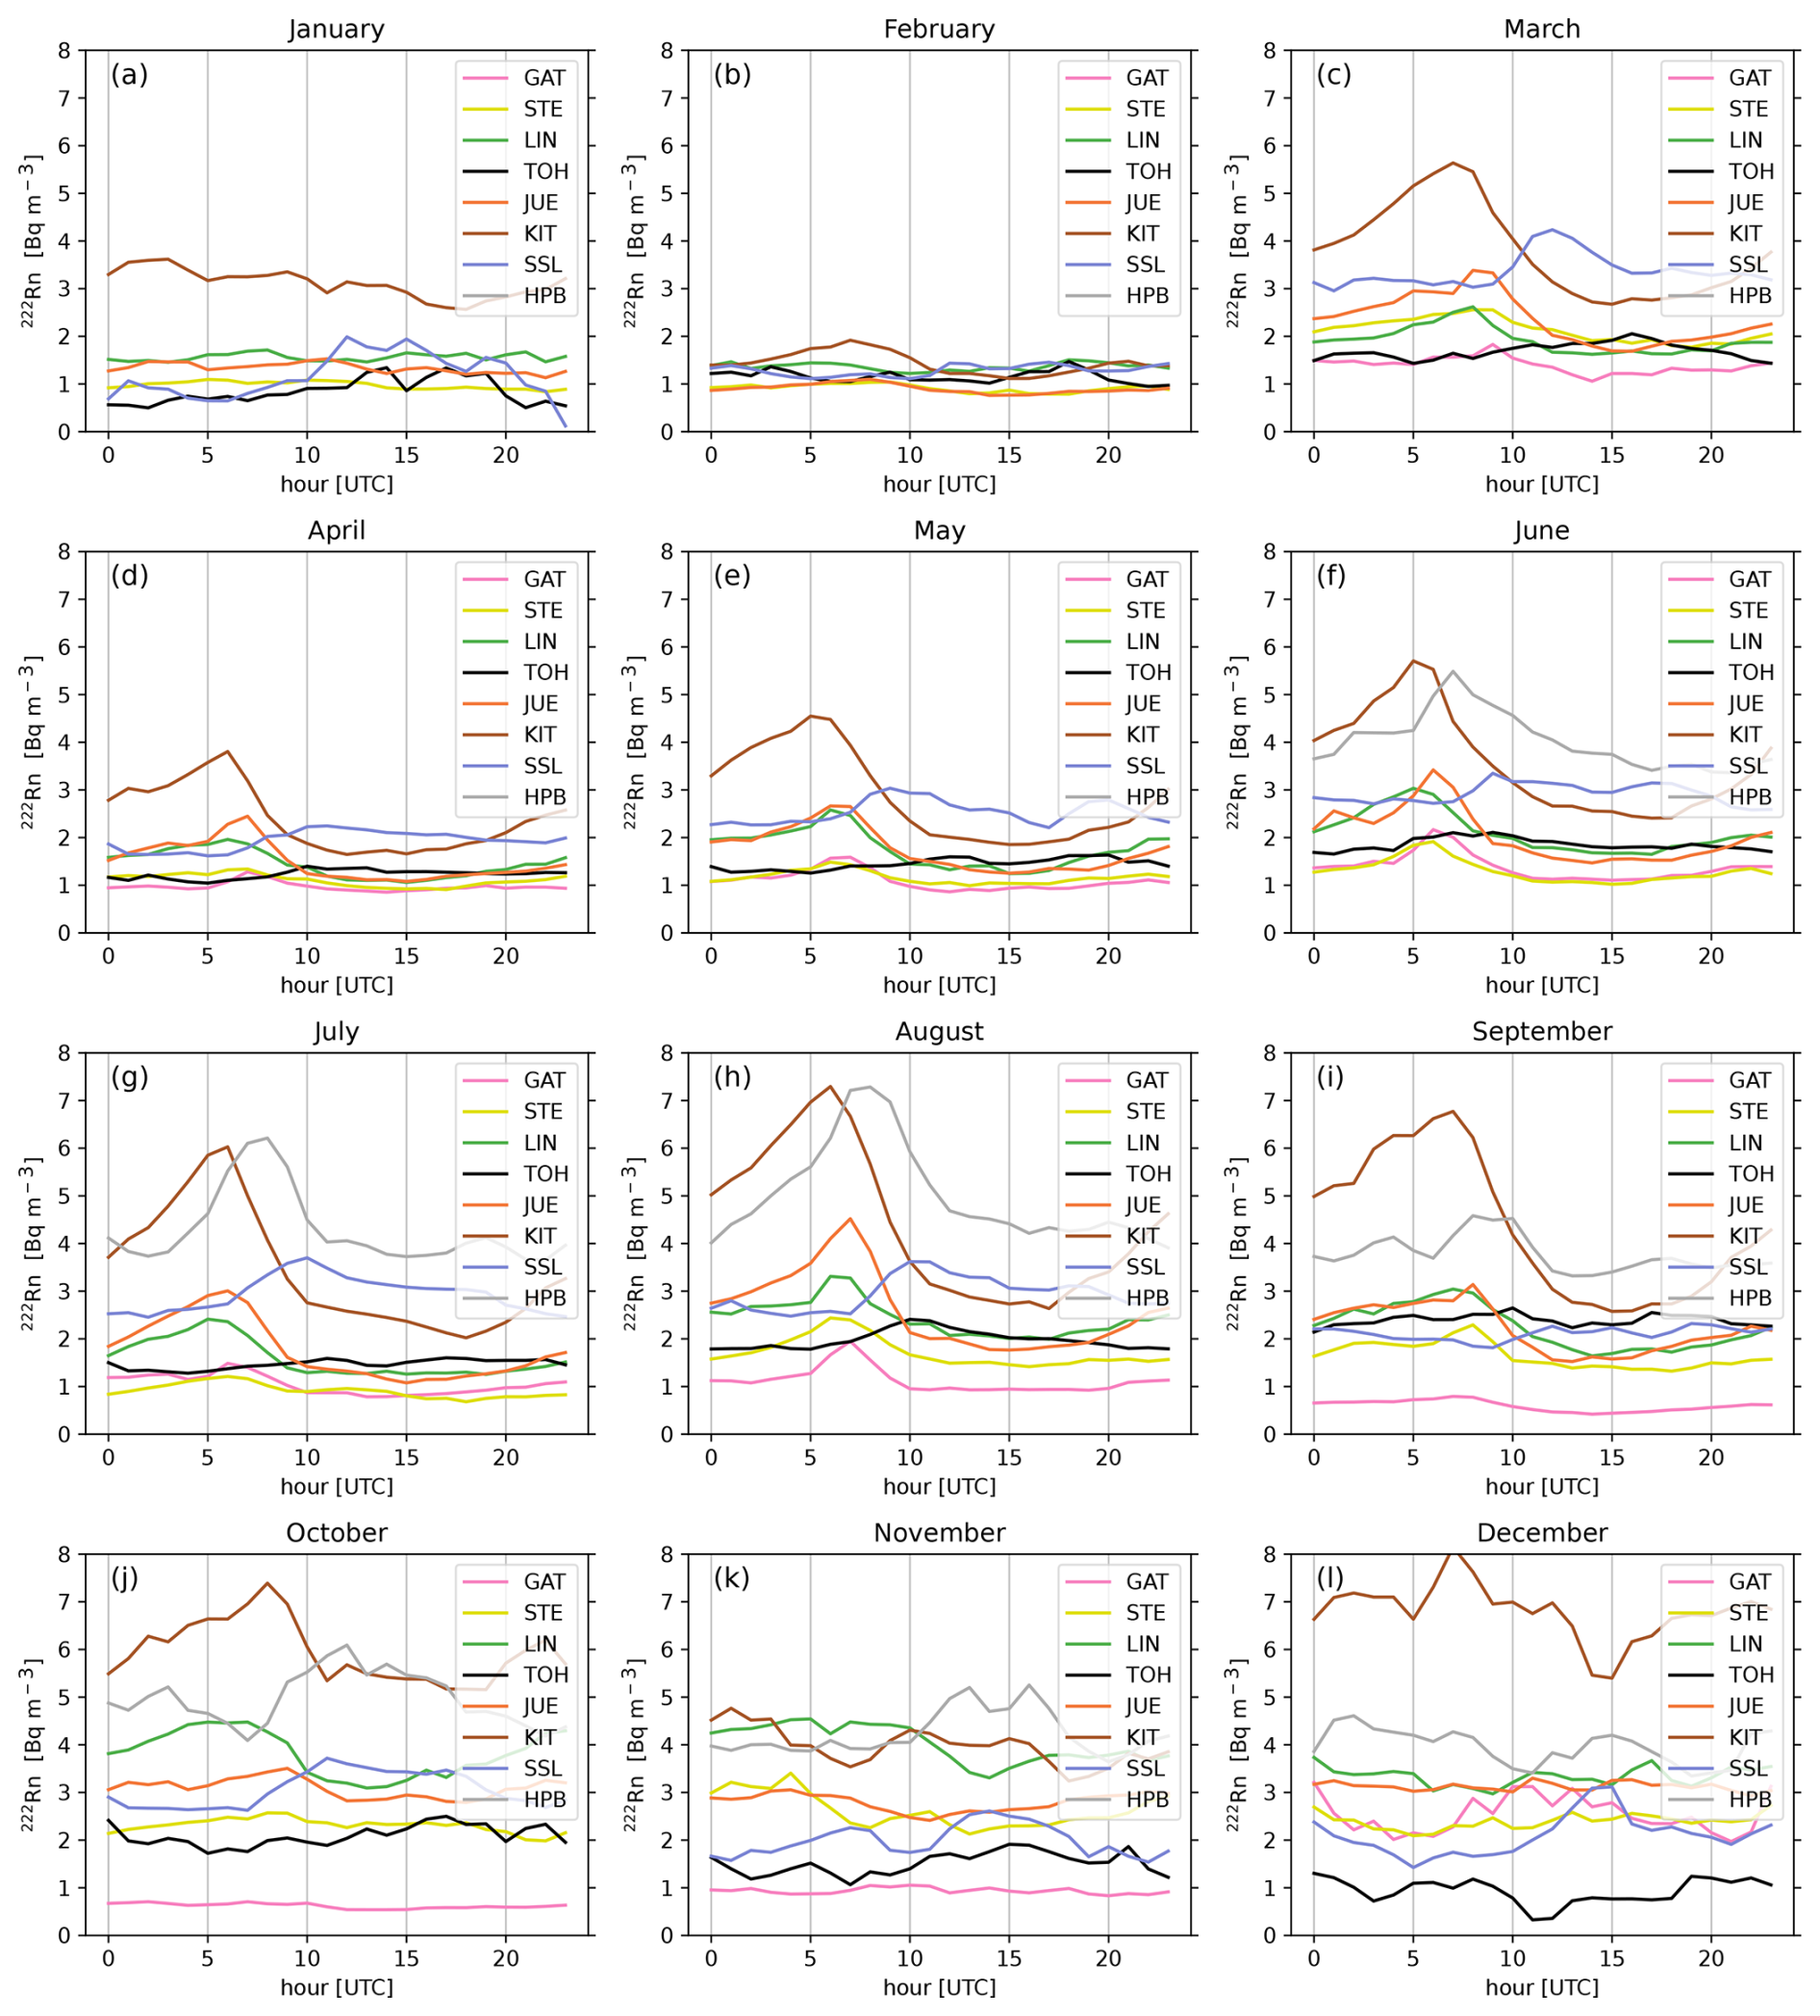
Figure 6Mean diurnal cycles of 214Po-based 222Rn for all months in 2022 where data are available.
Daily mean 214Po data from all stations are shown in the left panel of Fig. 4, while the data remaining after relative humidity flagging (where available) according to the procedure described in Sect. 2.4 are shown in the right panel of Fig. 4. Only mean values for days where more than 70 % of the hourly data are available or remained after flagging are displayed. Where no RH data are available, the 214Po data have been flagged. At some of the sites there are large gaps in the 214Po data, which are due to initial handling and logistical problems or occasional HRM failures. After flagging, data gaps become more frequent, especially during winter at high RH and at mountain stations like SSL and TOH, where the high-RH events are more prevalent in general. On average, we observe the highest 214Po (and 222Rn) activity concentrations at KIT located in the upper Rhine valley. Even the mountain stations SSL and HPB, which usually have longer air mass transport away from the 222Rn source and hence lower concentrations, show elevated concentrations compared to the rest of the network, with both of them and KIT located in the south of Germany. The lowest activity concentrations are found at GAT, STE, and TOH, with JUE showing slightly higher 214Po activities. All these stations are situated in the northern half of Germany. This south–north gradient of the 222Rn concentration is consistent with the radon flux estimates for Europe derived from uranium soil content, soil properties, and moisture content by Karstens and Levin (2023). Another factor contributing to this gradient may be the increased influence of radon-depleted marine air masses on northern stations. These stations are situated closer to the basins of the North Sea and the Baltic Sea with negligible radon flux from the surface. On the other hand, air masses reaching the southern stations potentially have more time for radon emanating from the soil to mix into them, leading to higher observed concentrations. The only exception to this longitudinal scheme is the LIN station that, however, has a region of elevated radon soil emission values to the south of the station.
At all stations we find a clear seasonal cycle, with the highest values in summer and autumn and lowest activity concentrations in winter and spring (Fig. 5 shows KIT, SSL, and LIN; Fig. A13 in the Appendix depicts all stations). This seasonality is mainly caused by the seasonality of the radon exhalation rate from soils, which, on the seasonal timescale, is mainly driven by soil moisture (Karstens et al., 2015). The high 222Rn values in summer and autumn are also due to stable atmospheric conditions in these seasons during nights (cf. Fig. 6) as well as to more frequent high-pressure systems bringing continental air masses to Germany.
The mean diurnal cycles of 222Rn from January to December 2022 are displayed in Fig. 6. Only in summer and early autumn (i.e., from April to September) do we observe on average significant diurnal variations at the tower stations in flat terrain, with maximum values early in the morning after sunrise, i.e., shortly before the atmosphere becomes well-mixed and 222Rn that was accumulated close to the ground is mixed into higher levels of the troposphere. At HPB the morning maximum occurs with a delay of a few hours, as ground-level radon is transported not only through vertical convection but also by upslope winds from the surrounding valleys to the sampling site. A similar diurnal variation is observed at SSL in some of the summer and autumn months. This behavior of 222Rn was observed earlier by Levin (1987). During late autumn, winter, and early spring, systematic diurnal variations are missing at all sites as the variations of the 222Rn activity concentration are much more dominated by synoptic variations. This could be explained by smaller differences in the daily and nightly mixing height distributions during late autumn and winter months (Emeis and Turk, 2004), which would greatly diminish the radon diurnal amplitude.
The 222Rn observations are available at the ICOS Carbon Portal (https://doi.org/10.18160/Q2M8-B1HJ, Fischer et al., 2024).
Currently, there are eight ICOS stations within Germany measuring atmospheric activity concentrations; these are fairly even distributed over the country with five tall towers in flat terrain and three stations on mountaintops (two of which sample air from more than 90 ). Observations are conducted with the static filter Heidelberg Radon Monitor, measuring atmospheric 222Rn progeny. At all tower stations sampling air from intake heights more than 90 , progeny can be assumed to be in equilibrium with atmospheric 222Rn. Only at very high relative humidity >98 % is this not necessarily the case, which we were able to demonstrate by comparison with simulated 222Rn activity concentrations. We, therefore, recommend excluding the data measured with HRM during RH conditions of 98 % and above at all sites in any applications where 222Rn values are of interest (and not of its progenies), for example as a tracer for boundary layer transport, e.g., for atmospheric transport model validation or for the application of the radon tracer method (RTM Levin et al., 2021). In this latter application, the missing data at high RH will probably not cause additional uncertainty in RTM-based flux estimates because these very humid atmospheric situations with marine air reaching the stations normally show little correlation between greenhouse gas (GHG) concentrations and 222Rn, and such situations would have been discarded. In the case of atmospheric transport model validation, however, it is essential to use appropriately flagged radon data, where the equilibrium between radon and its progenies can be ensured, even if this results in data gaps. The scavenging of aerosols in small droplets, followed by wet deposition and rain-out, can cause a significant reduction in radon progenies, which leads to discrepancies with the radon signal. These findings further highlight the limitations of the HRM and the need for direct 222Rn measurements at high-altitude sites where clouds frequently coincide with the intake heights. The quantity of flagged data ranges from 3 % to 55 % in the wetter winter months (December–February, average 24 %), with the highest flagged percentage in TOH (51 %) and SSL (55 %) and the lowest in KIT (9 %) and JUE (3 %). During the drier summer months (June–August), the percentage of flagged observations is significantly lower (average 7 %), with the same stations for the highest and lowest quantities (high: TOH – 13 %, SSL – 16 %, low: KIT – 1 %, JUE – 1 %).
In view of the rather small percentage of the data where the 214Po data measured with the HRM were most probably not in secular equilibrium with 222Rn (with the exception of SSL and TOH stations during winter months), and since the absolute agreement between the HRM and other instruments measuring 222Rn directly was of the order of ±10 % during intercomparison campaigns, we conclude that our method is suitable for sampling heights above 80–90 for the stations in flat terrain. The situation may be different for lower intake heights, where we cannot generally assume radioactive equilibrium between 222Rn and its progenies. For example, in the case of our station in Heidelberg, where air is collected from the roof of the building at 30 , we have to apply a mean correction for disequilibrium, multiplying the 214Po activity concentration with a corresponding factor that was based on comparison measurements with an ANSTO detector (i.e., 1.11 Schmithüsen et al., 2017; Levin et al., 2021). A correction for disequilibrium must also be applied to the Schauinsland 214Po data based on comparison with direct 222Rn measurements (Xia et al., 2010). As the disequilibrium between 214Po and 222Rn depends on atmospheric stability (Jacobi and Andre, 1963; Cuntz, 1997), applying just one mean factor adds uncertainty to the 222Rn data. Measuring 222Rn gradients below 80–90 is, therefore, not recommended with the HRM, unless a careful comparison with an instrument measuring 222Rn directly has been conducted for each height level in order to apply a disequilibrium correction based on direct observations. Furthermore, for high-altitude stations (e.g., TOH or SSL) with a high prevalence of RH values greater than 98 %, it is essential to closely examine the typical meteorological conditions prior to HRM deployment or to consider the utilization of other radon instruments that are not prone to aerosol scavenging effects.
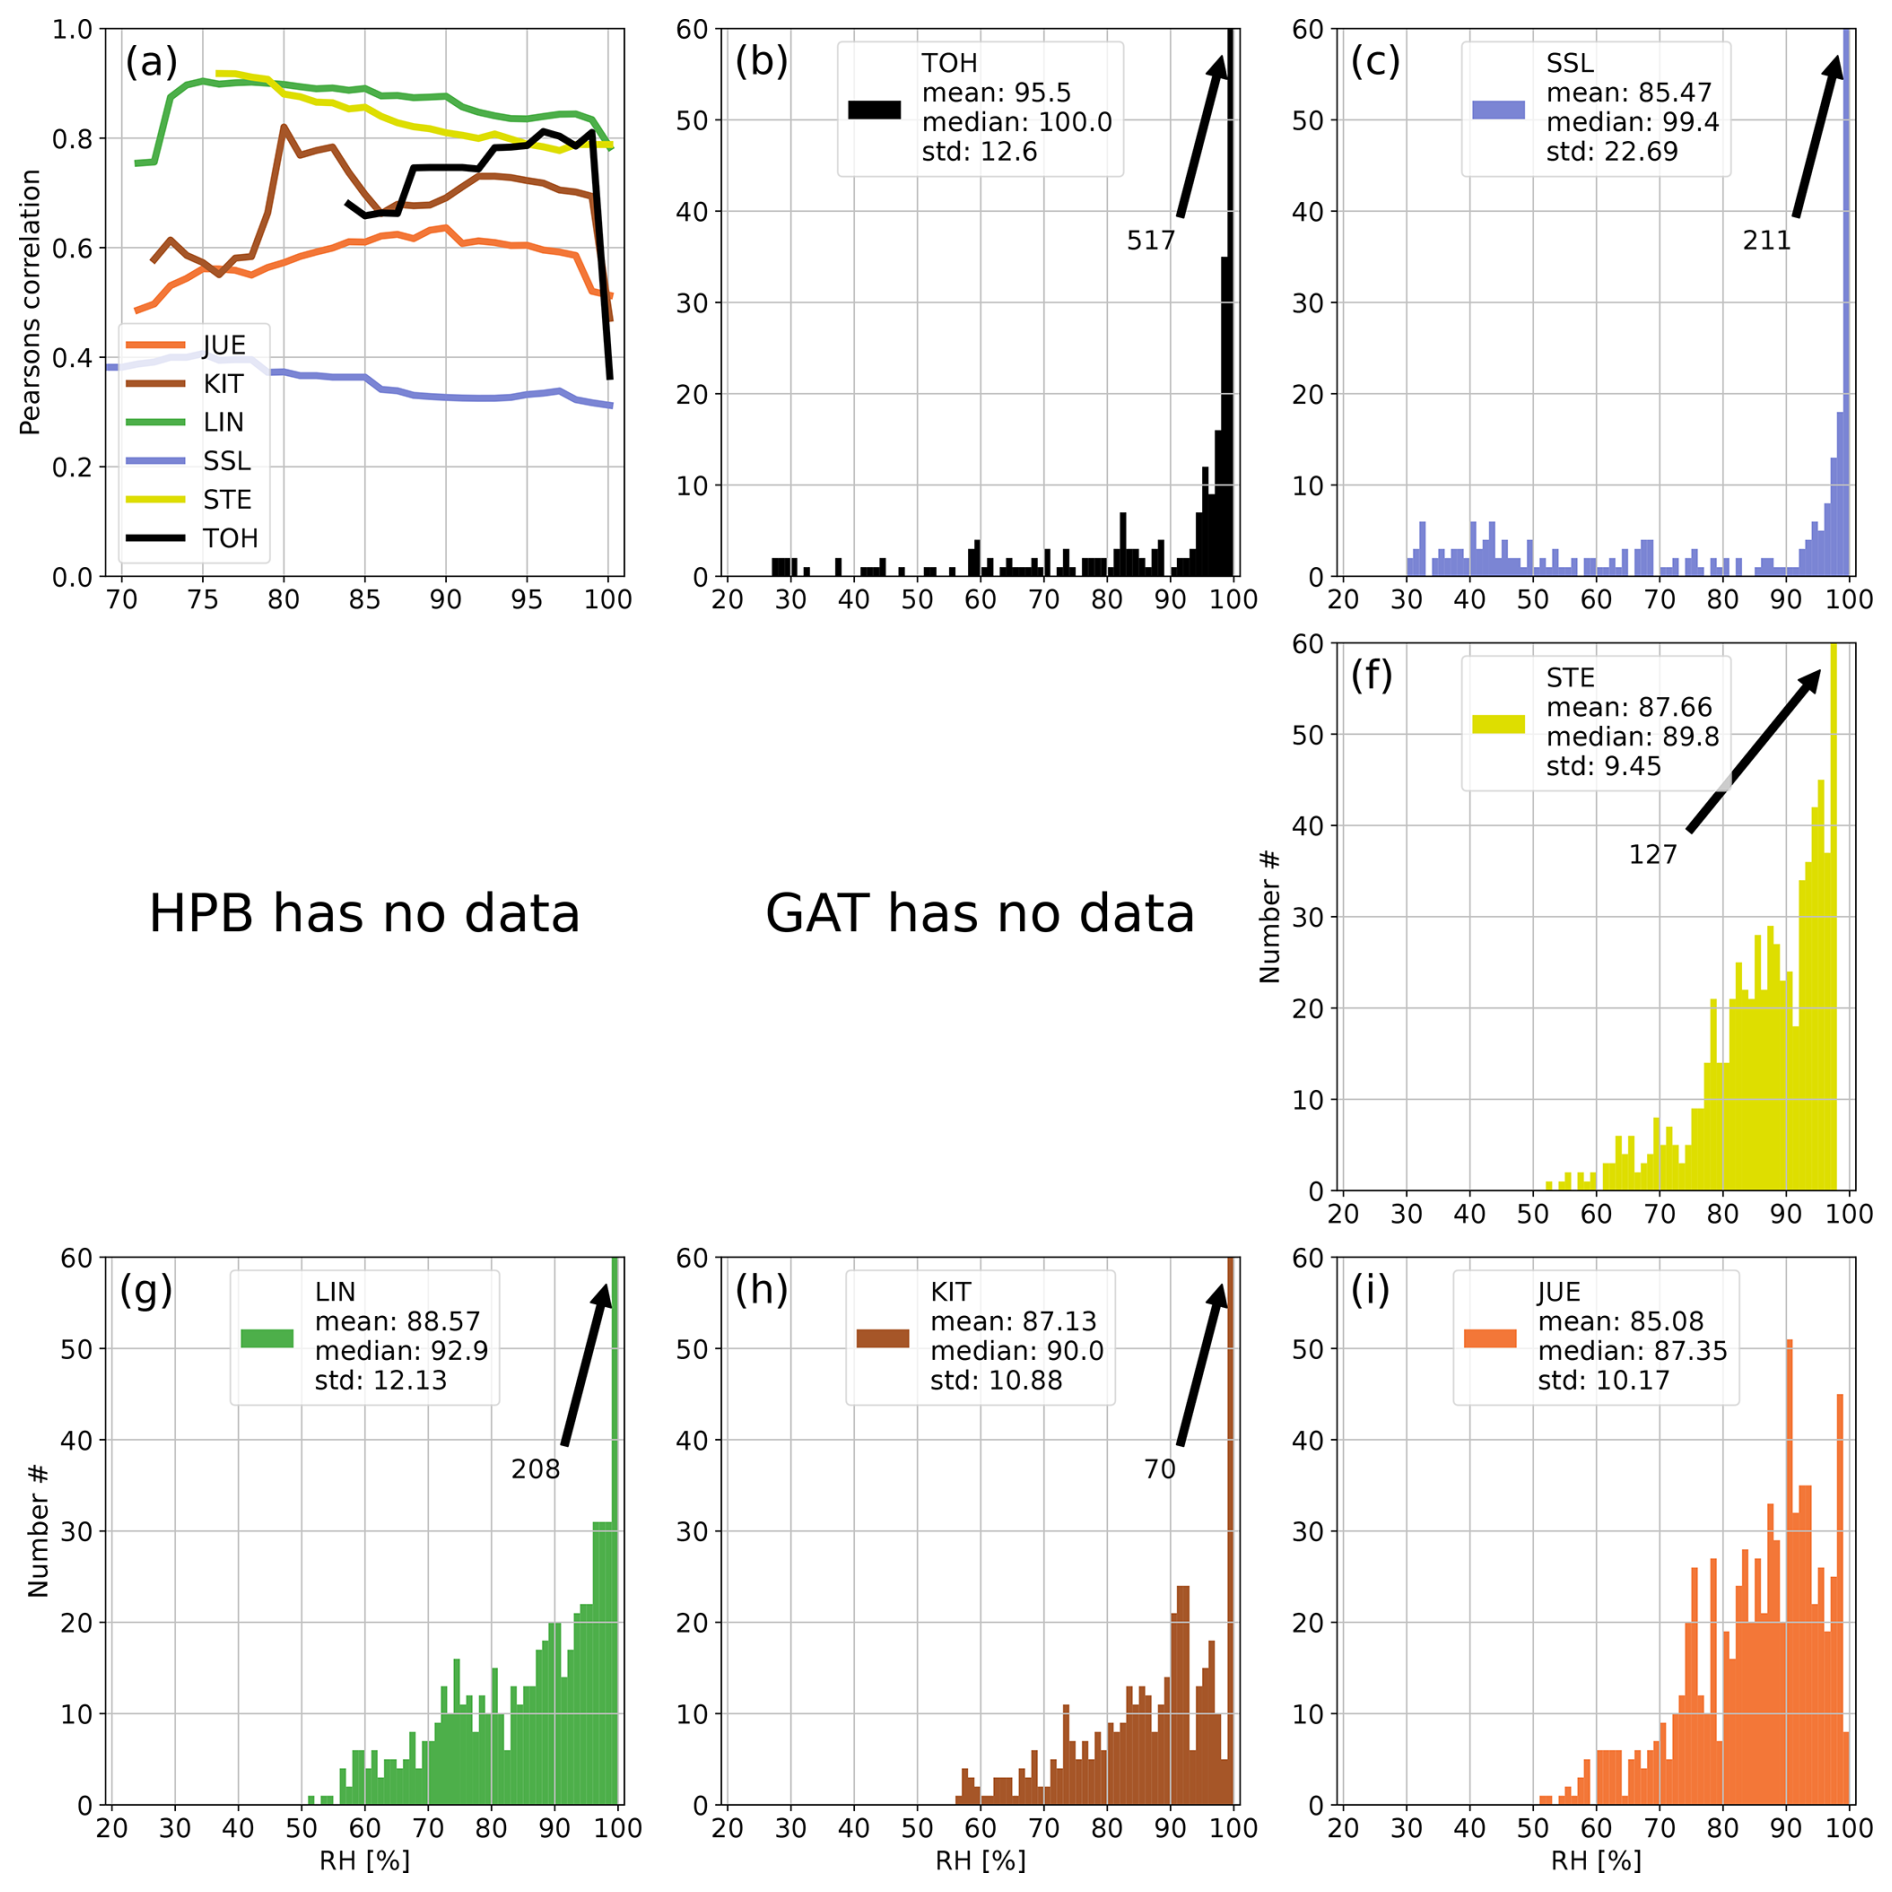
Figure A1Panel (a) shows the development of the correlation coefficient between 214Po observations and simulated 222Rn data at all German ICOS stations if data with increasing RH are successively included in the calculation of the correlation. Panels (b)–(i) show the distributions of hourly RH values at the stations of the network. The arrows with numbers indicate values that exceed the y-axis range (usually for high RH). For each station the correlation coefficient was calculated only if the number of filtered data points was higher than 10 % of all values for the given month to avoid the stochastic behavior of the curves in the first subplot associated with small datasets. January 2022.
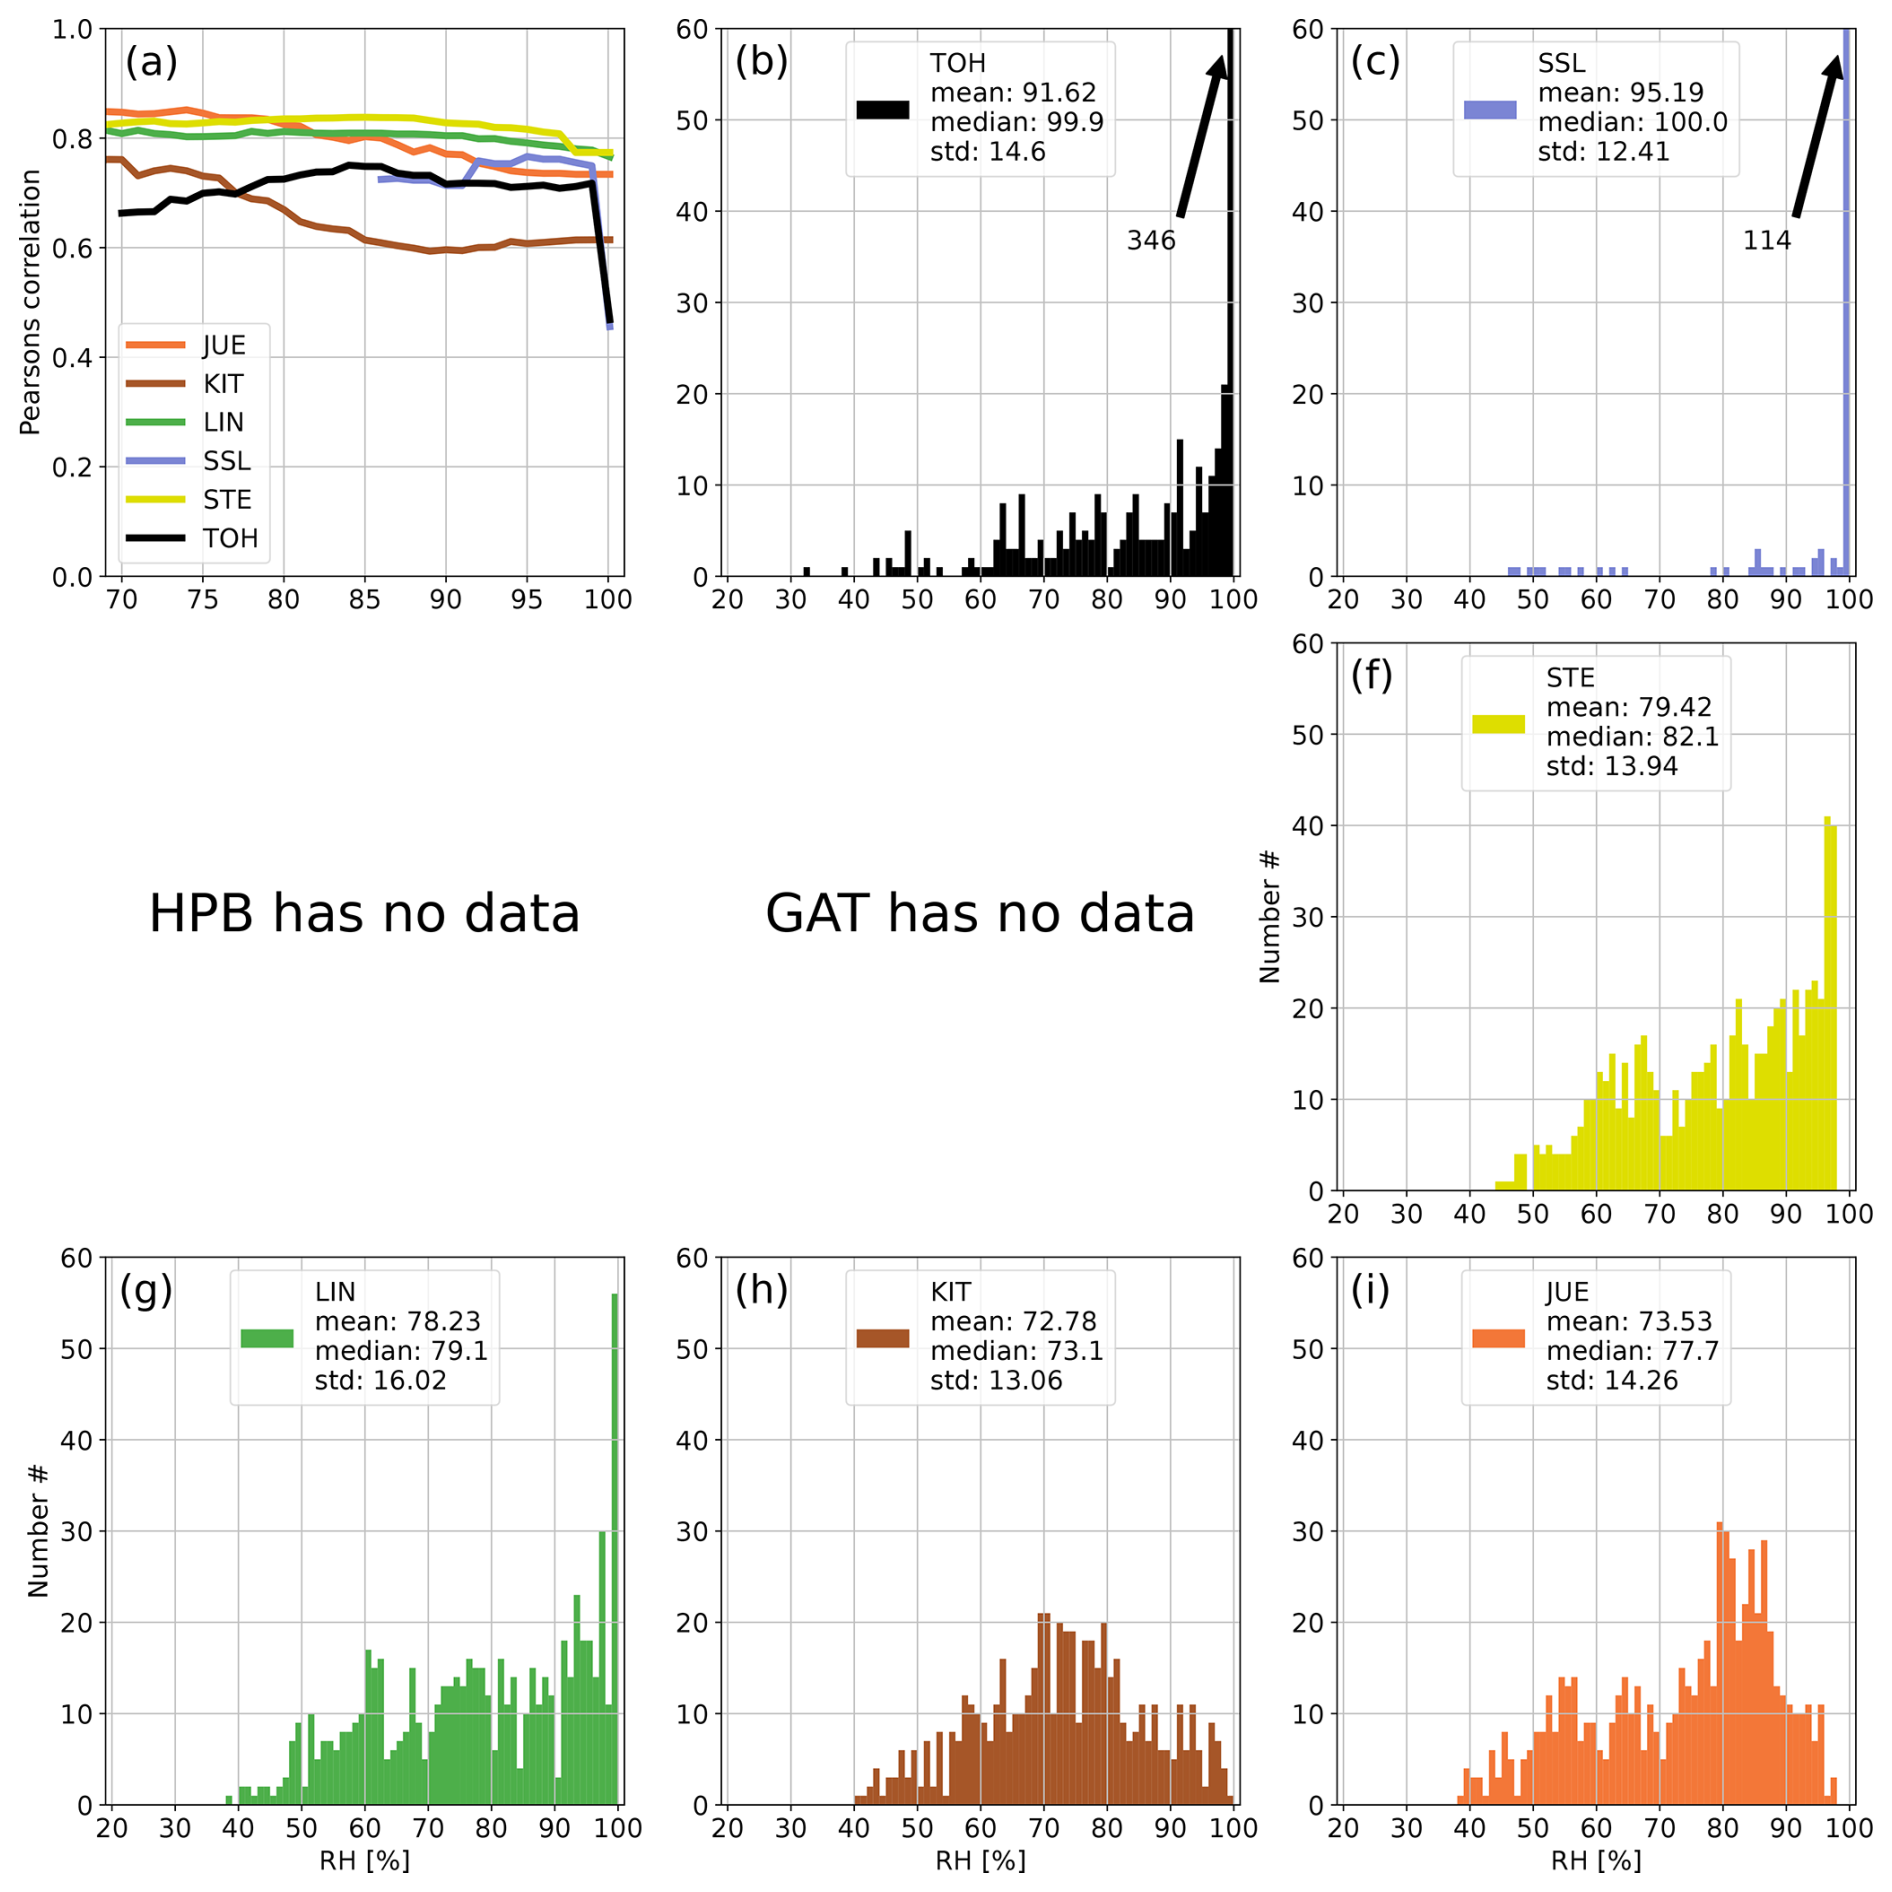
Figure A2Panel (a) shows the development of the correlation coefficient between 214Po observations and simulated 222Rn data at all German ICOS stations if data with increasing RH are successively included in the calculation of the correlation. Panels (b)–(i) show the distributions of hourly RH values at the stations of the network. The arrows with numbers indicate values that exceed the y-axis range (usually for high RH). For each station the correlation coefficient was calculated only if the number of filtered data points was higher than 10 % of all values for the given month to avoid the stochastic behavior of the curves in the first subplot associated with small datasets. February 2022.
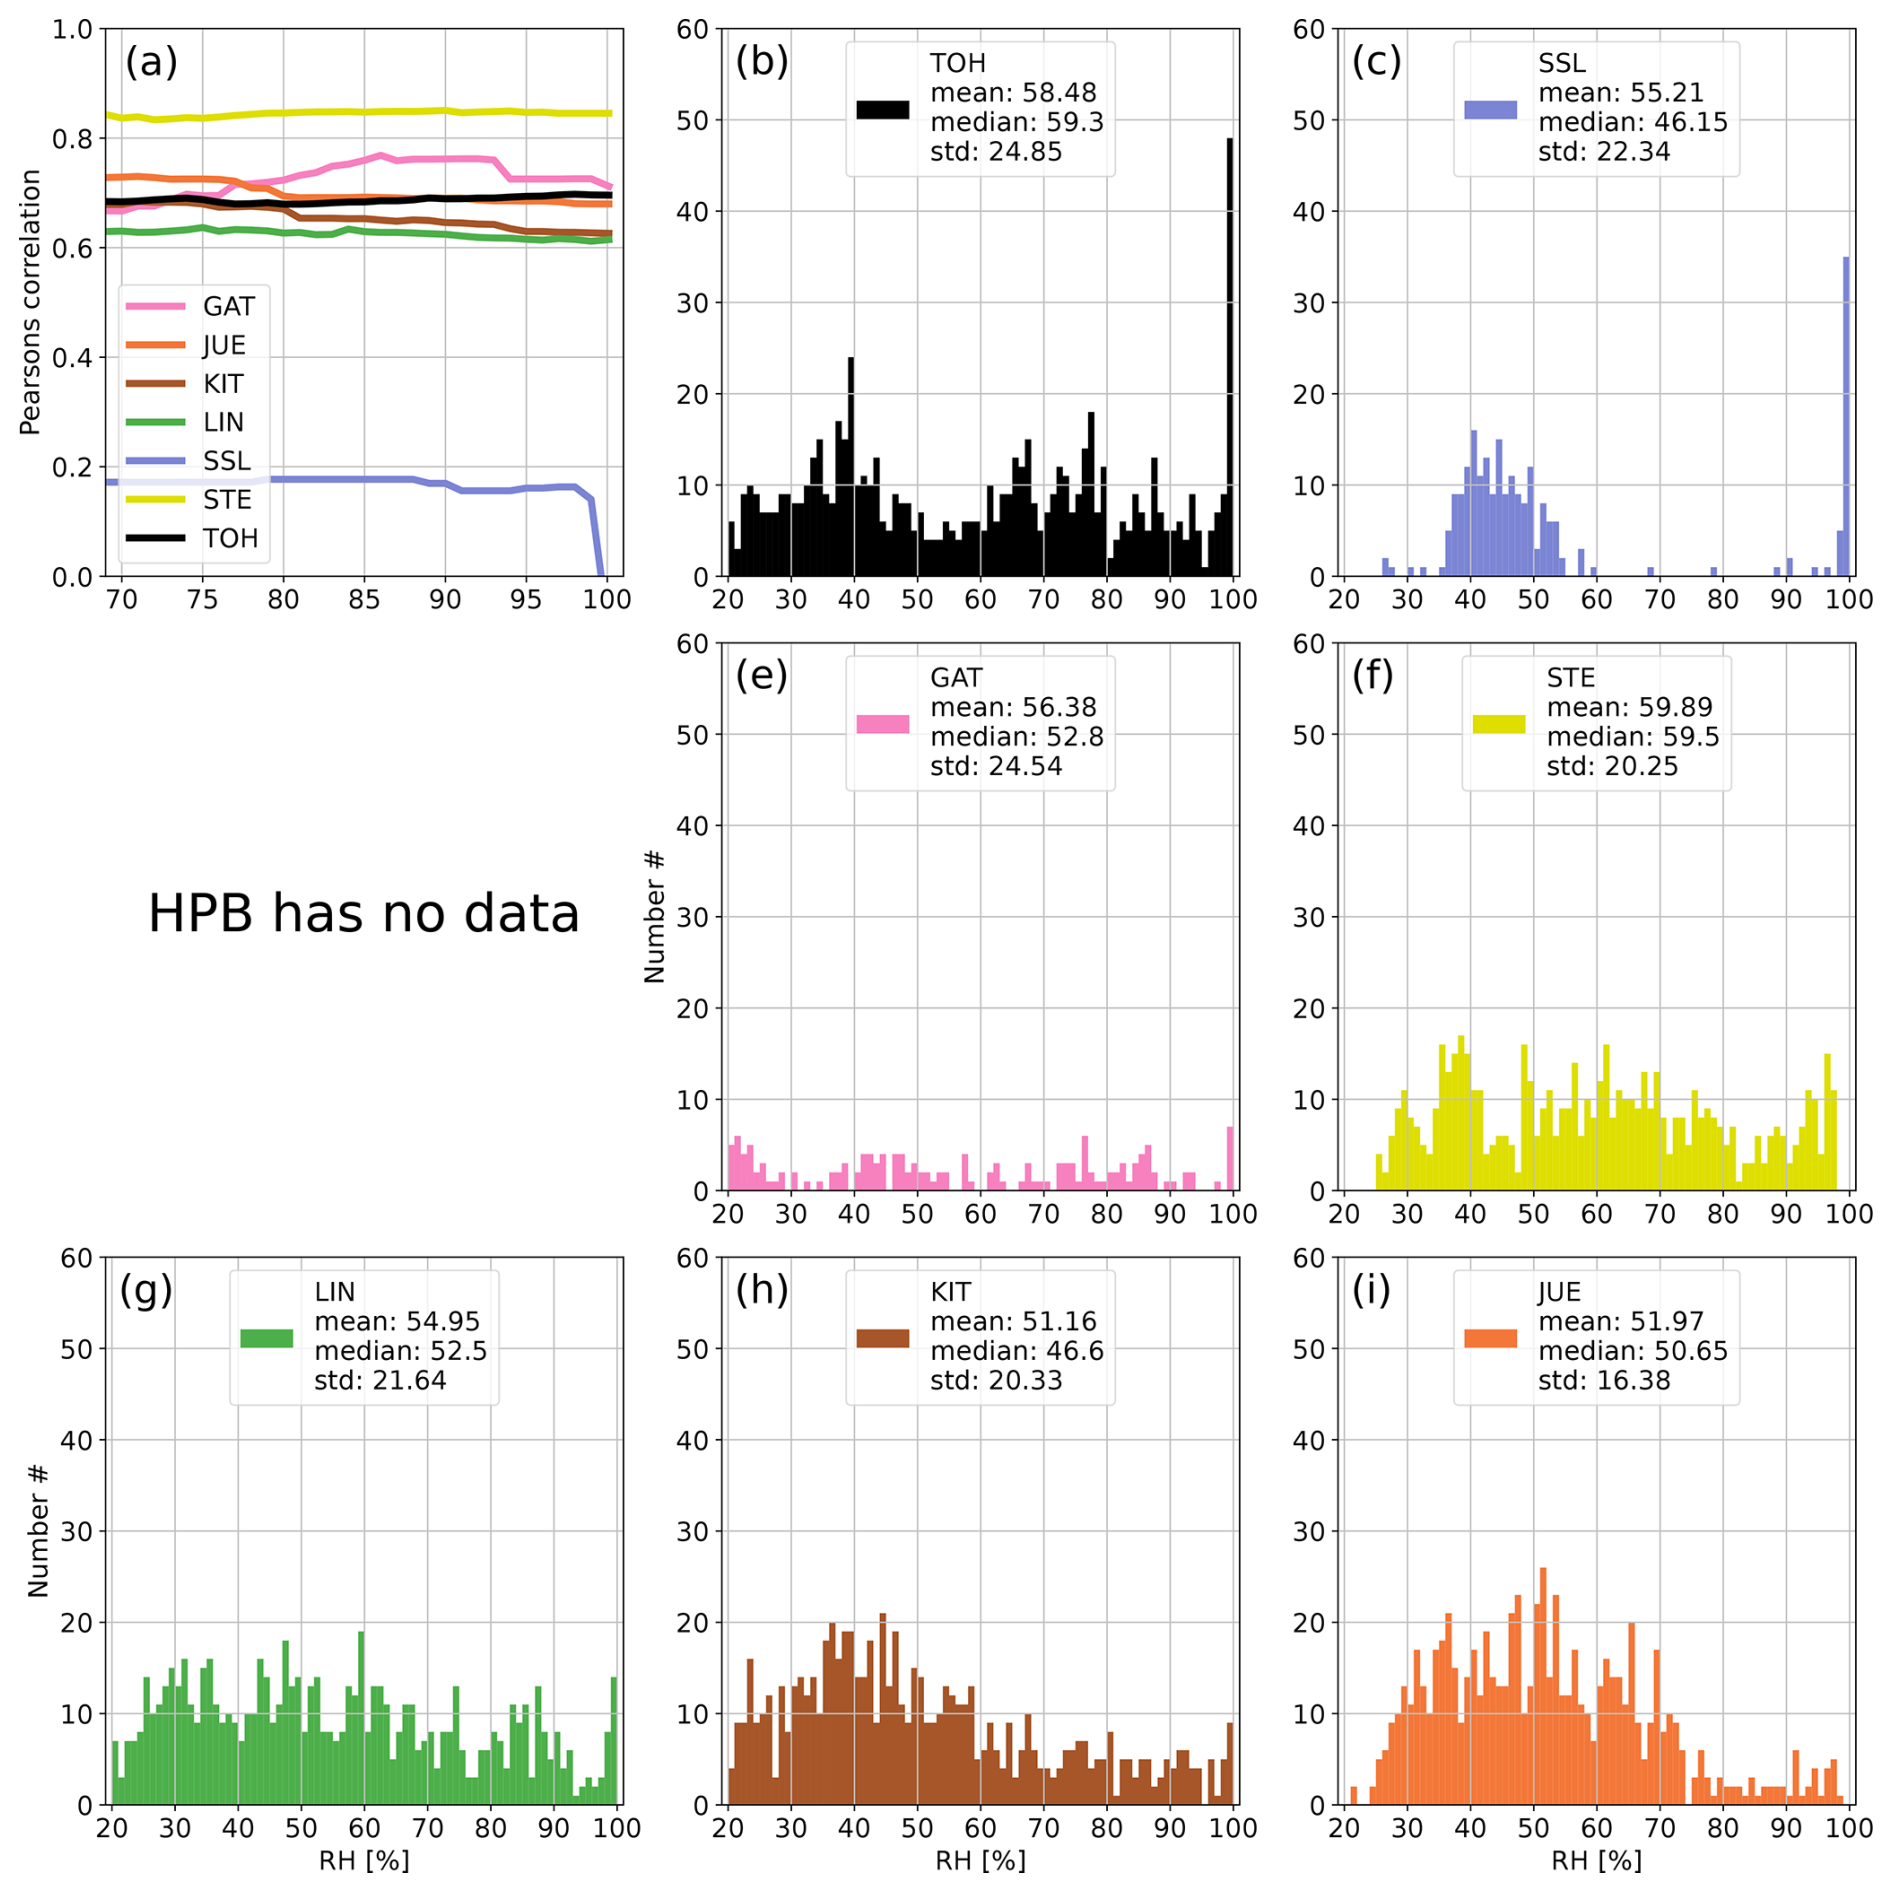
Figure A3Panel (a) shows the development of the correlation coefficient between 214Po observations and simulated 222Rn data at all German ICOS stations if data with increasing RH are successively included in the calculation of the correlation. Panels (b)–(i) show the distributions of hourly RH values at the stations of the network. The arrows with numbers indicate values that exceed the y-axis range (usually for high RH). For each station the correlation coefficient was calculated only if the number of filtered data points was higher than 10 % of all values for the given month to avoid the stochastic behavior of the curves in the first subplot associated with small datasets. March 2022.
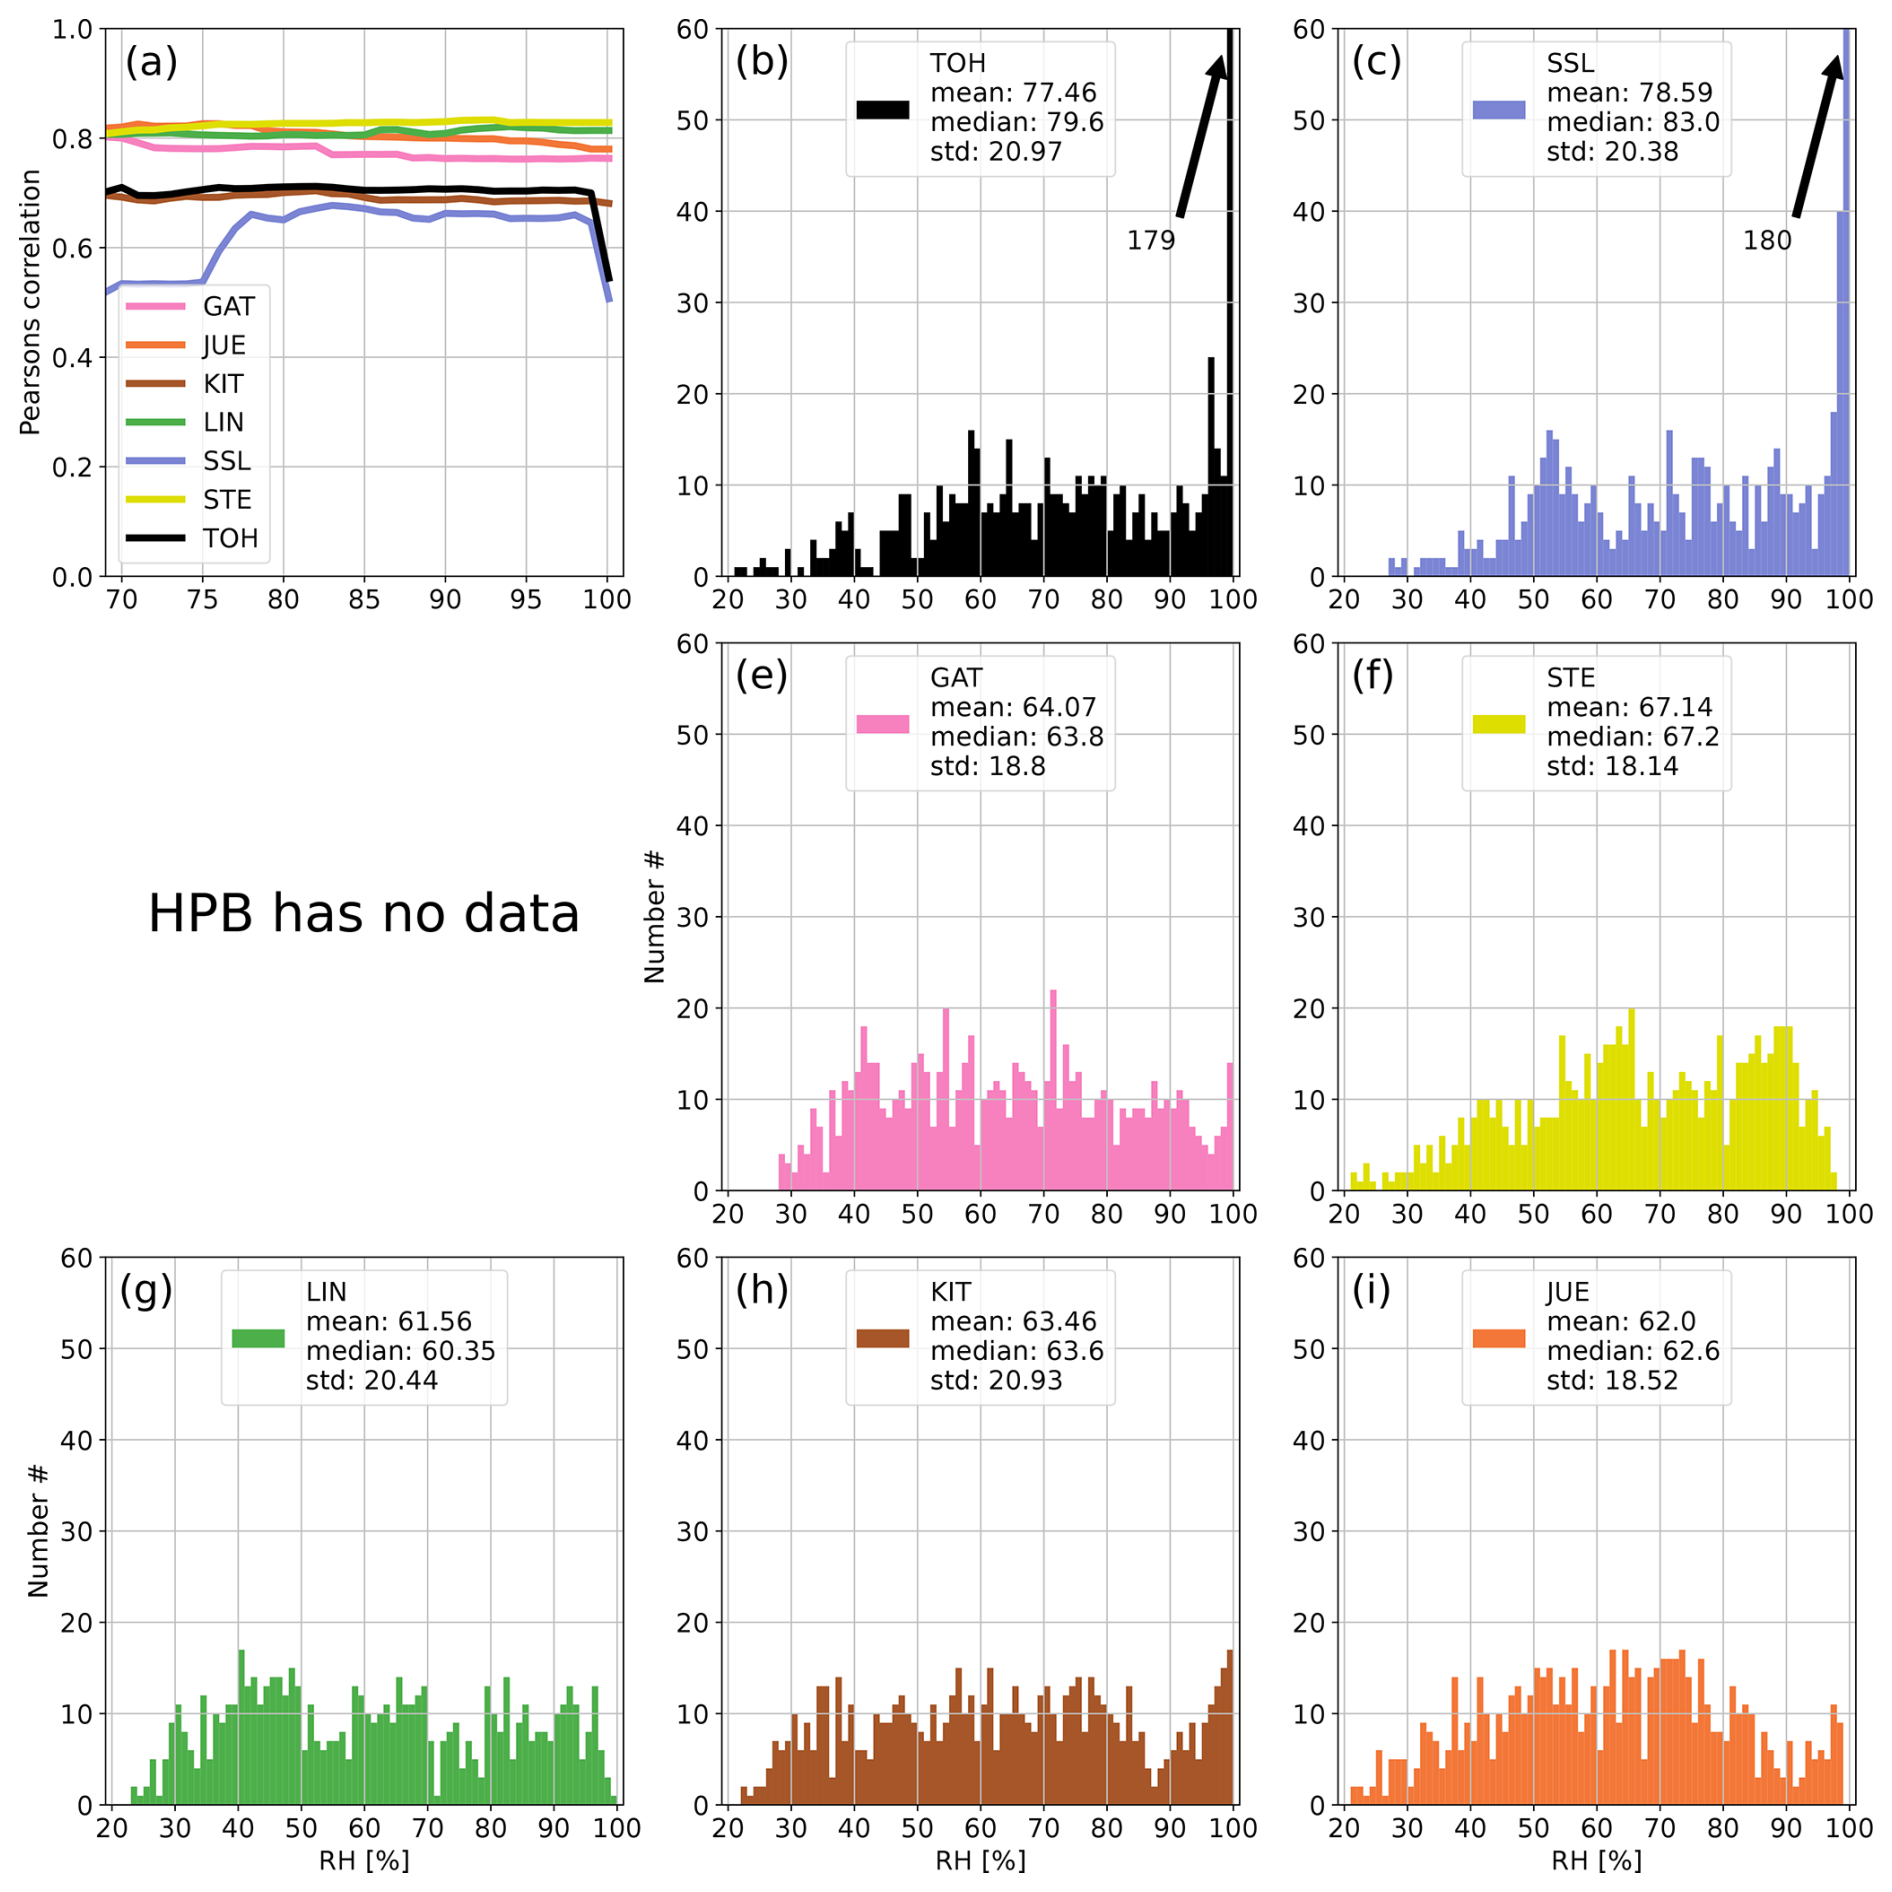
Figure A4Panel (a) shows the development of the correlation coefficient between 214Po observations and simulated 222Rn data at all German ICOS stations if data with increasing RH are successively included in the calculation of the correlation. Panels (b)–(i) show the distributions of hourly RH values at the stations of the network. The arrows with numbers indicate values that exceed the y-axis range (usually for high RH). For each station the correlation coefficient was calculated only if the number of filtered data points was higher than 10 % of all values for the given month to avoid the stochastic behavior of the curves in the first subplot associated with small datasets. April 2022.
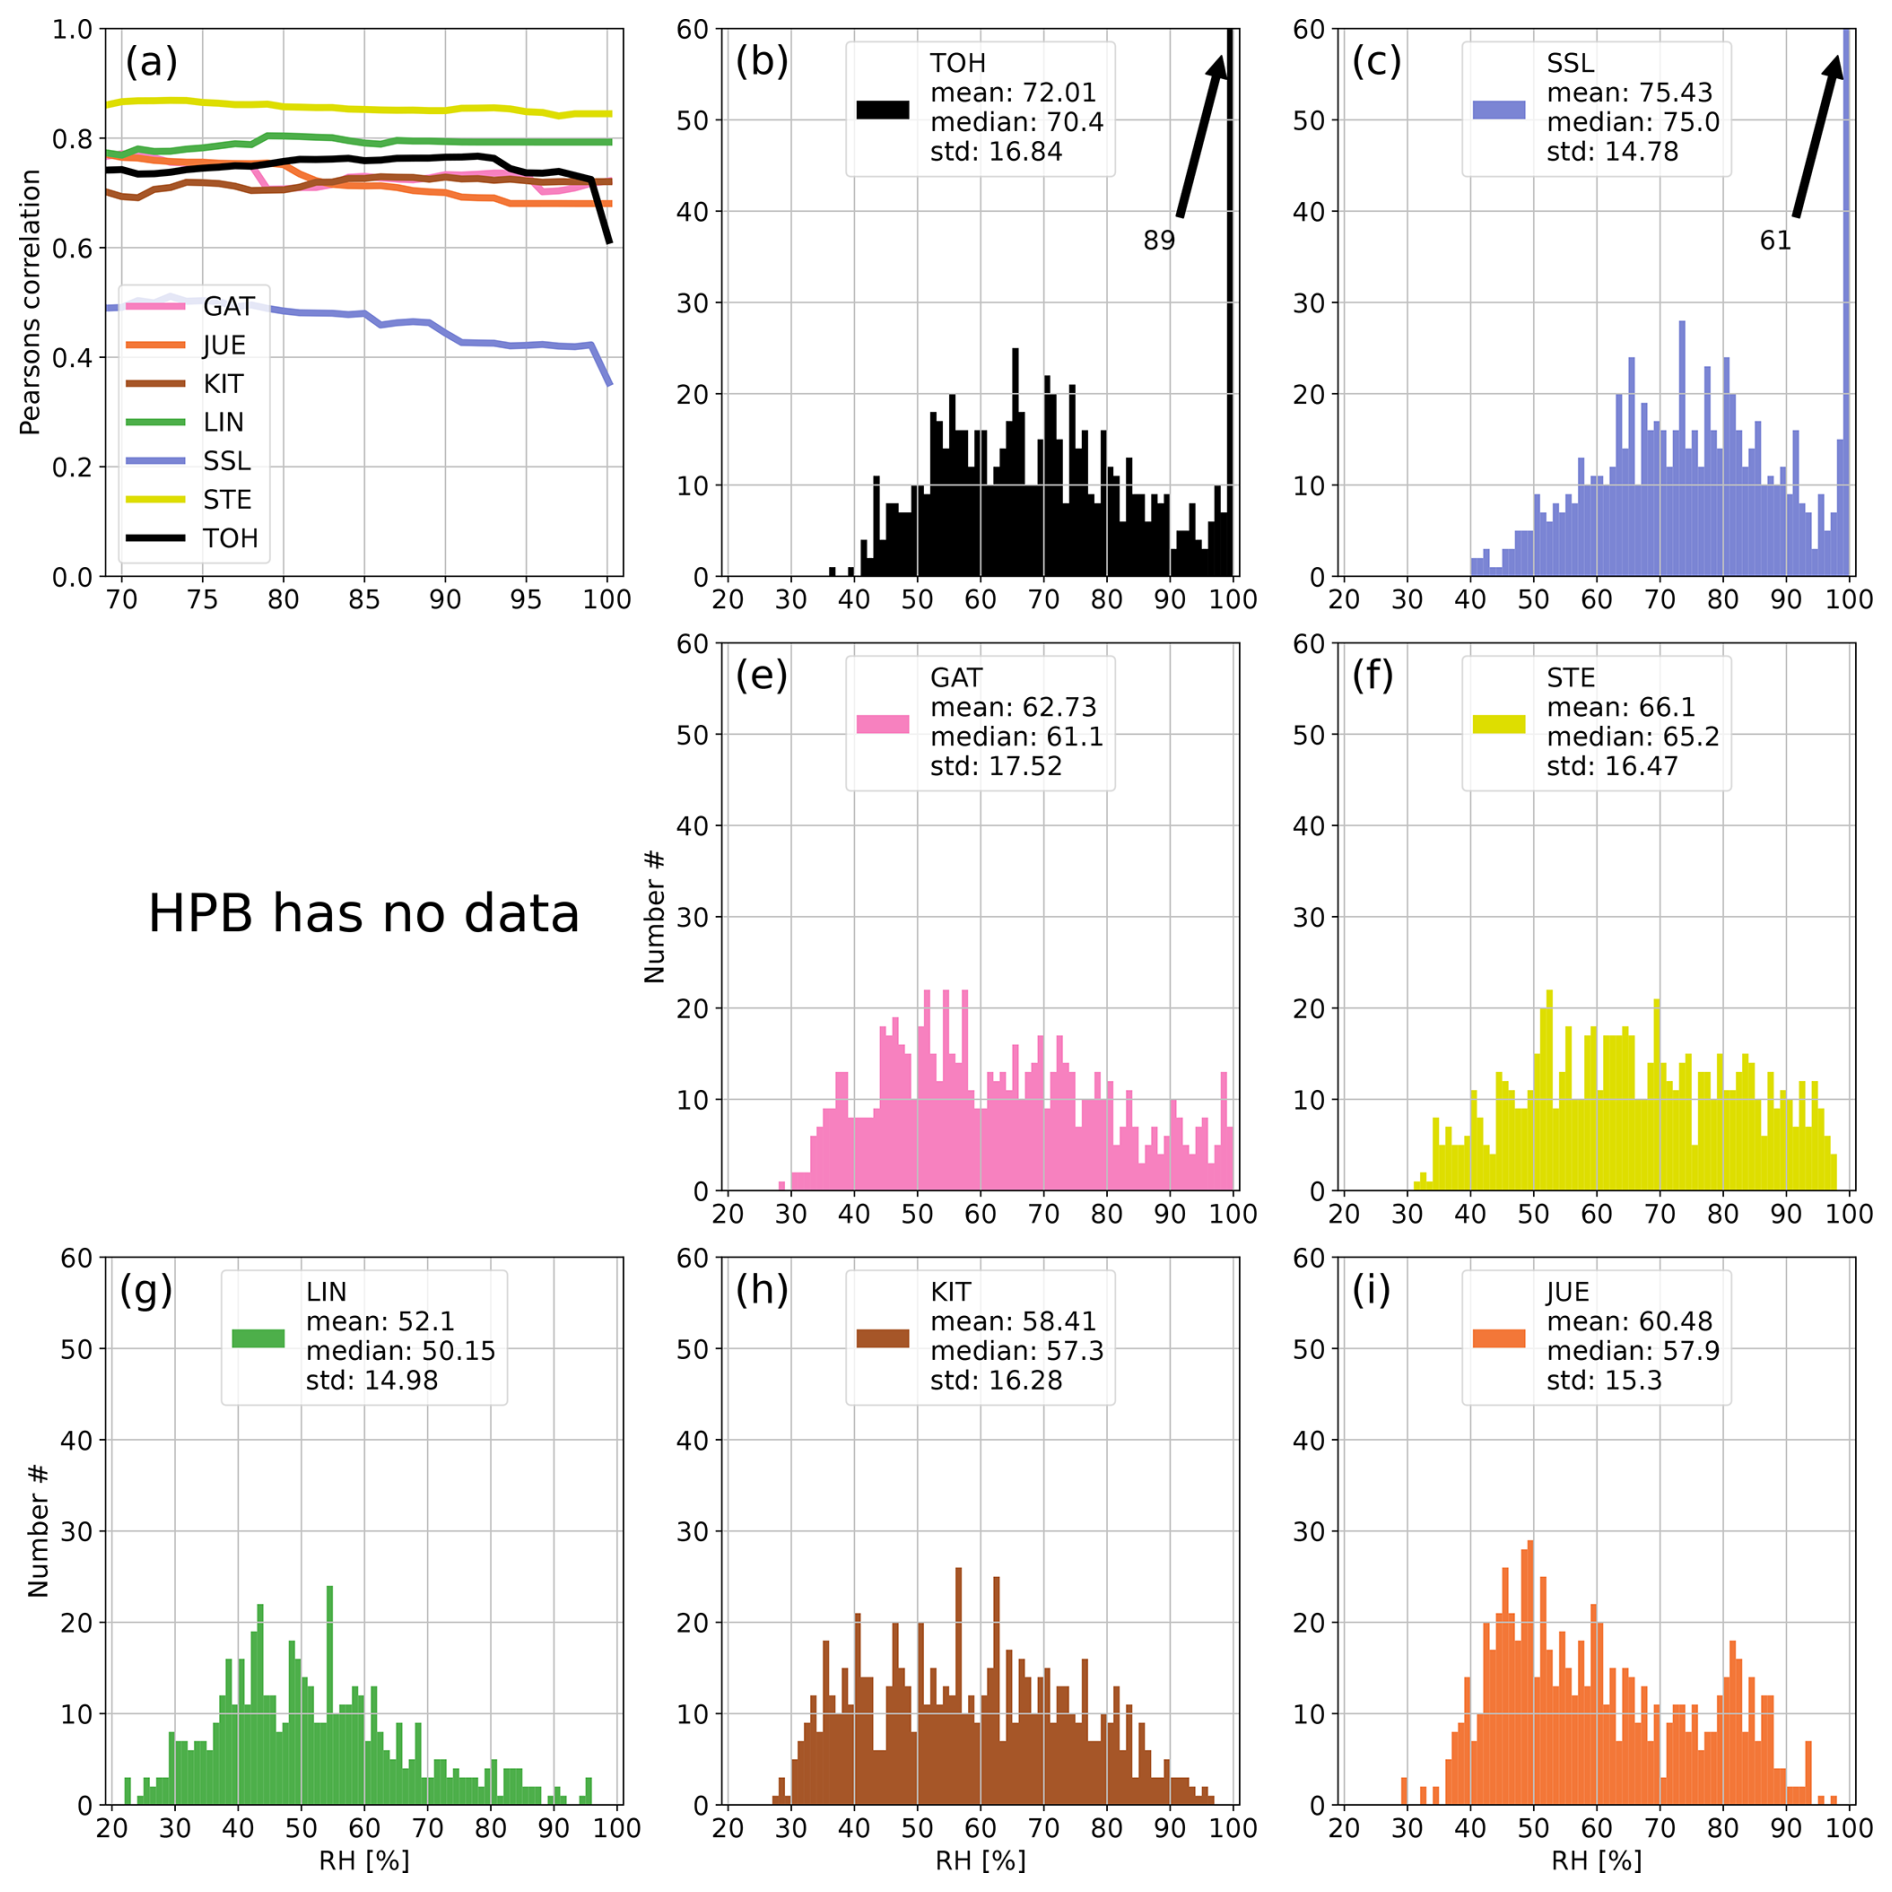
Figure A5Panel (a) shows the development of the correlation coefficient between 214Po observations and simulated 222Rn data at all German ICOS stations if data with increasing RH are successively included in the calculation of the correlation. Panels (b)–(i) show the distributions of hourly RH values at the stations of the network. The arrows with numbers indicate values that exceed the y-axis range (usually for high RH). For each station the correlation coefficient was calculated only if the number of filtered data points was higher than 10 % of all values for the given month to avoid the stochastic behavior of the curves in the first subplot associated with small datasets. May 2022.
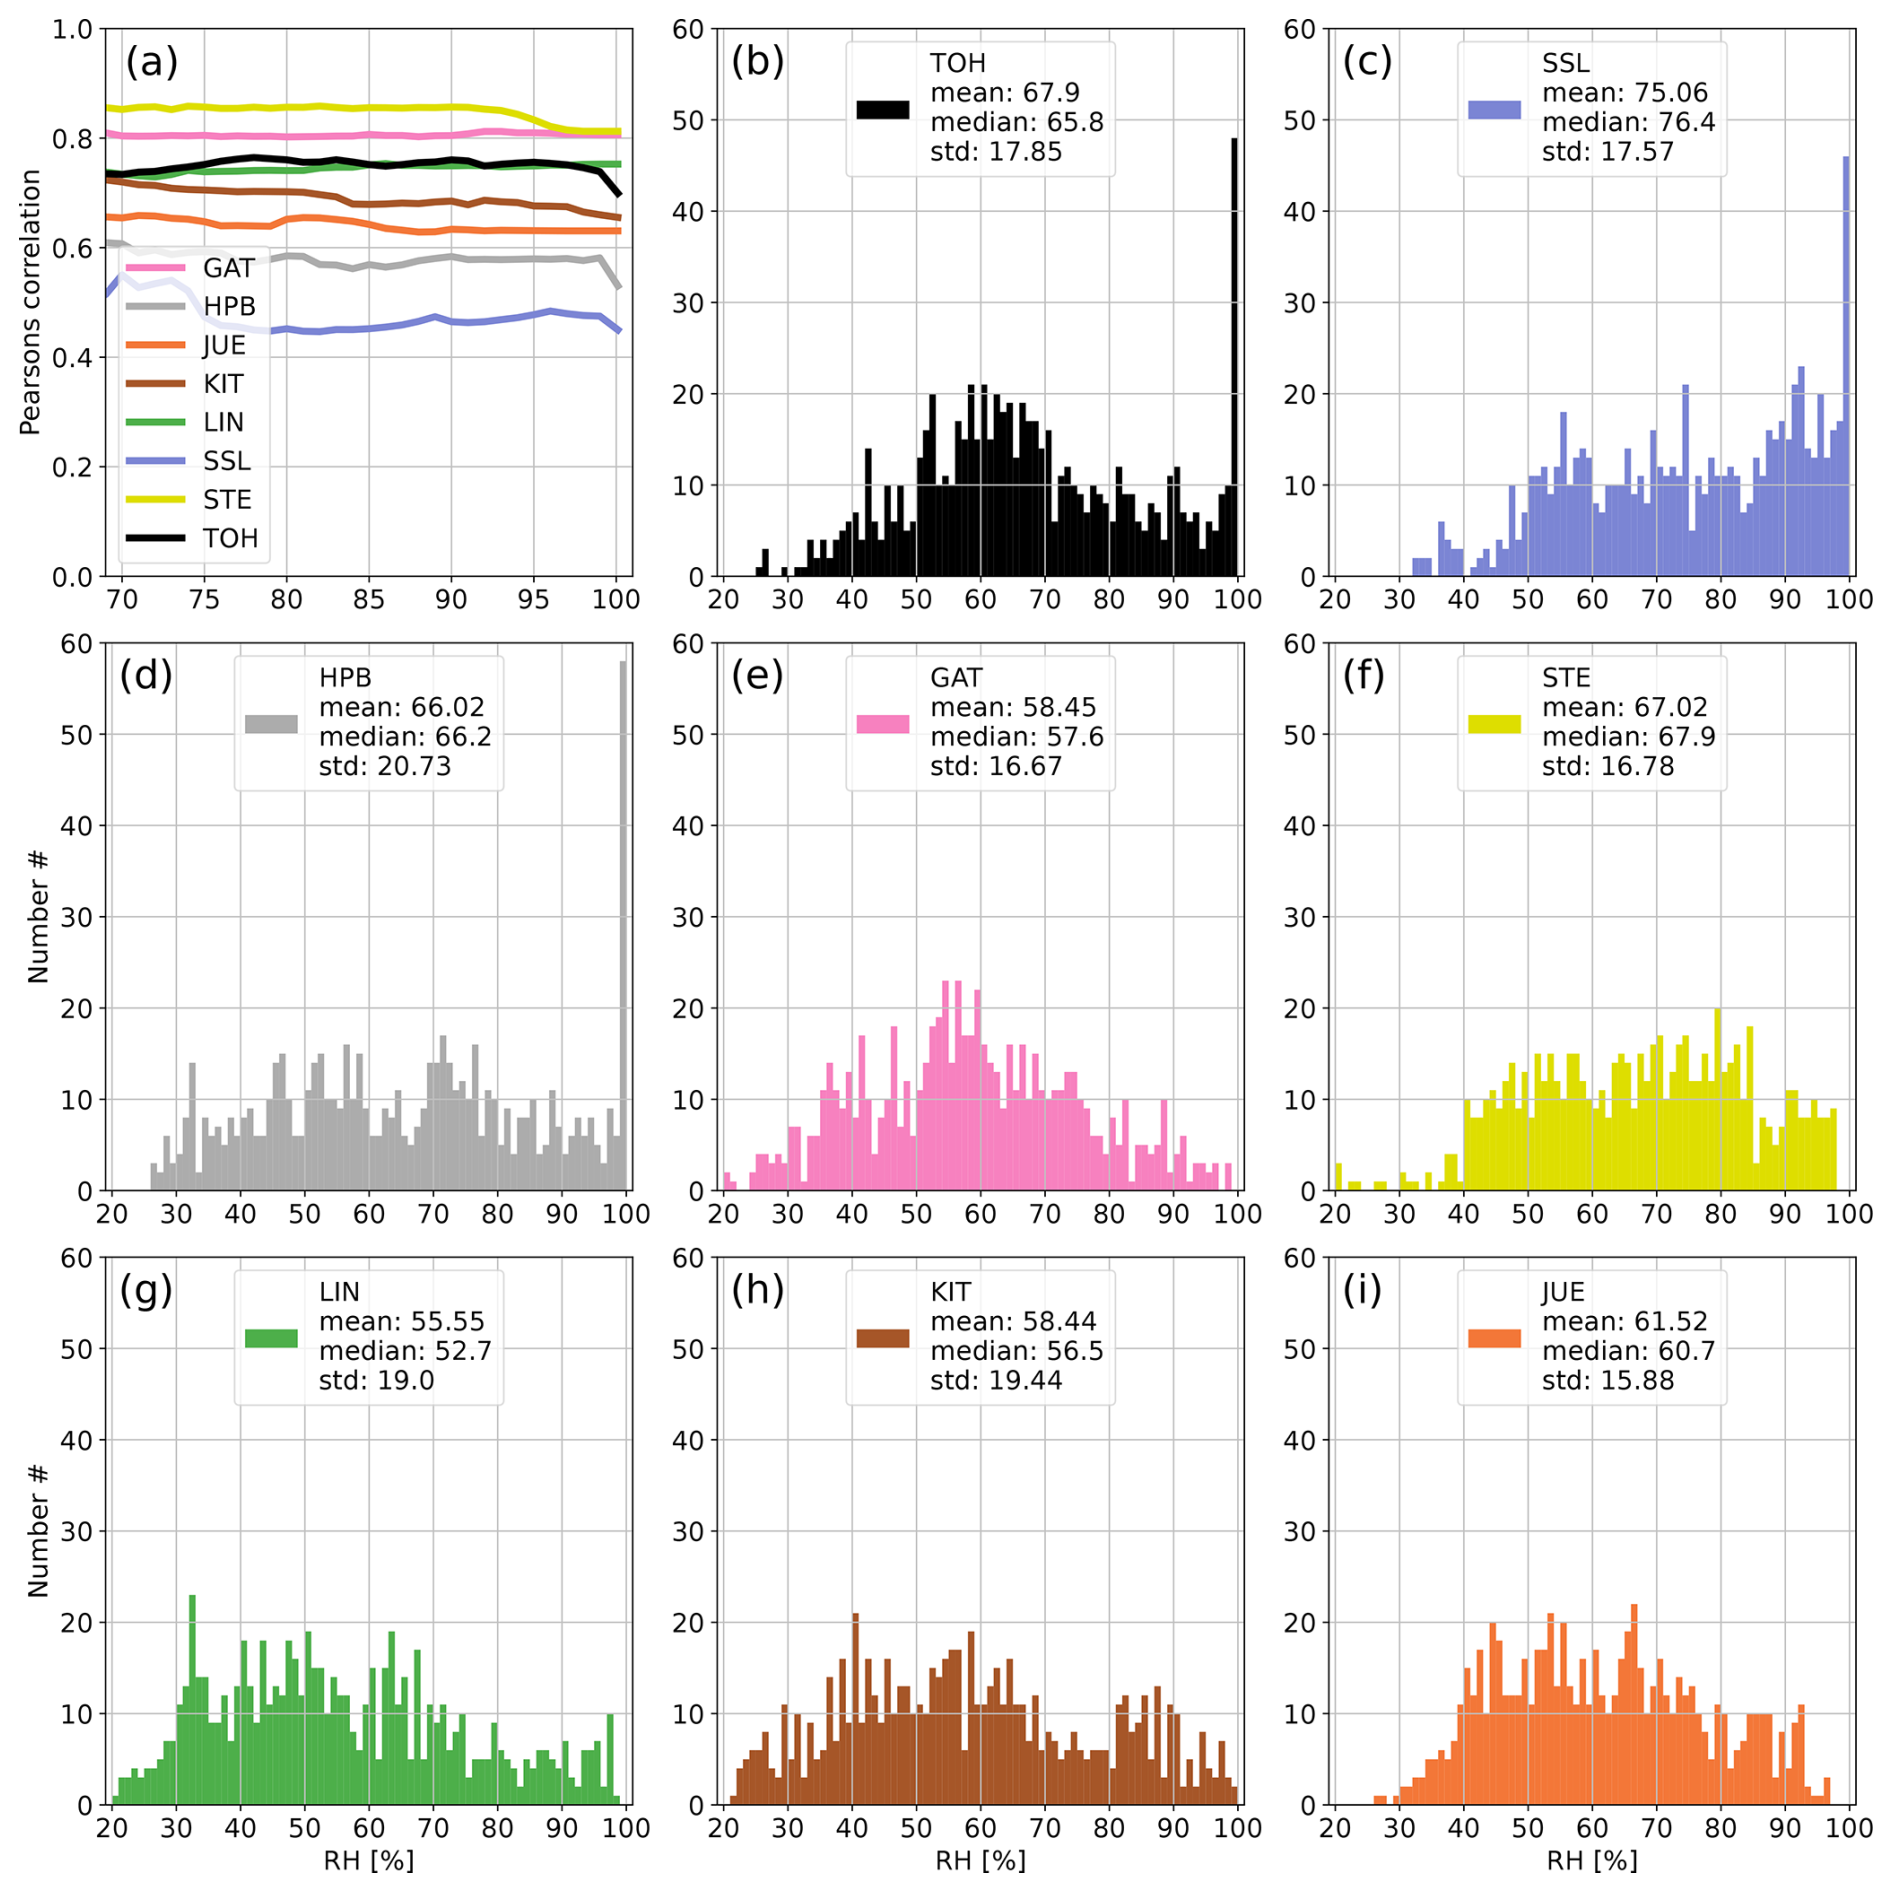
Figure A6Panel (a) shows the development of the correlation coefficient between 214Po observations and simulated 222Rn data at all German ICOS stations if data with increasing RH are successively included in the calculation of the correlation. Panels (b)–(i) show the distributions of hourly RH values at the stations of the network. The arrows with numbers indicate values that exceed the y-axis range (usually for high RH). For each station the correlation coefficient was calculated only if the number of filtered data points was higher than 10 % of all values for the given month to avoid the stochastic behavior of the curves in the first subplot associated with small datasets. June 2022.
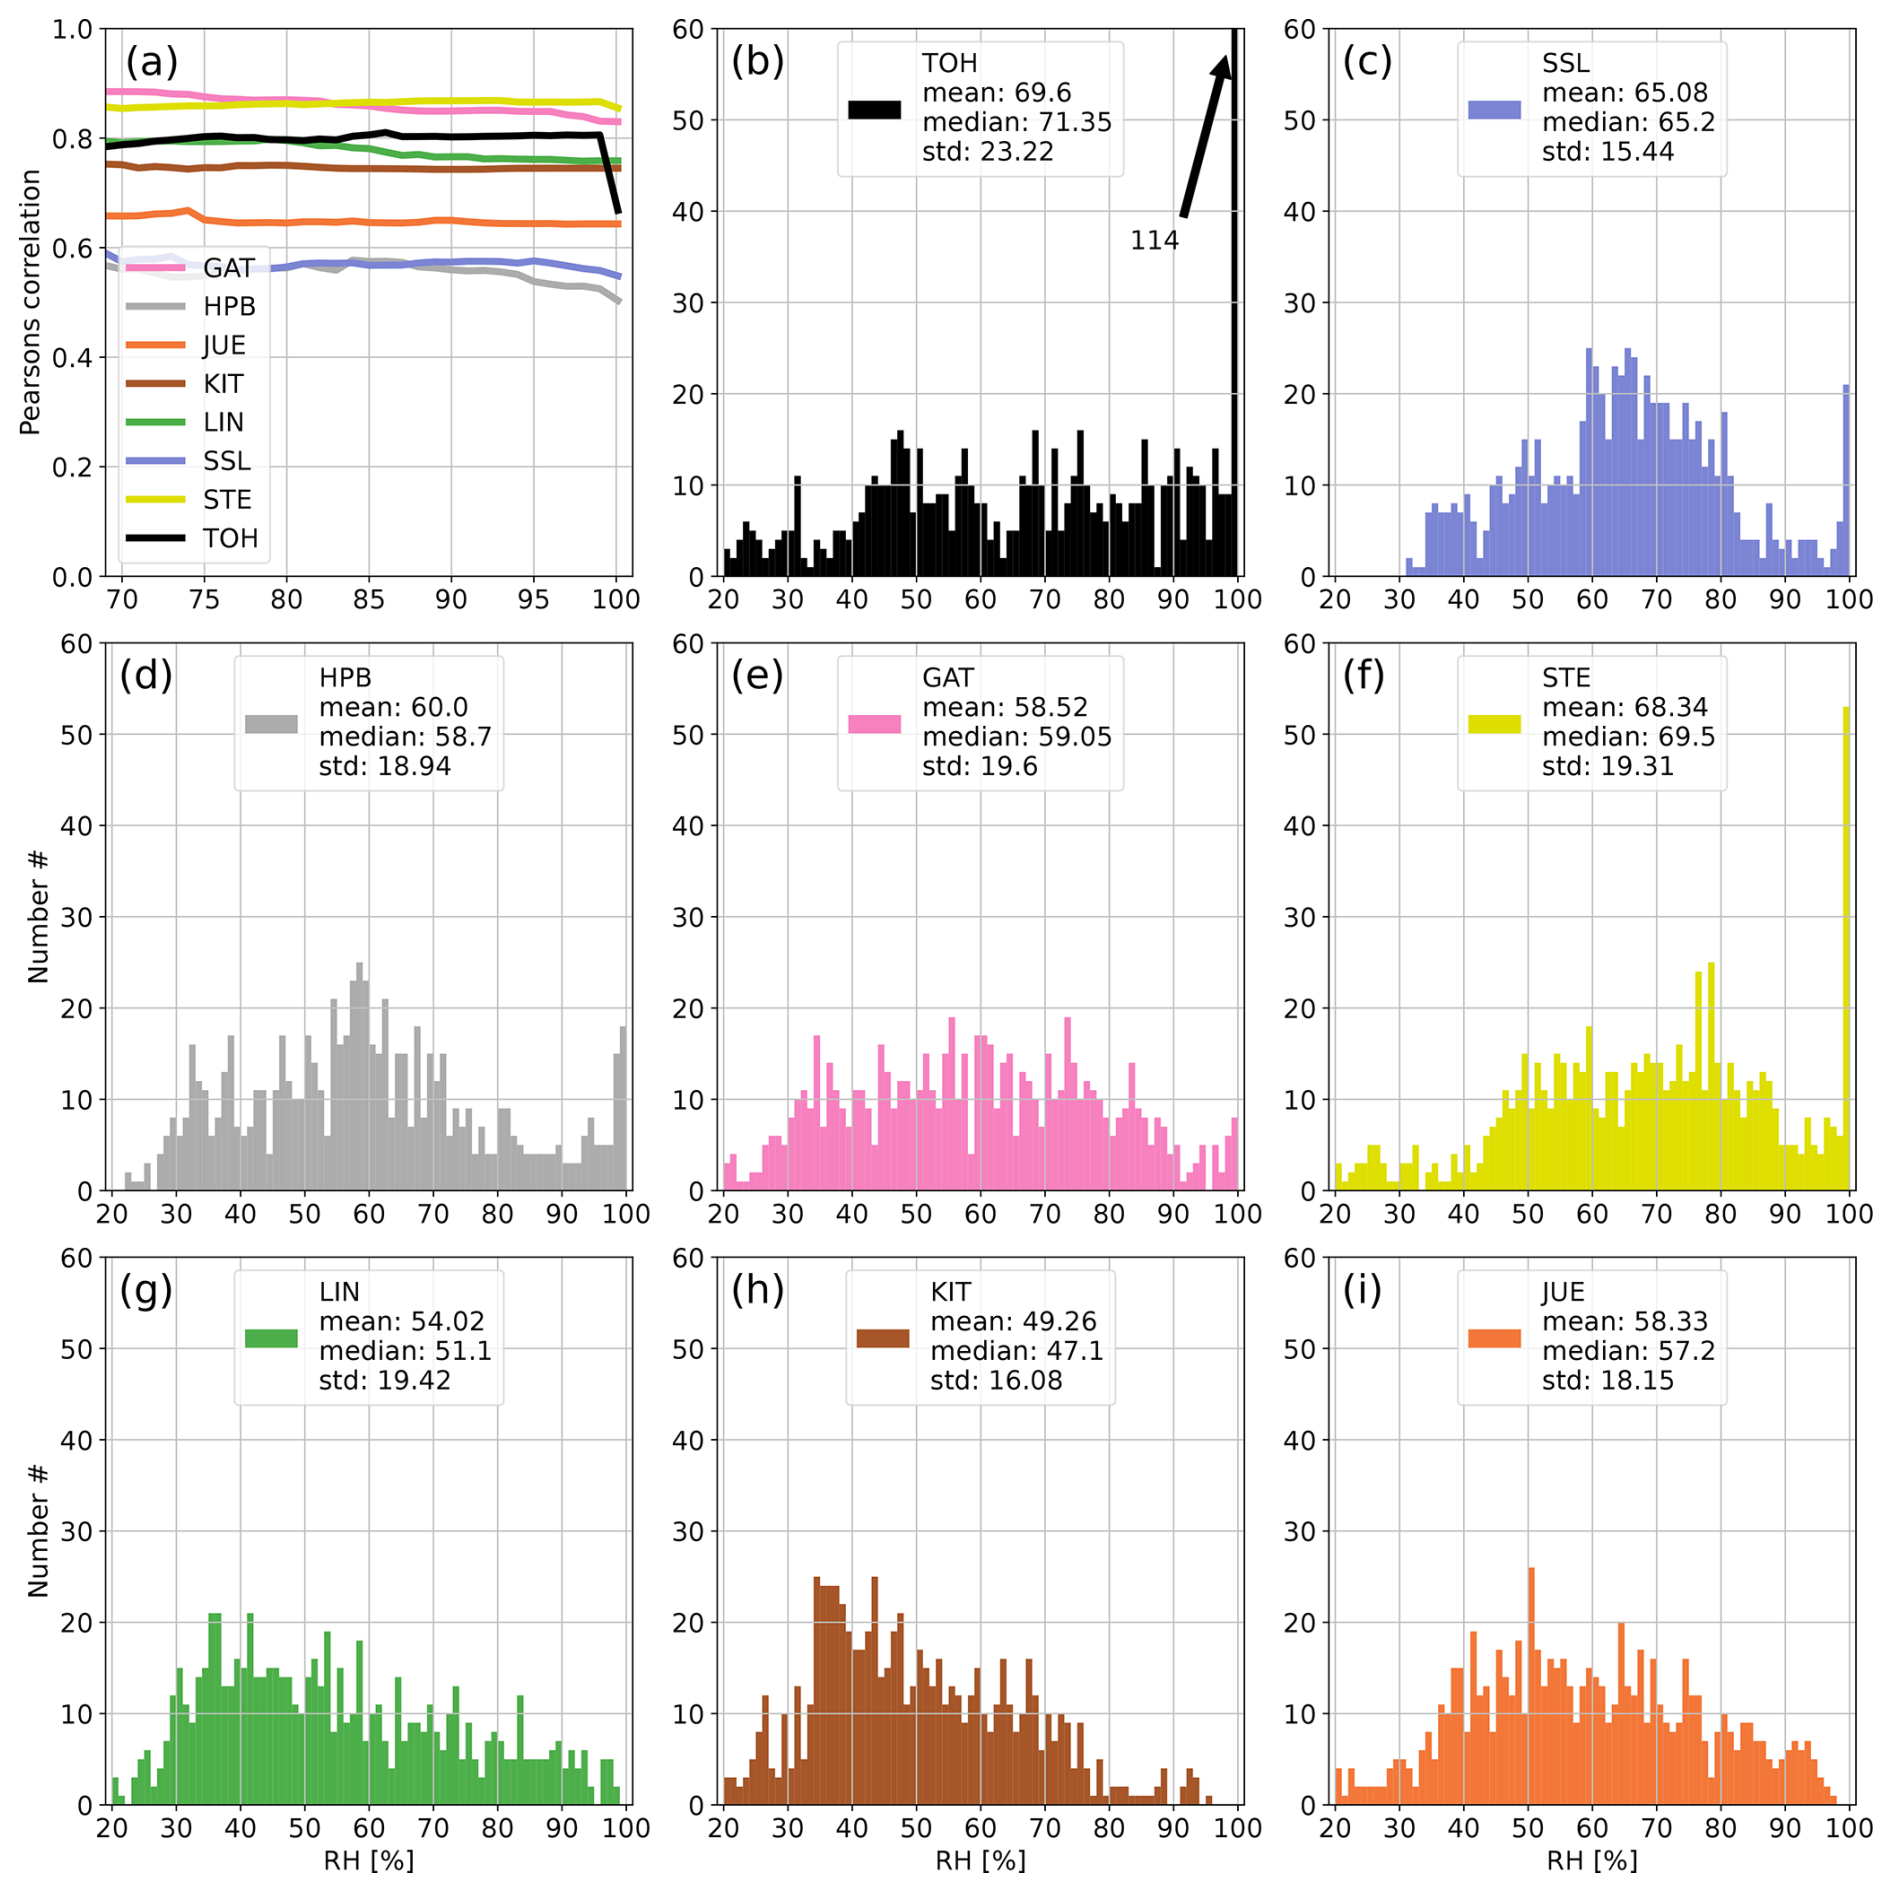
Figure A7Panel (a) shows the development of the correlation coefficient between 214Po observations and simulated 222Rn data at all German ICOS stations if data with increasing RH are successively included in the calculation of the correlation. Panels (b)–(i) show the distributions of hourly RH values at the stations of the network. The arrows with numbers indicate values that exceed the y-axis range (usually for high RH). For each station the correlation coefficient was calculated only if the number of filtered data points was higher than 10 % of all values for the given month to avoid the stochastic behavior of the curves in the first subplot associated with small datasets. July 2022.
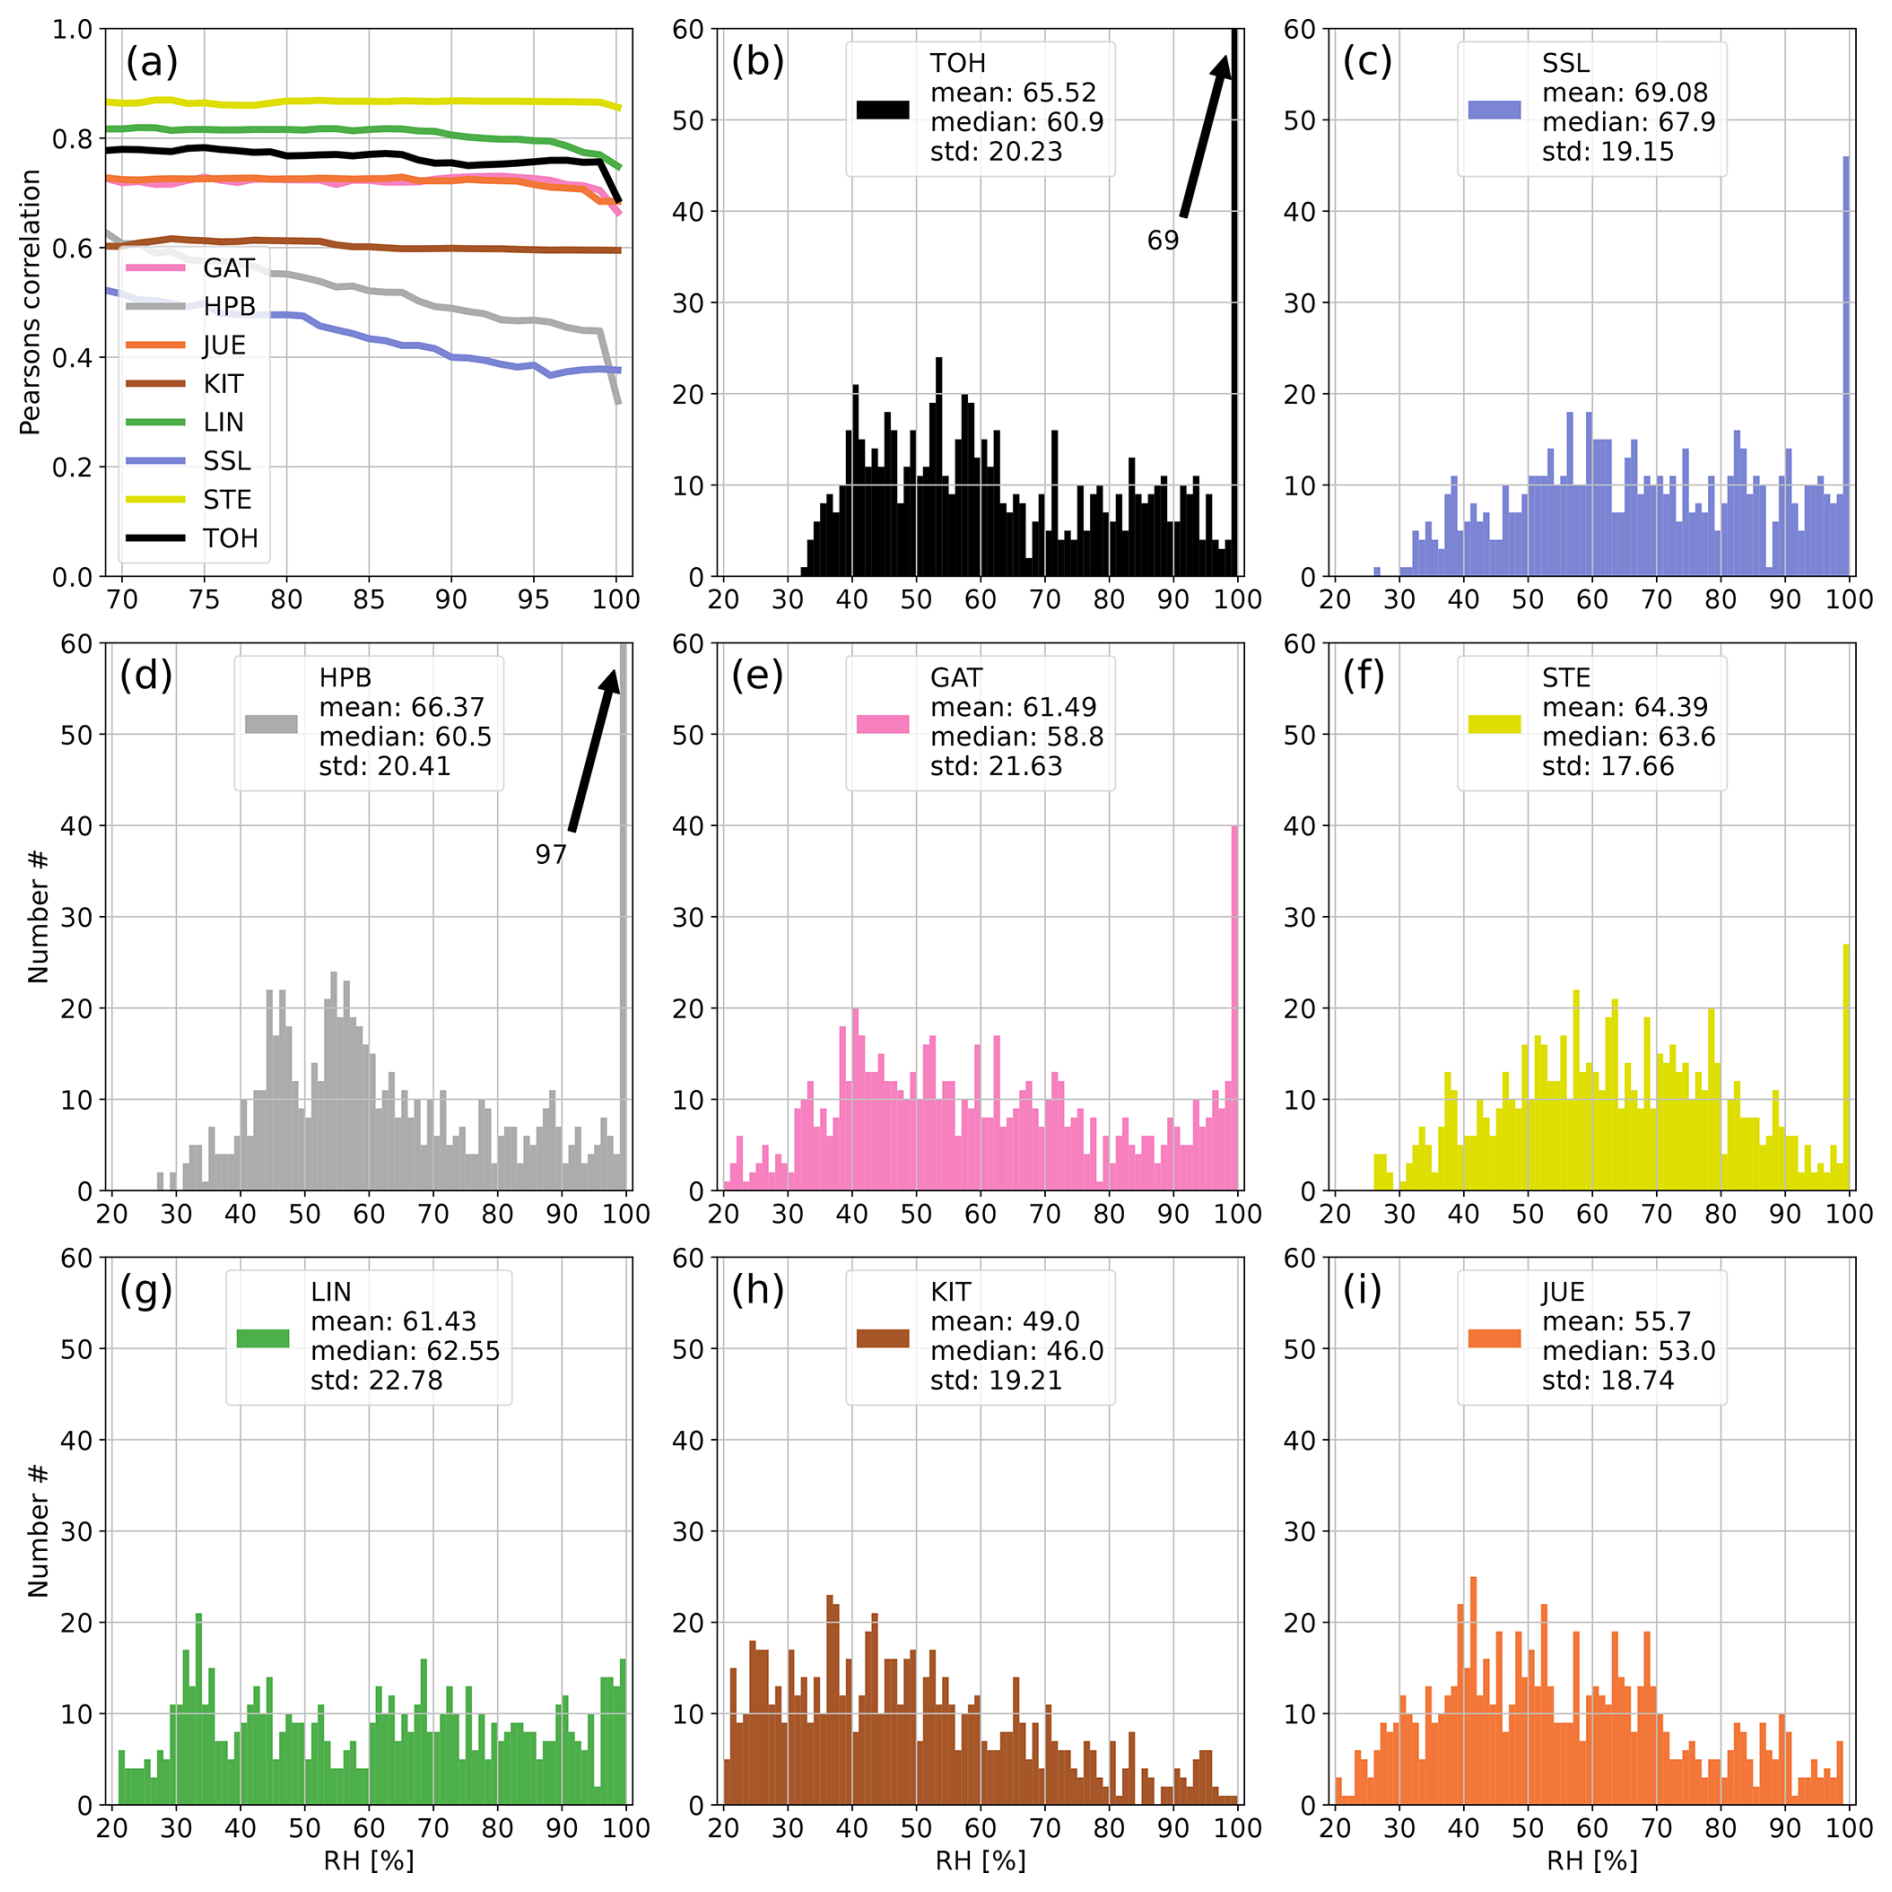
Figure A8Panel (a) shows the development of the correlation coefficient between 214Po observations and simulated 222Rn data at all German ICOS stations if data with increasing RH are successively included in the calculation of the correlation. Panels (b)–(i) show the distributions of hourly RH values at the stations of the network. The arrows with numbers indicate values that exceed the y-axis range (usually for high RH). For each station the correlation coefficient was calculated only if the number of filtered data points was higher than 10 % of all values for the given month to avoid the stochastic behavior of the curves in the first subplot associated with small datasets. August 2022.
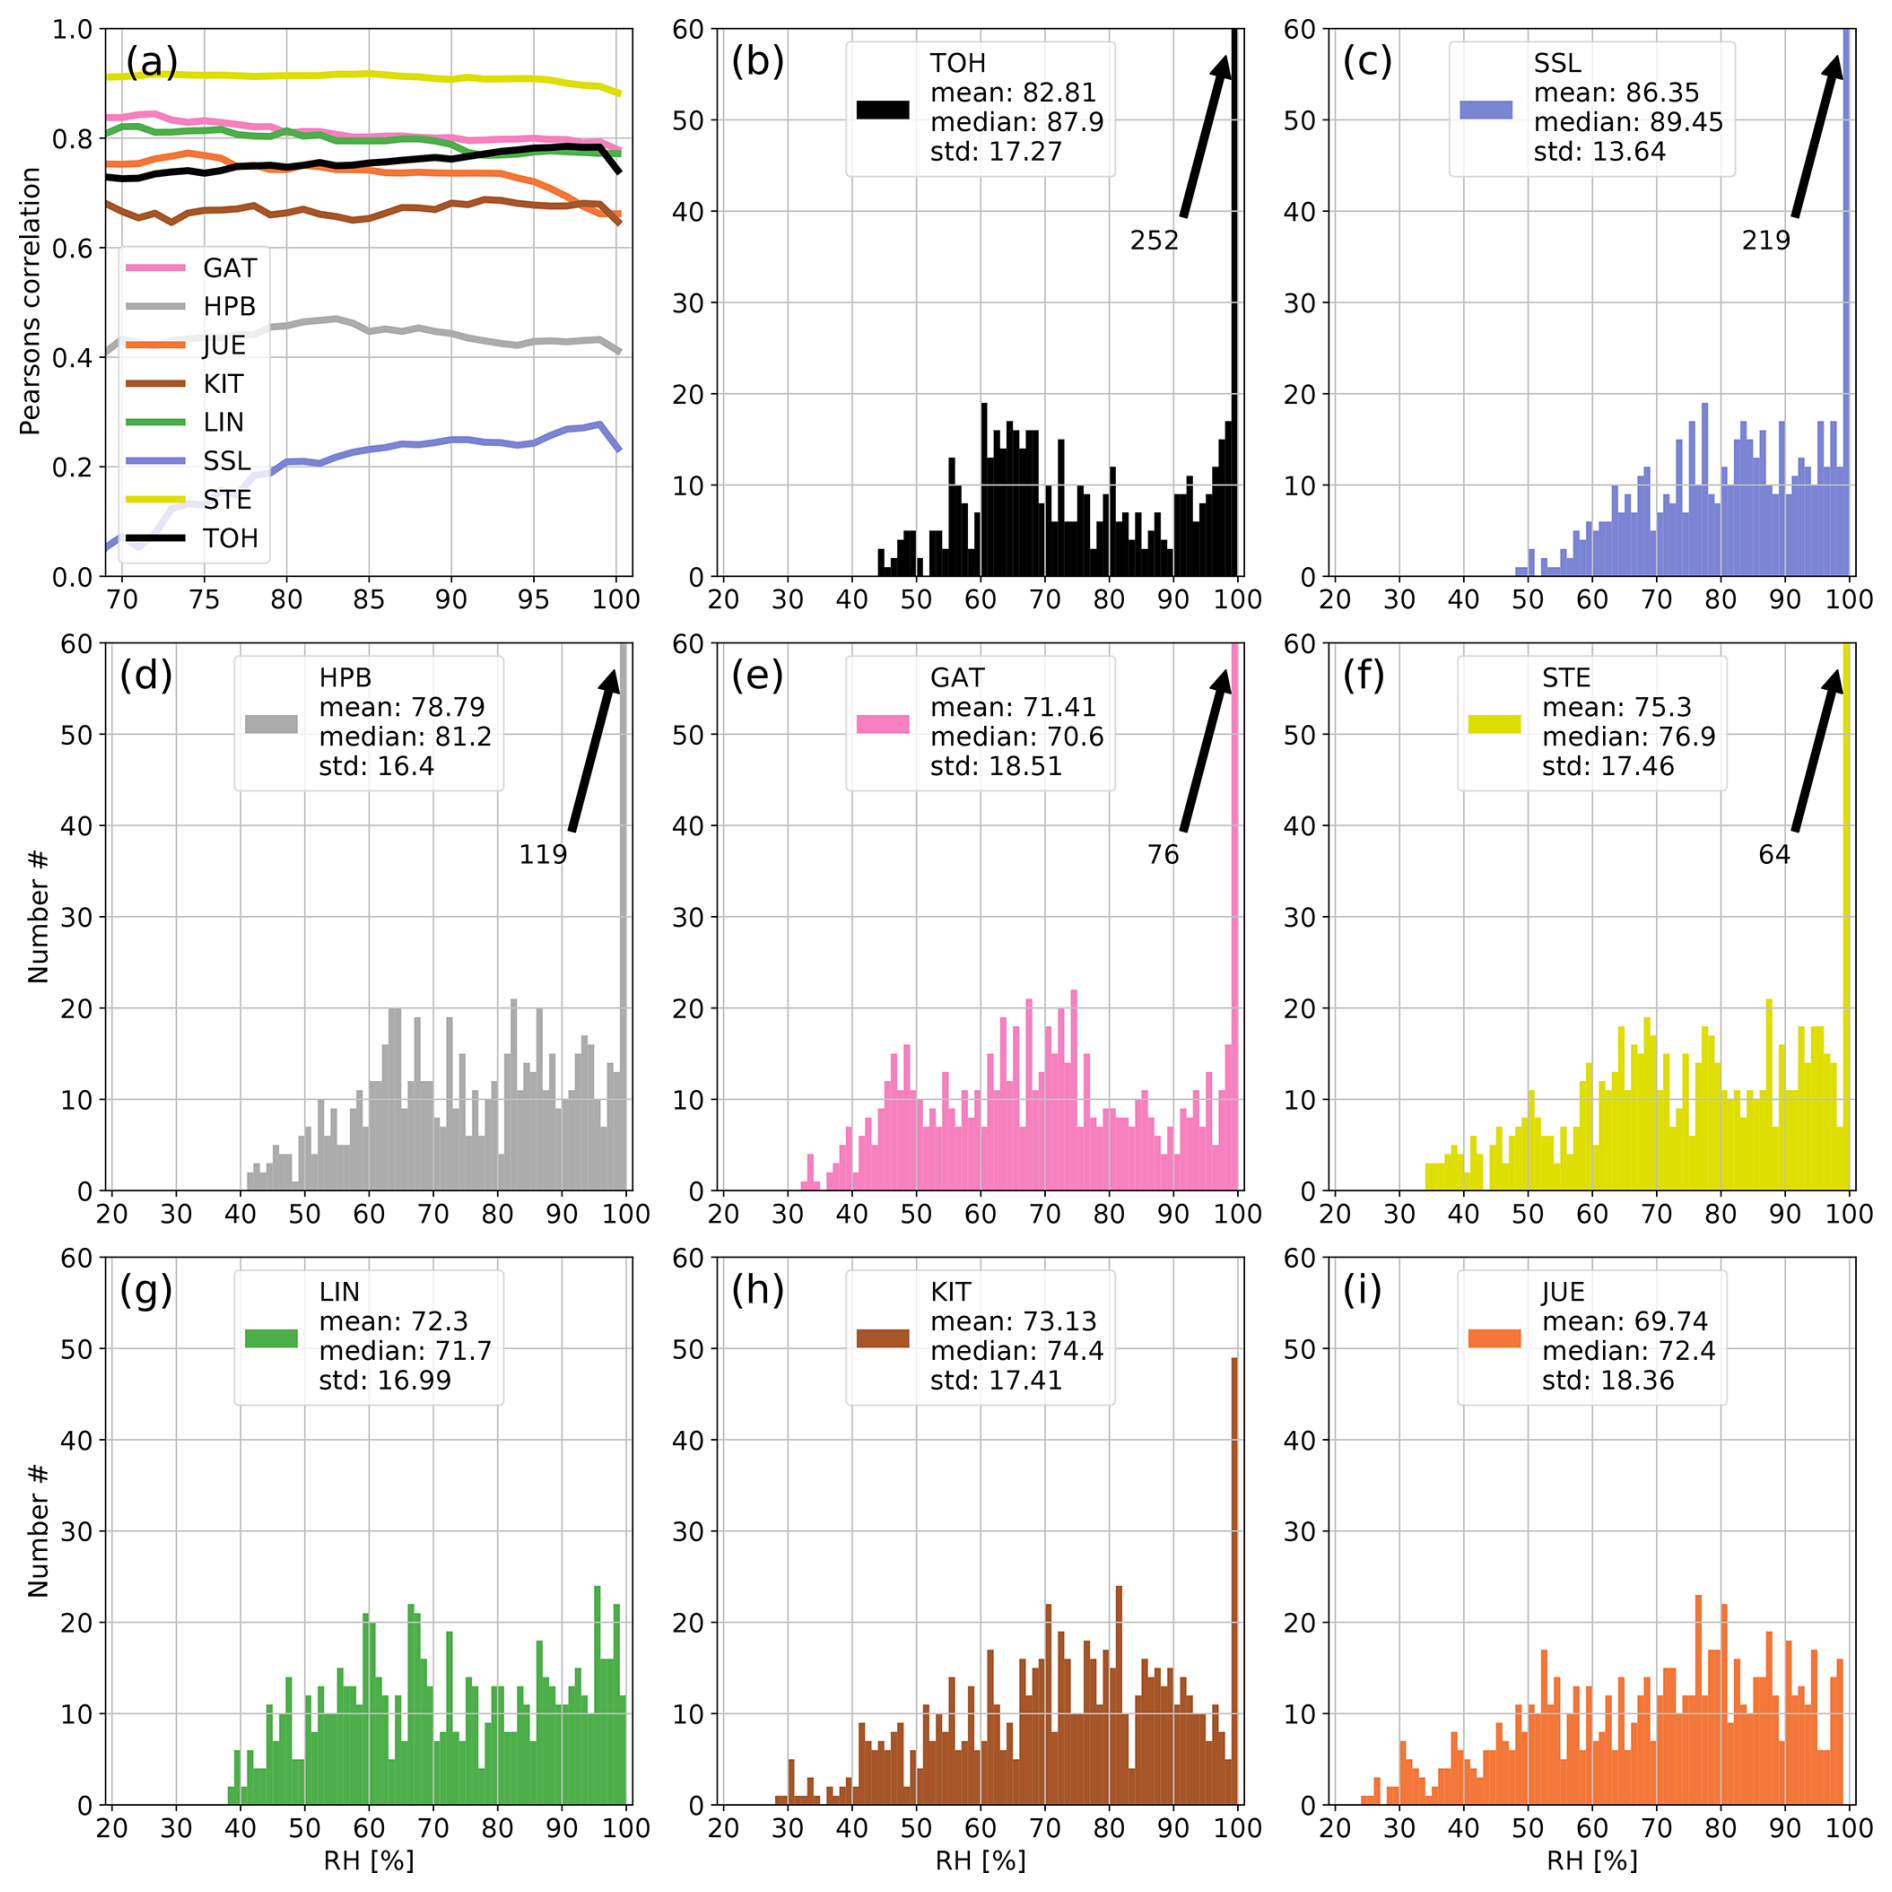
Figure A9Panel (a) shows the development of the correlation coefficient between 214Po observations and simulated 222Rn data at all German ICOS stations if data with increasing RH are successively included in the calculation of the correlation. Panels (b)–(i) show the distributions of hourly RH values at the stations of the network. The arrows with numbers indicate values that exceed the y-axis range (usually for high RH). For each station the correlation coefficient was calculated only if the number of filtered data points was higher than 10 % of all values for the given month to avoid the stochastic behavior of the curves in the first subplot associated with small datasets. September 2022.
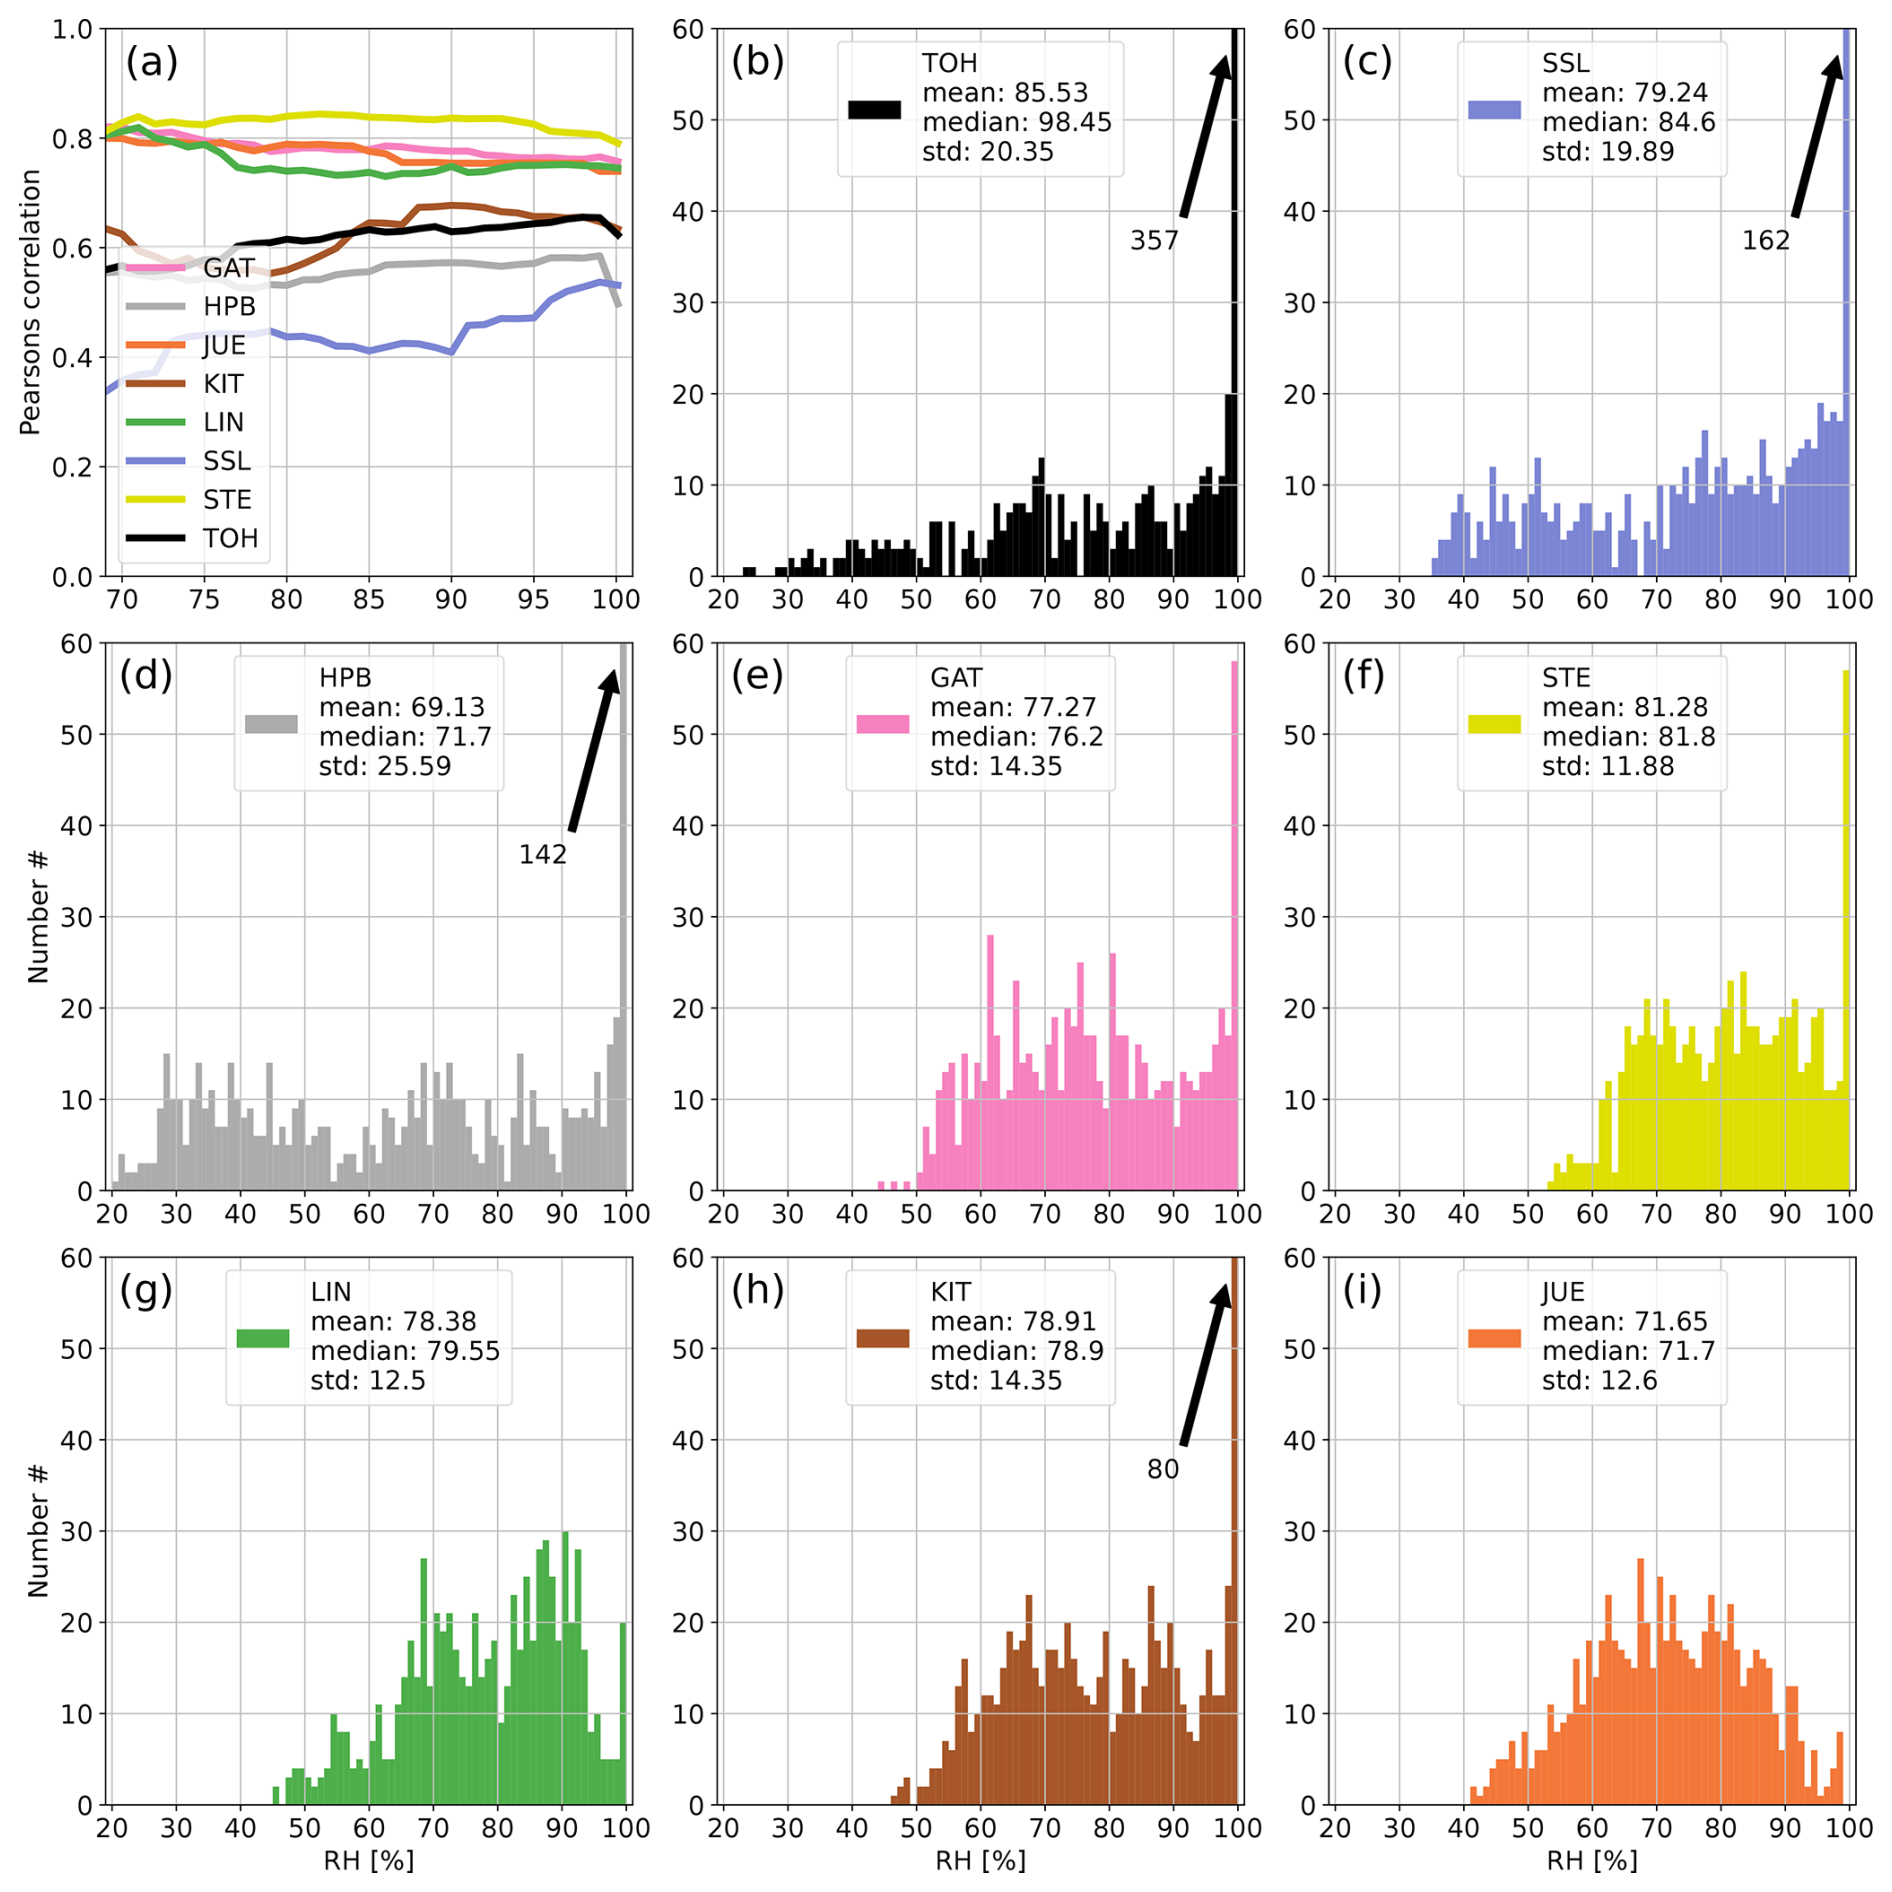
Figure A10Panel (a) shows the development of the correlation coefficient between 214Po observations and simulated 222Rn data at all German ICOS stations if data with increasing RH are successively included in the calculation of the correlation. Panels (b)–(i) show the distributions of hourly RH values at the stations of the network. The arrows with numbers indicate values that exceed the y-axis range (usually for high RH). For each station the correlation coefficient was calculated only if the number of filtered data points was higher than 10 % of all values for the given month to avoid the stochastic behavior of the curves in the first subplot associated with small datasets. October 2022.
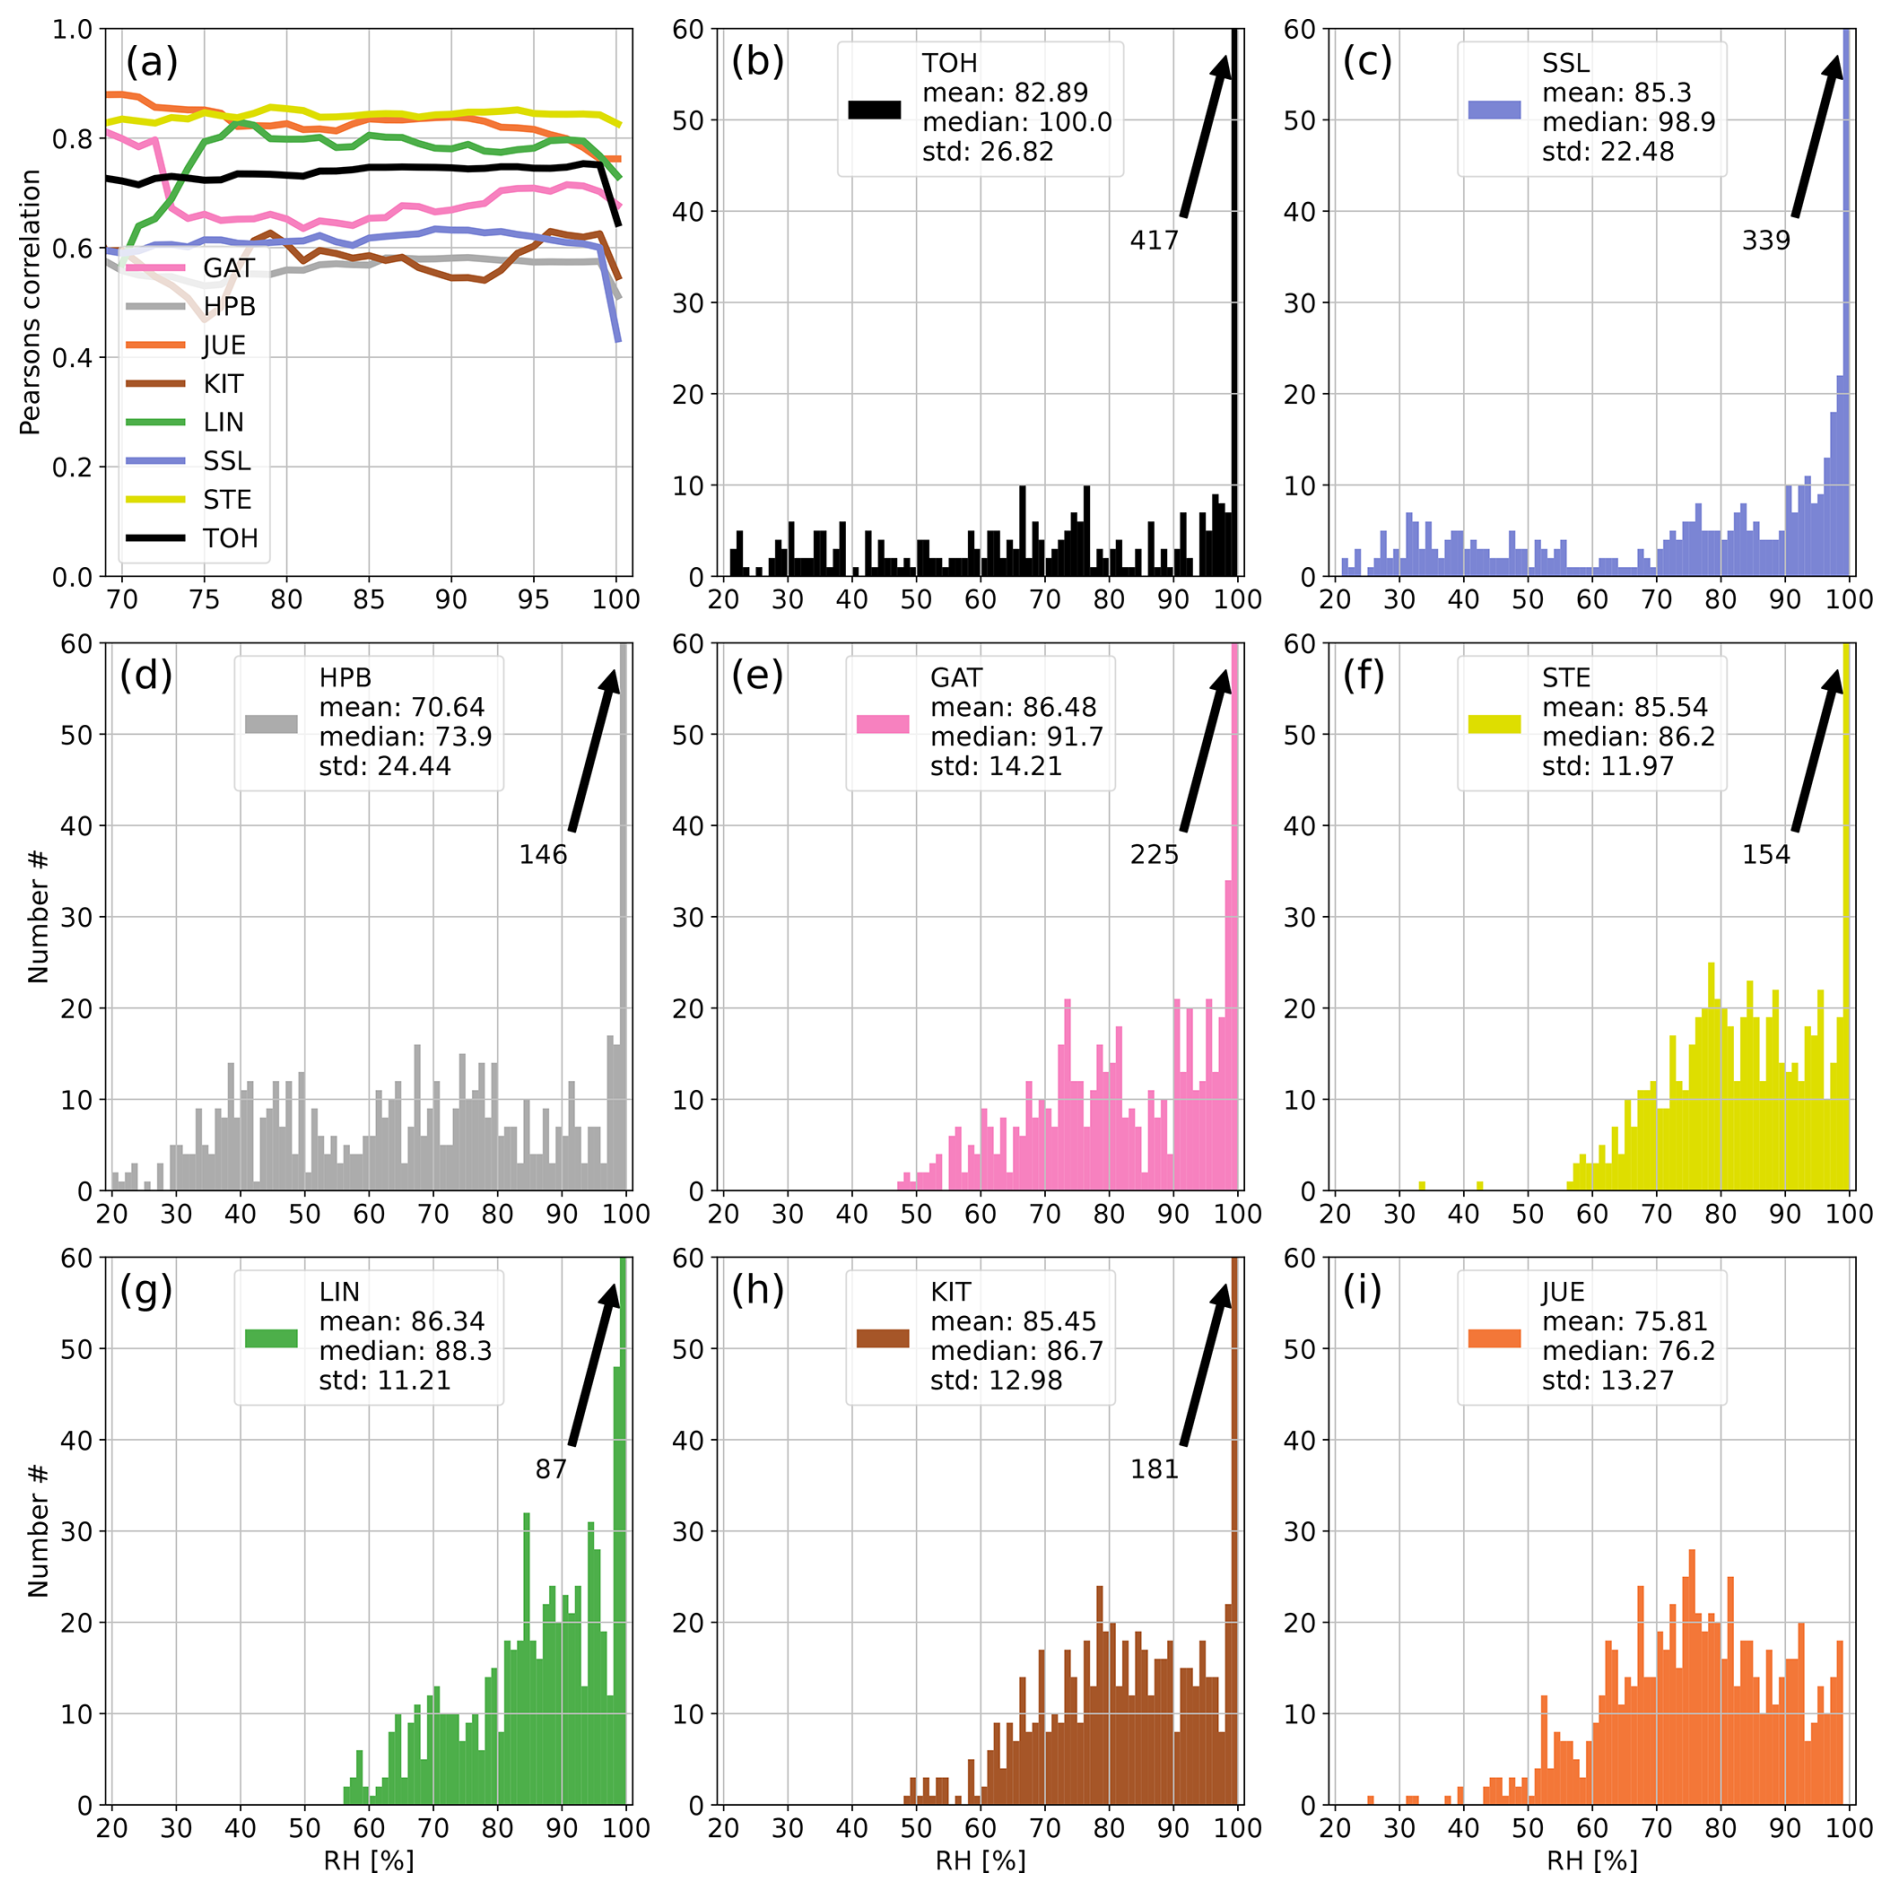
Figure A11Panel (a) shows the development of the correlation coefficient between 214Po observations and simulated 222Rn data at all German ICOS stations if data with increasing RH are successively included in the calculation of the correlation. Panels (b)–(i) show the distributions of hourly RH values at the stations of the network. The arrows with numbers indicate values that exceed the y-axis range (usually for high RH). For each station the correlation coefficient was calculated only if the number of filtered data points was higher than 10 % of all values for the given month to avoid the stochastic behavior of the curves in the first subplot associated with small datasets. November 2022.
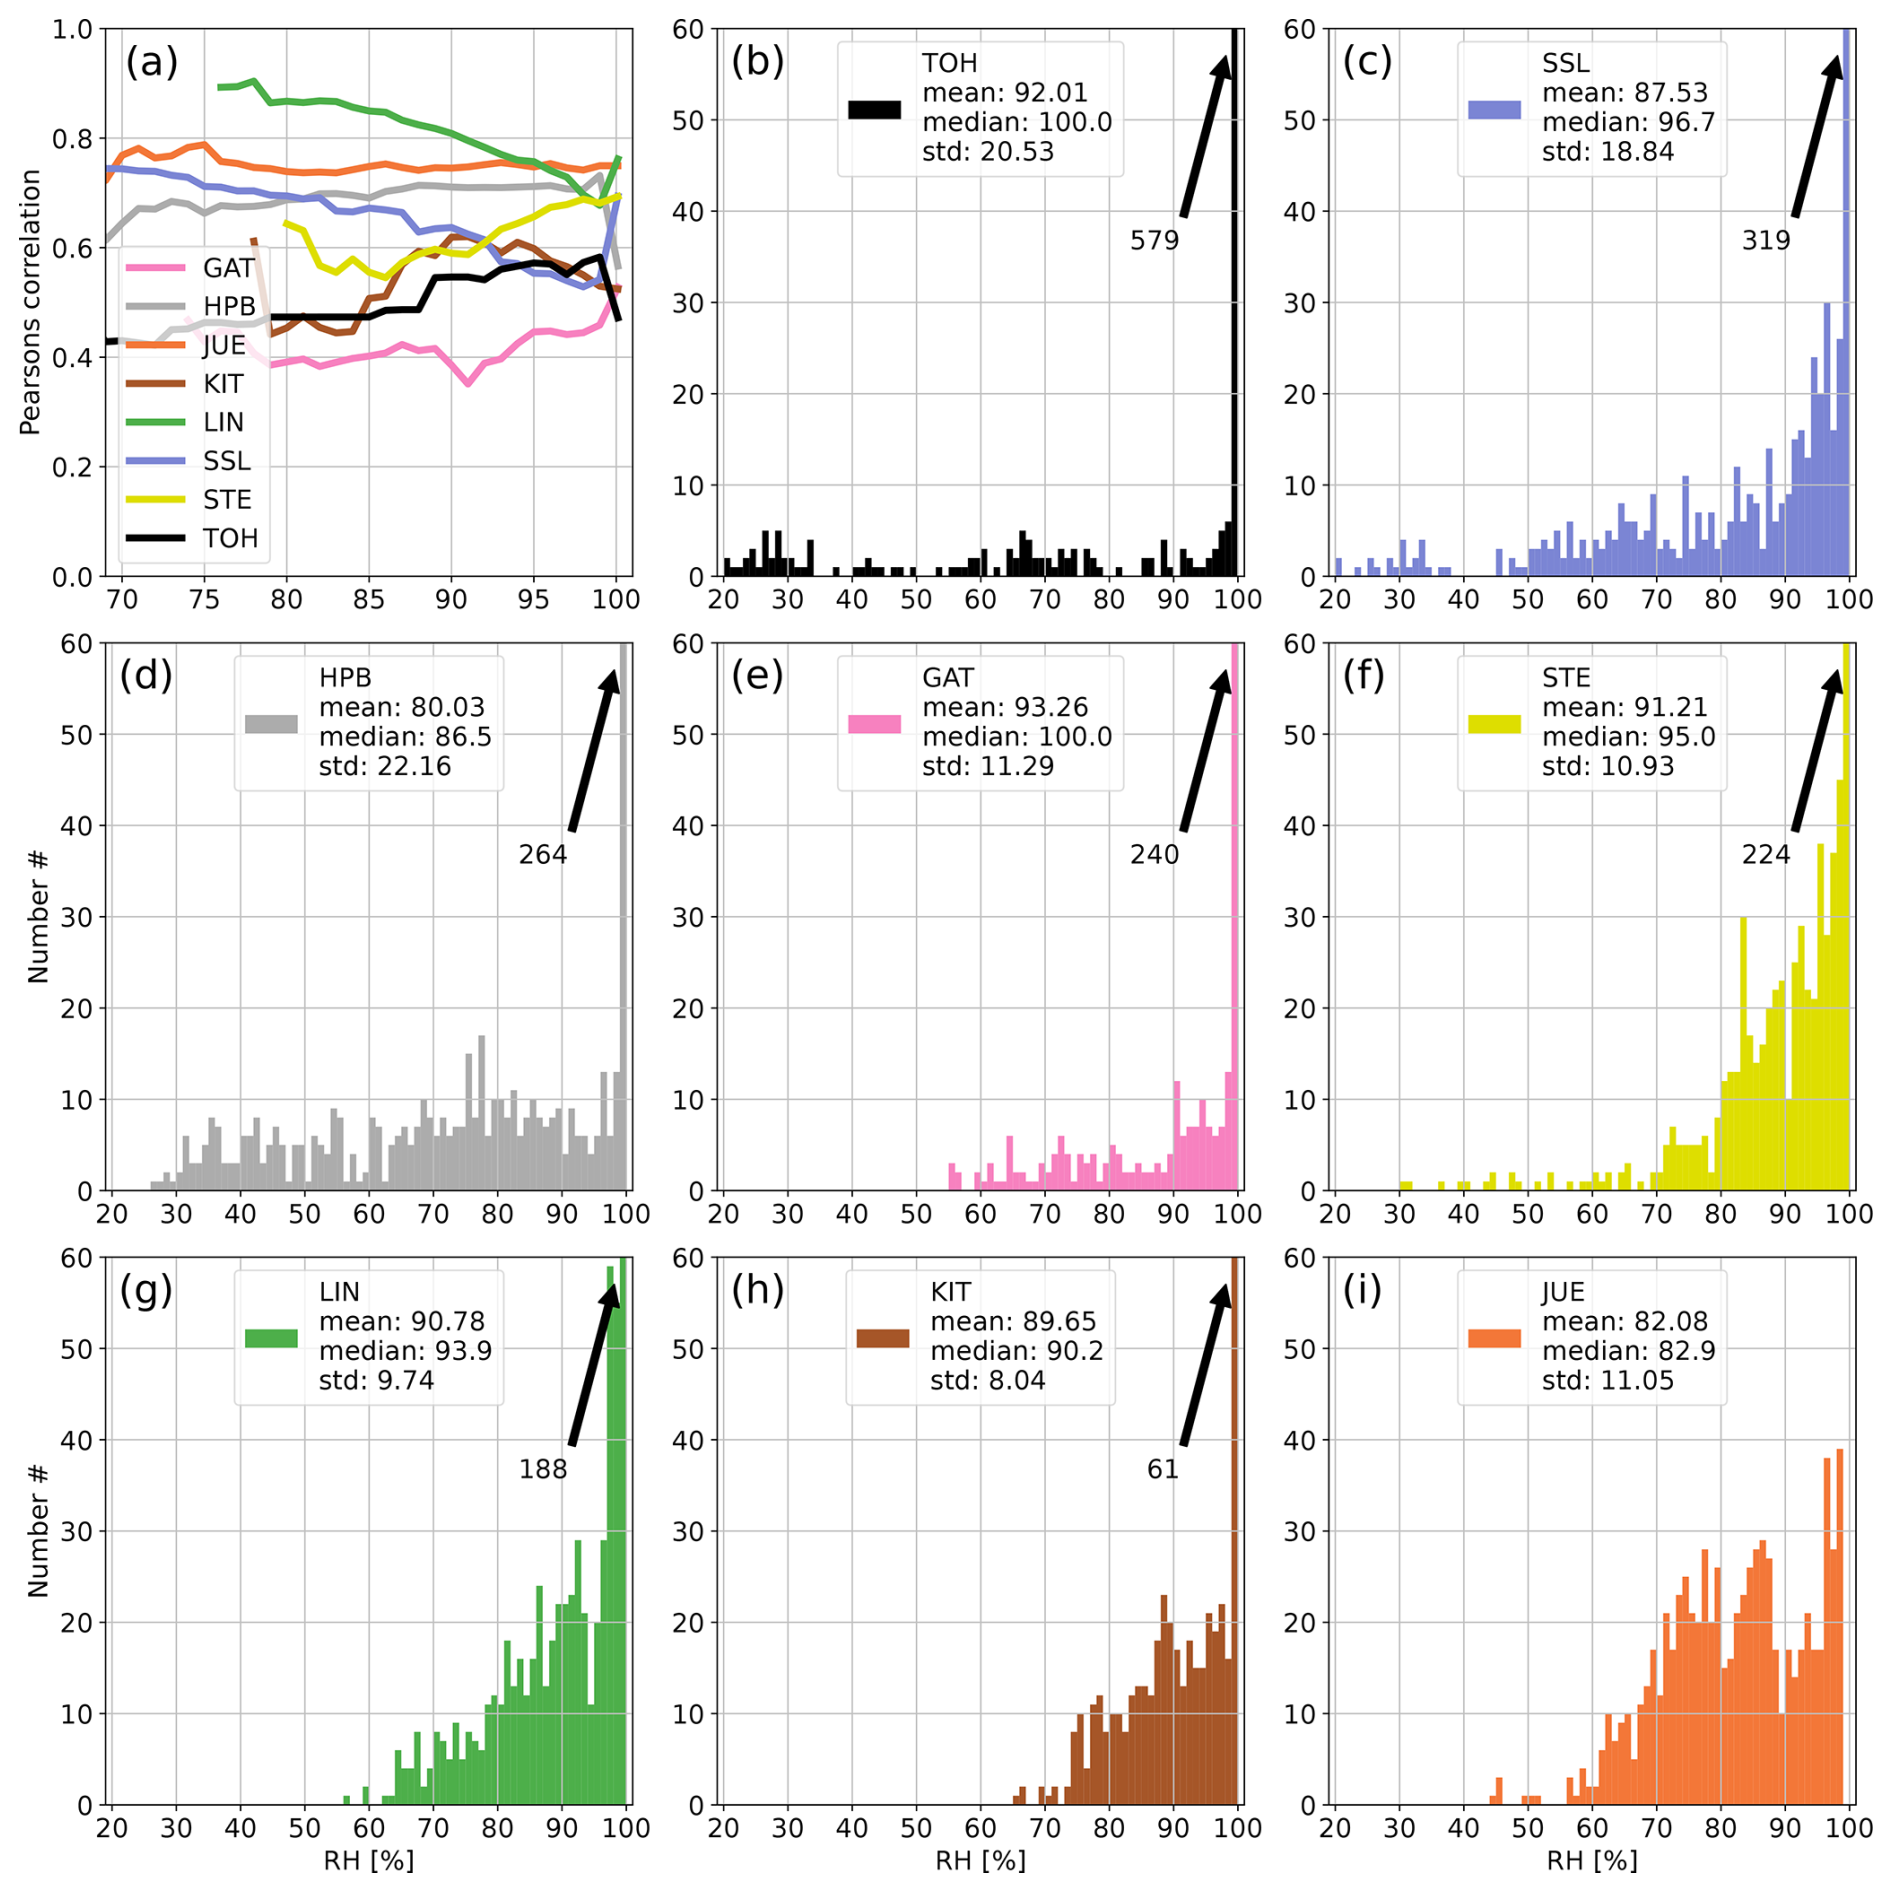
Figure A12Panel (a) shows the development of the correlation coefficient between 214Po observations and simulated 222Rn data at all German ICOS stations if data with increasing RH are successively included in the calculation of the correlation. Panels (b)–(i) show the distributions of hourly RH values at the stations of the network. The arrows with numbers indicate values that exceed the y-axis range (usually for high RH). For each station the correlation coefficient was calculated only if the number of filtered data points was higher than 10 % of all values for the given month to avoid the stochastic behavior of the curves in the first subplot associated with small datasets. December 2022.
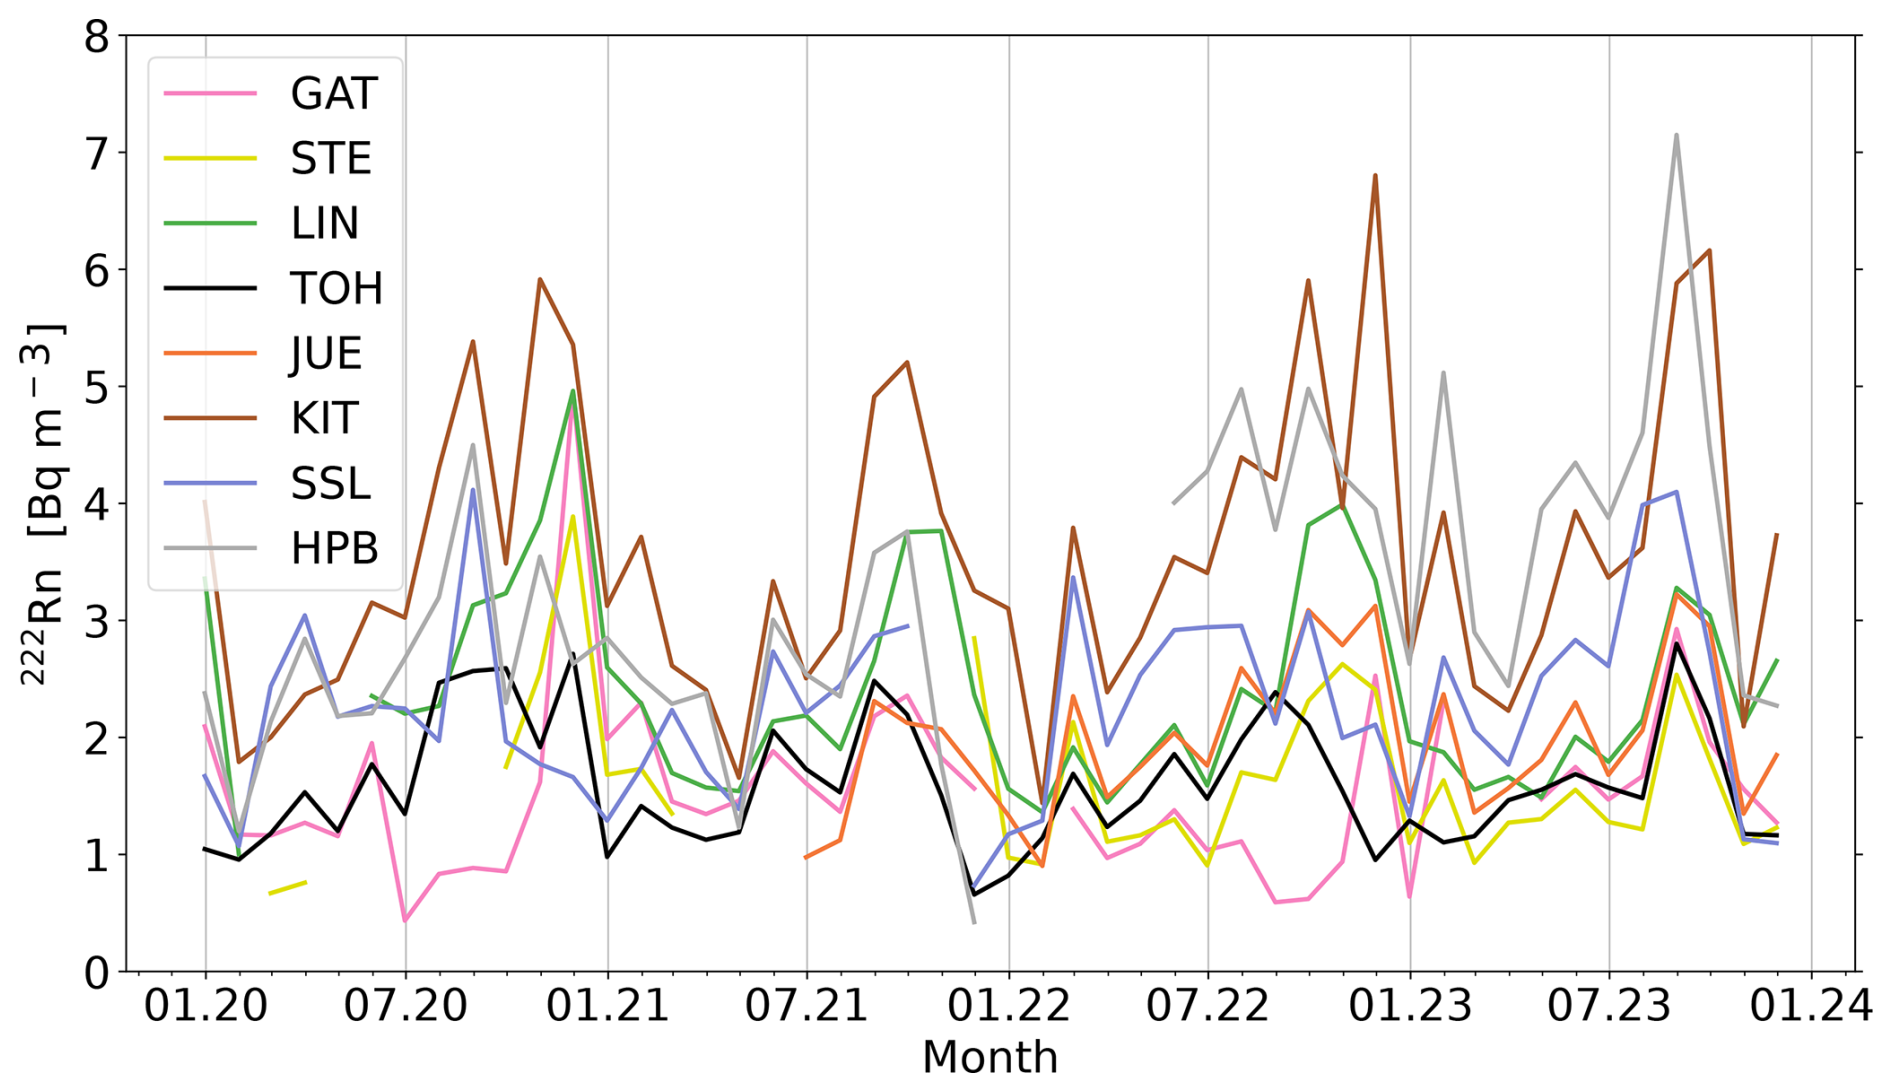
Figure A13Seasonal cycle of 222Rn monthly means at all German stations in the time period of 2020–2023. Note that monthly values are only shown if more than 70 % of the daily mean values were available for the respective month.
MG evaluated all raw data, conducted the relative humidity selection, and prepared the figures. UK made the STILT model runs. BF, ML, DK, and JMW provided the observational data. IL, together with UK and MG, designed the study and prepared the paper. All authors discussed and reviewed the paper.
The contact author has declared that none of the authors has any competing interests.
Publisher's note: Copernicus Publications remains neutral with regard to jurisdictional claims made in the text, published maps, institutional affiliations, or any other geographical representation in this paper. While Copernicus Publications makes every effort to include appropriate place names, the final responsibility lies with the authors.
We wish to thank the German Meteorological Service station technicians for their support in radon measurement and maintenance. The HRM instrumentation was partly funded by the Federal Ministry of Education and Research and the Federal Ministry for Digital and Transport. This study was supported by the ICOS Central Radiocarbon Laboratory, which is funded by the German Federal Ministry for Digital and Transport. Ute Karstens received funding from the project 19ENV01 traceRadon, part of EMPIR that is co-financed by the participating states and the European Union's Horizon 2020 research and innovation program. We would like to express our sincere gratitude to Samuel Hammer for his valuable time and insightful comments on this paper.
This research has been supported by the European Metrology Programme for Innovation and Research (traceRadon (grant no. 19ENV01)).
This paper was edited by Giulio G. R. Iovine and reviewed by Alan Griffiths, Scott Chambers, and Marina Muto.
Biraud, S.: Vers la régionalisation des puits et sources des composes à effet de serre: analyse de la variabilité synoptique à l'observatoire de Mace Head, Irlande, PhD thesis, Paris 7 https://www.sudoc.fr/071378243 (last access: 22 September 2025), 2000. a, b
Chambers, S., Williams, A., Zahorowski, W., Griffiths, A., and Crawford, J.: Separating remote fetch and local mixing influences on vertical radon measurements in the lower atmosphere, Tellus B, 63, 843–859, 2011. a
Chambers, S. D., Griffiths, A. D., Williams, A. G., Sisoutham, O., Morosh, V., Röttger, S., Mertes, F., and Röttger, A.: Portable two-filter dual-flow-loop 222 Rn detector: stand-alone monitor and calibration transfer device, Advances in Geosciences, 57, 63–80, 2022. a, b, c
Cuntz, M.: The Heidelberg 222Rn monitor: Calibration, optimisation, application, Diploma Thesis, Institut für Umweltphysik, Heidelberg University, Germany, 1997. a
Deutscher Wetterdienst, Meteorologisches Observatorium Hohenpeißenberg, Kubistin, D., Fischer, B., Lindauer, M., Kneuer, T., Müller-Williams, J., and Plaß-Dülmer, C.: Atmospheric measurements results archive, Gartow (132.0 m), 2016-03-02–2024-09-30, https://hdl.handle.net/11676/FeE43CeAKbBLMypyHAwqZmV7 (last access: 10 September 2025), 2024a. a
Deutscher Wetterdienst, Meteorologisches Observatorium Hohenpeißenberg, Kubistin, D., Fischer, B., Lindauer, M., Kneuer, T., Müller-Williams, J., and Plaß-Dülmer, C.: Atmospheric measurements results archive, Hohenpeissenberg (93.0 m), 2014-10-01–2024-09-30, https://hdl.handle.net/11676/awKnER1aDy3W3JvF4dqTze03 (last access: 10 September 2025), 2024b. a
Deutscher Wetterdienst, Meteorologisches Observatorium Hohenpeißenberg, Kubistin, D., Fischer, B., Lindauer, M., Kneuer, T., Müller-Williams, J., and Plaß-Dülmer, C.: Atmospheric measurements results archive, Jülich (120.0 m), 2021-07-22–2024-09-30, https://hdl.handle.net/11676/Qt29o957jlaKOuY5YRwm2C10 (last access: 10 September 2025), 2024c. a
Deutscher Wetterdienst, Meteorologisches Observatorium Hohenpeißenberg, Kubistin, D., Fischer, B., Lindauer, M., Kneuer, T., Müller-Williams, J., and Plaß-Dülmer, C.: Atmospheric measurements results archive, Karlsruhe (100.0 m), 2017-06-30–2024-09-30, https://hdl.handle.net/11676/m-J064qSOB3xJLaX42nshIr1 (last access: 10 September 2025), 2024d. a
Deutscher Wetterdienst, Meteorologisches Observatorium Hohenpeißenberg, Kubistin, D., Fischer, B., Lindauer, M., Kneuer, T., Müller-Williams, J., and Plaß-Dülmer, C.: Atmospheric measurements results archive, Lindenberg (98.0 m), 2015-03-09–2024-09-30, https://hdl.handle.net/11676/D9MQyfgEgCxQ6gJ2ek-KgeS_ (last access: 10 September 2025), 2024e. a
Deutscher Wetterdienst, Meteorologisches Observatorium Hohenpeißenberg, Kubistin, D., Fischer, B., Lindauer, M., Kneuer, T., Müller-Williams, J., and Plaß-Dülmer, C.: Atmospheric measurements results archive, Steinkimmen (127.0 m), 2020-03-03–2024-09-30, https://hdl.handle.net/11676/js_6phRK0ZYG-X7cCP4GqL_n (last access: 10 September 2025), 2024f. a
Deutscher Wetterdienst, Meteorologisches Observatorium Hohenpeißenberg, Kubistin, D., Fischer, B., Lindauer, M., Kneuer, T., Müller-Williams, J., and Plaß-Dülmer, C.: Atmospheric measurements results archive, Torfhaus (110.0 m), 2018-06-21–2024-09-30, https://hdl.handle.net/11676/O0nmMOdPhC_WAdSxKIr9co6J (last access: 10 September 2025), 2024g. a
Deutscher Wetterdienst, Meteorologisches Observatorium Hohenpeißenberg, Lindauer, M., Kubistin, D., Fischer, B., Schmidt, M., Schumacher, M., Kneuer, T., Müller-Williams, J., and Plaß-Dülmer, C.: Atmospheric measurements results archive, Schauinsland (12.0 m), 2014-02-21–2024-09-30, https://hdl.handle.net/11676/j_6dw4_39JB-N6EFh4eXqZsv (last access: 10 September 2025), 2024h. a
Deutscher Wetterdienst (DWD), Unpublished meteorogical data for LIN (98 m) and HPB (131 m), available upon request, publication in preparation, (contact: Dagmar Kubistin (dagmar.kubistin@dwd.de), Matthias Lindauer (matthias.lindauer@dwd.de), Jennifer Müller-Williams (jennifer.mueller-williams@dwd.de)) 2025. a
Dörr, H., Kromer, B., Levin, I., Münnich, K., and Volpp, H.-J.: CO2 and radon 222 as tracers for atmospheric transport, J. Geophys. Res.-Oceans, 88, 1309–1313, 1983. a
Emeis, S. and Turk, M.: Frequency distributions of the mixing height over an urban area from SODAR data, Meteorol. Z., 13, 361–368, 2004. a
Fischer, B., Kneuer, T., Kubistin, D., Lindauer, M., Müller-Williams, J., Plaß-Dülmer, C., Schmidt, M., and Meinhardt, F.: HRM Radon Data Germany L2 final data, ICOS [data set], https://doi.org/10.18160/Q2M8-B1HJ, 2024. a, b
Gachkivskyi, M. and Levin, I.: User Manual of the Heidelberg Radon Monitor, ICOS ERIC – Carbon Portal, https://doi.org/10.18160/BWHB-KFAJ, 2022. a
Geels, C., Gloor, M., Ciais, P., Bousquet, P., Peylin, P., Vermeulen, A. T., Dargaville, R., Aalto, T., Brandt, J., Christensen, J. H., Frohn, L. M., Haszpra, L., Karstens, U., Rödenbeck, C., Ramonet, M., Carboni, G., and Santaguida, R.: Comparing atmospheric transport models for future regional inversions over Europe – Part 1: mapping the atmospheric CO2 signals, Atmos. Chem. Phys., 7, 3461–3479, https://doi.org/10.5194/acp-7-3461-2007, 2007. a
Grossi, C., Àgueda, A., Vogel, F., Vargas, A., Zimnoch, M., Wach, P., Martín, J., López-Coto, I., Bolívar, J., Morguí, J. A., and Rodó., X.: Analysis of ground-based 222Rn measurements over Spain: filling the gap in southwestern Europe, J. Geophys. Res.-Atmos., 121, 11–021, 2016. a
Grossi, C., Vogel, F. R., Curcoll, R., Àgueda, A., Vargas, A., Rodó, X., and Morguí, J.-A.: Study of the daily and seasonal atmospheric CH4 mixing ratio variability in a rural Spanish region using 222Rn tracer, Atmos. Chem. Phys., 18, 5847–5860, https://doi.org/10.5194/acp-18-5847-2018, 2018. a
Grossi, C., Chambers, S. D., Llido, O., Vogel, F. R., Kazan, V., Capuana, A., Werczynski, S., Curcoll, R., Delmotte, M., Vargas, A., Morguí, J.-A., Levin, I., and Ramonet, M.: Intercomparison study of atmospheric 222Rn and 222Rn progeny monitors, Atmos. Meas. Tech., 13, 2241–2255, https://doi.org/10.5194/amt-13-2241-2020, 2020. a, b, c, d
ICOS RI: ICOS Atmosphere Station Specifications V2.0, edited by: Laurent, O., ICOS ERIC, https://doi.org/10.18160/GK28-2188, 2020. a
Jacob, D. J. and Prather, M. J.: Radon-222 as a test of convective transport in a general circulation model, Tellus B, 42, 118–134, 1990. a
Jacob, D. J., Prather, M. J., Rasch, P. J., Shia, R.-L., Balkanski, Y. J., Beagley, S. R., Bergmann, D. J., Blackshear, W., Brown, M., Chiba, M., Chipperfield, M. P., de Grandpré, J., Dignon, J. E., Feichter, J., Genthon, C., Grose, W. L., Kasibhatla, P. S., Köhler, I., Kritz, M. A., Law, K., Penner, J. E., Ramonet, M., Reeves, C. E., Rotman, D. A., Stockwell, D. Z., Van Velthoven, P. F. J., Verver, G., Wild, O., Yang, H., and Zimmermann, P.: Evaluation and intercomparison of global atmospheric transport models using 222Rn and other short-lived tracers, J. Geophys. Res.-Atmos., 102, 5953–5970, 1997. a
Jacobi, W. and Andre, K.: The vertical distribution of radon 222, radon 220 and their decay products in the atmosphere, J. Geophys. Res., 68, 3799–3814, 1963. a, b, c
Karstens, U. and Levin, I.: traceRadon daily radon flux map for Europe 2022 (based on GLDAS-Noah v2.1 soil moisture), https://hdl.handle.net/11676/SG_LHGMUsZVv9NxkIrRw9eRv (last access: 10 September 2025), 2023. a, b
Karstens, U., Schwingshackl, C., Schmithüsen, D., and Levin, I.: A process-based 222radon flux map for Europe and its comparison to long-term observations, Atmos. Chem. Phys., 15, 12845–12865, https://doi.org/10.5194/acp-15-12845-2015, 2015. a, b
Kikaj, D., Chung, E., Griffiths, A. D., Chambers, S. D., Forster, G., Wenger, A., Pickers, P., Rennick, C., O'Doherty, S., Pitt, J., Stanley, K., Young, D., Fleming, L. S., Adcock, K., Safi, E., and Arnold, T.: Direct high-precision radon quantification for interpreting high-frequency greenhouse gas measurements, Atmos. Meas. Tech., 18, 151–175, https://doi.org/10.5194/amt-18-151-2025, 2025. a
Kohler, M., Metzger, J., and Kalthoff, N.: Trends in temperature and wind speed from 40 years of observations at a 200-m high meteorological tower in Southwest Germany, Int. J. Climatol., 38, 23–34, 2018. a
Kountouris, P., Gerbig, C., Rödenbeck, C., Karstens, U., Koch, T. F., and Heimann, M.: Technical Note: Atmospheric CO2 inversions on the mesoscale using data-driven prior uncertainties: methodology and system evaluation, Atmos. Chem. Phys., 18, 3027–3045, https://doi.org/10.5194/acp-18-3027-2018, 2018. a
Kubistin, D., Plaß-Dülmer, C., Arnold, S., Kneuer, T., Lindauer, M., and Müller-Williams, J.: ICOS ATC Meteo Release, Karlsruhe (100.0 m), 2019-08-01–2024-03-31, https://hdl.handle.net/11676/6F7MBUvIk-jTUs77bMSN7vPz (last access: 10 September 2025), 2024a. a
Kubistin, D., Plaß-Dülmer, C., Arnold, S., Kneuer, T., Lindauer, M., and Müller-Williams, J.: ICOS ATC Meteo Release, Steinkimmen (127.0 m), 2019-07-22–2024-03-31, https://hdl.handle.net/11676/S9-m-RTwRNjSSJ1YUv-uScKs (last access: 10 September 2025), 2024b. a
Kubistin, D., Plaß-Dülmer, C., Arnold, S., Kneuer, T., Lindauer, M., Müller-Williams, J., and Schumacher, M.: ICOS ATC Meteo Release, Gartow (132.0 m), 2016-05-10–2024-03-31, https://hdl.handle.net/11676/dLToI172WS2PKvvwgvV1jWAf (last access: 10 September 2025), 2024c. a
Kubistin, D., Plaß-Dülmer, C., Arnold, S., Kneuer, T., Lindauer, M., Müller-Williams, J., and Schumacher, M.: ICOS ATC Meteo Release, Hohenpeissenberg (93.0 m), 2015-09-18–2024-03-31, https://hdl.handle.net/11676/ZgapN6ANw2V2YFM9pjdsqy4r (last access: 10 September 2025), 2024d. a
Kubistin, D., Plaß-Dülmer, C., Arnold, S., Kneuer, T., Lindauer, M., Müller-Williams, J., and Schumacher, M.: ICOS ATC Meteo Release, Lindenberg (98.0 m), 2017-02-21–2024-03-31, https://hdl.handle.net/11676/ejumpR8yaFWEp6XWrOUW88Hj (last access: 10 September 2025), 2024e. a
Kubistin, D., Plaß-Dülmer, C., Arnold, S., Kneuer, T., Lindauer, M., Müller-Williams, J., and Schumacher, M.: ICOS ATC Meteo Release, Torfhaus (110.0 m), 2018-06-21–2024-03-31, https://hdl.handle.net/11676/qOdruveyxvVFPIriXkBTc3k9 (last access: 10 September 2025), 2024f. a
Kubistin, D., Plaß-Dülmer, C., Kneuer, T., Lindauer, M., and Müller-Williams, J.: ICOS ATC Meteo Release, Jülich (120.0 m), 2021-07-23–2024-03-31, https://hdl.handle.net/11676/C7bjmdaMVMOPWmSMKOGXsyE0 (last access: 10 September 2025), 2024g. a
Levin, I.: Atmospheric CO2 in continental Europe – an alternative approach to clean air CO2 data, Tellus B, 39, 21–28, 1987. a, b
Levin, I., Glatzel-Mattheier, H., Marik, T., Cuntz, M., Schmidt, M., and Worthy, D. E.: Verification of German methane emission inventories and their recent changes based on atmospheric observations, J. Geophys. Res.-Atmos., 104, 3447–3456, 1999. a
Levin, I., Born, M., Cuntz, M., Langendörfer, U., Mantsch, S., Naegler, T., Schmidt, M., Varlagin, A., Verclas, S., and Wagenbach, D.: Observations of atmospheric variability and soil exhalation rate of radon-222 at a Russian forest site. Technical approach and deployment for boundary layer studies, Tellus B, 54, 462–475, 2002. a, b, c
Levin, I., Schmithüsen, D., and Vermeulen, A.: Assessment of 222radon progeny loss in long tubing based on static filter measurements in the laboratory and in the field, Atmos. Meas. Tech., 10, 1313–1321, https://doi.org/10.5194/amt-10-1313-2017, 2017. a, b, c, d, e
Levin, I., Karstens, U., Hammer, S., DellaColetta, J., Maier, F., and Gachkivskyi, M.: Limitations of the radon tracer method (RTM) to estimate regional greenhouse gas (GHG) emissions – a case study for methane in Heidelberg, Atmos. Chem. Phys., 21, 17907–17926, https://doi.org/10.5194/acp-21-17907-2021, 2021. a, b, c
Levin, I., Gachkivskyi, M., and Botía, S.: Activity concentration of Radon (222Rn) at the ATTO site (2018 to 2024), Max Planck Institute for Biogeochemistry, Jena, Germany [data set], https://doi.org/10.17871/ATTO.487.8.2038, 2025. a
Lin, J., Gerbig, C., Wofsy, S., Andrews, A., Daube, B., Davis, K., and Grainger, C.: A near-field tool for simulating the upstream influence of atmospheric observations: the Stochastic Time-Inverted Lagrangian Transport (STILT) model, J. Geophys. Res., 108, 4493, https://doi.org/10.1029/2002JD003161, 2003. a
Nazaroff, W. W.: Radon transport from soil to air, Rev. Geophys., 30, 137–160, 1992. a
Oney, B., Henne, S., Gruber, N., Leuenberger, M., Bamberger, I., Eugster, W., and Brunner, D.: The CarboCount CH sites: characterization of a dense greenhouse gas observation network, Atmos. Chem. Phys., 15, 11147–11164, https://doi.org/10.5194/acp-15-11147-2015, 2015. a
Paatero, J., Hatakka, J., and Viisanen, Y.: Concurrent Measurements of Airborne Radon-222, Lead-210 and Beryllium-7 at the Pallas-Sodankylä GAW Station, Northern Finland, Ilmatieteen Laitos, https://jyu.finna.fi/Record/jykdok.763799 (last access: 22 September 2025), 1998. a
Polian, G.: Les transports atmosphériques dans l'hémisphère sud et le bilan global du radon-222, PhD thesis, University of Paris VI, France, 1986. a, b
Röttger, A., Röttger, S., Grossi, C., Vargas, A., Curcoll, R., Otáhal, P., Hernández-Ceballos, M. Á., Cinelli, G., Chambers, S., Barbosa, S. A., Ioan, M.-R., Radulescu, I., Kikaj, D., Chung, E., Arnold, T., Yver-Kwok, C., Fuente, M., Mertes, F., Morosh, V.: New metrology for radon at the environmental level, Meas. Sci. Technol., 32, 124008, https://doi.org/10.1088/1361-6501/ac298d, 2021. a
Röttger, S., Röttger, A., Mertes, F., Chambers, S., Griffiths, A., Curcoll, R., and Grossi, C.: Traceable low activity concentration calibration of radon detectors for climate change observation networks, Measurement: Sensors, 38, 101708, ISSN 2665-9174, https://doi.org/10.1016/j.measen.2024.101708, 2025. a
Schery, S. and Huang, S.: An estimate of the global distribution of radon emissions from the ocean, Geophys. Res. Lett., 31, L19104, https://doi.org/10.1029/2004GL021051, 2004. a
Schmidt, M., Hoheisel, A., and Meinhardt, F.: ICOS ATC Meteo Release, Schauinsland (1.5 m), 2021-08-02–2024-03-31, https://hdl.handle.net/11676/6OVRGfa0RVGoU6m3aYF3joxJ (last access: 10 September 2025), 2024. a
Schmithüsen, D., Chambers, S., Fischer, B., Gilge, S., Hatakka, J., Kazan, V., Neubert, R., Paatero, J., Ramonet, M., Schlosser, C., Schmid, S., Vermeulen, A., and Levin, I.: A European-wide 222radon and 222radon progeny comparison study, Atmos. Meas. Tech., 10, 1299–1312, https://doi.org/10.5194/amt-10-1299-2017, 2017. a, b, c, d, e
Stockburger, H.: Continuous registration of the radon-, thorium-B and decay product activity of atmospheric air, PhD thesis, University of Freiburg, Germany (in German), 1960. a
Stockburger, H. and Sittkus, A.: Unmittelbare Messung der natürlichen und künstlichen Radioaktivität der atmosphärischen Luft, Z. Naturforsch. Pt. A, 21, 1128–1132, 1966. a, b
Taguchi, S., Law, R. M., Rödenbeck, C., Patra, P. K., Maksyutov, S., Zahorowski, W., Sartorius, H., and Levin, I.: TransCom continuous experiment: comparison of 222Rn transport at hourly time scales at three stations in Germany, Atmos. Chem. Phys., 11, 10071–10084, https://doi.org/10.5194/acp-11-10071-2011, 2011. a
UBA: Umweltbundesamt, Unpublished data meteorogical data, available from Stefan Feigenspan upon request, humidity sensor – “DEUB004”, stefan.feigenspan@uba.de, 2024. a
Weller, R., Levin, I., Schmithüsen, D., Nachbar, M., Asseng, J., and Wagenbach, D.: On the variability of atmospheric 222Rn activity concentrations measured at Neumayer, coastal Antarctica, Atmos. Chem. Phys., 14, 3843–3853, https://doi.org/10.5194/acp-14-3843-2014, 2014. a
Whittlestone, S. and Zahorowski, W.: Baseline radon detectors for shipboard use: development and deployment in the First Aerosol Characterization Experiment (ACE 1), J. Geophys. Res.-Atmos., 103, 16743–16751, 1998. a
Williams, A. G., Zahorowski, W., Chambers, S., Griffiths, A., Hacker, J. M., Element, A., and Werczynski, S.: The vertical distribution of radon in clear and cloudy daytime terrestrial boundary layers, J. Atmos. Sci., 68, 155–174, 2011. a
Xia, Y., Sartorius, H., Schlosser, C., Stöhlker, U., Conen, F., and Zahorowski, W.: Comparison of one- and two-filter detectors for atmospheric 222Rn measurements under various meteorological conditions, Atmos. Meas. Tech., 3, 723–731, https://doi.org/10.5194/amt-3-723-2010, 2010. a