the Creative Commons Attribution 4.0 License.
the Creative Commons Attribution 4.0 License.
 | 17 Nov 2025
A global reference data set for land cover mapping at 10 m resolution
Steffen Fritz
Martina Dürauer
Ivelina Georgieva
Marcel Buchhorn
Luc Bertels
Nandika Tsendbazar
Ruben Van De Kerchove
Daniele Zanaga
Dmitry Schepaschenko
Linda See
Martin Herold
Bruno Smets
Michael Cherlet
Andreas Brink
Ian McCallum
This paper presents a unique global reference data set for land cover mapping at a 10 m resolution, aligned with Sentinel-2 imagery for the year 2015. It contains more than 16.5 million data records at a 10 m resolution (or 165 K data records at 100 m) and information on 12 different land cover classes. The data set was collected by a group of experts through visual interpretation of very high resolution imagery (e.g., from Google Maps, Microsoft Bing, ESRI World), along with other sources of information provided in the Geo-Wiki platform (e.g., NDVI time series, Sentinel-2 image time series, geo-tagged photographs, and street view imagery). To ensure high quality and consistency among the experts that collected the data, regular coordination meetings took place, there were regular quality checks of submissions, and comparison with regional land cover maps was undertaken. This extensive reference land cover data set can be used in various applications, e.g., land cover analysis, including mapping and quality verification, ecosystems mapping and modelling, and biodiversity and cropland studies, among others. The data set is available for download at https://doi.org/10.5281/zenodo.14871659 (Lesiv, 2025).
- Article
(4276 KB) - Full-text XML
- BibTeX
- EndNote


Land cover mapping is highly dependent on the availability and quality of the training data available (Li et al., 2021). This is especially true when mapping large areas, such as in global land cover mapping, because the high spectral variability of land cover classes in different ecoregions limits the application of training samples to a specific area of interest (Hermosilla et al., 2022). Thus, large, high quality training data sets that have sufficient global coverage and are independent from existing land cover maps are needed. In the past, some data sets have been openly provided, e.g., through the GOFC-GOLD initiative (Herold et al., 2016), or from crowdsourcing (Fritz et al., 2017), but these have often been collected at much coarser spatial resolutions (e.g., 500 m or 1 km) than are currently needed, without any temporal reference, and are not up to date, having been collected from imagery before the year 2010.
As part of the Copernicus Global Land Service (GCLS-2019), annual global land cover maps at 100 m resolution were developed (CGLS-LC100) (Buchhorn et al., 2020a, b). However, at the start of this process, there were no appropriate open source reference data sets available for training. Thus, there was a critical need to develop a new global reference data set that would fill this gap. More recently, new higher resolution data sets have been published (10–30 m resolution) to support land cover mapping. For example, Stanimirova et al. (2023) published two million training data records collected from Landsat imagery over the period 1984–2020 at a 30 m resolution for use in land cover mapping and change detection, while Brown et al. (2022) collected land cover reference data at a 10 m resolution (to match Sentinel-2) for the development of the 10 m resolution Dynamic World global land cover maps. However, neither of these products existed when the CGLS-LC100 layers were in development.
This paper presents the global reference land cover data set that was developed to support the production of the CGLS-LC100 (Buchhorn et al., 2020a, b), which are comprised of annual global land cover maps and land cover fraction layers that cover the period 2015–2019. The global land cover reference data set is unique as it is independent from existing land cover products, has been collected at a 10 m resolution, and contains more than 16.5 million records at a 10 m resolution (or 165 K at 100 m). These records were collected over a 5 year period by a group of experts at the International Institute for Applied Systems Analysis (IIASA). By “experts”, we mean individuals who were trained in visual interpretation and have spent substantial amount of time on annotating land cover for at least a year or two. While “super experts” are those who were training the experts and reviewing the annotations.
In this paper, we describe the design and collection of the data set, including the thematic attributes, the tools used for data collection, and the quality assurance processes. Together, this reference data set and the two recently released global reference data sets (Brown et al., 2022; Stanimirova et al., 2023) are complementary in their spatial coverage, resolution, and quality, which provides a significant benefit to the land cover mapping community in the production of land cover products.
2.1 Land cover classes and definitions
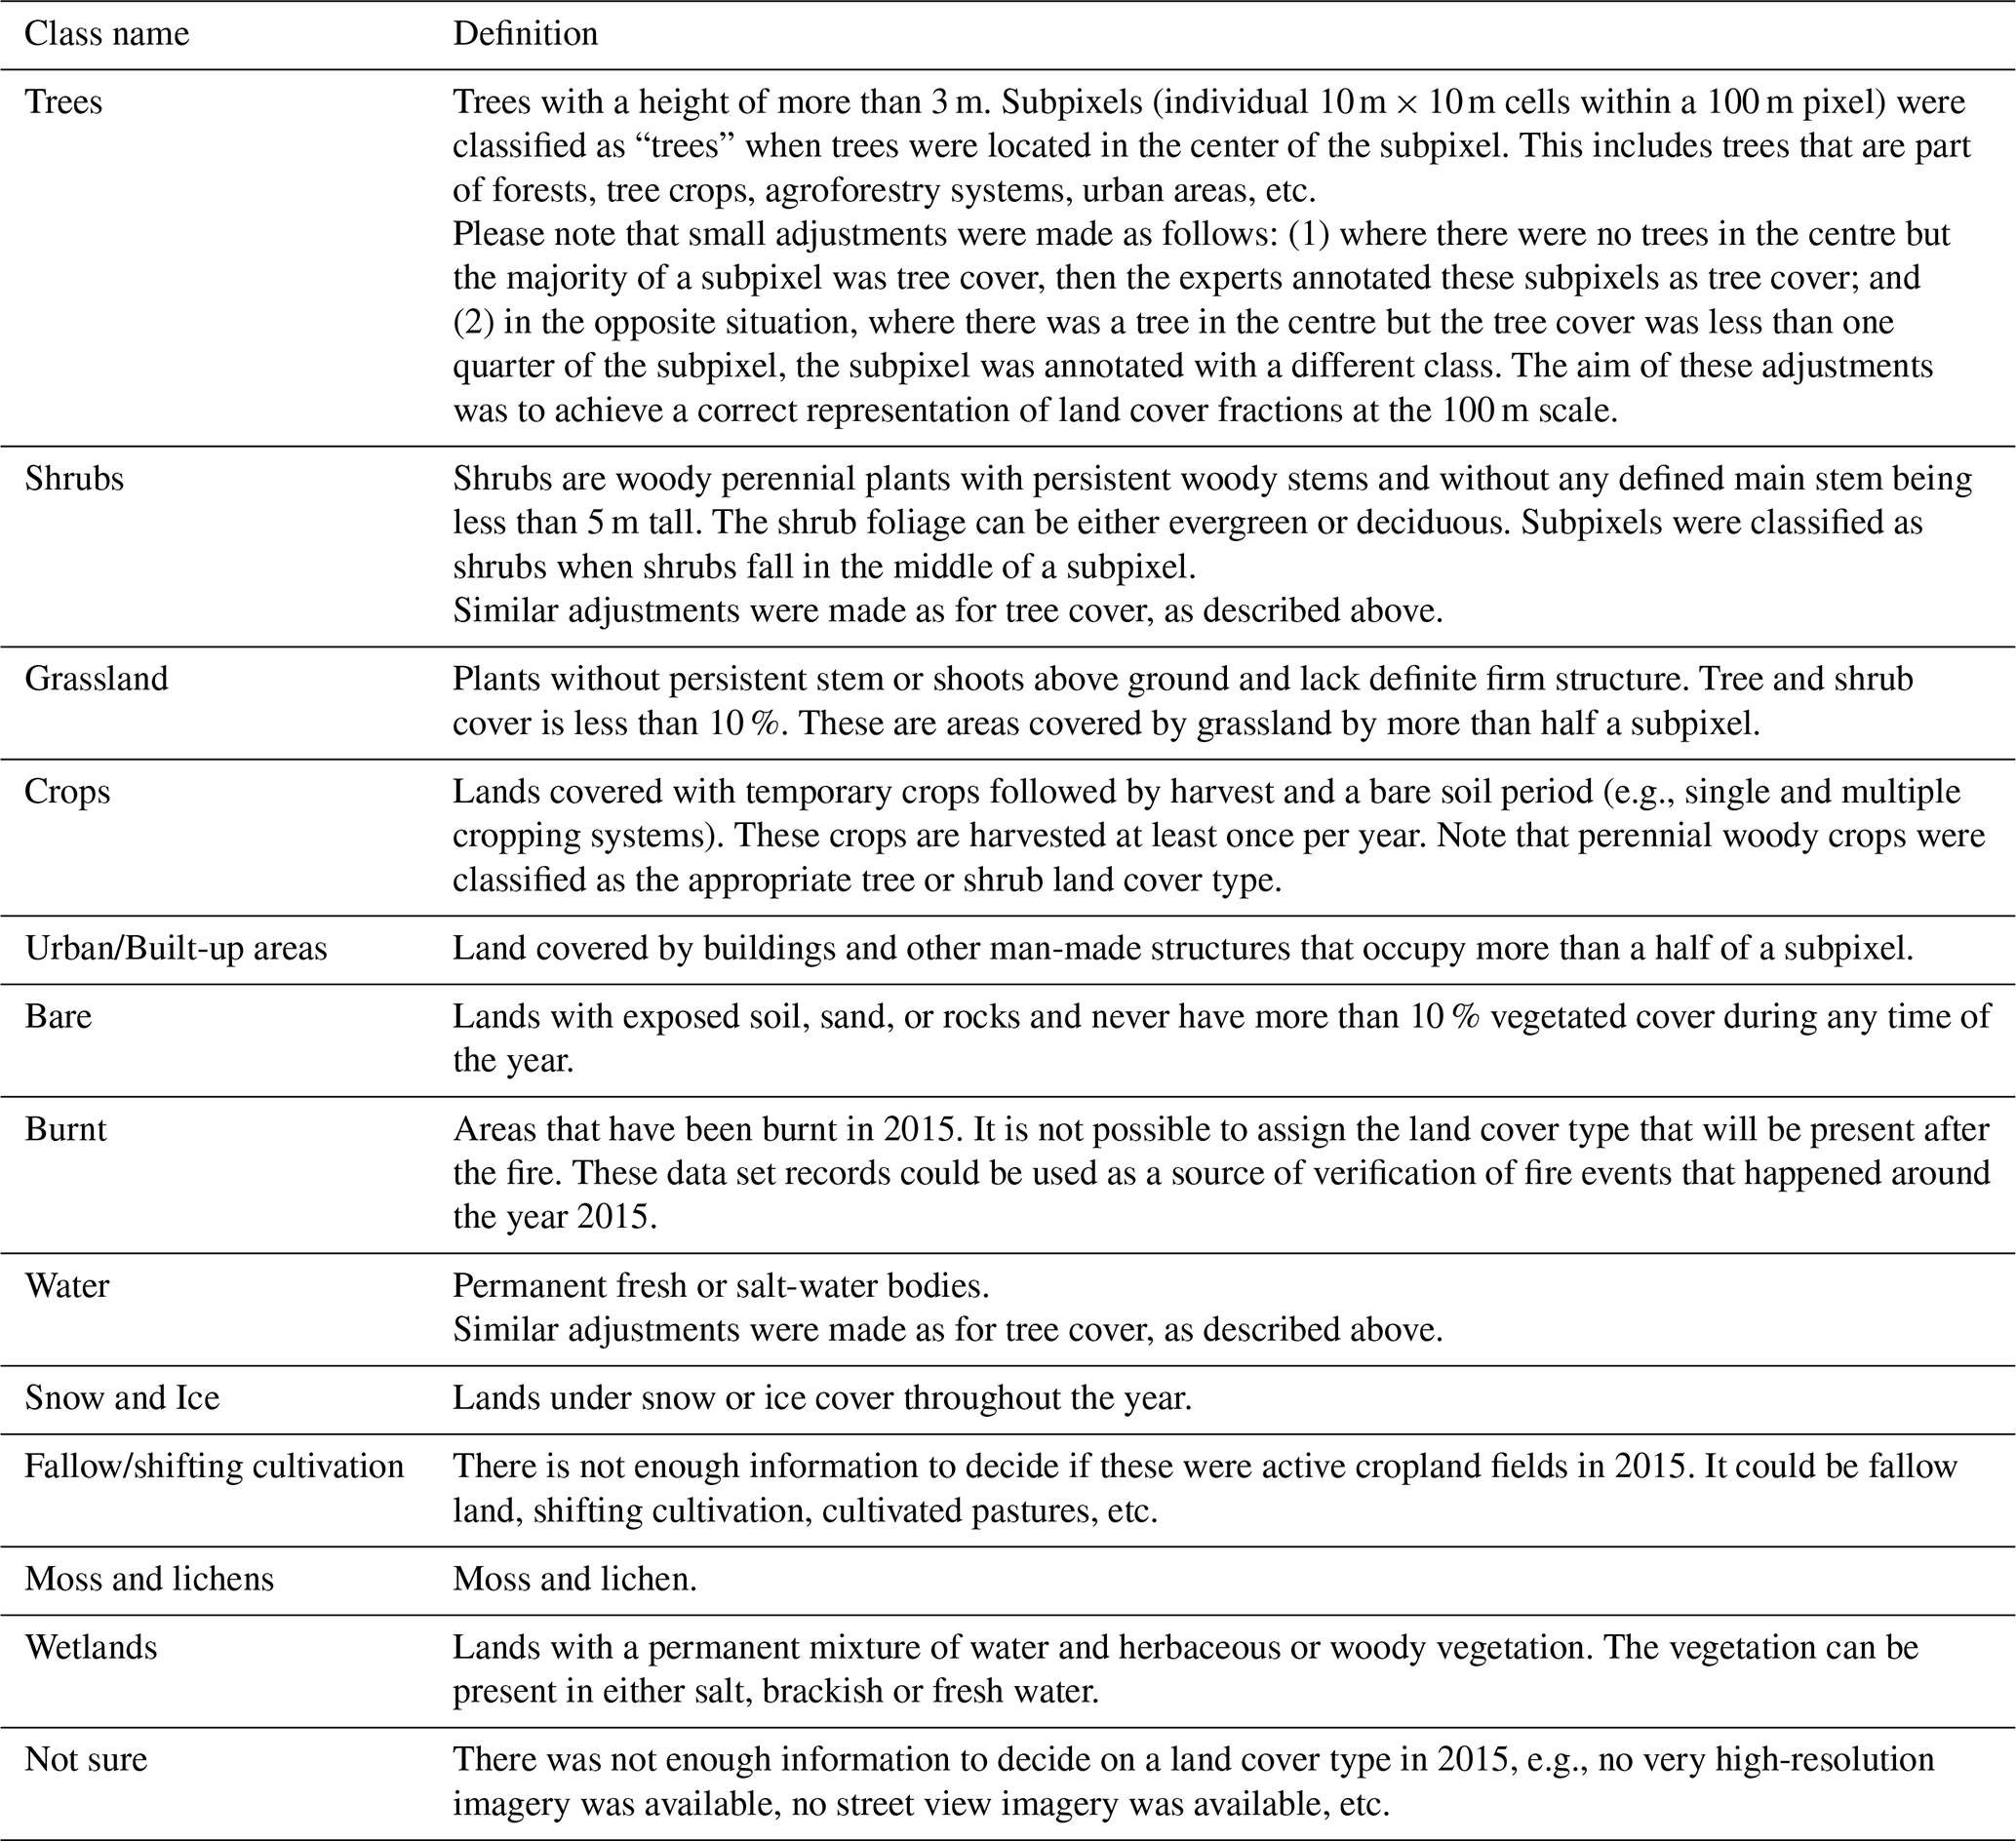
The global land cover reference data set contains training data labelled with the classes that were used to develop the GCLS-LC100 land cover maps. These classes were defined using the Land Cover Classification System (LCCS) developed by the United Nations (UN) Food and Agriculture Organization (FAO) (Buchhorn et al., 2020a, b). In addition, a few more classes were included to capture uncertainty related to the methodology used to collect the reference data. These classes include burnt areas, fallow land, shifting cultivation, and the class “Not sure”. Table 1 summarises these classes and their definitions.
Table 1Class definitions of the land cover reference data set.
2.2 Sampling design for the land cover reference data set
The sampling design of the land cover reference data set consisted of two stages:
-
At the beginning of the data collection process, a global systematic sample was first generated at an interval of approximately 35 km (starting at the top left corner in Lat/Lon: −179.8015, −55.645), resulting in around 125 K locations. We excluded permanent desert areas in Sahara and permanent snow areas in the Arctic and Antarctica.
-
Once the initial data collection process was completed, additional sample sites were added in areas with low classification accuracy. These sites were identified through visual inspection of intermediate versions of the CGLS-LC100 land cover map that were generated using the initial training data set produced in step 1. No specific sources of reference data sets were used to determine the classification accuracies. This was done only through visual inspection of the intermediate maps. In total, 40 000 sample locations were added.
2.3 Data collection method
We developed a dedicated branch of the Geo-Wiki (http://geo-wiki.org/) application to collect the land cover reference data at the required resolution of 100 m to match the CGLS-LC100 land cover product. Each 100 m pixel was subdivided into 100 subpixels, each with a resolution of 10 m, which is aligned with Sentinel-2 imagery pixels. This allowed for the collection of land cover information at a much finer resolution than the CGLS-LC100 product and for producing the fractional layers. Figure 1 shows a screenshot of the Geo-Wiki interface with the different features and tools highlighted. The data collection was done for the year 2015. Each 100 m pixel was laid on top of very high-resolution imagery including Google Maps, Microsoft Bing, and ESRI World imagery for visual interpretation, as well as some MAXAR imagery purchased for use in visual interpretation only. Geo-Wiki also provides access to other information that aids the visual interpretation process. This includes other layers such as regional land cover maps (e.g., CORINE land cover for Europe, land cover maps of Australia, etc.), which were used only as additional evidence but not as a main source of information, street view imagery from Mapillary, Normalized Difference Vegetation Index (NDVI) time series (e.g., Landsat Collection 2 Tier 1 Level 2 32-Day NDVI Composite, MOD13Q1.061 Terra Vegetation Indices 16-Day Global 250 m) derived from Google Earth Engine (GEE) (Gorelick et al., 2017) and which can be displayed as graphs, and a time series of Sentinel 2 images that can be retrieved from Sentinel hub (e.g., natural color and false color images). In addition, the location can be displayed in Google Earth Pro for access to historical imagery, geo-tagged photographs as well as Google Street View. The experts were asked to focus on data for the year 2015. If images were more recent or outdated, they additionally checked if there were changes using visual inspection of NDVI time series and Sentinel-2 images available from 2015. If there was not enough data available, such locations were labelled as “not sure” (see Table 1).
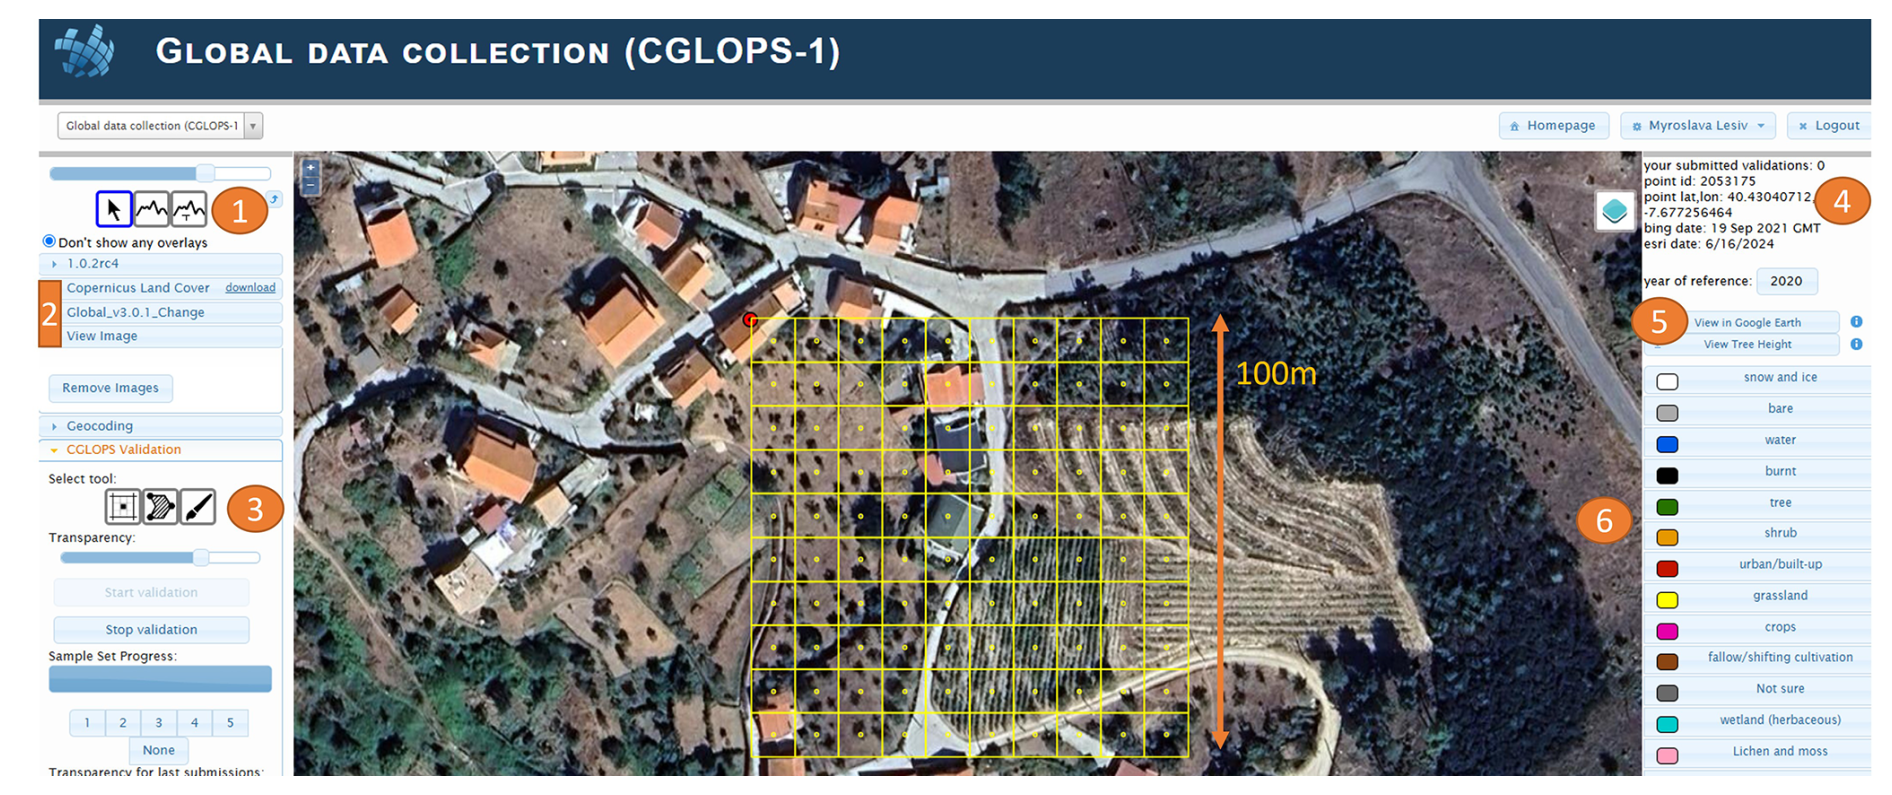
Figure 1Screenshot of the Geo-Wiki interface used for collecting the land cover reference data set. The numbered features of the interface are as follows: (1) Additional tools with NDVI time series displayed as graphs and time series of Sentinel-2 images; (2) additional map layers that can be added; (3) drawing tools for annotating individual pixels; (4) general information, such as the number of annotations completed by a user, the coordinates of the current location, and the dates of the Microsoft Bing and ESRI World imagery displayed; (5) a button to generate a kml file that is then displayed in the Google Earth Pro application to allow for access to historical imagery; (6) the land cover legend from which users select when making their annotations. Source of the underlying image: © Google Earth.
We trained a group of people to interpret each subpixel according to the land cover type visible, using the land cover class definitions outlined in Table 1. The training included instructions on how to use the Geo-Wiki tools and to gain a better understanding of landscapes by looking from above. Over a period of five years, a strong group of 18 land cover experts in visual interpretation was developed. In total, the experts classified 165 696 unique locations (100 pixels at 10 m×10 m resolution at each location), resulting in 16.5 million data records.
2.4 Quality assurance processes
To ensure that the land cover reference data set would be of high quality, the following steps were implemented:
-
An initial training session was conducted on the use of the Geo-Wiki tools, to explain the different land cover types and to demonstrate how they appear on very high-resolution imagery, e.g., Maxar images at a 50 cm resolution.
-
We then held regular online meetings to discuss various locations. These meetings took place once per week during the first year and then once every two weeks after that. Their purpose was to reduce any subjectivity related to land cover interpretation and to better align the interpretations with the definitions provided in Table 1.
-
In addition to the regular online meetings, we held regular meetings with each individual expert to do quality checking. This helped assess how well each expert understood the task and the land cover definitions. Where necessary, we provided additional training sessions. The quality requirement for an individual expert was 90 %–95 %. Thus, out of 100 interpretations that were checked, an expert could have made up to 5 to 10 misclassifications, which were mainly random mistakes. If the number of misclassifications was higher, the expert was either asked to redo the work or to discontinue further contributions. Such quality control was carried out by internal IIASA super experts on a weekly basis to maintain a high-performance standard. We would like to highlight that this was a continuous near-real time quality check and not a post-processing of the data at the end of the data collection process. There was no specific sample design for selecting the interpretations for review, but rather a random subset of 100 interpretations was selected from those submitted by each expert over the past week. This was an efficient and preventive way to reduce the number of mistakes during the early stages of the data collection process. Taking into account the individual performance rate, the overall accuracy of the reference data set was 90 %–95 %.
-
As an additional quality measure, we compared the annotations with regional land cover maps of high quality (e.g., CORINE land cover, Australian and North American land cover maps, etc.), and we then manually checked the locations that disagreed.
-
Finally, locations where visual interpretation was not possible were labelled as “Not sure” in the data set.
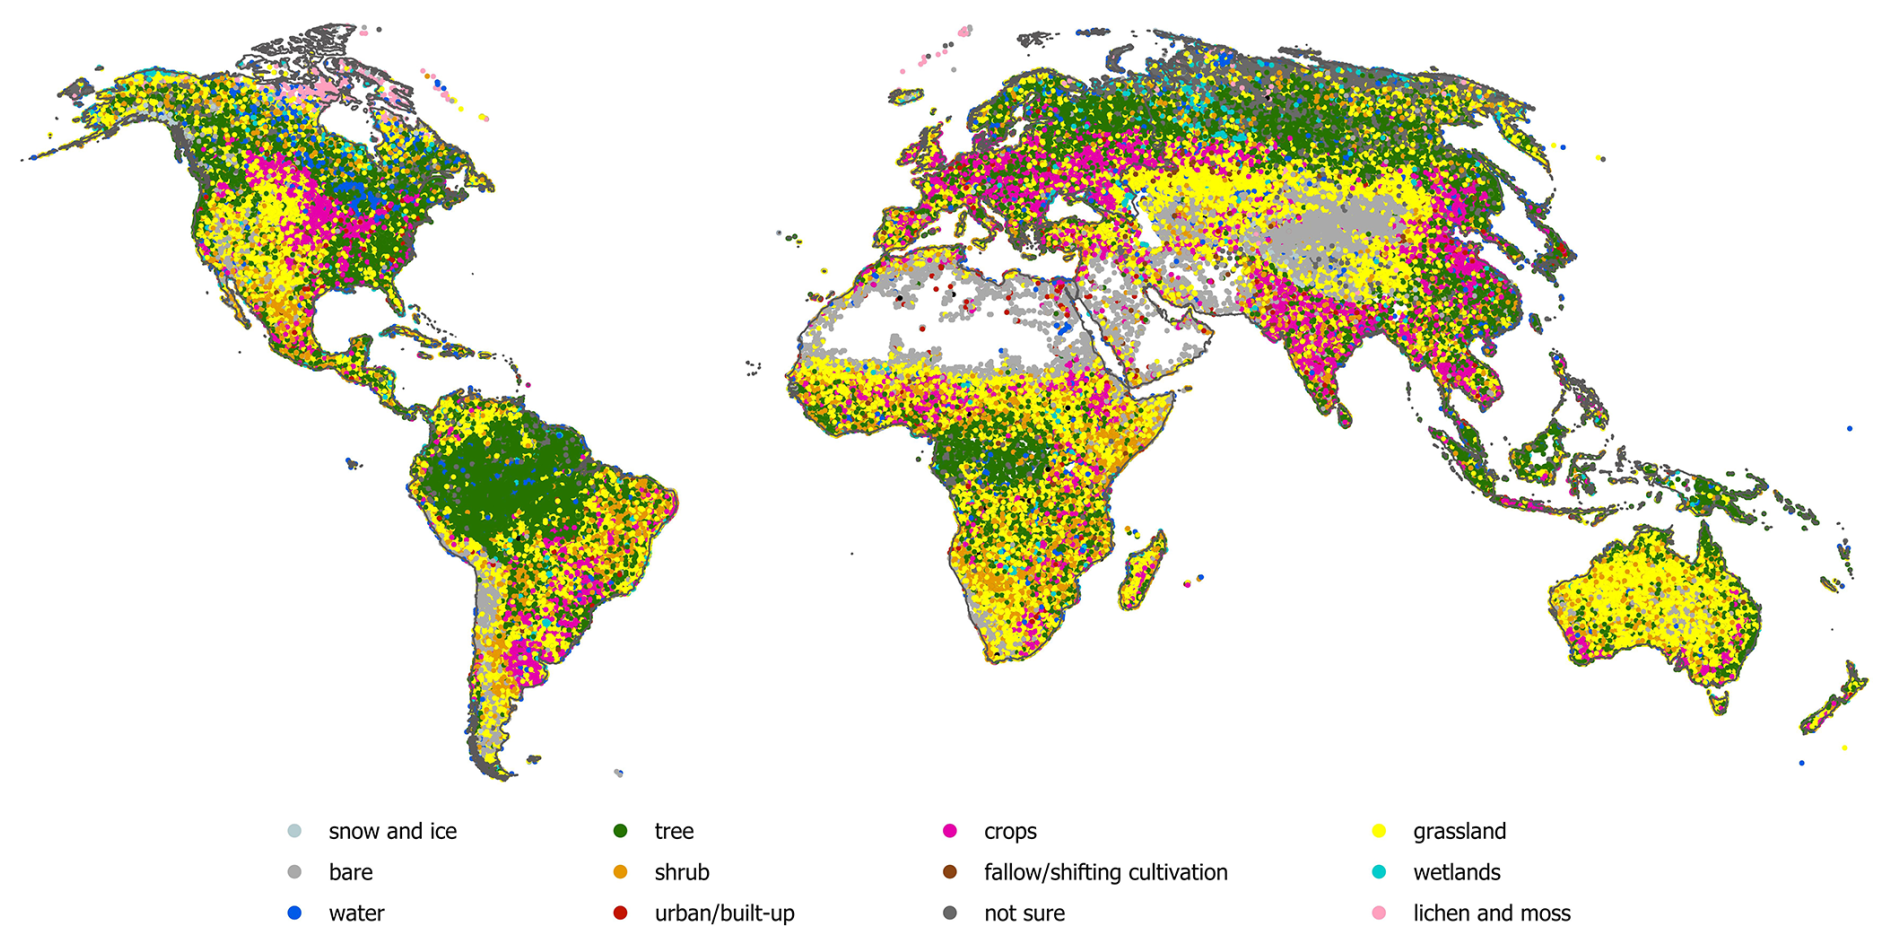
Figure 2The spatial distribution of the global land cover reference data set for 2015.
3.1 The reference data set and accuracy assessment
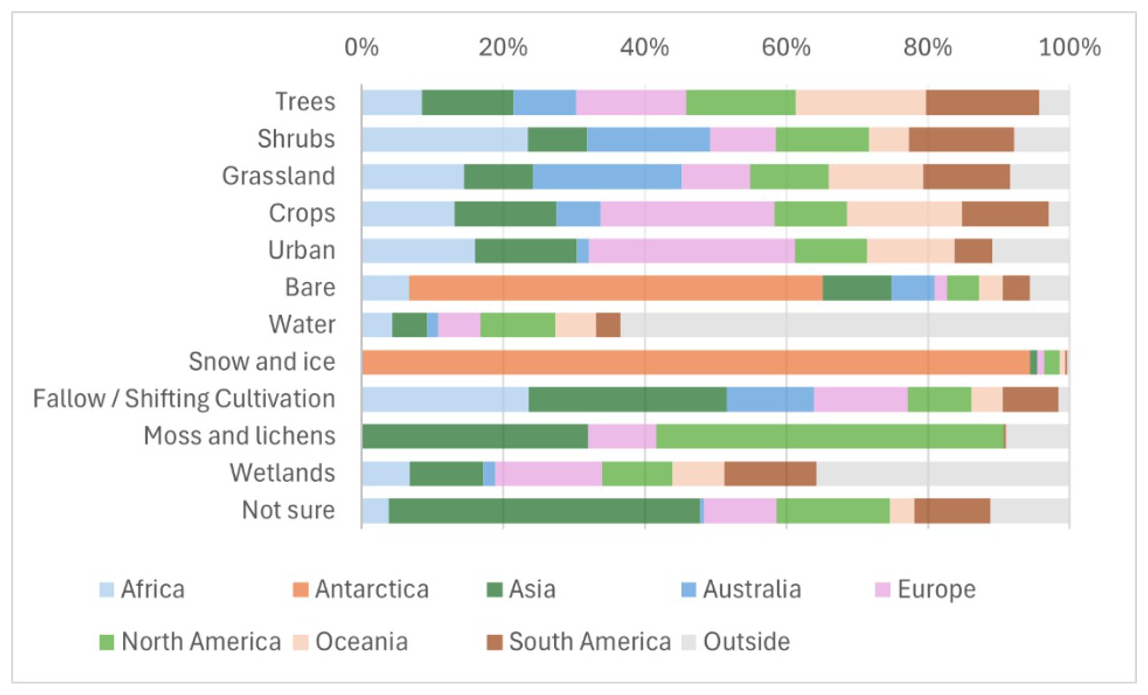
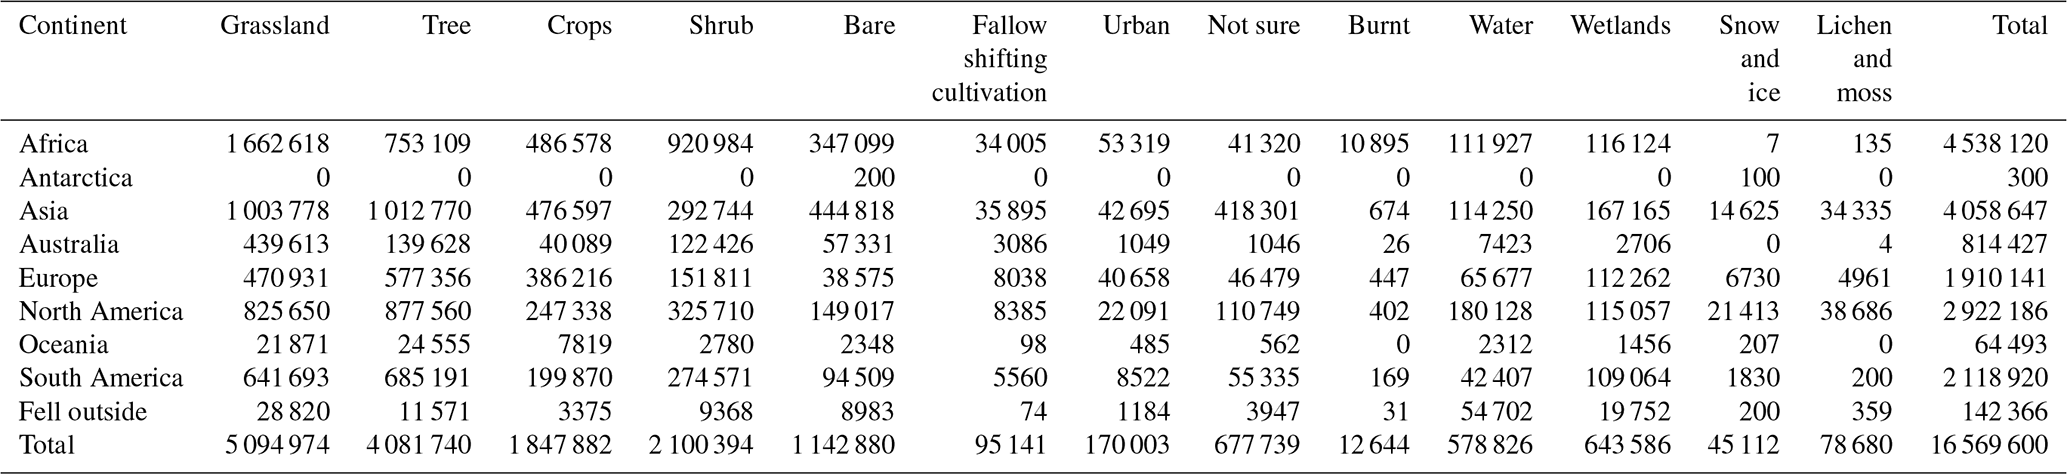
Figure 2 shows the spatial distribution of the global land cover reference data set, while Table 2 presents the breakdown by continent and land cover type. The “Burnt” class is not shown because it makes up a very small number of samples. Some points fell just outside of the continental boundaries or were located in water bodies (e.g., seas and oceans), but all were still used in the development of the CGLS-LC100 land cover product. Figure 3 illustrates the share of land cover reference data points across all land cover types by continent. The predominance of shrubs in Africa and shifting cultivation both in Africa and Asia is clearly visible, while the largest number of points in the “Not sure” class fell in Asia, possibly because there is less very high-resolution imagery available for visual interpretation in this region.
Table 2The continental distribution of the number of land cover reference points by land cover class (excluding the “Burnt” class).
3.2 Usage notes
The global land cover reference data set can be used in multiple land cover related applications as follows:
-
As a training data set to test various machine learning algorithms to produce land cover maps at various resolutions from 10 m to 100 m, e.g., the fractional land cover classification at a 100 m resolution
-
As a data set for a statistical cross-validation during the model refinement stages of an analysis of land cover maps with resolutions from 10 m to 100 m, with caution recommended in the application since the sampling design is not probabilistic;
-
As training and validation data sets for ecosystem mapping and complex modelling of biodiversity (e.g., for use in an indirect uncertainty assessment of land cover maps used to produce terrestrial habitat types (Jung et al., 2020); and
-
For any other land cover related studies, including land use modelling.
3.3 Limitations of the global land cover reference data set
Although the global land cover reference data set proved to be fit for purpose in the development of a 100 m resolution global land cover map (i.e., the dynamic CGLS-LC100m layers), there are a few limitations related to the data set usage at a 10 m resolution:
-
The aim was to obtain the correct land cover fractions at a 100 m resolution. For example, if approximately 65 % of a 100 m pixel was covered by tree cover, we labelled 65 out of the 100 corresponding 10 m pixels as tree cover. However, there were situations where the trees were located at the intersections of the 10 m pixels. In such cases, tree cover was not in the centre of individual pixels, yet we still needed to label some of them as “trees” to match the overall percentage. This introduced some subjectivity to the labelling process regarding which of the 10 m pixels to choose.
-
We did not account for potential spatial misalignment between the very high-resolution imagery used for interpretation and the 10 m pixels. This may have resulted in some uncertainty when assigning the dominant class to each 10 m pixel. Potentially, labels of neighbouring10 m subpixels could be considered for this (Xu et al., 2024).
Since not all the samples were checked for consistency, the data set contains up to 5 % misclassifications.
The data are openly available from Zenodo (https://doi.org/10.5281/zenodo.14871659, Lesiv, 2025) under a Creative Commons Attribution 4.0 International license.
The global land cover reference data set at 10 m resolution is a unique collection of high-quality reference data that can support a wide range of land cover applications as well as ecosystem mapping and biodiversity modelling. It contains more than 16.5 million records, each labelled across ∼165 K locations with one of 12 land cover classes, ranging from tree cover to urban areas. In addition, a “Not sure” class is included for cases where very high-resolution imagery was not available, there was cloud cover, or there was uncertainty in determining the land cover type. The data set is openly available under a Creative Commons license.
ML, SF, MB, RVDK and MH formulated the ideas and the overall concept of the work. ML was also responsible for data curation. MC, AB, BS, IM were responsible for funding acquisition. ML, AB, DM, NT, IG, DZ were involved in the quality assurance process (validation). MD developed the software. ML and LS wrote the original draft. All co-authors were involved in reviewing and editing the manuscript.
The contact author has declared that none of the authors has any competing interests.
Publisher's note: Copernicus Publications remains neutral with regard to jurisdictional claims made in the text, published maps, institutional affiliations, or any other geographical representation in this paper. While Copernicus Publications makes every effort to include appropriate place names, the final responsibility lies with the authors. Views expressed in the text are those of the authors and do not necessarily reflect the views of the publisher.
We would like to thank all the experts for their hard work in collecting this data set. In particular, we would like to acknowledge those experts who were not listed as co-authors: Halyna Bun, Maksym Matsala, Andrii Bilous, Roma Zadorozhniuk, Maria Sorochych, Nadiya Bun, Valentyn Bilous, Anatolii Makarevych, Vitalii Kinakh, Ekaterina Krylova, Anastasiya Baranenkova, Viktor Karminov, Alexey Martynenko, Isabella Noll, and Elviijs Martinsons. We would like to thank Orysia Yashchun and Zoriana Romanchuk for their contribution to the visualisation of the results.
This work received financial support from JRC Framework Service Contract no. 199494 (Copernicus Global Land Operations), ESA WorldCover, and JRC Framework service contract no. 945329-IPR-2023 (Copernicus Global Land Cover and Tropical Forest Mapping and Monitoring Service).
This paper was edited by Peng Zhu and reviewed by two anonymous referees.
Brown, C. F., Brumby, S. P., Guzder-Williams, B., Birch, T., Hyde, S. B., Mazzariello, J., Czerwinski, W., Pasquarella, V. J., Haertel, R., Ilyushchenko, S., Schwehr, K., Weisse, M., Stolle, F., Hanson, C., Guinan, O., Moore, R., and Tait, A. M.: Dynamic World, Near real-time global 10 m land use land cover mapping, Sci. Data, 9, 251, https://doi.org/10.1038/s41597-022-01307-4, 2022.
Buchhorn, M., Bertels, L., Smets, B., Roo, B. D., Lesiv, M., Tsendbazar, N.-E., Masiliunas, D., and Li, L.: Copernicus Global Land Service: Land Cover 100 m: version 3 Globe 2015–2019: Algorithm Theoretical Basis Document, Zenodo, https://doi.org/10.5281/zenodo.3938968, 2020a.
Buchhorn, M., Lesiv, M., Tsendbazar, N.-E., Herold, M., Bertels, L., and Smets, B.: Copernicus Global Land Cover Layers – Collection 2, Remote Sensing, 12, 1044, https://doi.org/10.3390/rs12061044, 2020b.
Fritz, S., See, L., Perger, C., McCallum, I., Schill, C., Schepaschenko, D., Duerauer, M., Karner, M., Dresel, C., Laso-Bayas, J.-C., Lesiv, M., Moorthy, I., Salk, C. F., Danylo, O., Sturn, T., Albrecht, F., You, L., Kraxner, F., and Obersteiner, M.: A global dataset of crowdsourced land cover and land use reference data, Scientific Data, 4, 170075, https://doi.org/10.1038/sdata.2017.75, 2017.
Gorelick, N., Hancher, M., Dixon, M., Ilyushchenko, S., Thau, D., and Moore, R.: Google Earth Engine: Planetary-scale geospatial analysis for everyone, Remote Sensing of Environment, 202, 18–27, https://doi.org/10.1016/j.rse.2017.06.031, 2017.
Hermosilla, T., Wulder, M. A., White, J. C., and Coops, N. C.: Land cover classification in an era of big and open data: Optimizing localized implementation and training data selection to improve mapping outcomes, Remote Sensing of Environment, 268, 112780, https://doi.org/10.1016/j.rse.2021.112780, 2022.
Herold, M., See, L., Tsendbazar, N.-E., and Fritz, S.: Towards an integrated global land cover monitoring and mapping system, Remote Sensing, 8, 1036, https://doi.org/10.3390/rs8121036, 2016.
Jung, M., Dahal, P. R., Butchart, S. H. M., Donald, P. F., De Lamo, X., Lesiv, M., Kapos, V., Rondinini, C., and Visconti, P.: A global map of terrestrial habitat types, Sci. Data, 7, 256, https://doi.org/10.1038/s41597-020-00599-8, 2020.
Lesiv, M.: Global land cover data set at 10 m for 2015 (Geo-Wiki), Zenodo [data set], https://doi.org/10.5281/zenodo.14871659, 2025.
Li, C., Ma, Z., Wang, L., Yu, W., Tan, D., Gao, B., Feng, Q., Guo, H., and Zhao, Y.: Improving the accuracy of land cover mapping by distributing training samples, Remote Sensing, 13, 4594, https://doi.org/10.3390/rs13224594, 2021.
Stanimirova, R., Tarrio, K., Turlej, K., McAvoy, K., Stonebrook, S., Hu, K.-T., Arévalo, P., Bullock, E. L., Zhang, Y., Woodcock, C. E., Olofsson, P., Zhu, Z., Barber, C. P., Souza, C. M., Chen, S., Wang, J. A., Mensah, F., Calderón-Loor, M., Hadjikakou, M., Bryan, B. A., Graesser, J., Beyene, D. L., Mutasha, B., Siame, S., Siampale, A., and Friedl, M. A.: A global land cover training dataset from 1984 to 2020, Sci. Data, 10, 879, https://doi.org/10.1038/s41597-023-02798-5, 2023.
Xu, P., Tsendbazar, N.-E., Herold, M., De Bruin, S., Koopmans, M., Birch, T., Carter, S., Fritz, S., Lesiv, M., Mazur, E., Pickens, A., Potapov, P., Stolle, F., Tyukavina, A., Van De Kerchove, R., and Zanaga, D.: Comparative validation of recent 10 m-resolution global land cover maps, Remote Sensing of Environment, 311, 114316, https://doi.org/10.1016/j.rse.2024.114316, 2024.