the Creative Commons Attribution 4.0 License.
the Creative Commons Attribution 4.0 License.
 | 19 Sep 2025
GRDC-Caravan: extending Caravan with data from the Global Runoff Data Centre
Henning Plessow
Simon A. Mischel
Frederik Kratzert
Nans Addor
Guy Shalev
Ulrich Looser
Large-sample datasets are essential in hydrological science to support modelling studies and advance process understanding. Here, we present the GRDC-Caravan dataset, an extension to the large-sample hydrology project Caravan. Caravan is a community initiative which aims to combine large-sample hydrology datasets of meteorological forcing data, catchment attributes and discharge data for catchments around the world. The GRDC-Caravan extension is based on a subset of hydrological discharge data and station-based watersheds from the Global Runoff Data Centre (GRDC), which are covered by an open data policy. The GRDC is an international data centre operating under the auspices of the World Meteorological Organization (WMO), which collects quality-controlled river discharge data and associated metadata from the National Meteorological and Hydrological Services (NMHS) of WMO member states. The extension contains discharge data and catchment boundaries from GRDC, which can be released under a permissive license (CC-BY-4.0). In addition, the extension contains meteorological forcing data and catchment attributes from the global datasets ERA5-Land and HydroATLAS in a standardized format. The dataset covers stations from 5356 catchments and 25 countries and spans the years 1950–2023. Compared to the core version of Caravan, the extension takes the total number of Caravan catchments to be 22 372 (of which 1589 catchments are duplicates between the core and extensions). While in the core Caravan dataset mostly stations from North America, central Europe and South America were included, the new extension significantly improves the global coverage of the dataset with new stations across Europe, South America, South Africa, Australia and Aotearoa New Zealand. In addition, the temporal extension of the time series could be significantly increased from 40–70 years. The extension strongly improves the global and temporal coverage of Caravan and represents a valuable dataset for global hydrological and climatological modelling studies. The dataset is released under a CC-BY-4.0 license that allows for redistribution and is publicly available on Zenodo: https://doi.org/10.5281/zenodo.15349031 (Färber et al., 2025).
- Article
(2441 KB) - Full-text XML
- BibTeX
- EndNote


River systems are an integral part of the global water cycle and are linked to many processes on local, regional and global scales (Dorigo et al., 2021). Observational river discharge data are counted as essential climate and water variables fundamental for a wide range of applications, such as flood and drought management, the modelling of the global water balance, the analysis of long-term circulation patterns, and the estimation of fluxes into the oceans (Lawford et al., 2023; GCOS, 2021; GEO, 2014). The largest hydrological database for observational in situ discharge data is the Global Runoff Database operated by the Global Runoff Data Centre (GRDC). The GRDC is an international data centre, which operates under the auspices of the World Meteorological Organization (WMO) at the German Federal Institute of Hydrology (BfG). GRDC provides daily and monthly time series data from the National Meteorological and Hydrological Services of WMO member states, which can be downloaded for non-commercial use, but the data remain the property of the owner, and redistribution is not allowed (GRDC, 2025a).
In parallel to hydrological data made available by GRDC and water services (e.g. US Geological Survey, USGS), river discharge data are increasingly being provided through large-sample hydrology (LSH) datasets collated by third parties. There are global collections of streamflow data, such as the Global Streamflow Indices and Metadata Archive (GSIM), which provides global streamflow indices and metadata (Do et al., 2018; Gudmundsson et al., 2018). Other datasets, such as MOPEX (Schaake et al., 2006), CAMELS (Newman et al., 2015; Addor et al., 2017) and HYSETS (Arsenault et al., 2020), are based on flow time series, which are complemented by atmospheric forcing (e.g. precipitation) time series and catchment attributes (characterizing, for example, the dominant soil type or the level of anthropogenic water extractions). These time series and attributes opened new possibilities in hydrology, enabling, for instance, the development of machine-learning-based hydrological models (e.g. Kratzert et al., 2019a, b) and the identification of human impacts on river flows over large regions (e.g. Bloomfield et al., 2021; Chagas et al., 2022).
While these datasets have led to key advances, progress is hindered by a few shortcomings (Addor et al., 2020). One of them is the lack of common standards, which makes their combination challenging. The Caravan project (Kratzert et al., 2023) was designed to overcome this and to create a global dataset by combining seven existing LSH datasets (Newman et al., 2015; Fowler et al., 2021; Chagas et al., 2020; Alvarez-Garreton et al., 2018; Coxon et al., 2020; Arsenault et al., 2020; Klingler et al., 2021). We refer to this collection of catchments as the “core Caravan dataset” below. In addition to this dataset, Caravan is also a cloud-based workflow (Fig. 1), which allows members of the hydrology community to extend the dataset to new locations, generating what we refer to as “extensions”. Meteorological forcing data and catchment attributes for all Caravan catchments (the core dataset and extensions) are all extracted from the global datasets ERA5-Land (Muñoz-Sabater et al., 2021) and HydroATLAS (Lehner et al., 2019; Linke et al., 2019), guaranteeing spatial consistency and comparability across regions. They also use the exact same data format which facilitates their uptake by the community and their combination.
Currently, the Global Runoff Database contains river discharge data from more than 10 000 stations in 160 countries, dating back up to 200 years. The core Caravan dataset has a strong focus on North America, South America, Europe and Australia, although several extensions have been produced since its release, covering different spatial and hydroclimatic regions of the world (Koch, 2022; Morin, 2024; Höge et al., 2023; Casado Rodríguez, 2023; Helgason and Nijssen, 2024; Dolich et al., 2024). The aim of this study was to extend the spatial and temporal coverage of Caravan with GRDC discharge data, which can be released with a permissive license (CC-BY-4.0). The extension was created using the cloud-based workflow of the Caravan framework and provides the first subset of freely available GRDC discharge data together with meteorological forcing data and catchment attributes.
The GRDC-Caravan extension was developed following the Caravan methodology in Kratzert et al. (2023). A simplified workflow showing how this and other extensions were built is shown in Fig. 1. Meteorological forcing data, catchment attributes and river discharge were compiled using Google Earth Engine in the cloud (Kratzert, 2025). A detailed description of the dataset structure and the processing of the dataset components is provided below.
2.1 Dataset structure
The current version of the GRDC-Caravan extension dataset is available at https://doi.org/10.5281/zenodo.15349031. Due to its size, the dataset is provided in two zip archives:
-
GRDC_Caravan_csv.zip, which provides the time series data as comma-separated values (CSV) text files (downloadable as a 8.8 GB zip archive);
-
GRDC_Caravan_nc.zip, which provides the time series data in the Network Common Data Form (NetCDF) (downloadable as a 7.6 GB zip archive).
The data in both versions are identical, but users can choose if they require the time series data in CSV or NetCDF format. The organization of the subfolders corresponds to the core Caravan dataset of Kratzert et al. (2023):
-
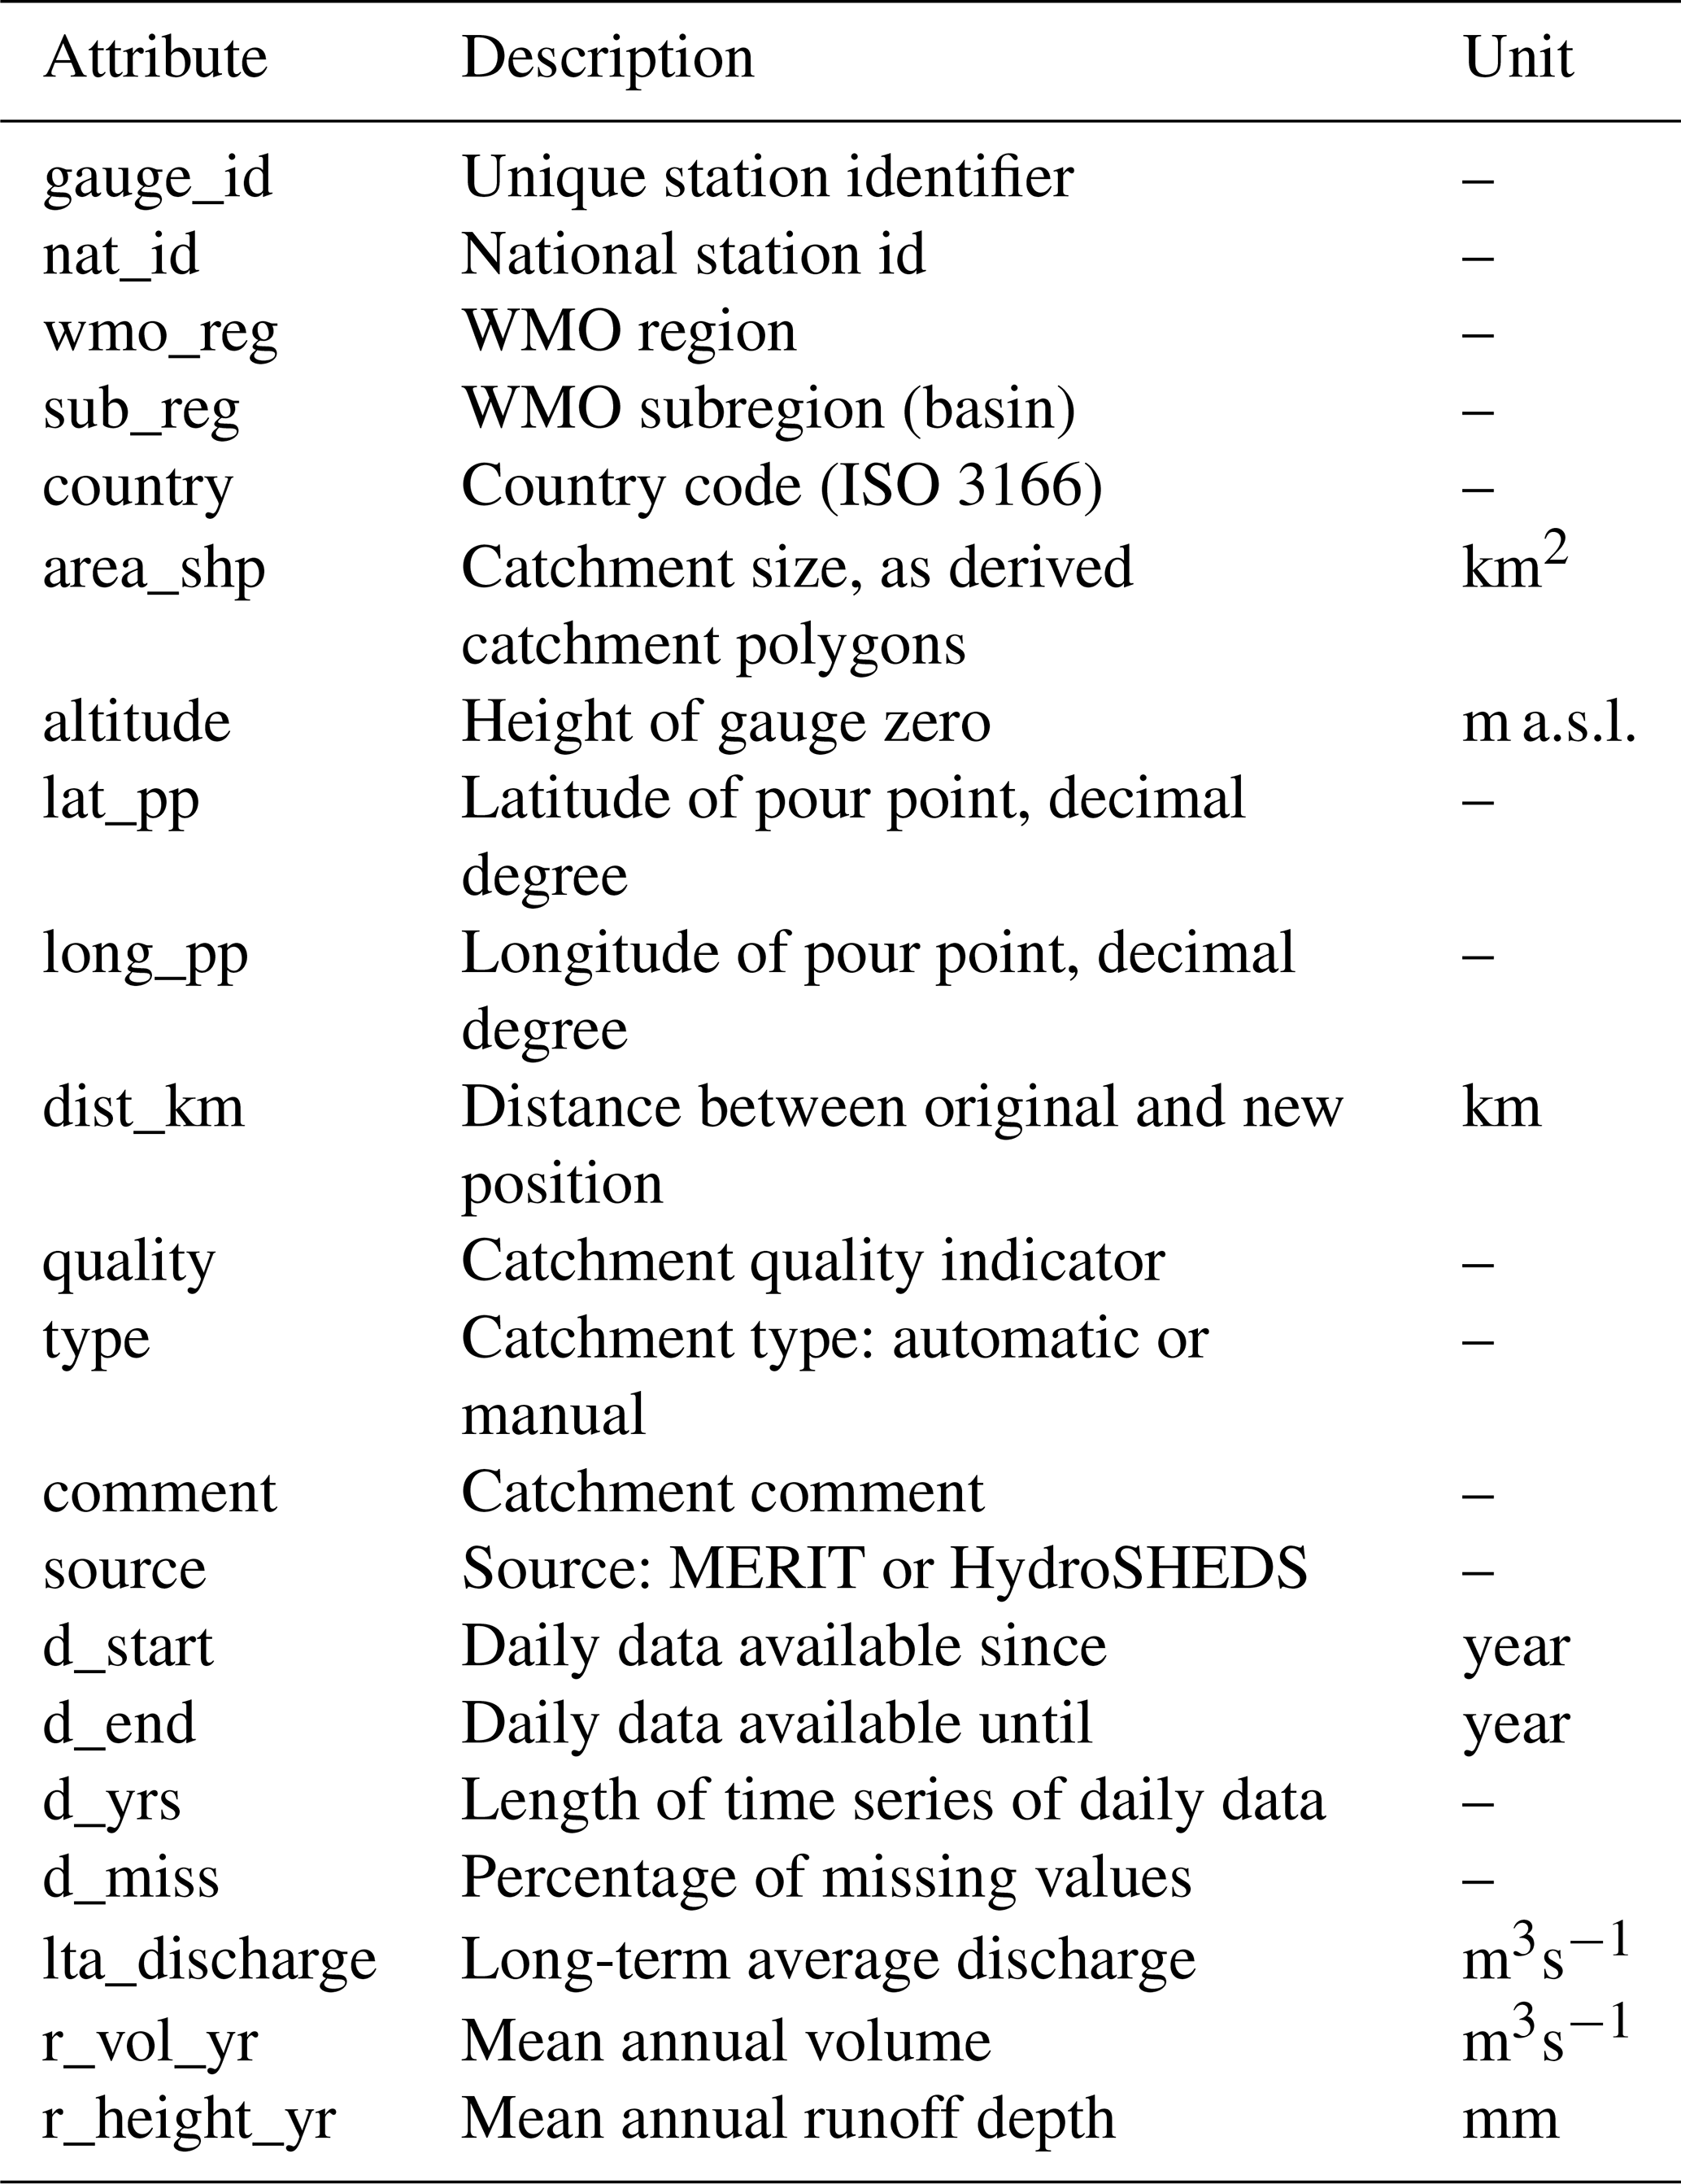
The attributes folder contains a subfolder with four CSV (comma-separated values) files. The file “attributes_hydroatlas_grdc.csv” contains attributes derived from HydroATLAS and the file “attributes_caravan_grdc.csv” contains climate indices derived from ERA5- Land. The metadata information is listed in “attributes_other_grdc.csv”, while the last file “attributes_additional_grdc.csv” is specific to the GRDC extension. It contains attributes from GRDC (Table 1), including the original national station IDs (“nat_id”) and catchment information. The first column in all attributes file is called “gauge_id” and contains a unique station identifier of the source dataset (GRDC) and the station id as defined in the original source dataset. The attribute “nat_id”, which is the national station code for each gauge station, allows the user to find duplicates between GRDC station codes and stations that are already included in Caravan.
-
The shapefiles folder contains a subfolder with a shapefile with the catchment boundaries of each station within the dataset. This shapefile was used to derive the catchment attributes and ERA5-Land time series data. Each polygon in a given shapefile has a field “gauge_id” that contains the unique station identifier.
-
The time series folder contains one subfolder (CSV or NetCDF, depending on the chosen file format). Within the subdirectory, there is one file (either CSV or NetCDF) per basin containing all time series data (meteorological forcings, state variables and streamflow). The NetCDF files also contain metadata information, including physical units, time zones and information on the data sources.
-
The licenses folder contains license information of all data included in the extension.
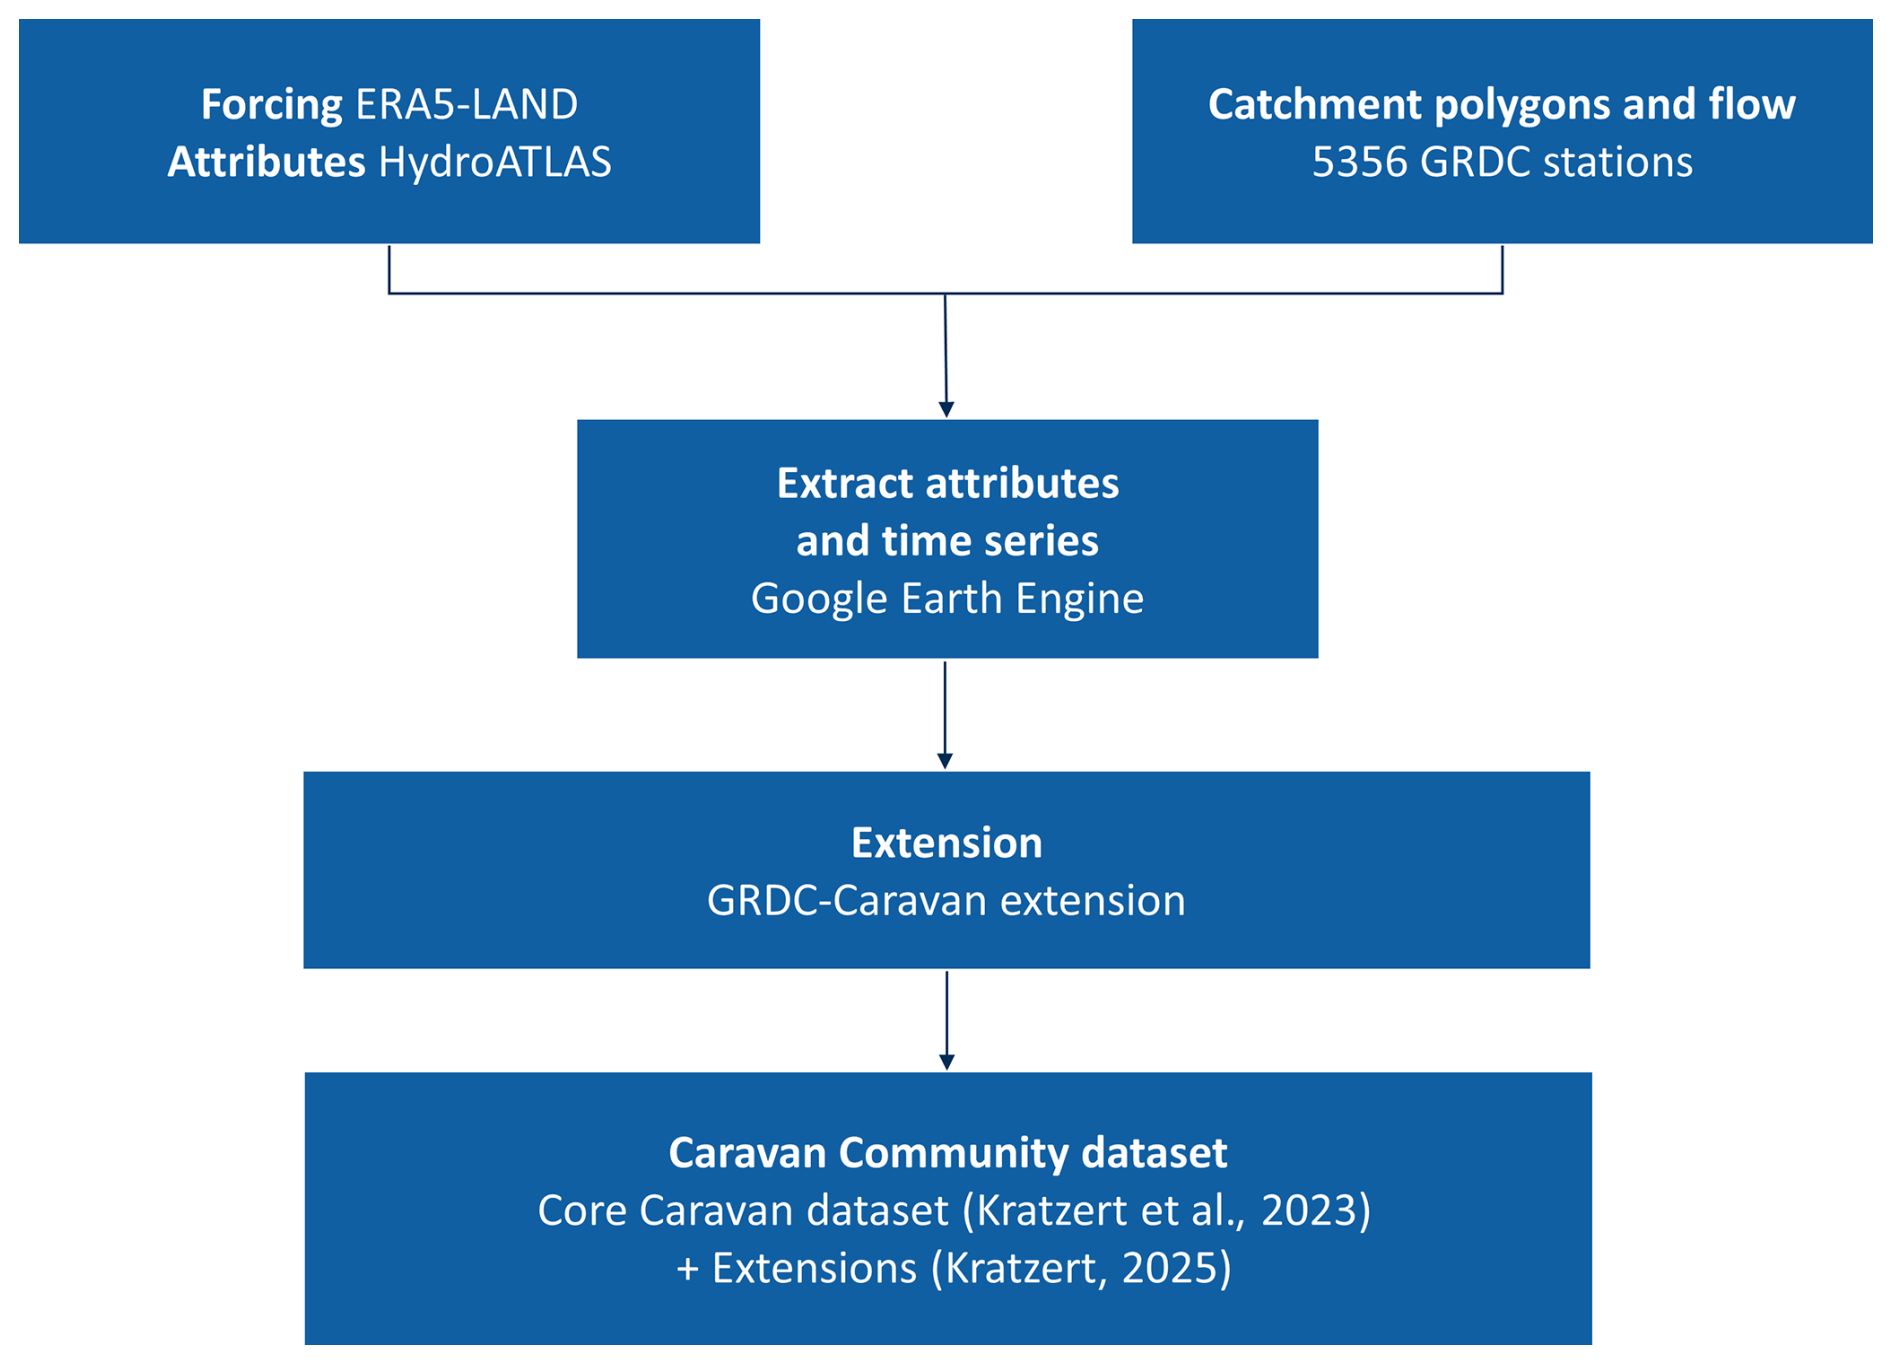
Figure 1Flow-chart demonstrating the generation of Caravan datasets as described in Kratzert et al. (2023) using this extension as an example. All Caravan datasets are composed of forcing data, attributes, catchment polygons and flow data. The code to create new extensions is available online, and all data are processed in the cloud. See Kratzert (2025) for published Caravan extensions.
2.2 River discharge data
For the compilation of the dataset, river discharge time series from the Global Runoff Data Centre (GRDC) were used. Most time series from GRDC are provided by the NMHS of WMO member states. In exceptional cases, the data are also provided by research institutions (e.g. Greenland). Although there are now several application programming interfaces (APIs) available that allow for an automated import of time series, the GRDC usually receives updated time series at irregular intervals and often only upon request.
Basically, there are two different types of updates. In the first case, we receive time series that are consecutive to the previous one, which are only appended. In the second case, we receive historical time series data, which are then compared to the old one in our database. The quality of the time series data is then inspected both numerically and graphically.
During the validation, the provided streamflow values are compared individually for each day. If the new value deviates from the previous one by more than 10 %, the old and new time series are graphically generated, overlaid and reviewed. This only happens occasionally, but in most cases, the rating curve has been recalculated, resulting in differences in streamflow peaks on the same day. If a deviation cannot be explained or is incorrect, the GRDC consults with the NMHS. In rare cases, this may lead to a revised and improved time series being delivered.
As Caravan is a truly open-source initiative (Kratzert et al., 2023), only those stations whose countries adhere to an open data policy with a permissive data sharing license were included in the dataset. In addition, only stations supported by a polygon of the catchment area were chosen. Furthermore, the stations must contain daily discharge values with a time series of at least 1 year and should end in 2010 or more recently. As for the rest of Caravan, discharge data are provided in area-normalized units (mm d−1). We used the area of the catchment polygons for the normalization, which is provided as the area in the catchment attribute.
Table 1Additional attributes that are included in the GRDC-Caravan extension in addition to the set of attributes in the core Caravan dataset (Kratzert et al., 2023).
2.3 Catchment polygons and gauge locations
All stations that meet the criteria for inclusion in the GRDC-Caravan extension contain a polygon of the station's catchment area. The polygons are mandatory as they will later be used to derive meteorological forcing data (see Sect. 2.4). Below, a detailed description of the calculation and evaluation of the catchment areas and the station allocation is given. Additionally, a quality indicator for the calculated catchments is provided.
2.3.1 Area calculation
For the calculation of station catchment areas, a global flow direction raster was chosen, preferably with an associated river network. The initial dataset utilized is the HydroSHEDS dataset with a 15 arcsec resolution, which corresponds to approximately 500 m at the Equator. The dataset has almost global coverage but was supplemented with the Hydro1k dataset above 60° N in latitude, where the quality of these catchment areas drops considerably (Lehner et al., 2008). Therefore, the Multi-Error-Removed Improved-Terrain (MERIT) Hydro dataset was used additionally. MERIT has a 3 arcsec resolution, equivalent to about 90 m at the Equator (Yamazaki et al., 2019). This dataset is well suited for higher latitudes and particularly for smaller catchment areas. Lin et al. (2019) employed the TauDEM tool to derive the river network of MERIT Hydro.
For the calculation of the upstream area of the stations with the HydroSHEDS dataset, the self-developed R package “GRDCFlowTools” has been used (GRDC, 2025b). It contains functions to process raster files and to determine all upstream cells of a given point using, among others, the R package igraph (Csardi and Nepusz, 2006), which is a library for graph theory and network analysis based on the principle of topological sorting. Creating these graph objects requires a lot of computing memory and quickly reaches its limit when using raster sets covering a whole continent. The function createSplitFlowGraph of the self-developed R package was used to divide a flow direction raster into any number of stripes, including their graph objects. For these calculations, a separation of the HydroSHEDS flow direction raster into 10 parts seemed to be a reasonable number. With the created graph objects, the function getBasinFromSplitGraph derives all inflow cells to a given cell number of a flow direction raster from which the total area was determined. This procedure was done for each pixel on the river network.
For the area calculations with the MERIT Hydro dataset, the delineator.py Python scripts of Heberger (2021), which have already proven effective in other LSH datasets (Loritz et al., 2024; Senent-Aparicio et al., 2024), were used. It allows quick watershed delineation using a hybrid of vector- and raster-based methods. It consists of two modes: a “high-resolution” mode, based on MERIT Hydro, and a “low-resolution” mode, based on HydroSHEDS. We used the “high-resolution” mode, which requires only a column-based file with a unique ID and the coordinates to run the script. The huge advantage of the method is how fast the raster is read and processed. This is due to the Python package “pysheds”, which is able to read the raster files using a bounding box, where only a particular part of the raster grid is processed. The bounding box is thereby created by the intersection of the unit catchment and the outlet point, clipping the flow direction and accumulation grids to the extent of the unit catchment. To achieve this, all cells outside the unit catchment are marked 0 to prevent a neighbouring catchment from being considered. Before the catchment is calculated with the grid.catchment function of “pysheds”, the point is snapped to the nearest stream, which depends on the number of upstream pixels to define a waterway. For smaller catchments, a smaller number is recommended and vice versa for large ones.
2.3.2 Catchment evaluation and station allocation
The methodology for calculating and evaluating the station catchment areas was adopted from the technical report of Lehner (2012). To link the gauging stations to the river network, a twofold strategy was used. First an automatic station allocation was carried out, where a 5 km buffer around each station was drawn. Within this buffer, points for each cell of the flow direction raster were created. Those cells were then clipped to the river network, if existent, which reduces the number of points considerably. Once all potential pour points were calculated, a rating score (R) was assigned based on the following formula:
where RA is the area difference and RD the distance ranking. RA was calculated by a relative comparison between the calculated watershed area and the original GRDC catchment area provided by the NMHS, with a value of 0 indicating a perfect match. A positive or negative deviation until 50 % was tolerated and assigned the value 50, while all stations that exceeded this tolerance limit were initially separated and inspected later in detail manually. RD was derived from the distance of the station's coordinates to the respective pour point. Due to the double-weighted distance ranking, stations are less likely to be chosen if they are far away. Since the buffer was 5 km large, a maximum value of 100 could be obtained. The two best results, namely, those with the best overall ranking calculated from MERIT and HydroSHEDS, were chosen, and the catchment polygon was calculated based on the one with the lowest R value (Eq. 1). These stations were assigned the type “Automatic”, while all other stations that exceeded the area difference of 50 were inspected manually and assigned the type “Manual”. Manual procedures for station allocation are very time-consuming as they involve the verification of river and station names as well as coordinates for each single station. The final decision on whether a station was moved to a new and “reliable” location was also based on the agreement of the calculated and reported GRDC catchment area.
2.3.3 Catchment quality indicator
Even if a minimum quality is ensured with the help of the ranking assessment, the question for the user is how reliable the derived station catchment areas are and how good the agreement is, since not all station catchment areas have the same quality. As the quality of the catchment boundaries depends on the accuracy of the provided coordinates as well as the catchment area, a further quality indicator has been assigned. The differentiation was based on whether the stations were generated automatically or manually and was further divided into three quality levels: “High”, “Medium” and “Low”. (Table 2). The quality indicator of catchments, which was calculated automatically, was assigned according to the calculated area difference and distance. “High” quality was assigned for catchments with an area difference ≦5 % and a distance≦5 km, “Medium” quality for an area difference of 5 %–10 % and a distance ≦5 km, and “Low” quality for an area difference between 10 % and 50 % and a distance ≦5 km.
Table 2Classification for the differentiation of quality levels of calculated catchments.
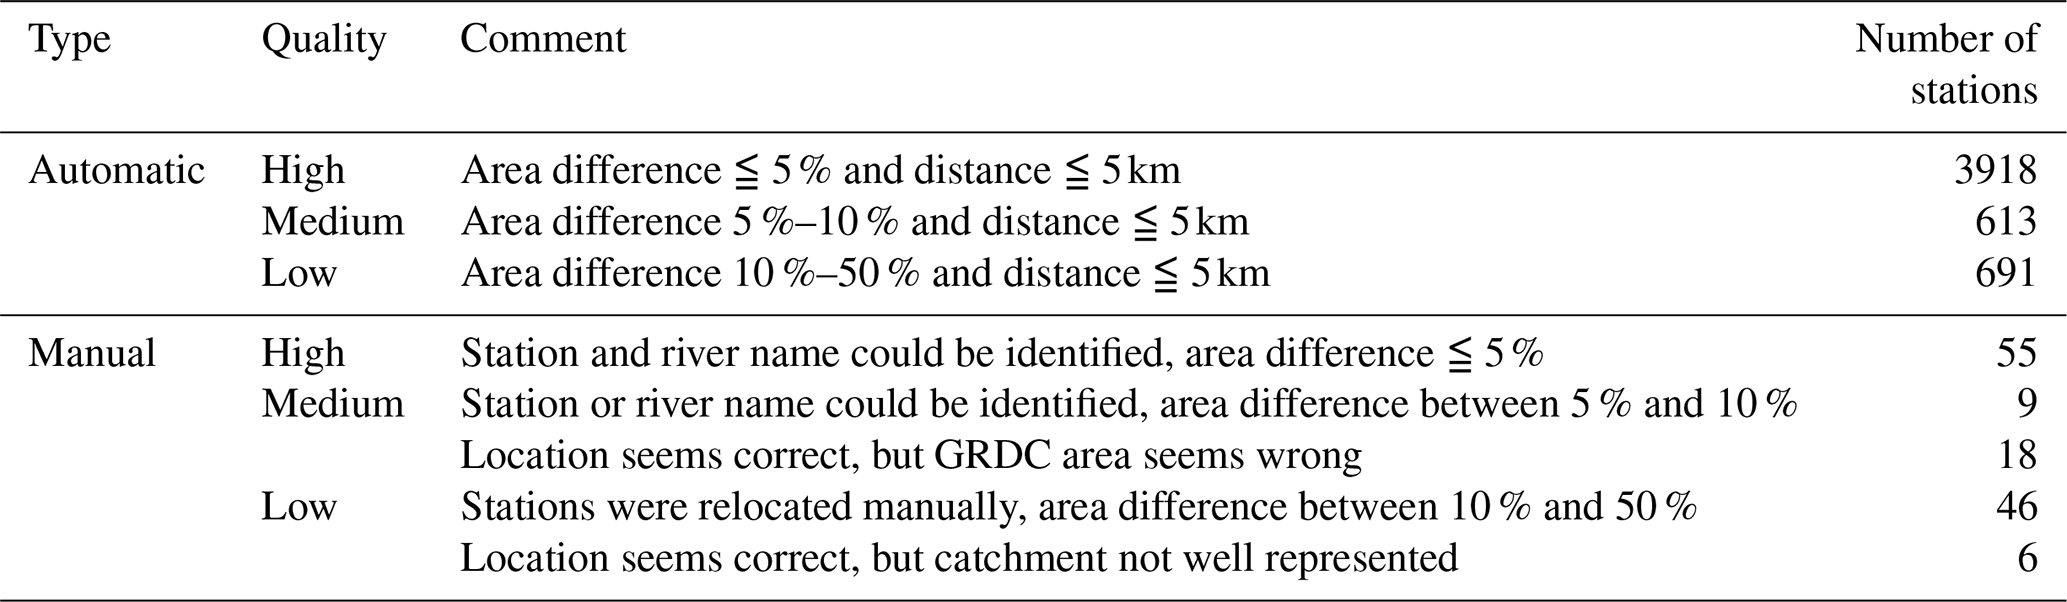
The quality of manually calculated catchments was more complicated. Manually calculated catchments were assigned a “High” quality index if both the station and river name could be identified and the area difference was less than or equal to 5 %. If either the station or river name could be identified, but the area difference is between 5 % and 10 %, catchments were classified into the “Medium” quality category. The “Medium” category was also assigned for cases where the location seems correct, but it is evident that the provided area is incorrect since regional case studies or comparisons with upstream or downstream stations reveal discrepancies. “Low” quality involved catchments where some of the stations were relocated manually and the catchment agreement tends to be mediocre, between 10 % and 50 %, but correlates to some extent with the flow behaviour. The derivation was not always clear, especially for stations located in arid regions. In addition, catchments were assigned to the “Low” quality category, whose coordinates are correct, but the elevation model could not represent the catchment accurately.
In total, the catchment area for 5356 stations was calculated, with 5222 stations being allocated automatically and 134 manually inspected stations (Table 2).
2.4 Meteorological forcing data
The GRDC-Caravan extension contains the same 38 ERA5-Land time series features derived with the same algorithm as in the core Caravan dataset; see Tables 1 and 2 in Kratzert et al. (2023). Note that the potential evaporation band from ERA5-Land, which is included in the core Caravan dataset, and in this extension, is known to have issues; see, for example, Clerc-Schwarzenbach et al. (2024). For that reason, FAO Penman–Monteith potential evapotranspiration (PET) has recently been added to the Caravan dataset, starting from version 1.5; see Kratzert et al. (2025a). The PET time series are derived from ERA5-Land time series using the code published by Singer et al. (2021). For consistency, however, the ERA5-Land potential evaporation band is still included in our extension, but it should be used with care.
2.5 Catchment attributes
The GRDC-Caravan extension includes the same 196 catchment attributes derived from HydroATLAS (see Tables 3 and 4 in Kratzert et al., 2023), the same 10 climate indices derived from the meteorological time series (see Table 5 in Kratzert et al., 2023) and the same metadata information (gauge latitude, longitude, area, country and station name; see Table 6 in Kratzert et al., 2023). Following the newly added FAO Penman–Monteith PET time series, all PET-related climate indices (4 in total) were additionally computed using the Penman–Monteith PET time series, resulting in a total of 14 climate indices. For better comparability, the climate indices were calculated from the same time period (1981–2022) as in the core Caravan dataset even though longer records of forcing data are available.
Since the GRDC-Caravan extension also includes catchments that are much larger than the upper threshold that was used in the core Caravan dataset, which was 2000 km2, we had to adapt the code that is responsible for deriving the catchment attributes from HydroATLAS on Google Earth Engine. The updated code has been merged with the official Caravan GitHub repository (Kratzert, 2025).
Additionally, the GRDC-Caravan extension includes a set of additional attributes that are specific to the GRDC data (see Table 1). Most of the attributes are derived from the GRDC station catalogue, available at the GRDC data portal (GRDC, 2025c). However, we made sure that the attributes related to streamflow availability are clipped to the periods included in this extension and that long-term streamflow indices are derived equally from the data that are included in the extension. Another attribute that was added is nat_id, which is the national station code for each gauge station. This allows the user to find duplicates between GRDC station codes and stations that are already included in Caravan. The reason is that we also provide a mapping from the GRDC gauge ID to the national station IDs, which helps to filter out duplicates between GRDC stations and stations from other datasets already included in Caravan.
The GRDC-Caravan extension covers stations from 5356 catchments and 25 countries from the Global Runoff Database, spanning a time series length of 1–73 years (Fig. 2 and Table 3). Most catchments are located in North America, with 1133 stations in Canada and 999 stations in the United States followed by Australia (701 stations), Brazil (472) and South Africa (434). In addition, there is a large contribution by European countries such as Germany (336 stations), Norway (206), Spain (145), Austria (134), Finland (133) and Sweden (130). From other countries in Africa and South America, only a few stations could be collected from. From Asia, no data could be provided at all.
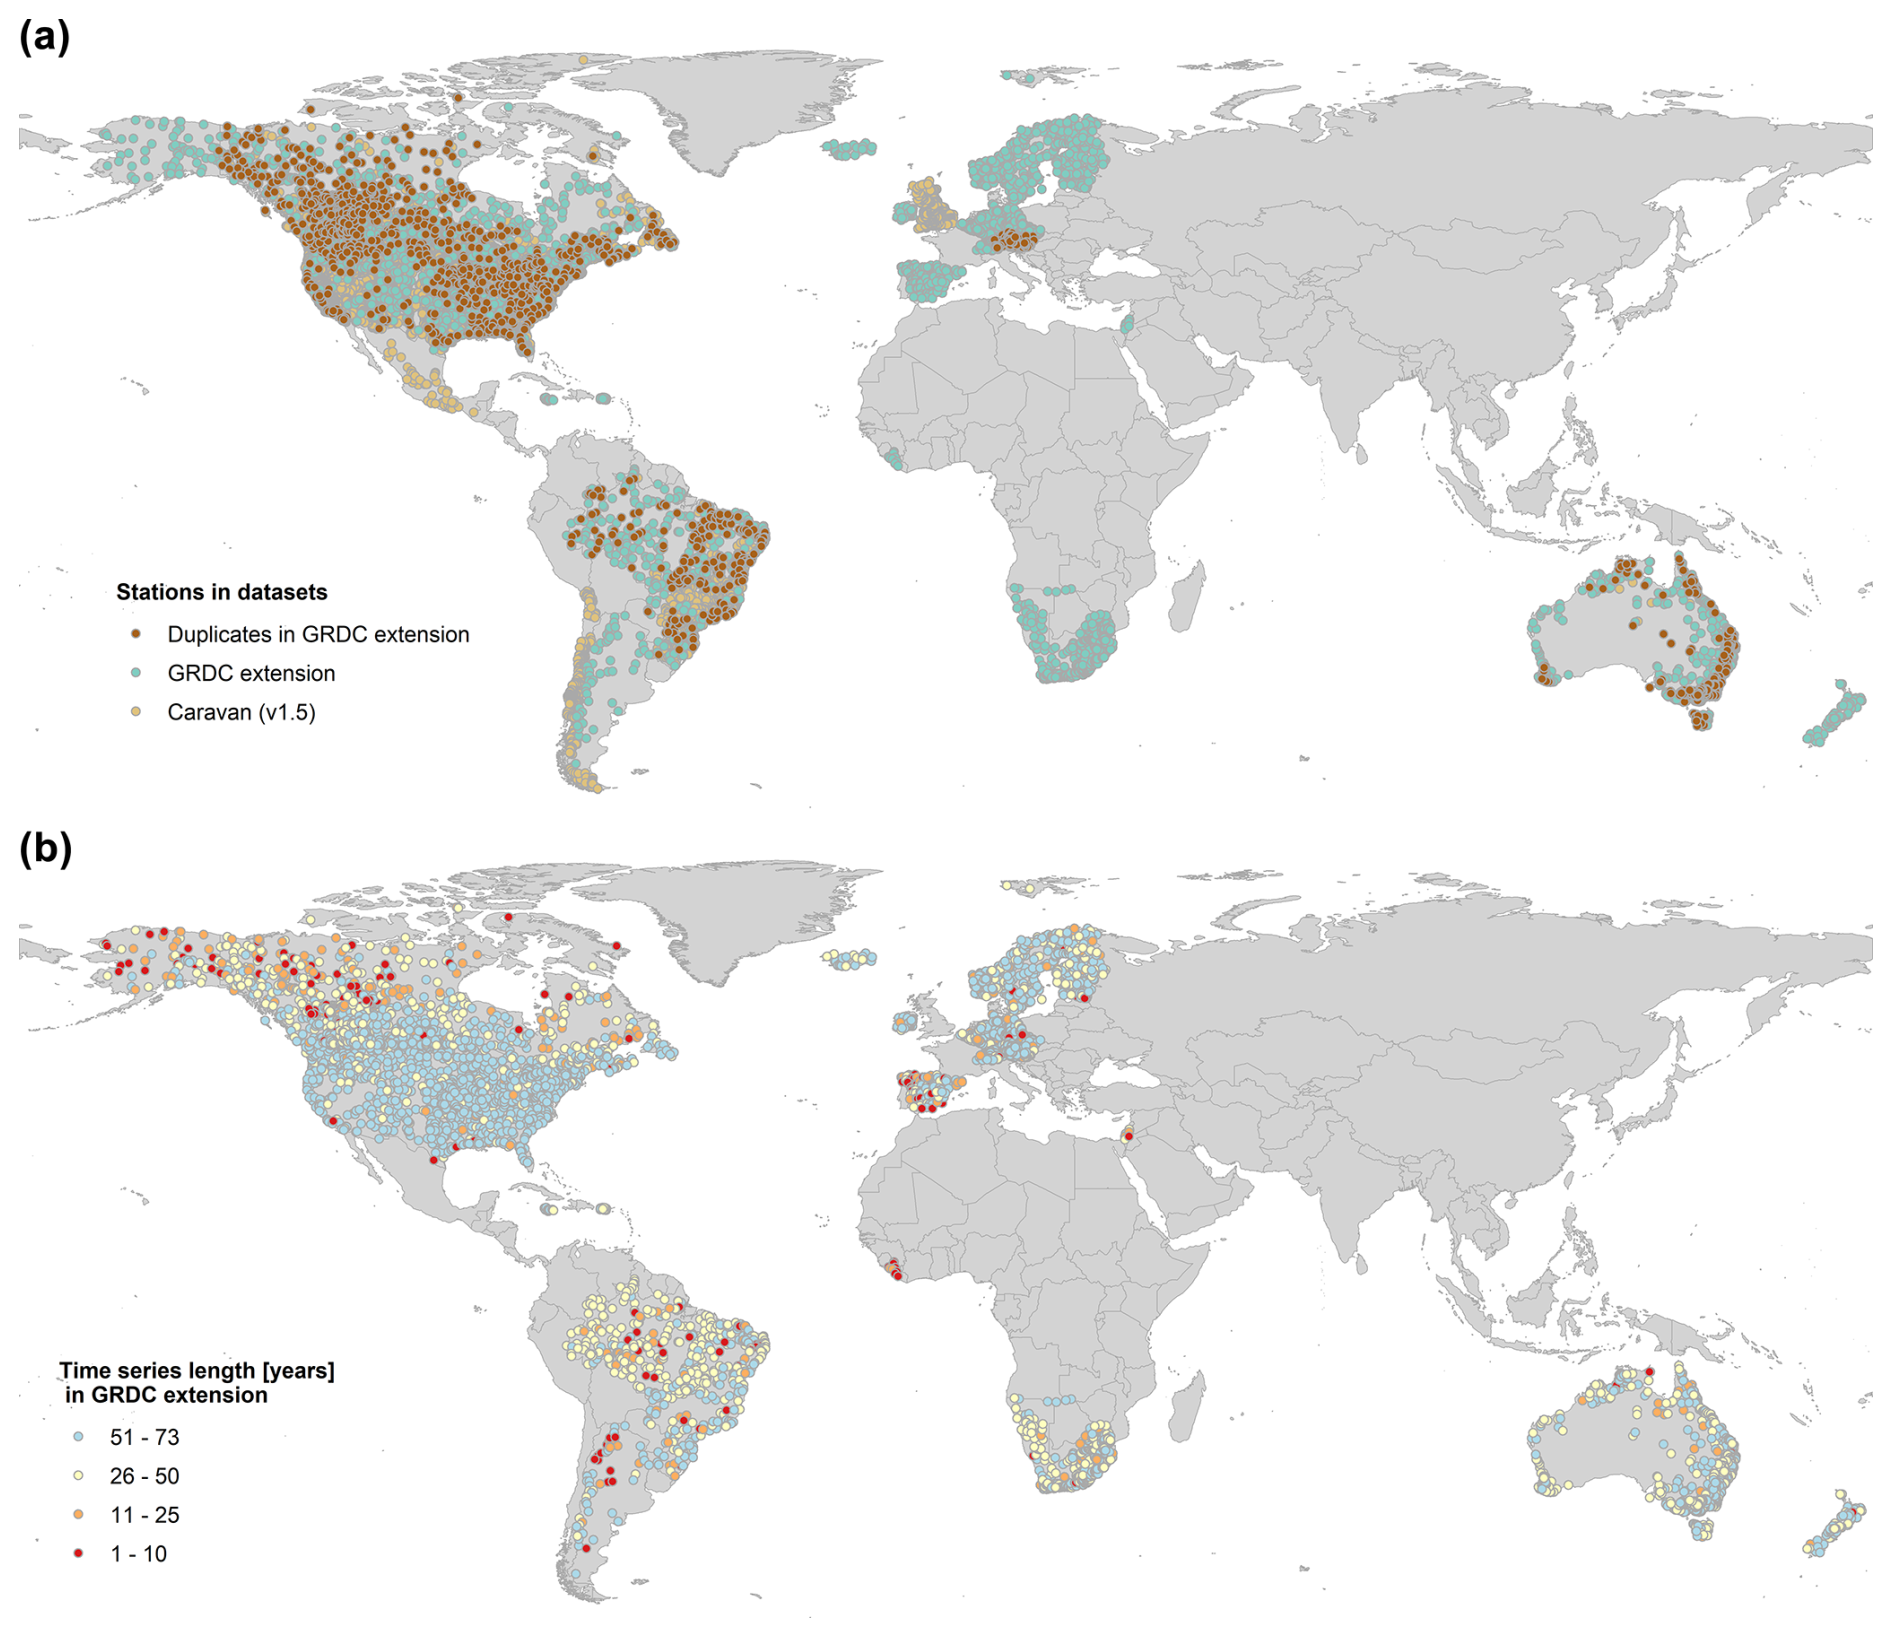
Figure 2(a) Global distribution of stations included in the core Caravan dataset (beige, Kratzert et al., 2025a) and in the GRDC-Caravan extension (green, this paper). Brown shows duplicate stations between the core dataset and the extension. (b) Time series length of stations included in the GRDC-Caravan extension. Note that the data record in the Caravan extension starts in 1951 (because of the forcing data). Longer records for individual stations might exist on the GRDC data portal (GRDC, 2025c).
Table 3Overview of country data included into the dataset. From WMO Region II (Asia), no data are provided in the extension.
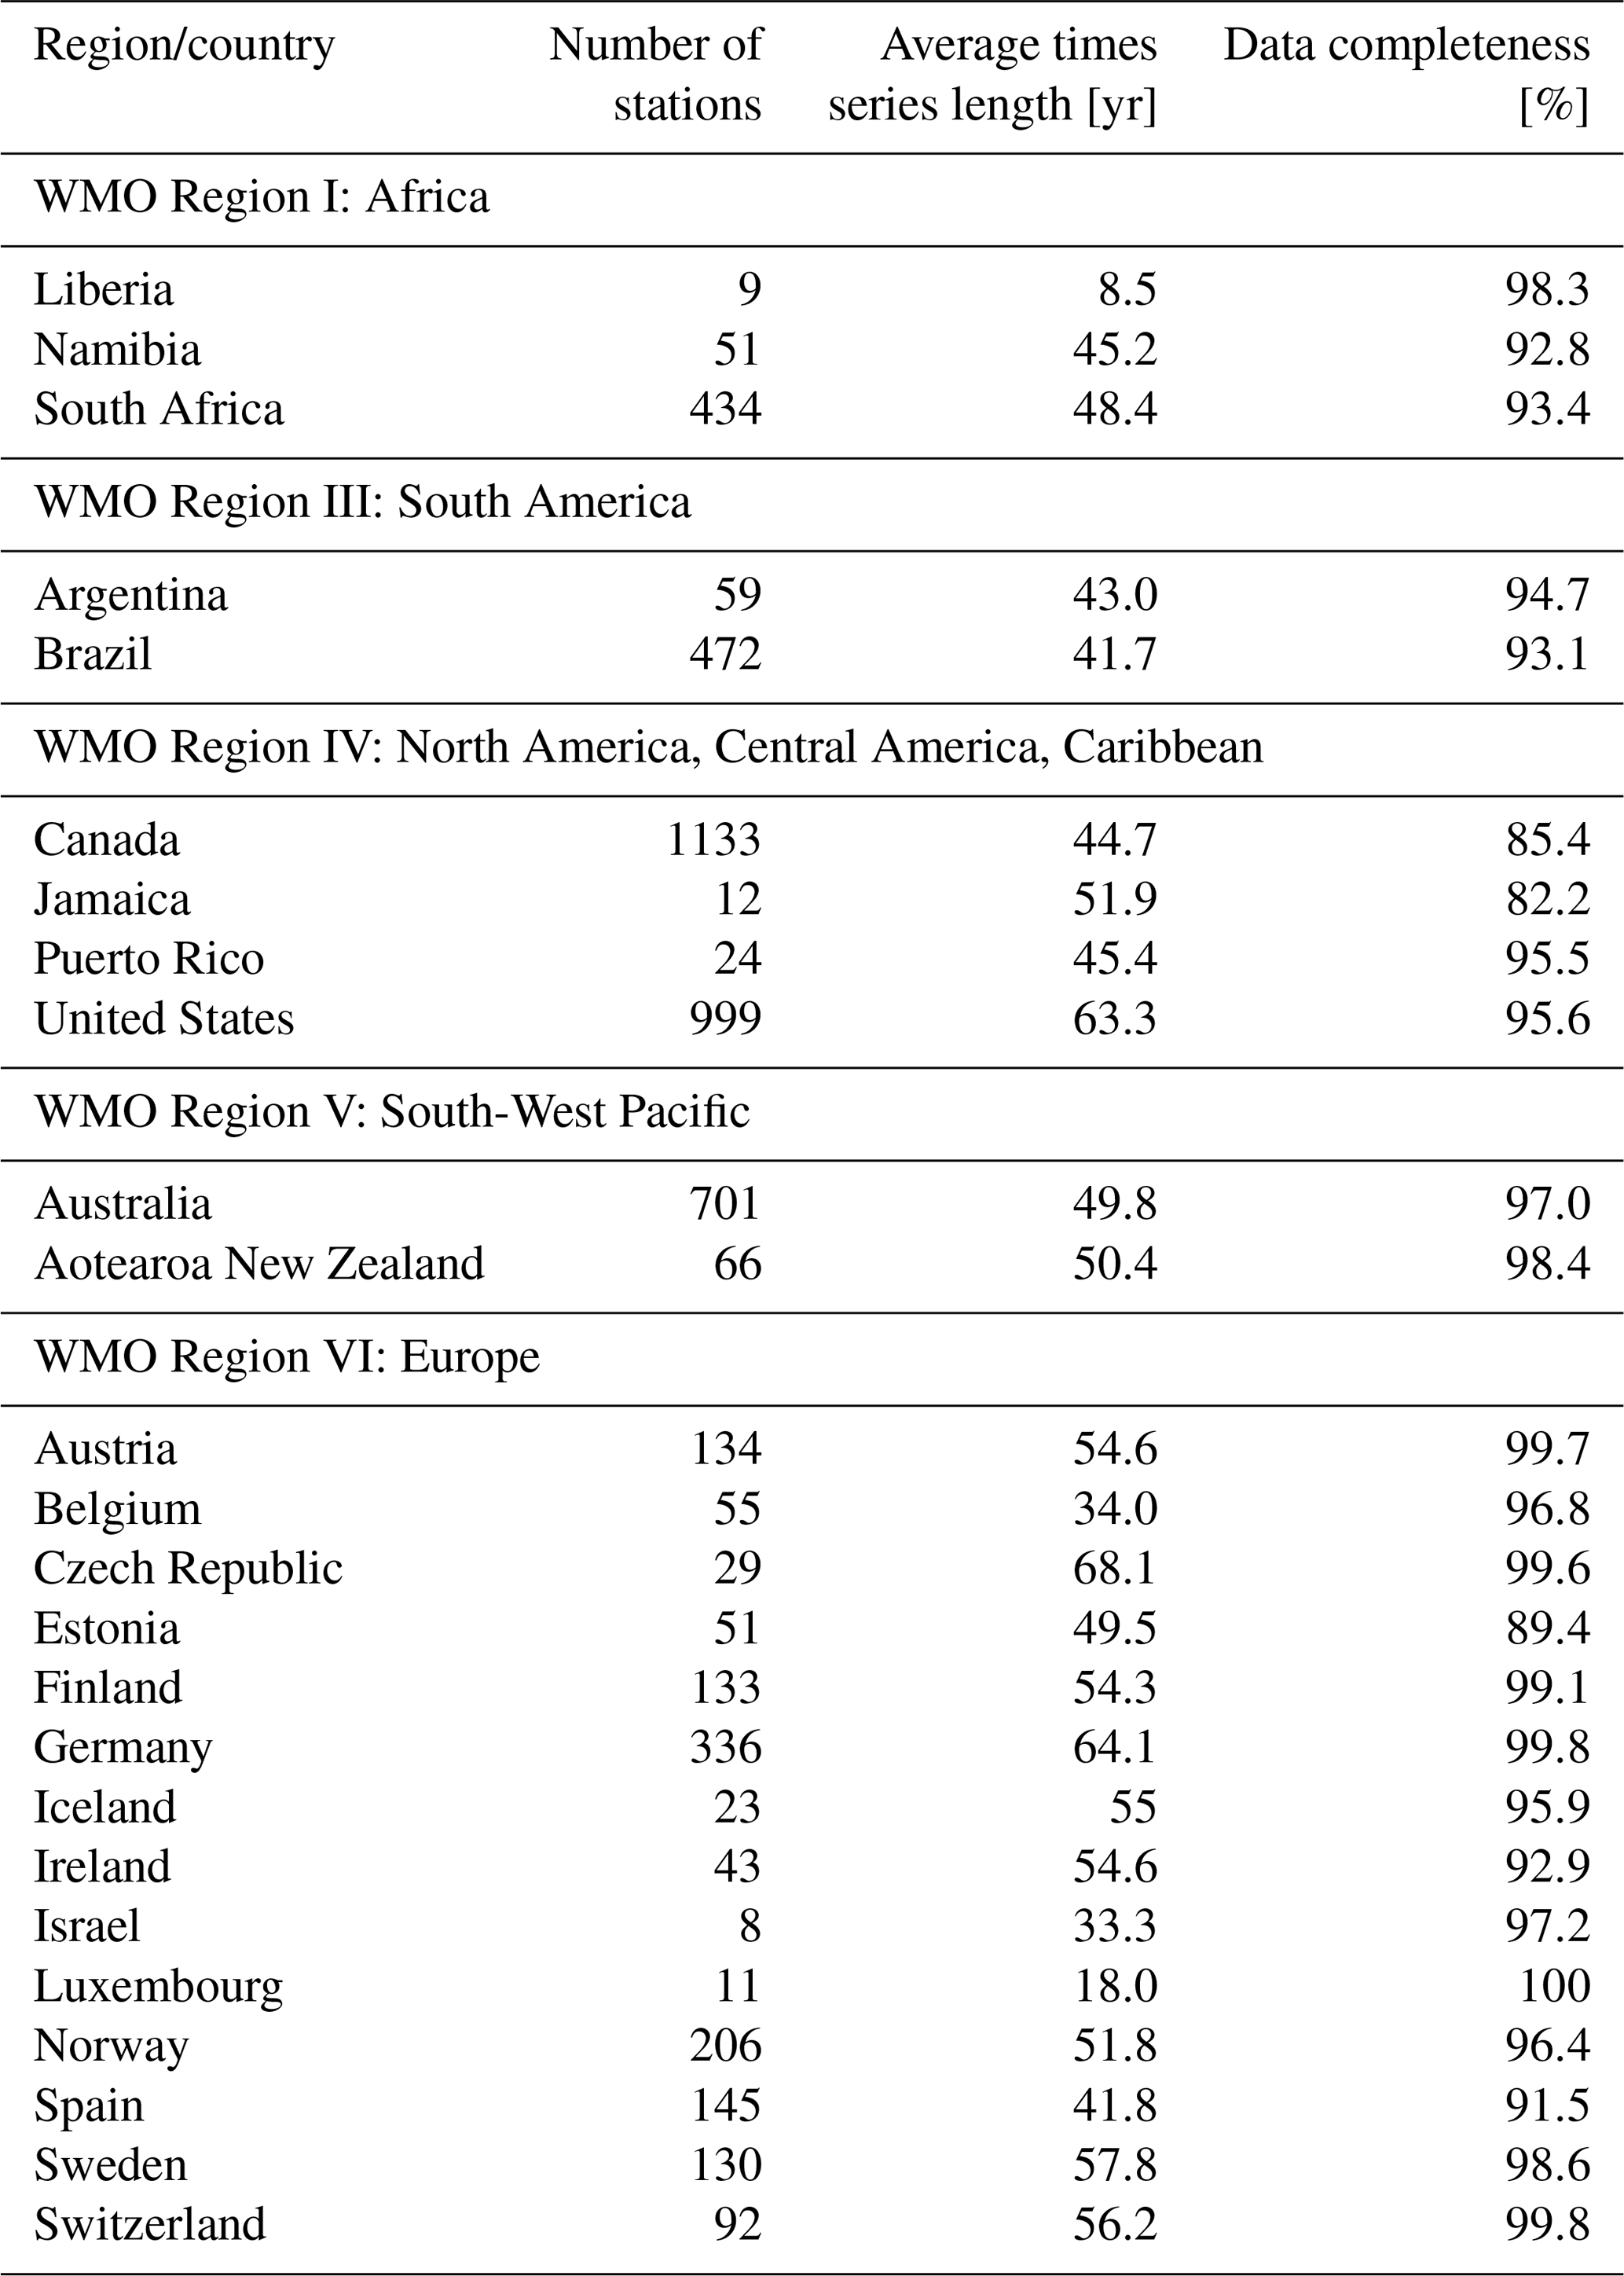
Figure 3 shows the distribution of catchments and fraction of global land mass across the Global Environmental Stratification (GEnS) climate zones (letters “A”–“R”) (Metzger et al., 2013). While most of the global land mass is lying in the “extremely cold and mesic” (“F”, about 16 %) or “extremely hot and moist” area (“R”, about 13 %), comparatively few catchments could be provided with our dataset in these regions (about 600 and 400 stations, respectively). In the “cold and mesic” area (“G”), however, which accounts for the second-largest fraction of global land mass (about 14 %), most of the catchments in the GRDC-Caravan extension could be provided (about 1400 stations). The second-most stations are located in the “warm temperate and mesic” area (“K”, about 800). A large number of catchments in the dataset is also located in the “cool temperate and dry” area (“H”, about 600 stations) and the “cool temperate and moist” area (“J”, about 400 stations), which make up a comparatively small total area on Earth (4 %–6 %).
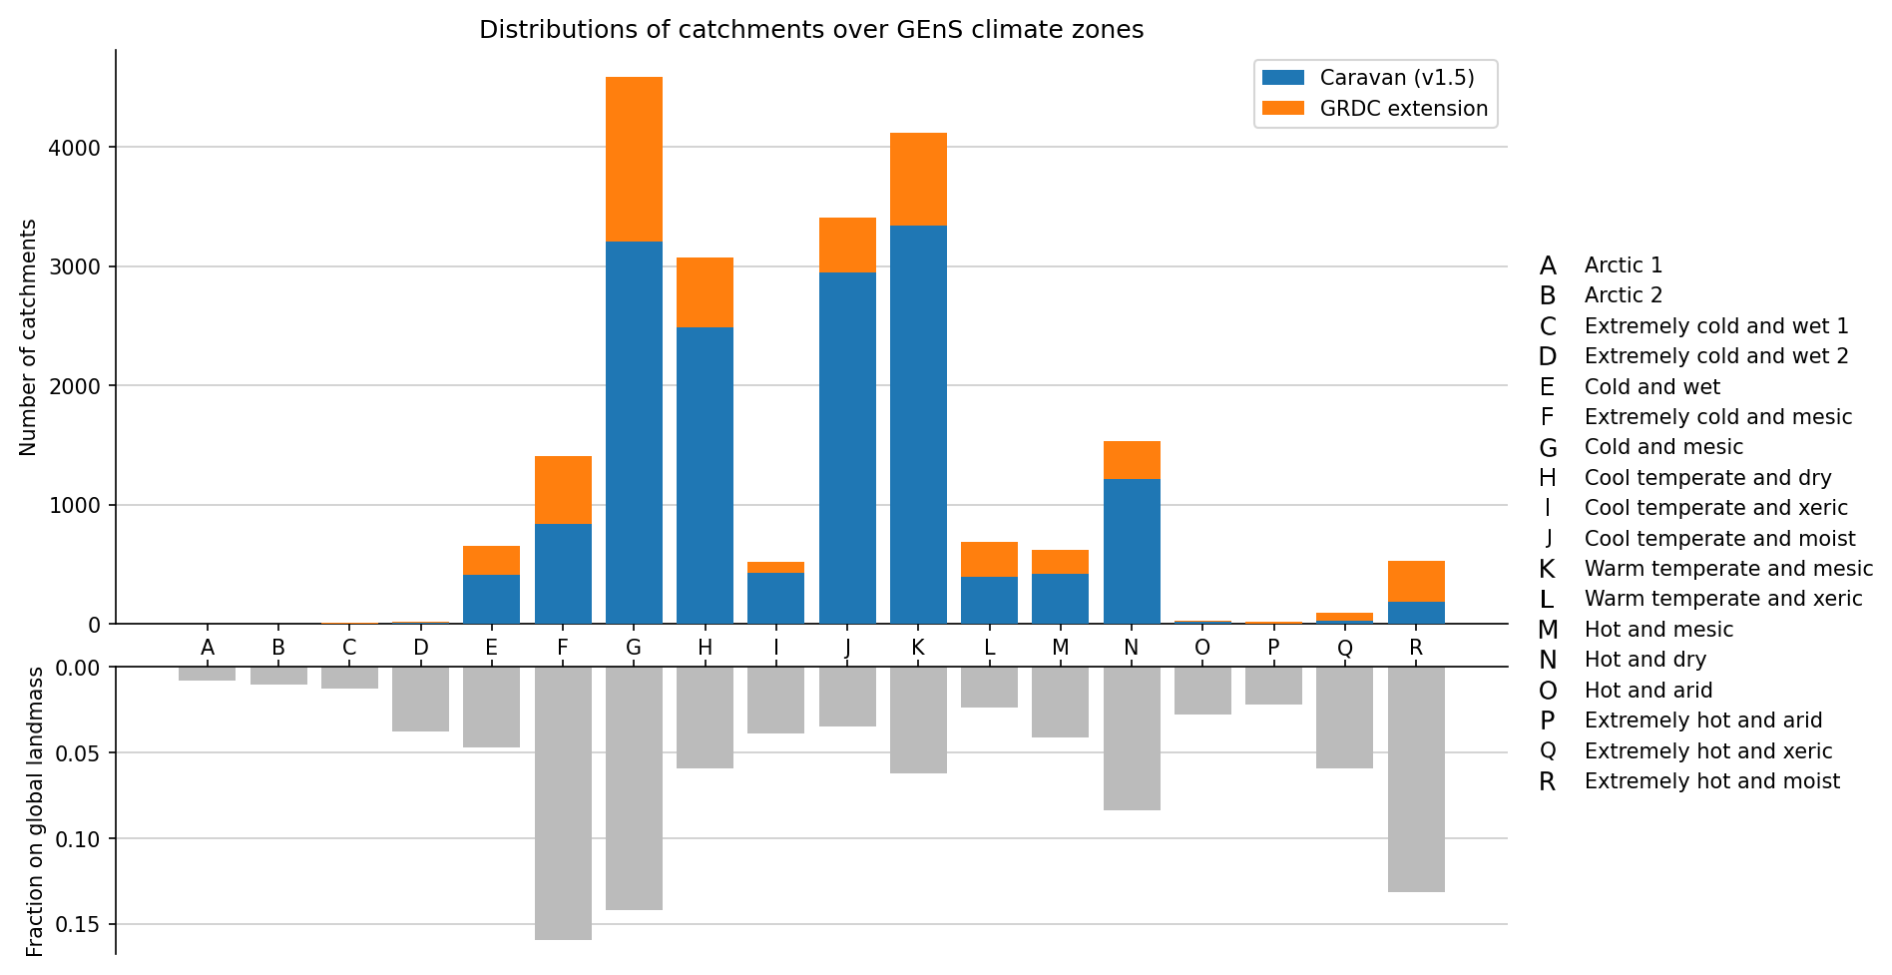
Figure 3Distribution of catchments among the Global Environmental Stratification (GEnS) climate zones (Metzger et al., 2013). Blue bars denote catchments included in the Caravan core dataset (v1.5, Kratzert et al., 2025a), and orange bars denote catchments included in this dataset. The bottom part of the plots shows the fraction of a particular climate zone on the total land mass.
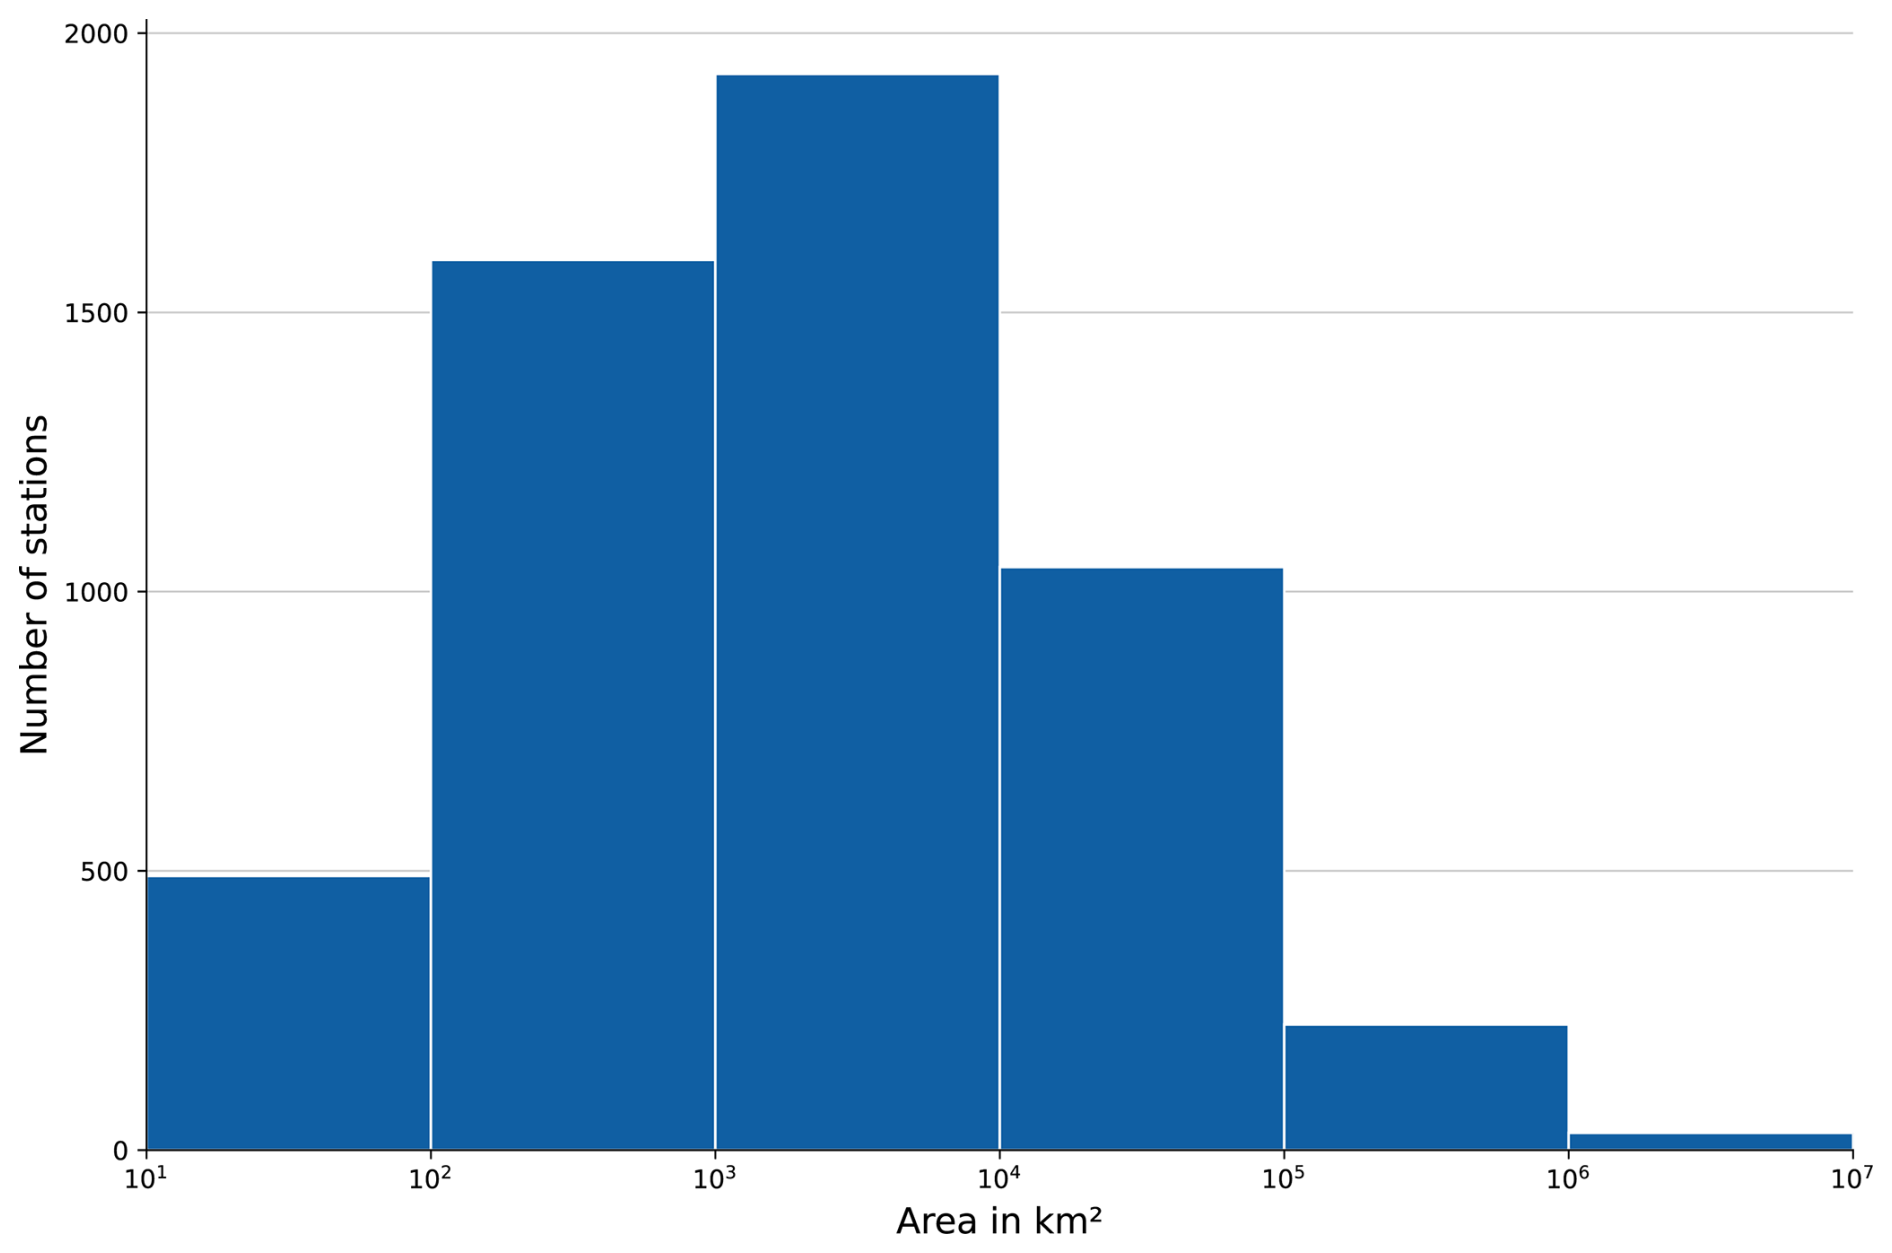
The size of the catchment areas ranges from very small streams with an area of about 2 km2 up to the largest catchment area of the Amazon, covering 4 671 493 km2 (Fig. 4). The majority of the stations (about 36 %) have a catchment area size of 1000–10 000 km2 followed by stations with catchment area sizes of 100–1000 km2 (about 30 %) and 10 000–100 000 km2 (about 19 %). About 9 % of catchments are smaller than 100 km2, and 5 % are larger than 100 000 km2. The median size of the catchments is 2015.8 km2.
Figures 5 and 6 provide an overview of the distribution of streamflow records through time and their average lengths. Table 3 gives an overview of the average time series length by country and the data completeness. The highest number of gauging stations with streamflow data is available between 1980 and 2010, and more than 1000 stations provide a streamflow record of more than 70 years. The longest average time series length was provided by country data from the Czech Republic (68 years), Germany (64 years) and the United States (63 years). The shortest average time series were collected from Liberia (8.5 years) and Luxembourg (18 years). The average length of streamflow records is about 50 years. In total, the extension covers a total of 275 444 years of records.
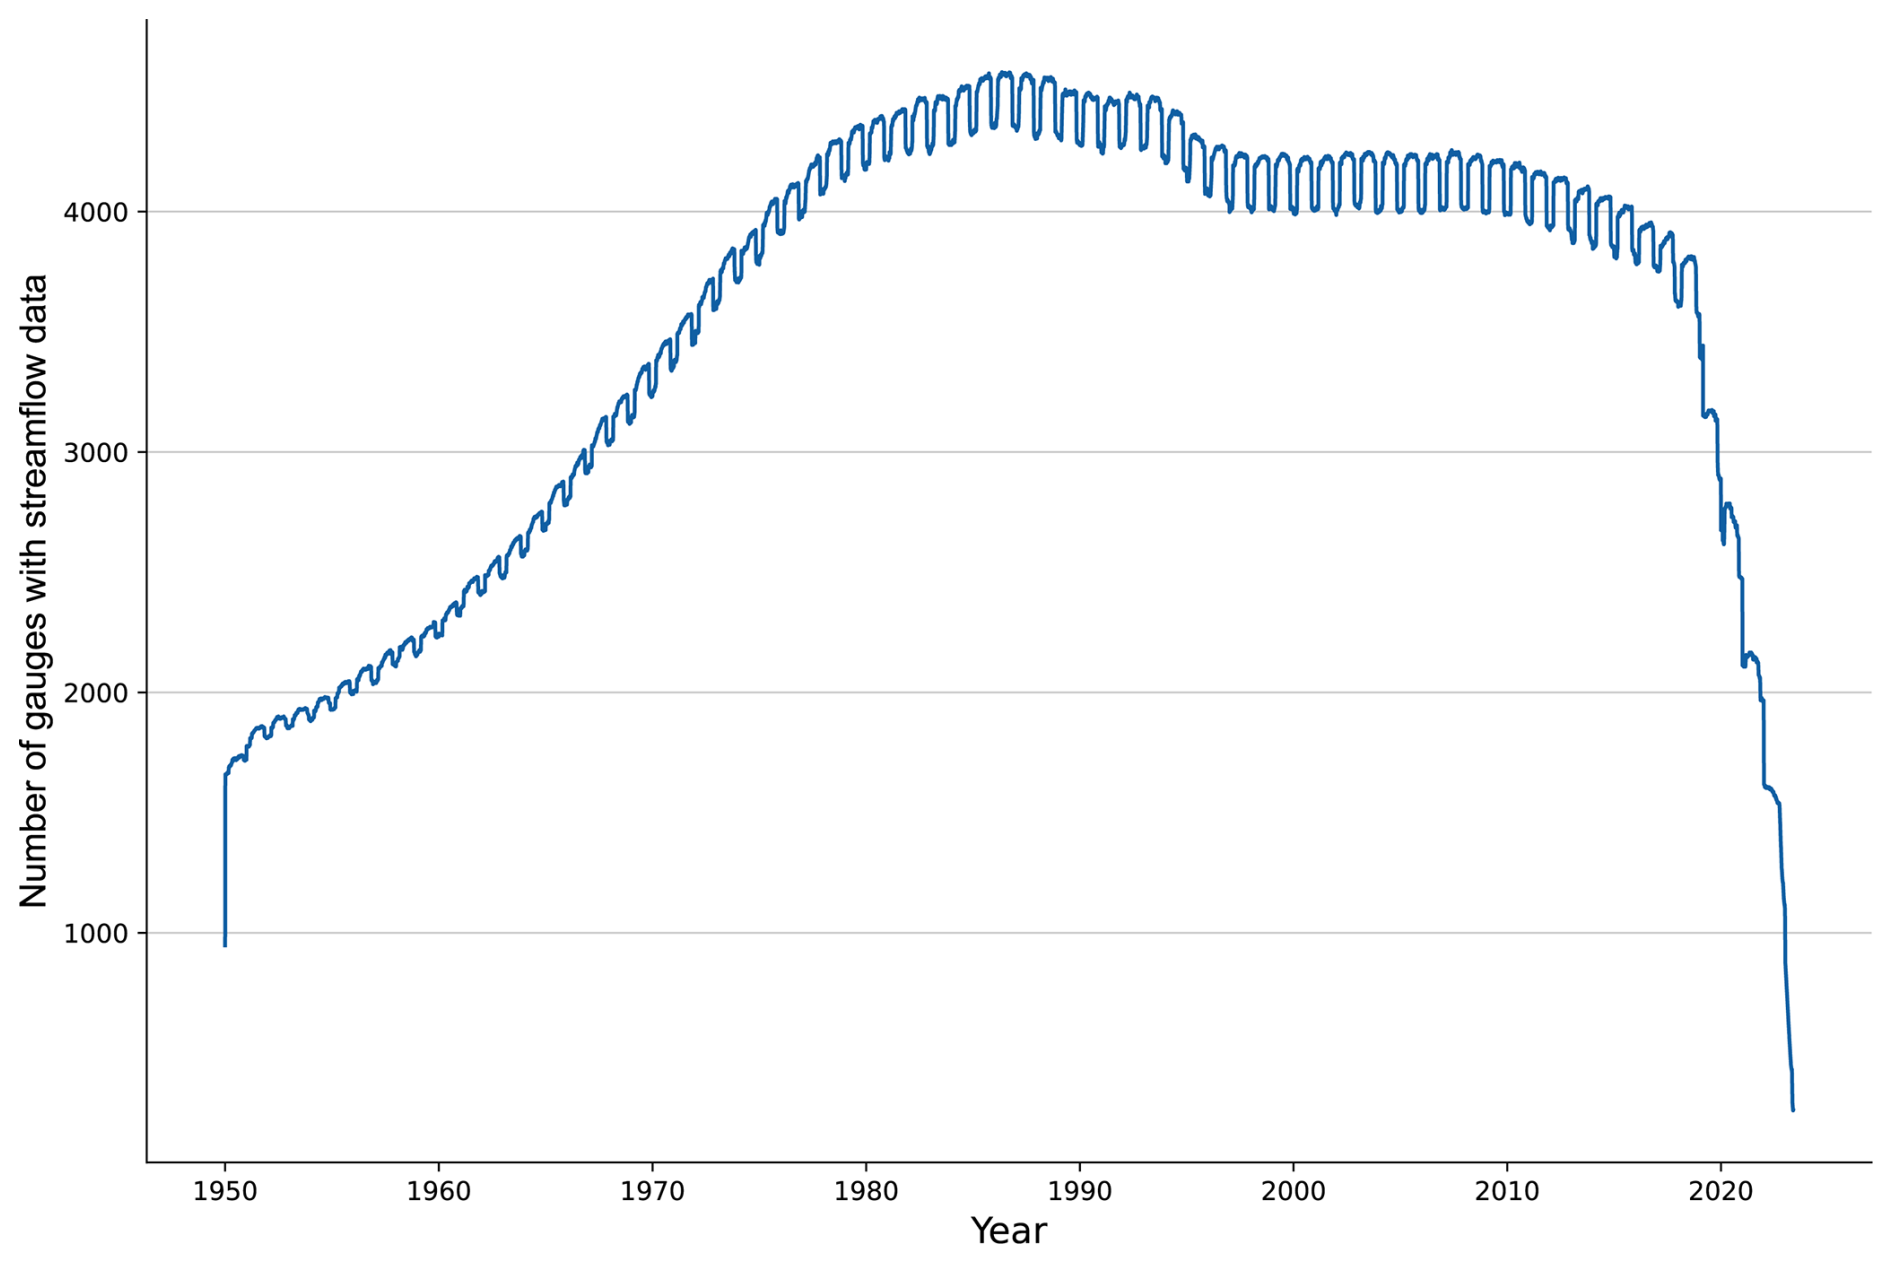
Figure 5Number of gauging stations with streamflow data through time. The recent drop-off is not an indication of a decreasing monitoring infrastructure but rather is evidence of the time it takes until GRDC receives data from NMHS and can release quality-controlled data. The annual cycles in the data availability are due to missing data in snow-dominated regions during winter.
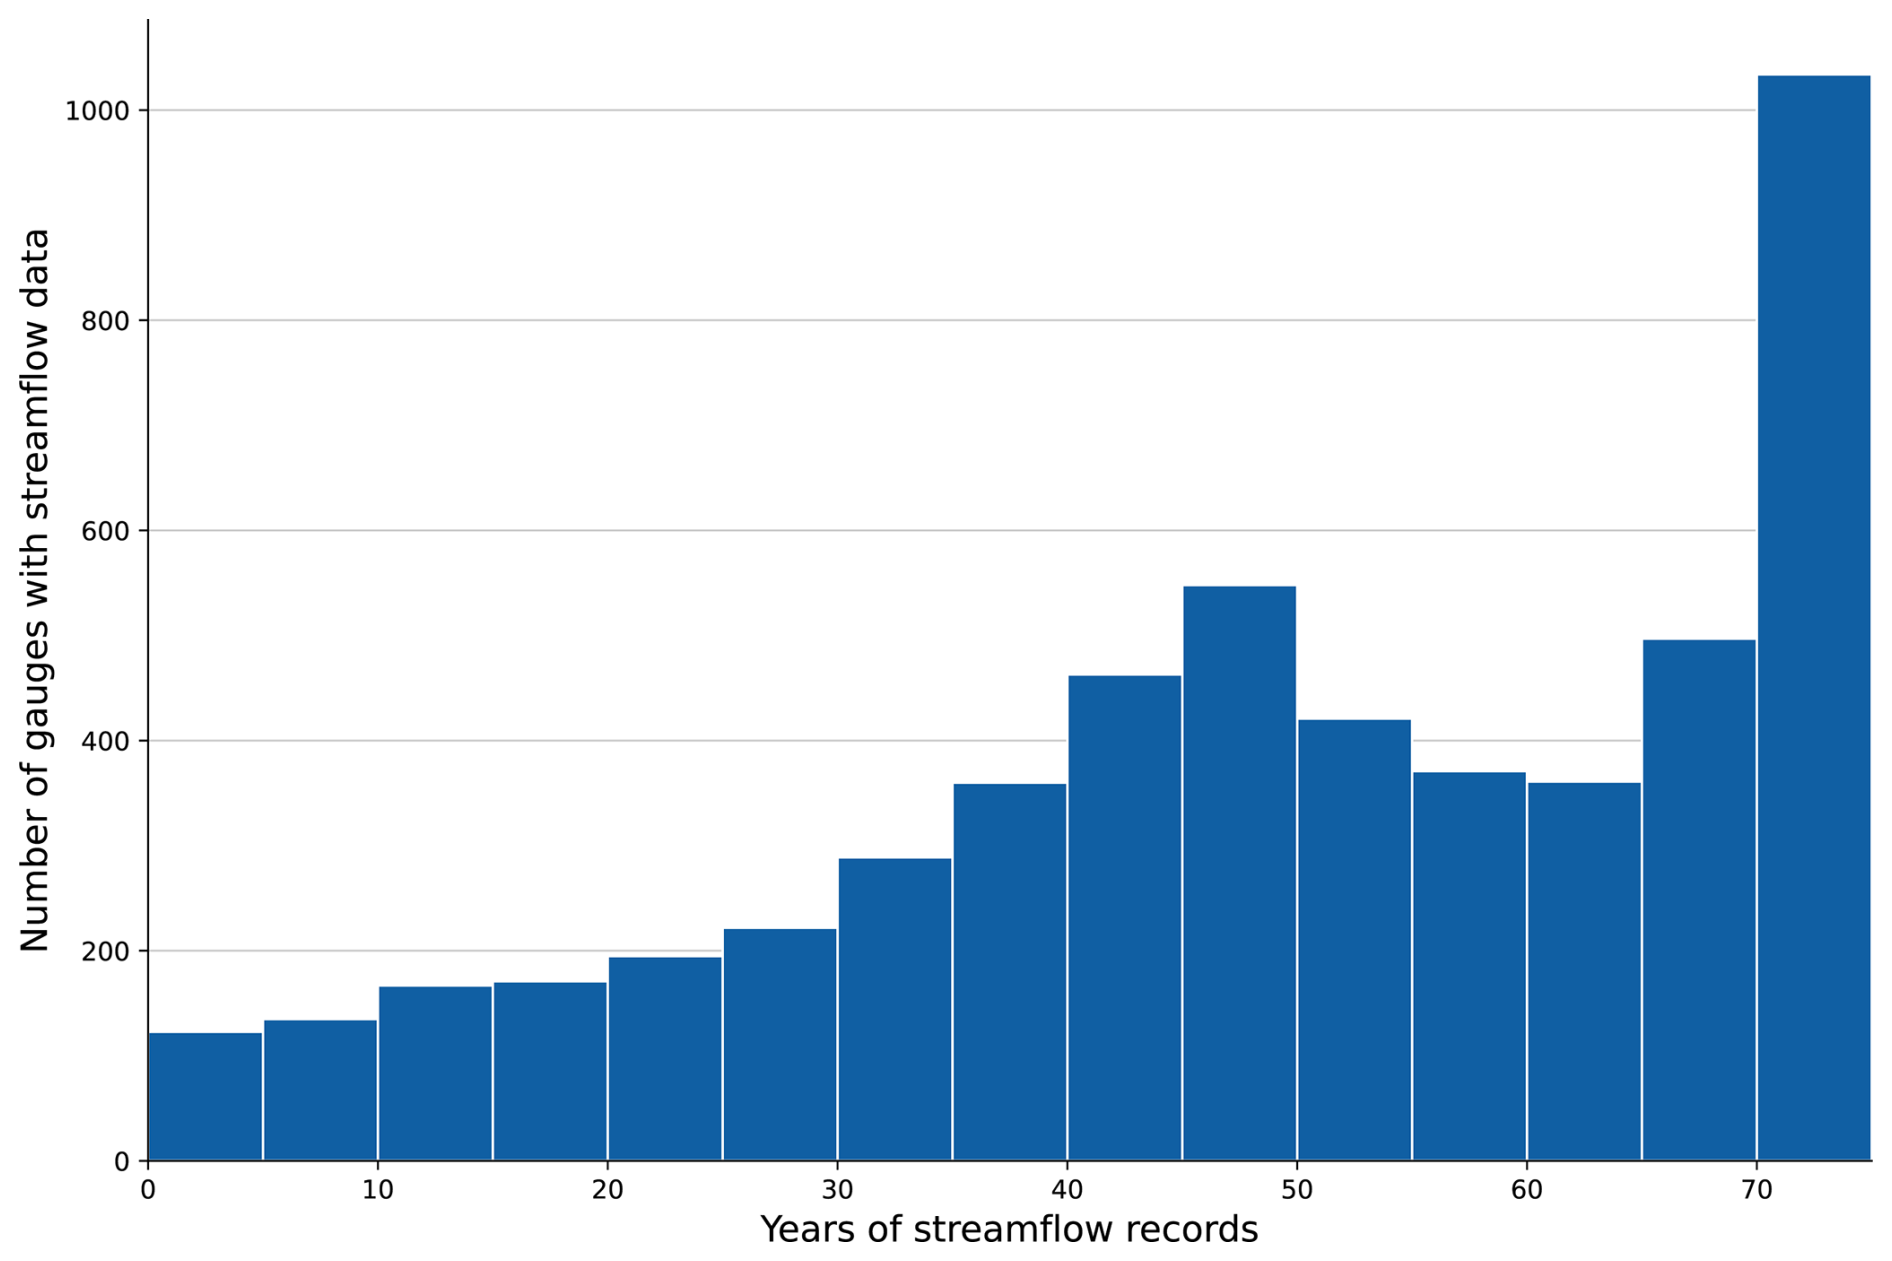
Figure 6Number of gauging stations by years of with streamflow record over time. The average time series length is about 50 years.
The dataset shows a high data completeness of more than 90 % with only few missing values. The lowest completeness was observed in Jamaica (82 %) and Canada (85 %). Missing values are also responsible for annual cycles in data availability in Fig. 5, which originate from snow- and ice-dominated regions during winter. In the same figure, the strong decline in streamflow records since 2020, however, must not be misinterpreted. It is not an indication of a decreasing monitoring infrastructure but is due to the fact that GRDC only includes quality-controlled (yearbook) river discharge data from NMHS. Since many countries take several years for the final release of the quality-controlled data, this time lag until GRDC can release quality-controlled data with confidence is evident in the drop-off of the number of available stations released by NMHS.
In comparison to the core Caravan dataset of Kratzert et al. (2023), the GRDC-Caravan extension strongly increases the global coverage of the dataset and takes the total number of Caravan catchments to 22 372. While in the core Caravan dataset are mostly catchments from North America, central Europe and South America were included, the new extension significantly improves the spatial coverage in northern and southern Europe, South America, South Africa, Australia, and Aotearoa New Zealand. However, there are still many data-scarce regions across Africa and Asia (Fig. 2).
The comparison across climate zones between the core dataset and the extension shows that the majority of catchments in Caravan is now available from the “cold and mesic” area (letter “G”, Fig. 3). The second-largest portion is contributed by the “warm temperate and mesic” area (“K”) followed by the “cool temperate and moist” (“J”) and “cool temperate and dry” area (“H”). Although the extension contributes a distinct number of stations in the “extremely cold and mesic” (“F”) and “extremely hot and moist” areas (“R”), these regions are still underrepresented despite their total fraction of global land mass.
With respect to temporal coverage, the GRDC-Caravan extension increases the time series of Caravan from 40–70 years (660 382 years). The inclusion of pre-1981 data into the GRDC-Caravan extension, however, is now possible as Google Earth Engine now includes the full record of ERA5-Land data. With respect to the catchment size, in the core Caravan dataset only gauges with a total drainage area between 100 and 2000 km2 have been included (Kratzert et al., 2023). In the GRDC-Caravan extension, smaller and much larger catchments are also included. This together with the extended time series is particularly important for studies investigating climate effects on global river basins.
Although the GRDC-Caravan extension supplied several new stations to the dataset, there was also an overlap of 1589 duplicates between the core and the extended datasets. This includes 202 stations from Brazil (CAMELS-BR), 944 in North America (HYSETS), 69 from the US (CAMELS-US), 191 from Australia (CAMELS-AUS) and 183 in central Europe (LamaH-CE). There are a few gauges where a single GRDC gauge maps to both a CAMELS (US) and a HYSETS gauge, which are counted as two duplicates in the value 1589. A high number of duplicates was still included in the expansion because they add an average of 13.8 time series years.
The GRDC-Caravan extension dataset is publicly available on Zenodo: https://doi.org/10.5281/zenodo.15349031 (Färber et al., 2025). The original code to produce Caravan extensions is available at https://github.com/kratzert/Caravan (last access: 22 August 2025, Kratzert, 2025; DOI: https://doi.org/10.5281/zenodo.15529786, Kratzert et al., 2025b). The R package “GRDCFlowTools” can be accessed via https://github.com/bafg-bund/GRDCFlowTools (GRDC, 2025b).
This paper introduces a contribution to the Caravan initiative extending the core dataset in space, but also in time. Although some countries are already covered in the core Caravan dataset, GRDC stations for the same countries, such as the USA, Canada, Brazil and others, have been added because the GRDC time series have brought an additional 70 years of discharge data for over 700 stations. On average, for duplicated basins we add 13.8 years. We show that using the Caravan platform, flow data from any set of catchments can be augmented using hydrometeorological time series and catchment attributes and formatted in a way that enables its immediate use as part of the Caravan dataset. This benefits the community, and because the extraction process is automated, additional catchments can easily be added.
We feel it is useful to step back and look at the progress the field of LSH has made to appreciate the importance of this extension and of the Caravan project more generally. A decade ago, open datasets providing hydrometeorological time series and attributes describing the landscape and human influences in large samples of catchments barely existed (Gupta et al., 2014). This impeded the systematic analysis of changes across hydroclimatic gradients, levels of human interventions and decades. Since then, significant community efforts have been underway to collate such datasets and make them publicly available. It resulted in data from multiple countries entering the public domain, adhering to a common blueprint formed by early datasets (MOPEX and CAMELS). Caravan and its extensions (including this one) currently encompass spatially consistent time series and attributes from 22 494 catchments from 35 countries, covering a total of 660 382 years of records, all published under an open license, free for the community to use. LSH datasets have enabled hundreds of hydrological studies across the globe, their use keeps increasing, and we believe they will keep playing a key role in hydrological sciences for the foreseeable future.
Without the 25 WMO member states who provided their data under an open-access license, the publication of the GRDC Caravan extension would not have been possible – most of the data in the Global Runoff Database is still published under a data policy which requires identified access, prohibiting redistribution and commercial use. As GRDC is continuously receiving new data from NMHS, it is intended that this dataset will be updated. We hope that in the future more and more member states will make their data available under open licenses so that they can be included in future versions of the extension.
Future versions of the extension will also benefit from upgrades of the Caravan dataset, such as the recent inclusion of weather forecasts/hindcasts (Shalev and Kratzert 2024a, b). Overall, we see these future developments as two-way exchanges between this extension and the wider Caravan dataset: this extension extends Caravan and, at the same time, will benefit from future Caravan improvements. Extending the dataset in space and time is just two ways to contribute to Caravan, and here we invite members of the community to imagine and share other extensions, for instance, including time series for new variables or new landscape attributes.
HP, FK, NA, GS, SM and UL were responsible for the design and processing of the dataset; CF, HP, FK and NA organized and wrote the manuscript. All authors discussed the results and contributed to the final paper.
The contact author has declared that none of the authors has any competing interests.
Publisher's note: Copernicus Publications remains neutral with regard to jurisdictional claims made in the text, published maps, institutional affiliations, or any other geographical representation in this paper. While Copernicus Publications makes every effort to include appropriate place names, the final responsibility lies with the authors.
GRDC thanks the World Meteorological Organization (WMO) for providing support and the Federal Institute of Hydrology, Germany (BfG), for hosting. Thomas Recknagel is acknowledged for providing the R package “GRDCFlowTools”. The NMHS are acknowledged for providing their valuable datasets.
GRDC received financial support from the Federal Ministry of Transport (BMV).
This paper was edited by Sibylle K. Hassler and reviewed by Thiago Nascimento and one anonymous referee.
Addor, N., Newman, A. J., Mizukami, N., and Clark, M. P.: The CAMELS data set: catchment attributes and meteorology for large-sample studies, Hydrol. Earth Syst. Sci., 21, 5293–5313, https://doi.org/10.5194/hess-21-5293-2017, 2017.
Addor, N., Do, H. X., Alvarez-Garreton, C., Coxon, G., Fowler, K., and Mendoza, P. A.: Large-sample hydrology: recent progress, guidelines for new datasets and grand challenges, Hydrolog. Sci. J., 65, 712–725, https://doi.org/10.1080/02626667.2019.1683182, 2020.
Alvarez-Garreton, C., Mendoza, P. A., Boisier, J. P., Addor, N., Galleguillos, M., Zambrano-Bigiarini, M., Lara, A., Puelma, C., Cortes, G., Garreaud, R., McPhee, J., and Ayala, A.: The CAMELS-CL dataset: catchment attributes and meteorology for large sample studies – Chile dataset, Hydrol. Earth Syst. Sci., 22, 5817–5846, https://doi.org/10.5194/hess-22-5817-2018, 2018.
Arsenault, R., Brissette, F., Martel, J.-L., Troin, M., Lévesque, G., Davidson-Chaput, J., Gonzalez, M. C., Ameli, A., and Poulin, A.: A comprehensive, multisource database for hydrometeorological modeling of 14 425 North American watersheds, Sci. Data, 7, 243, https://doi.org/10.1038/s41597-020-00583-2, 2020.
Bloomfield, J. P., Gong, M., Marchant, B. P., Coxon, G., and Addor, N.: How is Baseflow Index (BFI) impacted by water resource management practices?, Hydrol. Earth Syst. Sci., 25, 5355–5379, https://doi.org/10.5194/hess-25-5355-2021, 2021.
Casado Rodríguez, J.: CAMELS-ES: Catchment Attributes and Meteorology for Large-Sample Studies – Spain (1.0.2), Zenodo [data set], https://doi.org/10.5281/zenodo.8428374, 2023.
Chagas, V. B. P., Chaffe, P. L. B., Addor, N., Fan, F. M., Fleischmann, A. S., Paiva, R. C. D., and Siqueira, V. A.: CAMELS-BR: hydrometeorological time series and landscape attributes for 897 catchments in Brazil, Earth Syst. Sci. Data, 12, 2075–2096, https://doi.org/10.5194/essd-12-2075-2020, 2020.
Chagas, V. B. P., Chaffe, P. L. B., and Blöschl, G.: Climate and land management accelerate the Brazilian water cycle, Nat. Commun., 13, 5136, https://doi.org/10.1038/s41467-022-32580-x, 2022.
Clerc-Schwarzenbach, F., Selleri, G., Neri, M., Toth, E., van Meerveld, I., and Seibert, J.: Large-sample hydrology – a few camels or a whole caravan?, Hydrol. Earth Syst. Sci., 28, 4219–4237, https://doi.org/10.5194/hess-28-4219-2024, 2024.
Coxon, G., Addor, N., Bloomfield, J. P., Freer, J., Fry, M., Hannaford, J., Howden, N. J. K., Lane, R., Lewis, M., Robinson, E. L., Wagener, T., and Woods, R.: CAMELS-GB: hydrometeorological time series and landscape attributes for 671 catchments in Great Britain, Earth Syst. Sci. Data, 12, 2459–2483, https://doi.org/10.5194/essd-12-2459-2020, 2020.
Csardi, G. and Nepusz, T.: The igraph software package for complex network research, InterJournal, Complex Systems, 1695, https://igraph.org (last access: 22 August 2025), 2006.
Do, H. X., Gudmundsson, L., Leonard, M., and Westra, S.: The Global Streamflow Indices and Metadata Archive (GSIM) – Part 1: The production of a daily streamflow archive and metadata, Earth Syst. Sci. Data, 10, 765–785, https://doi.org/10.5194/essd-10-765-2018, 2018.
Dolich, A., Maharjan, A., Mälicke, M., Manoj J, A., and Loritz, R.: Caravan-DE: Caravan extension Germany – German dataset for large-sample hydrology (v1.0.1) [data set], https://doi.org/10.5281/zenodo.13983616, 2024.
Dorigo, W., Dietrich, S., Aires, F., Brocca, L., Carter, S., Cretaux, J.-F., Dunkerley, D., Enomoto, H., Forsberg, R., Güntner, A., Hegglin, M. I., Hollmann, R., Hurst, D. F., Johannessen, J. A., Kummerow, C., Lee, T., Luojus, K., Looser, U., Miralles, D. G., Pellet, V., Recknagel, T., Vargas, C. R., Schneider, U., Schoeneich, P., Schröder, M., Tapper, N., Vuglinsky, V., Wagner, W., Yu, L., Zappa, L., Zemp, M., and Aich, V.: Closing the Water Cycle from Observations across Scales: Where Do We Stand?, B. Am. Meteorol. Soc., 102, E1897–E1935, https://doi.org/10.1175/BAMS-D-19-0316.1, 2021.
Färber, C., Plessow, H., Mischel, S., Kratzert, F., Addor, N., Shalev, G., and Looser, U.: GRDC-Caravan: extending the original dataset with data from the Global Runoff Data Centre (0.6), Zenodo [data set], https://doi.org/10.5281/zenodo.15349031, 2025.
Fowler, K. J. A., Acharya, S. C., Addor, N., Chou, C., and Peel, M. C.: CAMELS-AUS: hydrometeorological time series and landscape attributes for 222 catchments in Australia, Earth Syst. Sci. Data, 13, 3847–3867, https://doi.org/10.5194/essd-13-3847-2021, 2021.
GCOS: The Status of the Global Climate Observing System 2021: The GCOS Status Report (GCOS-240), WMO, Geneva, 384 pp., https://library.wmo.int/idurl/4/57596 (last access: 22 August 2025), 2021.
GEO: The GEOSS Water Strategy: From Observations to Decisions, Japan Aerospace Exploration Agency, Tokyo, 276 pp., https://ceos.org/document_management/Ad_Hoc_Teams/WSIST/WSIST_GEOSS-Water-Strategy-Full-Report_Jan2014.pdf (last access: 22 August 2025), 2014.
GRDC: Policy guidelines for the dissemination of data: https://grdc.bafg.de/about/data_policy, last access: 11 February 2025a.
GRDC: GRDC Flow Tools, GitHub [code], https://github.com/bafg-bund/GRDCFlowTools, last access: 11 February 2025b.
GRDC: Data Portal: https://grdc.bafg.de/data/data_portal/, last access: 11 February 2025c.
Gudmundsson, L., Do, H. X., Leonard, M., and Westra, S.: The Global Streamflow Indices and Metadata Archive (GSIM) – Part 2: Quality control, time-series indices and homogeneity assessment, Earth Syst. Sci. Data, 10, 787–804, https://doi.org/10.5194/essd-10-787-2018, 2018.
Gupta, H. V., Perrin, C., Blöschl, G., Montanari, A., Kumar, R., Clark, M., and Andréassian, V.: Large-sample hydrology: a need to balance depth with breadth, Hydrol. Earth Syst. Sci., 18, 463–477, https://doi.org/10.5194/hess-18-463-2014, 2014.
Heberger, M.: delineator.py: Fast, accurate watershed delineation using hybrid vector- and raster-based methods and data from MERIT-Hydro (Version 1.0) [data set], https://doi.org/10.5281/zenodo.7314287, 2021.
Helgason, H. B. and Nijssen, B.: LamaH-Ice: LArge-SaMple DAta for Hydrology and Environmental Sciences for Iceland, HydroShare [data set], https://doi.org/10.4211/hs.86117a5f36cc4b7c90a5d54e18161c91, 2024.
Höge, M., Kauzlaric, M., Siber, R., Schönenberger, U., Horton, P., Schwanbeck, J., Floriancic, M. G., Viviroli, D., Wilhelm, S., Sikorska-Senoner, A. E., Addor, N., Brunner, M., Pool, S., Zappa, M., and Fenicia, F.: Catchment attributes and hydro-meteorological time series for large-sample studies across hydrologic Switzerland (CAMELS-CH) (0.8), Zenodo [data set], https://doi.org/10.5281/zenodo.10354485, 2023.
Klingler, C., Schulz, K., and Herrnegger, M.: LamaH-CE: LArge-SaMple DAta for Hydrology and Environmental Sciences for Central Europe, Earth Syst. Sci. Data, 13, 4529–4565, https://doi.org/10.5194/essd-13-4529-2021, 2021.
Koch, J.: Caravan extension Denmark – Danish dataset for large-sample hydrology (v_05), Zenodo [data set], https://doi.org/10.5281/zenodo.7962379, 2022.
Kratzert, F.: Caravan – A global community dataset for large-sample hydrology, GitHub [code], https://github.com/kratzert/Caravan, last access: 11 February 2025.
Kratzert, F., Klotz, D., Herrnegger, M., Sampson, A. K., Hochreiter, S., and Nearing, G. S.: Toward Improved Predictions in Ungauged Basins: Exploiting the Power of Machine Learning, Water Resour. Res., 55, 11344–11354, https://doi.org/10.1029/2019WR026065, 2019a.
Kratzert, F., Klotz, D., Shalev, G., Klambauer, G., Hochreiter, S., and Nearing, G.: Towards learning universal, regional, and local hydrological behaviors via machine learning applied to large-sample datasets, Hydrol. Earth Syst. Sci., 23, 5089–5110, https://doi.org/10.5194/hess-23-5089-2019, 2019b.
Kratzert, F., Nearing, G., Addor, N., Erickson, T., Gauch, M., Gilon, O., Gudmundsson, L., Hassidim, A., Klotz, D., Nevo, S., Shalev, G., and Matias, Y.: Caravan – A global community dataset for large-sample hydrology, Sci. Data, 10, 61, https://doi.org/10.1038/s41597-023-01975-w, 2023.
Kratzert, F., Nearing, G., Addor, N., Erickson, T., Gauch, M., Gilon, O., Gudmundsson, L., Hassidim, A., Klotz, D., Nevo, S., Shalev, G., and Matias, Y.: Caravan – A global community dataset for large-sample hydrology (1.5), Zenodo [data set], https://doi.org/10.5281/zenodo.14673536, 2025a.
Kratzert, F., Nearing, G., Addor, N., Erickson, T., Gauch, M., Gilon, O., Gudmundsson, L., Hassidim, A., Klotz, D., Nevo, S., Shalev, G., and Matias, Y.: Caravan – A global community dataset for large-sample hydrology (1.6), Zenodo [code], https://doi.org/10.5281/zenodo.15529786, 2025b.
Lawford, R., Unninayar, S., Huffman, G. J., Grabs, W., Gutiérrez, A., Ishida-Watanabe, C., and Koike, T.: Implementing the GEOSS water strategy: from observations to decisions, Int. J. Digit Earth, 16, 1439–1468, https://doi.org/10.1080/17538947.2023.2202420, 2023.
Lehner, B.: Derivation of watershed boundaries for GRDC gauging stations based on the hydrosheds drainage network, GRDC Report Series, 41, Koblenz, Germany, 18 pp., https://doi.org/10.5675/GRDC_Report_41, 2012.
Lehner, B., Verdin, K., and Jarvis, A.: New Global Hydrography Derived From Spaceborne Elevation Data, EOS, 89, 93–94, https://doi.org/10.1029/2008EO100001, 2008.
Lehner, B., Linke, S., and Thieme, M.: HydroATLAS version 1.0 figshare [data set], https://doi.org/10.6084/m9.figshare.9890531.v1, 2019.
Lin, P., Pan, M., Beck, H. E., Yang, Y., Yamazaki, D., Frasson, R., David, C. H., Durand, M., Pavelsky, T. M., Allen, G. H., Gleason, C. J., and Wood, E. F.: Global Reconstruction of Naturalized River Flows at 2.94 Million Reaches, Water Resour. Res., 55, 6499–6516, https://doi.org/10.1029/2019WR025287, 2019.
Linke, S., Lehner, B., Ouellet Dallaire, C., Ariwi, J., Grill, G., Anand, M., Beames, P., Burchard-Levine, V., Maxwell, S., Moidu, H., Tan, F., and Thieme, M.: Global hydro-environmental sub-basin and river reach characteristics at high spatial resolution, Sci. Data, 6, 283, https://doi.org/10.1038/s41597-019-0300-6, 2019.
Loritz, R., Dolich, A., Acuña Espinoza, E., Ebeling, P., Guse, B., Götte, J., Hassler, S. K., Hauffe, C., Heidbüchel, I., Kiesel, J., Mälicke, M., Müller-Thomy, H., Stölzle, M., and Tarasova, L.: CAMELS-DE: hydro-meteorological time series and attributes for 1582 catchments in Germany, Earth Syst. Sci. Data, 16, 5625–5642, https://doi.org/10.5194/essd-16-5625-2024, 2024.
Metzger, M. J., Bunce, R. G. H., Jongman, R. H. G., Sayre, R., Trabucco, A., and Zomer, R.: A high-resolution bioclimate map of the world: a unifying framework for global biodiversity research and monitoring, Global Ecol. Biogeogr., 22, 630–638, https://doi.org/10.1111/geb.12022, 2013.
Morin, E.: Caravan extension Israel – Israel dataset for large-sample hydrology, Zenodo [data set], https://doi.org/10.5281/zenodo.12760798, 2024.
Muñoz-Sabater, J., Dutra, E., Agustí-Panareda, A., Albergel, C., Arduini, G., Balsamo, G., Boussetta, S., Choulga, M., Harrigan, S., Hersbach, H., Martens, B., Miralles, D. G., Piles, M., Rodríguez-Fernández, N. J., Zsoter, E., Buontempo, C., and Thépaut, J.-N.: ERA5-Land: a state-of-the-art global reanalysis dataset for land applications, Earth Syst. Sci. Data, 13, 4349–4383, https://doi.org/10.5194/essd-13-4349-2021, 2021.
Newman, A. J., Clark, M. P., Sampson, K., Wood, A., Hay, L. E., Bock, A., Viger, R. J., Blodgett, D., Brekke, L., Arnold, J. R., Hopson, T., and Duan, Q.: Development of a large-sample watershed-scale hydrometeorological data set for the contiguous USA: data set characteristics and assessment of regional variability in hydrologic model performance, Hydrol. Earth Syst. Sci., 19, 209–223, https://doi.org/10.5194/hess-19-209-2015, 2015.
Schaake, J., Cong, S. Z., and Duan, Q. Y.: The US MOPEX data set, IAHS Publications, 307, 9–28, ISBN 978-1-901502-73-2, 2006.
Senent-Aparicio, J., Castellanos-Osorio, G., Segura-Méndez, F., López-Ballesteros, A., Jimeno-Sáez, P., and Pérez-Sánchez, J.: BULL Database – Spanish Basin attributes for Unravelling Learning in Large-sample hydrology, Sci. Data, 11, 737, https://doi.org/10.1038/s41597-024-03594-5, 2024.
Shalev, G. and Kratzert, F.: Caravan MultiMet (Part 1, Nowcasts): Extending Caravan with Multiple Weather Nowcasts and Forecasts (1.1), Zenodo [data set], https://doi.org/10.5281/zenodo.14196771, 2024a.
Shalev, G. and Kratzert, F.: Caravan MultiMet (Part 2, Forecasts): Extending Caravan with Multiple Weather Nowcasts and Forecasts (1.1), Zenodo [data set], https://doi.org/10.5281/zenodo.14196772, 2024b.
Singer, M. B., Asfaw, D. T., Rosolem, R., Cuthbert, M. O., Miralles, D. G., MacLeod, D., Quchimbo, E. A., and Michaelides, K.: Hourly potential evapotranspiration at 0.1° resolution for the global land surface from 1981–present, Sci. Data, 8, 224, https://doi.org/10.1038/s41597-021-01003-9, 2021.
Yamazaki, D., Ikeshima, D., Sosa, J., Bates, P. D., Allen, G. H., and Pavelsky, T. M.: MERIT Hydro: A High-Resolution Global Hydrography Map Based on Latest Topography Dataset, Water Resour. Res., 55, 5053–5073, https://doi.org/10.1029/2019WR024873, 2019.