the Creative Commons Attribution 4.0 License.
the Creative Commons Attribution 4.0 License.
 | 05 Feb 2025
CAMELS-IND: hydrometeorological time series and catchment attributes for 228 catchments in Peninsular India
Nikunj K. Mangukiya
Kanneganti Bhargav Kumar
Pankaj Dey
Shailza Sharma
Vijaykumar Bejagam
Pradeep P. Mujumdar
Ashutosh Sharma
We introduce CAMELS-IND (Catchment Attributes and MEteorology for Large-sample Studies – India), a dataset containing hydrometeorological time series and catchment attributes for 472 catchments in Peninsular India, of which 228 catchments have observed streamflow data available for over 30 % of the period between 1980 to 2020. Peninsular India covers 15 interstate river basins defined by the Central Water Commission (CWC), where river flow and water level datasets are available for several gauge stations through the open-source India Water Resources Information System (India-WRIS). However, many of these gauge stations lack reliable metadata, and data are not in an analysis-ready format for large-sample hydrological studies. Therefore, we utilized 472 gauge stations and their catchment boundaries, characterized as stations with reliable metadata, from the Geospatial dataset for hydrologic analyses in India (GHI) (Goteti, 2023). For each of these catchments, CAMELS-IND provides a catchment mean time series of meteorological forcings for 41 years (1980–2020) and 211 catchment attributes representing hydroclimatic and land cover characteristics extracted from multiple data sources (including ground-based observations, remote sensing-based products, and reanalyses datasets). CAMELS-IND follows the same standards of the previously developed CAMELS datasets for the USA, Chile, Brazil, Great Britain, Australia, Switzerland, and Germany to facilitate comparisons with catchments of those countries and inclusion in global hydrological studies. Notably, CAMELS-IND includes available observed streamflow and catchment mean time series of 19 meteorological forcings, including precipitation, maximum, minimum, average temperature, long-wave and short-wave radiation flux, U and V components of wind, relative humidity, evaporation rates from canopy and soil surface, actual and potential evapotranspiration, and soil moisture of four layers (covering depth up to 3 m below ground) for detailed hydrometeorological studies. We also derived catchment attributes representing human influences, including the number of dams and their utilization, total volume contents of dams in catchments, population density, and increases in urban and agricultural land covers to facilitate studies to understand human influences on catchment hydrology. Furthermore, the dataset includes predicted streamflow time series from a regionally trained long short-term memory (LSTM)-based hydrological model for all 472 catchments which can fill gaps in observed streamflow data or serve as a benchmark for testing and developing new hydrological models. We envision that CAMELS-IND will provide a strong foundation for a community-led effort toward gaining new hydrological insights from hydrologically distinct Indian catchments and solving pertinent issues related to water management, quantification and risk assessment of hydrologic extremes, unraveling regional-scale hydrologic functioning, and climate change impact assessment of catchments across India. The CAMELS-IND dataset is available at https://doi.org/10.5281/zenodo.14005378 (Mangukiya et al., 2024).
- Article
(16942 KB) - Full-text XML
- BibTeX
- EndNote


Large-scale hydrological studies to formulate generalized conclusions on hydrological models and processes require data from large samples of catchments to understand spatiotemporal hydrological differences across scales (Addor et al., 2017; Coxon et al., 2020). Various studies have utilized large-sample datasets to investigate the impacts of climate change and anthropogenic influences on hydrological behavior (Van Loon et al., 2022; Feng et al., 2023) for predictions of hydrometeorological variables (Feng et al., 2020; Kratzert et al., 2018; Lees et al., 2021; Mangukiya et al., 2023), for hydrological classification and similarities (Fang et al., 2022; Dimitriadis et al., 2021; Jehn et al., 2020), for predictions in the ungauged and data-sparse region (Kratzert et al., 2019; Ma et al., 2021; Nearing et al., 2024), and for understanding the drivers of extreme events and future hydrological changes (Mangukiya and Sharma, 2024; Alvarez-Garreton et al., 2021; Zhang et al., 2022; Das et al., 2024). The primary data required for hydrometeorological analyses are streamflow and its drivers, such as precipitation, temperature, solar radiation, evapotranspiration, wind, soil moisture, and relative humidity. Ideally, the hydrometeorological time series datasets are complemented by catchment attributes, which are believed to control hydrological processes such as topography, land cover, soil, and geology (Addor et al., 2017). The availability of such catchment datasets offers a new perspective to the research community, supporting solutions for key issues in water management, quantification and risk assessment of hydrologic extremes, understanding regional-scale hydrologic functioning, and assessing climate change impacts. In addition, it helps the researchers to expedite their research by saving hours of collecting and processing the data from various sources.
The compilation of hydrometeorological time series and complementary attributes for large samples of catchments began in 2006 with the Model Parameter Estimation Experiment (MOPEX) dataset (Schaake et al., 2006) in the USA. Later, the MOPEX dataset was extended by Newman et al. (2015) and Addor et al. (2017), resulting in the first Catchment Attributes and MEteorology for Large-sample Studies (CAMELS) dataset that comprises 671 catchments in the contiguous United States (CONUS). Given the importance of such a large-sample dataset for hydrometeorological studies, the CAMELS and other datasets are developed for various countries, such as Chile (CAMELS-CL; Alvarez-Garreton et al., 2018), North America (HYSETS; Arsenault et al., 2020), Brazil (CAMELS-BR in Chagas et al., 2020; CABra in Almagro et al., 2021), Great Britain (CAMELS-GB; Coxon et al., 2020), China (CCAM; Hao et al., 2021), Australia (CAMELS-AUS; Fowler et al., 2021), Austria (LamaH-CE; Klingler et al., 2021), Switzerland (CAMELS-CH; Höge et al., 2023), Spain (BULL database; Senent-Aparicio et al., 2024), Sweden (CAMELS-SE; Teutschbein, 2024), and Germany (CAMELS-DE; Loritz et al., 2024). Recently, the initiative to combine all existing CAMELS and other large-sample datasets was taken through Caravan (Kratzert et al., 2023) to facilitate global hydrological studies. The community-driven initiative further extended Caravan datasets for Denmark (Koch, 2022) and Israel (Efrat, 2023). Despite the increasing availability of large-sample hydrometeorological datasets globally, India still lacks a comprehensive dataset for large-sample hydrological studies.
In India, accessing analysis-ready datasets is difficult, and the available open-source datasets require additional quality checks (Goteti, 2023). The Central Water Commission (CWC) and various state government agencies provide water-related data through the online portal, India – Water Resources Information System (India-WRIS; https://indiawris.gov.in/wris/, last access: 18 November 2024). However, the related Geographic Information System (GIS) metadata, such as digitized gauge locations, catchment boundaries, and river network information, are still limited, and researchers need to put significant efforts into digitizing and compiling the required information from available CWC reports (Goteti, 2023). For meteorological time series datasets, the India Meteorological Department (IMD) provides a nationwide gridded dataset of rainfall and temperature, and the National Centre for Medium Range Weather Forecasting (NCMRWF) provides various other meteorological variables in a gridded format through the Indian Monsoon Data Assimilation and Analysis (IMDAA) reanalysis data services (https://rds.ncmrwf.gov.in/home, last access: 18 November 2024). However, such nationwide datasets are rarely aggregated to the catchment scale and require pre-processing to make them analyses-ready (Hao et al., 2021). For large-scale hydrological studies, searching for appropriate data, finding methods for data pre-processing, and formatting data consume considerable time and redundant efforts with limited research advances (Beniston et al., 2012; Hao et al., 2021). Due to a lack of analysis-ready datasets and associated difficulties in data processing, unsurprisingly, large-sample hydrological studies are less common in India than in the USA or Europe. To overcome all these difficulties, community-led efforts are required to develop the needed analysis-ready dataset for India (Goteti, 2023).
Goteti (2023) recently provided the first quality-controlled publicly available hydrographic dataset, the Geospatial dataset for hydrologic analyses in India (GHI), which includes GIS data on locations of gauges, catchment boundaries, and river network, and monthly and annual time series of precipitation, evapotranspiration, and runoff for 472 catchments in Peninsular India. Even though the GHI dataset does not systematically provide catchment attributes representing hydroclimatic, land cover, and anthropogenic influences, it paved the way for the hydrologic community by providing reliable GIS metadata for a consistent set of catchments for Indian river basins. To address the data gap of GHI, we produced the CAMELS-IND dataset (Mangukiya et al., 2024), which provides a daily catchment mean time series of 19 meteorological forcing variables; observed streamflow data where available; long short-term memory (LSTM)-based hydrological model-predicted streamflow (Mangukiya et al., 2023); and 211 catchment attributes representing topographic, climatic, hydrologic, land cover, soil, geological, and anthropogenic influence characteristics for 472 catchments in Peninsular India. The proposed dataset will be the stepping stone to provide large-sample meteorological time series and attributes of the Indian catchments to the global and national hydrological community. CAMELS-IND follows the same standards as the previously developed CAMELS datasets to facilitate comparisons with catchments of those countries and inclusion in global hydrological studies. The following sections describe the objectives behind the CAMELS-IND dataset and comprehensively describe all data provided within CAMELS-IND, including its data source and how the hydrometeorological time series and static catchment attributes were prepared.
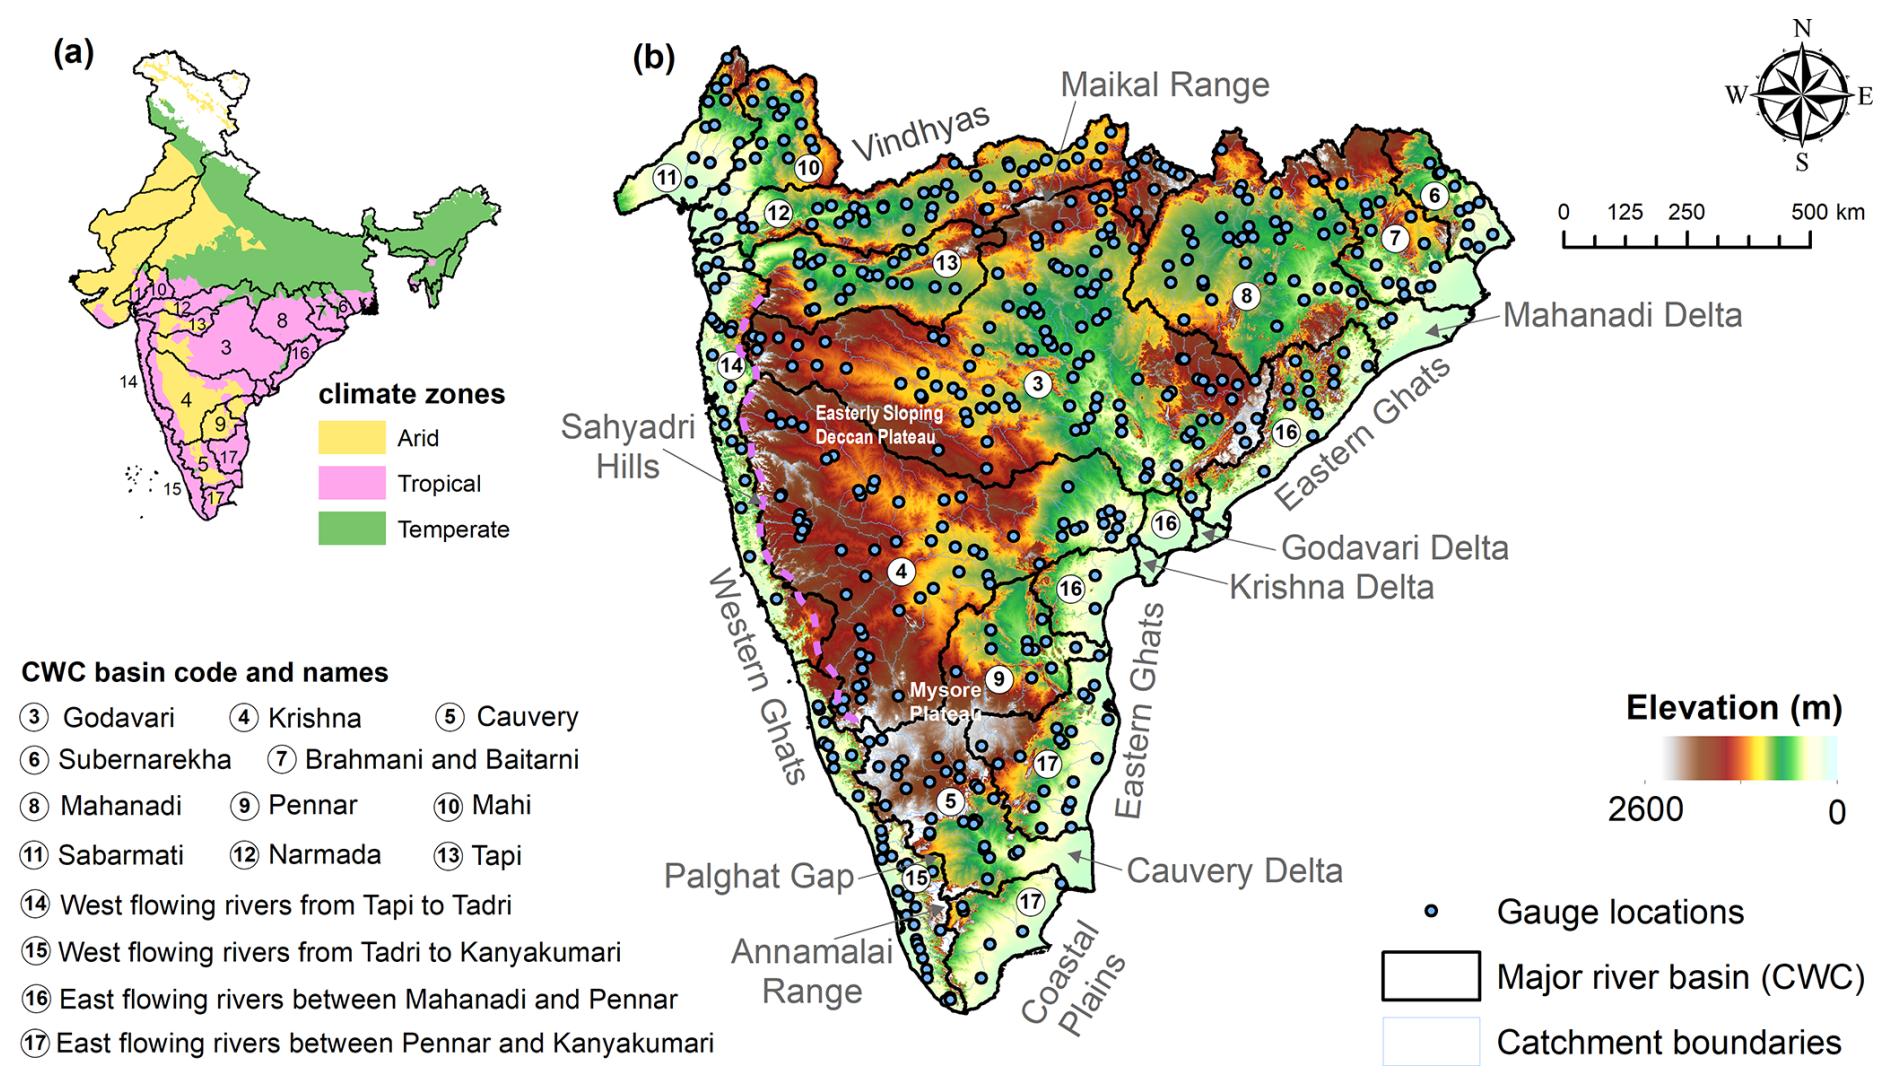
Figure 1(a) Major river basins in Peninsular India, defined by the Central Water Commission (CWC), spread across various climate zones. (b) Geography of Peninsular India with major river basins, gauge locations, catchment boundaries, and an elevation map.
India has hydrologically distinct catchments spread across arid, temperate, and tropical climate zones (Fig. 1a). These catchments are heterogeneous in terms of characterization and are influenced to varying degrees by anthropogenic activities (Mangukiya and Sharma, 2024; Mangukiya et al., 2023). Despite these unique characteristics, Indian catchments are often underutilized in global hydrological studies due to insufficient analysis-ready datasets. The publication of CAMELS-IND aims to address this gap, providing an essential resource for researchers worldwide to investigate hydrological regimes under anthropogenic influences and changing climates, thus tackling water-related issues. CAMELS-IND includes over 100 arid catchments, which can be combined with other arid-zone catchments, such as those in CAMELS, CAMELS-CL, and CAMELS-AUS, enabling large-sample studies of arid-zone hydrology (Fowler et al., 2021). Furthermore, India's catchments are regulated by large and medium dams due to the seasonality of rainfall, often experiencing water limitations on a seasonal basis. This characteristic offers a significant number of samples to the global research community, aiding in addressing various modeling challenges specific to catchments with such unique features.
Given the global use case, during the development of CAMELS-IND, a critical choice was whether to utilize national or global datasets for extracting hydrometeorological time series and catchment attributes. While global datasets would facilitate intercontinental comparisons, national datasets would provide the highest-quality information available in India. So far, CAMELS datasets of different countries have utilized the best possible national data sources, drawing on the expertise of CAMELS creators. In cases where national datasets were unavailable, global datasets, such as the Global Lithological Map (GLiM) (Hartmann and Moosdorf, 2012) and GLobal HYdrogeology MaPS (GLHYMPS) (Gleeson et al., 2014), were used. Using national products would facilitate global users, potentially unfamiliar with such products, to benefit from these local insights (Fowler et al., 2021). It will also encourage national-scale studies by providing analysis-ready datasets from the best available data source within the country. Moreover, ongoing efforts, such as Caravan (Kratzert et al., 2023), to produce consistent global datasets (using global data products for deriving meteorological time series and catchment attributes) will complement the data produced from national sources and facilitate comparative studies. Therefore, we prioritized national data products, where possible, to produce CAMELS-IND.
3.1 Catchment description
The CWC and other state government agencies have listed 4824 gauge locations, at present, on India-WRIS for users to obtain streamflow observations. However, out of those, only 645 gauges in Peninsular India offer free access to data for users. The remaining stations either lack data or fall under the “classified data” category due to transboundary river basins. Given the existing challenges in validating and extracting information from available datasets in India, the GHI has introduced the first quality-controlled metadata in GIS format and listed 472 catchments with consistent and verified metadata out of the 645 gauge stations in Peninsular India (Goteti, 2023). The quality control performed by Goteti (2023) addressed essential metadata aspects, including the accuracy of station coordinates, consistency of station descriptions, and verification of delineated catchment area estimates. In the CAMELS-IND dataset, we have incorporated these 472 catchments located in Peninsular India (Fig. 1b) to extract daily meteorological time series and catchment attributes for large-sample hydrological studies.
Peninsular India is a large region situated between the Western Ghats and the Eastern Ghats, extending south of the Vindhya Range (Fig. 1b). The elevation ranges from 0 to 2600 m above mean sea level, with a mean elevation of 600 m, sloping eastward. The Western Ghats, also known as Sahyadri hills, are a prominent landform in this region and play a crucial role in controlling moisture movement during the southwest monsoon. The Palghat (Palakkad) Gap, a narrow region in the Western Ghats, is a geological shear zone representing a weak area in the Earth's crust. This gap supports a network of brooks and creeks forming the west-flowing Bharathapuzha river, which is the second-largest river in Kerala. This gap influences the weather patterns in Peninsular India by allowing moisture-laden southwest monsoon winds to enter the state of Tamil Nadu, moderating the summer temperatures and increasing the rainfall in the region. Other major landforms in Peninsular India include the Eastern Ghats, a discontinuous mountain range along the Bay of Bengal coast. These mountains are eroded and intersected by major rivers of Peninsular India, namely the Mahanadi, Godavari, Krishna, and Cauvery. These rivers create large delta regions east of Eastern Ghats, with nutrient-rich soils (Fig. 1b). The Maikal range in the north is the origin of the Narmada River. Figure 1b illustrates the major river basins and gauge locations in Peninsular India.
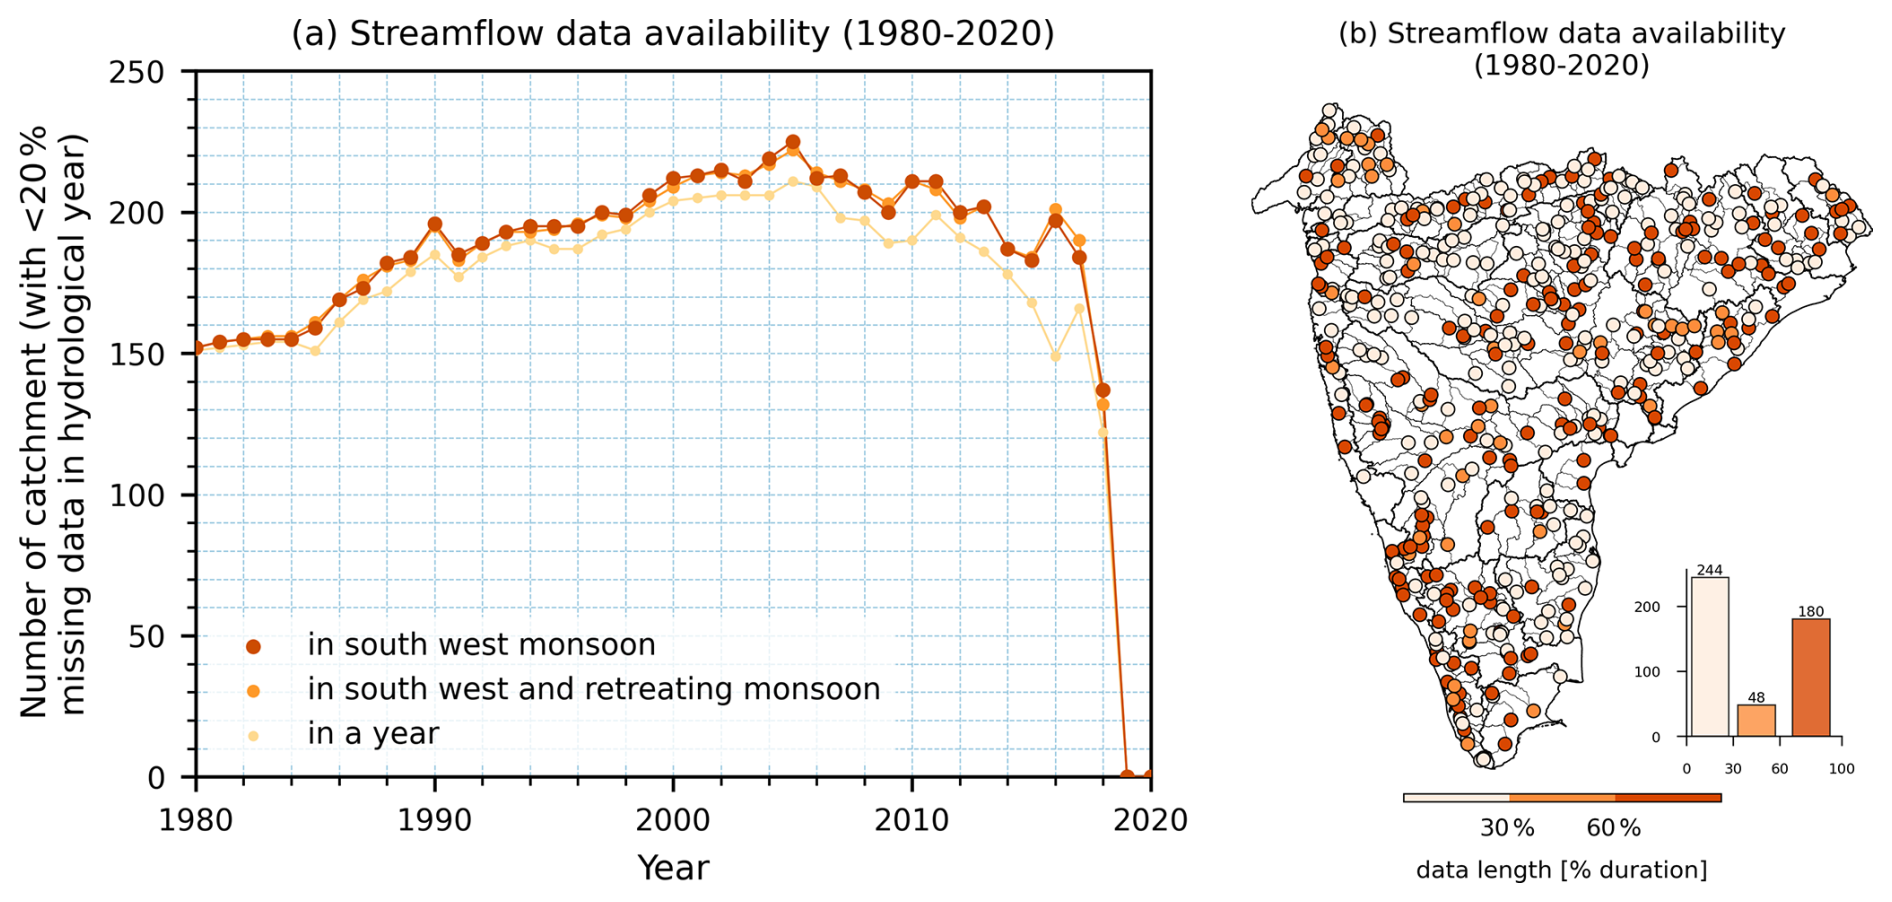
Figure 2Streamflow data availability. (a) Line plot with markers showing the number of catchments with less than 20 % missing data for each hydrological year (starting on 1 June). (b) Data availability (as a percentage of total duration) for each gauge station, indicating that 228 catchments have streamflow data available for over 30 % of the period.
3.2 Hydrological time series
Daily-scale streamflow and water level observations for Indian catchments are publicly accessible via the online portal India-WRIS (https://indiawris.gov.in/wris/, last access: 18 November 2024). To ensure data quality, the dataset on India-WRIS undergoes primary validation through the Surface Water Data Entry System (SWDES) and subsequent processing for standardization. The standard operating procedures and data processing protocols are comprehensively described in various user manuals (Lohani, 2012). Users can navigate the portal to select the data source (agencies providing river flow and water level data) and location (such as river basin and gauge name) to download river flow and water level data in an Excel document (.xlsx) format. Currently, India-WRIS imposes a maximum limit of 1 year for each download. To obtain the long-term time series, users must combine data by downloading 1 year at a time. This process can be tedious, but it is necessary to acquire river flow data for Indian catchments. Following this process, we compiled the available streamflow observations from 1 January 1980 to 31 December 2020 from India-WRIS and provided them in the CAMELS-IND dataset. We performed a primary validation of the flow data for negative values and outliers, and no such anomalies were observed in the dataset. Additionally, our preliminary analysis shows that 228 catchments have streamflow data availability for over 30 % of the period between 1980 to 2020 (Fig. 2b). In addition to these 228 catchments, there are 60 catchments with partial streamflow records, ranging from 2.4 % (approximately 1 year) to 30 % (about 12 years) of the period. Although these may not meet the threshold for extensive hydrological analysis, they offer valuable opportunities for pseudo-ungauged studies and model testing or validation in data-limited environments. However, it is worth noting that the India-WRIS portal was launched in July 2019. Since then, continuous efforts have been made to digitize the available data and update the information on the portal. We anticipate that, with time, observations from the rest of the gauges will be made available for users to download. Therefore, we extracted catchment mean meteorological forcings and static attributes for all 472 catchments. To facilitate immediate use by those specifically requiring catchments with streamflow observations, we have also provided a subset of the dataset with the 228 catchments within CAMELS-IND.
For large-sample studies, meteorological time series are often extracted from gridded datasets (Fowler et al., 2021). In CAMELS-IND, we extracted daily meteorological time series for 19 variables (listed in Table A1) from a nationwide gridded dataset covering the period from 1 January 1980 to 31 December 2020, spanning 41 years. We used gridded precipitation (0.25° spatial resolution) (Pai et al., 2014) and maximum and minimum temperature (1° spatial resolution) (Srivastava et al., 2009) datasets from the IMD, which has the only available and widely utilized national dataset for India. The precipitation dataset from the IMD is based on rainfall observations from 6995 rain gauge stations across India, providing an accurate representation of the spatial distribution of rainfall (Pai et al., 2014). The temperature dataset from IMD is based on observations from 395 quality-controlled observatories across India. Data from these stations are then converted into a gridded product using Shepard's angular distance weighting method (Srivastava et al., 2009).
Daily time series for the surface downward long-wave and short-wave radiation flux, u and v component of wind (at 10 m), relative humidity (at 2 m), evaporation rates from the soil surface and canopy, and soil moisture at four different layers (0–0.1, 0.1–0.35, 0.35–1, and 1–3 m below ground) were extracted from the IMDAA dataset (Rani et al., 2021). IMDAA data form a regional reanalysis dataset developed by Weather and Climate Modelling under the Ministry of Earth Sciences, India. This dataset, with a resolution of approximately 12 km, is presently the highest-resolution regional reanalysis dataset available for the Indian monsoon region, with increased reliability and accuracy (Rani et al., 2021; Ashrit et al., 2020). As the actual and potential evapotranspiration (AET and PET) dataset over India is not available from national sources, we obtained a daily time series of AET and PET from the Global Land Evaporation Amsterdam Model (GLEAM) (Miralles et al., 2011). We also extracted daily time series of the PET from Singer et al. (2021), which is presently the highest-resolution (0.1°) gridded dataset developed using the ERA5-Land reanalysis dataset, to facilitate comparison. For all meteorological variables, spatially averaged time series for each catchment were calculated using area-weighted averages for each day. The catchment-wise meteorological time series is provided in a folder named catchment_mean_forcings in the CAMELS-IND dataset (Mangukiya et al., 2024).
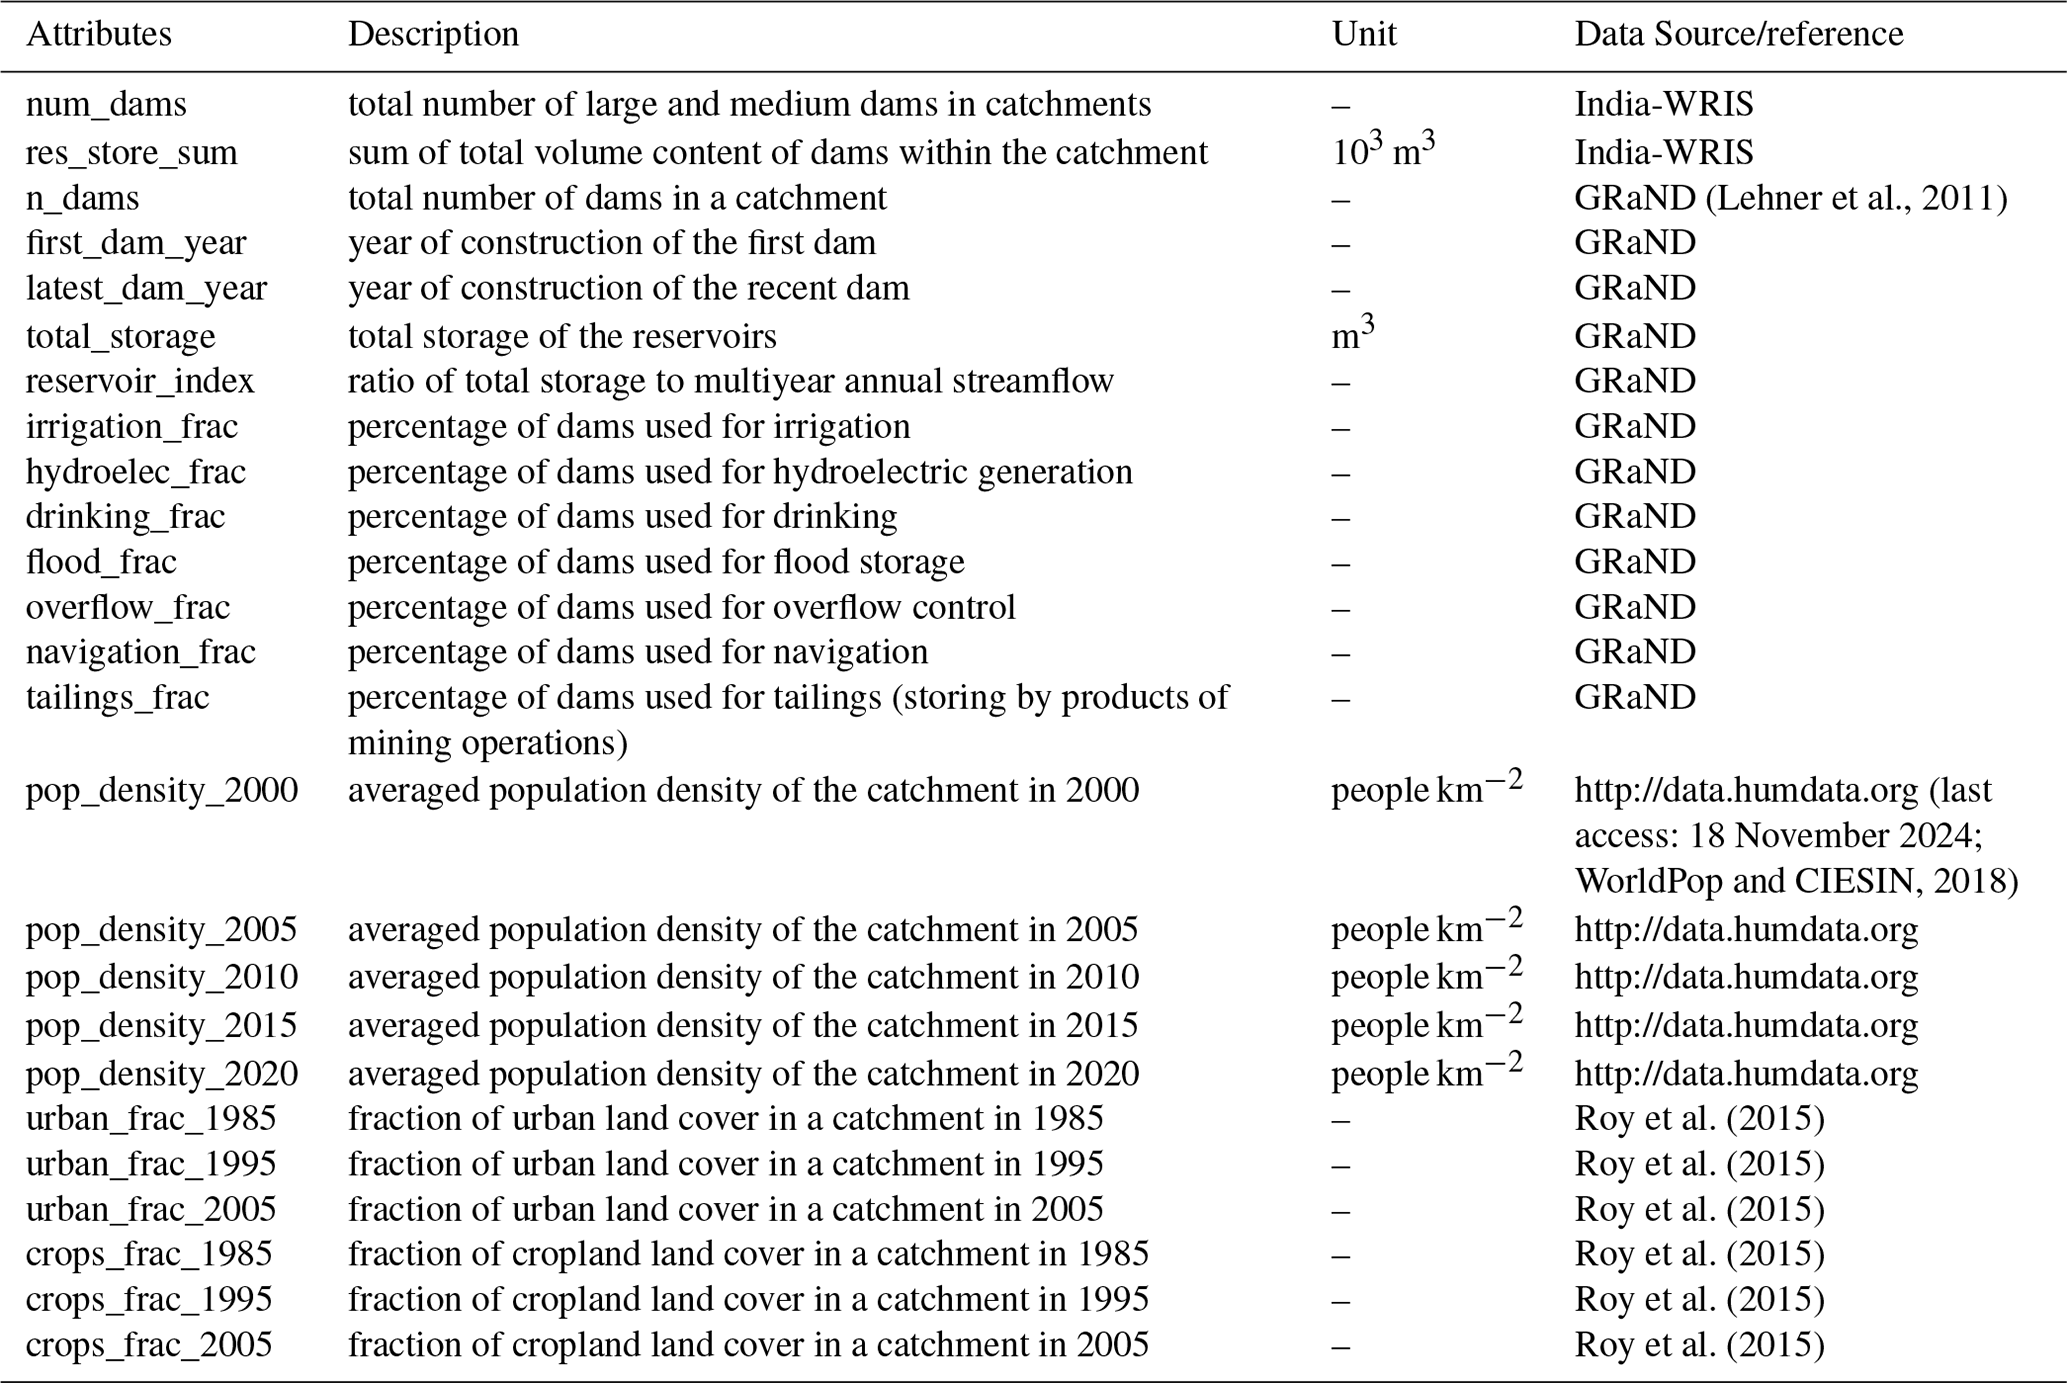
In CAMELS-IND, we compiled and calculated 211 catchment attributes representing location and topography, climate, hydrological signatures, land use land cover (LULC), soil and geology, and anthropogenic influences. Table 1 summarizes the file names and descriptions of the attributes provided within the files in the CAMELS-IND dataset. In India, CWC has divided the entire country into 22 basins and provided a unique basin code for identification (India-WRIS, 2012). In CAMELS-IND, we created a five-digit gauge station identifier (the first two digits are the CWC basin code, and the last three digits are station number) and used it as the gauge ID throughout the dataset. For each gauge ID, we provided the station's name as in the CWC database (CWC, 2021) and the name of the river/tributary and basin on which the station is located (Table A2). For ease of use, we also provided the GHI station ID and the GHI-assigned group from the GHI dataset to associate the catchment attributes with the metadata provided in the GHI dataset (Goteti, 2023).
Table 1Summary of 211 catchment attributes provided in CAMELS-IND.
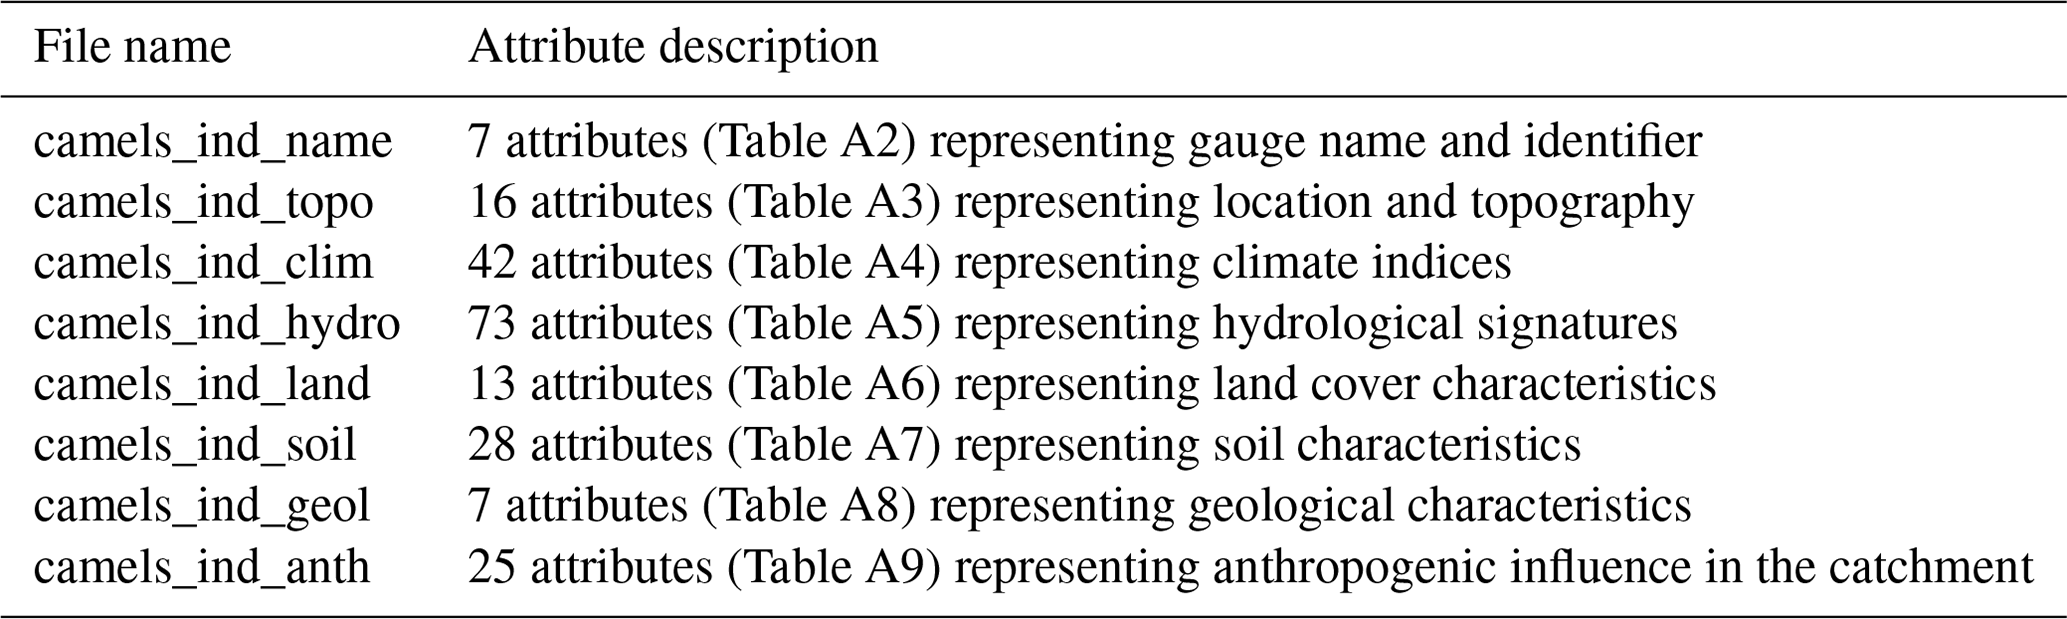
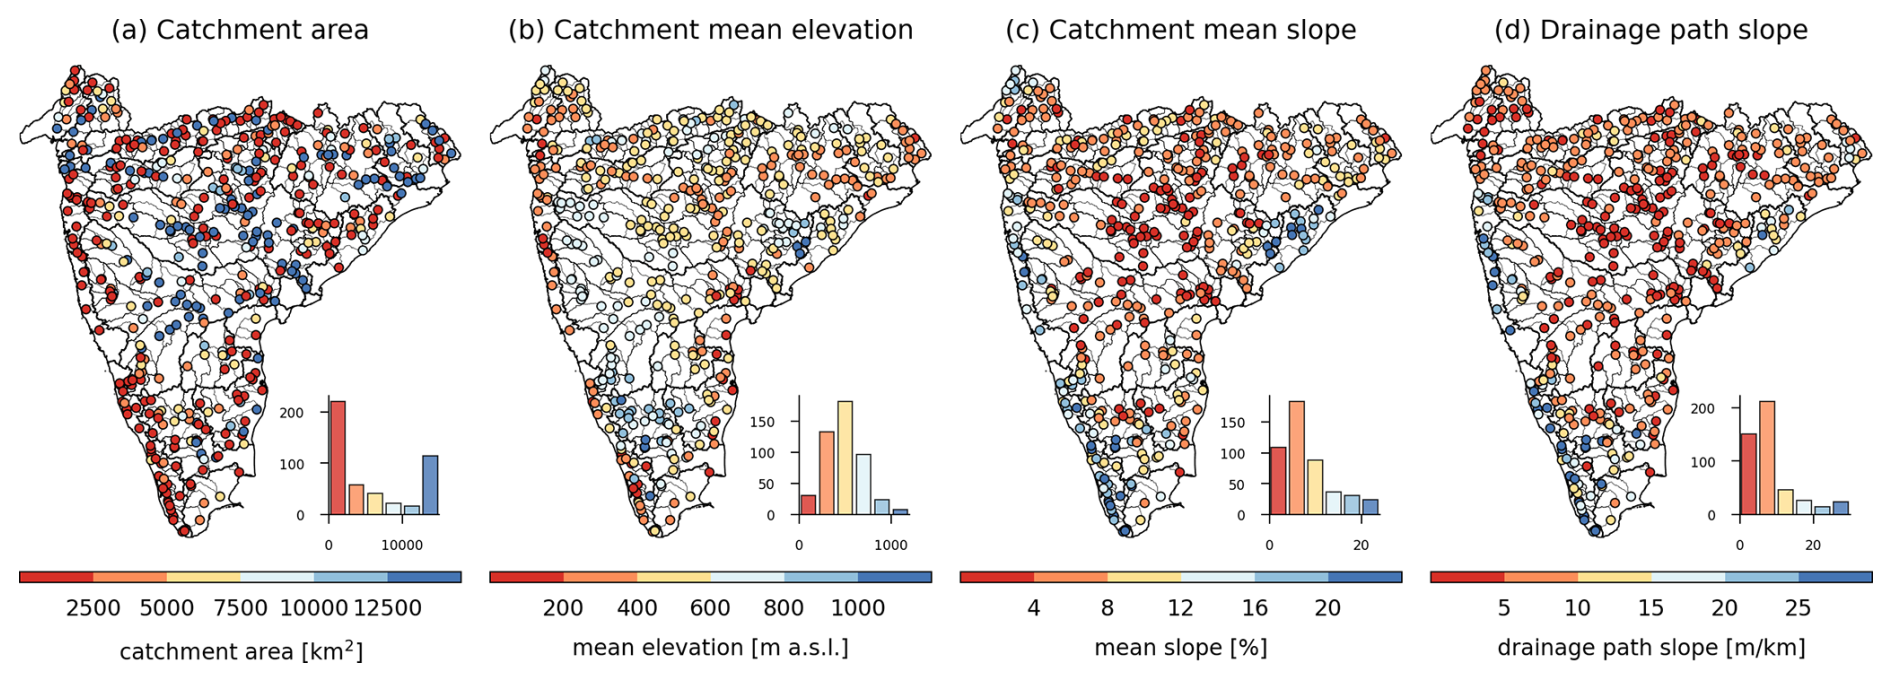
Figure 3Topographic characteristics of catchments in Peninsular India. The histograms depict the frequency distribution of catchments across the bins. (a) Catchment area (in km2), (b) catchment mean elevation (in meters above mean sea level), (c) catchment mean slope (in percentage), and (d) catchment mean drainage path slope (in m km−1).

Figure 4Climate indices for catchments in Peninsular India. The histograms depict the frequency distribution of catchments across the bins. (a) Mean annual precipitation, (b) variation in annual precipitation patterns (higher values indicate more significant variation), (c) frequency of days with precipitation ≥5 times the mean daily precipitation, (d) average number of consecutive days with precipitation ≥5 times the mean daily precipitation, (e) frequency of days with precipitation <1 mm d−1, (f) average number of consecutive days with precipitation <1 mm d−1, (g) maximum number of consecutive days with precipitation <1 mm d−1, and (h) aridity index (P/PET).
5.1 Location and topography
The attributes representing the location and catchment area for each gauge ID are compiled from both the CWC and GHI datasets in CAMELS-IND (Table A3). However, it is worth noting that for many gauge stations, the CWC documented spurious gauge locations and catchment areas (Goteti, 2023). Therefore, we preferred the corrected locations provided within the GHI dataset for plotting the gauge locations in this work. For topographic characteristics, elevation and slope are extracted using the 3 arcsec (∼90 m) resolution digital elevation model (DEM) of the Shuttle Radar Topography Mission (SRTM) (Farr et al., 2007), as these are the key controlling factors of catchment behavior (Addor et al., 2017). The catchment areas range from 125.7 to 308 433.8 km2, with quartile values of 1095.38 km2 (first quartile), 3042.2 km2 (second quartile), and 11 990.63 km2 (third quartile). Figure 3a shows the spatial distribution of the catchment area and highlights that there are 131 catchments with an area greater than 10 000 km2. The average elevation becomes less meaningful for such large catchments due to spatial heterogeneity. Moreover, the west-flowing rivers from Tadri to Kanyakumari originate from the steep mountains and meet the Arabian Sea, flowing through plain regions, resulting in lower average elevations and higher slopes (Fig. 3b–c). Therefore, we also computed minimum, maximum, and median catchment elevation and slope using the zonal statistics tool of QGIS for all the gauges to represent the spatial heterogeneity of topographical features in the CAMELS-IND dataset. The catchment mean elevation ranges from 58.04 to 1687.24 m, with quartile values of 361.04 m (first quartile), 470.37 m (second quartile), and 617.9 m (third quartile), while the mean slope ranges from 1.07 % to 32.15 %, with quartile values of 4.11 % (first quartile), 6.23 % (second quartile), and 10.02 % (third quartile). Additionally, the catchment mean drainage path slope is also estimated using SRTM DEM and HydroSHEDS river network (Lehner and Grill, 2013) (Fig. 3d). The mean drainage path slope of the catchments ranges from 1.22 to 74.88 m km−1, with mean and median slopes of 8.93 and 6.35 m km−1, respectively. Overall, the topographic attributes show that the high-altitude catchments with moderate to steep slopes are located in the Western and Eastern Ghats regions, while the catchments in central India have gentler slopes.
5.2 Climate indices
We computed climate indices similar to Addor et al. (2017), which represent both mean and extreme events, using the meteorological time series described in Sect. 4. Additionally, we calculated the monthly and annual precipitation variability, precipitation uniformity, asynchronicity, and the maximum number of consecutive days of extreme event occurrence and their timings (Table A4). To compute aridity, we used the ratio of mean annual precipitation over the PET, following the approach of Addor et al. (2017). Moreover, we also derived the aridity index as the ratio of the deficit between potential and actual evapotranspiration over PET. As an additional reference, we extracted the spatially averaged aridity index from Trabucco and Zomer (2018). The precipitation uniformity indicates how uniformly the annual maximum precipitation is distributed across the days of a year, and it is estimated by relative entropy, a metric proposed by Feng et al. (2013). A zero-precipitation uniformity value indicates that all the days have equal precipitation, whereas a value of 1 indicates that all the annual maximum precipitation occurred in a single day (Dey and Mujumdar, 2019). The asynchronicity index measures the relative magnitude and phase differences between long-term monthly precipitation and potential evapotranspiration (Feng et al., 2019). The frequency of high precipitation days is estimated when the observed precipitation is at least 5 times the mean daily precipitation. The frequency of low precipitation days is calculated when the observed precipitation is less than 1 mm d−1. The average consecutive days of high precipitation are used to estimate the average duration of high precipitation, and the average consecutive dry days are used to estimate the average duration of low precipitation. The timing of high and low precipitation is defined as the season (monsoon – June, July, August, and September; pre-monsoon – January, February, March, April and May; post-monsoon – October, November, and December) during which most of the high and low precipitation events occur.
The spatial distribution of the selected climate indices is shown in Fig. 4. Higher mean annual precipitation (>2500 mm) is observed in the Western Ghats region, and the precipitation decreases (<1000 mm) towards the central part of the region (Fig. 4a). The northern and eastern parts of the region exhibit moderate precipitation in the range of 1500 to 2500 mm. The variability in the annual precipitation and frequency of high precipitation days are notably higher (with a coefficient of variation >0.8 and more than 21 d with precipitation ≥5 times mean daily precipitation) in the Mahi, Narmada, Pennar, Sabarmati, and Tapi basins (Fig. 4b–c). We observed high precipitation events mainly concentrated during the monsoon and post-monsoon seasons in the majority and southern parts of the region, respectively. This highlights the dominance of the southwest monsoon (June to September) in the region and the impact of the northeast monsoon in the southeastern part during winter (Das et al., 2022; Das and Jain, 2023). The catchments along the west coast experience prolonged high precipitation in the southwest monsoon season and exhibit evaporation rates of more than 1.2 mm d−1 (Fig. 4d). India has a seasonal precipitation pattern, with most of the precipitation occurring during the southwest monsoon. Consequently, most Indian catchments experience more than 210 dry days in a year (Fig. 4e). Moreover, the Mahi, Narmada, Sabarmati, and Tapi basins, along with the catchments of west-flowing rivers between the Tapi and Tadri basins, show extreme seasonality (Rai and Dimri, 2020), receiving most of the precipitation in 1–2 months, thus resulting in the prolonged dry periods (Fig. 4f–g). The catchments along the southwest coast and eastern sides of Peninsular India are relatively more humid compared to the catchments of Godavari, Krishna, Mahi, Pennar, Sabarmati, and Tapi basins (Fig. 4h). A sharp transition in the aridity index is observed across the Western Ghats – highlighting the increased precipitation on the leeward side and a decrease in the rain shadow region of the Western Ghats. A distinct north–south pattern in the asynchronicity index between long-term precipitation and PET is observed – with a strong out-of-phase relationship in the north and central parts of Peninsular India (Fig. A1). In contrast, an in-phase relationship is observed in the southern part of the region. In CAMELS-IND, we also provide mean indices for temperature, relative humidity, radiation flux, wind speed, and soil moisture to understand the climatic conditions over Peninsular India comprehensively. The spatial patterns of PET indicate moderate values of 1000 to 1250 mm in the central and northern parts, with higher values exceeding 1250 mm in the lower Western Ghats. AET shows a similar trend, with values below 750 mm in the central and northern regions and over 1250 mm in the lower Western Ghats (Fig. A1).
5.3 Hydrological signatures
The hydrological signatures were computed for 228 catchments, with streamflow data available for at least 30 % of the period between 1980 and 2020. The hydrological signatures representing the mean flow and extreme flow events are included in the CAMELS-IND (Table A5), similar to Addor et al. (2017). Additionally, due to seasonal precipitation patterns in India, we also computed seasonal flow and its variability, providing quartiles of flow for the southwest monsoon season. For this purpose, we also included gauges with available streamflow observations during specific seasons with less than 20 % of the values missing for all months. In general, streamflow comprises two components, namely baseflow and quick flow. The baseflow index – the ratio of long-term baseflow to long-term total flow – is estimated using the method described in Ladson et al. (2013) and is available in the TOSSH (Toolbox for Streamflow Signatures in Hydrology) (Gnann et al., 2021). The higher the baseflow index, the more the contribution of the baseflow to the total streamflow. The slope of the flow duration curve (FDC) is used to estimate the variability in streamflow. The slope of the FDC is calculated as the slope of the curve between the log-transformed 33rd and 66th percentiles of daily streamflow over the period of observation (Chouaib et al., 2018; Yokoo and Sivapalan, 2011). A high slope value indicates highly variable streamflow due to pronounced streamflow seasonality or rapid response to precipitation events. Streamflow elasticity quantifies the sensitivity of mean annual precipitation (Sankarasubramanian et al., 2001). A value of streamflow elasticity m indicates that there will be m % change in mean annual streamflow with respect to 1 % change in mean annual precipitation. In addition, runoff ratio – the ratio of long-term mean daily flow to long-term mean daily precipitation – is estimated, which measures the fraction of precipitation that, on average, gets converted to streamflow. The streamflow uniformity, measured using Gini's coefficient (Gudmundsson et al., 2018), ranges from 0 to 1, where 0 indicates a uniform distribution of flows throughout the year, and 1 indicates that all the flows occur on a single day, with values between 0 and 1 representing intermediate cases. Apart from the measures of streamflow variability, attributes quantifying the behavior of extreme streamflow conditions are also quantified. The high-flow and low-flow thresholds during the observation period are computed based on the 95th and 25th percentile of the daily flows. Moreover, we computed approximately 40 indices of hydrological alterations, representing monthly water availability and variability, annual extreme events and their timing, and the frequency and rate of change in flow conditions. The primary limitations with the hydrologic signatures derived are that (1) many attributes can be associated with the size of the catchments and that (2) the causal factors of the extreme flow conditions are not considered.
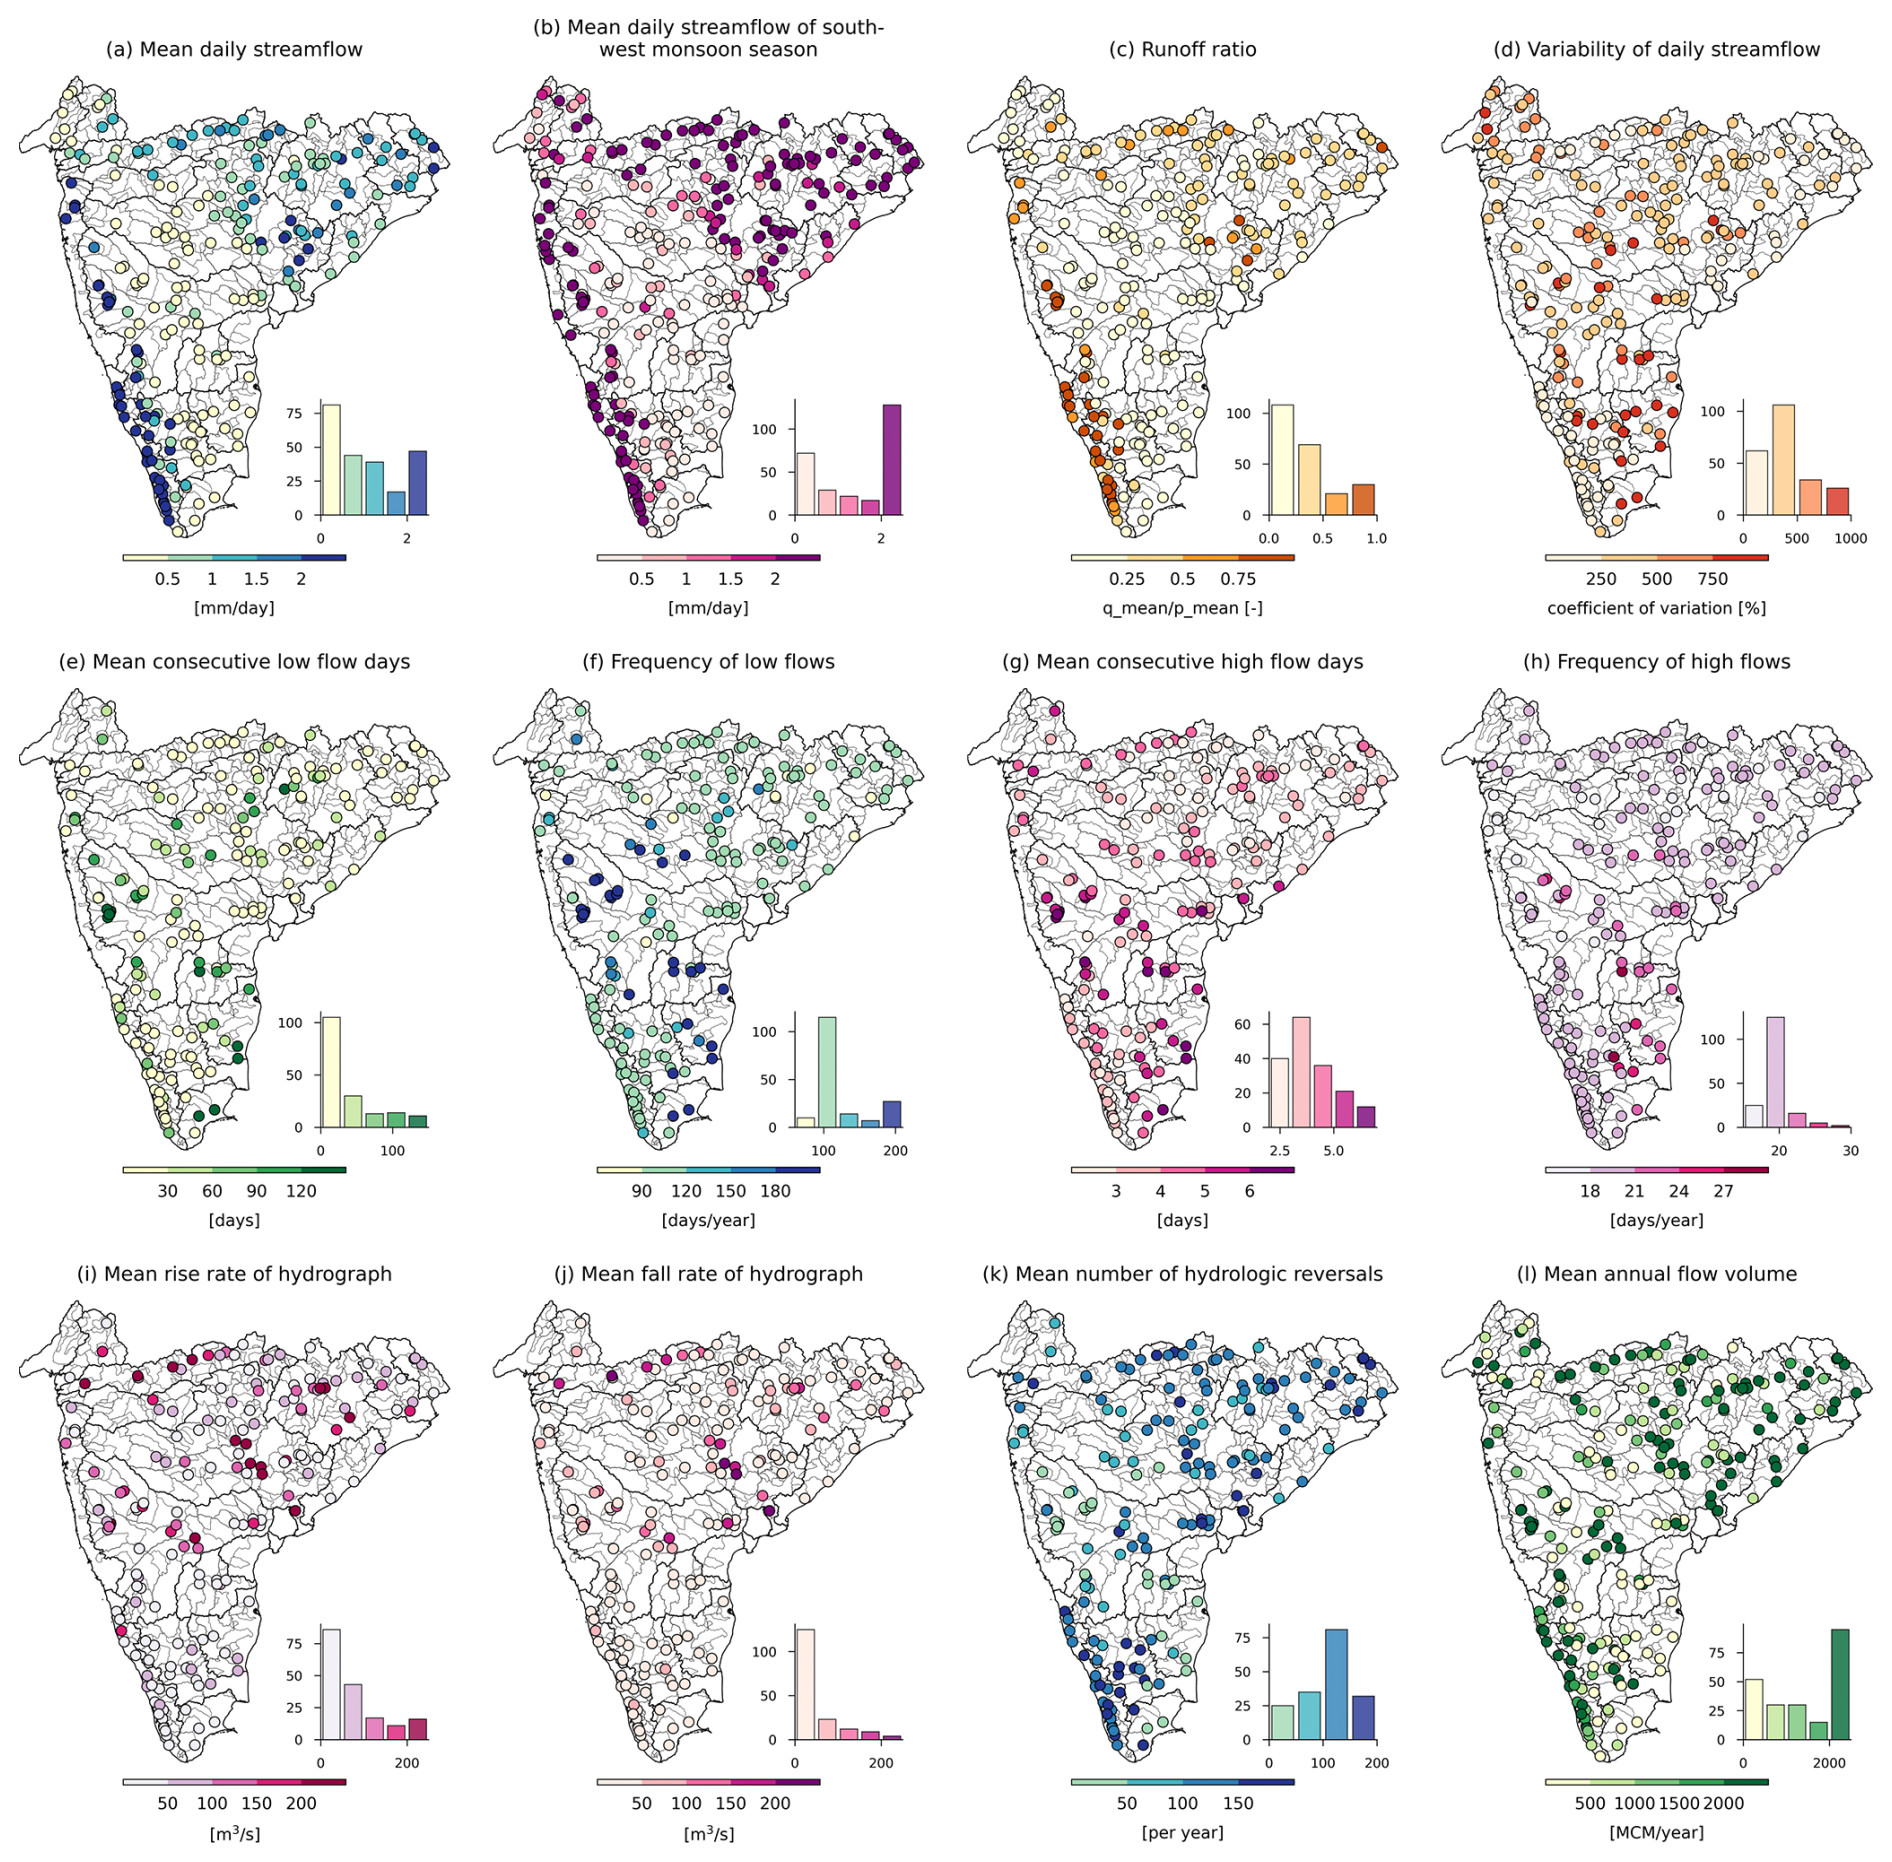
Figure 5Streamflow characteristics for catchments in Peninsular India. The histograms depict the frequency distribution of catchments across the bins. (a) Mean daily streamflow, (b) mean daily streamflow of southwest monsoon season, (c) runoff ratio (q_mean/p_mean), (d) variability in daily streamflow, (e) mean consecutive low flow days (flow <25th percentile daily flow), (f) frequency of low flows in a year, (g) mean consecutive high flow days (flow >95th percentile daily flow), (h) frequency of high flows, (i) mean of the positive difference between consecutive flow values, (j) mean of the negative difference between consecutive flow values, (k) mean number of hydrologic reversals (i.e., number of peaks in hydrograph), and (l) mean annual flow volume.
The mean streamflow pattern closely follows the spatial patterns of the precipitation. The catchments of west-flowing rivers and the Brahmani, Baitarni, Godavari, Mahanadi, Narmada, and Subernarekha basins exhibit higher flows (>1 mm d−1) throughout the year, including the southwest monsoon season (Fig. 5a–b). A high variation in the streamflow elasticity is observed in the arid regions, and less variation is observed in the humid regions (Fig. A1). However, the sensitivity of streamflow change to precipitation change is more in the arid regions. The streamflow uniformity is higher in the central Eastern Ghats and delta regions and smaller in the Western Ghats region (Fig. A1). High variability (with increased values) in the baseflow index is observed in the southern region, whereas this variability tends to reduce in the central and the northern parts of the region (Fig. A1). In addition, the sensitivity of streamflow to precipitation decreases with increasing baseflow index, highlighting the role of the baseflow in sustaining the flows. The catchments along the southwest coast have a high runoff ratio (>0.5) and relatively low variability in daily flows (Fig. 5c–d). The majority of Indian catchments exhibit low flows for 90 to 120 d during the summer season (March–May), with 30 to 60 consecutive days of low flows (Fig. 5e–f). A similar pattern can be observed for high flows but for a shorter duration, indicating the influence of the dams (Fig. 5g–h). Most dams in India are operated to store water from high precipitation during the southwest monsoon season and gradually release it during summer for irrigation and other water demands. Evidence of this can be seen in Fig. 5i–k, indicating a higher number of hydrological reversals (>100 in a year) despite seasonal precipitation patterns.
5.4 Land cover characteristics
Land cover attributes were extracted from the Sentinel-2 10 m LULC time series (Karra et al., 2021) providing eight LULC classes, including water, trees, flooded vegetation, crops, built-up areas, bare ground, snow cover, and rangeland. Due to the absence of snow cover in Peninsular Indian catchments, we excluded it, and the temporal average of the seven remaining LULC classes was extracted as fractions of the catchment using the zonal histogram tool in QGIS (Table A6). Additionally, the spatiotemporally averaged (from 2001 to 2020) minimum and maximum leaf area index (LAI) of the catchment was extracted from MCD15A2H MODIS/Terra + Aqua leaf area index/FPAR (fraction of absorbed photosynthetically active radiation) 8 d L4 Global 500 m SIN Grid V006 (Myneni et al., 2015) to represent the vertical density of vegetation. The maximum LAI will help set the boundary conditions of evaporation rates from the canopy and vegetation interception, while the difference between maximum and minimum LAI will represent the seasonal variation in LAI (Addor et al., 2017). The spatial variation in different LULC classes indicates that catchments of west-flowing rivers from Tadri to Kanyakumari, east-flowing rivers between Pennar and Kanyakumari, and the Cauvery basin have higher (>8 %) urban areas. In comparison, more than 50 % of the catchment areas of the Godavari, Krishna, Mahi, Narmada, and Tapi basins are covered with agricultural land (Fig. 6a–b). To meet agricultural water demands in these catchments, several large and medium reservoirs and lakes are present in this region, covering more than 2 % of the catchment area (Fig. 6c). The catchments along the southwest coast are mainly covered with trees and exhibit lower seasonal variability in the LAI (Fig. 6d–f). On the other hand, catchments in central India show high seasonal variability in the LAI, primarily due to seasonal crops, as these catchments have a very low fraction of forest cover (Fig. 6d–f).
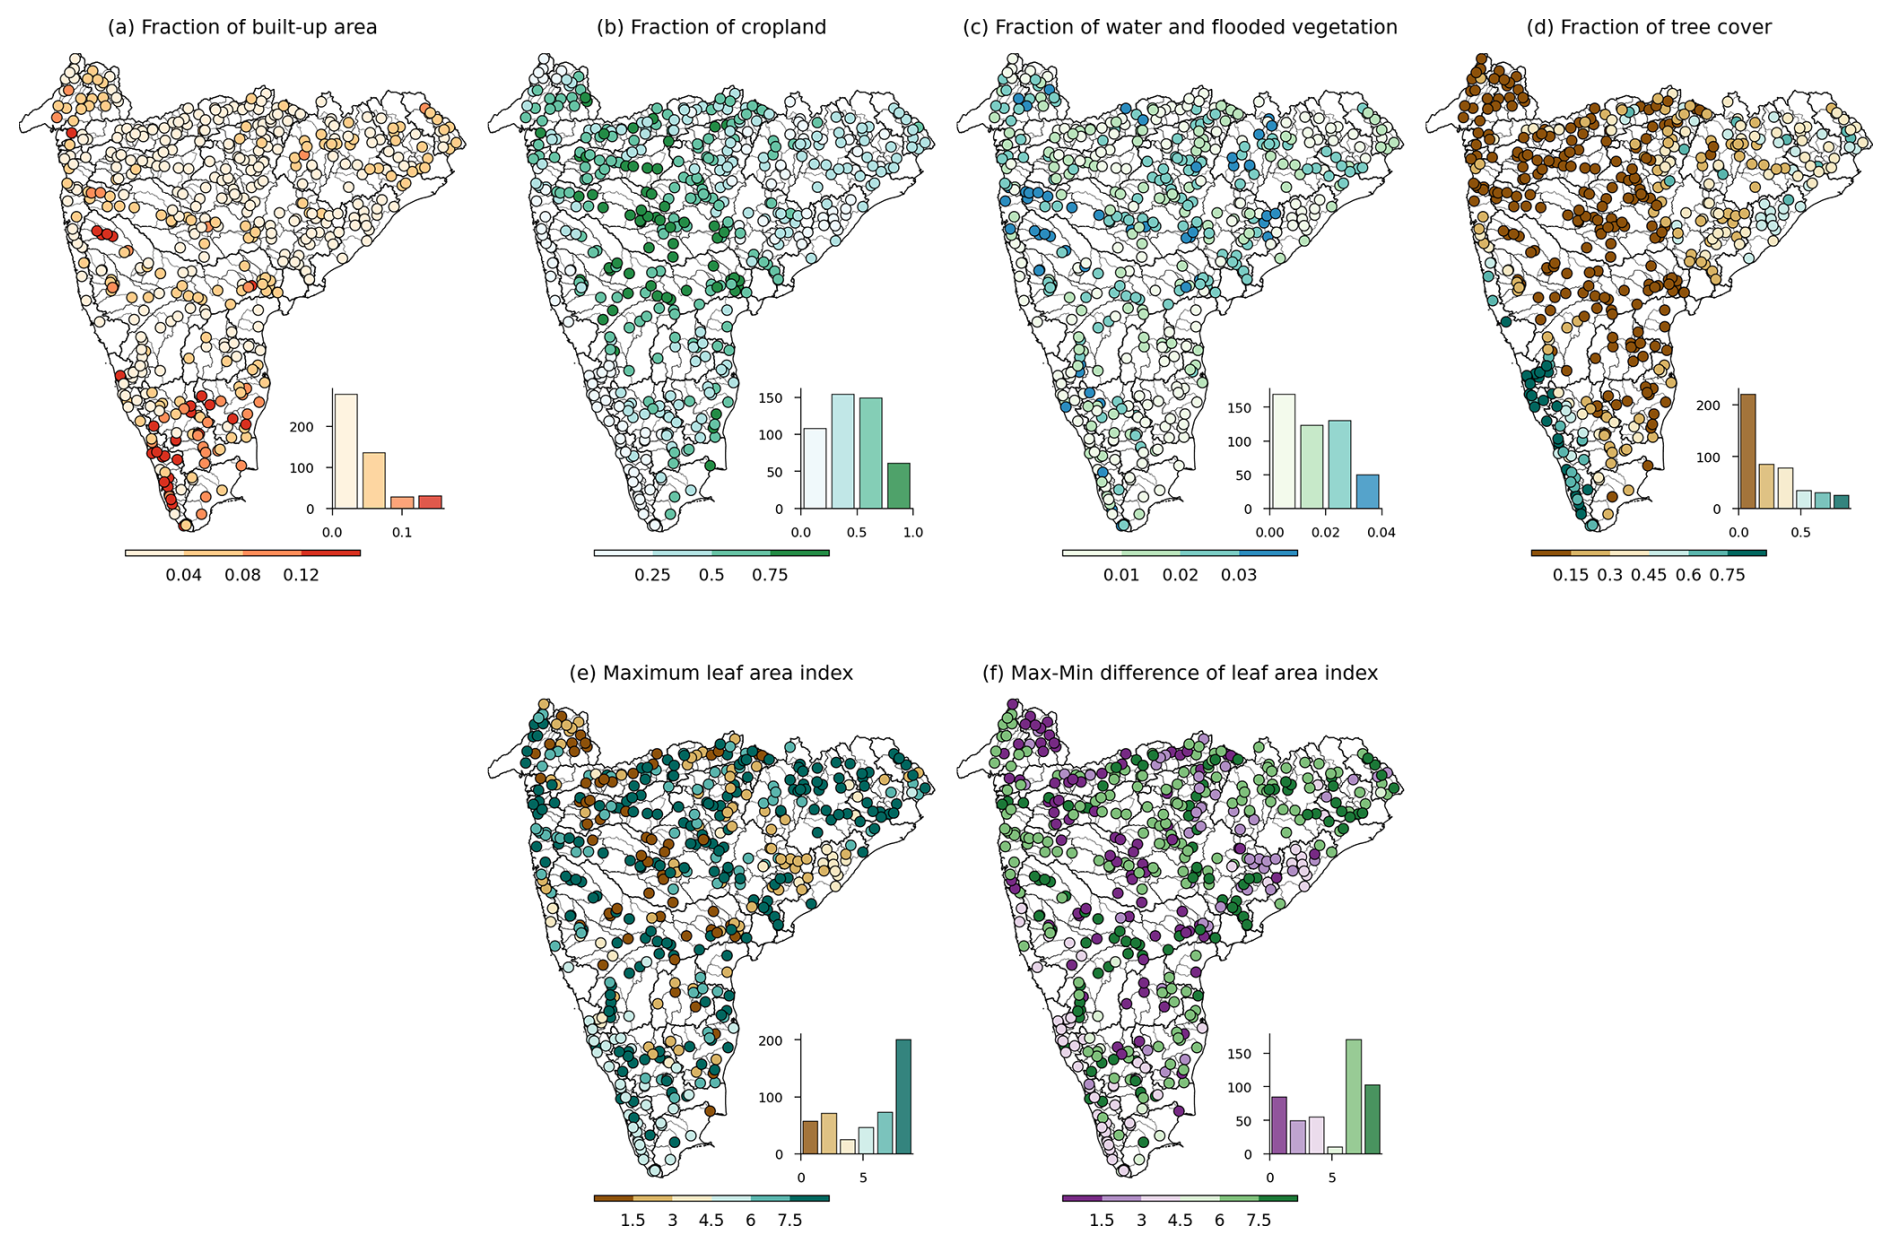
Figure 6LULC characteristics for catchments in Peninsular India. The histograms depict the frequency distribution of catchments across the bins. (a–d) Fraction of built-up area, cropland, water and flooded vegetation, and tree cover, respectively. (e) Maximum leaf area index. (f) Difference between the maximum and minimum leaf area index.
5.5 Soil and geological characteristics
The attributes related to soil characteristics of the catchment were derived from global data sources (Table A7), as national datasets related to soil characteristics are either not freely available or not in a digitized form at present. The average soil depth of the catchments was extracted from Pelletier et al. (2016), which provides the thickness of soil and sediment deposits with a 30 arcsec resolution. The saturated hydraulic conductivity, available water storage, and fraction of organic matter content for both topsoil (0–30 cm) and subsoil (30–200 cm) were extracted from HiHydroSoil v2 at 250 m resolution (Simons et al., 2020). The available water storage capacity of the soil was extracted from Food and Agriculture Organization (FAO) soil data (Fischer et al., 2008). The fraction of sand, silt, clay, gravel, the bulk density of soil, and the organic carbon content in soil for topsoil (0–30 cm) and subsoil (30–100 cm) were extracted from the Harmonized World Soil Database v2.0 (FAO and IISA, 2023). The catchment mean annual average water table depth was extracted from Fan et al. (2013). Additionally, we also extracted the major hydrologic soil group (HSG) from the HiHydroSoil v2 (Simons et al., 2020). The HSG helps derive the runoff curve number utilized in hydrological modeling for direct runoff estimation. All the attributes related to soil characteristics were computed using the zonal statistics tool of QGIS.
The spatial variability in soil attributes shows that the catchments of the Mahanadi and lower Godavari basins have a high fraction of sand, while catchments along the southwest coast in the Brahmani and Baitarni, Sabarmati, and Subernarekha basins have a high fraction of silt and gravel (Fig. 7a–d). The catchments of the Krishna, Narmada, Tapi, and upper Godavari basins have a high fraction of clay in the soil. Catchments of west-flowing rivers from Tapi to Tadri have more than 4 % organic carbon content (Fig. 7e). Out of 472 catchments, 320 catchments in India have a soil depth up to 2 m, while 87 catchments, mainly located along the east coast and lower Godavari, lower Narmada, and Sabarmati basins, exhibit soil depth of more than 3 m (Fig. 7f). The catchments located in the upper part of Peninsular India, mainly in the Godavari, Mahanadi, Mahi, Narmada, Sabarmati, and Tapi basins, have soil with a low available water storage capacity compared to the catchments along the southwest coast (Fig. 7g). The spatial variability in the soil conductivity shows that catchments of lower Krishna, Mahi, Pennar, and Sabarmati basins have high soil conductivity (>5 cm d−1) (Fig. 7h), and catchments of Peninsular India have moderate-to-high runoff potential.
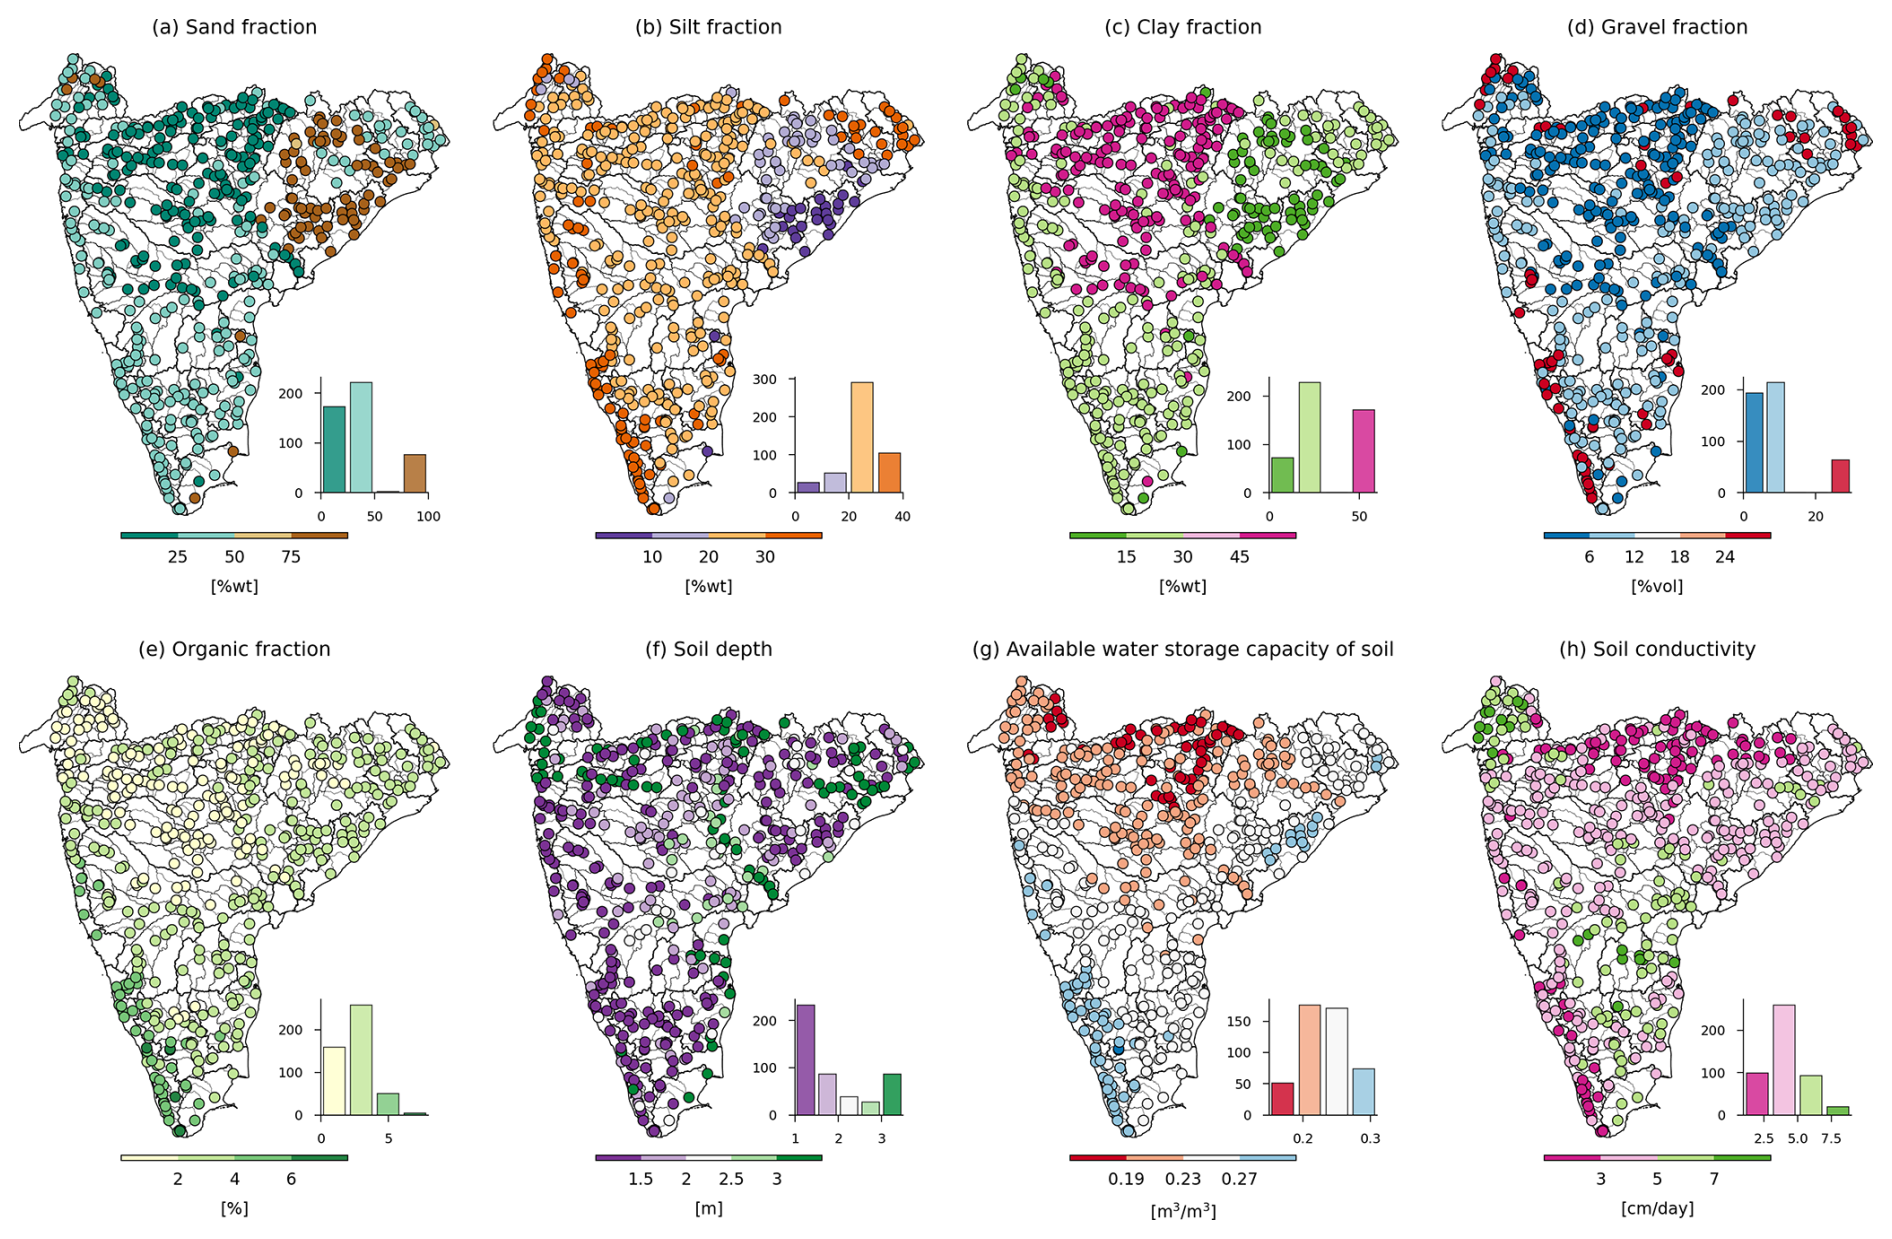
Figure 7Soil characteristics for catchments in Peninsular India. The histograms depict the frequency distribution of catchments across the bins. (a–e) Fraction of sand, silt, clay, gravel, and organic matter content in topsoil (0–30 cm), respectively. (f) Average thickness of soil and sedimentary deposits. (g) Available water storage capacity of topsoil (0–30 cm). (h) Mean saturated hydraulic conductivity of topsoil (0–30 cm).
The geological attributes (Table A8) were computed following Addor et al. (2017). The first and second most common geological classes, their respective proportions within the catchment, and the fraction of “carbonate sedimentary rocks” were extracted from the Global Lithological Map (GLiM) (Hartmann and Moosdorf, 2012) using the zonal statistics and zonal histogram tools of QGIS. The mean subsurface porosity and permeability of the catchment were derived from the GLobal HYdrogeology MaPS (GLHYMPS) (Gleeson et al., 2014). The spatial variability in subsurface porosity and permeability indicates that catchments in the Narmada and Sabarmati basins have relatively high porosity (>0.1), while those in the Mahi, Narmada, Tapi, upper Godavari, and upper Krishna basins exhibit high permeability (>0.73 m2) (Fig. 8a–b). The southern parts of the Peninsular region consist of the hard-rock aquifer system with low porosity and permeability. The Peninsular region is the oldest and largest geomorphic province of India. There are seven dominant geological classes identified in the Peninsular region, namely basic volcanic, metamorphic, acid plutonic, siliciclastic sedimentary rocks, mixed sedimentary rocks, carbonate sedimentary rocks, and subordinate unconsolidated sediments. Out of 472 catchments, 179 have basic volcanic rocks and 176 have metamorphic rocks as the most common geological classes, with the majority of them having only a single geological class for the entire catchment (Fig. 8c–g). The rock types that are classified under basic volcanic rocks are basalts, tephrites, tholeiites, and lamprophyres (Hartmann and Moosdorf, 2012). The metamorphic class constitutes a variety of rocks from shales to gneiss and from amphibolite to quartzite. The groundwater movement in these two dominant classes is controlled by rock fractures and their continuities, depth of weathering, topography, nature, and size of recharge and discharge areas.
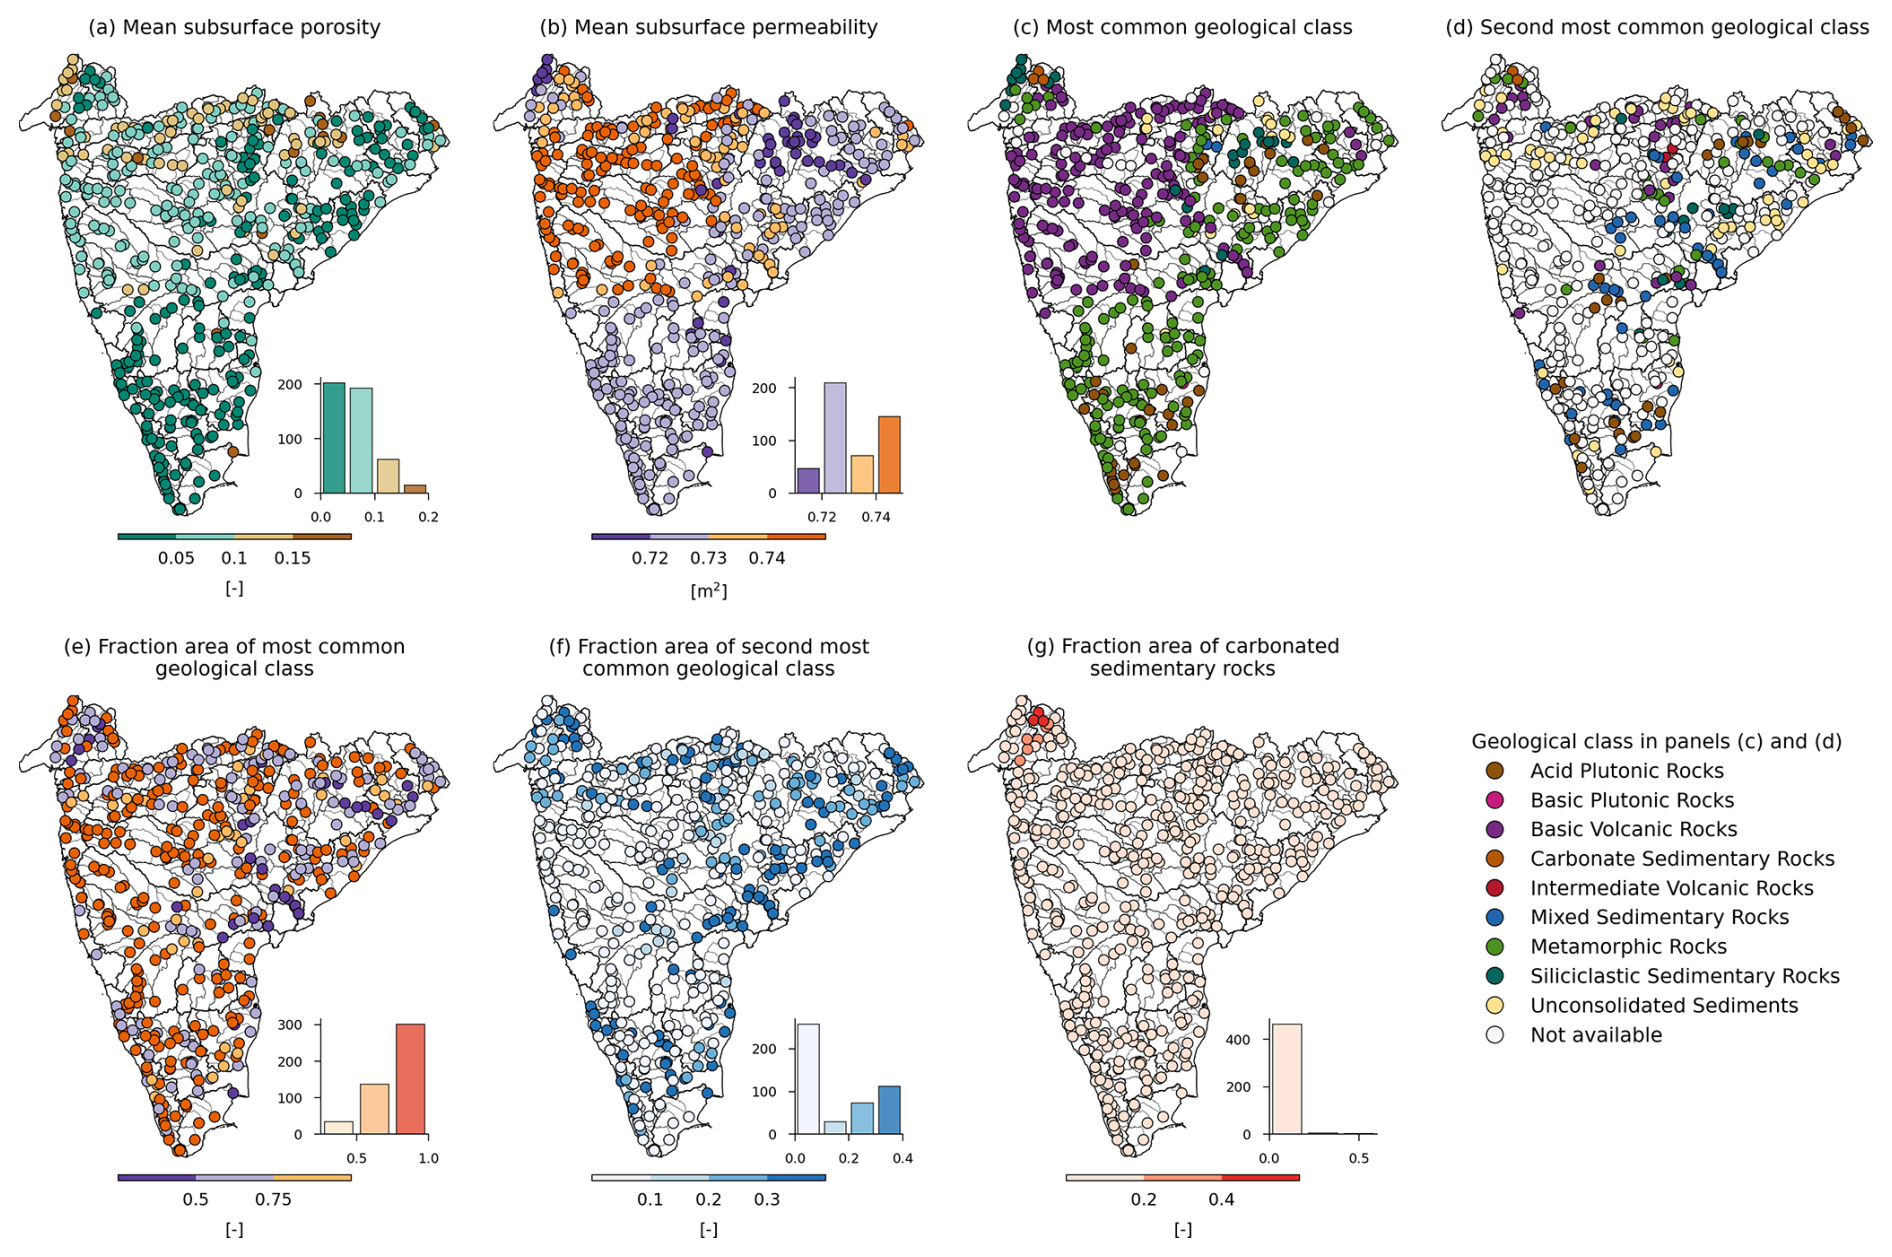
Figure 8Geological characteristics for catchments in Peninsular India. The histograms depict the frequency distribution of catchments across the bins. (a, b) Mean subsurface porosity and permeability. (c, d) Most common geological classes. (e, f) Fraction of the catchment area associated with most common geological classes. (g) Fraction of the catchment area characterized as carbonated sedimentary rocks.
5.6 Anthropogenic influences
Catchments in India have varied degrees of anthropogenic influence. Due to seasonal rainfall patterns, water demands in the region are primarily met by several dams. In CAMELS-IND, the degree of human intervention within the catchments is quantified through the information on the number of dams; year of construction of the first and the recent dam; total cumulative storage of dams; and fraction of these storages used in hydropower generation, flood control, irrigation, drinking, flood storage, and navigation (Table A9). In addition, the reservoir index – a ratio of total storage volume to multiyear annual streamflow – is also estimated. The attributes of the number of dams in each catchment and their cumulative storage volume were extracted and digitized from India-WRIS and the Global Reservoir and Dam Database (GRanD) (Lehner et al., 2011). The water stored in these dams is mainly used for urban and agricultural purposes. Since quantitative measurements of water demands are unavailable, we included decadal population density data (WorldPop and CIESIN, 2018) and the fraction of urban areas and cropland (Roy et al., 2015) as indirect measures in CAMELS-IND.
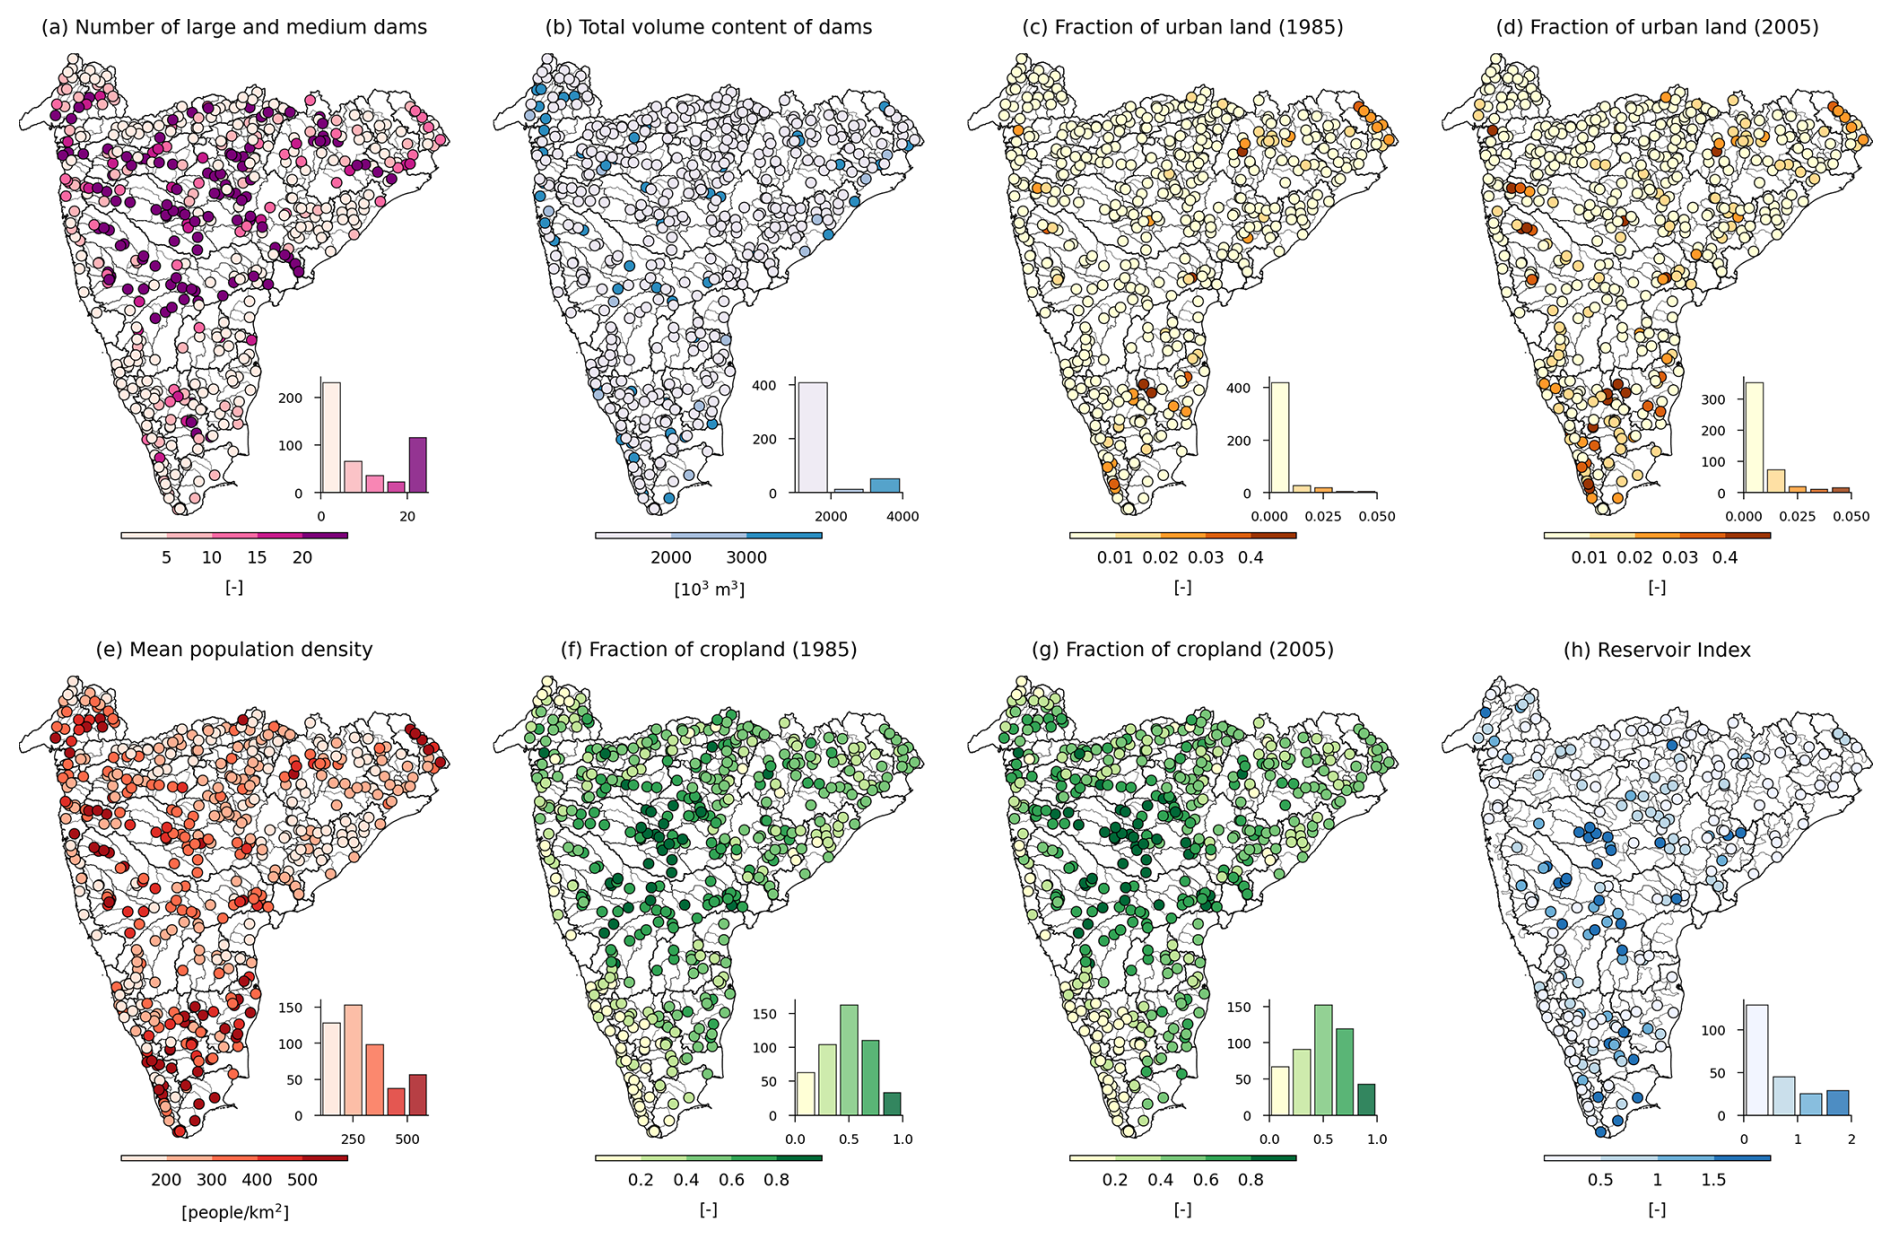
Figure 9Attributes representing anthropogenic influences for catchments in Peninsular India. The histograms depict the frequency distribution of catchments across the bins. (a) Total number of large and medium dams. (b) Total volume content of dams. (c, d) Decadal fraction of urban land cover in 1985 and 2005, respectively. (e) Mean population density. (f, g) Decadal fraction of cropland in 1985 and 2005, respectively. (h) Reservoir index.
The spatial distribution of large and medium dams (with heights > 10 m) across catchments shows significant regulation in the catchments of the Cauvery, Godavari, Krishna, Mahanadi, Mahi, Narmada, and Tapi basins (Fig. 9a–b). The number of dams within the catchment ranges from 0 to 1277, with a mean and median of 75 and 9, respectively. The total storage capacity ranges from 0 to 59 929 Mm3, with a mean and median storage capacity of 3796 and 246 Mm3, respectively. The decadal variation in the urban land cover and population density reveals a notable increase in urbanization within the catchments of southern India from 1985 to 2015 (Fig. 9c–e). Conversely, the fraction of agricultural land remains relatively constant over the same period (Fig. 9f–g). The reservoir index, indicating the impact of dams on streamflow, is higher in the Godavari, Krishna, and Cauvery basins, whereas most of the catchments in Narmada basin and Western Ghats region have lower values of reservoir index (Fig. 9h). It is observed that the majority of the dams in this region served irrigation purposes, whereas the dams in the lower Western Ghats of the Peninsular region are mainly used for hydroelectric power generation (Fig. A1).
We used a long short-term memory (LSTM)-based regional hydrological model applied to Indian catchments by Mangukiya et al. (2023) to predict the daily streamflow for all 472 catchments. The LSTM model architecture includes an input gate, output gate, forget gate, and a memory cell, which enables the model to learn long-term dependencies within the input datasets (Hochreiter and Schmidhuber, 1997). We trained the LSTM-based regional hydrological model using daily meteorological time series and catchment attributes as input and predicted daily streamflow (Mangukiya et al., 2023; Mangukiya and Sharma, 2024). The input data included daily meteorological time series of precipitation, maximum and minimum temperature, solar radiation, wind speed, and relative humidity, along with catchment attributes representing topographic, land cover, soil, and geological characteristics. The LSTM model was trained using a dataset from 159 catchments, ensuring that a minimum data length of 28 years was available for each catchment between 1980 and 2020. The optimized hyperparameter values for the LSTM model were adopted from Mangukiya et al. (2023). The model was trained from 1 January 1991 to 31 December 2015, validated from 1 January 1980 to 31 December 1990, and tested from 1 January 2016 to 31 December 2020. In addition to 159 catchments, we tested the LSTM model's generalization capability to make streamflow predictions in 17 pseudo-ungauged catchments, which were held out during training.
The results indicate satisfactory model performance, with a median Nash–Sutcliffe efficiency (NSE) of 0.59 and 0.57 during the test and validation periods, respectively (Fig. 10a). Notably, the LSTM model achieved a median correlation of 0.8, percentage bias of −7.64, Kling–Gupta efficiency (KGE) of 0.62, root mean squared error (RMSE) of 121.5 m3 s−1, low flow (bottom 30 % of flow, FLV) bias of −1.4 %, and high flow (top 2 % of flow, FHV) bias of −15.72 % (Fig. 10b). Additionally, we calculated the average RMSE of the observed and predicted flow duration curve (fdcRMSE) as an additional evaluation metric. The model achieved a median fdcRMSE of 127.09 m3 s−1. However, we observed that the LSTM model performed poorly in challenging catchments, such as those with a high number of dams, non-perennial catchments, and catchments in arid and semi-arid climate zones. More details on the model's performance and limitations can be found in Mangukiya et al. (2023). The LSTM-based regional hydrological model, trained on 159 catchments, was used to predict daily streamflow for all 472 catchments from 1 January 1980 to 31 December 2020. Within CAMELS-IND, gauge-wise predicted streamflow series are provided in a compressed zip file named LSTM_pred_streamflow.zip. This predicted streamflow series is included in the dataset to support deep-learning- or machine-learning-based hydrology research and can be used as a benchmark or baseline model for developing and testing hydrological models.
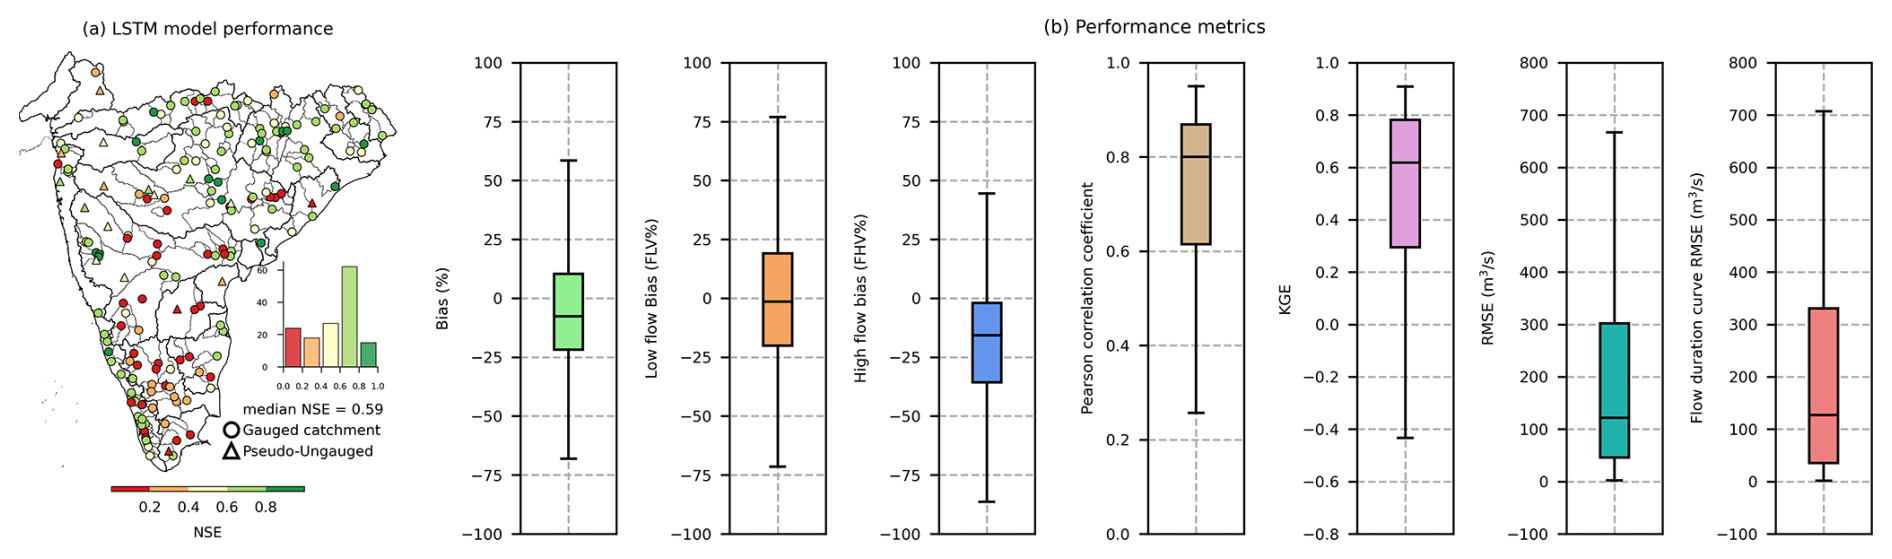
Figure 10LSTM model performance. (a) Spatial distribution of NSE. (b) Performance metrics.
The preliminary assessment presented here focuses only on the catchment mean meteorological time series provided in CAMELS-IND. The precipitation and maximum and minimum temperature time series were extracted from the IMD dataset. Goteti (2023) has provided a detailed comparison of the annual precipitation series of the catchment extracted from IMD and ECMWF Reanalysis (ERA). The results indicated a Pearson correlation coefficient greater than 0.75 for 31 catchments and between 0.5 to 0.75 for 331 catchments out of 472. The lower correlation was found only in the hilly terrain of the southwestern part of Peninsular India. Moreover, Mahto and Mishra (2019) also observed a general consistency between the ERA and IMD datasets. We extracted the meteorological time series of solar radiation, wind speed, relative humidity, and soil moisture from the IMDAA data. Figure 11a shows the Pearson correlation of catchment mean annual time series for long-wave and short-wave solar radiation, as well as wind speed, extracted from IMDAA and those derived from the Global Land Data Assimilation System (GLDAS) Noah Land Surface Model L4 3-hourly 0.25×0.25 v2.0 for period of 1980–2014 (Beaudoing and Rodell, 2019) and v2.1 for period 2014–2020 (Beaudoing and Rodell, 2020). For the majority of catchments, the long-wave solar radiation extracted from the IMDAA dataset shows consistency with that of the GLDAS dataset, indicated by a high correlation coefficient. However, a lower correlation was observed for short-wave solar radiation, particularly in the hilly terrain of the Mysore plateau and southern catchments. Similarly, wind speed also exhibited discrepancies in a few catchments in the southern region and in the catchments of the upper Eastern Ghats, lower Godavari, Mahanadi, Brahmani, and Baitarni basins. These discrepancies between the data sources could be attributed to the different boundary conditions and forcings that are used to simulate the climate models (Rodell et al., 2004; Rani et al., 2021). While global reanalysis products provide a convenient data source, their relatively coarse resolution (e.g., 25 km grid spacing) limits their ability to accurately capture climate variations in mountainous regions. In contrast, IMDAA, with its 10 km resolution, provides a more detailed representation of such variations. As demonstrated by Nayak et al. (2018), reanalysis products derived using Indian-specific boundary conditions and land use data showed better performance in capturing meteorological patterns in hilly areas compared with GLDAS.
To further evaluate the quality of the meteorological time series provided within the CAMELS-IND, we used it as input to the LSTM-based regional hydrological model (described in Sect. 6) and compared the model's performance with that of GLDAS meteorological time series as input for 200 catchments with continuous streamflow observations from 1991 to 2015. The model was trained on data from 1991 to 2011 and tested on data from 2011 to 2015. The results indicate superior model performance when using IMDAA forcings as input compared to GLDAS forcings (Fig. 11b). For the majority of the catchments (165 out of 200), the model performed better with IMDAA forcings. Minor improvements (with a NSE difference of ≈0.02) were observed in 13 catchments, while performance significantly deteriorated in 22 catchments with GLDAS forcings. Notably, the simulated streamflow based on IMDAA forcings outperformed that based on GLDAS forcings, with a median percentage bias of −11.74 %, low flow bias (FLV) of −19.48 %, and high flow bias (FHV) of −18.58 % compared to −20.39 %, −22.5 %, and −25.22 %, respectively (Fig. 11c). Overall, the preliminary assessment of the dataset suggests that the meteorological time series extracted from the IMD and IMDAA have the best available national data sources for Indian region, providing reliable model performance compared to global data sources.
The preliminary results clearly demonstrated the CAMELS-IND dataset's potential to significantly enhance the performance of hydrological applications. However, it is crucial to acknowledge that the dataset is not without its limitations. Several factors, including data collection methods, processing techniques, and measurement errors, can introduce uncertainties into the dataset. For instance, the use of diverse instruments and methodologies over time can lead to inconsistencies in measurements, particularly for variables like rainfall and streamflow. While the dataset provides catchment-averaged indices and series, the spatial resolution disparities between satellite, ground-based, and re-analysis products have a relatively limited impact on overall data quality. Nonetheless, gaps in data coverage and the presence of spurious values can further exacerbate the uncertainty. A detailed assessment and quantification of uncertainty is beyond the scope of this paper and will be addressed in future versions of the dataset when ground-based observations become available for public use.
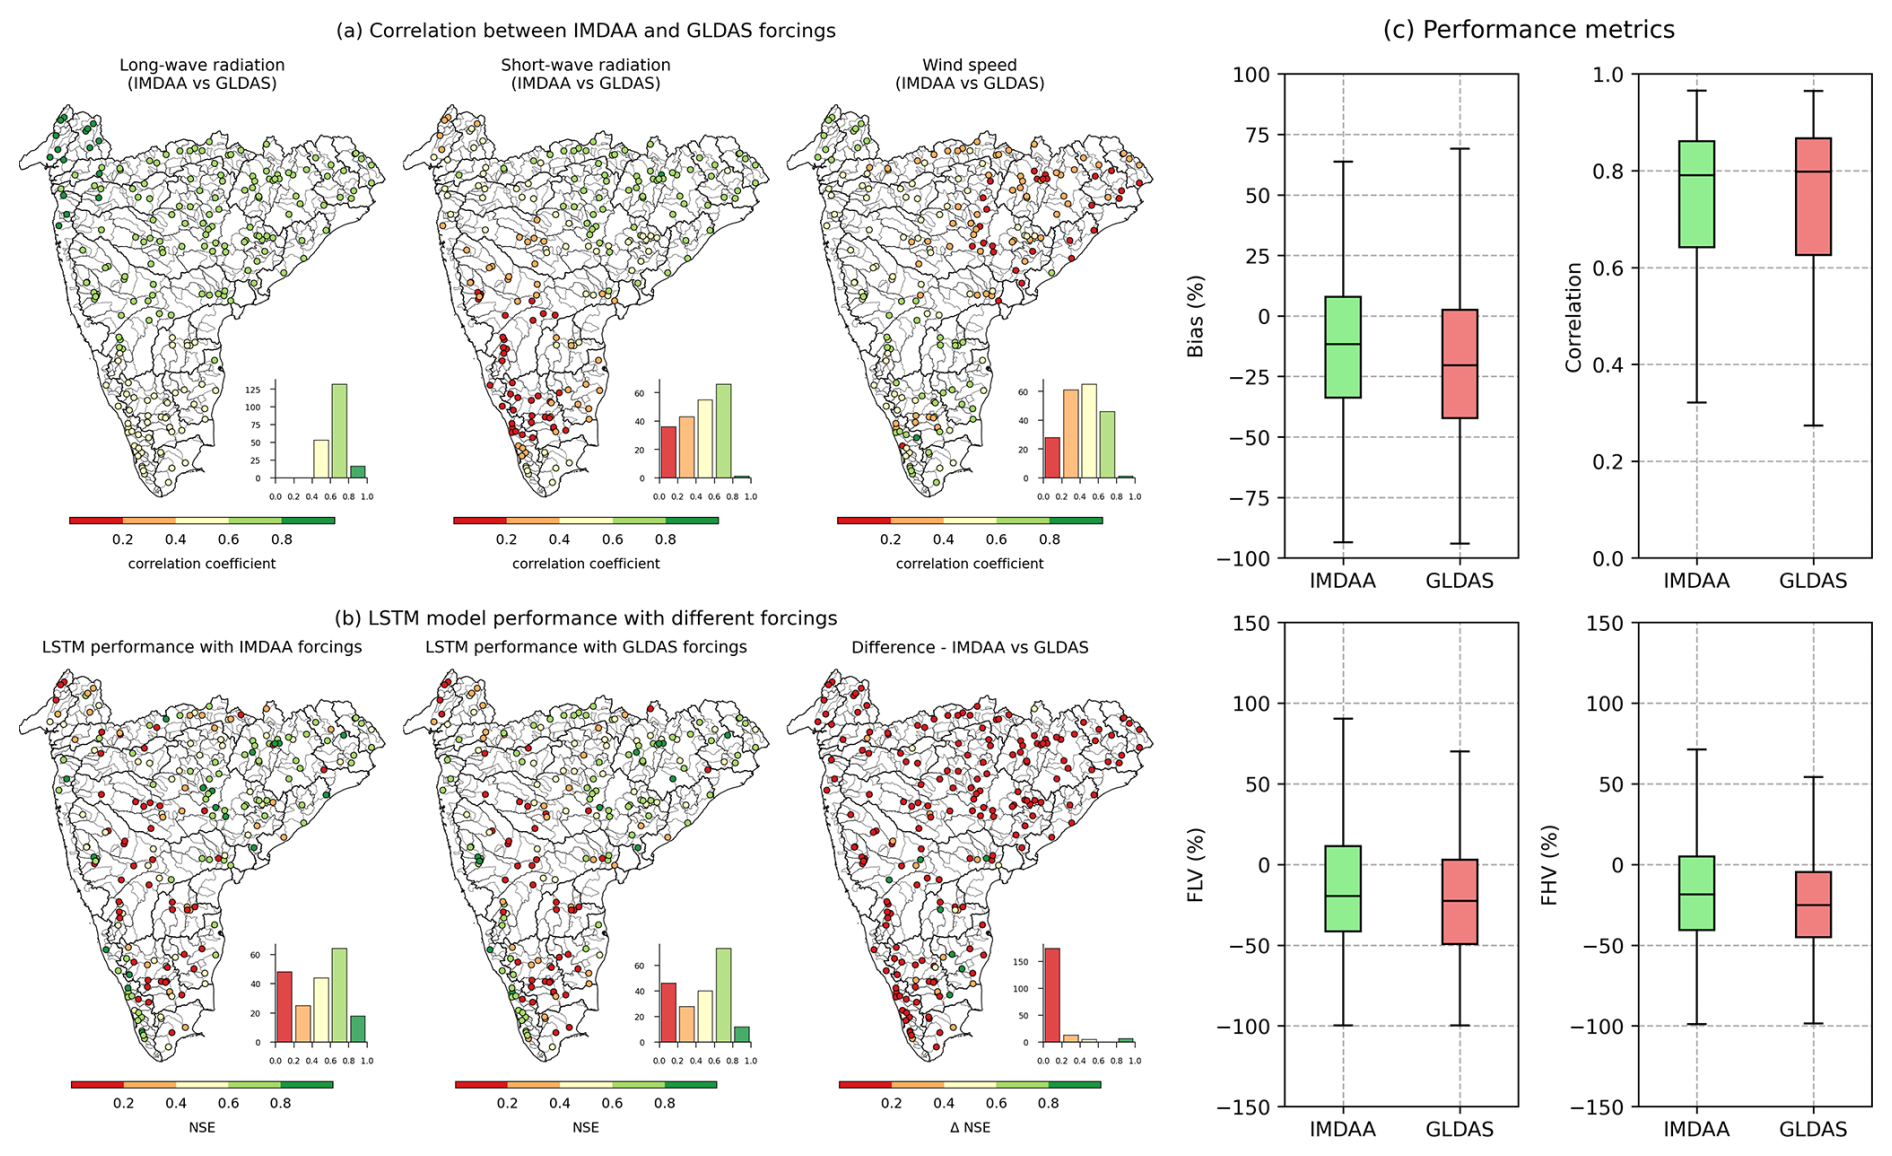
Figure 11(a) Pearson correlation coefficient between catchment mean annual time series from IMDAA and GLDAS. (b) LSTM model performance with IMDAA and GLDAS as inputs. (c) Calculated performance metrics of the LSTM model with IMDAA and GLDAS forcing inputs.
The CAMELS-IND dataset currently provides hydrometeorological time series and catchment attributes for only 472 catchments in Peninsular India due to the availability of openly accessible and quality-controlled datasets. However, India has 4824 catchments at present, many of which are restricted due to their location in transboundary river basins. While the meteorological data are available for the entire country, the primary constraint is the availability of consistent streamflow observations. In future versions, we aim to address this limitation by applying the conceptual or physics-based and regionally trained LSTM-based hydrological model to other locations, thereby providing simulated streamflow series for catchments currently classified as restricted. Additionally, we intended to leverage the streamflow series from other sources, such as GloFAS (Global Flood Awareness System; Harrigan et al., 2020) and satellite altimetry (Verma et al., 2021; Rai et al., 2021) to improve the spatial coverage of the dataset. To ensure accuracy, these streamflow time series will be validated against ground-based measurements at selected stations in restricted regions.
Groundwater is a vital component of understanding hydrological extremes such as floods (Sharma and Mujumdar, 2024) and droughts (Hellwig et al., 2020). However, the current CAMELS-IND dataset is limited by the absence of groundwater data. To address this limitation, we aim to incorporate the groundwater level data available at India-WRIS Portal (https://indiawris.gov.in/wris/, last access: 18 November 2024) and derived groundwater level data from Gravity Recovery and Climate Experiment (GRACE) (Li et al., 2019; Moudgil and Rao, 2023; Gautam et al., 2024). The inclusion of groundwater data will significantly improve the dataset's ability to capture the complex interactions between surface and sub-surface systems, thereby enhancing our understanding of hydrological processes and extreme events.
The catchment boundaries included in the CAMELS-IND dataset are derived from Goteti (2023), who highlighted that the catchment delineation based on the 500 m HydroSHEDS v1 dataset may suffice for larger catchments but could introduce minor mismatches, particularly in smaller catchments and around flow outlets. The upcoming HydroSHEDS v2, with 12 m topographic data, is anticipated to improve spatial accuracy, enhancing the delineation of catchment boundaries and river networks for future dataset versions.
The CAMELS-IND dataset is freely available at https://doi.org/10.5281/zenodo.14005378 (Mangukiya et al., 2024), which includes (1) the file 00_CAMELS_IND_Data_Description.pdf, which provides a description of data sources, references, and the file structure of the dataset in the repository; (2) CAMELS_IND_All_Catchments.zip, containing hydrometeorological time series, catchment attributes, and GIS shapefiles for all 472 catchments, as well as a filter_catchment.py script to help users create a subset of the dataset based on specific requirements; and (3) CAMELS_IND_Catchments_Streamflow_Sufficient.zip, a subset of data for the 228 catchments with observed streamflow for at least 30 % of the period between 1980 and 2020.
India has hydrologically distinct catchments, each with unique characteristics. However, Indian catchments are often underutilized in global hydrological studies due to insufficient analysis-ready datasets. To address this gap, we introduce CAMELS-IND (Catchment Attributes and MEteorology for Large-sample Studies – India), which provides catchment mean time series of meteorological variables and around 211 catchment attributes representing location and topography, climate, hydrological signatures, land use land cover (LULC), soil and geology, and anthropogenic influences for 472 catchments in Peninsular India. Such a dataset is essential for understanding hydrologic processes over multiple spatiotemporal scales and various other applications for planning and regulating water resources in India. The CAMELS-IND follows the same standards of the previously developed CAMELS datasets for the USA, Chile, Brazil, Great Britain, Australia, Switzerland, and Germany to facilitate comparisons with catchments of those countries and inclusion in global hydrological studies.
CAMELS-IND serves as a stepping stone to provide large-sample hydrometeorological time series and attributes of the Indian catchments to the global and national hydrological community, and we plan to update and expand the dataset with additional catchment attributes and meteorological forcings as new national data sources become available. For example, future versions of CAMELS-IND could include additional catchment attributes to better characterize heterogeneity and regulations within each catchment. Additionally, since data uncertainties are inherent, future studies will explore this through comparisons with additional data sources.
The creation of CAMELS-IND aims to foster large-sample hydrological studies in India and promote the inclusion of Indian catchments in global hydrological research. Furthermore, it will enhance the reproducibility and transparency of hydrological studies in India by providing a standardized dataset.
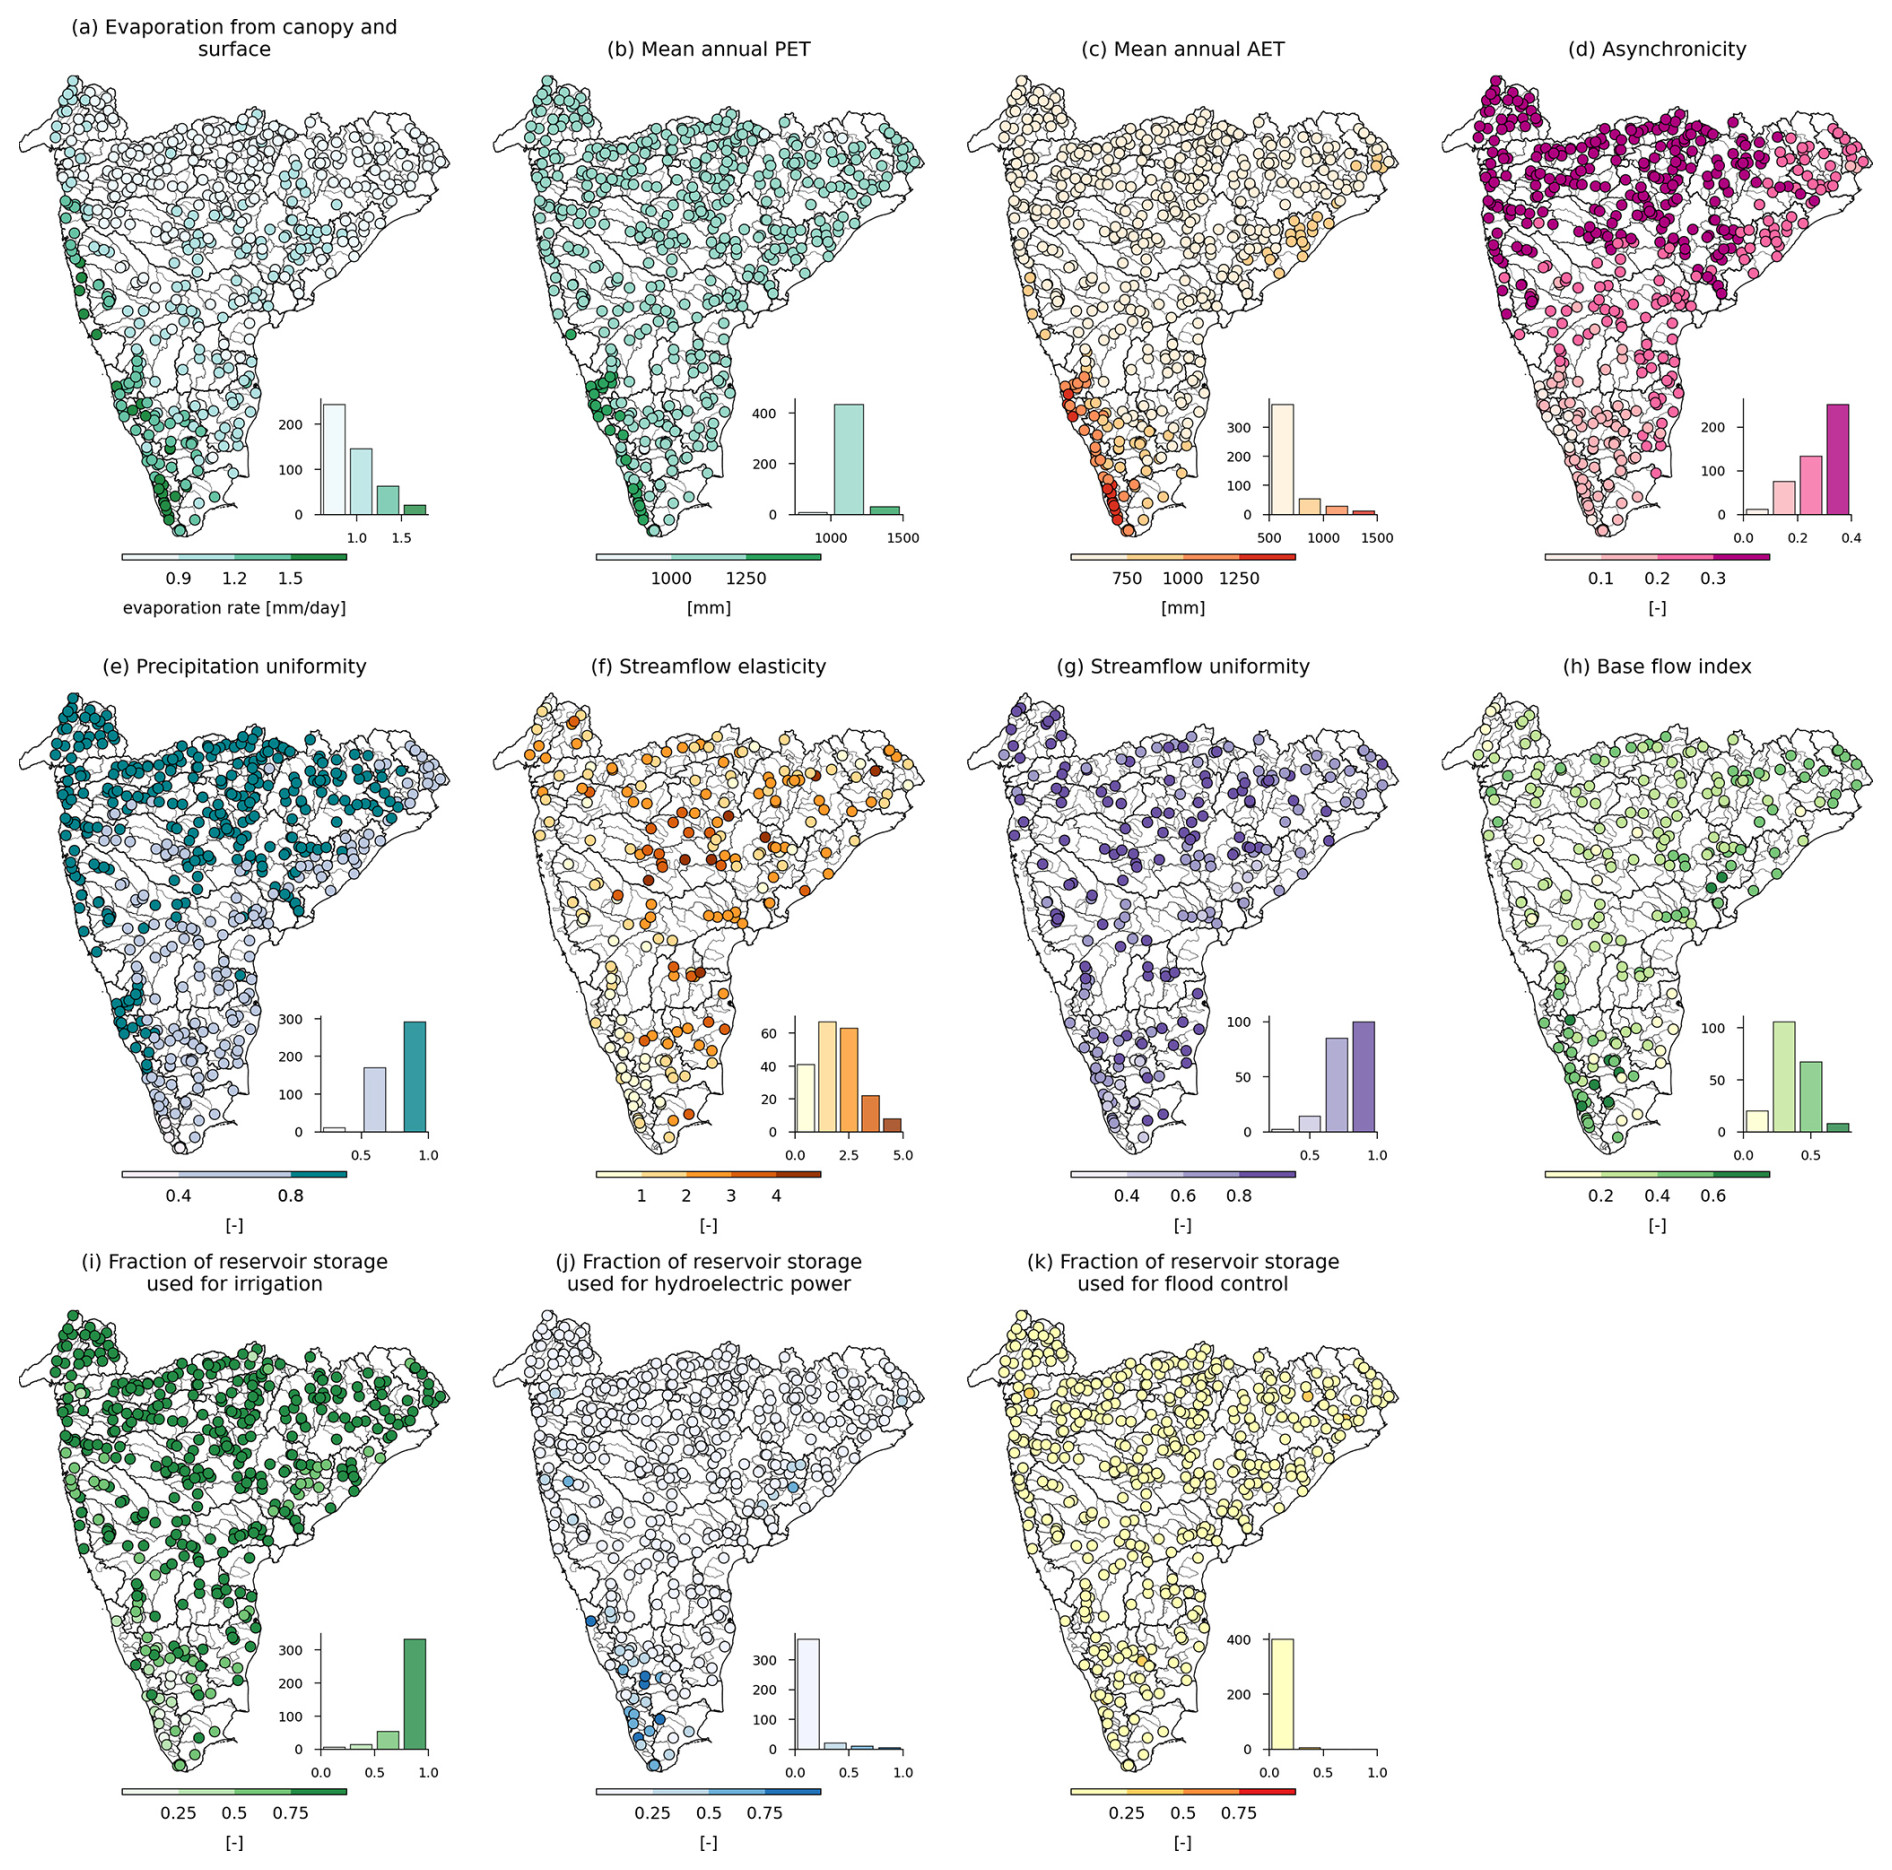
Figure A1(a) Evaporation from canopy and soil surface; (b) mean annual actual evapotranspiration; (c) mean annual potential evapotranspiration; (d) asynchronicity; (e) precipitation uniformity; (f) streamflow elasticity; (g) streamflow uniformity (Gini coefficient); (h) baseflow index; and (i–k) fraction of reservoir storage uses for irrigation, hydroelectric power, and flood control.
Table A1Summary of streamflow and catchment mean meteorological time series for a period from 1 January 1980 to 31 December 2020.
Table A2Summary of catchment attributes representing gauge names and identifiers.
Table A3Summary of catchment attributes representing location and topography.
Table A4Summary of catchment attributes representing climate indices computed from 1 January 1980 to 31 December 2020.

Table A5Summary of catchment attributes representing hydrological signatures computed from 1 January 1980 to 31 December 2015.
Table A6Summary of catchment attributes representing land cover characteristics.
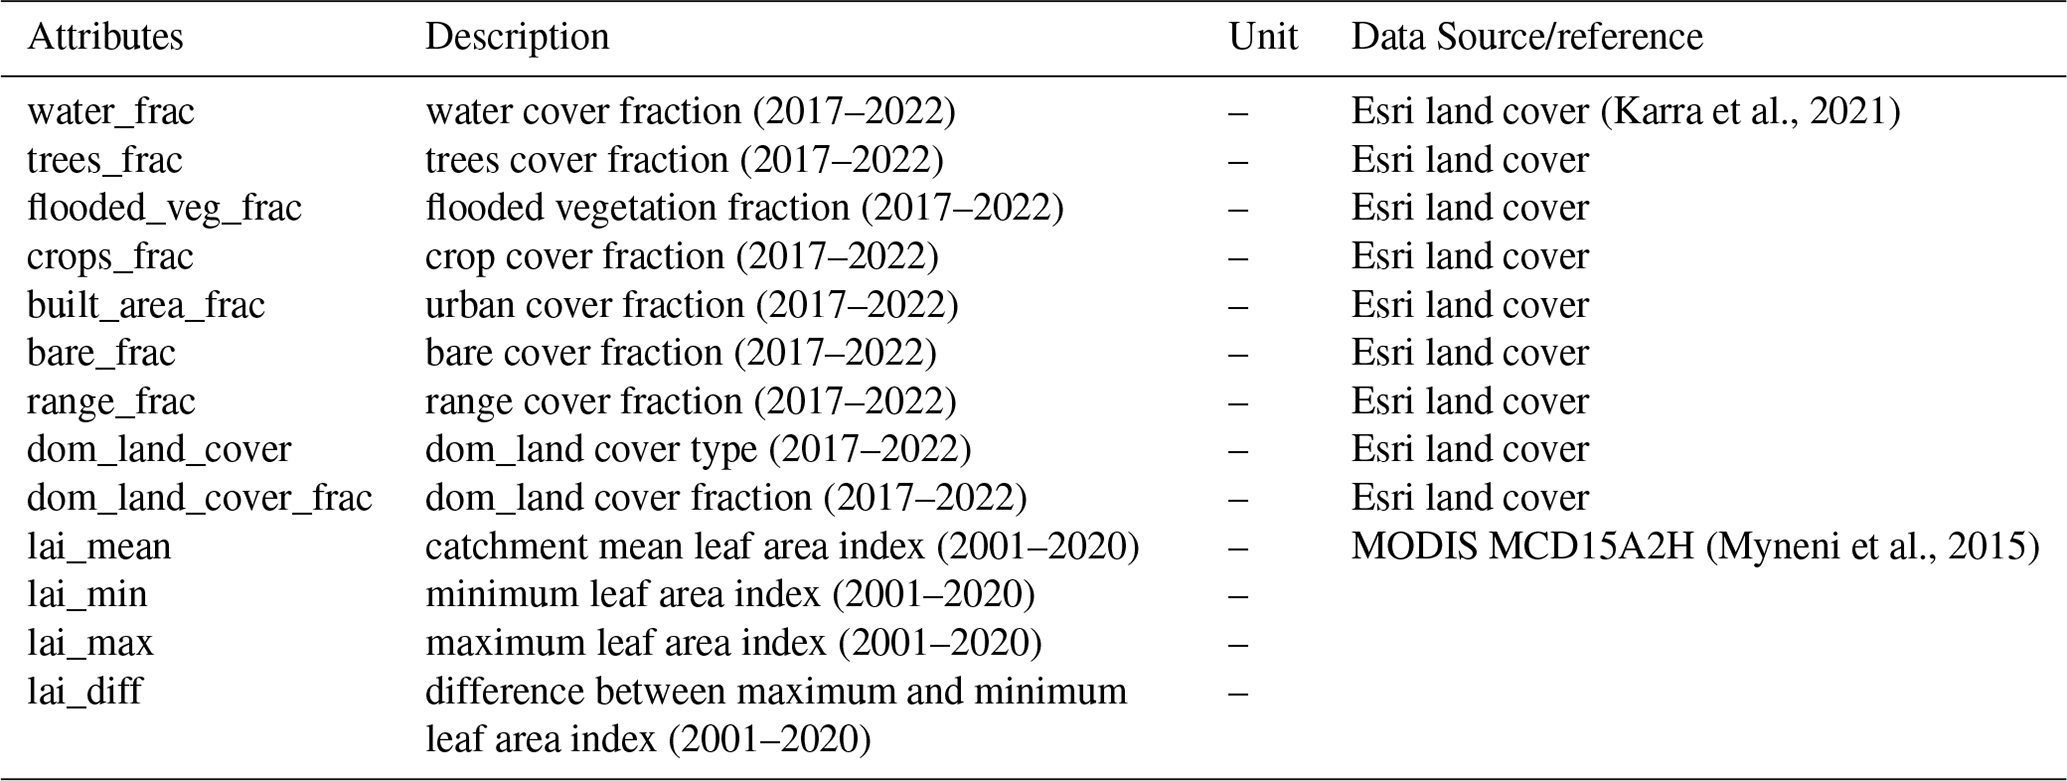
Table A7Summary of catchment attributes representing soil characteristics.
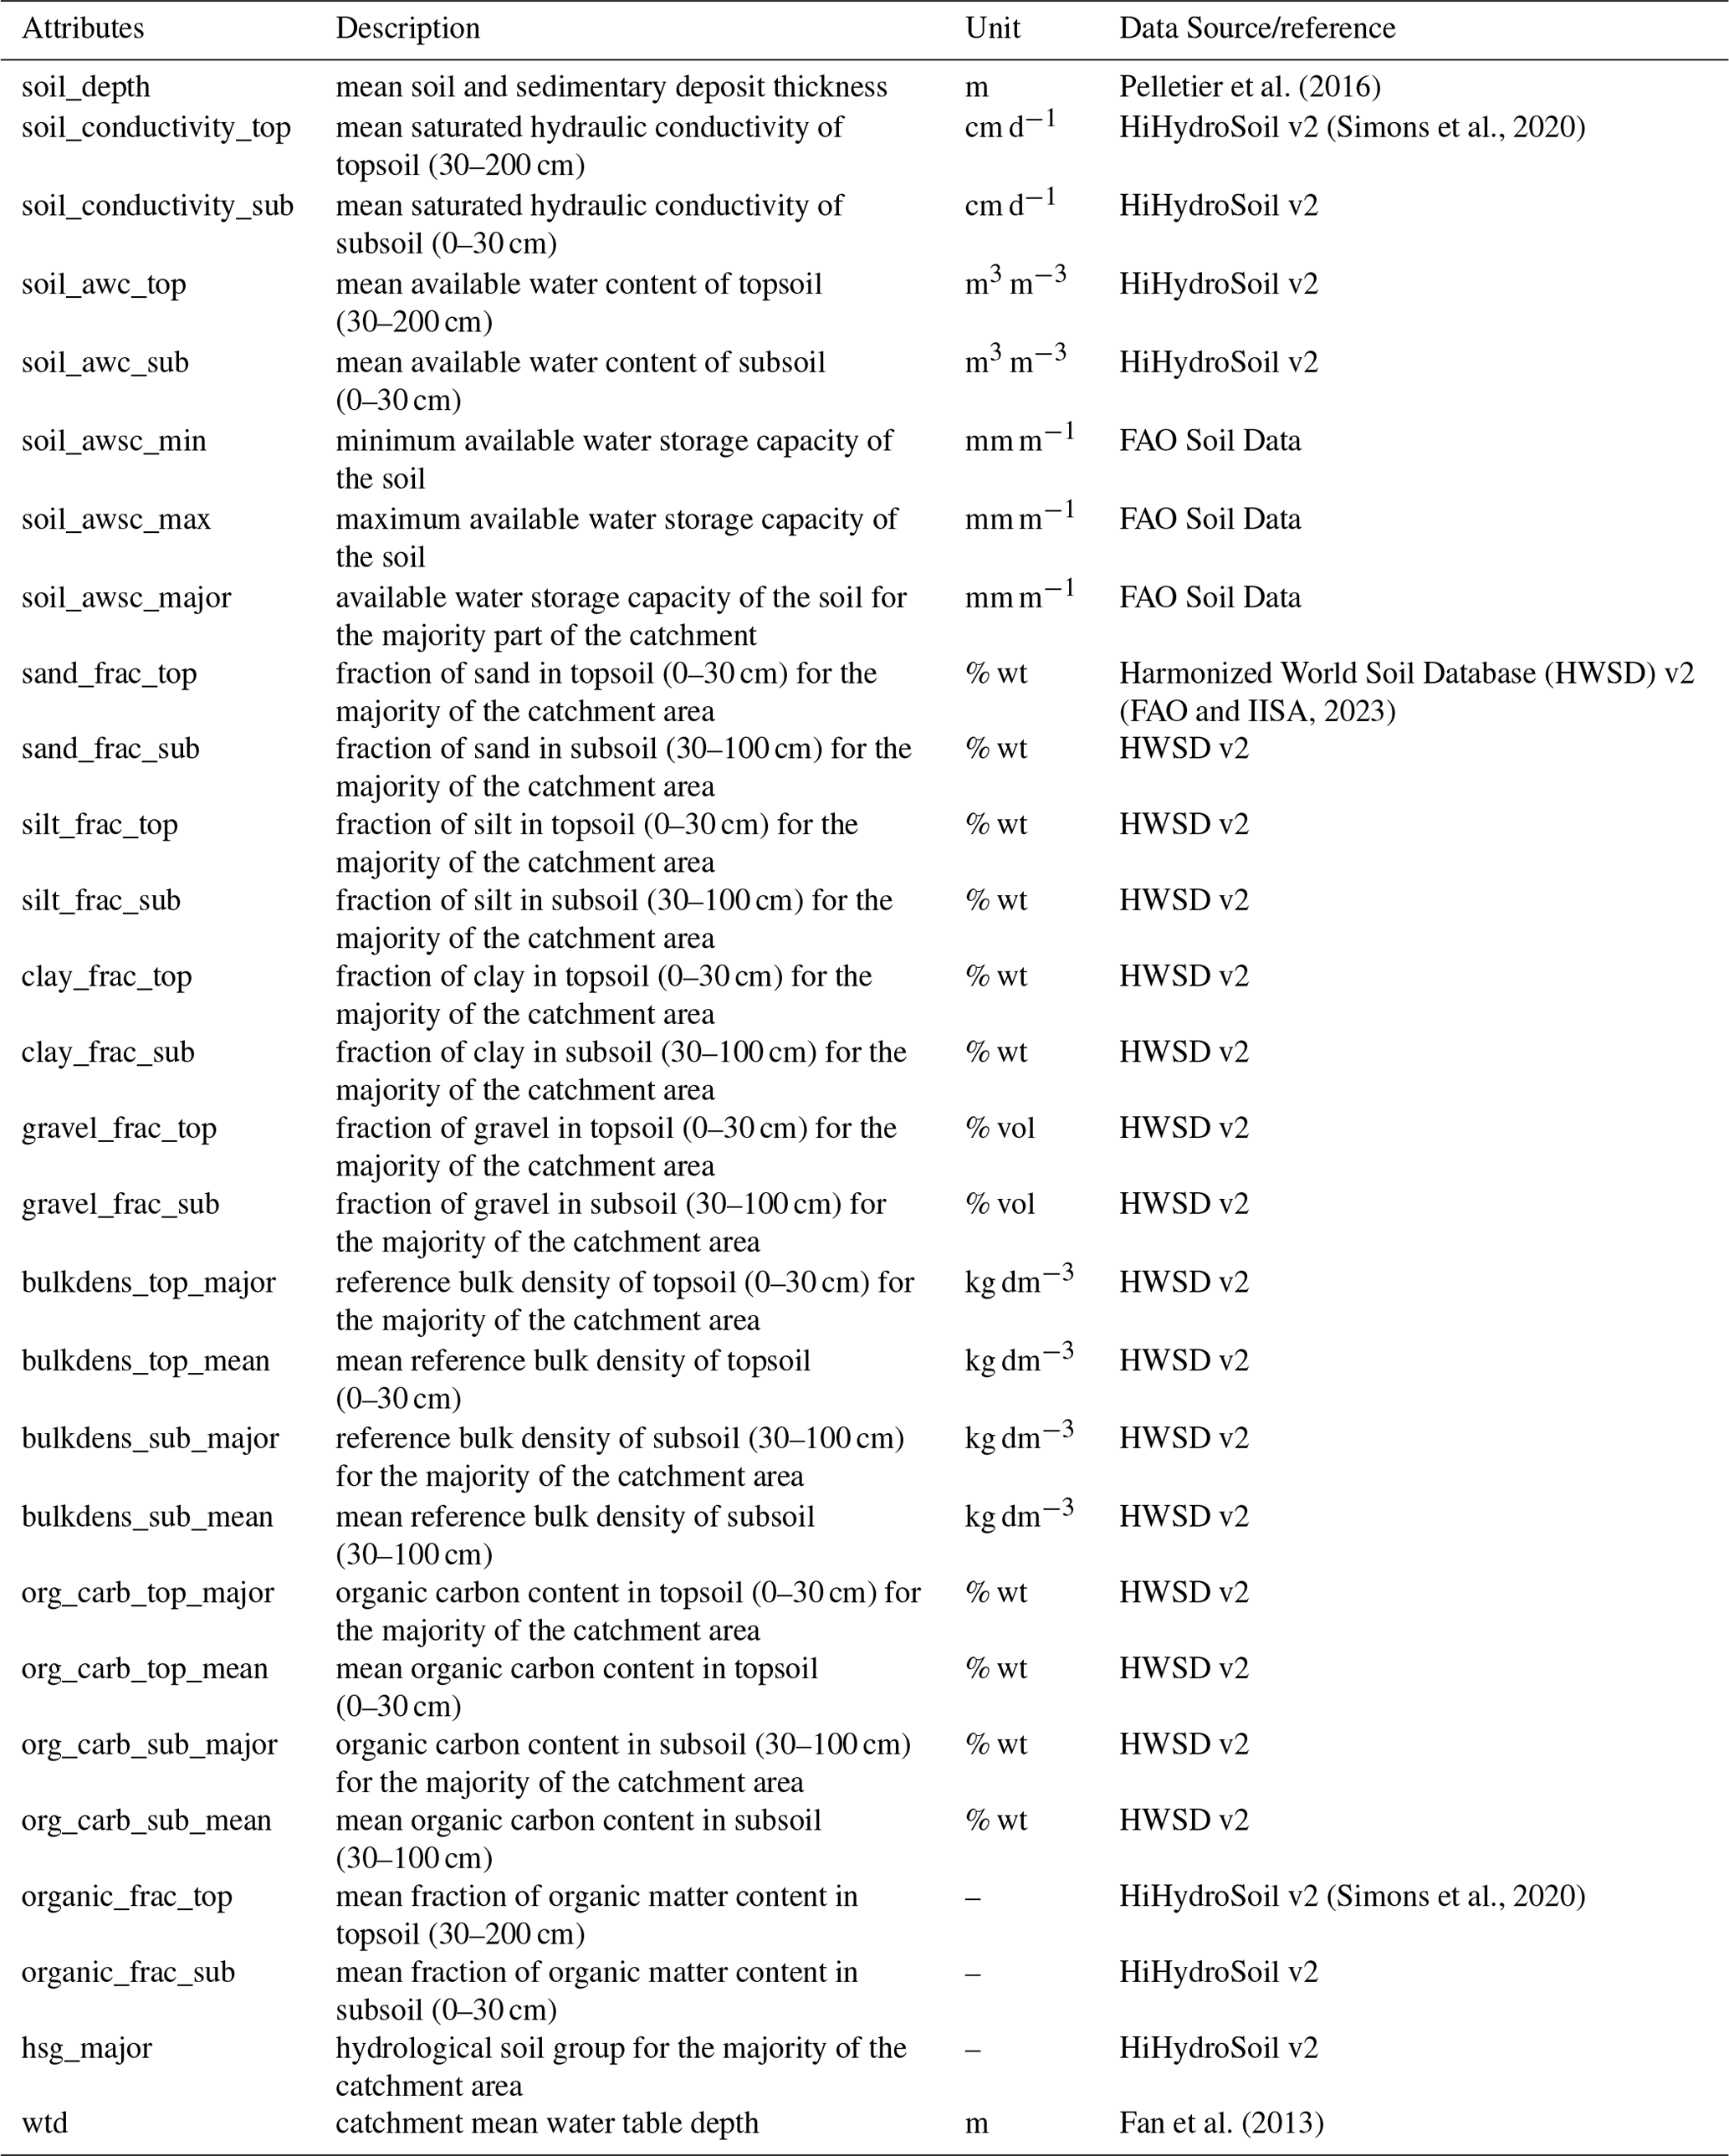
Table A8Summary of catchment attributes representing geological characteristics.
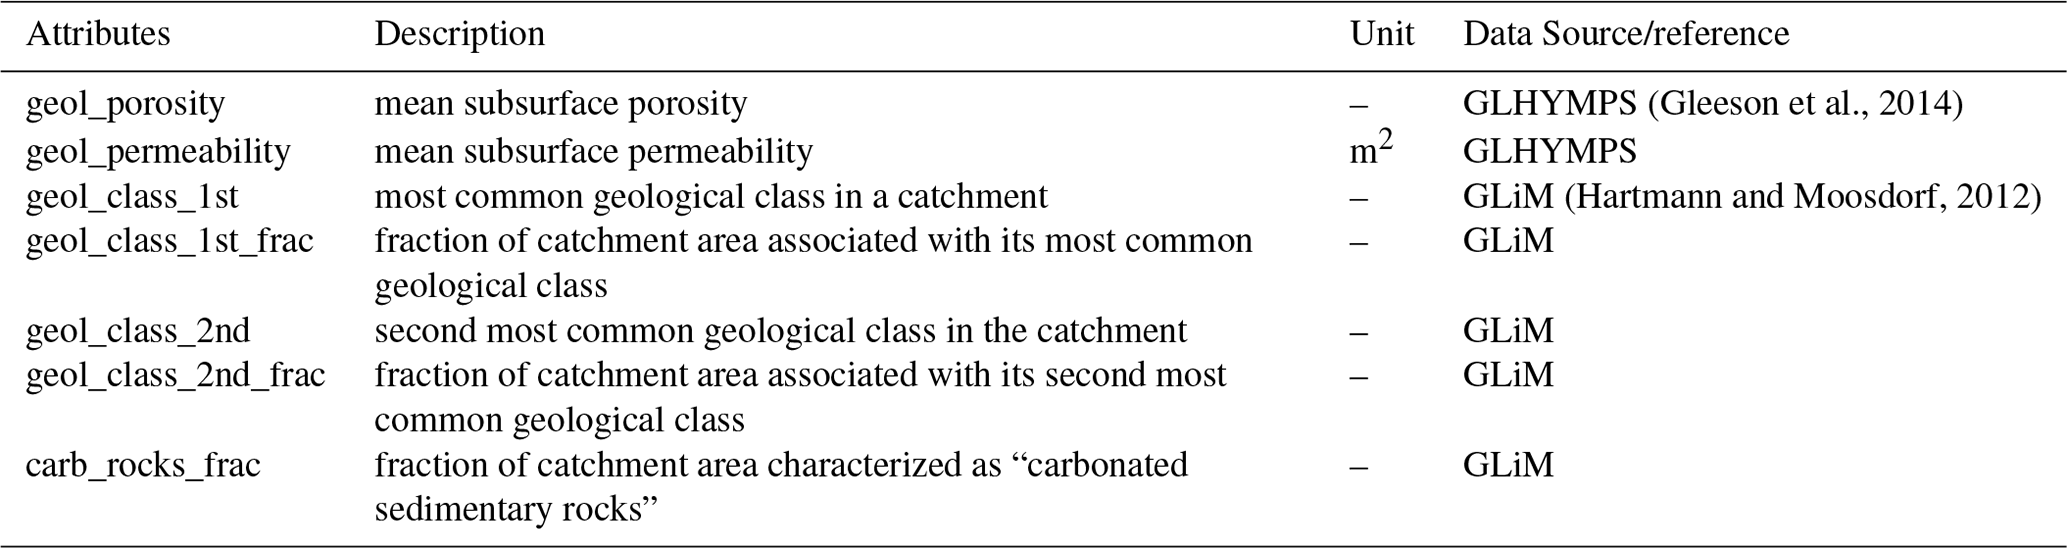
Table A9Summary of catchment attributes representing anthropogenic influences.
NKM: conceptualization; data curation; formal analysis; investigation; visualization; writing (original draft preparation); writing (review and editing). KBK: conceptualization; data curation; formal analysis; investigation; writing (original draft preparation). PD: conceptualization; writing (review and editing). SS: conceptualization; writing (review and editing). VB: data curation; formal analysis. PPM: conceptualization; resources; supervision; writing (review and editing). AS: conceptualization; resources; supervision; writing (review and editing).
The contact author has declared that none of the authors has any competing interests.
Publisher's note: Copernicus Publications remains neutral with regard to jurisdictional claims made in the text, published maps, institutional affiliations, or any other geographical representation in this paper. While Copernicus Publications makes every effort to include appropriate place names, the final responsibility lies with the authors.
The authors gratefully acknowledge the Central Water Commission (CWC), the National Water Informatics Centre (NWIC), and the Ministry of Jal Shakti (MoJS) for providing the streamflow dataset through the online portal, India – Water Resources Information System (India-WRIS; https://indiawris.gov.in/wris/#/, last access: 18 November 2024). The authors also extend their gratitude to the India Meteorological Department (IMD), Ministry of Earth Sciences, Government of India, for providing the gridded rainfall and temperature datasets through their respective websites. Additionally, the authors gratefully acknowledge the National Centre for Medium Range Weather Forecasting (NCMRWF), Ministry of Earth Sciences, Government of India, for the Indian Monsoon Data Assimilation and Analysis (IMDAA) reanalysis. The IMDAA reanalysis was produced under the collaboration between UK Met Office, NCMRWF, and IMD, with financial support from the Ministry of Earth Sciences under the National Monsoon Mission program. The authors utilized numerous publicly available datasets for compiling catchment attributes and the meteorological forcing time series, duly acknowledging and citing them where applicable. The authors extend their gratitude to all the researchers and contributing authors of these open-source datasets.
Kanneganti Bhargav Kumar received financial support through the Prime Minister Research Fellowship (grant no. 0200367) provided by the Ministry of Education, Government of India. Pankaj Dey received financial support through the DST INSPIRE Faculty Fellowship (faculty reg. no. IFA22-EAS114 and application reference no. DST/INSPIRE/04/2022/001952). Vijaykumar Bejagam received financial support through the Prime Minister Research Fellowship (grant no. PM-31-22-659-414) provided by the Ministry of Education, Government of India.
This paper was edited by Conrad Jackisch and reviewed by Ashish J. Manoj and Gemma Coxon.
Addor, N., Newman, A. J., Mizukami, N., and Clark, M. P.: The CAMELS data set: catchment attributes and meteorology for large-sample studies, Hydrol. Earth Syst. Sci., 21, 5293–5313, https://doi.org/10.5194/hess-21-5293-2017, 2017.
Almagro, A., Oliveira, P. T. S., Meira Neto, A. A., Roy, T., and Troch, P.: CABra: a novel large-sample dataset for Brazilian catchments, Hydrol. Earth Syst. Sci., 25, 3105–3135, https://doi.org/10.5194/hess-25-3105-2021, 2021.
Alvarez-Garreton, C., Mendoza, P. A., Boisier, J. P., Addor, N., Galleguillos, M., Zambrano-Bigiarini, M., Lara, A., Puelma, C., Cortes, G., Garreaud, R., McPhee, J., and Ayala, A.: The CAMELS-CL dataset: catchment attributes and meteorology for large sample studies – Chile dataset, Hydrol. Earth Syst. Sci., 22, 5817–5846, https://doi.org/10.5194/hess-22-5817-2018, 2018.
Alvarez-Garreton, C., Boisier, J. P., Garreaud, R., Seibert, J., and Vis, M.: Progressive water deficits during multiyear droughts in basins with long hydrological memory in Chile, Hydrol. Earth Syst. Sci., 25, 429–446, https://doi.org/10.5194/hess-25-429-2021, 2021.
Arsenault, R., Brissette, F., Martel, J.-L., Troin, M., Lévesque, G., Davidson-Chaput, J., Gonzalez, M. C., Ameli, A., and Poulin, A.: A comprehensive, multisource database for hydrometeorological modeling of 14 425 North American watersheds, Sci. Data, 7, 243, https://doi.org/10.1038/s41597-020-00583-2, 2020.
Ashrit, R., Indira Rani, S., Kumar, S., Karunasagar, S., Arulalan, T., Francis, T., Routray, A., Laskar, S. I., Mahmood, S., Jermey, P., Maycock, A., Renshaw, R., George, J. P., and Rajagopal, E. N.: IMDAA Regional Reanalysis: Performance Evaluation During Indian Summer Monsoon Season, J. Geophys. Res.-Atmos., 125, e2019JD030973, https://doi.org/10.1029/2019JD030973, 2020.
Beaudoing, H. and Rodell, M.: GLDAS Noah Land Surface Model L4 3 hourly 0.25 x 0.25 degree V2.0, Goddard Earth Sci. Data Inf. Serv. Cent. (GES DISC), Greenbelt, Maryland, USA [data set], https://doi.org/10.5067/342OHQM9AK6Q, 2019.
Beaudoing, H. and Rodell, M.: GLDAS Noah Land Surface Model L4 3 hourly 0.25 x 0.25 degree V2.1, Goddard Earth Sci. Data Inf. Serv. Cent. (GES DISC), Greenbelt, Maryland, USA [data set], https://doi.org/10.5067/E7TYRXPJKWOQ, 2020.
Beniston, M., Stoffel, M., Harding, R., Kernan, M., Ludwig, R., Moors, E., Samuels, P., and Tockner, K.: Obstacles to data access for research related to climate and water: Implications for science and EU policy-making, Environ. Sci. Policy, 17, 41–48, https://doi.org/10.1016/j.envsci.2011.12.002, 2012.
Chagas, V. B. P., Chaffe, P. L. B., Addor, N., Fan, F. M., Fleischmann, A. S., Paiva, R. C. D., and Siqueira, V. A.: CAMELS-BR: hydrometeorological time series and landscape attributes for 897 catchments in Brazil, Earth Syst. Sci. Data, 12, 2075–2096, https://doi.org/10.5194/essd-12-2075-2020, 2020.
Chouaib, W., Caldwell, P. V., and Alila, Y.: Regional variation of flow duration curves in the eastern United States: Process-based analyses of the interaction between climate and landscape properties, J. Hydrol., 559, 327–346, https://doi.org/10.1016/j.jhydrol.2018.01.037, 2018.
Coxon, G., Addor, N., Bloomfield, J. P., Freer, J., Fry, M., Hannaford, J., Howden, N. J. K., Lane, R., Lewis, M., Robinson, E. L., Wagener, T., and Woods, R.: CAMELS-GB: hydrometeorological time series and landscape attributes for 671 catchments in Great Britain, Earth Syst. Sci. Data, 12, 2459–2483, https://doi.org/10.5194/essd-12-2459-2020, 2020.
CWC: Hydrological Observation Stations in India under Central Water Commission, September 2021, Central Water Commission, 1–307 pp., 2021.
Das, S. and Jain, M. K.: Unravelling the future changes in rainfall erosivity over India under shared socio-economic pathways, CATENA, 232, 107417, https://doi.org/10.1016/j.catena.2023.107417, 2023.
Das, S., Jain, M. K., and Gupta, V.: A step towards mapping rainfall erosivity for India using high-resolution GPM satellite rainfall products, CATENA, 212, 106067, https://doi.org/10.1016/j.catena.2022.106067, 2022.
Das, S., Jain, M. K., and Gupta, V.: An assessment of anticipated future changes in water erosion dynamics under climate and land use change scenarios in South Asia, J. Hydrol., 637, 131341, https://doi.org/10.1016/j.jhydrol.2024.131341, 2024.
Dey, P. and Mujumdar, P. P.: On the uniformity of rainfall distribution over India, J. Hydrol., 578, 124017, https://doi.org/10.1016/j.jhydrol.2019.124017, 2019.
Dimitriadis, P., Koutsoyiannis, D., Iliopoulou, T., and Papanicolaou, P.: A Global-Scale Investigation of Stochastic Similarities in Marginal Distribution and Dependence Structure of Key Hydrological-Cycle Processes, Hydrology, 8, 59, https://doi.org/10.3390/hydrology8020059, 2021.
Efrat, M.: Caravan extension Israel – Israel dataset for large-sample hydrology, Zenodo [data set], https://doi.org/10.5281/zenodo.7758515, 2023.
Fan, Y., Li, H., and Miguez-Macho, G.: Global Patterns of Groundwater Table Depth, Science, 339, 940–943, https://doi.org/10.1126/science.1229881, 2013.
Fang, K., Kifer, D., Lawson, K., Feng, D., and Shen, C.: The Data Synergy Effects of Time-Series Deep Learning Models in Hydrology, Water Resour. Res., 58, e2021WR029583, https://doi.org/10.1029/2021WR029583, 2022.
FAO and IISA: Harmonized World Soil Database version 2.0, FAO, International Institute for Applied Systems Analysis (IIASA), https://doi.org/10.4060/cc3823en, 2023.
Farr, T. G., Rosen, P. A., Caro, E., Crippen, R., Duren, R., Hensley, S., Kobrick, M., Paller, M., Rodriguez, E., Roth, L., Seal, D., Shaffer, S., Shimada, J., Umland, J., Werner, M., Oskin, M., Burbank, D., and Alsdorf, D.: The Shuttle Radar Topography Mission, Rev. Geophys., 45, RG2004, https://doi.org/10.1029/2005RG000183, 2007.
Feng, D., Fang, K., and Shen, C.: Enhancing Streamflow Forecast and Extracting Insights Using Long-Short Term Memory Networks With Data Integration at Continental Scales, Water Resour. Res., 56, e2019WR026793, https://doi.org/10.1029/2019WR026793, 2020.
Feng, D., Beck, H., Lawson, K., and Shen, C.: The suitability of differentiable, physics-informed machine learning hydrologic models for ungauged regions and climate change impact assessment, Hydrol. Earth Syst. Sci., 27, 2357–2373, https://doi.org/10.5194/hess-27-2357-2023, 2023.
Feng, X., Porporato, A., and Rodriguez-Iturbe, I.: Changes in rainfall seasonality in the tropics, Nat. Clim. Chang., 3, 811–815, https://doi.org/10.1038/nclimate1907, 2013.
Feng, X., Thompson, S. E., Woods, R., and Porporato, A.: Quantifying Asynchronicity of Precipitation and Potential Evapotranspiration in Mediterranean Climates, Geophys. Res. Lett., 46, 14692–14701, https://doi.org/10.1029/2019GL085653, 2019.
Fischer, G., Nachtergaele, F., Prieler, S., van Velthuizen, H. T., Verelst, L., and Wiberg, D.: Global Agro-ecological Zones Assessment for Agriculture (GAEZ 2008), IIASA, Laxenburg, Austria and FAO, Rome, Italy, 2008.
Fowler, K. J. A., Acharya, S. C., Addor, N., Chou, C., and Peel, M. C.: CAMELS-AUS: hydrometeorological time series and landscape attributes for 222 catchments in Australia, Earth Syst. Sci. Data, 13, 3847–3867, https://doi.org/10.5194/essd-13-3847-2021, 2021.
Gautam, P. K., Chandra, S., and Henry, P. K.: Monitoring of the Groundwater Level using GRACE with GLDAS Satellite Data in Ganga Plain, India to Understand the Challenges of Groundwater, Depletion, Problems, and Strategies for Mitigation, Environ. Challenges, 15, 100874, https://doi.org/10.1016/j.envc.2024.100874, 2024.
Gleeson, T., Moosdorf, N., Hartmann, J., and van Beek, L. P. H.: A glimpse beneath earth's surface: GLobal HYdrogeology MaPS (GLHYMPS) of permeability and porosity, Geophys. Res. Lett., 41, 3891–3898, https://doi.org/10.1002/2014GL059856, 2014.
Gnann, S. J., Coxon, G., Woods, R. A., Howden, N. J. K., and McMillan, H. K.: TOSSH: A Toolbox for Streamflow Signatures in Hydrology, Environ. Model. Softw., 138, 104983, https://doi.org/10.1016/j.envsoft.2021.104983, 2021.
Goteti, G.: Geospatial dataset for hydrologic analyses in India (GHI): a quality-controlled dataset on river gauges, catchment boundaries and hydrometeorological time series, Earth Syst. Sci. Data, 15, 4389–4415, https://doi.org/10.5194/essd-15-4389-2023, 2023.
Gudmundsson, L., Do, H. X., Leonard, M., and Westra, S.: The Global Streamflow Indices and Metadata Archive (GSIM) – Part 2: Quality control, time-series indices and homogeneity assessment, Earth Syst. Sci. Data, 10, 787–804, https://doi.org/10.5194/essd-10-787-2018, 2018.
Hao, Z., Jin, J., Xia, R., Tian, S., Yang, W., Liu, Q., Zhu, M., Ma, T., Jing, C., and Zhang, Y.: CCAM: China Catchment Attributes and Meteorology dataset, Earth Syst. Sci. Data, 13, 5591–5616, https://doi.org/10.5194/essd-13-5591-2021, 2021.
Harrigan, S., Zsoter, E., Alfieri, L., Prudhomme, C., Salamon, P., Wetterhall, F., Barnard, C., Cloke, H., and Pappenberger, F.: GloFAS-ERA5 operational global river discharge reanalysis 1979–present, Earth Syst. Sci. Data, 12, 2043–2060, https://doi.org/10.5194/essd-12-2043-2020, 2020.
Hartmann, J. and Moosdorf, N.: The new global lithological map database GLiM: A representation of rock properties at the Earth surface, Geochem. Geophys. Geosyst., 13, 1–26, https://doi.org/10.1029/2012GC004370, 2012.
Hellwig, J., de Graaf, I. E. M., Weiler, M., and Stahl, K.: Large-Scale Assessment of Delayed Groundwater Responses to Drought, Water Resour. Res., 56, e2019WR025441, https://doi.org/10.1029/2019WR025441, 2020.
Hochreiter, S. and Schmidhuber, J.: Long Short-Term Memory, Neural Comput., 9, 1735–1780, https://doi.org/10.1162/neco.1997.9.8.1735, 1997.
Höge, M., Kauzlaric, M., Siber, R., Schönenberger, U., Horton, P., Schwanbeck, J., Floriancic, M. G., Viviroli, D., Wilhelm, S., Sikorska-Senoner, A. E., Addor, N., Brunner, M., Pool, S., Zappa, M., and Fenicia, F.: CAMELS-CH: hydro-meteorological time series and landscape attributes for 331 catchments in hydrologic Switzerland, Earth Syst. Sci. Data, 15, 5755–5784, https://doi.org/10.5194/essd-15-5755-2023, 2023.
India-WRIS: River Basin Atlas of India, RRSC-West, NRSC, ISRO, Jodhpur, India, 1–144 pp., 2012.
Jehn, F. U., Bestian, K., Breuer, L., Kraft, P., and Houska, T.: Using hydrological and climatic catchment clusters to explore drivers of catchment behavior, Hydrol. Earth Syst. Sci., 24, 1081–1100, https://doi.org/10.5194/hess-24-1081-2020, 2020.
Karra, K., Kontgis, C., Statman-Weil, Z., Mazzariello, J. C., Mathis, M., and Brumby, S. P.: Global land use / land cover with Sentinel 2 and deep learning, in: 2021 IEEE International Geoscience and Remote Sensing Symposium IGARSS, 4704–4707, https://doi.org/10.1109/IGARSS47720.2021.9553499, 2021.
Klingler, C., Schulz, K., and Herrnegger, M.: LamaH-CE: LArge-SaMple DAta for Hydrology and Environmental Sciences for Central Europe, Earth Syst. Sci. Data, 13, 4529–4565, https://doi.org/10.5194/essd-13-4529-2021, 2021.
Koch, J.: Caravan extension Denmark – Danish dataset for large-sample hydrology, Zenodo [data set], https://doi.org/10.5281/zenodo.6645861, 2022.
Kratzert, F., Klotz, D., Brenner, C., Schulz, K., and Herrnegger, M.: Rainfall–runoff modelling using Long Short-Term Memory (LSTM) networks, Hydrol. Earth Syst. Sci., 22, 6005–6022, https://doi.org/10.5194/hess-22-6005-2018, 2018.
Kratzert, F., Klotz, D., Herrnegger, M., Sampson, A. K., Hochreiter, S., and Nearing, G. S.: Toward Improved Predictions in Ungauged Basins: Exploiting the Power of Machine Learning, Water Resour. Res., 55, 11344–11354, https://doi.org/10.1029/2019WR026065, 2019.
Kratzert, F., Nearing, G., Addor, N., Erickson, T., Gauch, M., Gilon, O., Gudmundsson, L., Hassidim, A., Klotz, D., Nevo, S., Shalev, G., and Matias, Y.: Caravan - A global community dataset for large-sample hydrology, Sci. Data, 10, 61, https://doi.org/10.1038/s41597-023-01975-w, 2023.
Ladson, A. R., Brown, R., Neal, B., and Nathan, R.: A Standard Approach to Baseflow Separation Using The Lyne and Hollick Filter, Australas. J. Water Resour., 17, 25–34, https://doi.org/10.7158/13241583.2013.11465417, 2013.
Lees, T., Buechel, M., Anderson, B., Slater, L., Reece, S., Coxon, G., and Dadson, S. J.: Benchmarking data-driven rainfall–runoff models in Great Britain: a comparison of long short-term memory (LSTM)-based models with four lumped conceptual models, Hydrol. Earth Syst. Sci., 25, 5517–5534, https://doi.org/10.5194/hess-25-5517-2021, 2021.
Lehner, B. and Grill, G.: Global river hydrography and network routing: baseline data and new approaches to study the world's large river systems, Hydrol. Process., 27, 2171–2186, https://doi.org/10.1002/hyp.9740, 2013.
Lehner, B., Liermann, C. R., Revenga, C., Vörösmarty, C., Fekete, B., Crouzet, P., Döll, P., Endejan, M., Frenken, K., Magome, J., Nilsson, C., Robertson, J. C., Rödel, R., Sindorf, N., and Wisser, D.: High-resolution mapping of the world's reservoirs and dams for sustainable river-flow management, Front. Ecol. Environ., 9, 494–502, https://doi.org/10.1890/100125, 2011.
Li, B., Rodell, M., Kumar, S., Beaudoing, H. K., Getirana, A., Zaitchik, B. F., de Goncalves, L. G., Cossetin, C., Bhanja, S., Mukherjee, A., Tian, S., Tangdamrongsub, N., Long, D., Nanteza, J., Lee, J., Policelli, F., Goni, I. B., Daira, D., Bila, M., de Lannoy, G., Mocko, D., Steele-Dunne, S. C., Save, H., and Bettadpur, S.: Global GRACE Data Assimilation for Groundwater and Drought Monitoring: Advances and Challenges, Water Resour. Res., 55, 7564–7586, https://doi.org/10.1029/2018WR024618, 2019.
Lohani, A. K.: Surface Water Data Processing Using SWDES, National Institute of Hydrology, 2012.
Loritz, R., Dolich, A., Acuña Espinoza, E., Ebeling, P., Guse, B., Götte, J., Hassler, S. K., Hauffe, C., Heidbüchel, I., Kiesel, J., Mälicke, M., Müller-Thomy, H., Stölzle, M., and Tarasova, L.: CAMELS-DE: hydro-meteorological time series and attributes for 1582 catchments in Germany, Earth Syst. Sci. Data, 16, 5625–5642, https://doi.org/10.5194/essd-16-5625-2024, 2024.
Ma, K., Feng, D., Lawson, K., Tsai, W., Liang, C., Huang, X., Sharma, A., and Shen, C.: Transferring Hydrologic Data Across Continents – Leveraging Data-Rich Regions to Improve Hydrologic Prediction in Data-Sparse Regions, Water Resour. Res., 57, e2020WR028600, https://doi.org/10.1029/2020WR028600, 2021.
Mahto, S. S. and Mishra, V.: Does ERA-5 Outperform Other Reanalysis Products for Hydrologic Applications in India?, J. Geophys. Res. Atmos., 124, 9423–9441, https://doi.org/10.1029/2019JD031155, 2019.
Mangukiya, N. K. and Sharma, A.: Alternate pathway for regional flood frequency analysis in data-sparse region, J. Hydrol., 629, 130635, https://doi.org/10.1016/j.jhydrol.2024.130635, 2024.
Mangukiya, N. K., Sharma, A., and Shen, C.: How to enhance hydrological predictions in hydrologically distinct watersheds of the Indian subcontinent?, Hydrol. Process., 37, e14936, https://doi.org/10.1002/hyp.14936, 2023.
Mangukiya, N. K., Kanneganti, B. K., Dey, P., Sharma, S., Bejagam, V., Mujumdar, P. P., and Sharma, A.: CAMELS-IND: hydrometeorological time series and catchment attributes for 472 catchments in Peninsular India (v2.1), Zenodo [data set], https://doi.org/10.5281/zenodo.14005378, 2024.
Miralles, D. G., Holmes, T. R. H., De Jeu, R. A. M., Gash, J. H., Meesters, A. G. C. A., and Dolman, A. J.: Global land-surface evaporation estimated from satellite-based observations, Hydrol. Earth Syst. Sci., 15, 453–469, https://doi.org/10.5194/hess-15-453-2011, 2011.
Moudgil, P. S. and Rao, G. S.: Groundwater levels estimation from GRACE/GRACE-FO and hydro-meteorological data using deep learning in Ganga River basin, India, Environ. Earth Sci., 82, 441, https://doi.org/10.1007/s12665-023-11137-1, 2023.
Myneni, R., Knyazikhin, Y., and Park, T.: MCD15A2H MODIS/Terra+Aqua Leaf Area Index/FPAR 8-day L4 Global 500m SIN Grid V006, NASA EOSDIS L. Process. DAAC [data set], https://doi.org/10.5067/MODIS/MCD15A2H.006, 2015.
Nayak, H. P., Osuri, K. K., Sinha, P., Nadimpalli, R., Mohanty, U. C., Chen, F., Rajeevan, M., and Niyogi, D.: High-resolution gridded soil moisture and soil temperature datasets for the Indian monsoon region, Sci. Data, 5, 180264, https://doi.org/10.1038/sdata.2018.264, 2018.
Nearing, G., Cohen, D., Dube, V., Gauch, M., Gilon, O., Harrigan, S., Hassidim, A., Klotz, D., Kratzert, F., Metzger, A., Nevo, S., Pappenberger, F., Prudhomme, C., Shalev, G., Shenzis, S., Tekalign, T. Y., Weitzner, D., and Matias, Y.: Global prediction of extreme floods in ungauged watersheds, Nature, 627, 559–563, https://doi.org/10.1038/s41586-024-07145-1, 2024.
Newman, A. J., Clark, M. P., Sampson, K., Wood, A., Hay, L. E., Bock, A., Viger, R. J., Blodgett, D., Brekke, L., Arnold, J. R., Hopson, T., and Duan, Q.: Development of a large-sample watershed-scale hydrometeorological data set for the contiguous USA: data set characteristics and assessment of regional variability in hydrologic model performance, Hydrol. Earth Syst. Sci., 19, 209–223, https://doi.org/10.5194/hess-19-209-2015, 2015.
Pai, D., Rajeevan, M., Sreejith, O., Mukhopadhyay, B., and Satbha, N.: Development of a new high spatial resolution (0.25° × 0.25°) long period (1901–2010) daily gridded rainfall data set over India and its comparison with existing data sets over the region, MAUSAM, 65, 1–18, https://doi.org/10.54302/mausam.v65i1.851, 2014.
Pelletier, J. D., Broxton, P. D., Hazenberg, P., Zeng, X., Troch, P. A., Niu, G., Williams, Z., Brunke, M. A., and Gochis, D.: A gridded global data set of soil, intact regolith, and sedimentary deposit thicknesses for regional and global land surface modeling, J. Adv. Model. Earth Sy., 8, 41–65, https://doi.org/10.1002/2015MS000526, 2016.
Rai, A. K., Beg, Z., Singh, A., and Gaurav, K.: Estimating discharge of the Ganga River from satellite altimeter data, J. Hydrol., 603, 126860, https://doi.org/10.1016/j.jhydrol.2021.126860, 2021.
Rai, P. and Dimri, A. P.: Changes in rainfall seasonality pattern over India, Meteorol. Appl., 27, e1823, https://doi.org/10.1002/met.1823, 2020.
Rani, S. I., T, A., George, J. P., Rajagopal, E. N., Renshaw, R., Maycock, A., Barker, D. M., and Rajeevan, M.: IMDAA: High Resolution Satellite-era Reanalysis for the Indian Monsoon Region, J. Climate, 34, 5109–5133, https://doi.org/10.1175/JCLI-D-20-0412.1, 2021.
Rodell, M., Houser, P. R., Jambor, U., Gottschalck, J., Mitchell, K., Meng, C.-J., Arsenault, K., Cosgrove, B., Radakovich, J., Bosilovich, M., Entin, J. K., Walker, J. P., Lohmann, D., and Toll, D.: The Global Land Data Assimilation System, B. Am. Meteorol. Soc., 85, 381–394, https://doi.org/10.1175/BAMS-85-3-381, 2004.
Roy, P., Roy, A., Joshi, P., Kale, M., Srivastava, V., Srivastava, S., Dwevidi, R., Joshi, C., Behera, M., Meiyappan, P., Sharma, Y., Jain, A., Singh, J., Palchowdhuri, Y., Ramachandran, R., Pinjarla, B., Chakravarthi, V., Babu, N., Gowsalya, M., Thiruvengadam, P., Kotteeswaran, M., Priya, V., Yelishetty, K., Maithani, S., Talukdar, G., Mondal, I., Rajan, K., Narendra, P., Biswal, S., Chakraborty, A., Padalia, H., Chavan, M., Pardeshi, S., Chaudhari, S., Anand, A., Vyas, A., Reddy, M., Ramalingam, M., Manonmani, R., Behera, P., Das, P., Tripathi, P., Matin, S., Khan, M., Tripathi, O., Deka, J., Kumar, P., and Kushwaha, D.: Development of Decadal (1985–1995–2005) Land Use and Land Cover Database for India, Remote Sens., 7, 2401–2430, https://doi.org/10.3390/rs70302401, 2015.
Sankarasubramanian, A., Vogel, R. M., and Limbrunner, J. F.: Climate elasticity of streamflow in the United States, Water Resour. Res., 37, 1771–1781, https://doi.org/10.1029/2000WR900330, 2001.
Schaake, J., Cong, S., and Duan, Q.: US MOPEX data set (No. UCRL-JRNL-221228), Lawrence Livermore National Lab. (LLNL), Livermore, CA (United States), 2006.
Senent-Aparicio, J., Castellanos-Osorio, G., Segura-Méndez, F., López-Ballesteros, A., Jimeno-Sáez, P., and Pérez-Sánchez, J.: BULL Database – Spanish Basin attributes for Unravelling Learning in Large-sample hydrology, Sci. Data, 11, 737, https://doi.org/10.1038/s41597-024-03594-5, 2024.
Sharma, S. and Mujumdar, P. P.: Baseflow significantly contributes to river floods in Peninsular India, Sci. Rep., 14, 1–10, https://doi.org/10.1038/s41598-024-51850-w, 2024.
Simons, G., Koster, R., and Droogers, P.: HiHydroSoil v2.0 – A high resolution soil map of global hydraulic properties, Wageningen, the Netherlands, Future Water, 2020.
Singer, M. B., Asfaw, D. T., Rosolem, R., Cuthbert, M. O., Miralles, D. G., MacLeod, D., Quichimbo, E. A., and Michaelides, K.: Hourly potential evapotranspiration at 0.1° resolution for the global land surface from 1981–present, Sci. Data, 8, 224, https://doi.org/10.1038/s41597-021-01003-9, 2021.
Srivastava, A. K., Rajeevan, M., and Kshirsagar, S. R.: Development of a high resolution daily gridded temperature data set (1969–2005) for the Indian region, Atmos. Sci. Lett., 10, 249–254, https://doi.org/10.1002/asl.232, 2009.
Teutschbein, C.: CAMELS- SE: Long- term hydroclimatic observations (1961–2020) across 50 catchments in Sweden as a resource for modelling, education, and collaboration, Geosci. Data J., 11, 655–668, https://doi.org/10.1002/gdj3.239, 2024.
Trabucco, A. and Zomer, R. J.: Global Aridity Index and Potential Evapo-Transpiration (ET0) Climate Database v2. CGIAR Consortium for Spatial Information (CGIAR-CSI), CGIAR-CSI GeoPortal, https://cgiarcsi.community, last access: 18 November 2024). 2018.
Van Loon, A. F., Rangecroft, S., Coxon, G., Werner, M., Wanders, N., Di Baldassarre, G., Tijdeman, E., Bosman, M., Gleeson, T., Nauditt, A., Aghakouchak, A., Breña-Naranjo, J. A., Cenobio-Cruz, O., Costa, A. C., Fendekova, M., Jewitt, G., Kingston, D. G., Loft, J., Mager, S. M., Mallakpour, I., Masih, I., Maureira-Cortés, H., Toth, E., Van Oel, P., Van Ogtrop, F., Verbist, K., Vidal, J.-P., Wen, L., Yu, M., Yuan, X., Zhang, M., and Van Lanen, H. A. J.: Streamflow droughts aggravated by human activities despite management, Environ. Res. Lett., 17, 044059, https://doi.org/10.1088/1748-9326/ac5def, 2022.
Verma, K., Nair, A. S., Jayaluxmi, I., Karmakar, S., and Calmant, S.: Satellite altimetry for Indian reservoirs, Water Sci. Eng., 14, 277–285, https://doi.org/10.1016/j.wse.2021.09.001, 2021.
WorldPop and CIESIN: Global High Resolution Population Denominators Project – Funded by The Bill and Melinda Gates Foundation (OPP1134076), WorldPop (http://www.worldpop.org, last access: 18 November 2024 – School of Geography and Environmental Science, University of Southampton; Department of Geography and Geosciences, University of Louisville; Departement de Geographie, Universite de Namur) and Center for International Earth Sc., https://doi.org/10.5258/SOTON/WP00674, 2018.
Yokoo, Y. and Sivapalan, M.: Towards reconstruction of the flow duration curve: development of a conceptual framework with a physical basis, Hydrol. Earth Syst. Sci., 15, 2805–2819, https://doi.org/10.5194/hess-15-2805-2011, 2011.
Zhang, S., Zhou, L., Zhang, L., Yang, Y., Wei, Z., Zhou, S., Yang, D., Yang, X., Wu, X., Zhang, Y., Li, X., and Dai, Y.: Reconciling disagreement on global river flood changes in a warming climate, Nat. Clim. Chang., 12, 1160–1167, https://doi.org/10.1038/s41558-022-01539-7, 2022.
- Abstract
- Introduction
- Motivation and rationale
- Catchments and hydrological time series
- Meteorological forcings
- Catchment attributes
- Regionally trained LSTM-based hydrological model for streamflow prediction
- Preliminary assessment of dataset quality and uncertainty
- Possible future extensions
- Data availability
- Concluding remarks
- Appendix A
- Author contributions
- Competing interests
- Disclaimer
- Acknowledgements
- Financial support
- Review statement
- References