the Creative Commons Attribution 4.0 License.
the Creative Commons Attribution 4.0 License.
A dataset for lake level changes in the Tibetan Plateau from 2002 and 2010 to 2021 using multi-altimeter data
Jiaming Chen
Shanmu Ma
Yanhan Lou
Guozhuang Shen
Lianchong Zhang
Yanhong Wu
The Tibetan Plateau (TP), known as the Roof of the World and the Water Tower of Asia, has the largest number of lakes in the world, and, because of its high altitude and the near absence of disturbances by human activity, the plateau has long been an important site for studying global climate change. Hydrological stations cannot be readily set up in this region, and in situ gauge data are not always publicly accessible. Satellite radar altimetry has become a very important alternative to in situ observations as a source of data. Estimation of the water levels of lakes via radar altimetry is often limited by temporal and spatial coverage, and, therefore, multi-altimeter data are often used to monitor lake levels. Restricted by the accuracy of waveform processing and the interval period between different altimetry missions, the accuracy and the sampling frequency of the water level series are typically low. By processing and merging data from eight different altimetry missions (Envisat, ICESat-1, CryoSat-2, Jason-1, Jason-2, Jason-3, SARAL, and Sentinel-3A), the developed datasets provided the water level changes for 361 lakes (larger than 10 km2) on the TP from 2002 to 2021 (181 lakes for the time series from 2002 to 2021 and 180 lakes for the time series from 2010 to 2021). The lake level change series shows good consistency with in situ measurements, demonstrating a median root-mean-square error (RMSE) of 0.19 m across eight validation gauges. The dataset further exhibits robust agreement with established satellite altimetry products (DAHITI, Hydroweb, and G-REALM), with median RMSE values below 0.30 m in all cross-validation comparisons. The present datasets and associated approaches are valuable for calculating the changes in lake storage, trend analyses of the lake levels, short-term monitoring of the overflow of lakes and flooding disasters on the plateau, and the relationships between changes in the lake ecosystems and changes in the water resources. Data described in this article can be accessed at PANGAEA under https://doi.org/10.1594/PANGAEA.973443 (Chen et al., 2024).
- Article
(7740 KB) - Full-text XML
-
Supplement
(503 KB) - BibTeX
- EndNote
As primary water reservoirs, lakes not only play an important role in the supply and adjustment of surface water but also reflect the impact of climate change and human activities on regional and global environmental change (Adrian et al., 2009; Schindler, 2009; Song et al., 2015; Chen and Liao, 2020). The water level of lakes is a key indicator of regional climate change and human disturbance. Generally, it is assumed that the changes in lake bottoms are very slight over decades, and so understanding the changes in lake levels can help to evaluate the impact of climate change and human activities on regional water resources.
Observation by use of a water gauge is the traditional method to measure the changes in water levels in lakes; in situ gauge measurement of lakes can afford high precision, but such equipment is expensive to maintain and challenging to operate in remote areas. Furthermore, the total number of monitoring stations has decreased in recent years (Frappart et al., 2006; Kleinherenbrink et al., 2014), and lake level data in many countries and regions are not freely available to the public. Alternatively, satellite altimetry technology is an effective tool that can be used to measure the dynamics of the surface elevation of the Earth and has been successful in measuring lake levels. The Tibetan Plateau (TP), known as the Roof of the World and the Water Tower of Asia, has numerous and some of the largest natural lakes in the world, and, because of its high altitude and the near absence of human disturbances, the plateau is an important location for studying global change. Changes in the water level in lakes are one of the important indicators of the water balance of the TP, and these are directly affected by temperature, precipitation, evaporation, glaciers, perennial snow cover, and permafrost (Zhang et al., 2012, 2013a, b). The TP is the source of many major rivers, and more than 1.4 billion people depend on water resources from the plateau (Pritchard, 2017). However, due to the vastness and remoteness, it is a challenge to set up in situ monitoring stations. There are only a few lakes (such as Qinghai Lake, Namtso, and Yamdrok Yumtso) with in situ gauge stations for lake level measurements (Zhang, 2018). Most lakes on the TP lack such a measurement capability, making it difficult to understand the long-term spatial and temporal characteristics regarding the evolution and dynamics of the water levels of the lakes.
Satellite altimetry has become the most important means to measure lake levels and their changes on the plateau. Numerous studies have focused on the use of satellite altimeters for measuring changes in lake levels on the TP. For example, Gao et al. (2013) employed multi-altimeter data from Envisat, CryoSat-2, Jason-1, and Jason-2 to examine water level changes at 51 lakes between 2002 and 2012 on the TP. Zhang et al. (2011) used Ice, Cloud, and the land Elevation Satellite (ICESat) data to determine changes in lake levels in Tibet from 2003 to 2009. Hwang et al. (2016) obtained 2 decades of lake level measurements at 23 lakes on the TP from the Topex/Poseidon (T/P)-family altimeters. Song et al. (2015) combined ICESat-1 and CryoSat-2 altimetry data to access the water level dynamics of Tibetan lakes from 2003 to 2014. Kleinherenbrink et al. (2015) and Jiang et al. (2017) used the CryoSat-2 data to measure changes in the water levels at, respectively, 125 lakes and 70 lakes on the TP. Hwang et al. (2019) constructed a lake level time series for 61 lakes on the TP between 2003 and 2016 and discussed the trends of the time series. Li et al. (2019) constructed high-temporal-resolution water level datasets for 52 large lakes on the TP. These studies on the TP reveal that estimation of the lake levels with a given radar altimeter is often limited by temporal and spatial coverage, and, therefore, multiple altimeters are needed to obtain multiple decades of changes in the water levels of lakes. Although some websites also provide open-access lake level data on the TP, the number of lakes is limited; e.g. Hydroweb has only 46 lakes, G-REALM has only 8 lakes, and DAHITI has only 62 lakes on the TP (Crétaux et al., 2011; Schwatke et al., 2015). However, due to the large size of the radar altimeter footprint and contaminations from the steep lakeshore or surrounding land, the observations of lake levels via satellites are noisy, and it is difficult to obtain the distance from the altimeter to the nadir points. Therefore, waveform retracking processing may be used to remove the contamination by land signals when lake levels are retrieved from multi-altimeter data. In this study, by combining eight sets of altimeter data from Envisat, ICESat-1, CryoSat-2, Jason-1, Jason-2, Jason-3, SARAL, and Sentinel-3A, the trends of the changes in the water levels for 361 lakes (>10 km2) on the TP during 2002–2021 were estimated using retracking and outlier detection algorithms.
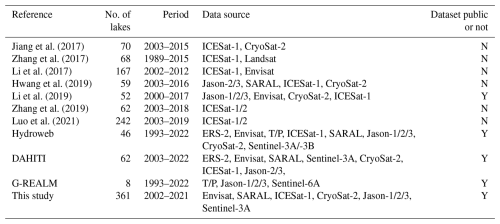
The primary objective of this study was to determine the changes in the water levels of 361 lakes on the TP using multi-altimeters and to evaluate the accuracy of the time series and the performance of the multi-altimeter data with respect to monitoring the long-term variations in the water levels of the lakes. Readers can access the dataset described in this paper at https://doi.org/10.1594/PANGAEA.973443 (Chen et al., 2024), and a comparison of our study with related previous studies is shown in Table 1.
2.1 Study area
The TP is in the southwest of China and covers about 27 % of the total area of China (Zhang et al., 2002), and its location and details are shown in Fig. 1. There are more than 1000 lakes of >1 km2 (Wan et al., 2016) on the TP, most of which belong to inland drainage systems. Based on coverage by altimeter data, 361 lakes of >10 km2 on the TP were selected as the objects of study. Among these lakes, there were 13 lakes of >500 km2, 79 lakes of 100–500 km2, 69 lakes of 50–100 km2, and 200 lakes of 10–50 km2. Most of these lakes are inland lakes with surface runoff, precipitation, snowmelt and ice melt, springs, and underground runoff as their main sources of water recharge. Due to minimal impact by human activity, changes in the water levels in the lakes in the region are driven mainly by natural factors such as precipitation and temperature, which are important indicators of changes in the regional climate and the ecological environment.
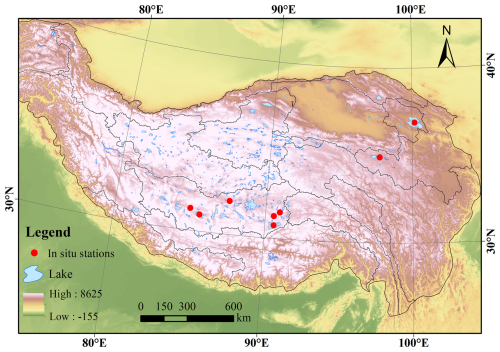
Figure 1Location and distribution of lakes on the TP. The digital elevation model (DEM) of the base map is from the Global Multi-resolution Terrain Elevation Data 2010 (GMTED2010) (GMTED: https://topotools.cr.usgs.gov/gtmed_viewer/, last access: 1 June 2023).
2.2 Data
2.2.1 Multi-altimeter data
Eight sets of altimeter data from Envisat, ICESat-1, CryoSat-2, Jason-1, Jason-2, Jason-3, SARAL, and Sentinel-3A were used to extract the water levels of the lakes on the TP to obtain the lake level time series with high spatial coverage. The details of the multi-altimeter data are given in Table 2. Envisat, CryoSat-2, and Sentinel-3A data provided by the European Space Agency (ESA) were available for 121, 352, and 106 lakes, respectively. Jason-1, Jason-2, and Jason-3 data provided by the Centre National d'Etudes Spatiales (CNES) and the National Aeronautics and Space Administration (NASA) were available for 48, 71, and 28 lakes, respectively, due to the relatively sparse ground tracks. Note that Jason-1 and Jason-2 experience interlaced orbit (Jason-2 from October 2016 to June 2017 and Jason-1 after February 2009), which increases the spatial coverage of Jason-1 and Jason-2. ICESat-1 data provided by NASA were available for 124 lakes. SARAL is a joint mission of the Indian Space Research Organization (ISRO) and CNES and is a continuation of the Envisat mission. SARAL (Steunou et al., 2015) data were available for 135 lakes on the TP. ICESat-1 is a lidar altimeter, distinct from the above radar altimeters. Its technique provides a high spatial resolution and small footprint but results in fewer measurements over time due to its 91 d orbit repeat period and frequent data gaps caused by cloud obstruction.
Table 2Details of the multi-altimeter data used in this study.
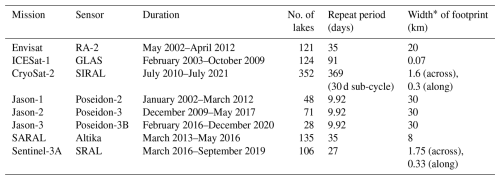
* The footprint for SAR/synthetic aperture radar interferometry (SARin) can be approximated by a rectangle given with the footprint width in the across-track and along-track direction.
In addition, a dataset on the shapes of the lakes generated by Wan et al. (2016) was selected to determine whether the altimeter data encompassed the lakes, and a buffer of 1 km around the shape of the lake was generated to determine the change in the boundary of the lakes during the past 20 years.
2.2.2 In situ data
In situ data on eight lakes were used to validate reliable information on the lake level time series from the multi-altimeter data. Table 3 lists the details of the in situ data on the eight lakes. The in situ data for Qinghai Lake and Ngoring Lake were from the Hydrology and Water Resources Survey Bureau in Qinghai Province and from the Yellow River Commission of the Ministry of Water Resources, respectively, and the in situ data on Bamco, Dagzeco, Dawaco, Namco, Pungco, and Zhari Namco were from the Institute of Tibetan Plateau Research, Chinese Academy of Sciences (Lei, 2018; Wang, 2018).
Table 3Details of the in situ data for eight lakes as used for validation.
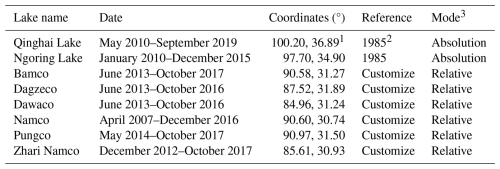
1 The first figure is longitude, the second figure is latitude; 2 1985 indicates the 1985 national height datum of China; 3 absolute mode is the elevation relative to the geoid, and relative mode is the elevation relative to the average value (set to 0) of the in situ data.
3.1 Extraction of lake water levels
With respect to the extraction of the water level data from the satellite altimetry, there is uncertainty as to whether there is a valid footprint falling on the lakes; this problem can be addressed by comparing the geographic coordinates of the footprints with the shape of the dynamic dataset for the lake. However, it would take considerable time to extract the dynamic shape file. A static shape dataset for the TP was used in this study (Wan et al., 2016); we also generated a 1 km buffer for the shape to resolve the situation regarding the changes in the boundary of lakes during the last 20 years. After picking out the available footprints, the lake surface height can be calculated using Eq. (1) for each footprint:
where Alt is the satellite altitude; Rrange is the distance between the altimeter and the lake surface; ΔRdry is the dry troposphere; ΔRwet is the wet troposphere; ΔRiono is the ionospheric correction; ΔRtide includes the solid-earth tide and the pole tide; Ngeoid is the geoid height with respect to the ellipsoid, for which the 2008 Earth Gravitational Model (EGM2008) was used in this study (Pavlis et al., 2012); and ΔRcorrection stands for the retracking value ΔRretrack for radar altimetry and the saturation correction ΔRsaturation for the laser altimetry. With the exception for ΔRretrack, all of the corrections above are included in the altimetry data product.
3.1.1 Waveform retracking
The accurate measurement of the distance from the altimeter to the nadir points in inland waterbodies presents a significant challenge due to the interference of adjacent land area signals with signals from waterbodies. Consequently, the implementation of retracking is of great importance in mitigating the influence of land signals when utilizing radar altimetry data for inland waterbody studies (Martin et al., 1983; Lee et al., 2008). In this study, we employed the automatic multiscale-based peak detection retracker (AMPDR) (Chen et al., 2021). The Jason-2 and Jason-3, Sentinel-3A and B, and CryoSat-2 satellites are all suitable for providing precise measurements, with average accuracies of, respectively, 0.18, 0.14, and 0.15 m when compared to gauges. However, sometimes, there were biases for the retracking caused by the hooking effect or the scatter signal of the off-nadir point for Jason-1, Envisat, and SARAL. Therefore, some modifications to the AMPDR were adopted for Jason-1, Envisat, and SARAL data in this study.
To ensure that the different typologies of multiple waveforms can be dealt with, we implemented a two-step process for the modified AMPDR here. The steps of the modified retracker are illustrated in Fig. 2. The optimal retracked range was determined using several criteria:
-
The optimal retracked levels should be within the range of the digital-elevation-model (DEM)-based reference elevation of HDEM±20 m.
-
For periods with continuous data (where the gap between cycles is less than 10 d), the DistanceThresh in AMPDR was adjusted to minimize the median difference in water levels derived from neighbouring cycles.
-
For non-continuous data (where the gap between cycles exceeds 10 d or several months), error filtering was applied to reduce the standard deviation of water levels in the current cycle, helping to minimize variability over time.
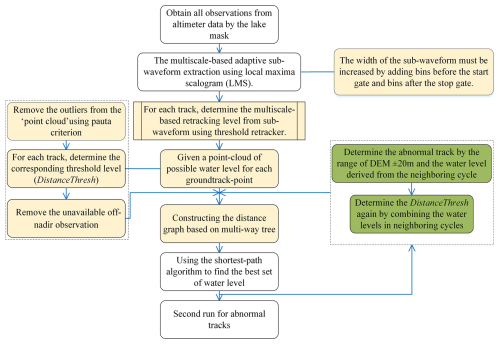
Figure 2Flowchart outlining the waveform retracking process. Steps with a yellow background are the preparation steps for using the shortest-path algorithm. Steps with a green background are the retracking for the abnormal track by the selected DEM.
In the initial run, the standard AMPDR retracker was applied to calculate the lake level time series, with further details on the AMPDR's definition and implementation provided in Chen et al. (2021).
Following this, a second run of the AMPDR was performed to retrack abnormal tracks identified by checking if the current cycle's water level fell within the range of the digital elevation model (DEM) at ±20 m and by comparing it with water levels from neighbouring cycles, particularly when a significant discrepancy or abrupt change was detected in the current cycles. In this second run, the DistanceThresh parameter in the AMPDR was defined using one of the three smallest second-order difference quotients of the cumulative distribution function (CDF) of the rounded water levels (the smallest value was used in the initial run). This approach ensured that the DistanceThresh aligned with the median of the neighbouring cycle water levels.
Additionally, a retracking point from the Offset Center of Gravity (OCOG) algorithm was incorporated into the AMPDR to assist in constructing the “point cloud” and the CDF. This integration addresses specific cases where the AMPDR's adaptive thresholding may encounter challenges. An example of the modified two-step retracker in operation is illustrated in Fig. 3.
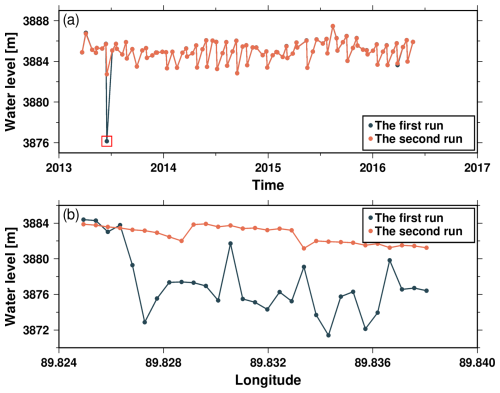
Figure 3An example of the operation of the modified two-step retracker in Ayakkum Lake using SARAL measurement. Panel (a) shows the two water level time series for processing by the two-step retracker. Panel (b) shows the along-track water level in the red rectangle from (a) when processing using the two-step retracker.
3.1.2 Waveform selection
By selecting observations within a 1 km buffer around the lake boundary, we capture additional data points. However, this approach can also introduce uncertainty as some observations may contain noisy waveforms that complicate the retracking process. Such noise may result from signals reflected off of surrounding terrain or from off-nadir observations. To ensure accuracy in constructing the lake level time series, noisy observations should be removed before constructing the lake level time series. Waveform classification is an effective method for identifying highly noisy waveforms that are challenging to process accurately. Waveform classification has proven to be effective in identifying these noisy signals, and various methods have achieved strong results (Göttl et al., 2016; Lee et al., 2016; Marshall and Deng, 2016; Shen et al., 2017).
Differently from the previous study that classifies waveforms into multiple categories, this study focuses on separating waveforms into noise and non-noise categories using a random forest (RF) classifier. The RF classifier was trained on a dataset of approximately 300 waveforms per altimeter, using observations over inland lakes. The key features for the classification included the pulse peakiness (Strawbridge and Laxon, 1994), the mean value of the waveform, the skewness of the waveform, the kurtosis of the waveform, the amplitude of the waveform, the width of the waveform as determined by the Offset Center of Gravity (OCOG) retracker (Bamber, 1994), the bin position corresponding to the centre of gravity determined by the OCOG retracker, and the peakiness of the left and right pulse (Ricker et al., 2014). After removing noisy observations, tracks containing fewer than five quality-controlled observations (post filtering via DEM-based elevation thresholds and waveform classification criteria) were excluded to ensure statistical reliability.
3.1.3 Construction of time series
Despite removing the noise footprints through waveform classification, outliers remain in the lake level time series for each cycle of certain altimeters. To address this, any point in each cycle with a difference exceeding 3 times the standard deviation (3σ rule) was removed. Then, the lake level time series was estimated using the R package tsHydro (https://github.com/cavios/tshydro (last access: 1 June 2022). The core of tsHydro is a state space model consisting of a process model and an observation model, providing a robust time series for altimeter observations.
The process model is used to describe the relationship between the true water level H(true), and the observation model is described by the observed water level H(obs), with an error term εij, used to describe the relationship between H(obs) and H(true). ti is the time of the ith time step, j is the number of observations in given time, and zi is a random noise term following a standard normal distribution. The scaling parameter σRW is defined as the standard deviation of the random walk in a time step. The model is described in detail by Nielsen et al. (2015). The predictions of the true heights denote the estimate of the water level of the lake for each cycle. Meanwhile, the standard deviation of each cycle was reserved to evaluate the uncertainty of the time series.
3.2 Fusion of multi-altimeter time series
It is not uncommon that the geoid between different altimeters should be different. Before merging the lake level from different altimeters, the geoid should be unified as WGS84/EGM 2008. The reference system of Jason-1, Jason-2, and Jason-3 is the Topex/Poseidon (T/P) ellipsoid system instead of the WGS84 system; thus, it was necessary to perform an ellipsoid system transformation from T/P to WGS84 by subtracting 0.71 m from the vertical height (Bhang et al., 2007).
Due to the variations in orbits and the disparities between instruments, systematic biases existed among the lake level time series extracted from the multi-altimetry, although they were corrected to the same reference system. In most studies (Li et al., 2019; Gao et al., 2013; Hwang et al., 2016), the altimeters with the longest overlap period would be merged for the first time, but there may be some special situations whereby, for some lakes, the lake level time series for each altimeter cannot be merged. In this study, the dynamic reference time series was used to merge the lake level time series. We first merged the two products with the longest period for the time series and chose the altimeter-derived water level with the longer time series as the baseline. Then systematic biases between another altimeter and the baseline were removed by subtracting the mean discrepancy during the overlap period compared with the reference series (Lee et at., 2011; Kropáček et al., 2012) according to Eq. (4). To ensure consistency, we only merged time series when the average difference between the reference series () and the current satellite series () was less than 10 m. Then the same process was applied to the remaining products and the merged products connecting the three altimeters. The result for the merged altimetry data when all sensors are available is shown in Fig. 4a and b.
In the above, Series2ini(ti) is the uncorrected lake level at time ti, is the mean value of the water level time series from the baseline, and is the mean value of the other water level time series at the same time as .
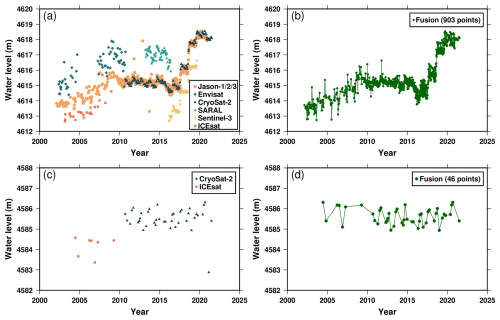
Figure 4The process of merging multi-altimetry data. (a) The water level data from eight altimeters in Zhari Namco. (b) The fusion water level data in Zhari Namco. (c) The water level data from two altimeters in Cuona Lake. (d) The fusion water level data in Cuona Lake.
Nevertheless, not all of the lake level time series can be merged successfully following the steps outlined above. For instance, Cuona Lake, Xiasa'er Co, and Bei Hulsan Lake cannot be merged successfully because only ICESat and CryoSat-2 were available for these lakes before 2013, while there is no overlap period between ICESat and CryoSat-2. In this study, 18 lakes were found to have similar problems.
A combined linear–periodic–residual model (Liao et al., 2014) was used to simulate and forecast the lake level time series in the no-overlap period to merge the two altimeters with no overlap period. Numerous studies (Medina et al., 2008; Irvine and Eberhardt, 1992; Kropáček et al., 2012; Lee et al., 2011) have indicated that the changes in the lake level exhibited a clear linear trend and inter-periodic fluctuations at some scales, such as 10 or 20 years, in line with Eq. (5):
where a and b are the linear components of the lake level time series, Ti indicates the ith periodic component, and εt is the remaining random component after removal of the linear and periodic components.
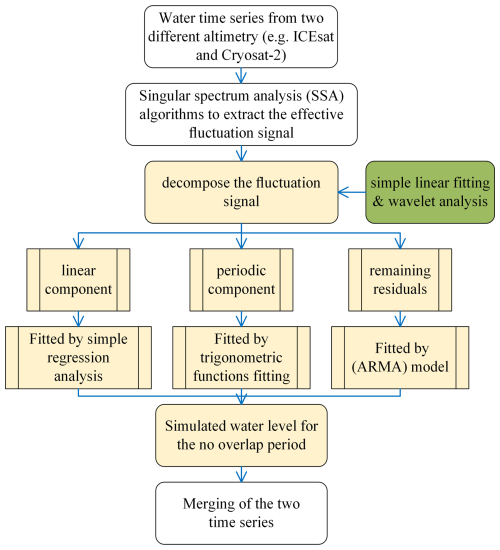
A result for the merged altimetry data of Cuona Lake is presented in Fig. 4c and d. First, singular spectrum analysis (SSA) algorithms are used to reduce the noise of the lake level time series and to extract the effective fluctuating signal. Second, we decomposed the fluctuating signal into a linear component, a periodic component, and remaining residuals using a simple linear fitting and wavelet analysis; simple regression analysis, trigonometric function fitting, and the autoregressive-moving-average (ARMA) model, respectively, were used to fit each component. Finally, we combined the modelling data of each component and obtained the simulated water level. The diagram for fusion processing is shown in Fig. 5.
3.3 Lake level annual change rate
The trends of lake level change can be estimated from the dataset. The periodic changes in the water level were simplified as 1-year and half-year periodic changes according to the following expression for the lake level change:
where t is the time relative to the mean time; v is the residual; a is a constant; b is the trend; and c, d, e, and f are the coefficients of the periodic terms for 1-year and half-year cycles. All of the above parameters were determined by the least-squares method.
4.1 Validation and accuracy of lake level time series
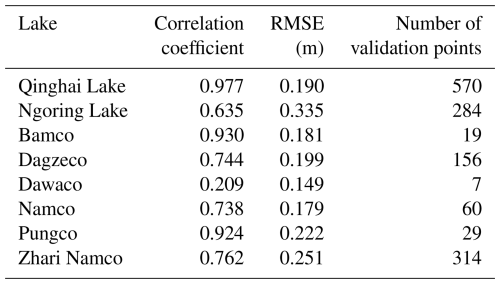
Due to the lack of in situ data for the water levels of lakes on the TP, only in situ data for eight lakes were collected to validate the accuracy of the lake level time series, and the datums of these in situ data were unknown, and so the comparison of the water level anomaly between in situ data and lake level in this study was performed by removing the mean value over the validation period. Figure 6 shows the comparison of the water level anomaly between in situ data and lake level as extracted from altimetry data. It can be seen that there is good consistency between in situ data and the lake level extracted from altimetry data. Table 4 gives the statistical results for a comparison between the lake level time series and the in situ data for the eight lakes. The results show that the accuracy for all eight lakes was less than 0.35 m, and the average accuracy was 0.213 m. Dawaco had the lowest root-mean-square errors (RMSEs) (0.149 m), and Ngoring Lake had the highest RMSEs (0.335 m), indicating that the results of this study are reliable and that the accuracy of the time series can reach the decimetre level with respect to the monitoring inland lakes. At the same time, except for Dawaco, the lake levels obtained in this study agreed well with those from the in situ gauges, showing a good correlation (correlation coefficients of>0.60). Furthermore, it can be seen from the comparison between the satellite-derived lake levels and the in situ water levels for the eight lakes that the satellite-derived lake level series followed the gauged data quite well, especially for Qinghai Lake, Bamco, and Pungco (correlation coefficients of>0.90).
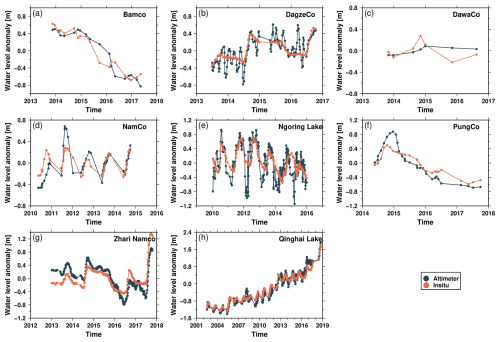
Figure 6Comparison of the water level anomaly between in situ data and lake level as extracted from altimetry data.
4.2 Cross-validation with similar products
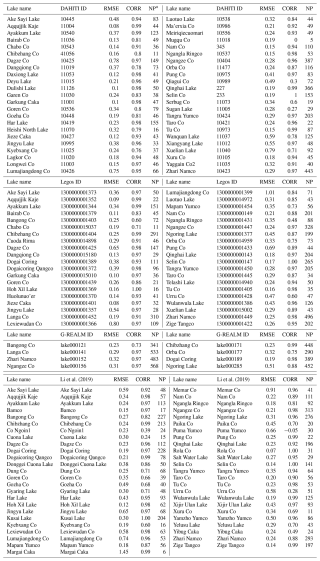
We made a comparison of our product with three different lake level datasets provided by DAHITI, LEGOS Hydroweb, G-REALM (Global Reservoirs and Lakes Monitor), and Li et al. (2019). In Fig. 7 and Appendix A, we compared the time series of water levels for 46 lakes from DAHITI, 40 lakes from LEGOS Hydroweb, 8 lakes from G-REALM, and 49 lakes from Li et al. (2019) against the lake levels from our study. The results indicate that the dataset in our study aligns consistently with the other three datasets. The median RMSEs are consistently below 0.30 m (with a value of 0.24 m for DAHITI, a value of 0.27 m for LEGOS Hydroweb, a value of 0.30 m for G-REALM, and a value of 0.26 m for Li et al. (2019)), while the median correlation values consistently exceed 0.90 (with a value of 0.94 for DAHITI, a value of 0.96 for LEGOS Hydroweb, a value of 0.96 for G-REALM, and a value of 0.95 for Li et al. (2019)).
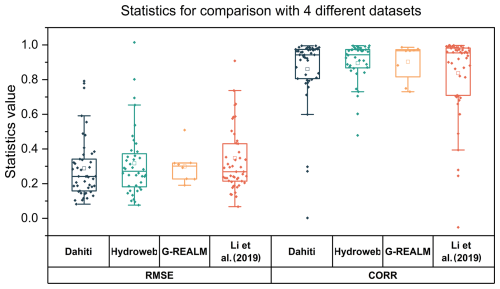
Figure 7Cross-validation of the lake levels on the TP derived from the present study with those provided by DAHITI, LEGOS Hydroweb, G-REALM, and Li et al. (2019).
It should be noticed that occasional discrepancies in the statistics may arise from variations in the processing chain for different datasets. For example, Xuelian Lake exhibits an RMSE of 0.79 m when compared to data from DAHITI, whereas it demonstrates a markedly reduced RMSE of 0.29 m when compared to LEGOS Hydroweb. Moreover, observations for Zhari Namco across all four datasets reveal that our study's results are consistently close to those of other studies, showing an RMSE of approximately 0.30 m.
4.3 Potential source of error
A potential source of error in our dataset arises when the tracking window captures signals from nearby waterbodies, such as other lakes or rivers, rather than the intended target lake. While the tracking window typically provides a valid waveform, the recorded signal may correspond to an unintended waterbody, leading to inaccuracies in lake level measurements. To mitigate this, we apply DEM-based height selection criteria, which filter lake level data to those within a defined range (e.g. HDEM±20 m). However, this approach is not fully correct, especially in regions where neighbouring waterbodies are within similar elevation ranges. Such cases could introduce inconsistencies into the time series for certain lakes, particularly where OLTC (Open-Loop Tracking Command) DEM values have changed over time, affecting the tracking window's focus. Future improvements in the tracking algorithm and additional validation steps could help reduce these potential errors. Additionally, ice and snow cover introduce significant uncertainties into radar altimeter measurements. During frozen periods, radar pulses may penetrate snow and/or ice layers, measuring subsurface features rather than the true water surface (Guerreiro et al., 2017). Ice formation alters surface reflectivity, causing peak retracking misidentification (e.g. false peaks from ice–water interfaces; Chen et al., 2021, Song et al., 2020).
4.4 Description of the dataset
The lake level change time series for 361 lakes (181 lakes for the time series from 2002 to 2021 and 180 lakes for the time series from 2010 to 2021) are available in the datasets. The water level time series for each lake are archived as 361 entities based on the names of the lakes, with a table describing all of the information about each lake. The first part of each file describes the basic information of the lake level time series, such as the geographic information, the start date of the time series, the end date of the time series, and the number of data points. Next is the main part for each file: the first row stands for the time, the second row records the water level, the third row is the uncertainty of the water level, and the final row stands for the source of the data. It should be noted that the uncertainty of the water level time series was calculated using the standard deviation for the processing in constructing the time series with the R package.
The spatio-temporal changes in lake levels across the TP can be analysed using this dataset. In summary, water level changes were monitored for a total of 181 lakes from 2002 to 2021, while the remaining 180 lakes were monitored from 2010 to 2021. Overall, lake water levels exhibited a clear upward trend from 2002 to 2021, with a weighted average annual change rate of 0.179 m yr−1 (Table 5), but only 290 lakes showed a significant trend at the level of 0.05 (p<0.05). The other 71 lakes were not significant (see Table S1 in the Supplement). Approximately 80 % of the lakes showed rising water levels (232 lakes reached p<0.05). The total area of lakes with increasing water levels (32 892 km2) significantly exceeds that of lakes with decreasing levels (5151 km2) (58 lakes reached p<0.05), indicating a steady increase in water reserves across lakes on the TP.
Table 5The trends in the changes in the water levels of the lakes in the different basins of the TP during 2002–2021 and 2010–2021 (p<0.05).
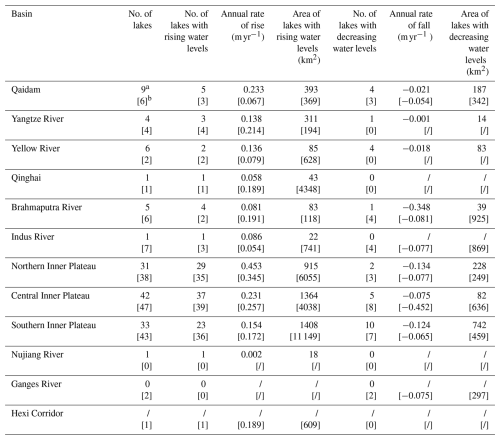
a The trends in the changes in the water levels of the lakes during 2002–2021 are shown inside square brackets. b The trends in the changes in the water levels of the lakes during 2010–2021 are shown without square brackets.
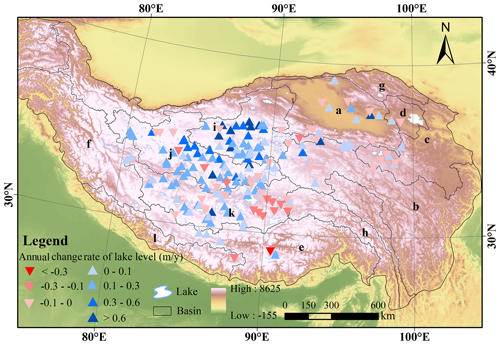
Figure 8Spatial distribution of trends in the changes in the water levels of lakes on the TP during 2010–2021. The black line shows the boundary of the basin of the TP (refer to Wan et al., 2016). The lowercase letters indicate different basins. The DEM of the base map is from the Global Multi-resolution Terrain Elevation Data 2010 (GMTED2010) (GMTED: https://topotools.cr.usgs.gov/gtmed_viewer/, last access: 1 June 2022) (a – Qaidam; b – Yangtze River; c – Yellow River; d – Qinghai Lake; e – Brahmaputra River; f – Indus River; g – Hexi Corridor; h – Nu Jiang River; i – Northern Inner Plateau; j – Central Inner Plateau; k – Southern Inner Plateau; l – Ganges River).
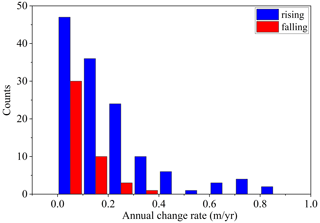
Based on the changes in the water levels of the lakes, the spatial patterns for the trends in the lake levels during 2010–2021 are shown in Fig. 8. Overall, the lake levels on the TP showed a clear rising trend, and the overall average annual rate of change, weighted by lake size, is 0.111 m yr−1; further, the number of lakes with rising water levels accounts for 80 % of all monitored lakes between 2010–2021, and the trends were significant at the level of 0,05 (p<0.05 for 106 lakes). The total area of lakes with rising water levels (4643 km2) is much larger than the total area of lakes with falling water levels (1374 km2), indicating that the water storage of lakes on the TP is growing. From the distribution of the annual average rate of change in lake levels (Fig. 9), among the monitored lakes between 2010 and 2021, there are more lakes with rising water levels than those with falling water levels.
Analysis of the trends in the changes in the water levels based on the lake areas shows that there is a clear rising trend in the water level of lakes on the TP, with the most significant trends in the case of rising water levels being for larger-sized lakes (>500 km2) and also for smaller-sized (<50 km2) lakes, while intermediate-sized lakes show a significant rising trend (Table 6).
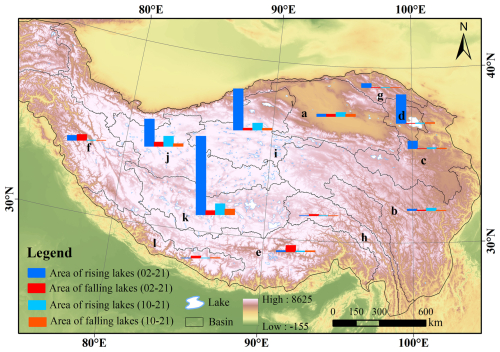
Figure 10Relative proportions of the trends in the lake level changes in each basin. The boundary of each basin based on Wan et al. (2016). The DEM of the base map is from the Global Multi-resolution Terrain Elevation Data 2010 (GMTED2010) (GMTED: https://topotools.cr.usgs.gov/gtmed_viewer/ (last access: 1 June 2022) (the lowercase letters indicate the different lake basins studied, as in Fig. 8).
To better understand the spatial distribution pattern of the changes in the water levels of the lakes, the trends for the changes in the water levels of the lakes in each basin of the TP were analysed (Table 5). Overall, during the period of 2010–2021, the water levels of the lakes in all basins increased significantly, except for that of the Brahmaputra River basin. The area of lakes with rising water levels was larger than that for lakes with decreasing water levels (Fig. 10). The water level changes in the lakes for each basin can be summarized as follows:
-
Qaidam basin. A total of nine lakes were monitored in the basin at the level of 0.05 (p<0.05), of which five lakes showed a rising trend, with an average rising rate of 0.233 m yr−1 and a total rising lake area of 393 km2. The other four lakes showed a falling trend, with an average falling rate of and a total falling lake area of 187 km2. The fastest rising lake level in the basin is that of Tuosu Lake, with an average annual rate of 0.724 m yr−1, and the fastest declining lake level is that of Dachaidan Lake, with an average annual rate of .
-
Yangtze River basin. Four lakes were measured in the basin at the level of 0.05 (p<0.05), distributed in the upper reaches of the Yangtze River source area. Three lakes exhibited a rising trend, predominantly located in the relatively lower-altitude regions upstream, with an average rising rate of 0.138 m yr−1 and a total rising lake area of 311 km2. The remaining one lake showed a downward trend, concentrated in the southern part of the basin, along the northern slopes of the Kunlun Mountains, with an average decrease rate of and a total falling area of 14 km2. Telashi Lake has the fastest rising water level at 0.326 m yr−1. Yelusu Lake is the largest lake in the basin, with an average annual rate of 0.034 m yr−1.
-
Qinghai Lake basin. Xiligou Lake, with an area of 43 km2, exhibited a rising water level, with an average annual increase rate of 0.058 m yr−1 (p<0.05).
-
Yellow River basin. The water levels of six lakes were monitored in the basin at the level of 0.05 (p<0.05), of which two lakes showed a rising trend, with an average rate of 0.136 m yr−1, and a total rising lake area of 85 km2, and the other four lakes showed a decreasing trend, with an average rate of . In this basin, Ayongwuerma Co has the fastest rising water level, with a mean rate of 0.174 m yr−1, and Xinxin Lake has the fastest declining water level, with a mean rate of . The largest lake is Kuhai Lake, with a mean rate of 0.099 m yr−1.
-
Brahmaputra River basin. A total of five lakes were monitored in the basin at the level of 0.05 (p<0.05), mainly in the upper and middle reaches of the Brahmaputra River. Of these, four lakes showed an increasing trend, with an average rising rate of 0.081 m yr−1 and a total rising area of 83 km2. The remaining one lake exhibited a decreasing water level trend, primarily concentrated in the upstream portion of the basin, with an average decline rate of and a total falling area of 39 km2. The lake with the fastest rising water level is Bajiu Co, at 0.230 m yr−1, while the fastest decline is observed in Chen Co, at . Sengli Co, the largest lake monitored, with an area of 83 km2, has an average annual water level change rate of .
-
Indus River basin. The monitored lake in this basin is Aiyong Co, with an average annual increase rate of 0.086 m yr−1 and a total rising area of 21 km2 (p<0.05).
-
Inner Plateau basin. The basin contains the Qiangtang Plateau and the Cocosili region, with a harsh natural environment and dry climate, and is the largest endorheic area on the TP. The water levels of 106 lakes were monitored in the basin at the level of 0.05 (p<0.05), and 89 lakes have a rising trend, with an average rising rate of 0.279 m yr−1 and a total rising area of 3688 km2. The remaining 17 lakes have a declining trend, mainly in the central and northern parts of the basin, with an average falling rate of and a total falling area of 1052 km2. The fastest rising lake level in the basin is that of Yan Lake, with an average rate of 2.384 m yr−1, and the fastest falling lake level is that of Ringco Ogma, with an average rate of .
Since the number of lakes monitored in the Nujiang River, Ganges River, and Hexi Corridor basins is very small, analyses for these basins were not conducted.
The derived water levels in the lakes of the TP are archived and available at https://doi.org/10.1594/PANGAEA.973443 (Chen et al., 2024).
In this study, high-resolution datasets for changes in the water levels of 361 lakes on the TP during 2002–2021 and 2010–2021 were developed based on multi-altimeter data from Envisat, ICESat-1, CryoSat-2, Jason-1, Jason-2, Jason-3, SARAL, and Sentinel-3A. A two-step AMPDR retracker and a noise footprint removal method were used to extract the water levels, and the lake level time series were then estimated using the R package tsHydro. The dynamic reference time series was then used to merge the lake level time series from the multi-altimeter data. It was found that the merged water levels based on the altimetry increased the overall sampling frequency regardless of the lake size. The water levels derived from the altimeter data were validated with in situ data, and the accuracy of the time series for monitoring lakes reached the decimetre level. Based on comparison with the DAHITI, LEGOS Hydroweb, and G-REALM datasets, the new product was found to be consistent with these products, and the median RMSEs are consistently below 0.30 m, while the median correlation values consistently exceed 0.90, indicating that the new dataset was reliable. In addition, the spatial–temporal changes in the water levels of the lakes on the TP during 2002–2021 were explored. Overall, the measured lake levels on the TP were indicative of a rising trend, with an overall average annual rate of change of 0.175 m yr−1; moreover, the number of lakes with rising water levels accounted for 78 % of the total examined. The lakes with the most significant rises in water levels were those of a large size (>500 km2) and small size (<50 km2), and the intermediate-sized lakes showed a significant rising trend in the water levels. The water levels of lakes in all basins increased significantly over the period of 2002–2021, except for those of the Brahmaputra River basin. The lakes with decreasing water levels were distributed mainly in the Brahmaputra River, Ganges River, and Nujiang River basins. Further applications of the lake level dataset of the TP are anticipated.
Comparison of the lake levels on the TP derived from this study with those provided by the DAHITI, LEGOS Hydroweb, G-REALM, and Li et al. (2019) in terms of RMSE and correlation.
The supplement related to this article is available online at https://doi.org/10.5194/essd-17-4235-2025-supplement.
JL and JC designed the research plan. JC developed the approaches and the dataset. JL, SM, and YL contributed to the analysis of the results. GS, LZ, and YW contributed to the data processing. JL and JC wrote the paper.
The contact author has declared that none of the authors has any competing interests.
Publisher's note: Copernicus Publications remains neutral with regard to jurisdictional claims made in the text, published maps, institutional affiliations, or any other geographical representation in this paper. While Copernicus Publications makes every effort to include appropriate place names, the final responsibility lies with the authors.
We thank the European Space Agency and Centre National d'Etudes Spatiales for providing the altimeter data and the Bureau of Hydrology and Water Resources of Qinghai Province, the Yellow River Commission of the Ministry of Water Resources, and the Institute of Tibetan Plateau Research of the Chinese Academy of Sciences for providing the in situ gauge measurements of the water levels.
This work was jointly supported by the National Key R&D Plan of China (grant no. 2024YFF0808302) and the National Natural Science Foundation of China (grant nos. 41871256 and 42371142).
This paper was edited by Birgit Heim and reviewed by three anonymous referees.
Adrian, R., O'Reilly, C. M., Zagarese, H., Baines, S. B., Hessen, D. O., Keller, W., Livingstone, D. M., Sommaruga, R., Straile, D., Donk, E. V., Weyhenmeyer, G. A., and Winder, M.: Lakes as sentinels of climate change, Limnol. Oceanogr., 54, 2283–2297, https://doi.org/10.4319/lo.2009.54.6_part_2.2283, 2009.
Bamber, J. L.: Ice sheet altimeter processing scheme, Int. J. Remote Sens., 15, 925–938, https://doi.org/10.1080/01431169408954125, 1994.
Bhang, K. J., Schwartz, F. W., and Braun, A.: Verification of the Vertical Error in C-Band SRTM DEM Using ICESat and Landsat-7, Otter Tail County, MN, IEEE T. Geosci. Remote, 45, 36–44, https://doi.org/10.1109/TGRS.2006.885401, 2007.
Chen, J. and Liao, J.: Monitoring lake level changes in China using multi-altimeter data (2016–2019), J. Hydrol., 590, 125544, https://doi.org/10.1016/j.jhydrol.2020.125544, 2020.
Chen, J., Liao, J., and Wang, C.: Improved lake level estimation from radar altimeter using an automatic multiscale-based peak detection retracker, IEEE J. Sel. Top. Appl., 14, 1246–1259, https://doi.org/10.1109/JSTARS.2020.3035686, 2021.
Chen, J., Liao, J., Deng, W., Shen, G., Zhang, L., and Wang, C.: High-space-coverage lake level change data sets on the Tibetan Plateau from 2002 to 2021 using multiple altimeter data, PANGAEA [data set], https://doi.org/10.1594/PANGAEA.973443, 2024.
Crétaux, J.-F., Arsen, A., Calmant, S., Kouraev, A., Vuglinski, V., Bergé-Nguyen, M., Gennero, M.-C., Nino, F., Abarca Del Rio, R., Cazenave, A., and Maisongrande, P.: SOLS: A lake database to monitor in the Near Real Time water level and storage variations from remote sensing data, Adv. Space Res., 47, 1497–1507, https://doi.org/10.1016/j.asr.2011.01.004, 2011.
Frappart, F., Calmant, S., Cauhopé, M., Seyler, F., and Cazenave, A.: Preliminary results of Envisat RA-2-derived water levels validation over the Amazon basin, Remote Sens. Environ., 100, 252–264, https://doi.org/10.1016/j.rse.2005.10.027, 2006.
Gao, L., Liao, J., and Shen, G.: Monitoring lake-level changes in the Qinghai-Tibetan Plateau using radar altimeter data (2002–2012), J. Appl. Remote Sens., 7, 073470, https://doi.org/10.1117/1.JRS.7.073470, 2013.
Göttl, F., Dettmering, D., Müller, F., and Christian, S.: Lake level estimation based on Cryosat-2 SAR altimetry and multi-looked waveform classification, Remote Sens., 8, 885, https://doi.org/10.3390/rs8110885, 2016.
Guerreiro, K., Fleury, S., Zakharova, E., Kouraev, A., Rémy, F., and Maisongrande, P.: Comparison of CryoSat-2 and ENVISAT radar freeboard over Arctic sea ice: toward an improved Envisat freeboard retrieval, The Cryosphere, 11, 2059–2073, https://doi.org/10.5194/tc-11-2059-2017, 2017.
Hwang, C., Cheng, Y., Han, J., Kao, R., Huang, C., Wei, S., and Wang, H.: Multi-decadal monitoring of lake level changes in the Qinghai-Tibet Plateau by the TOPEX/Poseidon-Family altimeters: Climate implication, Remote Sens., 8, 446, https://doi.org/10.3390/rs8060446, 2016.
Hwang, C., Cheng, Y., Yang, W., Zhang, G., Huang, Y., Shen, W., and Pan, Y.: Lake level changes in the Tibetan Plateau from Cryosat-2, SARAL, ICESat, and Jason-2 altimeters, Terr. Atmos. Ocean. Sci. 30, 1–18, https://doi.org/10.3319/TAO.2018.07.09.01, 2019.
Irvine, K. N. and Eberhardt, A. J.: Multiplicative, seasonal ARIMA models for Lake Erie and Lake Ontario water levels, Water Resour. Bull., 28, 385–396, https://doi.org/10.1111/j.1752-1688.1992.tb04004.x, 1992.
Jiang, L., Nielsen, K., Andersen, O. B., and Bauer-Gottwein, P.: Monitoring recent lake level variations on the Tibetan Plateau using Cryosat-2 SARIn mode data, J. Hydrol., 544, 109–124, https://doi.org/10.1016/j.jhydrol.2016.11.024, 2017.
Kleinherenbrink, M., Ditmar, P. G., and Lindenbergh, R. C.: Retracking Cryosat data in the SARIn mode and robust lake level extraction, Remote Sens. Environ., 152, 38–50, https://doi.org/10.1016/j.rse.2014.05.014, 2014.
Kleinherenbrink, M., Lindenbergh, R. C., and Ditmar, P. G.: Monitoring of lake level changes on the Tibetan Plateau and Tian Shan by retracking Cryosat SARIn waveforms, J. Hydrol., 521, 119–131, https://doi.org/10.1016/j.jhydrol.2014.11.063, 2015.
Kropáček, J., Braun, A., Kang, S., Feng, C., Ye, Q., and Hochschild, V.: Analysis of lake level changes in Nam Co in central Tibet utilizing synergistic satellite altimetry and optical imagery, Int. J. Appl. Earth Obs., 17, 3–11, https://doi.org/10.1016/j.jag.2011.10.001, 2012.
Lee, H., Shum, C. K., Kuo, C. Y., Yi, Y., and Braun, A.: Application of TOPEX altimetry for solid earth deformation studies, Terr. Atmos. Ocean. Sci., 19, 37–46, https://doi.org/10.3319/tao.2008.19.1-2.37(sa), 2008.
Lee, H., Shum, C. K., Tseng, K. H., Guo, J. Y., and Kuo, C. Y.: Present-day lake level variation from envisat altimetry over the northeastern Qinghai-Tibetan Plateau: links with precipitation and temperature, Terr. Atmos. Ocean. Sci., 22, 169–175, https://doi.org/10.3319/TAO.2010.08.09.01(TibXS), 2011.
Lee, S., Im, J., Kim, J., Kim, M., Shin, M., Kim, H. C., and Quackenbush, L. J.: Arctic sea ice thickness estimation from CryoSat-2 satellite data using machine learning-based lead detection, Remote Sens., 8, 698, https://doi.org/10.3390/rs8090698, 2016.
Lei, Y.: The water level observation of lakes on the Tibetan Plateau (2010–2017), National Tibetan Plateau Data Center, https://doi.org/10.11888/Hydrology.tpe.249464.db, 2018.
Li, H. W., Qiao, G., Wu, Y. J., Cao, Y. J., and Mi, H.: Water level monitoring on Tibetan Lakes based on Icesat and Envisat data series, Int. Arch. Photogramm., XLII-2/W7, 1529–1533, https://doi.org/10.5194/isprs-archives-XLII-2-W7-1529-2017, 2017.
Li, X., Long, D., Huang, Q., Han, P., Zhao, F., and Wada, Y.: High-temporal-resolution water level and storage change data sets for lakes on the Tibetan Plateau during 2000–2017 using multiple altimetric missions and Landsat-derived lake shoreline positions, Earth Syst. Sci. Data, 11, 1603–1627, https://doi.org/10.5194/essd-11-1603-2019, 2019.
Liao, J., Gao, L., and Wang, X., Numerical simulation and forecasting of water level for Qinghai Lake using multi-altimeter data between 2002 and 2012, IEEE J. Sel. Top. Appl., 7, 609–622, https://doi.org/10.1109/JSTARS.2013.2291516, 2014.
Luo, S., Song, C., Zhan, P., Liu, K., Chen, T., Li, W., and Ke, L. (2021). Refined estimation of lake water level and storage changes on the Tibetan Plateau from ICESat/ICESat-2, Catena, 200, 105177, https://doi.org/10.1016/j.catena.2021.105177, 2021.
Marshall, A. and Deng, X. L.: Image analysis for altimetry waveform selection over heterogeneous inland waters, IEEE Geosci. Remote S., 13, 1198–1202, https://doi.org/10.1109/LGRS.2016.2575068, 2016.
Martin, T. V., Zwally, H. J., Brenner, A. C., and Bindschadler, R. A.: Analysis and retracking of continental ice sheet radar altimeter waveforms, J. Geophys. Res.-Atmos., 88, 1608–1616, https://doi.org/10.1029/JC088iC03p01608, 1983.
Medina, C. E., Gomez-Enri, J., Alonso, J. J., and Villares, P.: Water level fluctuations derived from ENVISAT Radar Altimeter (RA-2) and in-situ measurements in a subtropical waterbody: Lake Izabal (Guatemala), Remote Sens. Environ., 112, 3604–3617, https://doi.org/10.1016/j.rse.2008.05.001, 2008.
Nielsen, K., Stenseng, L., Andersen, O. B., Villadsen, H., and Knudsen, P.: Validation of CryoSat-2 SAR mode based lake levels, Remote Sens. Environ., 171, 162–170, https://doi.org/10.1016/j.rse.2015.10.023, 2015.
Pavlis, N. K., Holmes, S. A., Kenyon, S. C., and Factor, J. K.: The development and evaluation of the Earth Gravitational Model 2008 (EGM2008), J. Geophys. Res. Sol. Ea., 117, 1–38, https://doi.org/10.1029/2011JB008916, 2012.
Pritchard, H. D.: Asia's glaciers are a regionally important buffer against drought, Nature, 545, 169–174, https://doi.org/10.1038/nature22062, 2017.
Ricker, R., Hendricks, S., Helm, V., Skourup, H., and Davidson, M.: Sensitivity of CryoSat-2 Arctic sea-ice freeboard and thickness on radar-waveform interpretation, The Cryosphere, 8, 1607–1622, https://doi.org/10.5194/tc-8-1607-2014, 2014.
Schindler, D. W.: Lakes as sentinels and integrators for the effects of climate change on watersheds, airsheds, and landscapes, Limnol. Oceanogr., 54, 2349–2358, https://doi.org/10.4319/lo.2009.54.6_part_2.2349, 2009.
Schwatke, C., Dettmering, D., Bosch, W., and Seitz, F.: DAHITI – an innovative approach for estimating water level time series over inland waters using multi-mission satellite altimetry, Hydrol. Earth Syst. Sci., 19, 4345–4364, https://doi.org/10.5194/hess-19-4345-2015, 2015.
Shen, X., Zhang, J., Zhang, X., Meng, J., and Ke, C.: Sea ice classification using Cryosat-2 altimeter data by optimal classifier feature assembly, IEEE Geosci. Remote S., 14, 1948–1952, https://doi.org/10.1109/LGRS.2017.2743339, 2017.
Song, C., Ye, Q., and Cheng,, X.: Shifts in water-level variation of Namco in the central Tibetan Plateau from ICESat and Cryosat-2 altimetry and station observations, Sci. Chin., 60, 1287–1297, https://doi.org/10.1007/s11434-015-0826-8, 2015.
Song, S., Liu, H., Beck, R. A., Frappart, F., Korhonen, J., Xu, M., Yang, B., Hinkel, K. M., Huang, Y., and Yu, B.: Analysis of Sentinel-3 SAR altimetry waveform retracking algorithms for deriving temporally consistent water levels over ice-covered lakes, Remote Sens. Environ., 239, 111643, https://doi.org/10.1016/j.rse.2020.111643, 2020.
Steunou, N., Desjonqueres, J.-D., Picot, N., Sengenes, P., Noubel, J., and Poisson, J. C.: AltiKa altimeter: instrument description and in flight performance, Mar. Geod., 38, 22–42, https://doi.org/10.1080/01490419.2014.988835, 2015.
Strawbridge, F. and Laxon, S.: ERS-1 altimeter fast delivery data quality flagging over land surfaces, Geophys. Res. Lett., 21, 1995–1998, https://doi.org/10.1029/94GL01730, 1994.
Wan, W., Long, D., Hong, Y., Ma, Y., Yuan, Y., Xiao, P., Duan, H., Han, Z., and Gu, X.: A lake data set for the Tibetan Plateau from the 1960s, 2005, and 2014, Sci. Data, 3, 160039, https://doi.org/10.1038/sdata.2016.39, 2016.
Wang, J.: The lake level observation data of Lake Namco from the Integrated Observation and Research Station of Multisphere in Namco (2007–2016), National Tibetan Plateau Data Center, 2018.
Zhang, G.: Changes in lakes on the Tibetan Plateau observed from satellite data and their responses to climate variations, Progr. Geogr., 37, 214–223, https://doi.org/10.18306/dlkxjz.2018.02.004, 2018.
Zhang, G., Xie, H., Kang, S., Yi, D., and Ackley, S. F.: Monitoring lake level changes on the Tibetan Plateau using ICESat altimetry data (2003–2009), Remote Sens. Environ. 115, 1733–1742, https://doi.org/10.1016/j.rse.2011.03.005, 2011.
Zhang, G., Xie, H., Yao, T., Liang, T., and Kang, S.: Snow cover dynamics of four lake basins over Tibetan Plateau using time series MODIS data (2001–2010), Water Resour. Res., 48, W10529, https://doi.org/10.1029/2012WR011971, 2012.
Zhang, G., Xie, H., Yao, T., and Kang, S.: Water balance estimates of ten greatest lakes in China using ICESat and Landsat data, Chin. Sci. Bull., 58, 3815–3829, https://doi.org/10.1007/s11434-013-5818-y, 2013a.
Zhang, G., Yao, T., Xie, H., Kang, S., and Lei, Y.: Increased mass over the Tibetan Plateau: from lakes or glaciers?, Geophys. Res. Lett., 40, 2125–2130, https://doi.org/10.1002/grl.50462, 2013b.
Zhang, G., Yao, T., Shum, C., Yi, S., Yang, K., Xie, H., Feng, W., Bolch, T., Wang, L., and Behrangi, A.: Lake volume and groundwater storage variations in Tibetan Plateau's endorheic basin, Geophys. Res. Lett., 44, 5550–5560, https://doi.org/10.1002/2017GL073773, 2017.
Zhang, G., Chen, W., and Xie, H.: Tibetan Plateau's lake level and volume changes from NASA's ICESat/ICESat-2 and Landsat missions, Geophys. Res. Lett., 46, 13107–13118, https://doi.org/10.1029/2019GL085032, 2019.
Zhang, Y., Li, B., and Zheng, D.: A discussion on the boundary and area of the Tibetan Plateau in China, Geogr. Res., 21, 1–8, https://doi.org/10.11821/yj2002010001, 2002.
- Abstract
- Introduction
- Study area and data
- Methods
- Validation of data quality
- Spatio-temporal analysis of changes in lake levels on the TP
- Data availability
- Conclusion
- Appendix A
- Author contributions
- Competing interests
- Disclaimer
- Acknowledgements
- Financial support
- Review statement
- References
- Supplement


