the Creative Commons Attribution 4.0 License.
the Creative Commons Attribution 4.0 License.
 | 13 Aug 2025
Compilation and analysis of thaw settlement test results: implications for prediction tools and stress–strain characterization in permafrost
Zakieh Mohammadi
Jocelyn L. Hayley
Climate change has already significantly impacted infrastructure built on permafrost with thaw settlement as the most frequently reported issue. By characterizing thaw settlement tests, an improved understanding of the thaw settlement properties of permafrost sediment can be obtained. Thaw settlement tests involve thawing permafrost samples under an initial load, followed by applying additional load to the thawed sample to characterize its volume change behaviour upon thawing. In the absence of a standardized procedure for conducting thaw settlement tests, characterizing thaw settlement properties has been done using various methods in the existing literature; however, to date, these data have not been broadly compared. This is in part because they had not previously been compiled in a single dataset. This study presents a comprehensive dataset of thaw settlement test results digitized from published papers and reports. The data are standardized and stored in an open-source repository. Aggregating the data enabled a cross-comparison of thaw settlement properties for different soil types. This was achieved by constructing an idealized stress–strain curve for each test and deriving thaw settlement parameters from the curves. These parameters were then used to compare the thaw settlement behaviour of fine-grained, coarse-grained, and highly organic permafrost samples. Additionally, the compiled data were used to evaluate the effectiveness of various empirical tools developed to predict thaw strain from index properties. The predicted thaw strain values were compared with the measured thaw strains to determine which tool provided the most accurate and reliable predictions for each soil type. The results suggest that a correlation developed by Nixon and Ladanyi (1978) for estimating thaw strain based on frozen bulk density shows the smallest deviation from actual values and exhibits the least bias in its predictions. This dataset enhances understanding of thaw settlement behaviour and provides a basis for developing and improving empirical prediction tools. Additionally, it facilitates more consistent characterization of stress–strain response upon thawing, supporting future modelling efforts. While the dataset is a valuable foundation for preliminary analysis, its full utility is realized when combined with site-specific data. The dataset is accessible at https://doi.org/10.5281/zenodo.15192404 (Mohammadi and Hayley, 2024c), and the results presented in this paper are based on version 1.2.1 of the dataset. While this dataset enhances preliminary assessment capabilities, it does not replace the need for site-specific investigations to accurately characterize local foundation conditions and stratigraphy.
- Article
(7490 KB) - Full-text XML
- BibTeX
- EndNote


Thaw settlement is a frequently reported issue for infrastructure built on permafrost and contributes to high maintenance costs, reduced life cycles, and compromised serviceability of infrastructure (Brooks, 2019; Schneider von Deimling et al., 2021; Flynn et al., 2015; Fortier et al., 2011; Hjort et al., 2018). Thaw settlement occurs when excess water, originating from melting ground ice, is expelled under the overburden loads, resulting in ground subsidence (Andersland and Ladanyi, 2003). With increasing warming trends and projections showing a substantial decrease in near-surface permafrost extent, it is expected that thaw settlement will become an even greater threat to infrastructure (Hjort et al., 2022). Improved understanding and estimation of thaw settlement are crucial for developing adaptive strategies, design, and management of new structures, as well as maintenance of stability and serviceability of existing infrastructure undergoing climate changes.
Thaw settlement properties at the site scale can be determined by conducting a comprehensive site investigation, obtaining an adequate number of minimally disturbed permafrost samples, and determining the thaw settlement parameters experimentally under controlled thermal and loading conditions for representative samples. This is, however, not feasible in many cases because of remoteness, harsh weather conditions, and high costs, limiting the capacity for thaw settlement testing when planning and budgeting. In light of these challenges, empirical methods correlating thaw strain to index properties of permafrost are commonly used for predicting thaw strains. The development of new tools and improving the existing ones relies heavily on what experimental data there are to develop correlations between thaw strain and more easily acquirable index properties of permafrost samples. Thaw settlement test results, beyond their established role in developing thaw strain estimation tools, are also integral to characterizing the stress–strain behaviour of thawing permafrost, which is essential for accurate numerical modelling of thaw settlement. This type of data has previously been used to investigate the characteristics of the stress–strain relationship in various permafrost soils (Dumais and Konrad, 2023, 2024; Mohammadi and Hayley, 2024a, b).
While challenges in conducting thaw settlement tests have led to a scarcity of high-quality data, the lack of a standardized procedure for conducting the test has resulted in diverse test procedures across sources, introducing uncertainties and variability when consolidating data for conclusive analysis. Homogenizing thaw settlement data from various sources, as well as compiling them into larger datasets, is crucial for enhancing the understanding and prediction of thaw settlement.
This paper presents a repository of thaw settlement test results sourced from the literature that had not previously been compiled in a single dataset. This repository aims to enhance the understanding of thaw settlement behaviour across various permafrost sediments. The compilation includes thaw settlement test results, corresponding sample properties, borehole data, and detailed particle size distribution. The thaw settlement test results and observed general stress–strain behaviour among three major groups of samples – fine-grained, coarse-grained, and organic – are discussed. The data are utilized to compare the effectiveness of existing empirical tools for estimating thaw strain and to identify the most fitting tools for various soil groups. This compiled dataset supports applications where site-specific data are limited, offering a means to infer thaw settlement properties using regional analogues. Its standardized format also facilitates comparative studies and the refinement of empirical estimation tools.
Thaw settlement refers to “settling of the ground surface, buildings, or infrastructure caused by melt of ice within the soil” (Lewkowicz et al., 2024). It is technically defined as the compression of the ground due to thaw consolidation, where thaw consolidation is a time-dependent process involving the thawing of frozen ground and the subsequent drainage of excess pore water (Harris et al., 1988). The magnitude of thaw settlement can vary significantly depending on soil type and ice content. The settlement continues as long as the thawing front advances and until excess water generated during thawing is expelled and the potential pore pressure buildup, especially in relatively impermeable fine-grained soils, is dissipated.
The thaw settlement test is widely used to characterize the volume change behaviour of permafrost subjected to thawing. Figure 1 shows a typical curve of void ratio versus vertical stress for a permafrost sample as it undergoes thawing and experiences additional vertical stress after thawing.
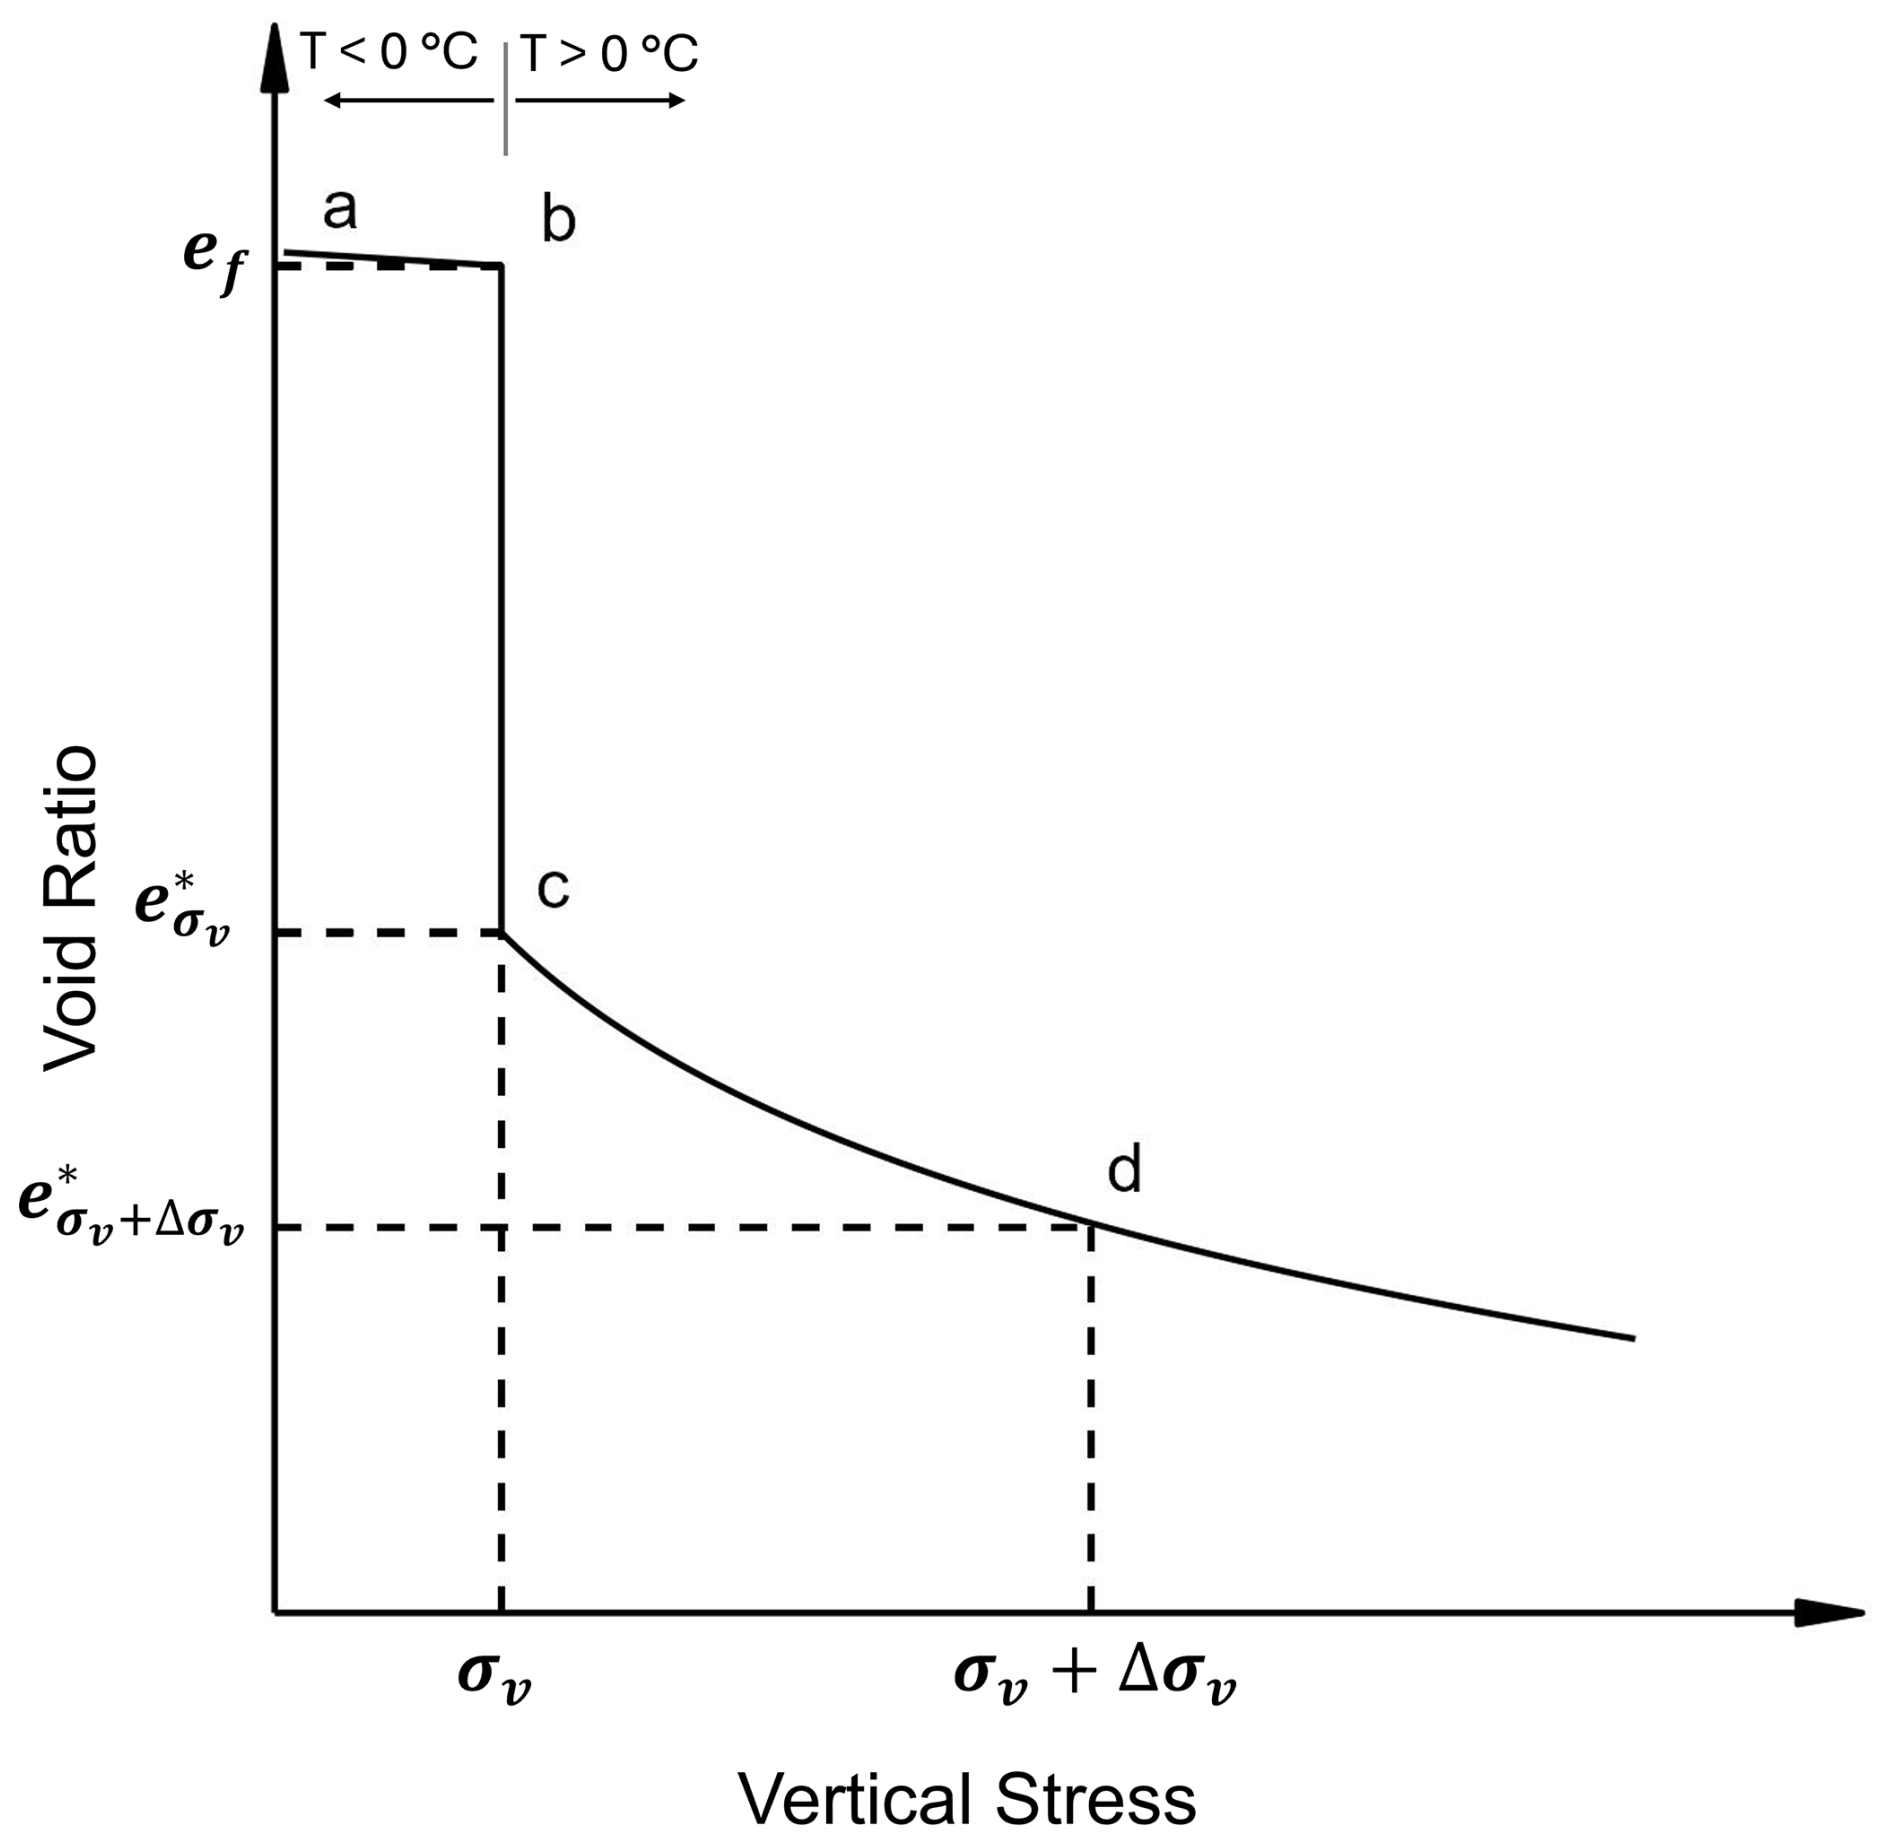
Figure 1Typical void ratio (e) versus vertical stress (σv) curve for a permafrost sample with a frozen void ratio of ef subjected to thawing under a vertical stress of σv and subjected to additional vertical stress of Δσv after the completion of thawing (adopted from Andersland and Ladanyi, 2003).
Based on the theoretical concept established by Tsytovich (1960), thaw strain (measured as the percentage of volume change from point b to c) has three main components: (1) phase change, (2) drainage of excess water (meltwater in excess of what soil can retain in the thawed state), and (3) compression of the thawed soil under the applied initial pressure during thawing (σv). Additional volume change may occur if an additional load is applied after thawing (points c to d).
The thaw settlement test typically involves subjecting the sample to an initial or seating load (generally equivalent to the overburden pressure) and then increasing the temperature to induce thawing. Once thawed and deformation is stabilized, the loading can be increased incrementally to establish stress–strain behaviour under the combined effects of overburden pressure and potential surface loading. Currently, there is no standardized procedure for conducting the test, which results in a variety of methodologies being adapted, introducing variability and uncertainty in the cross-comparison of data from different testing programs.
For a given permafrost stratum, a thaw settlement test on representative samples measures thaw strain, which is mostly controlled by ground ice content, soil composition, and overburden pressure. However, the magnitude of thaw settlement at the ground surface over a specific period is influenced by the stratigraphy, the rate of thawing (controlled by climate forces and site conditions), the thaw strain of each thawed layer, and their confining conditions.
Thaw settlement test results are typically presented as either thaw strain versus vertical (effective) stress (hereafter referred to as the ε –σv curve) or void ratio versus vertical (effective) stress (referred to as the e–σv curve), as shown in Fig. 2. In this paper, “vertical stress” refers interchangeably to vertical effective stress, given that sufficient time is allowed during each loading step for the dissipation of excess pore pressure and completion of consolidation. However, in relatively permeable coarse-grained soils, the development of pore pressure is expected to be negligible. From both representations, comparative parameters, termed thaw settlement parameters in this paper, can be derived that enable characterization of the stress–strain behaviour and cross-comparison of the test results obtained using various testing procedures. These derived parameters offer a standardized basis for comparing thaw settlement behaviour across datasets, helping address variability introduced by non-standardized testing procedures.
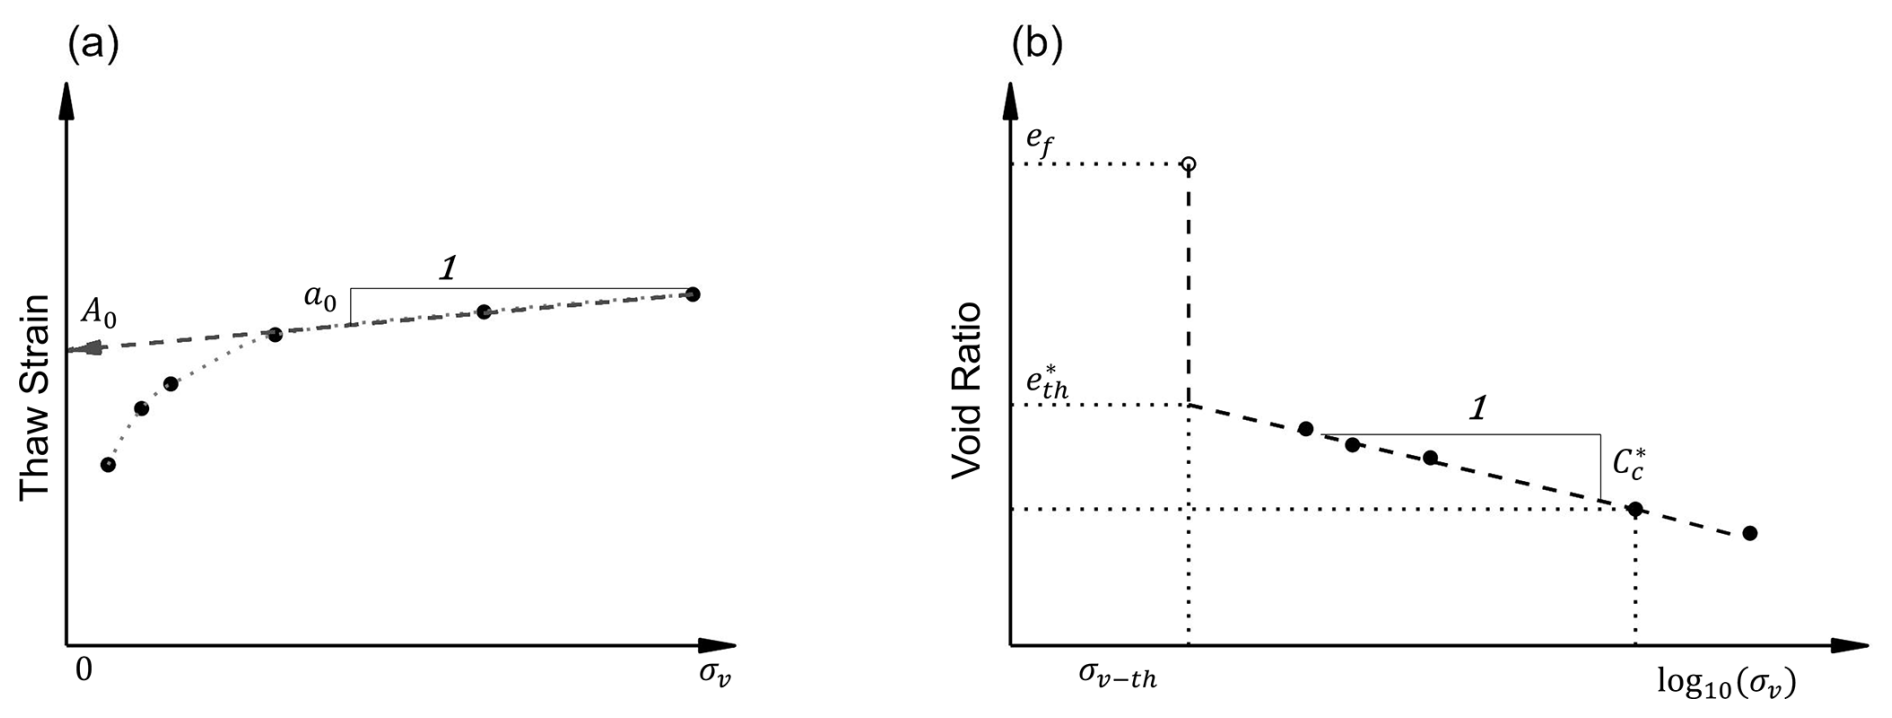
Figure 2Schematic of typical thaw settlement test results: (a) strain versus vertical stress and (b) void ratio versus logarithm of vertical stress, where “f” represents the frozen state,“*” represents the thawed state, and “th” marks the threshold values (figure adapted from Mohammadi and Hayley, 2024a).
Previous experimental programs have identified a consistent pattern in the ε–σv curve marked by a relatively linear trend at higher pressure ranges. Linear curve fitting (as illustrated in Fig. 2a) allows for the derivation of two parameters: the coefficient of volume compressibility (a0), corresponding to the slope of this linear segment, and the thaw strain parameter (A0), corresponding to the intercept of the linear portion and strain axis. In the case of the e–σv curve, a linear semilogarithmic trend is identified as more effective in characterizing stress–strain behaviour (Dumais and Konrad, 2023; Mohammadi and Hayley, 2024a; Nixon and Morgenstern, 1974; Yao et al., 2017). Following the approach proposed for fine-grained soils (e.g. Dumais, 2019; Dumais and Konrad, 2023, 2024), this idealization allows for the derivation of parameters such as the compressibility index of thawed soil (), corresponding to the slope of the line, and the threshold thawed void ratio (), corresponding to the thawed void ratio associated with a threshold vertical effective stress (σv-th) at which phase change and expulsion of excess water (if present) conclude and soil's compression as a result of increase in effective stress initiates, as illustrated in Fig. 2b.
2.1 Thaw strain prediction
Several empirical studies have focused on developing correlations between thaw strain and index properties such as water content and frozen bulk density (e.g. Hanna et al., 1983; Luscher and Afifi, 1973; Nelson et al., 1983; Speer et al., 1973). Speer et al. (1973) established a correlation between thaw strain and frozen bulk density based on tests conducted on samples collected along the potential route for a buried warm pipeline, traversing various regions of the Arctic. Nelson et al. (1983) developed empirical relationships between thaw strain and basic index properties of frozen soils for nine distinct soil groups. Nelson's equation used properties such as moisture content, porosity, and degree of saturation to allow for thaw strain estimation in partially saturated soils. Luscher and Afifi (1973) developed bilinear relations between thaw strain (measured at σv of about 70 to 100 kPa) and frozen bulk density for three types of coarse-grained soils. Ladanyi (1996) derived a correlation between thaw strains measured at 100 kPa and frozen bulk density using test results on silt and sand samples from multiple sites along the Mackenzie River (Andersland and Ladanyi, 2003). Hanna et al. (1983) established relationships for predicting thaw strain from volumetric water content for six groups of soils (gravel, high plastic fines, low plastic soils, organics, and peat) using thaw settlement test results on samples subjected to thaw under a vertical stress of 50 kPa. Table 1 summarizes various established methods for thaw strain estimation and the range of their applicability.
Table 1Summary of existing empirical relations for estimating thaw strain from index properties.
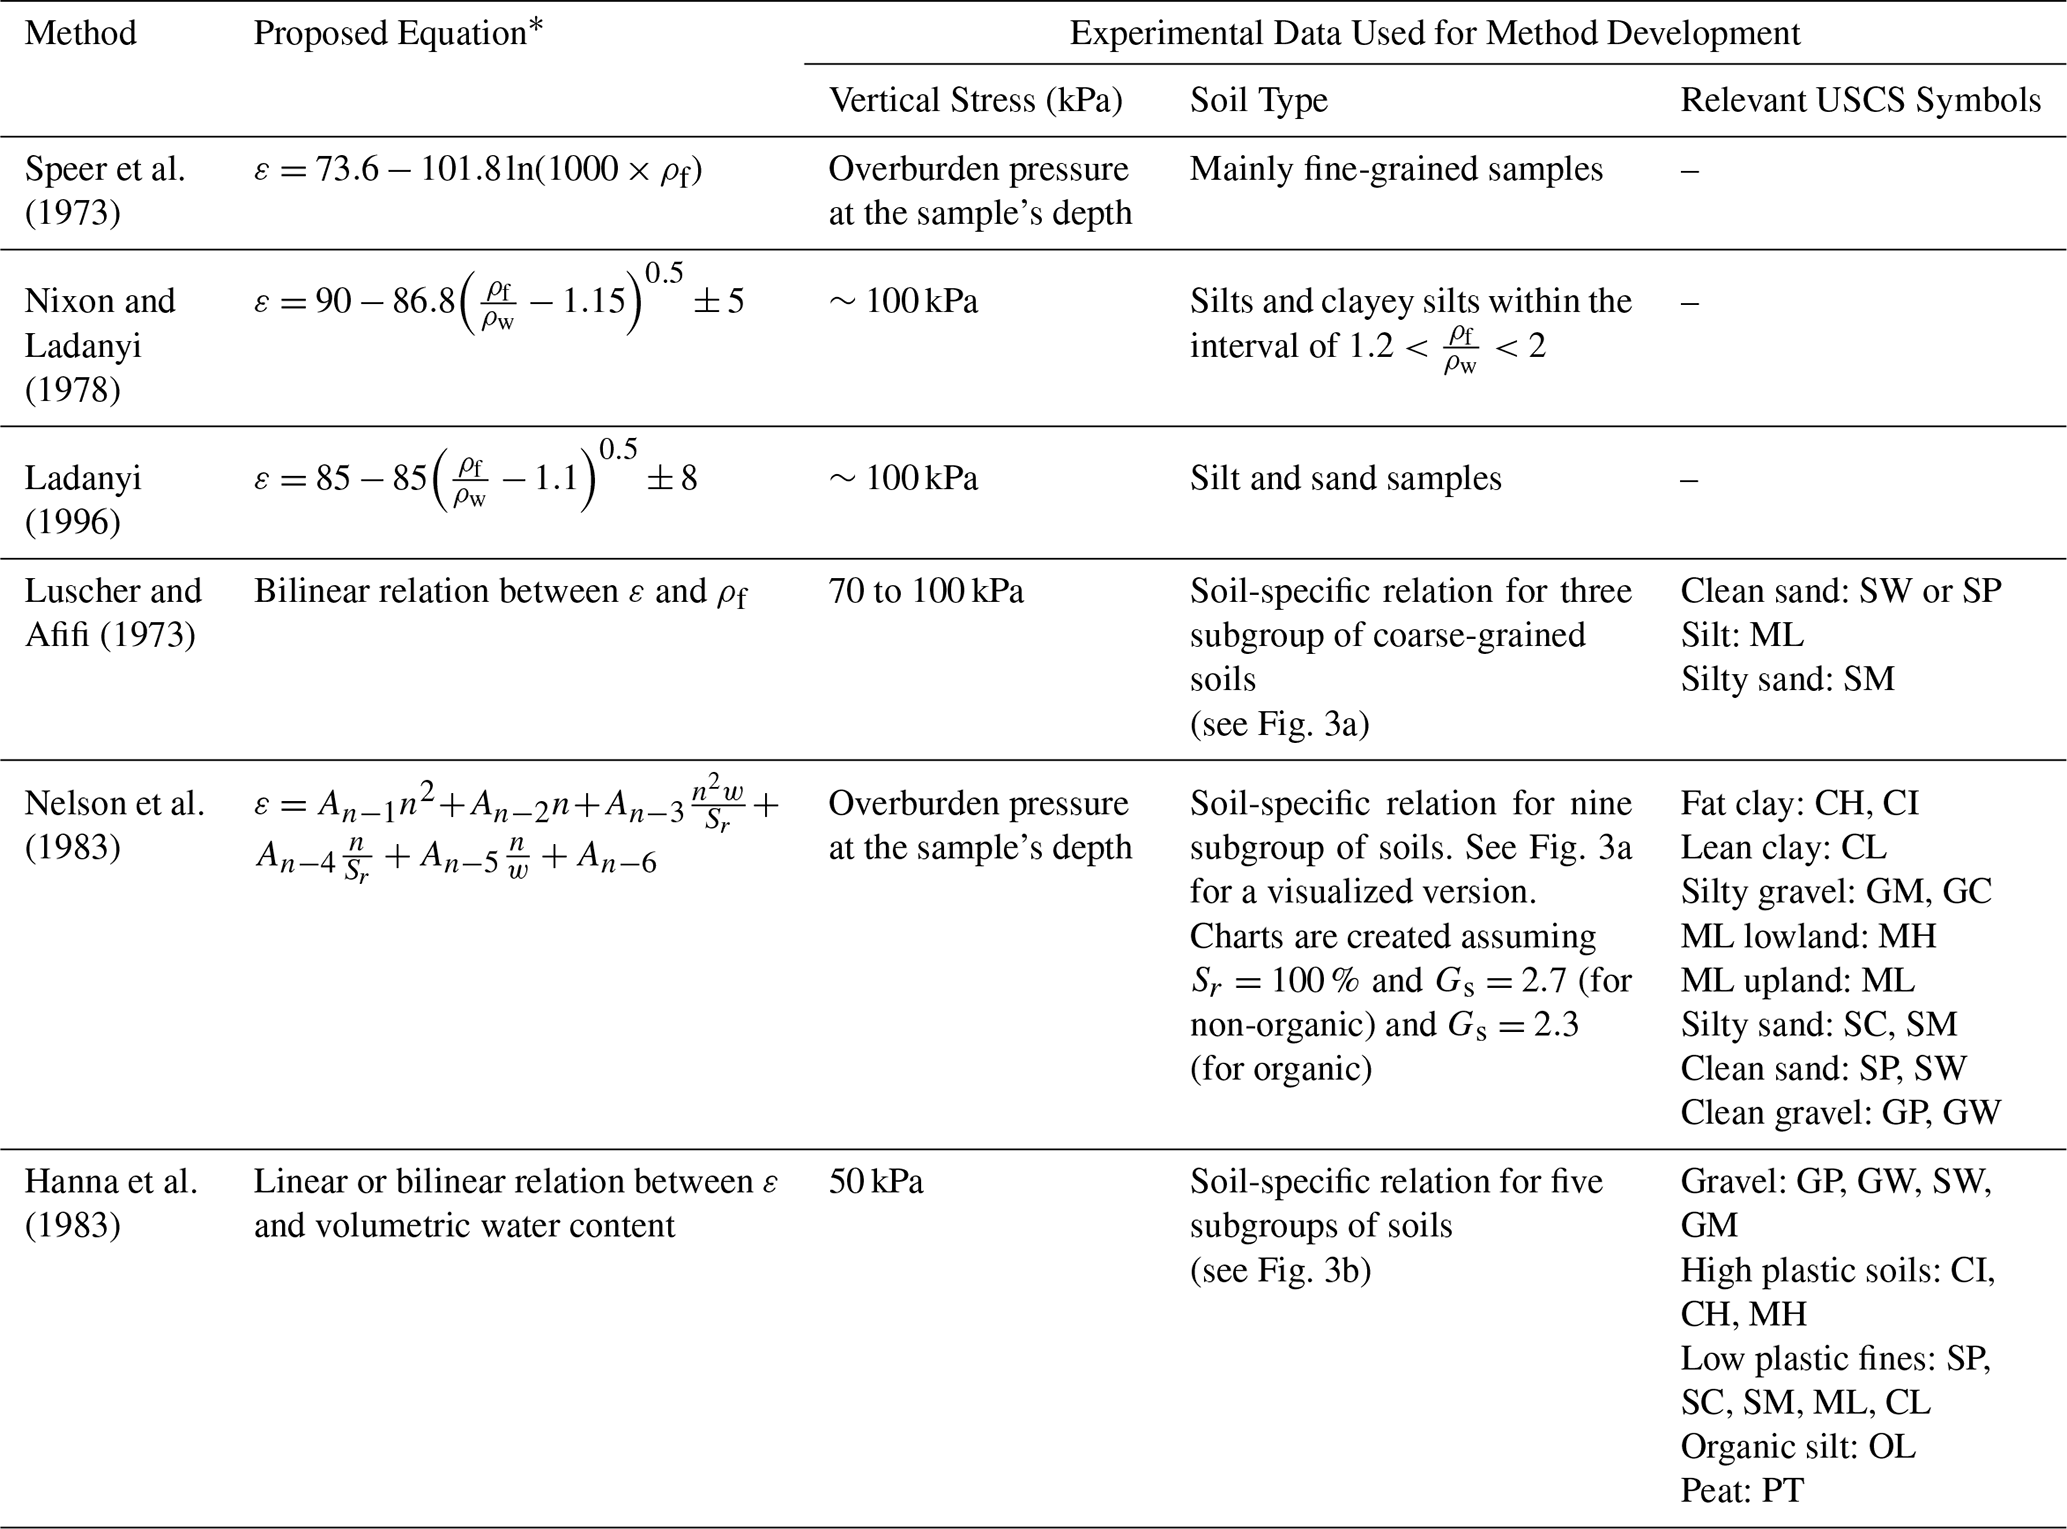
* Refer to Appendix A for the full list of symbols, their meaning, and the unit of each variable.
Despite being derived from relatively large datasets, the developed correlations for predicting thaw strain exhibit intrinsic variability, indicating potential limitations in their predictive accuracy and introducing uncertainties into predictions. As shown in Fig. 3a, thaw strain estimates for relatively similar soil types can vary substantially between different methods, introducing uncertainties into the predictions. Additionally, while some tools use laboratory-measured thaw strains collected under a specific vertical stress, others rely on thaw strain values measured under pressures equivalent to the overburden pressure at each sample's depth, which varies for each sample. As thaw strain depends on the applied stress, particularly for highly compressible soils, the estimated thaw strain obtained using the latter approach lacks a clear stress reference. Moreover, even for tools that provide a clear stress reference for the estimated thaw strain, instructions are not provided for adjusting the estimation for stresses different from the reference value. In Sect. 5 of this paper, the complied thaw settlement test results are used to critically evaluate the effectiveness of empirical method outlined in Table 1 for predicting thaw strain. This evaluation focuses on identifying which methods yield the most accurate predictions for various soil types, taking into account the limitations and uncertainties discussed previously. By systematically comparing the predicted thaw strains with the actual test results, the strengths and weaknesses of each approach are highlighted, ultimately guiding practitioners in selecting the most reliable method for thaw strain estimation in their specific applications.
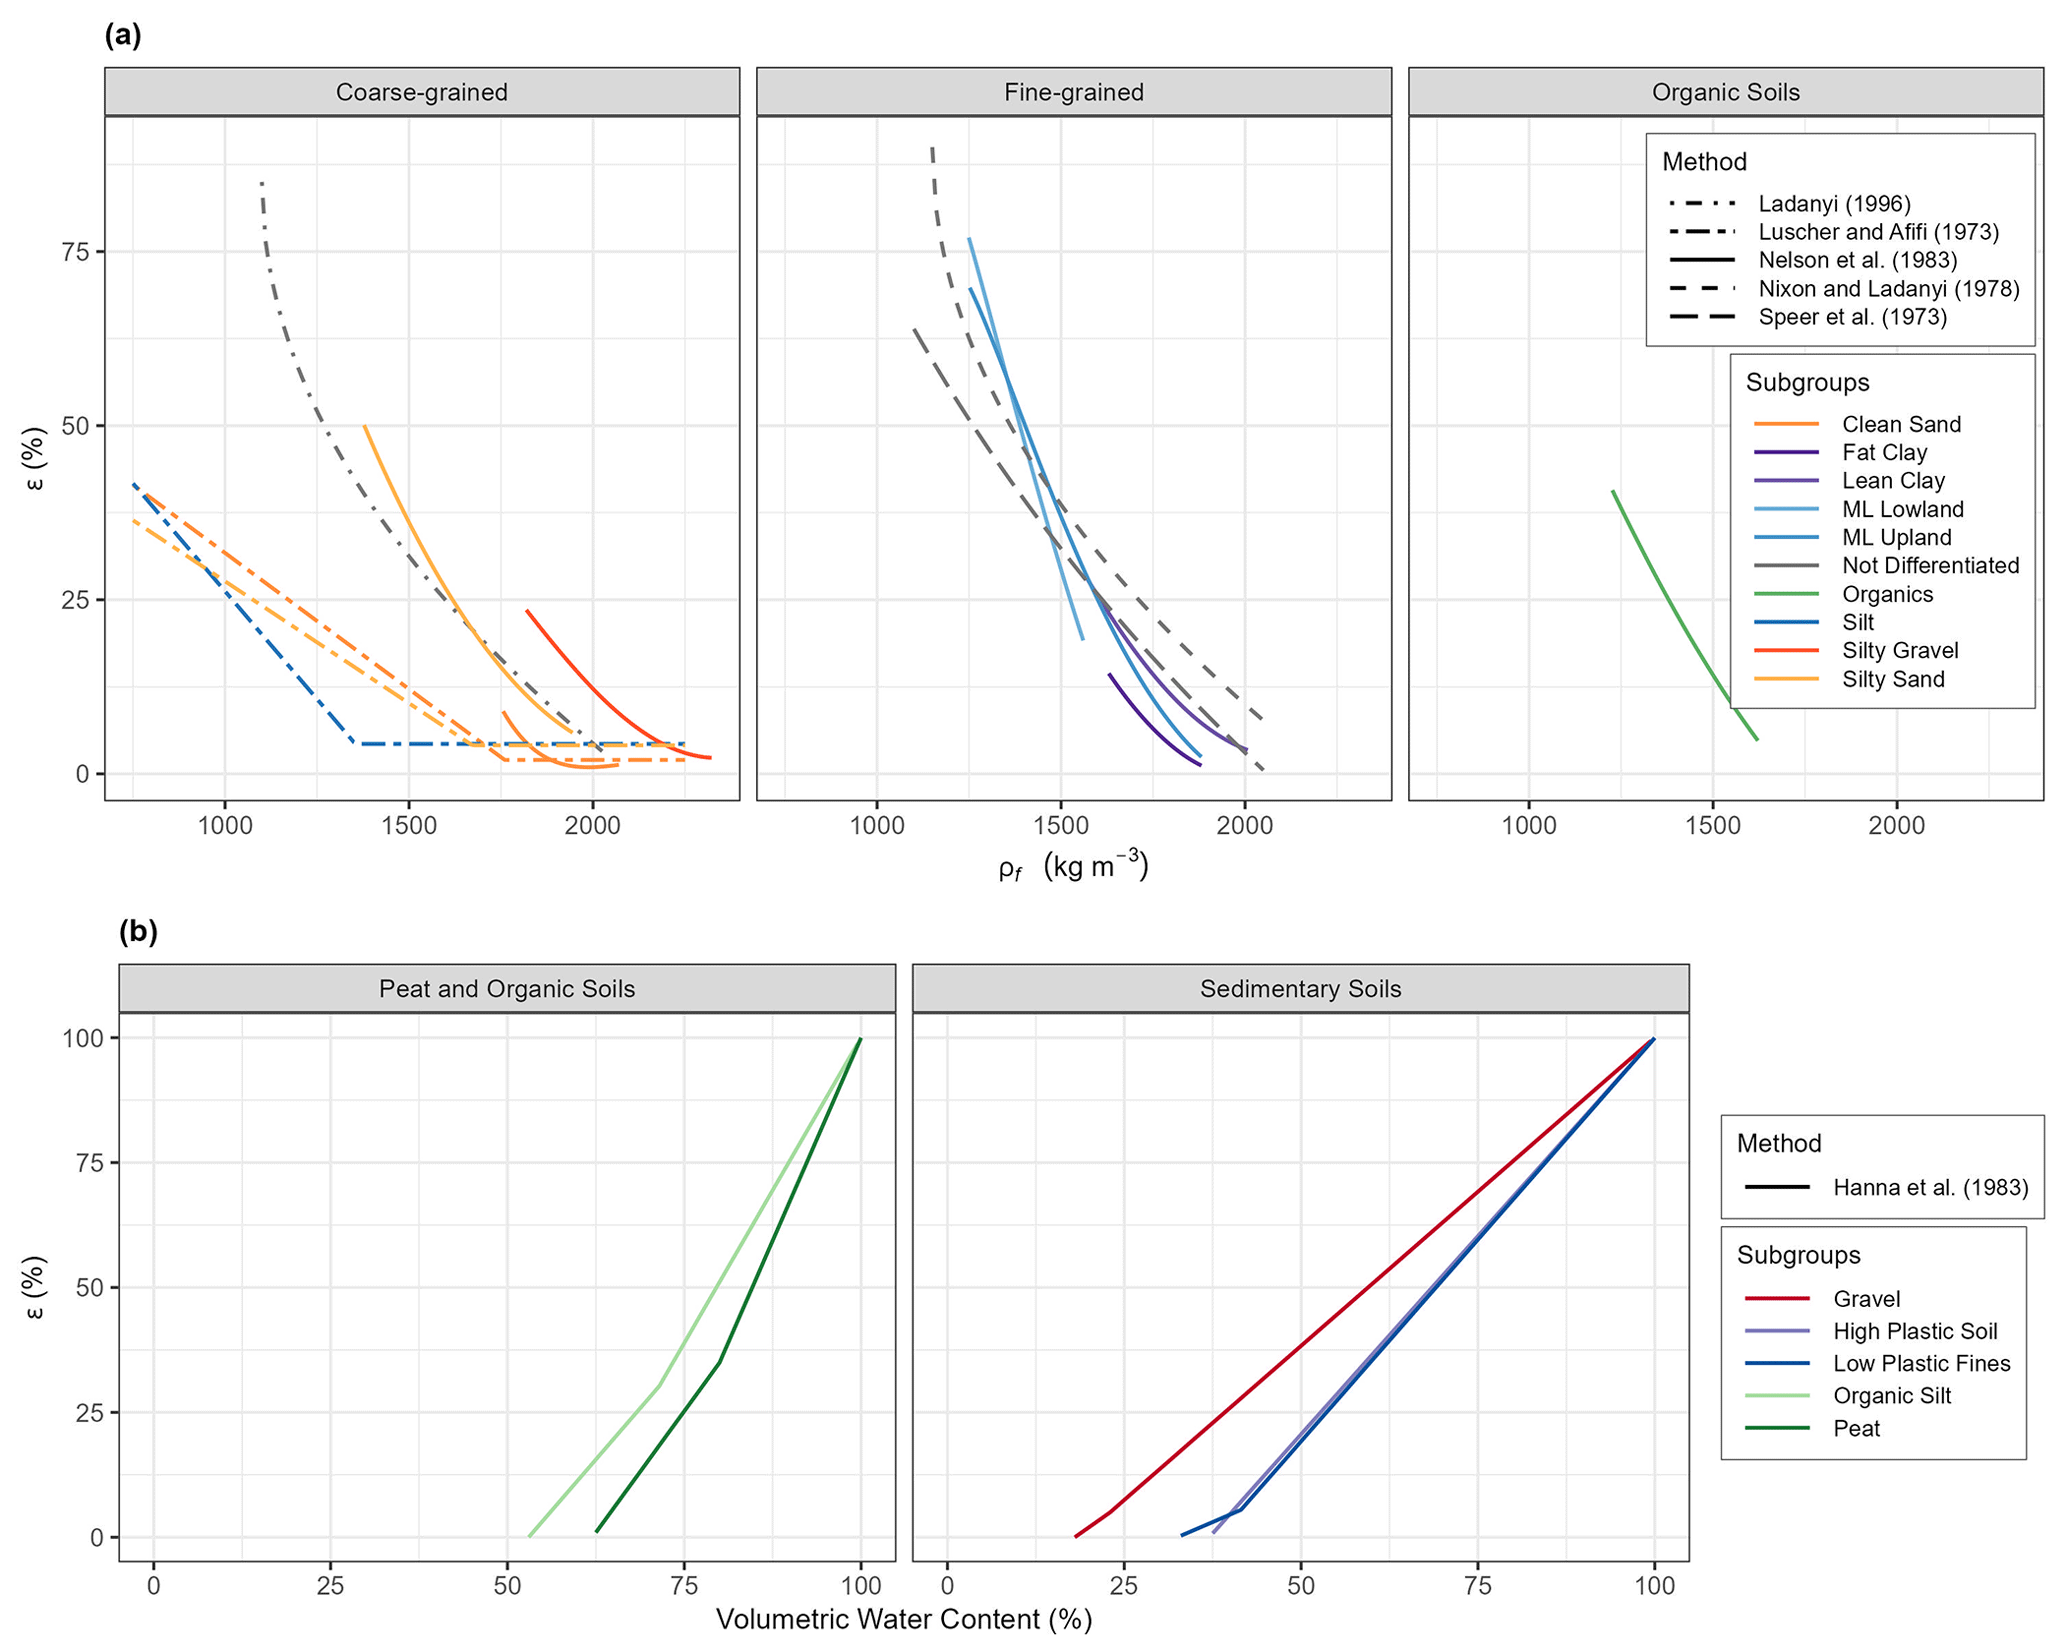
Figure 3Empirical methods for estimating thaw strain (ε) from (a) frozen bulk density (ρf) and (b) volumetric water content. The correlations are grouped by major soil type. In each box, the line type represents the reference method, while the colour indicates the names of subgroups (if the major soil types are further divided). Although several methods have been developed using ρf, only one reference uses volumetric water content. Note the variability in ε for a given ρf across different methods developed in various references for coarse-grained and fine-grained soils.
2.2 Formulating strain–stress relationship
Recent studies have focused on characterizing the stress–strain behaviour of thawing permafrost and developing correlations between comparative parameters and index properties. These efforts are crucial for constructing stress–strain relationships that facilitate the determination of thaw strain (or void ratio) as a function of vertical stress, as illustrated in Fig. 2.
Dumais and Konrad (2023) developed a framework for thaw consolidation of fine-grained permafrost, providing insights into idealizing stress–strain behaviour of permafrost sediments. They employed the concept of residual stress, defined as the effective stress sustained by thawed soil under undrained conditions, to differentiate between ice-rich and ice-poor permafrost samples. Their findings suggest that a linear semilogarithmic relation between effective stress and void ratio is suitable for ice-poor permafrost, while an idealized bilinear relationship is more appropriate for ice-rich soils. Using thaw settlement test results from the Canadian Arctic Gas Pipeline Project conducted in the 1970s by Northern Engineering Services Company Limited (1976), they established correlations between index properties and the thaw settlement parameters.
Mohammadi and Hayley (2024a) conducted a comprehensive review of the thaw settlement behaviour of coarse-grained permafrost samples. Their analysis incorporated thaw settlement test results from various sources, including Allard et al. (2020) and NESCL (1976, 1977b, a). Using thaw settlement data alongside experimental data on the minimum void ratio for granular soils, they developed empirical relations for predicting thawed void ratio at a specific vertical stress of 15 kPa (). These predictions were guided by the observed alignment between and the minimum void ratio estimated from soil particle gradation. They suggested that, similarly to fine-grained soils, a linear semilogarithmic relation between effective stress and the void ratio can be adopted for coarse-grained soils. However, they noted that the values for these sediments were low, with a mean value of 0.11. This indicates that thaw strain in coarse-grained soils is relatively insensitive to applied stress. The empirical tools developed for predicting relied on properties such as median particle size and coefficient of uniformity.
Despite the prevalence of highly organic permafrost in various regions such as the Hudson Bay Lowlands in Canada, studies on the thaw settlement behaviour of organic soils are limited (Wang et al., 2023). Highly organic permafrost is particularly prone to thaw settlement due to its high compressibility and its occurrence in the upper layers of permafrost, which are more susceptible to thawing. Using thaw settlement test results on frozen peat samples sourced from NESCL (1976), Mohammadi and Hayley (2024b) showed that gravimetric water content can effectively predict thaw settlement parameters such as and (at an assumed threshold vertical stress of 1 kPa) for highly organic soils.
Building upon these studies and to enhance the applicability of the compiled dataset for a deeper understanding of the stress–strain behaviour across various soil types, an idealized stress–strain curve was developed, and comparative parameters were extracted for each test result in the dataset. A detailed comparison of these parameters across different soil types is presented in Sect. 4, contributing to a more comprehensive understanding of thaw settlement evaluation and informing future research directions.
To develop a comprehensive dataset of thaw settlement tests, a thorough review of the literature was carried out to identify and compile relevant test results. Key data, including test outcomes, sample properties, and borehole information, were extracted. Thaw settlement test results, such as void ratio and/or thaw strain versus vertical stress, were digitized from figures using PlotDigitizer software (https://plotdigitizer.com, last access: 10 April 2025) or extracted from tabulated data in various reports. For digitized figures using PlotDigitizer, care was taken to align axes and scale references accurately. Reported reliability studies of this tool show high accuracy, with intercoder agreement reaching over 99.1 % and intracoder reliability ranging from 99.3 % to 99.5 % across published and hypothetical graphs (Aydin and Yassikaya, 2022). Where tabulated values were available, they were used to validate or replace digitized data. This same procedure was applied to borehole data and particle size distributions when available.
In total, 446 test results were identified and extracted, primarily from two sources: a testing program by Northern Engineering Service Company Limited (NESCL) as part of the Canadian Arctic Gas Pipeline Project in the Mackenzie Valley (Canadian Arctic Gas Study Limited and Northern Engineering Services Company, 1977; Northern Engineering Services Company Limited, 1976, 1977c, a, b, d) and a testing program by the Centre d'Études Nordiques (CEN) on samples collected from various villages in Nunavik, northern Quebec (Allard et al., 2020, 2023; Aubé-Michaud et al., 2020b, a; Chiasson et al., 2020a, b; L'Hérault et al., 2014; St-Amour et al., 2020).
In addition to these primary sources, test results were gathered from other data resources (indicated by ODS), including test results included in Watson et al. (1973a, b) and tests conducted as part of permafrost hazard mapping for different communities in Yukon (Benkert et al., 2015a, c, b, 2016). Figure 4 illustrates the locations of the boreholes collected from various data sources.
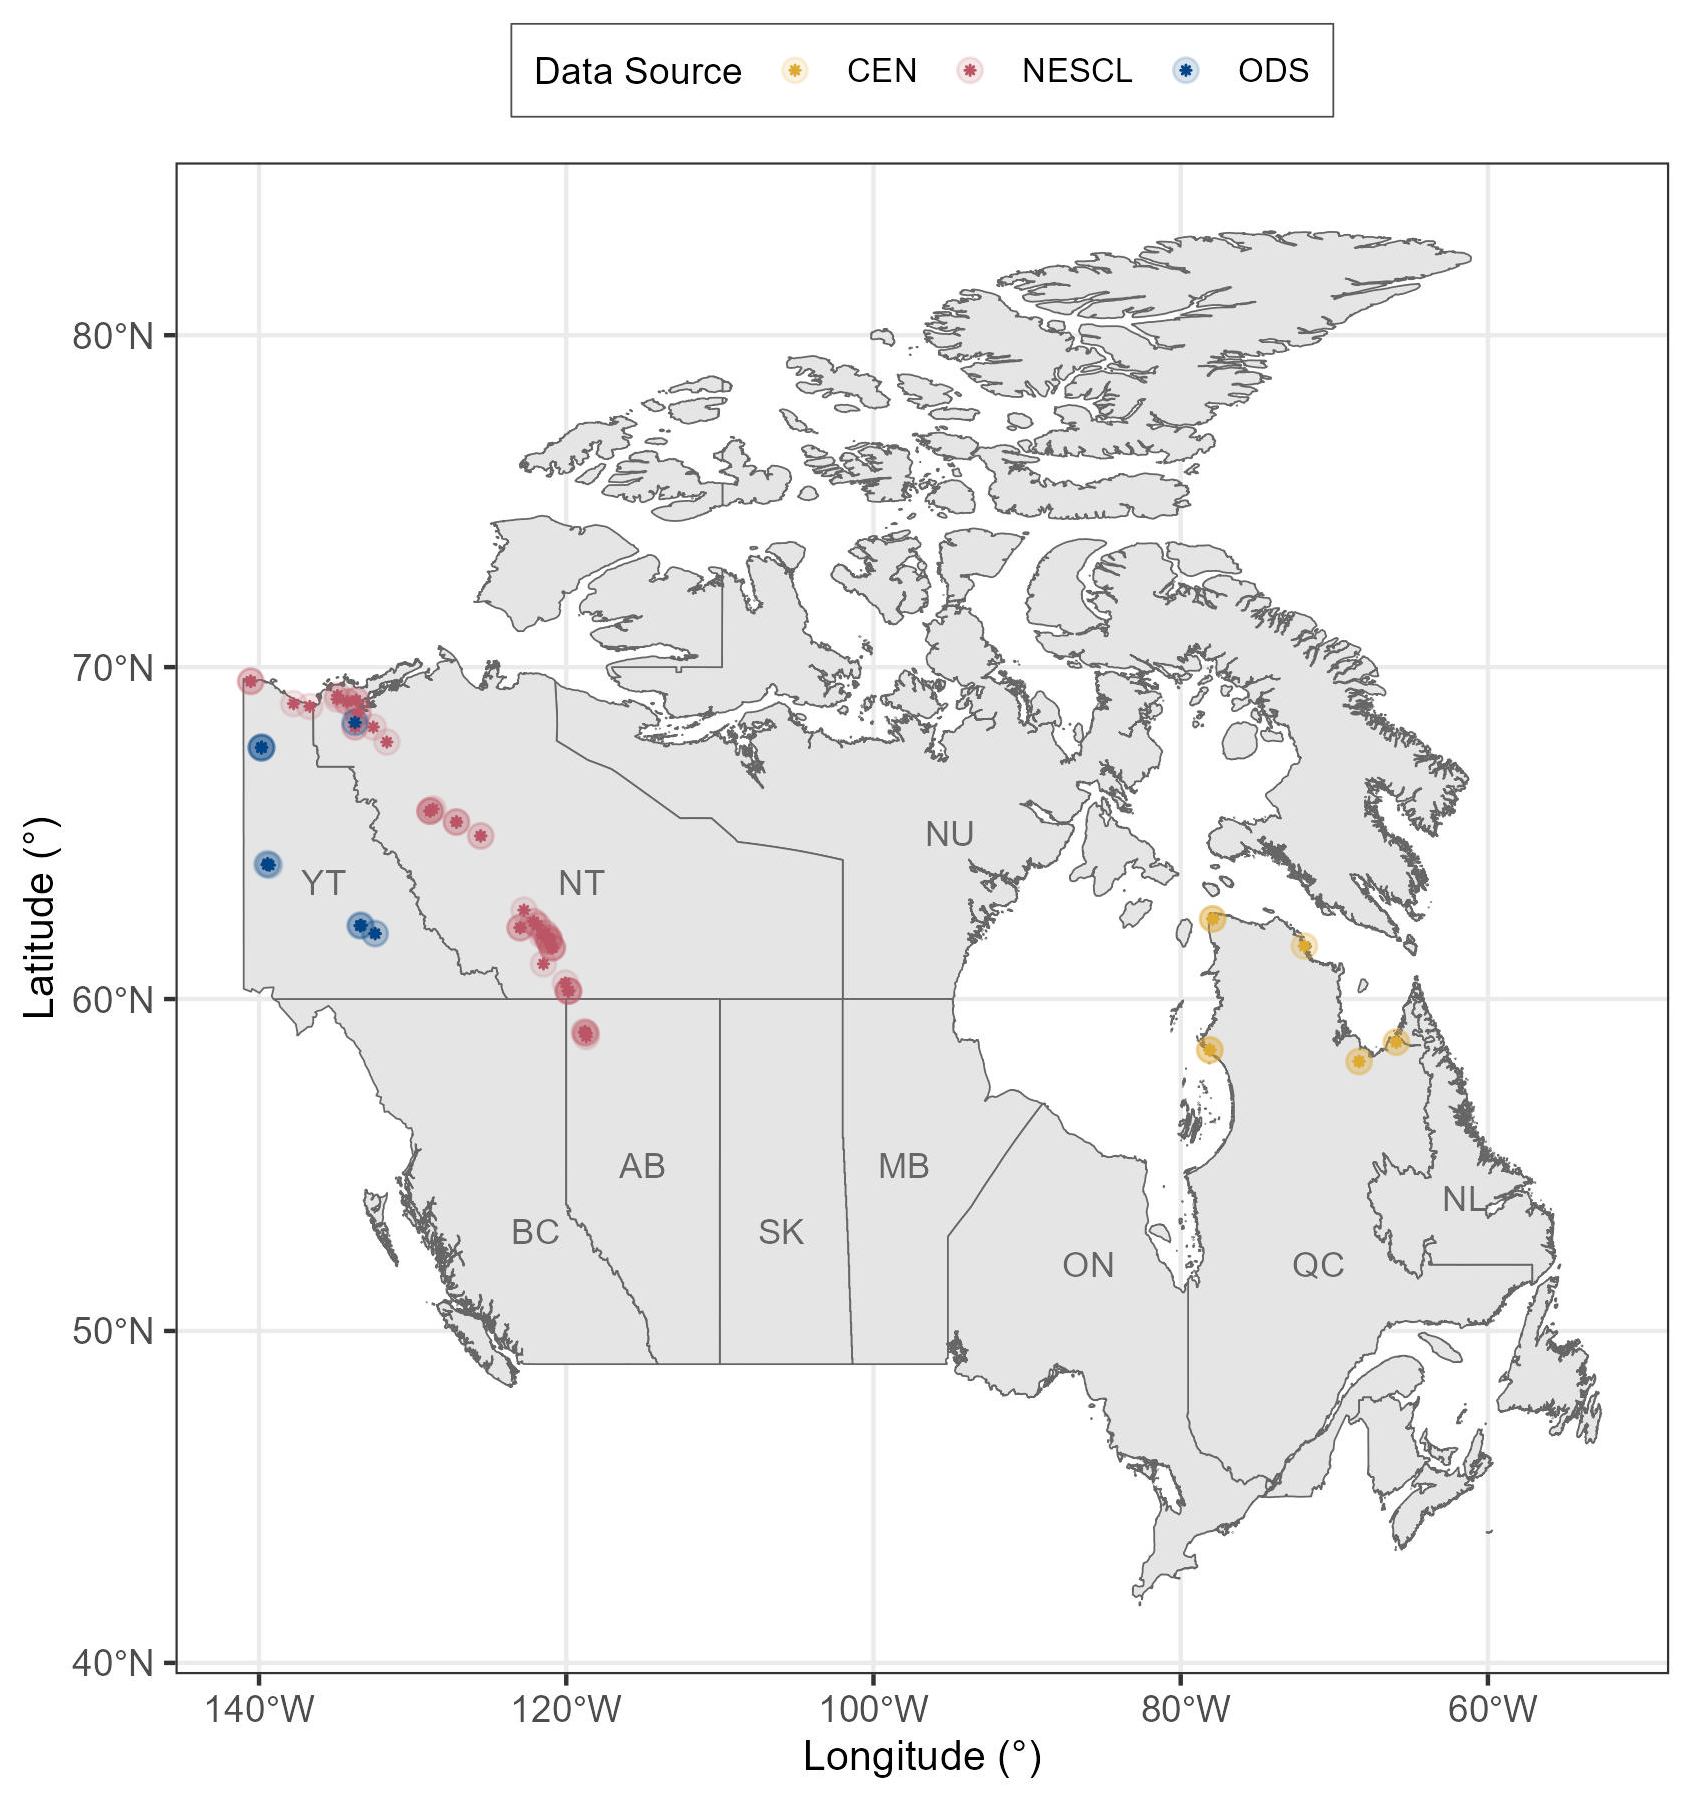
Figure 4Locations of boreholes from various sources, including data collected by the Centre d'Études Nordiques (CEN), Northern Engineering Services Company Limited (NESCL), and other data sources (ODS). The markers are rendered with transparency; areas with higher concentrations of boreholes appear darker. Map was created using the canadianmaps R package (Cayen, 2023).
The collected data underwent thorough evaluation, homogenization, and merging processes to construct a comprehensive dataset, named the Permafrost Thaw Settlement Dataset (PTSD), which is publicly available (at https://doi.org/10.5281/zenodo.15192404) (Mohammadi and Hayley, 2024c). The collected data were rigorously examined, avoiding reliance solely on reported sample properties and test results. Measurements of sample dimensions, mass, and deformation readings during the thaw settlement test (if included in the original sources) were relied upon to derive or recalculate sample properties and test results. This approach was adapted to add an extra layer of validation and mitigate potential errors in the reported values for these properties or test results in the original reports.
Each test in the PTS dataset was assigned a unique identifier, referred to as “test_id”, to ensure distinct identification across various datasets. To standardize the data, all reported values in different unit systems were converted to SI units. A quality control process was implemented using quality scores of 0, 1, and 2 to denote low- (e.g. erroneous or insufficient data), moderate- (e.g. contradictory properties), and high-quality data, respectively. These scores help users filter the dataset according to reliability: Level 2 data are suitable for parameter derivation and validation, Level 1 data may be used for general trends or exploratory comparisons but are excluded from regression analyses, and Level 0 data are retained for completeness but are not recommended for quantitative analysis.
While subsets of these data have previously been used to investigate the characteristics of the stress–strain relationship in various permafrost soils (e.g. Dumais and Konrad 2023, 2024; Mohammadi and Hayley 2024b, a), the data used have not been published or made publicly available. This underscores the significance of developing the PTS dataset, which centralizes these data and enhances their accessibility.
A detailed description of each variable included the PTS dataset, along with their units of measurement and relevant notes, is outlined in Appendix A.
3.1 Thaw settlement test results
A compilation of thaw settlement test results, including unique test ID, vertical stress, vertical deformation, thaw strain, and void ratio during each loading step is stored in the “thaw_settlement_test_results.csv” file in the PTS dataset. In instances where the sample's deformation and initial height were available, thaw strain and void ratio were calculated based on these measurements. Where deformation was not included in the original reports and only thaw strain or void ratio was reported, these values were directly included in the dataset. In cases where only one of these two variables (void ratio and thaw strain) was reported, the missing variable was calculated based on the available variable and sample's properties. This approach was adopted to ensure consistency in the dataset format and to facilitate the extraction of various comparative parameters for each sample.
Testing procedure
Due to the lack of a standard procedure for conducting thaw settlement test, the test procedures adopted across the different sources vary. While the procedure usually involves thawing undisturbed permafrost samples in a modified oedometer cell and measuring the vertical deformation, different loading schemes in terms of the magnitude of the initial load, the number of loading steps, and the range of applied vertical stresses are used across various sources and even within one testing program. Figure 5 illustrate the variability in testing procedure in terms of minimum and maximum applied vertical stress during each test and the frequency of the number of loading steps across various data sources in PTS dataset.
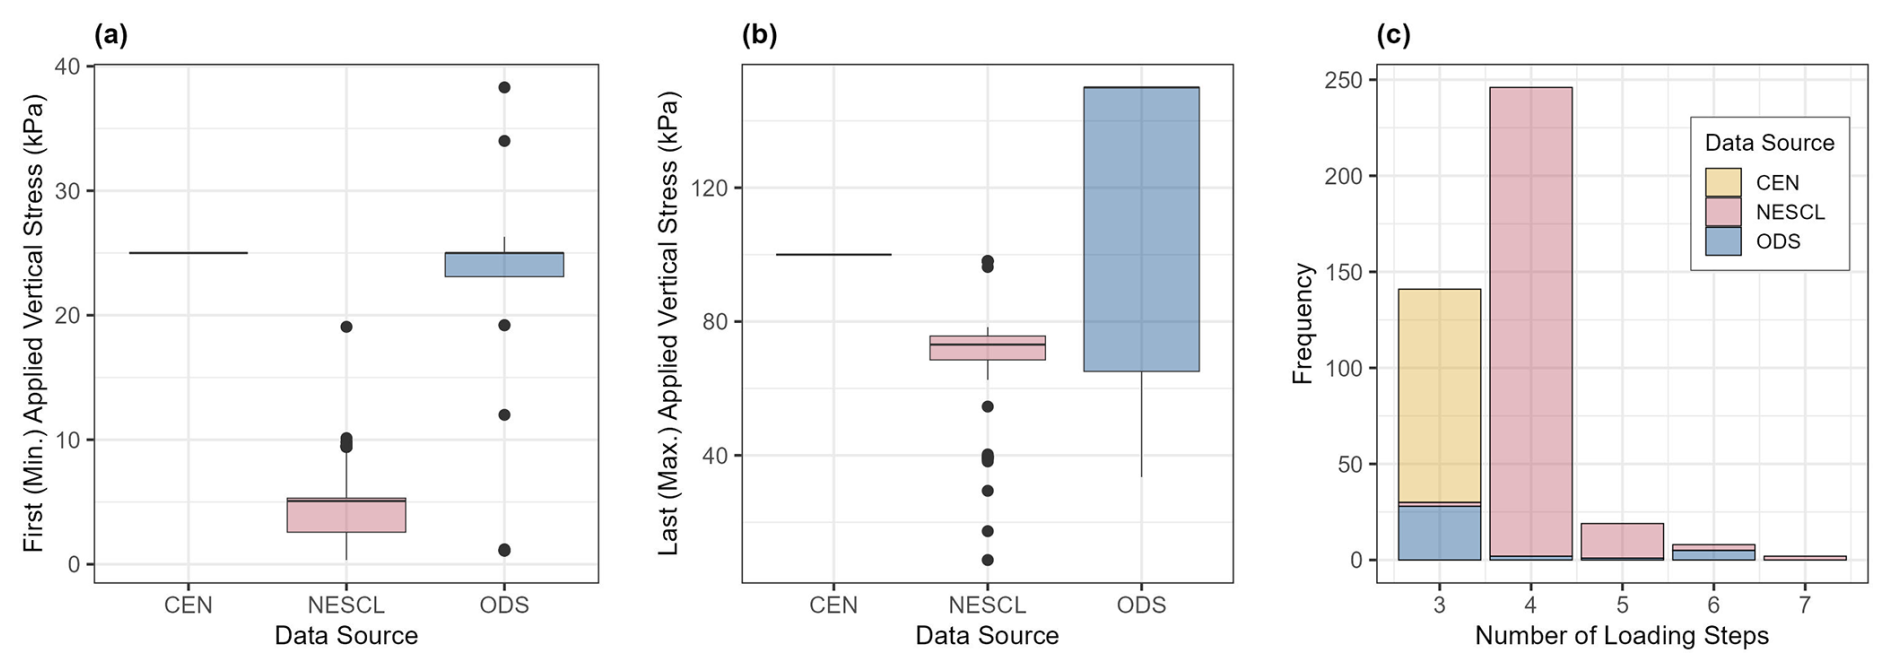
Figure 5Variability of test procedure across different data sources: (a) a box plot showing the range of minimum vertical stress (applied during first loading step), (b) a box plot showing the range of maximum vertical stress (applied during last loading step), and (c) a bar chart showing the frequency of tests completed with specific number of loading steps across all data sources.
For the testing procedure adopted by NESCL, the applied vertical stress during thawing varied between 0.35 and 38.3 kPa, with the majority of samples tested at an initial vertical stress between 2.5 and 9.3 kPa (representing the 10th and 90th percentile of initial vertical stress, respectively). Most samples were then loaded up to vertical stresses of approximately 66.5 to 77 kPa. However, in a limited number of tests, vertical stresses outside this range were used, with the overall range of maximum applied vertical stress varying between 8.7 and 98.1 kPa. For CEN data, permafrost samples were subjected to thawing under vertical stress of 25 kPa followed by two incremental loads at 50 kPa and then 100 kPa, resulting in a total of three deformation readings (L'Hérault et al., 2014).
Most tests from sources other than NESCL are completed typically with three loading steps. In the case of NESCL data, more than 80 % of tests are completed with four loading steps; 6.5 % at five loading steps; and limited number of tests at three, six, or seven loading steps. Tests with fewer than three loading steps were occasionally reported; however, they were excluded when calculating thaw settlement parameters and were flagged as “0”, indicating tests with insufficient/inaccurate data or sample properties.
In addition to variation in the loading scheme, a variation in sample dimensions exists across different testing programs. The sample diameter for the CEN data was approximately 97 mm, with sample heights ranging from 70 to 150 mm and most samples falling within the 120 to 140 mm range. For the NESCL data, a thaw settlement cell with an internal diameter of 63.5 mm and a height of about 50 mm was used. If available, sample or cell dimensions are included in the PTS dataset.
3.2 Sample information
3.2.1 Soil group
Based on the available information on sample particle size distribution and soil classification/description from the original sources, the samples were categorized into three main groups: fine-grained, coarse-grained, and peat samples. For mineral soils, the Unified Soil Classification System (USCS) criteria were employed to assign soil category. Samples with more than 50 % of particles larger than the no. 200 sieve size were categorized as coarse-grained, while those with less were classified as fine-grained. The soil symbols reported in the original sources, when available, are included in the PTS dataset. The supporting document detailing the methodologies used to obtain these symbols is included in Appendix A.
As organic content was reported for only a limited number of samples, a systematic classification based on measured organic content was not feasible. Instead, samples labelled as “peat” in the original NESCL reports were assumed to have high organic content and were categorized as “peat” in the dataset. These samples were visually classified based on texture, colour, and fibrous content rather than laboratory measurements. Figure 6 presents the relative proportions of different soil categories within the dataset.
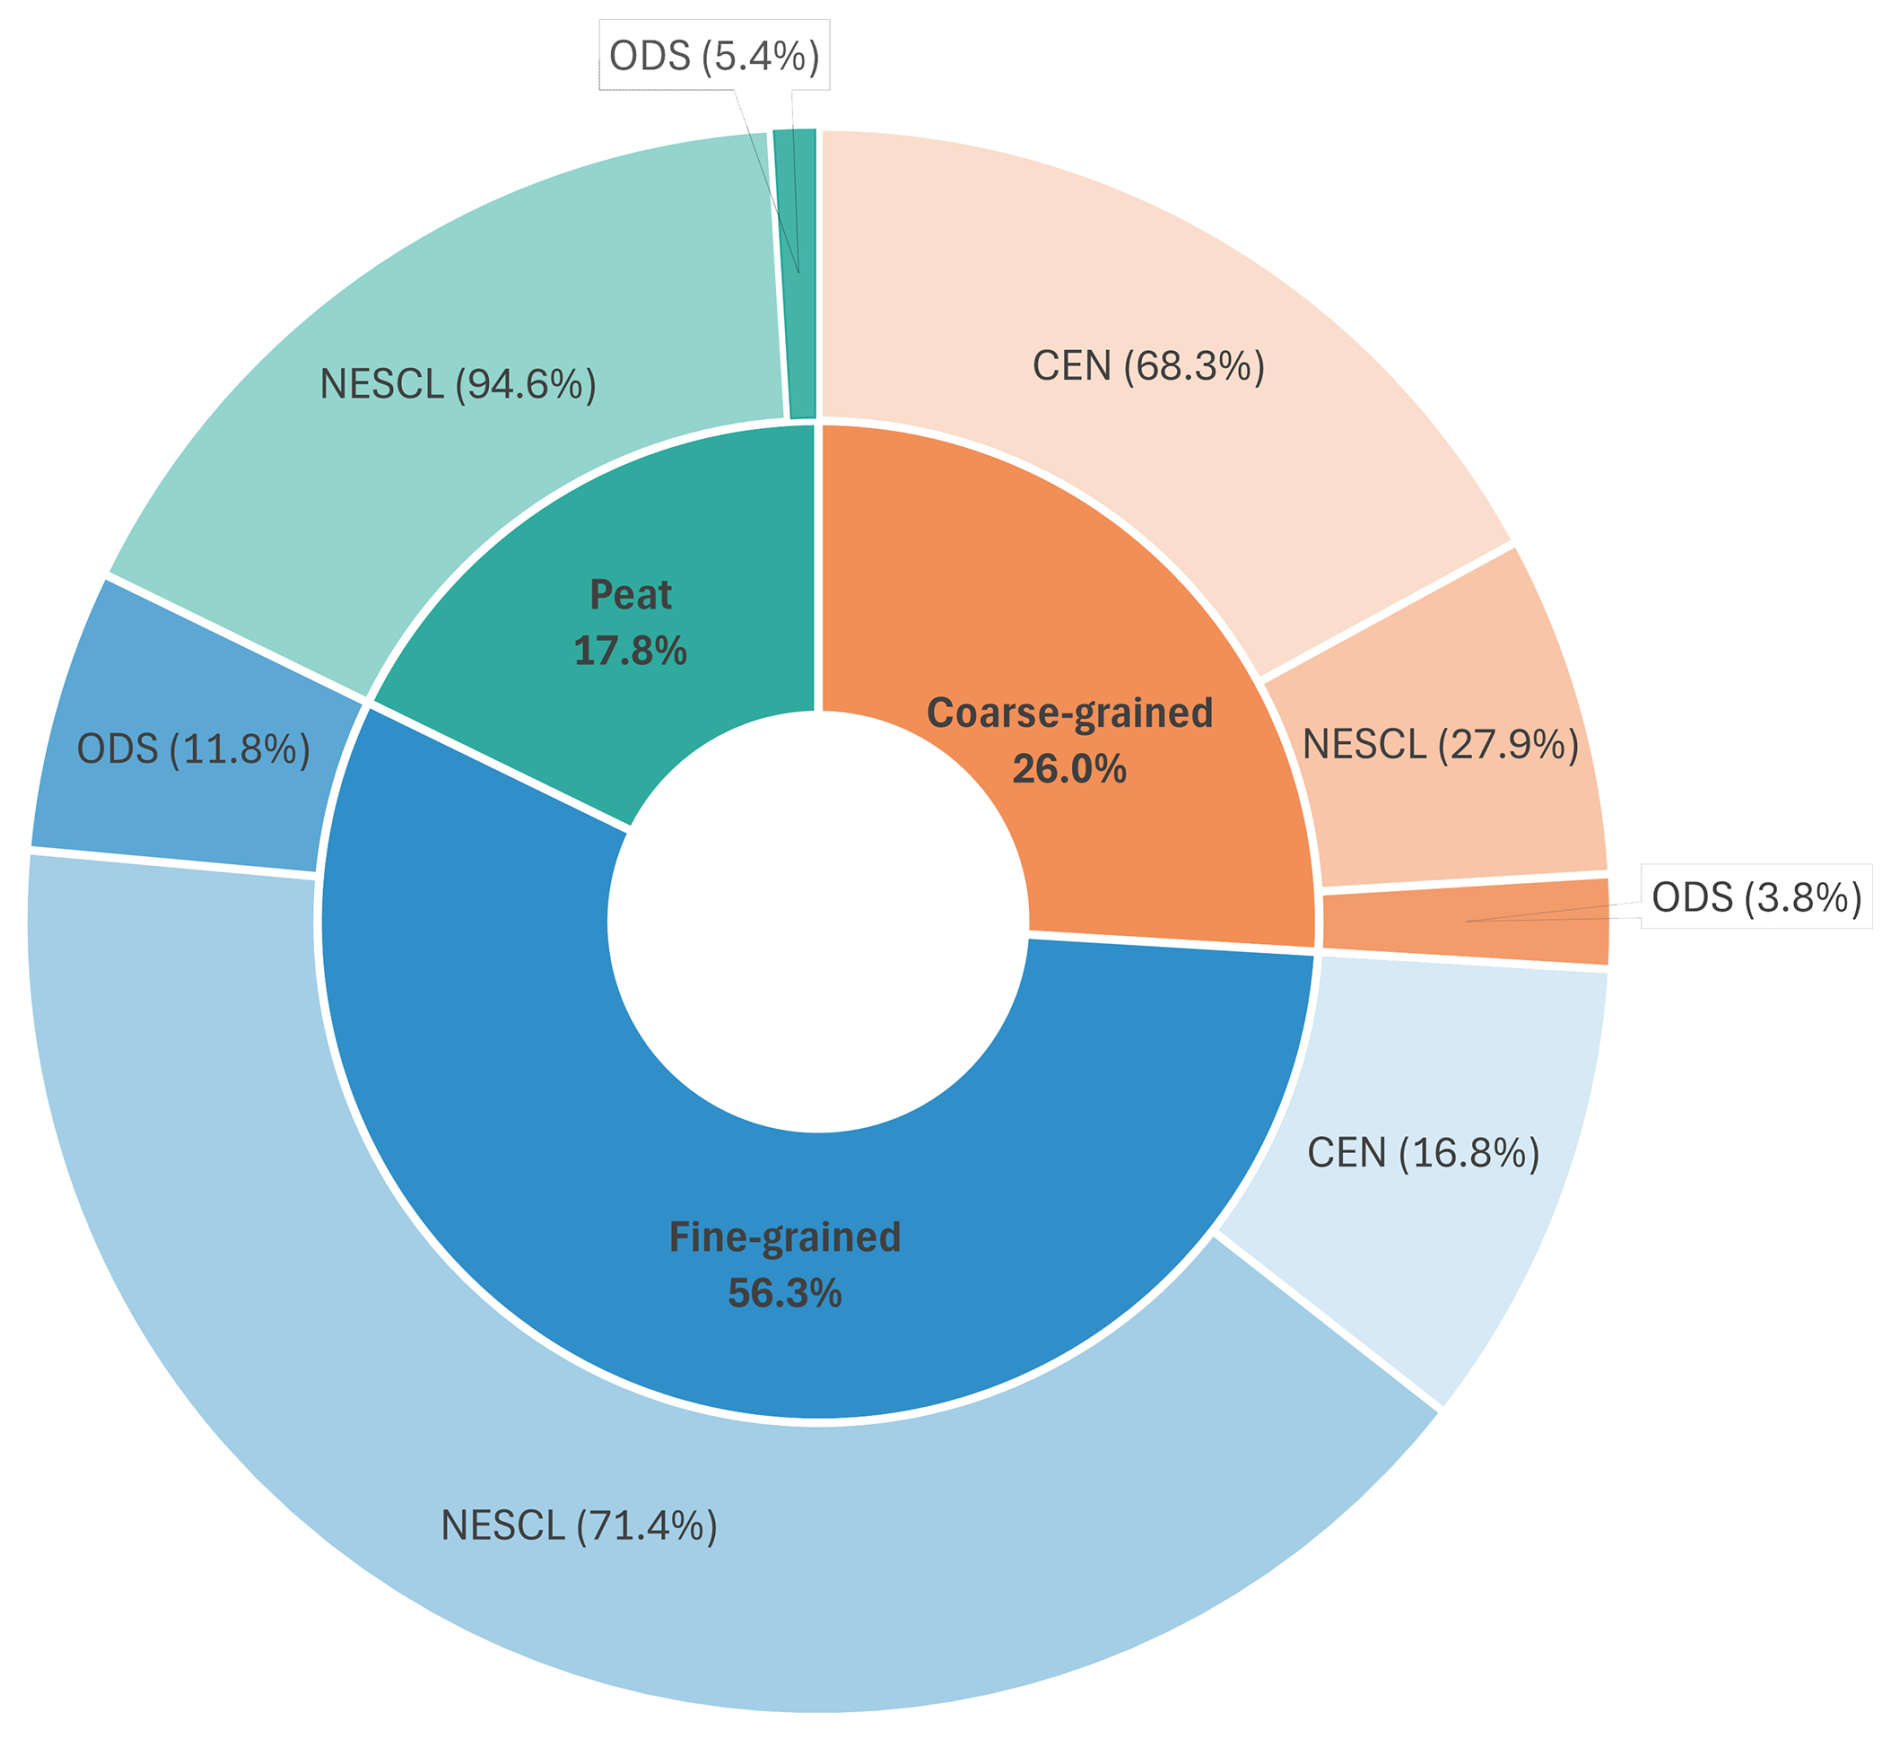
Figure 6The relative proportions of three different soil categories within the PTS dataset and their distribution among various sources.
3.2.2 Index properties
Information on soil texture, including the fractions of gravel, sand, and fines (and, in some cases, further divided into silt and clay), were among the properties most consistently reported in the original sources and included in PTS dataset. In some instances, Atterberg limits were reported for samples with significant fines content. However, these properties are not uniformly reported across all samples, resulting in incomplete data.
Measurements of sample dimensions and mass (if included in the original sources) were included in the dataset and used to calculate the gravimetric water content and frozen bulk density. If sample measurements were not reported, the reported values for gravimetric water content and frozen bulk density were directly included in the dataset. Gravimetric water content and frozen bulk density were among the most consistently reported properties for the samples. These properties facilitated the calculation of the frozen void ratio (ef) for the samples. The determination of ef also requires the specific gravity (Gs) of the soil, which was measured for only a limited number of samples. In cases where a measured Gs was not reported for sedimentary samples, specific gravity values ranging from 2.6 to 2.7 were assumed based on recommendations from the original sources and typical values reported in the literature for sedimentary soils (Andersland and Ladanyi, 2003). For peat samples, a value of 1.5 was assumed, as recommended by the original data sources. For all the samples, the frozen void ratio (ef) was calculated using the following equation:
where w is the gravimetric water content (in %), Gs is the specific gravity of soil particles (dimensionless), ρw is the water density (1000 kg m−3), and ρf is the frozen bulk density (in kg m−3).
Properties such as w, ρf, and ef provide insight into permafrost conditions prior to thawing and serve as proxies for inferring the excess ground ice. These properties are commonly used as predictor variables to develop correlations for thaw strain. Table 2 summarizes the descriptive statistics for w, ρf, and ef across each soil group in the PTS dataset. Figure 7 illustrates the range and variability of these properties within each group, providing a visual comparison of their distribution. The data reveal that peat samples exhibit significantly different values compared to the other soil groups.
Table 2Descriptive statics of index properties including gravimetric water content (w), frozen bulk density (ρf), and frozen void ratio (ef) across three different soil groups in the PTS dataset.
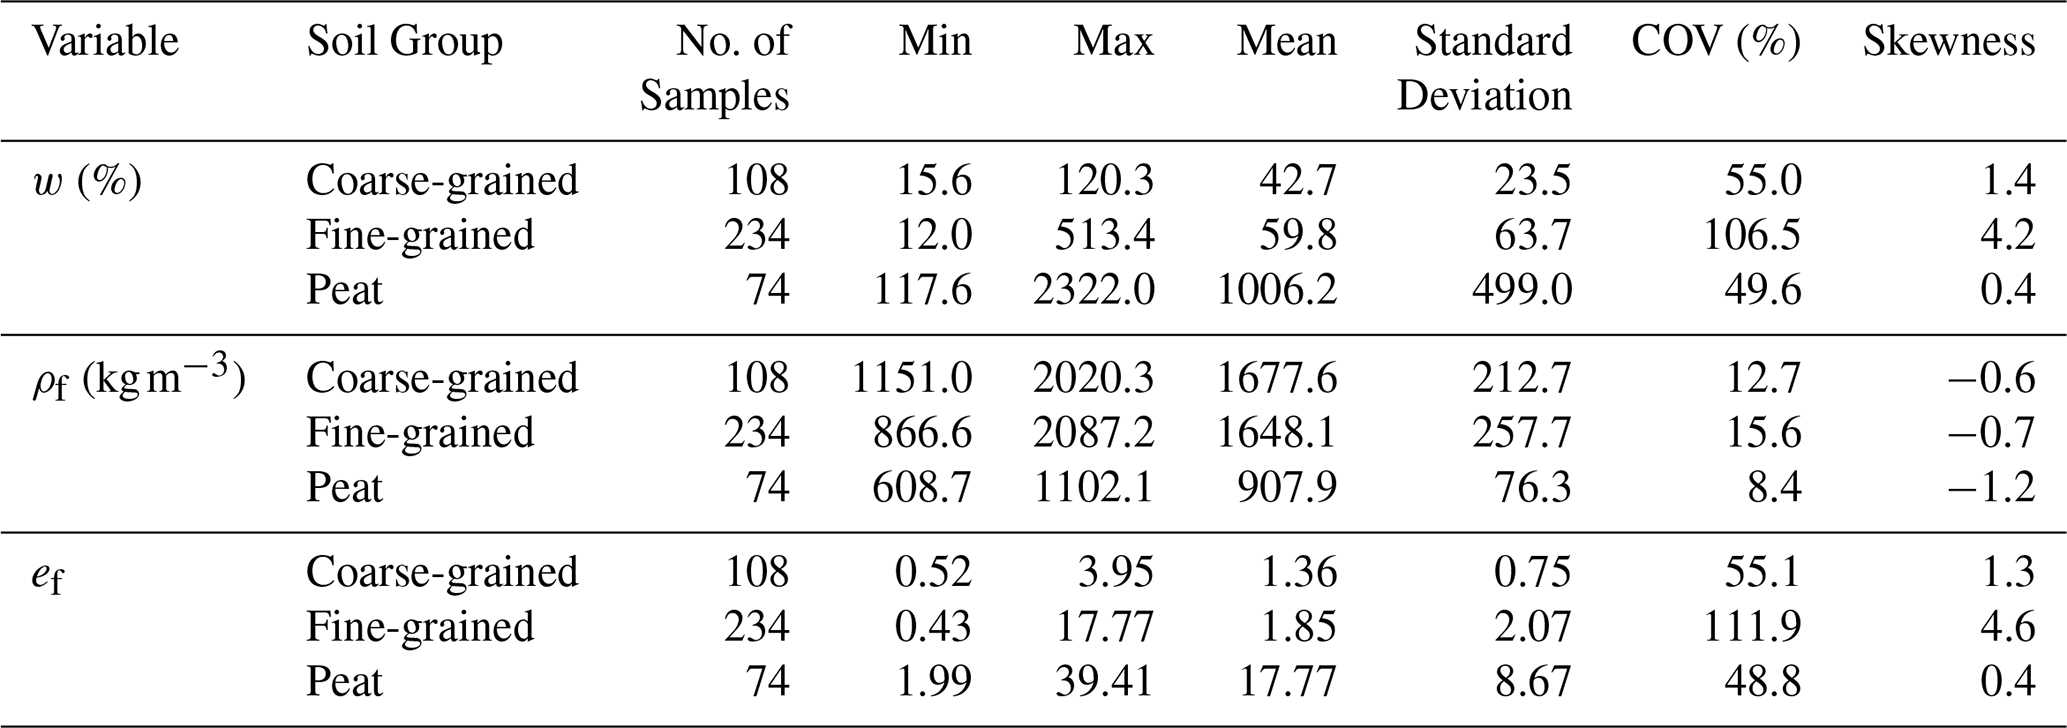
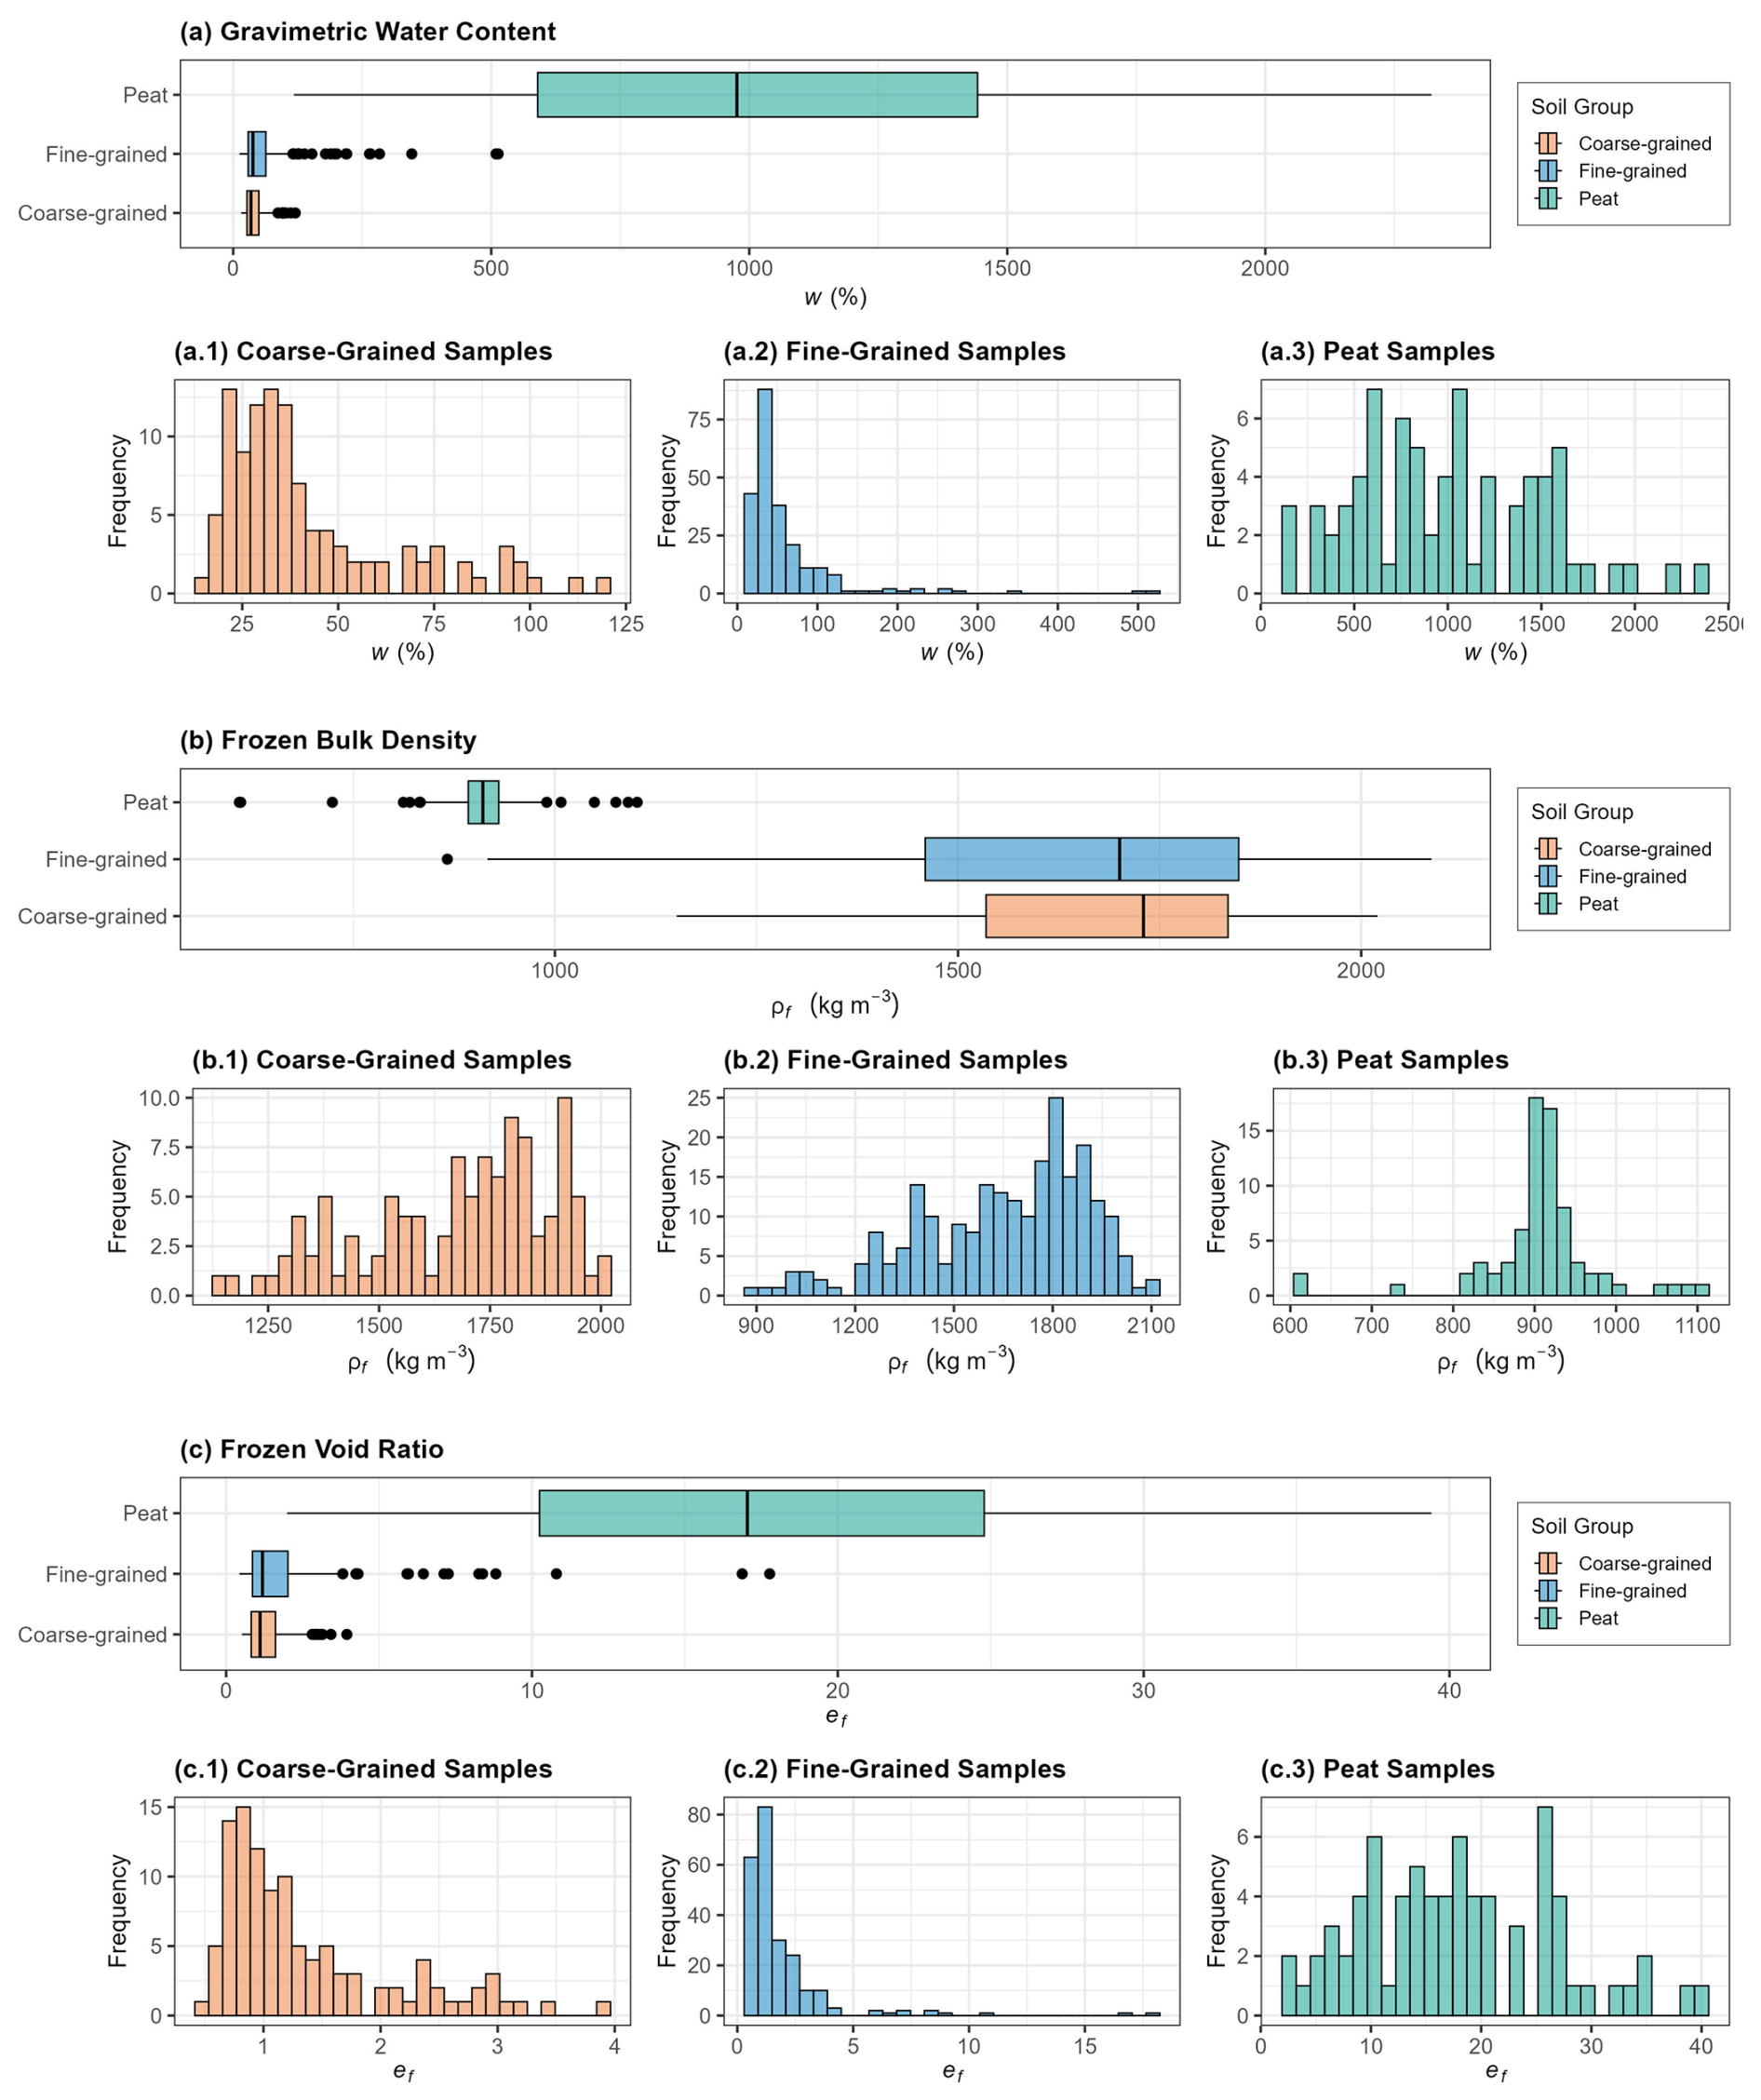
Figure 7Detailed comparison of index properties across three distinct soil groups. The figure includes box plots that illustrate the distribution of (a) gravimetric water content (w), (b) frozen bulk density (ρf), and (c) frozen void ratio (ef) within each group. Additionally, each box plot is accompanied by histograms for each variable illustrating its frequency distribution of corresponding index properties within each soil group.
For all three variables, fine-grained soils display the greatest variation around the mean, as evidenced by the higher coefficient of variation. Frozen bulk density shows less skewness compared to the other variables, with the greatest negative skewness being observed in peat samples followed by fine-grained and coarse-grained soils. For w and ef, the distribution of data around the mean is more relatively uniform for peat samples but is skewed with a pronounced right tail for fine-grained and coarse-grained soils. Obtained from samples across vast regions and encompassing significant variation, these data are valuable for fitting statistical distributions that best represent the observed variability and shape of the data. This is crucial for accurately modelling uncertainty and conducting probabilistic analyses related to thaw settlement. Moreover, the descriptive statistics can help assign more realistic deterministic values to these variables based on soil type.
3.2.3 Borehole data
Along with the tabulated data, the borehole logs were carefully examined, and relevant information was extracted. The PTS dataset includes information such as the borehole name, sample depth, and descriptions of soil and ground ice at the depths where samples were collected, all extracted from borehole logs. The supporting documents detailing the methodologies used to describe soil and ground ice are included in Appendix A.
3.3 Particle size distribution
Although the mass fractions of gravel, sand, and fines were consistently reported, detailed particle size distribution (PSD) data were available for only a subset of the samples. In total, PSD data were available for 92 samples. If available, detailed particle size distribution for the sample was extracted and stored in the “particle_size_distribution.csv” file within the PTS dataset. Including detailed PSD provides a comprehensive view of soil texture and enables the derivation of various parameters, thereby enhancing the future application of the data in diverse contexts.
3.4 Metadata and supplementary material
In addition to the sample properties and test results, the metadata for 91 boreholes, including their locations and references to the original reports containing data relevant to each borehole, are stored in the “borehole_locations_and_sources.csv” file within the PTS dataset. If the exact coordinate of a sampling location or borehole was not available, the approximate location of the site as described in the main source is included in the metadata. The coordinates of borehole locations were originally reported in different formats depending on the data source. For the NESCL data, coordinates were provided in degrees–minutes–seconds (DMS) format and were converted to decimal degrees for consistency. The CEN data typically reported coordinates directly in decimal degrees, usually with three decimal places. For boreholes from Yukon hazard mapping reports, coordinates were given in Universal Transverse Mercator (UTM) format, consisting of easting and northing values. All coordinates were converted to decimal degrees to standardize the format across the dataset and support integration with GIS tools. In some cases, while decimal precision may appear high (e.g. six decimal places), actual precision is likely lower and may vary depending on original mapping techniques.
3.5 Idealized stress strain behaviour
Using the methods outlined in Sect. 2.2 for formulating the stress–strain behaviour for different soil types, existing test results were used to construct an idealized stress–strain curve, which allowed for the extraction of thaw settlement parameters for each test, such as the one shown in Fig. 2. The idealization allowed for differentiating between the ice-rich and ice-poor behaviour during each test and obtaining void ratio or thaw strain as a function of vertical stress. Differentiation between ice-rich and ice-poor conditions was based on the approach established by Dumais and Konrad (2023), with further details provided in Sect. 3.5.1. Additionally, efforts were made to distinguish between the different components of thaw strain during each test, including phase change, excess water expulsion, and soil skeleton compression, using the idealized behaviour. The method used to separate and calculate these components is also described in Appendix A.
3.5.1 Thaw settlement parameters
Two parameters (A0 and a0) were derived from ε–σv plots using regression analysis. The linear segment of each curve was identified, and linear regression was applied to data points within this segment. A minimum of three loading steps was required for the regression. In cases where only three points were available, all were used. However, for tests with more than three points, an initial regression was performed using all points, and the R squared (R2) value was checked. If the R2 was satisfactory (greater than an arbitrary value of 0.98), the model was accepted. Otherwise, points were iteratively removed, starting with the exclusion of the lowest vertical stress, until an acceptable R2 was achieved or the minimum number of points was reached. In the final regression model, the intercept represented A0, and the slope represented a0.
In the context of void ratio–vertical stress plots, a linear relationship between the void ratio and the logarithm of vertical (effective) stress is generally identified as the best fit, as established in the literature (Dumais and Konrad, 2023; Nixon and Morgenstern, 1974; Yao et al., 2017). The onset of this linear relationship is marked by a threshold effective stress, commonly known as residual stress for soils with low permeability. Residual stress, an intrinsic soil characteristic, depends on soil texture and the initial ground ice content. It is believed that residual stress for ice-rich samples is relatively small but can be within a physically significant range for ice-poor samples (Dumais and Konrad, 2023; Nixon and Morgenstern, 1973).
To idealize the void ratio–effective stress relationship for each sample, linear regression was applied after logarithmically transforming the vertical stress. The resulting slope of this regression model was extracted as . Then, this regression model was used to differentiate between ice-rich and ice-poor behaviour and define the residual stress (i.e. the threshold vertical stress) as outlined by Dumais and Konrad (2023). To achieve this, the initial thawed void ratio (), which is defined as the void ratio immediately after thawing under undrained conditions and represents volume change solely due to phase change, was used to extrapolate a hypothetical threshold vertical stress for each sample. If the obtained value was greater than 1 kPa, the sample was classified as ice-poor, and this predicted vertical stress was considered the threshold vertical stress. Conversely, if the predicted value was inappreciable (e.g. lower than 1 kPa, which was used as the cutoff in this study), ice-rich behaviour was assumed, and the threshold vertical stress was set to 1 kPa, representing a reasonably low and physically comprehensible value.
While for coarse-grained soils, the concept of residual stress is less relevant due to their high permeability, to ensure consistency in obtaining comparative parameters across all soil types, the method outlined by Dumais and Konrad (2023) to obtain residual stress in fine-grained soils was applied to all three soil types.
After defining the threshold vertical stress, the developed regression model was used to predict the threshold thawed void ratio (, as shown in Fig. 2b) for each sample. For ice-poor samples, the threshold thawed void ratio is equal to the initial thawed void ratio. For ice-rich samples, the threshold thawed void ratio is generally lower than the initial thawed void ratio, with the difference representing the excess ice within the sample.
For each sample, comparative parameters such as A0, a0, , , σv-th, and sample condition (indicating ice-rich or ice-poor behaviour) have been stored in the PTS dataset. These parameters form a basis for future comparisons of thaw settlement characteristics across various soil types. A detailed comparison of these parameters is discussed in Sect. 4.
3.5.2 Inferred sample condition (ice-rich versus ice-poor)
Approximately 70 % of coarse-grained, 60 % of fine-grained, and 70 % of peat samples were classified as exhibiting ice-rich behaviour. This high percentage may be partly due to a sampling and testing bias in thaw settlement tests, where the emphasis is often on ice-rich samples to better represent worst-case scenarios. Figure 8 provides a comparison of the distribution of frozen void ratios in ice-rich and ice-poor samples, along with a histogram showing the occurrence of these two conditions across varying fines fractions and soil classifications, which serve as proxies for soil texture and composition.
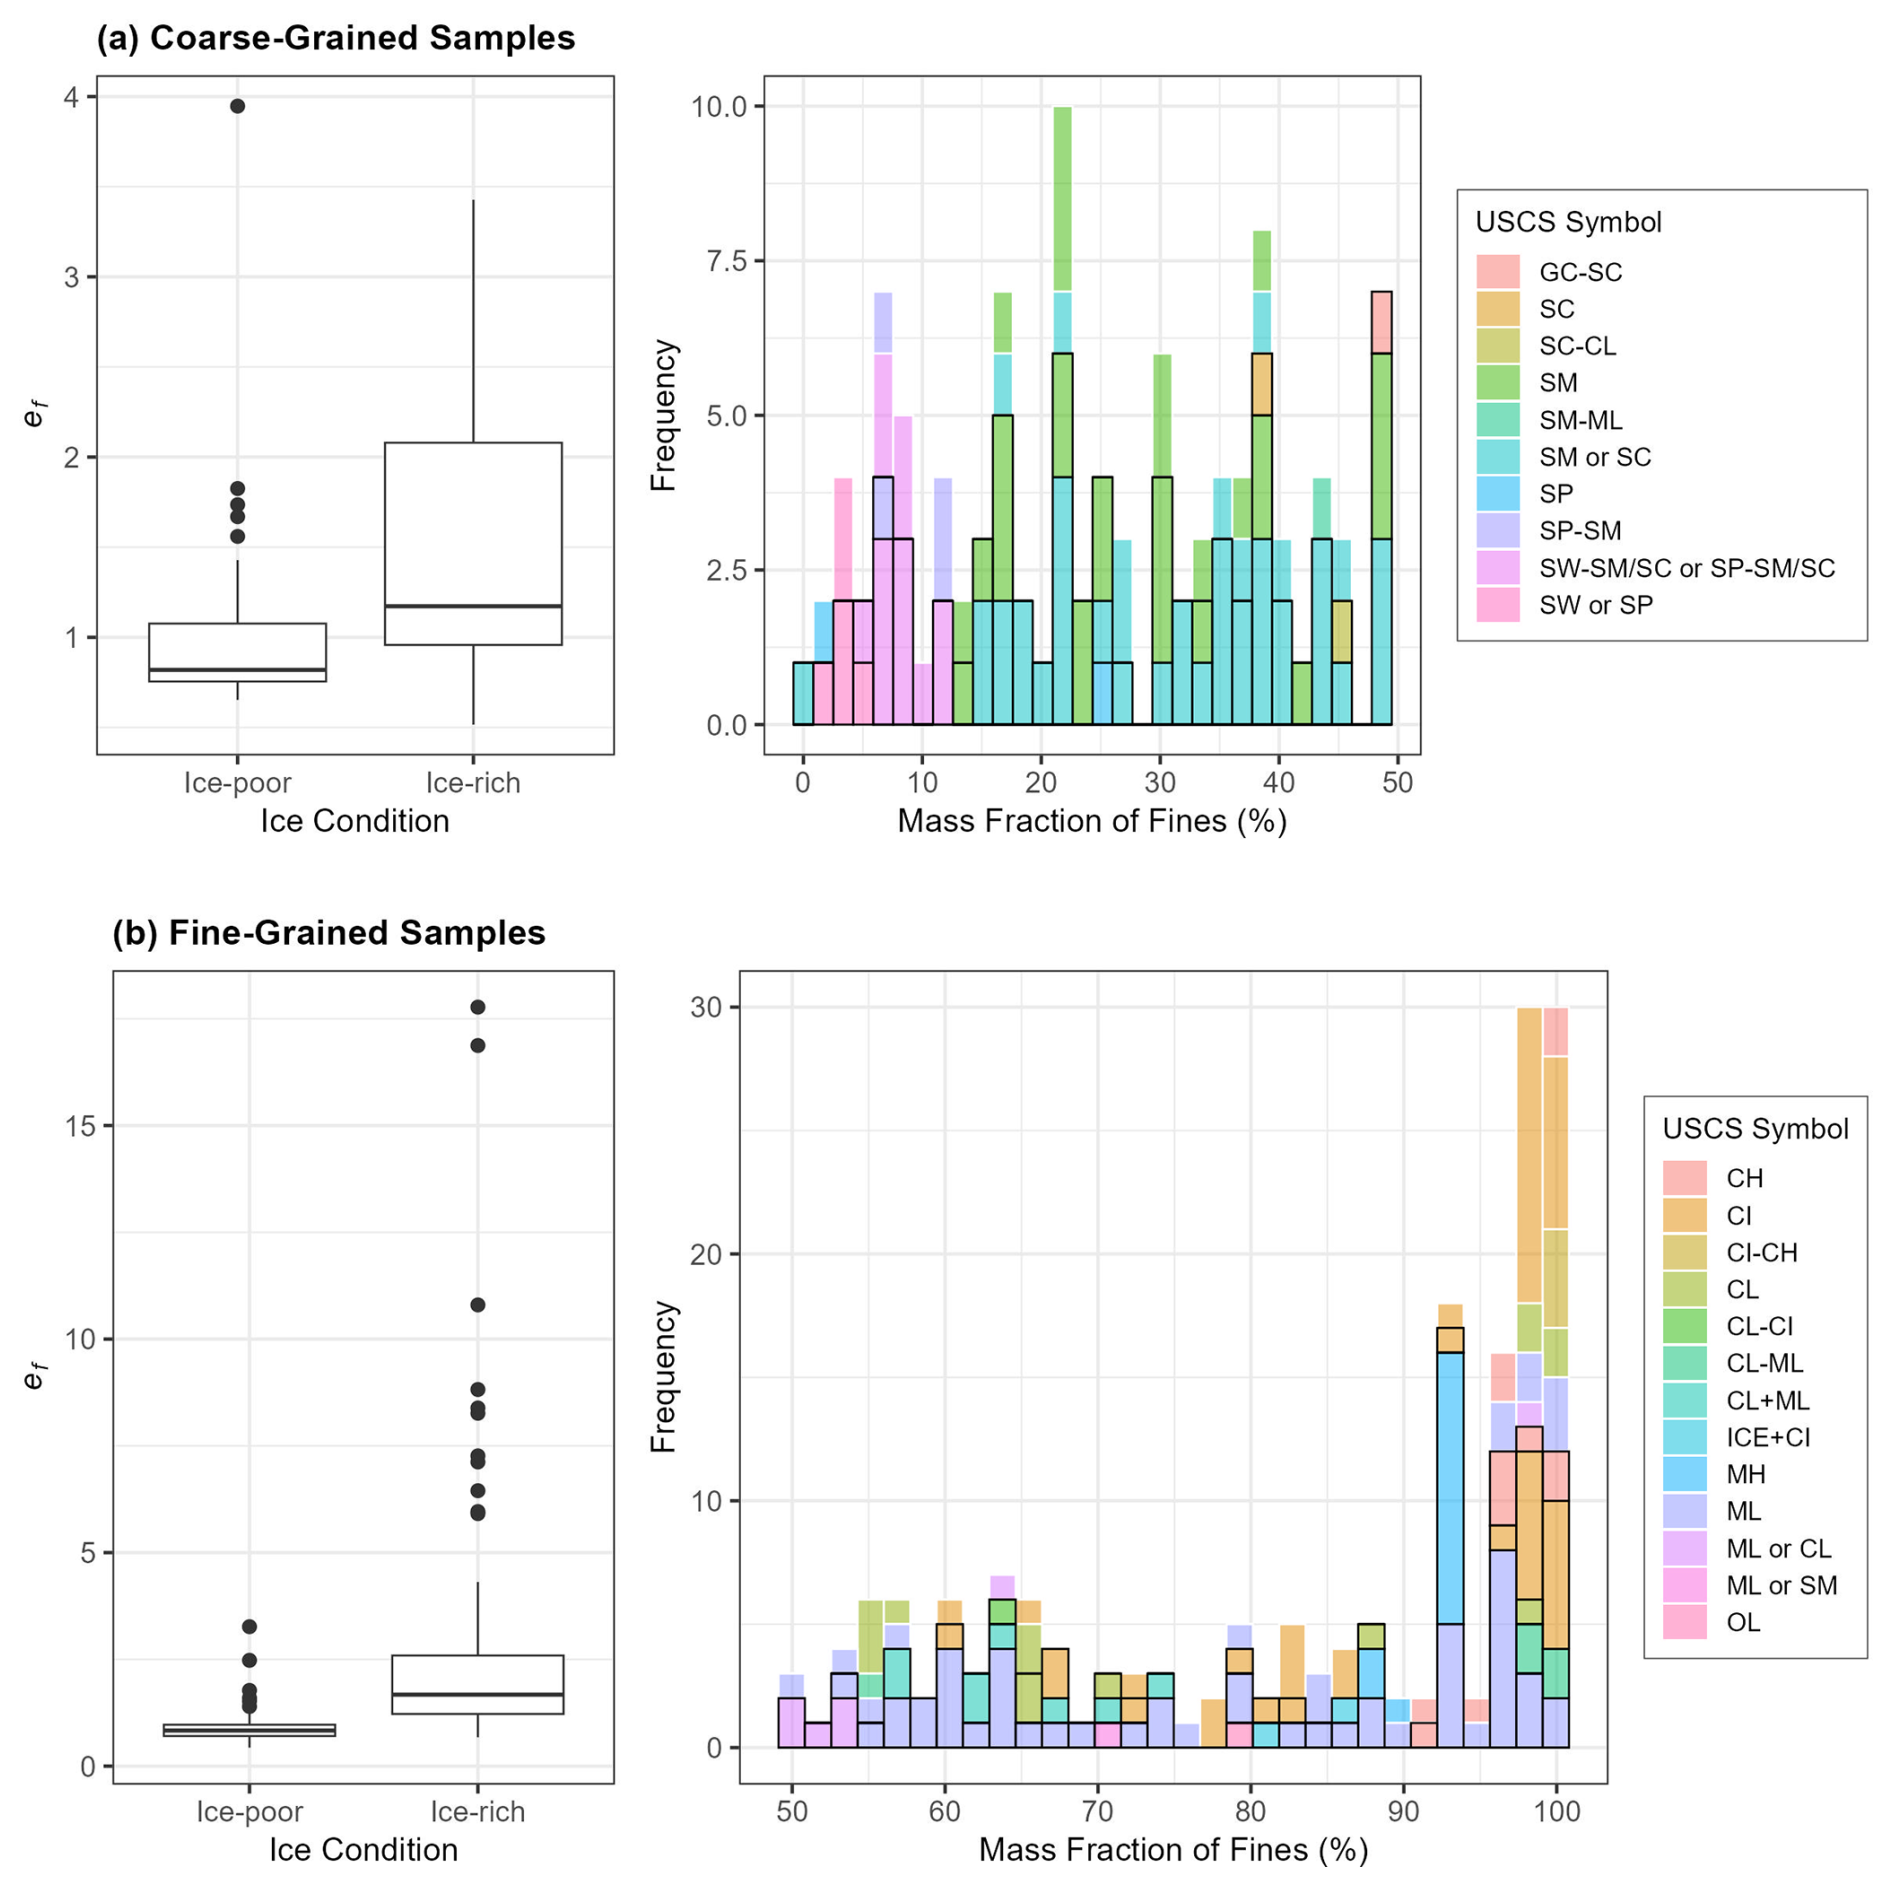
Figure 8The box plots on the left side illustrate the distribution of frozen void ratio (ef) for ice-rich and ice-poor conditions in the PTS dataset for (a) coarse-grained samples and (b) fine-grained samples. The frequency histogram on the right side illustrates the distribution of fines content for (a) coarse-grained and (b) fine-grained samples. The histogram series represent multiple USCS soil symbols (with varying fill colours). The ice condition is indicated by the border style: bold borders represent ice-rich samples, while thin white borders represent ice-poor sample. This allows for visual comparison of soil classification, fines content, and ice condition across the dataset.
The box plots in Fig. 8 show that for both coarse-grained and fine-grained soils, the frozen void ratio in ice-poor samples exhibits a relatively narrow range. Additionally, ice-rich and ice-poor conditions are well differentiated by ef, with minimal overlap between the two classes, especially in fine-grained soils. Conversely, the histograms in Fig. 8 illustrate the fact that ice-rich and ice-poor behaviour occurs uniformly across various fines fractions and soil classifications, indicating that the presence of excess ice in samples is independent of soil composition based on the PTS dataset. However, it is generally understood that fine-grained soils are more prone to higher ground ice content due to the formation of segregated ice.
3.5.3 Thaw strain estimation
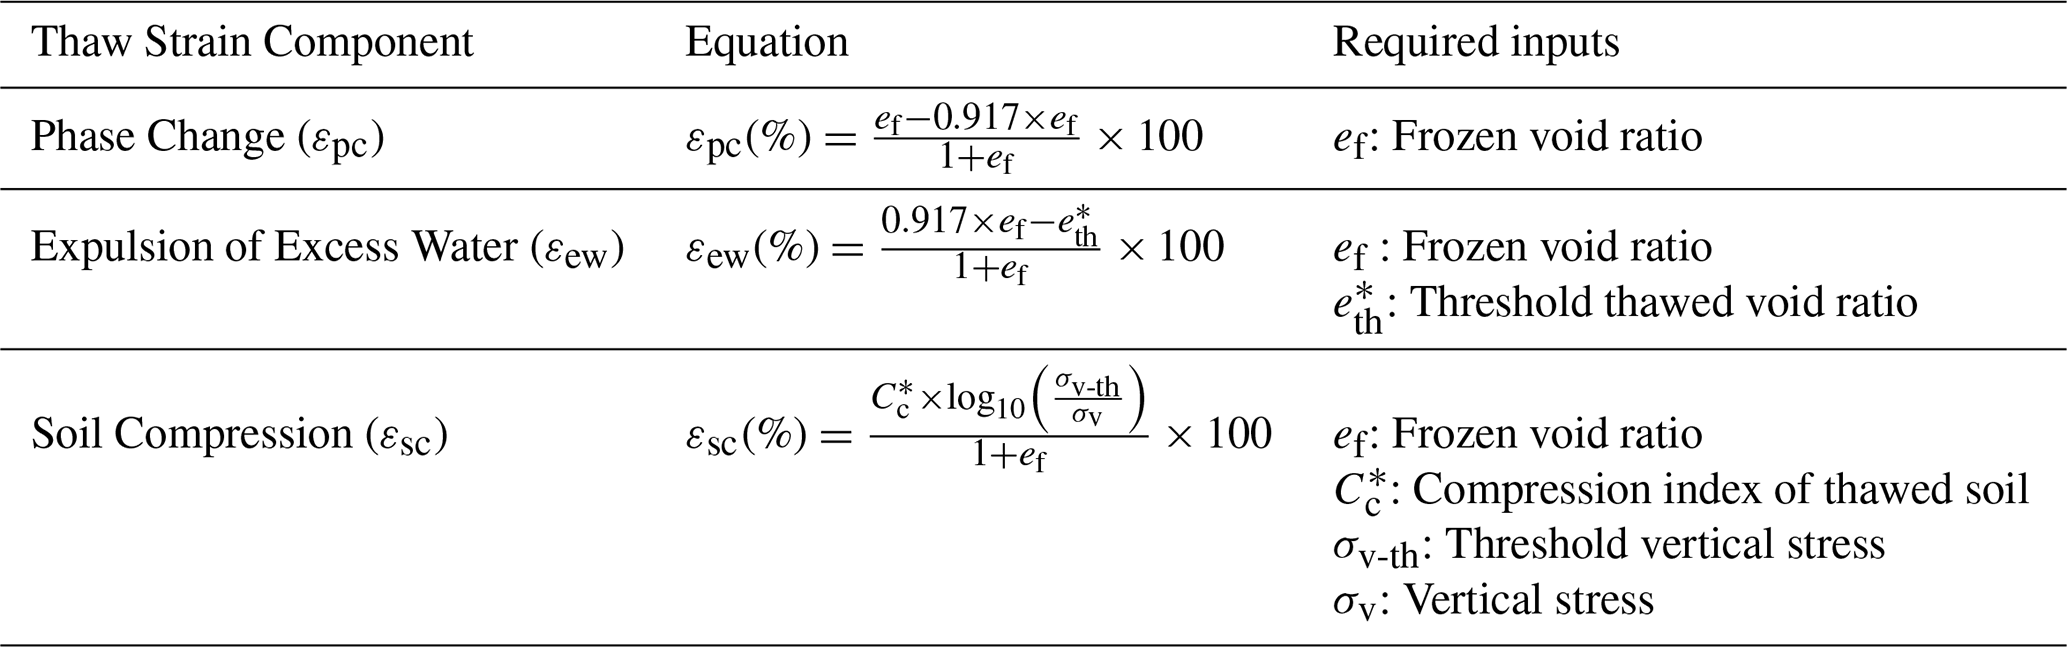
The idealized void ratio–vertical stress relationship enables the approximate differentiation of various thaw strain components contributing to the total thaw strain under a given applied vertical stress. Using the idealized e–log 10(σv) relationship allows for the derivation of the portion of thaw strain attributed to phase change (εpc), the expulsion of excess water (εew), and soil compression (εsc) at any given vertical stress. These components can be calculated using the equations summarized in Table 3 based on parameters and properties such as , , and σv-th and ef. The detailed derivation of these equations is discussed in Appendix A.
Table 3Summary of equations used for calculating various components of thaw strain based on e–log 10(σv) idealization.
In some thaw settlement tests from the PTS dataset, measured thaw strains were found to be lower than εpc, indicating that swelling exceeded the anticipated volume reduction due to phase change after thawing. These samples were flagged in the PTS dataset with a binary variable, “swelling_flag”, where a TRUE value was assigned to these samples. For most of these samples, swelling occurred only during the initial loading steps; however, in some cases, it persisted even after an additional load was applied to the thawed samples.
Swelling, when it occurred, was detectable only in ice-poor samples. In ice-rich conditions, swelling was not detectable as it was fully compensated by the volume reduction due to phase change and the expulsion of excess water. Swelling was identified in 79 out of 148 samples classified as ice-poor, with approximately 80 % being fine-grained, 14 % coarse-grained, and 6 % peat samples.
Figure 9 illustrates the distribution of frozen void ratios for swelling and non-swelling samples in ice-poor coarse-grained and fine-grained categories as well as the occurrence of swelling across varying fines fractions and soil classifications. The box plots indicate that, in both soil categories, swelling was predominantly observed in denser samples. The histograms demonstrate that swelling was primarily noted in samples with higher fine fractions. For coarse-grained samples, swelling was most commonly observed in silty sands, while in fine-grained samples, it was primarily identified in those with over 90 % of fines content, classified as high or medium plasticity clay, indicating the dependency of swelling on the soil's composition.
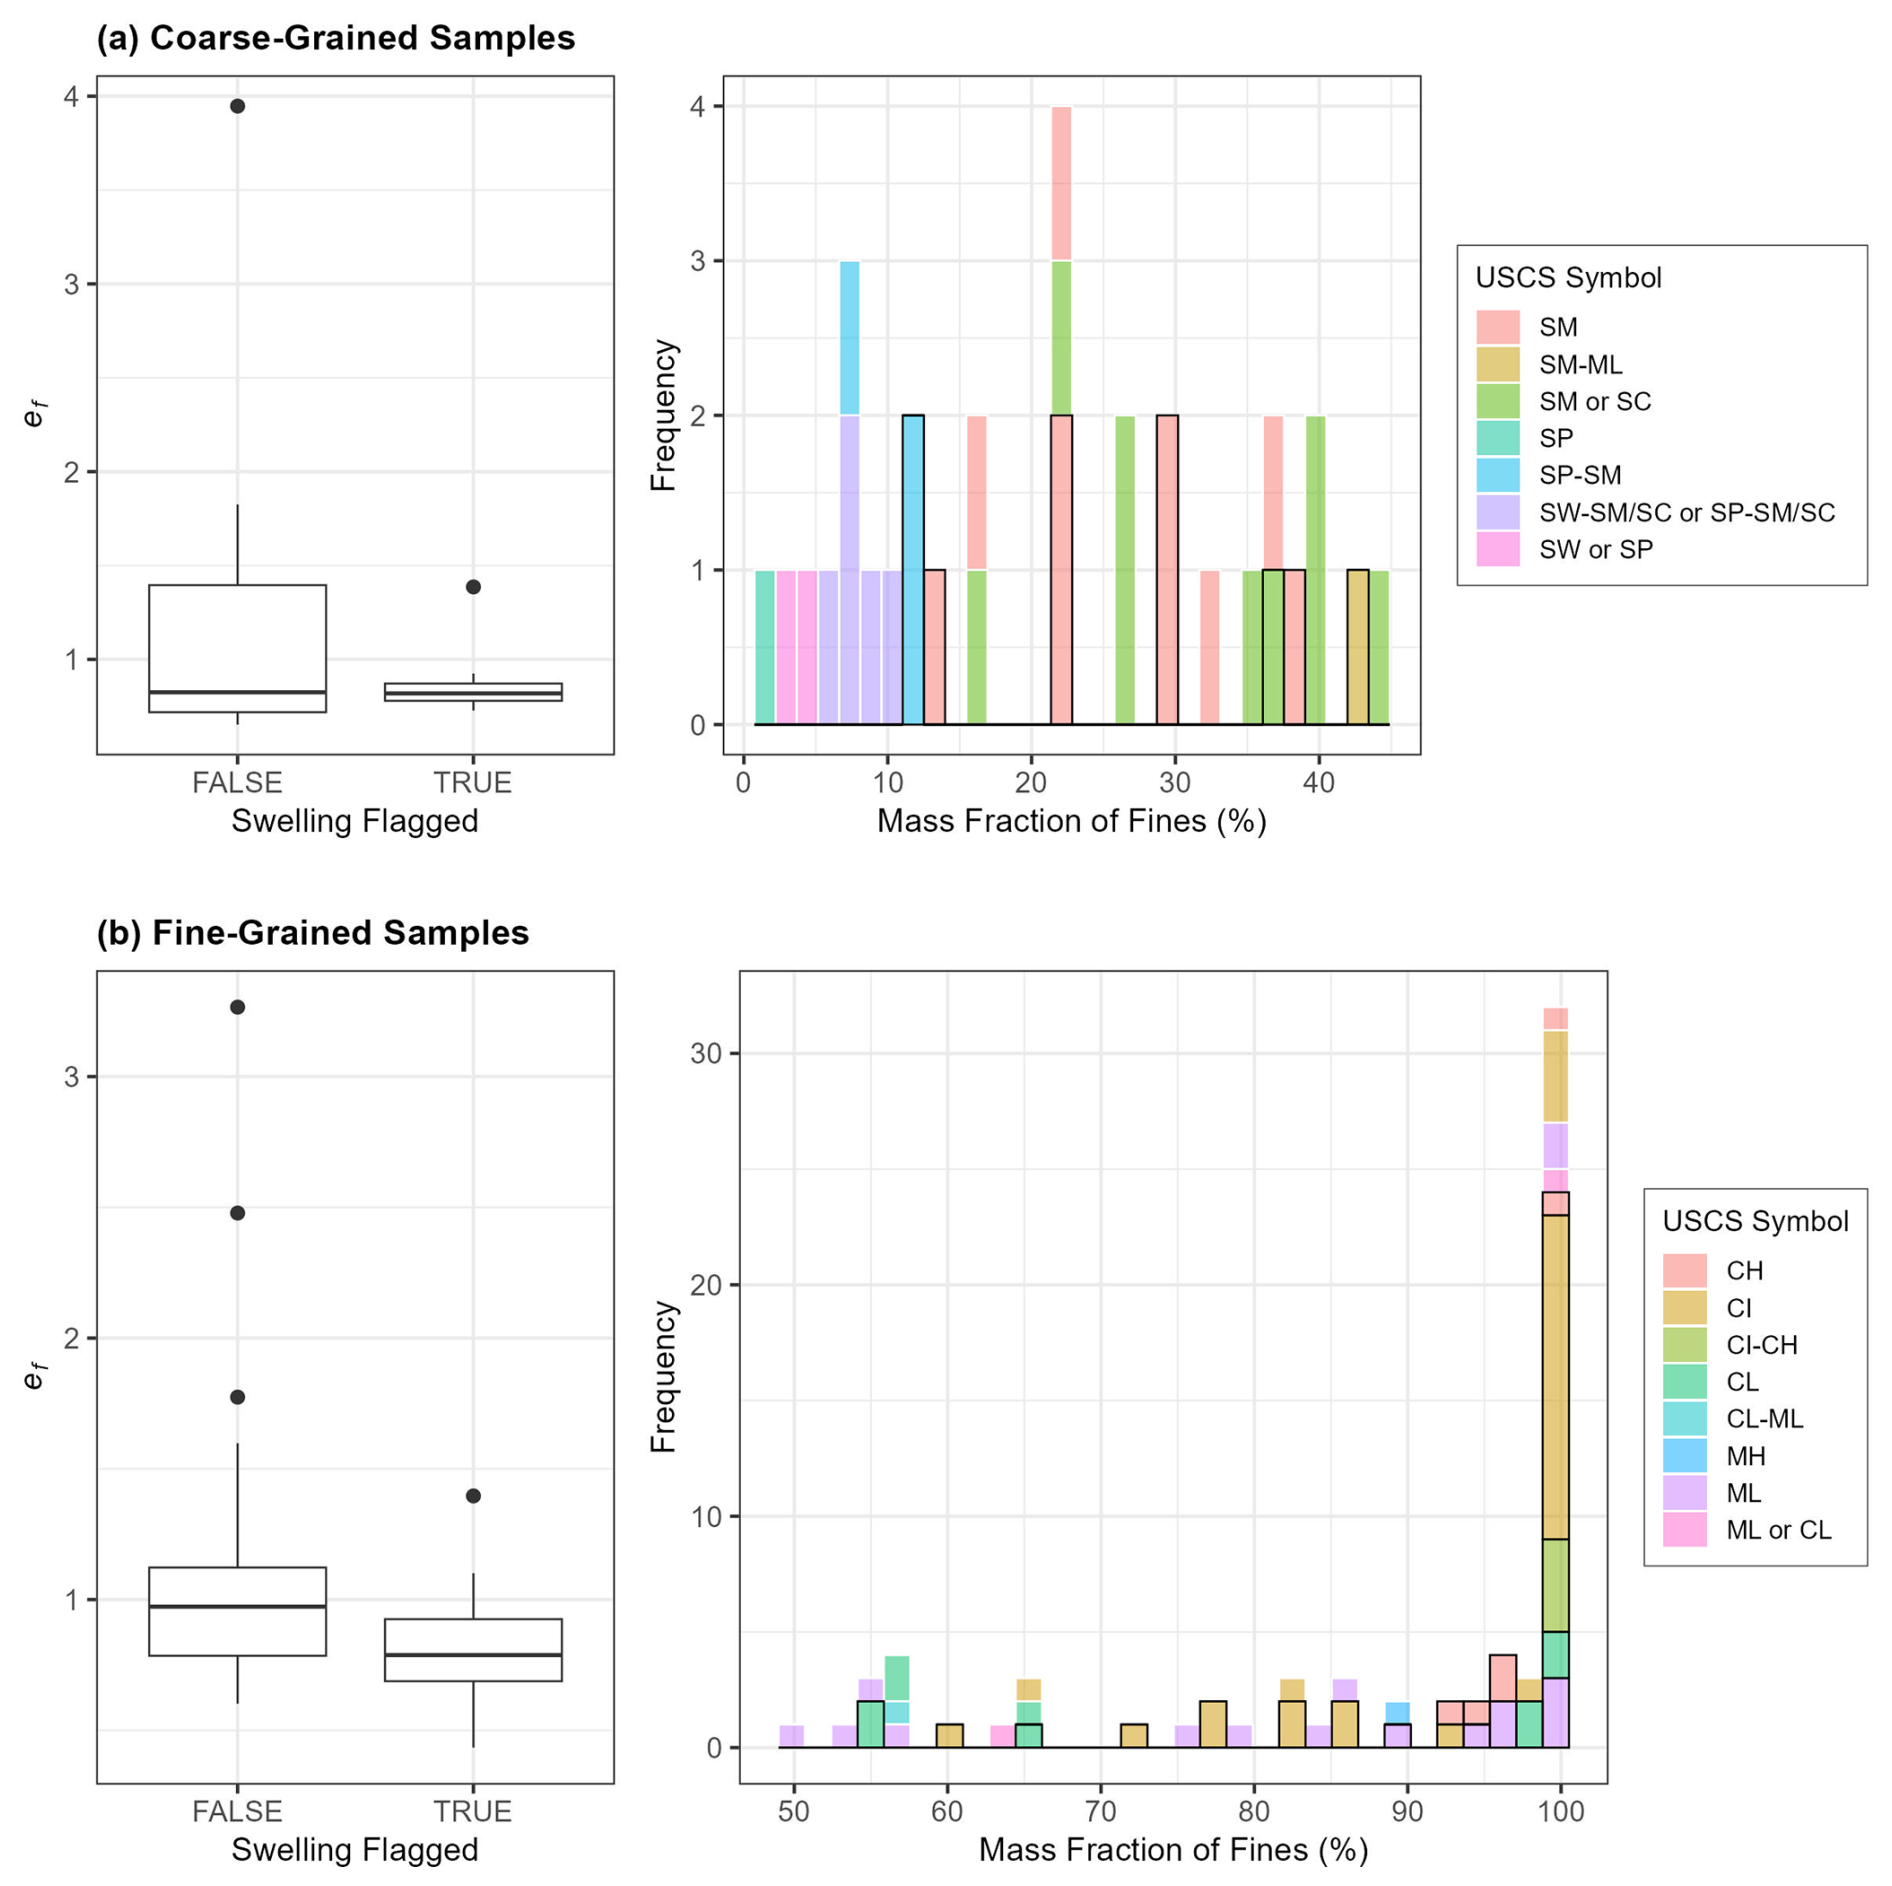
Figure 9The box plots on the left side illustrate the distribution of frozen void ratio (ef) for samples in the PTS dataset, indicative of swelling (TRUE) and no swelling (FALSE) for (a) ice-poor coarse-grained samples and (b) ice-poor fine-grained samples. The frequency histogram on the right side shows the distribution of fines content for (a) ice-poor coarse-grained and (b) ice-poor fine-grained samples. The histogram series represent USCS soil group (indicated by fill colour), and the border style indicates swelling condition: bold borders represent samples where swelling was observed, and thin white borders represent samples without swelling. This visual representation enables comparison of soil classification, fines content, and swelling behaviour across the dataset.
Using the idealized e–log 10(σv) relationship, the total thaw strain at any given vertical stress can be calculated by summing the three main components of thaw strain (see Table 3) as follows:
where ef is the frozen void ratio, is threshold thawed void ration, is the compression index of thawed soil, σv-th is the threshold vertical stress (in kPa), and σv is the vertical stress (in kPa).
Alternatively, using the idealized ε–σv relationship, the total thaw strain at any given vertical stress can be estimated as follows:
where A0 is thaw strain parameter (in %), a0 is the coefficient of volume compressibility (in % per kPa), and σv is the vertical stress (in kPa).
Upon determining the thaw settlement parameters, both Eqs. (2) and (3) can be used to estimate thaw strain at a given vertical stress. However, since the idealized e–log 10(σv) relationship better captures the overall nonlinear stress–strain behaviour of permafrost samples across a wider range of vertical stresses, Eq. (2) provides more accurate estimates of thaw strain, particularly at lower vertical stress values, compared to Eq. (3).
For each thaw settlement test, various components of thaw strain were calculated and included in the PTS dataset, providing insight into the contribution of each component to the total thaw strain. A vertical pressure of 100 kPa was selected to determine the portion of thaw strain attributed to soil compression. A visualization of these variables across different soil groups is provided in Appendix A for further details.
Figure 10 depicts the distribution of A0 and a0 values across various soil categories, while Table 4 provides a summary of the descriptive statistics for these parameters within each category. An analysis of the overall range and mean value of A0 reveals no significant differences between coarse-grained and fine-grained soils, with most samples having A0 values below 30 %. However, peat samples exhibit approximately double the mean value compared to other soil types, with the A0 value for the majority of samples exceeding 30 %.
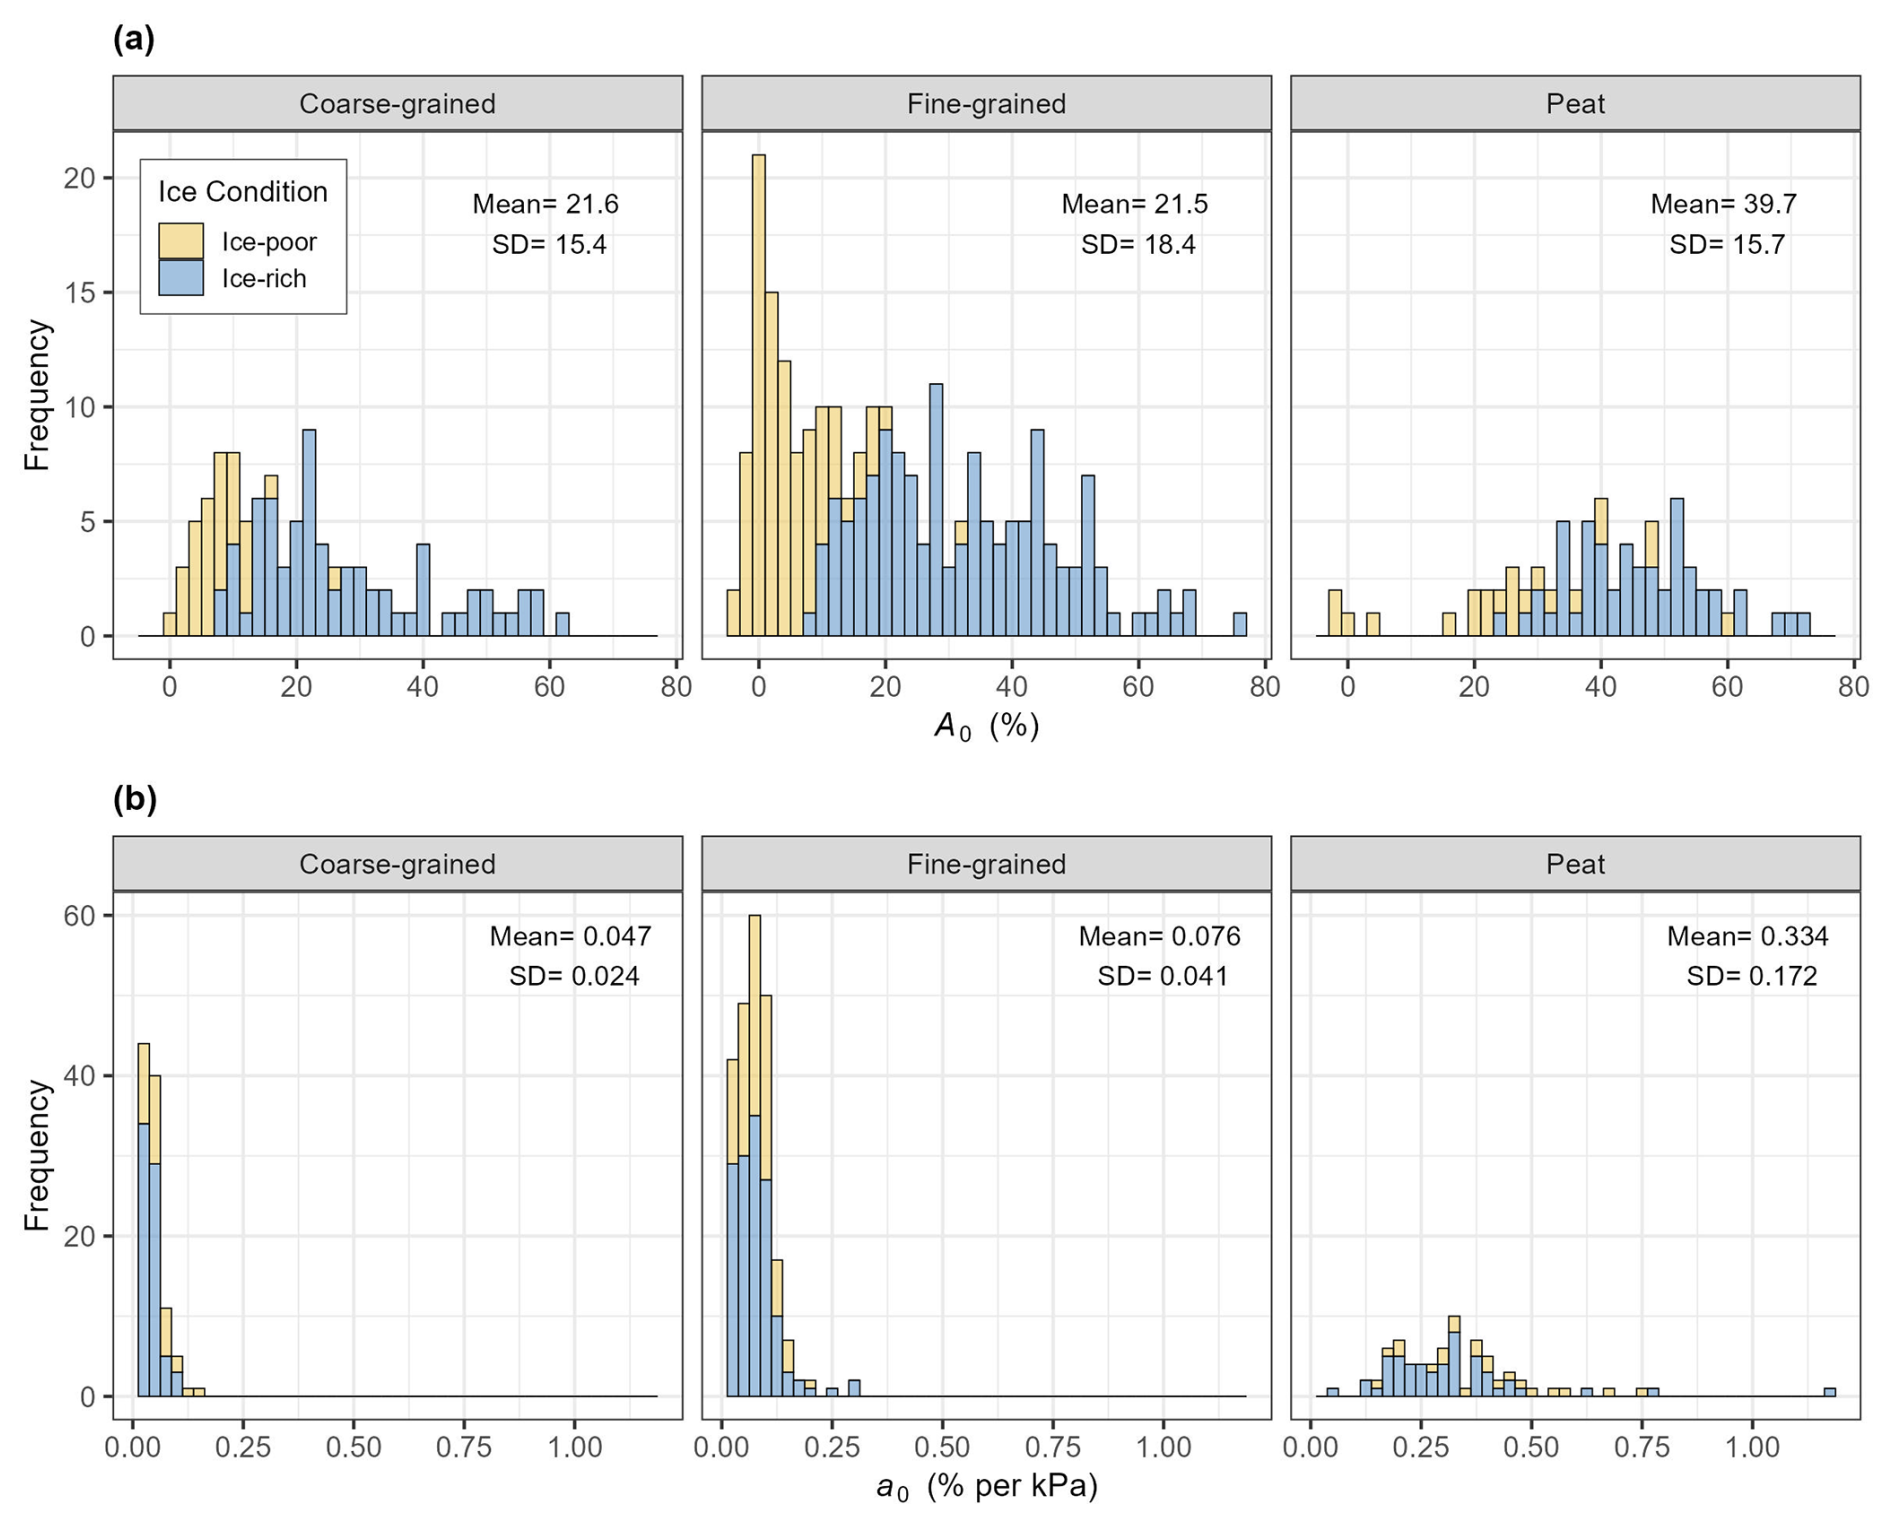
Figure 10Frequency histograms of (a) the thaw strain parameter (A0) and (b) the coefficient of volume compressibility (a0) across three main soil groups. Different colours represent the ice conditions, highlighting the lower values of A0 in ice-poor conditions compared to samples classified as ice-rich. For a0, both ice-rich and ice-poor samples exhibit similar ranges within each soil group; however, the mean value of a0 is higher for peat compared to mineral soils and for fine-grained soils compared to coarse-grained soils.
Table 4The descriptive statistics for the thaw strain parameter (A0) and the coefficient of volume compressibility (a0).
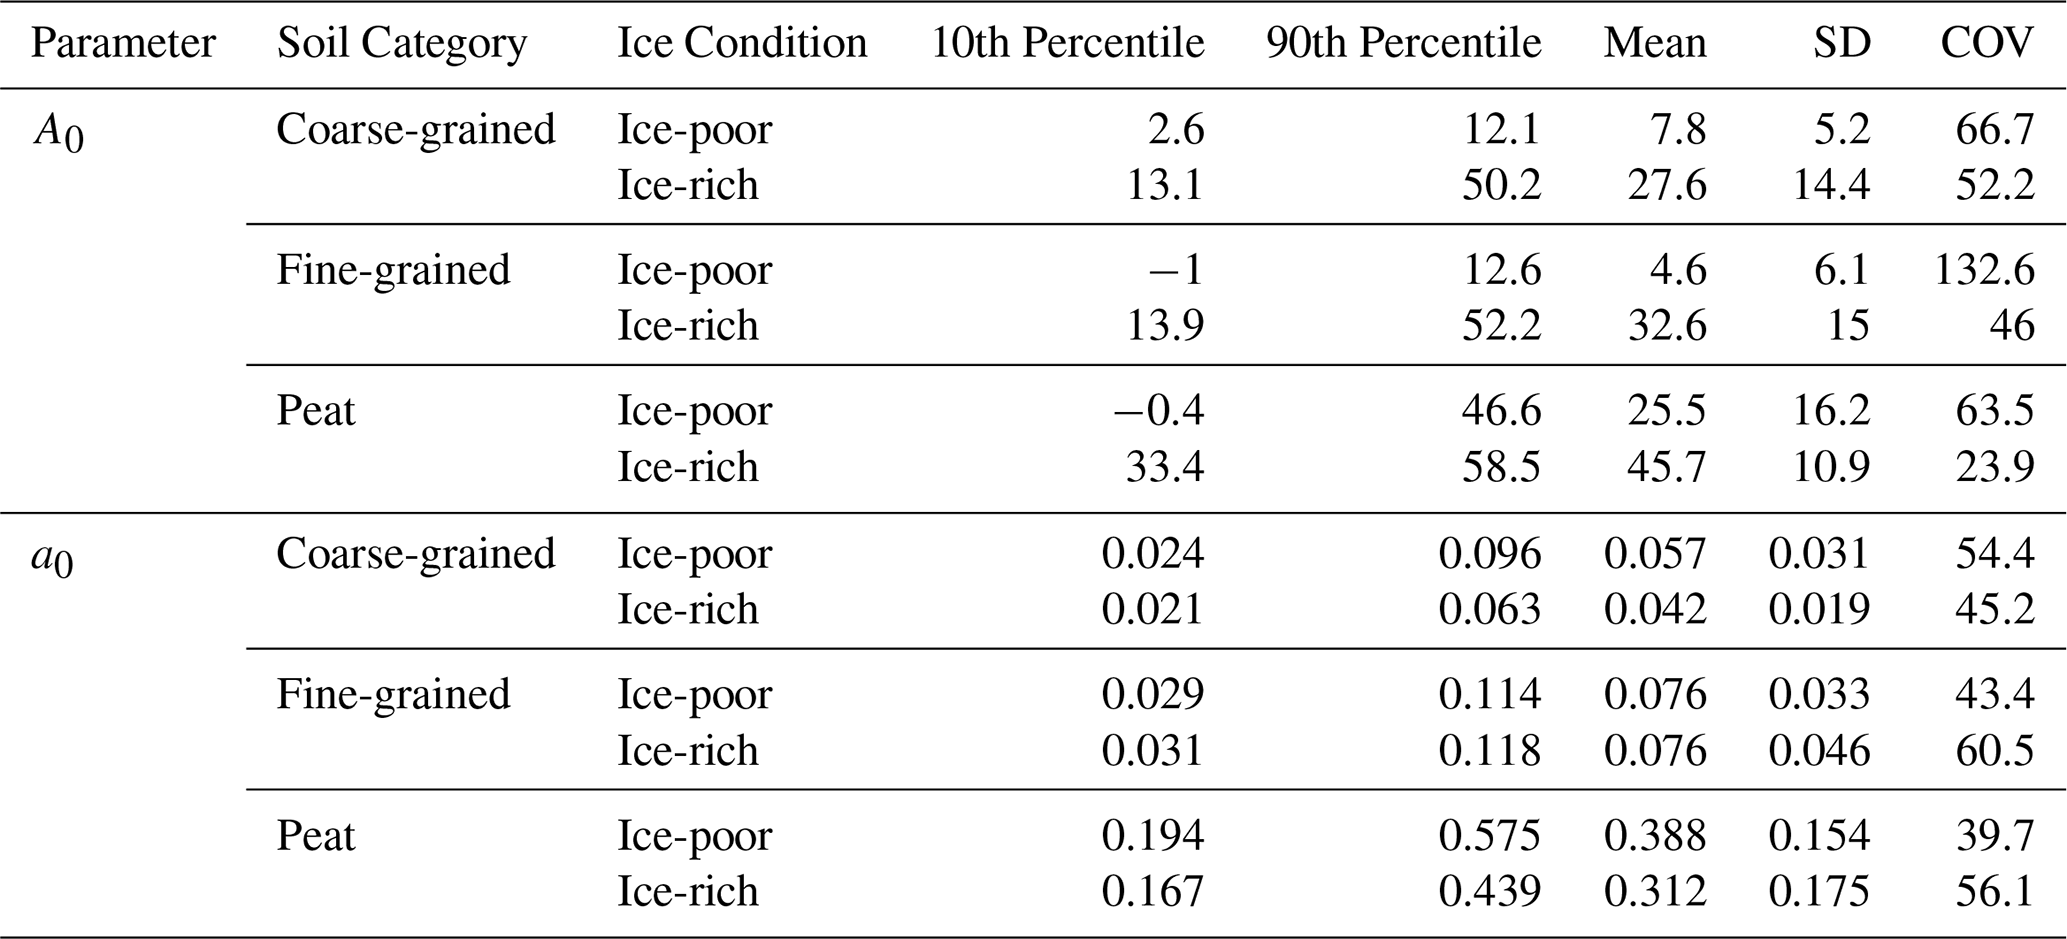
Note that these measures are based on a subset of data with definitive A0 and a0 values obtained from linear regression models fitted to test results with R2 values greater than 0.8. Models with R2 values of less than 0.8 were excluded as the corresponding A0 values may be inaccurate due to weak fit.
In coarse-grained and fine-grained soils, Fig. 10a demonstrates a marked disparity in A0 values under ice-poor versus ice-rich conditions. The mean A0 value for ice-rich samples is notably higher – about 4 times greater for coarse-grained soils and 7 times greater for fine-grained soils – compared to ice-poor samples. Analysis of the 10th and 90th percentiles of A0 reveals minimal overlap in the range of A0 for ice-poor and ice-rich conditions within these two soil categories. The midpoint of the 90th percentile for A0 in ice-poor soils and the 10th percentile for A0 in ice-rich soils serves as a practical threshold for differentiating between these conditions and is approximately 12.6 % for coarse-grained soils and 13.3 % for fine-grained soils. For peat samples, there is some overlap in A0 values between ice-rich and ice-poor conditions, specifically from 33.4 % (the 10th percentile for ice-rich conditions) to 46.6 % (the 90th percentile for ice-poor conditions). The mean value of A0 for ice-rich peat samples is almost 2 times greater than ice-poor samples. The distinction in A0 values between ice-rich and ice-poor conditions, with less evident influence from soil type, highlights the parameter's strong dependence on ground-ice content rather than soil composition.
Representing the compressibility of the samples, the range of a0 is substantially different across the three soil groups, with notable distinctions between peat samples and mineral soils. Fine-grained samples exhibit a compressibility that is approximately 1.7 times higher than coarse-grained samples. Peat samples, in contrast, show compressibility values that are 7.1 times higher than coarse-grained samples and 4.4 times higher than fine-grained samples. For each soil category, the a0 values display only minor variations in range and mean values between ice-rich and ice-poor samples. The mean compressibility values are 0.047 %, 0.076 %, and 0.334 % per kPa for coarse-grained, fine-grained, and peat samples, respectively. These mean compressibility values can be used to refine thaw strain estimation through empirical methods, allowing for adjustments based on the applied vertical stress and soil type.
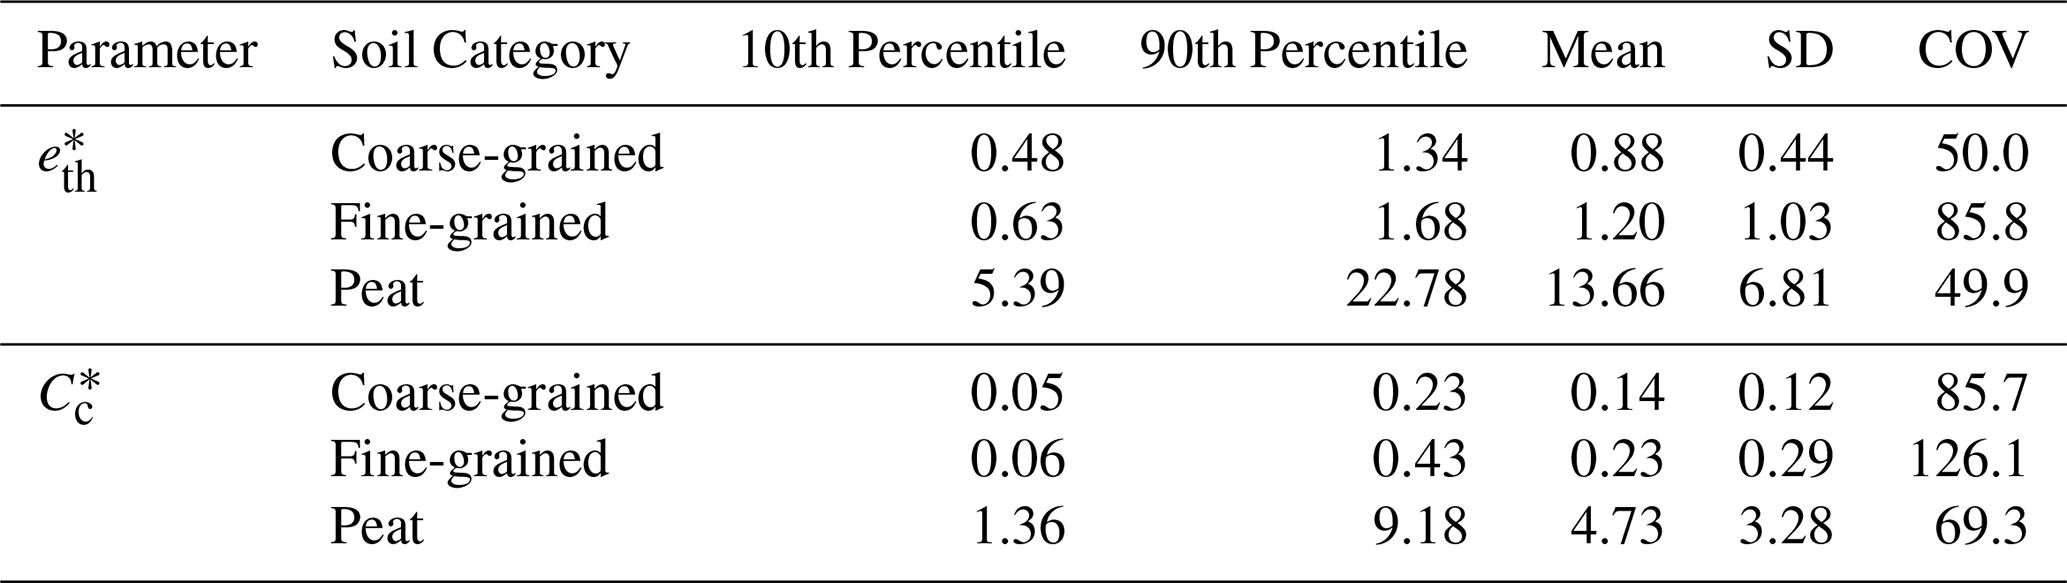
Figure 11 depicts the distribution of and values across various soil categories, while Table 5 provides a summary of the descriptive statistics for these parameters within each category. The analysis of reveals minimal differences between coarse-grained and fine-grained soils, with most samples having values below 1.5. Peat samples exhibit the highest values, with a mean value of 13.66, which is 15.5 times higher than coarse-grained soils and 11.4 times higher than fine-grained soils. Unlike the A0 parameter, shows a less distinct separation between ice-rich and ice-poor conditions, with overlapping ranges observed across both groups.
When comparing the values, which represent soil compressibility similarly to a0, notable variations are also observed between soil categories. Peat samples have the highest values, with a mean value of 4.73, which is approximately 33.8 times higher than that of coarse-grained soils and 20.6 times higher than fine-grained soils. The coefficient of variation (COV) for is the highest in coarse-grained and fine-grained soils, indicating greater relative variability, while peat samples exhibit moderate variability. A comparison between ice-rich and ice-poor samples reveals no specific trends in based on ice content, underscoring the parameter's dependence on soil composition rather than ice conditions.
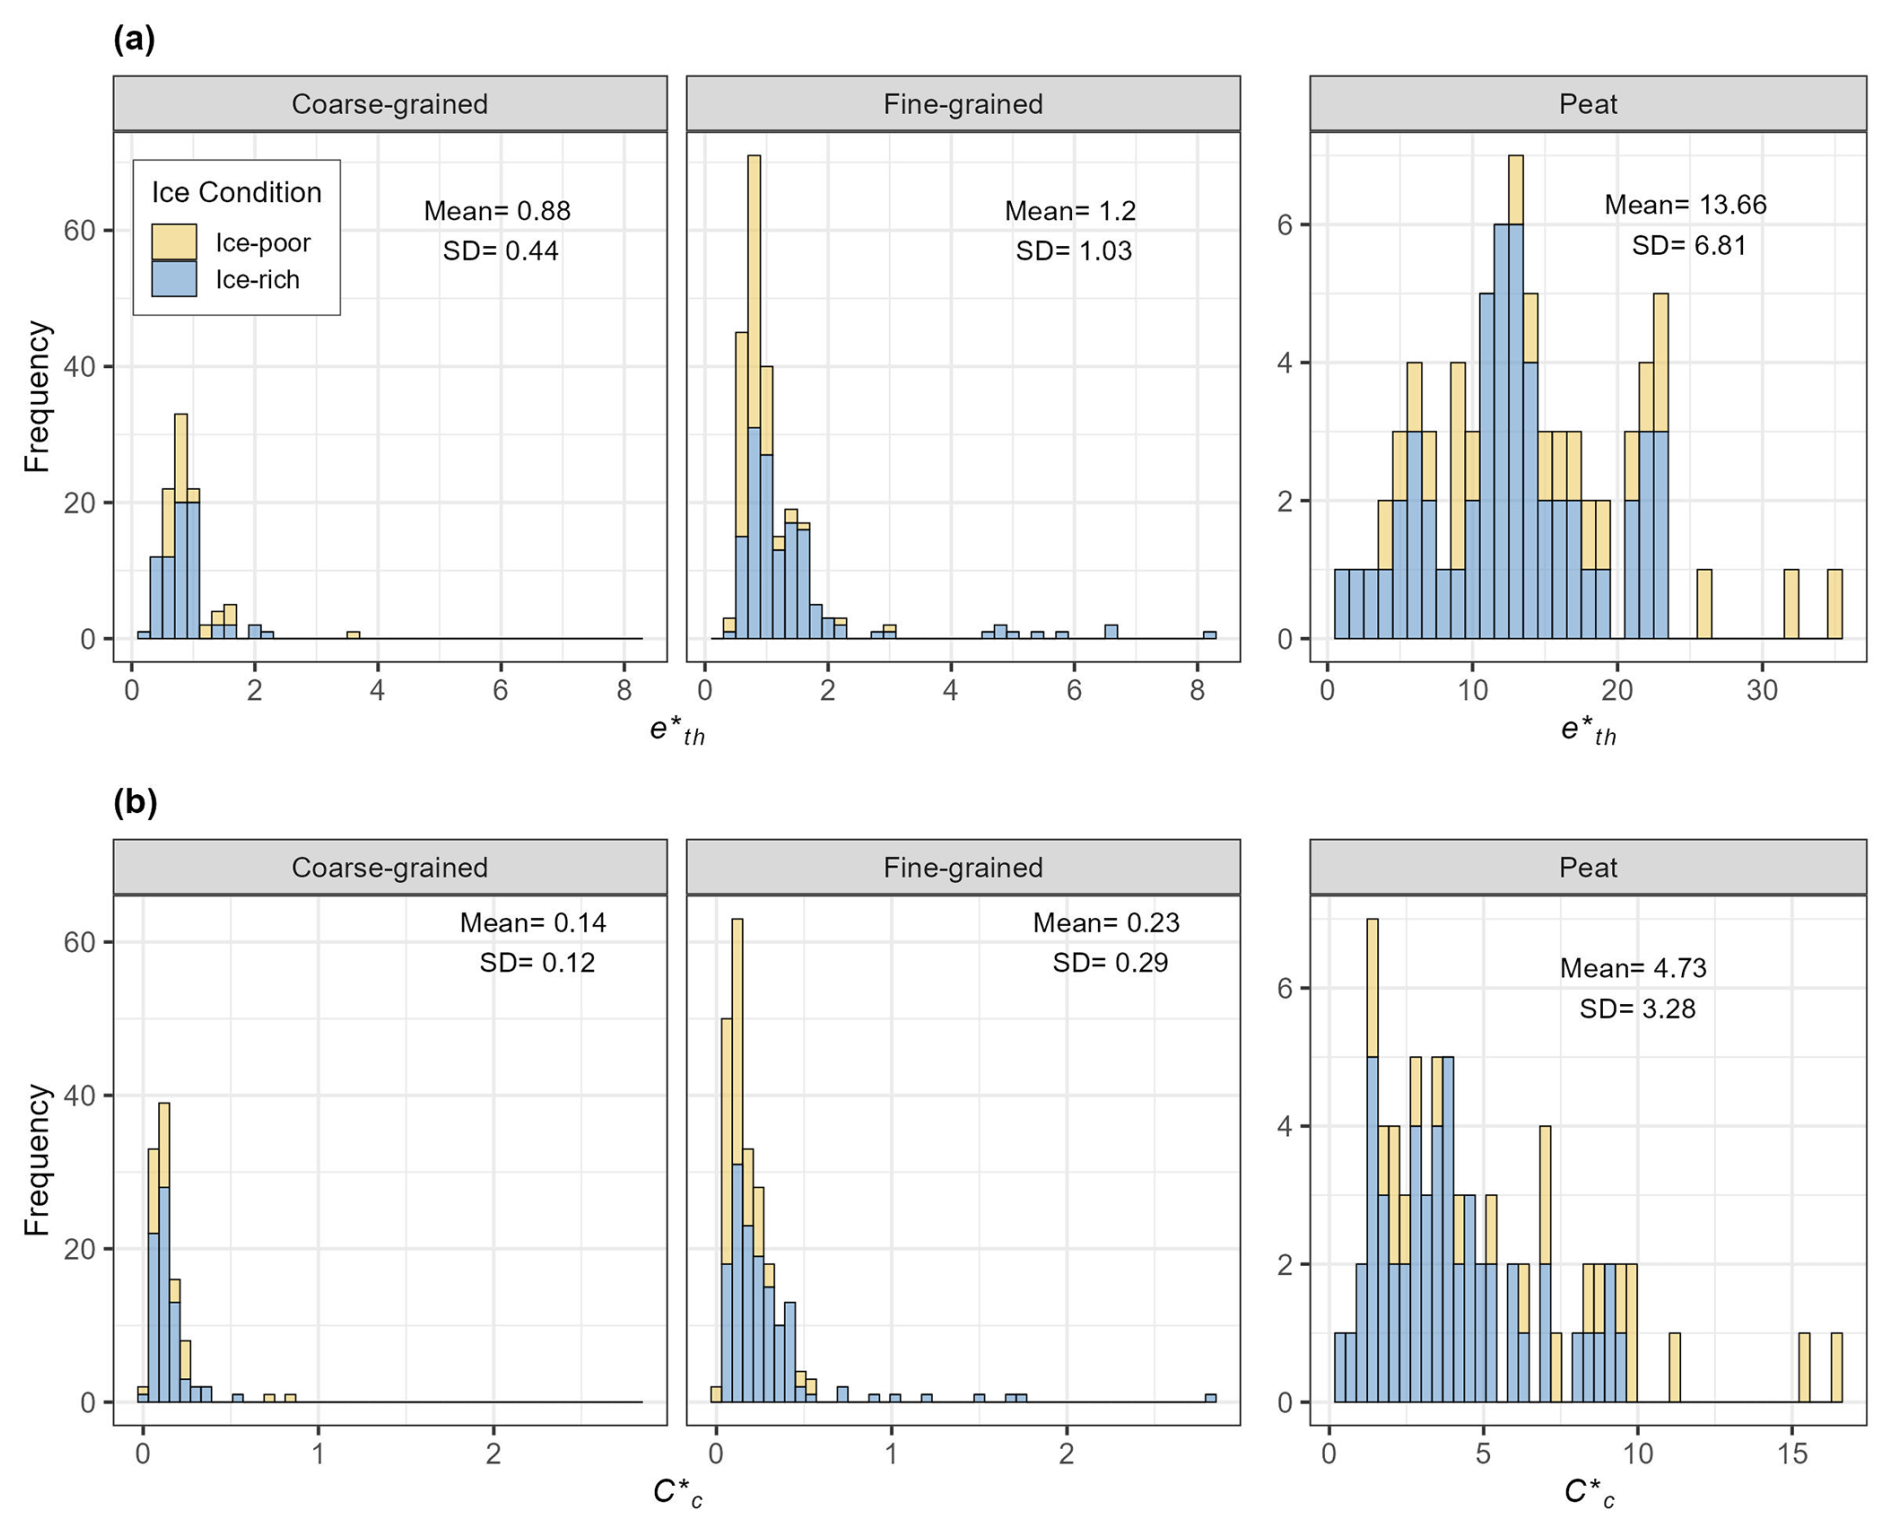
Figure 11Frequency histograms of (a) threshold thawed void ratio () and (b) compression index of thawed soil () across three main soil categories. Different colours represent the ice conditions.
Table 5The descriptive statistics of threshold thawed void ratio () and compression index of thawed soil ().
Empirical correlations relating thaw strain to properties such as water content and frozen bulk density of permafrost samples (e.g. Luscher and Afifi, 1973; Nelson et al., 1983; Speer et al., 1973; Watson et al., 1973b) have been widely used to estimate thaw settlement. These correlations offer a straightforward and cost-effective approach to estimating anticipated thaw strain upon thawing. However, estimations made using these methods exhibit inherent variability and significant scatter despite using relatively large datasets to establish the correlations. Therefore, thaw strain estimates can vary substantially between different methods, introducing uncertainties into the predictions.
In this study, compiled data were used to assess the effectiveness of various existing methods and compare their performance in predicting thaw strain. To achieve this, thaw strain values estimated using the methods outlined in Table 1 were compared with corresponding measured values for each sample in the PTS dataset. The performance of each method in comparison to others was evaluated using measures such as the root-mean-squared deviation (RMSD) and bias between estimated and actual thaw strain values. RMSD, a measure of average deviation between estimated and actual values, and bias, a measure of systematic deviation from the true values, both provide insights into the accuracy and reliability of predictive models. A lower RMSD indicates better agreement between estimated and actual values, while a bias closer to zero suggests that the method is not systematically overestimating or underestimating thaw strain. Table 6 summarizes the obtained metrics for each method across major soil categories, while Table 7 presents the metrics for methods that provide soil-specific correlations. Figure 12 visualizes this evaluation by presenting the predicted versus actual thaw strain for various empirical methods.
Table 6Root-mean-squared deviation (RMSD) and bias for thaw strain measurements from the PTS dataset and predictions made using different empirical methods.
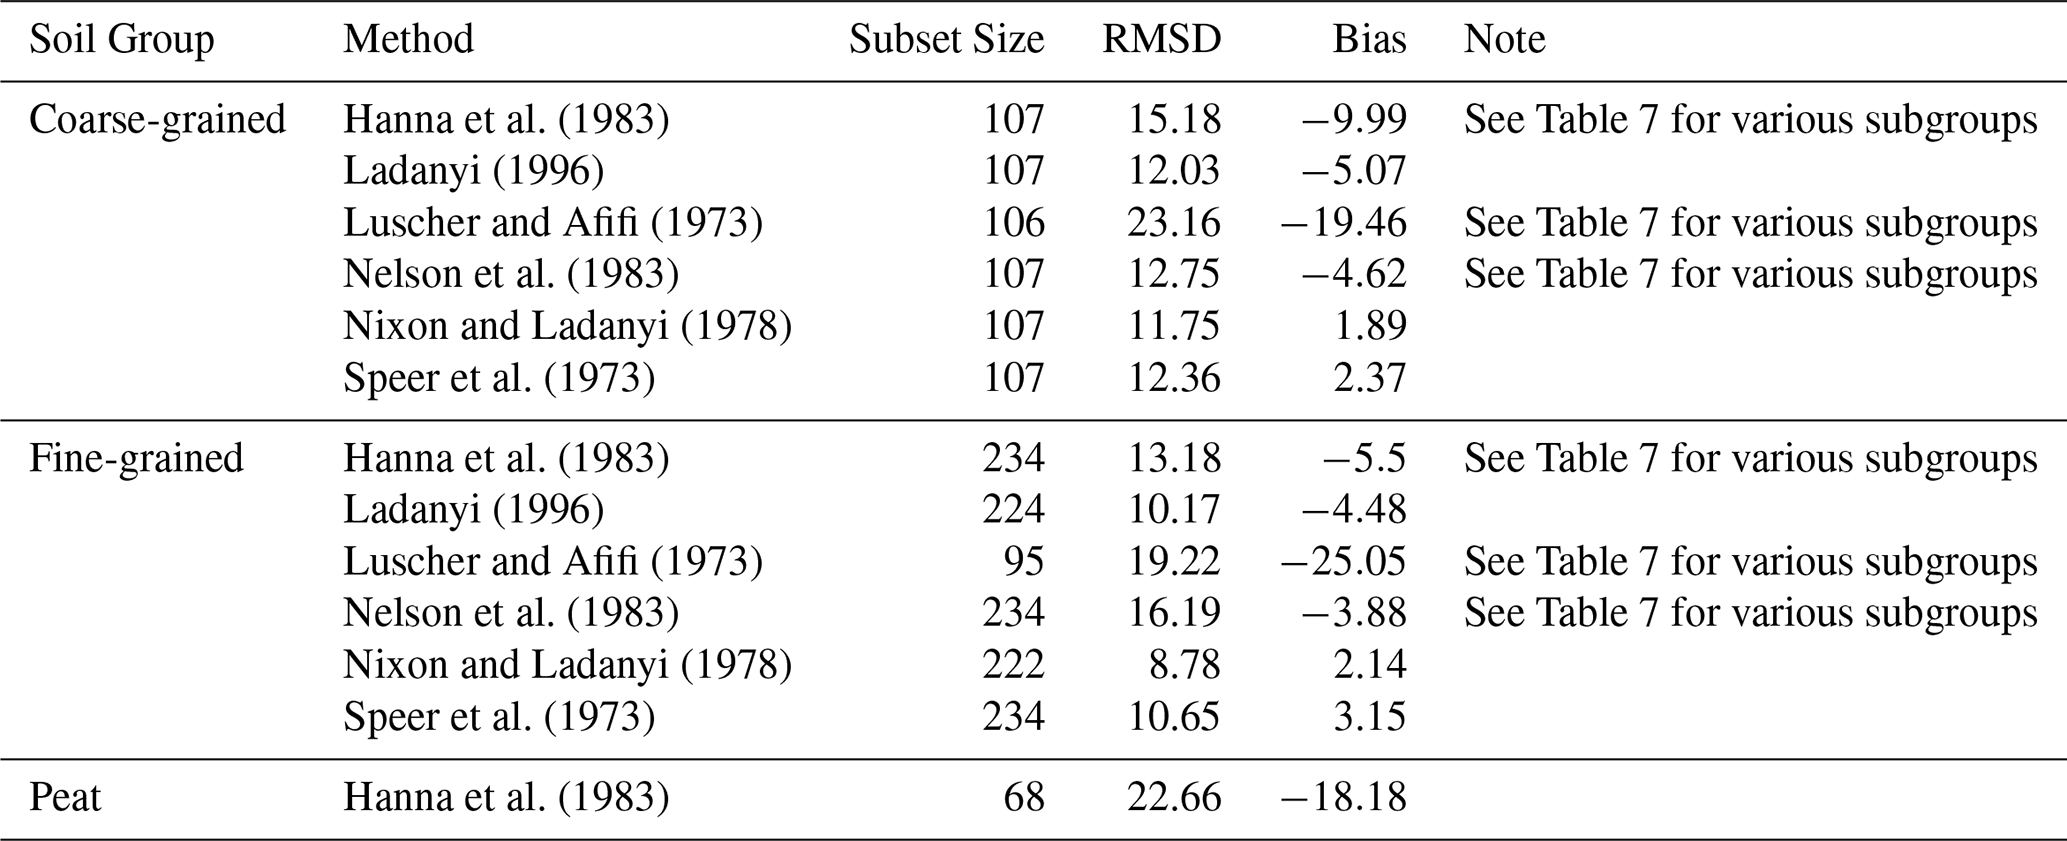
Table 7Root-mean-squared deviation (RMSD) and bias for thaw strain measurements from PTS dataset and predictions made using different empirical methods for various subgroups of soils.
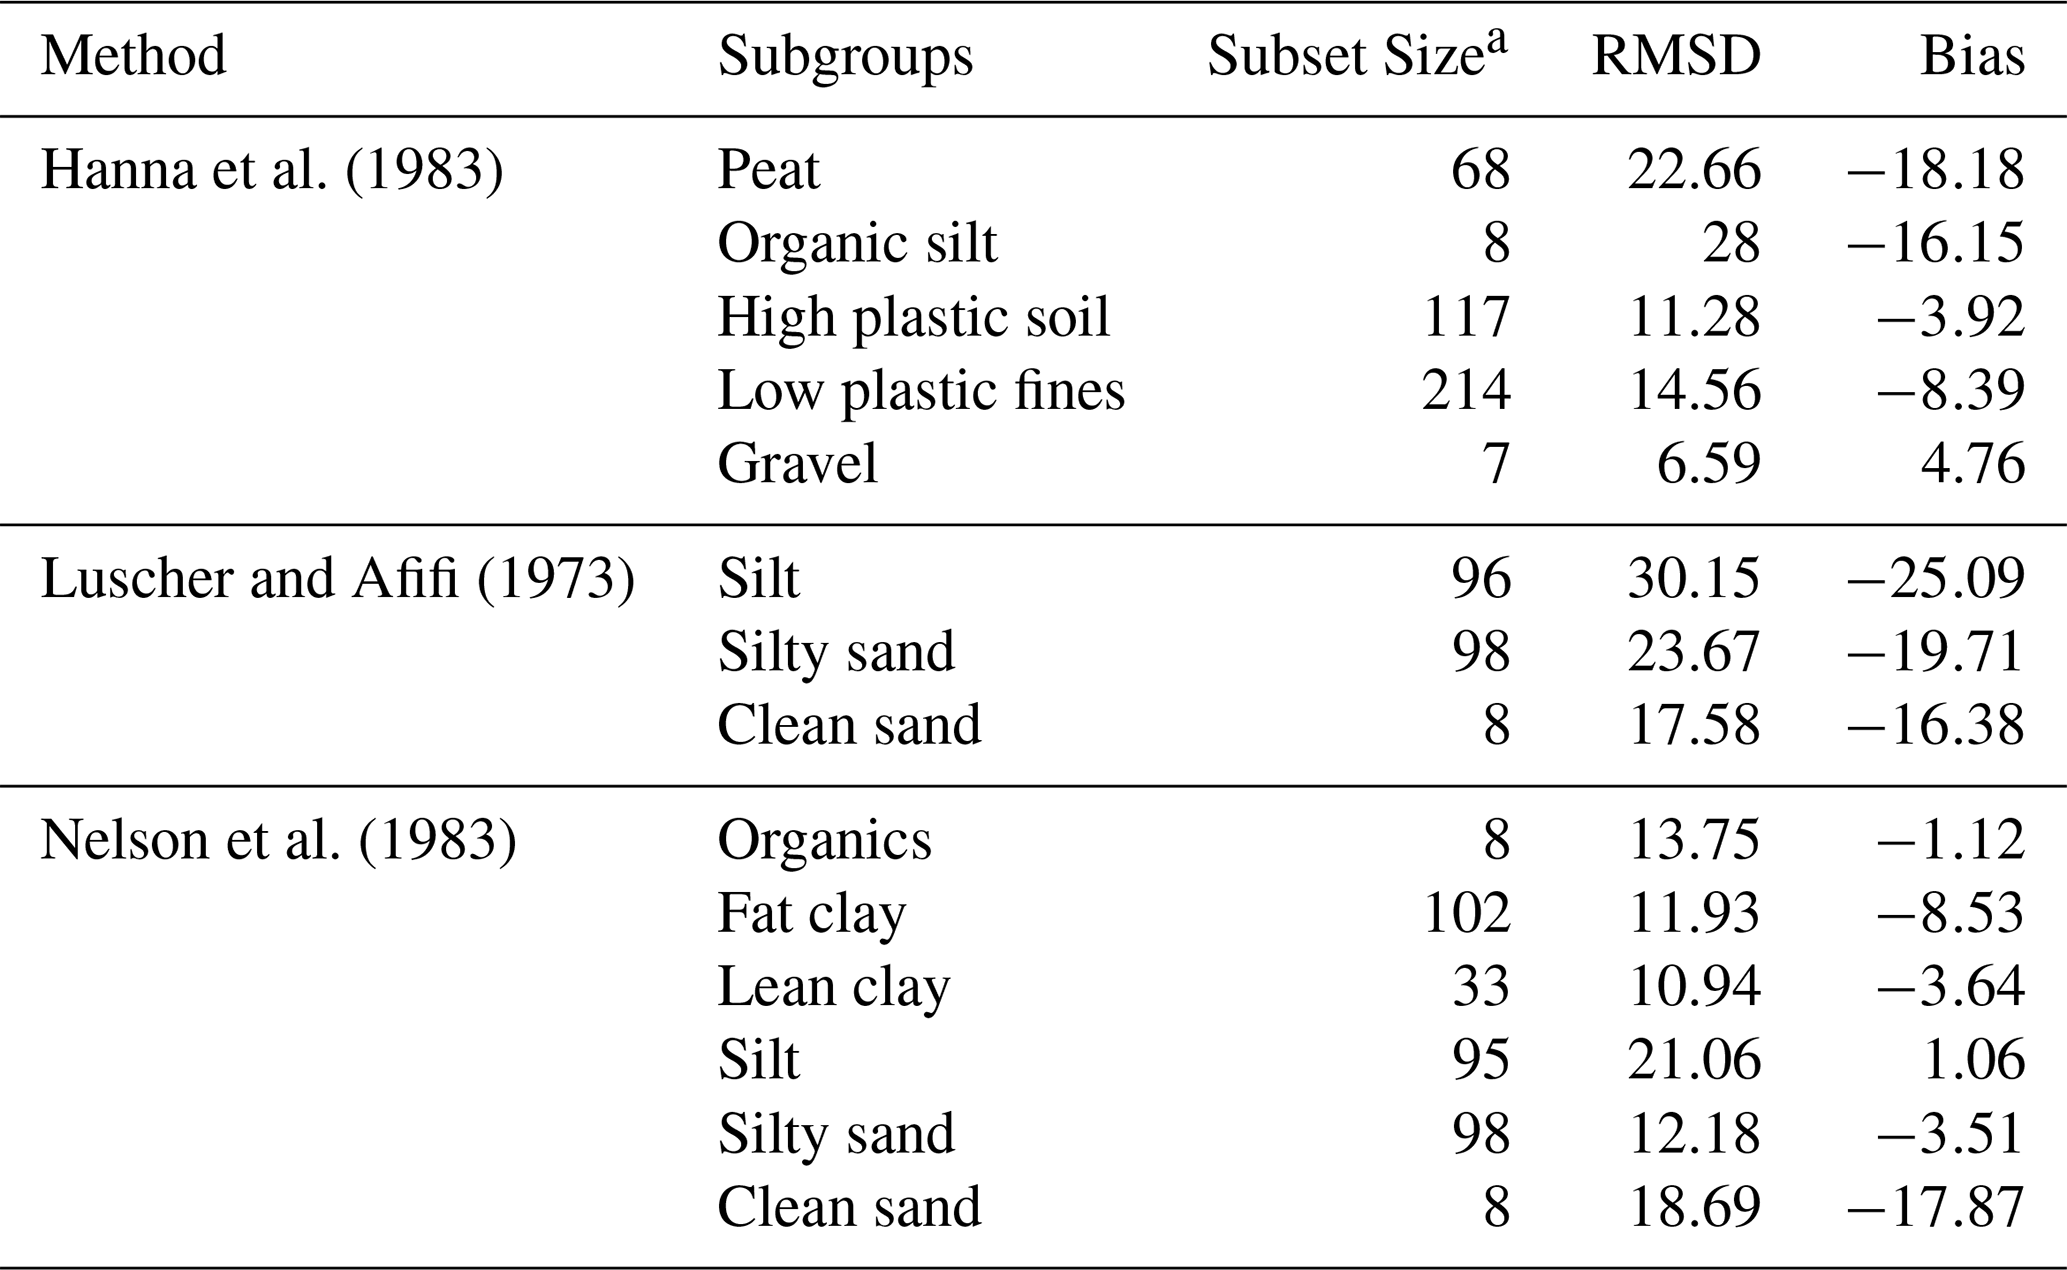
a Subgroups with subset size of 5 or less are excluded.
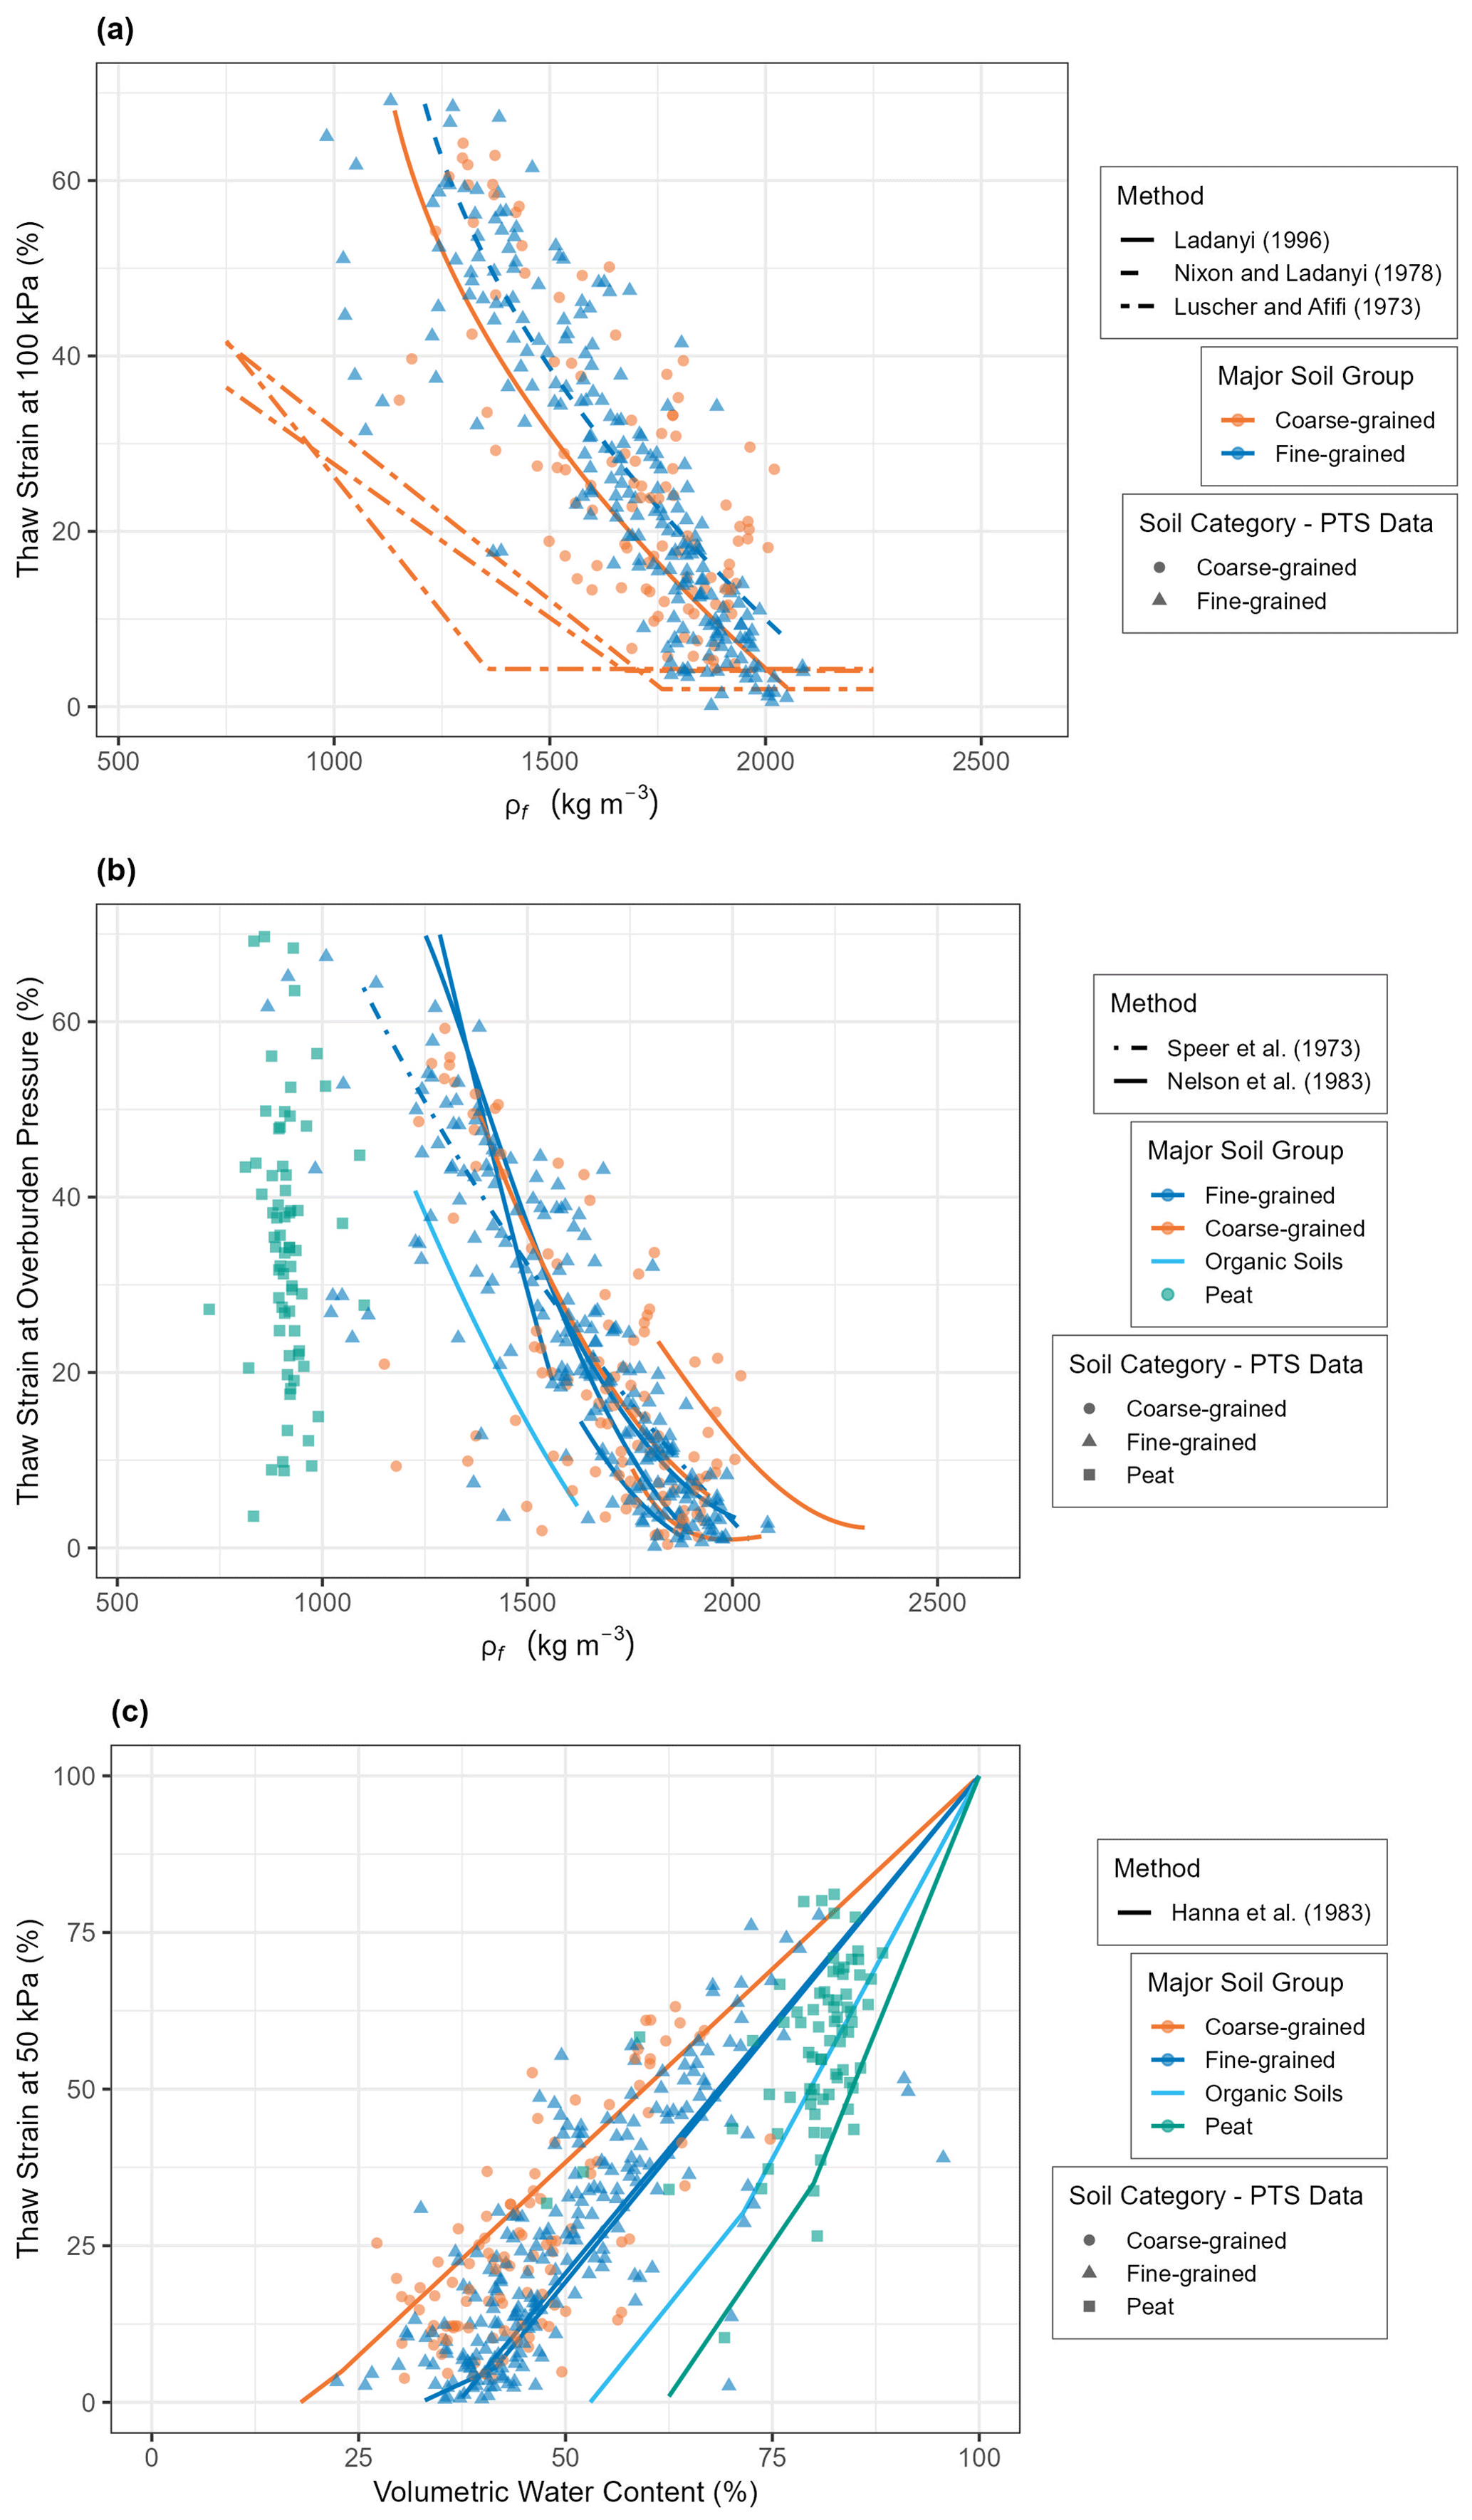
Figure 12Visual comparison of empirical tools for predicting thaw strain against experimental data from the PTS dataset. Lines represent the correlations, while points depict the experimental data. Colour represents major soil groups for both correlations and experimental data. The subplots include (a) three methods, including Luscher and Afifi (1973), Nixon and Ladanyi (1978), and Ladanyi (1996); (b) two methods, including Nelson et al. (1983) and Speer et al. (1973); and (c) the Hanna et al. (1983) method.
In this evaluation, careful attention was given to using only a subset of compiled data that fit the applicability range of each method or each subgroup of soils (if applicable) in terms of soil type. Properties such as soil texture, plasticity limits and USCS classification (if available) were used to identify samples within the PTS dataset that matched each method or subgroup. To ensure comparability between actual thaw strain and estimated values in relation to vertical stress, thaw strain corresponding to the vertical stress used to derive the correlations for each method was selected (see Table 1). For instance, for the correlations proposed by Ladanyi (1996) and Nixon and Ladanyi (1978), thaw strain measurements at 100 kPa were calculated for each test using Eq. (2) and used as the actual thaw strain for validation against predictions made by these methods. Similarly, the correlations by Hanna et al. (1983) were evaluated using thaw strain at 50 kPa for each soil type. The correlations by Luscher and Afifi (1973) were developed using thaw strain at vertical stresses ranging from 70 to 100 kPa; therefore, thaw strain values at 100 kPa were used to obtain the metrics presented in Tables 6 and 7. Both Hanna's method and the Luscher–Afifi method provide soil-specific correlations. In both cases, appropriate thaw strain correlations were applied after assigning each sample in the PTS dataset to one of the defined soil subgroups.
In the cases of Speer et al. (1973) and Nelson et al. (1983), thaw strains were not measured at a unique vertical stress; instead, they were measured at various vertical stresses selected to replicate the overburden pressure at the sample depths. Therefore, during the validation process, the overburden pressure for each sample was first estimated using an approximate borehole stratigraphy constructed based on the available data. Then, thaw strain values were calculated at these estimated overburden pressures using Eq. (2) and were compared with predictions from Speer's and Nelson's methods. Speer's method was applied to all samples classified as fine-grained or coarse-grained in the PTS dataset. For Nelson's method, which provides soil-specific correlations, the appropriate correlations were applied after assigning each sample in the PTS dataset to one of the defined subgroups. Most samples were categorized into fat clay, lean clay, and ML upland/lowland subgroups, while fewer samples were classified into subgroups such as clean sand, gravel, silty gravel, and organics.
As shown in Table 6, among the existing correlations, the method proposed by Nixon and Ladanyi (1978) produced the lowest RMSD and bias when applied to both fine-grained and coarse-grained soils. The RMSD was significantly lower for fine-grained samples, likely due to the development of the original correlations mainly based on thaw strain measurements of silts and clayey silts. A correlation for peat samples was provided solely by Hanna et al. (1983); however, this correlation does not fit the peat sample data well, significantly underestimating thaw strain, as indicated by a high RMSD of approximately 22.66 % and a bias of about −18.18 %.
As shown in Table 6, a comparison of correlations developed for subgroups of coarse-grained soils by Nelson et al. (1983) and Luscher and Afifi (1973) reveals that, in general, Nelson's correlations resulted in lower RMSD and bias compared to those of Luscher and Afifi. However, the correlations developed by Nixon and Ladanyi (1978) achieved the lowest RMSD and bias for both clean sand and silty/clayey sands. Although the number of gravel samples within the PTS dataset was limited, the correlation developed by Hanna et al. (1983) was found to be the most effective for this group, followed by the correlation proposed by Nixon and Ladanyi (1978). For subgroups of fine-grained soils, correlations developed by Nelson et al. (1983) and Hanna et al. (1983) generally exhibited higher RMSD and bias compared to the Nixon and Ladanyi (1978) method, making the latter more effective for predicting thaw strain for different types of these soils. The correlations developed for organic soils are limited, as is the number of samples assigned to the organic subgroup in the PTS dataset. However, among the methods proposed by Nelson and Hanna, the Nelson yielded lower RMSD and bias for organic soils.
It also should be noted that, in general, correlations developed between thaw strain and frozen bulk density, such as Speer et al. (1973), Nixon and Ladanyi (1978), and Ladanyi (1996), showed comparable performance in terms of predicting thaw strain, with Nixon and Ladanyi (1978) marginally outperforming the other two correlation, indicated by a smaller RMSD and a smaller absolute bias. Moreover, the positive bias value for this method, which indicates an overestimation of thaw strain, is more favourable as it results in conservative estimations. The correlations developed by Hanna et al. (1983) are the recommended tools for predicting thaw strain in Canadian Foundation Engineering Manual (Canadian Geotechnical Society, 2023); however, the result of this evaluation suggests that other correlations may outperform these correlations, particularly in terms of bias, as this method has a significantly large negative bias that is indicative of an underestimation of thaw stain.
The data used in this study were collected from a range of published sources rather than generated by the authors. As a result, several sources of uncertainty are inherent in the dataset, including uncertainty in the original data, uncertainty introduced during data extraction and processing, and limitations due to incomplete or missing information.
A primary source of uncertainty lies in potential errors in the original sampling, testing, or reporting processes. Ideally, undisturbed permafrost samples should be obtained for thaw settlement tests, but in practice, thermal disturbance and water loss can occur during sample collection, transport, and handling. Other contributing factors include human error during experimental procedures, subjectivity in visual soil or ice classification, and inconsistencies in calculation or reporting. The lack of a standardized protocol for thaw settlement testing across different studies further contributes to variability.
To improve reliability, original deformation and sample measurements were used, where available, to verify reported values for sample properties, such as thaw strain and void ratio. If discrepancies were found, recalculated values were prioritized.
A quality control process was implemented to flag the reliability of each test result. Each entry was assigned a quality score of 0, 1, or 2 to indicate low, moderate, and high data quality, respectively. Low-quality entries typically involved erroneous or insufficient information, moderate-quality entries showed inconsistencies in reported sample properties, and high-quality entries exhibited minimal issues and reliable sample properties.
In several cases, thaw settlement results were available only as graphical plots in legacy reports. These were digitized using the PlotDigitizer tool. While care was taken to follow best practices, some uncertainty remains, especially when figures were of low resolution. Similar uncertainties apply to digitized particle size distributions. Additionally, to maintain consistency across the dataset, all reported values from various sources were converted to SI units, which may introduce minor uncertainty during unit conversion. Similarly, geographic coordinates, originally reported in various formats and with differing levels of precision, were converted to decimal degrees for consistency. Older records often lacked exact location precision, and in such cases, coordinates should be considered approximate.
In some cases, missing data required assumptions to allow for key parameter calculations. A notable example is the specific gravity of soil particles, which is required for calculating the frozen void ratio. Since specific gravity was only reported for a limited number of samples, assumed values were applied based on soil type and typical literature values: 2.6–2.7 for mineral soils and 1.5 for peat.
Missing values for any variable were consistently marked as “NA” in the dataset. If a variable was reported in one source but absent from another, it was still listed in the corresponding data table, with “NA” filling the gaps for missing entries. This consistent approach ensured that data from various sources could be integrated smoothly. Certain thaw settlement parameters could not be calculated for some of the test results due to an insufficient number of loading steps, which made regression analysis unfeasible. These tests were still included in the dataset but had “NA” assigned to the thaw settlement parameters.
Despite these limitations, the dataset provides a valuable foundation for understanding the thaw settlement behaviour of permafrost soils. The steps taken to standardize, verify, and flag data inconsistencies help to mitigate some of the uncertainties inherent in the collected sources, ensuring that the dataset remains robust for further analysis.
In addition to data-related uncertainties, it is important to define the intended scope of application for the dataset and acknowledge its broader limitations. This dataset is designed to support the estimation of thaw strain and the characterization of stress–strain behaviour based on the material properties of permafrost soils. It provides standardized parameters and supports the development of empirical tools to facilitate material-level analysis. While thaw strain plays a key role in determining ground deformation, total thaw settlement also depends on the thickness of the thawed layer, which varies with local site conditions and long-term climatic trends. Estimating thaw depth requires thermal modelling or integration with climate-driven projections of permafrost change, which are beyond the scope of this study.
The dataset is intended primarily for inferring the strain-based response derived from material behaviour during thawing. It does not account for coupled hydrological or thermal processes that may influence thaw progression. For example, water infiltration through thawed layers may accelerate the thawing of deeper layers, resulting in more complex ground responses not captured by strain estimates alone.
Nevertheless, the dataset offers a valuable foundation for future work that integrates material-scale behaviour with broader climate or geotechnical models. Its standardized format and open-access availability make it suitable for both empirical model development and inclusion in more comprehensive modelling frameworks.
The original measurements and readings, as extracted from the original sources, are included in the input directory of the GitHub repository associated with this paper on Zenodo: https://doi.org/10.5281/zenodo.15192369 (Mohammadi, 2025). The processed and homogenized data, reduced to the necessary variables, are published as the permafrost thaw settlement (PTS) dataset, supporting research on permafrost thaw settlement. The dataset is publicly available on Zenodo: https://doi.org/10.5281/zenodo.15192404 (Mohammadi and Hayley, 2024c).
The code used for this analysis, written in R (R Core Team, 2023), is available on Zenodo: https://doi.org/10.5281/zenodo.15192369 (Mohammadi, 2025). The essd-pts-final version was used to generate all scripts, figures, and datasets presented in this paper. The repository also includes a link to the associated dataset archived on Zenodo (at https://doi.org/10.5281/zenodo.15192404) (Mohammadi and Hayley, 2024c).
Thaw settlement remains a significant concern for infrastructure stability in permafrost regions, and with the accelerating effects of climate change, it is increasingly crucial to improve our understanding and predictive capabilities regarding this phenomenon. This study addresses key challenges in permafrost research by compiling and standardizing thaw settlement data from diverse sources.
The dataset compiled in this study addresses key challenges in permafrost research, including the scarcity of data and the lack of standardized procedures for thaw settlement testing. The resulting dataset allows for a meaningful comparison of soil behaviour across regions and soil types, serving as a foundation for both tool validation and empirical model development.
The dataset also contributes to enhancing existing empirical tools used to estimate thaw strain from easily measurable index properties. An evaluation of some existing tools using the experimental data in the PTS dataset highlighted the stronger predictive performance of the correlation developed by Nixon and Ladanyi (1978) for estimating thaw strain based on frozen bulk density. Additionally, by enabling consistent stress–strain characterization, the dataset supports improved integration of thaw settlement data into numerical modelling frameworks. Its open-access availability encourages future work in both research and practice, particularly when used in conjunction with site-specific data.
In conclusion, this study contributes a critical resource to the field of permafrost research by offering a homogenized dataset that enhances our understanding of thaw settlement behaviour across different permafrost sediments. The findings are expected to support more accurate predictions of thaw settlement and contribute to the design and maintenance of resilient infrastructure in permafrost regions, especially in the context of a warming climate.
A1 List of symbols and nomenclature in the paper
| Term | Symbol | Unit |
| Coefficient of volume compressibility | a0 | % per kPa |
| Coefficient of uniformity | CU | 1 |
| Coefficient of variation | COV | % |
| Compression index of thawed soil | 1 | |
| Degree of saturation | Sr | % |
| Density of water | ρw | kg m−3 |
| Frozen bulk density | ρf | kg m−3 |
| Frozen void ratio | ef | 1 |
| Gravimetric water content | w | % |
| Initial thawed void ratio | 1 | |
| Median particle size | D50 | mm |
| Porosity | n | 1 |
| Residual stress | kPa | |
| Root-mean-squared deviation | RMSD | same as the unit of data |
| Sample height at the frozen state | Hf | mm |
| Sample height at the thawed state at a vertical stress of σv | mm | |
| Soil's specific gravity | Gs | 1 |
| Soil-specific coefficients for Nelson's method | An−i | unitless |
| Standard deviation | SD or std. dev. | Same as the unit of data |
| Term | Symbol | Unit |
| Thaw strain at a vertical stress of σv | % | |
| Thaw strain component attributed to expulsion of excess water | εex | % |
| Thaw strain component attributed to phase change | εpc | % |
| Thaw strain component attributed to soil compression | εsc | % |
| Thaw strain parameter | A0 | % |
| Thawed void ratio at a vertical stress of σv | 1 | |
| Threshold thawed void ratio | 1 | |
| Threshold vertical stress | σv-th | kPa |
| Vertical stress | σv | kPa |
| Volumetric water content | θ | % |
Note that in the symbols, an asterisk (*) as a superscript denotes the thawed state, the letter “f” as a subscript indicates the frozen state, and “th” as a subscript signifies threshold values.
A2 An overview of the permafrost thaw settlement (PTS) dataset
The PTS dataset comprises several files, each serving a distinct purpose:
-
borehole_locations_and_sources.csv: this file contains geographic coordinates and source references for test results on samples collected from each borehole location.
-
particle_size_distribution.csv: this file contains particle size distribution for samples, provided it was included in the original sources.
-
thaw_settlement_test_results.csv: this file contains the results of thaw settlement tests conducted on various permafrost samples. Each row corresponds to one loading step on a sample, detailing the applied vertical stress, deformation measurements, strain, and void ratio during that specific loading step.
-
sample_details_with_derived_parameters.csv: this file provides detailed properties of each sample, including both basic properties and comparative parameters derived from the test results. It serves as a comprehensive summary of the physical and mechanical characteristics of the samples.
For a detailed description of the variables included in the PTS dataset, please refer to the accompanying README.txt file. This document provides comprehensive explanations of each variable along with their corresponding units.
Table A1Descriptors added to variable names in the PTS dataset.
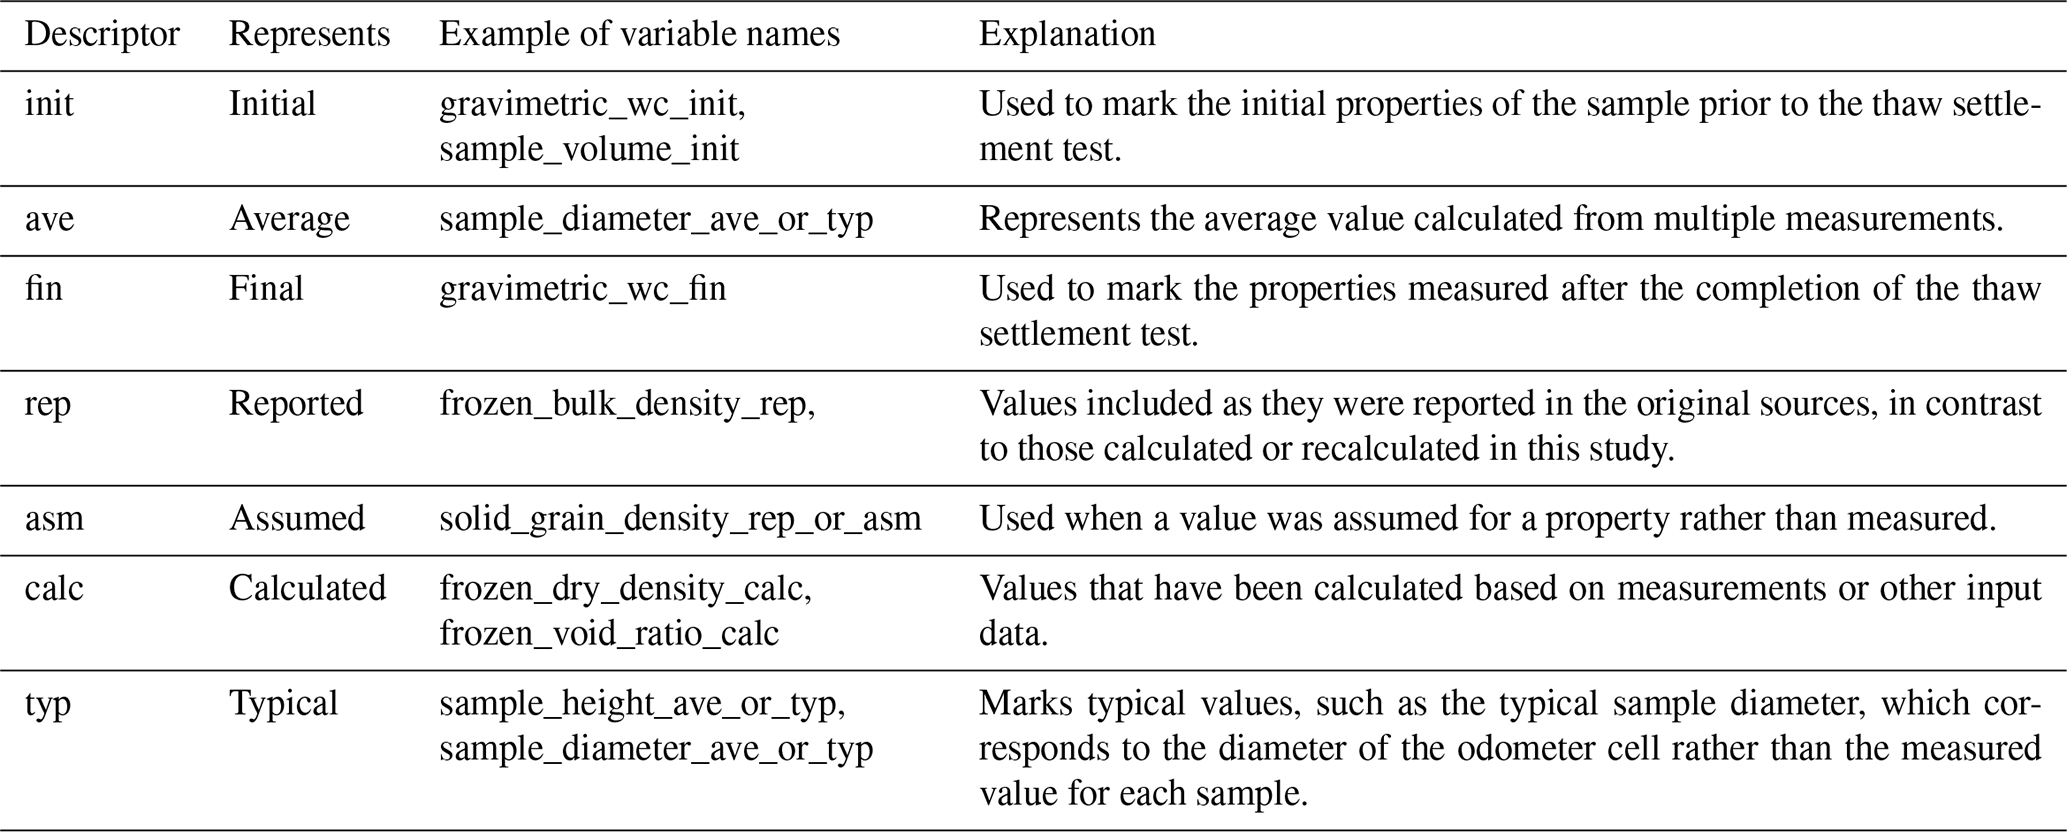
The variable names in the PTS dataset follow a structured naming convention, incorporating descriptors as outlined in Table A1. These descriptors help distinguish between various types of values, such as initial and final measurements, reported and calculated values (derived from analyses conducted by the author), assumed values, and typical values.
A3 Visual description of soil and ground ice
The Unified Soil Classification System (USCS) or modified adaptations of this system were used to visually assess and classify samples in the original sources. Specifically, an adaptation of the USCS was employed to classify and describe samples in the NESCL reports. For detailed procedures regarding the description of soil samples, refer to the Geotechnical Data Report for the Proposed Arctic Gas Pipeline – Cross Delta Alternative (NESCL, 1975).
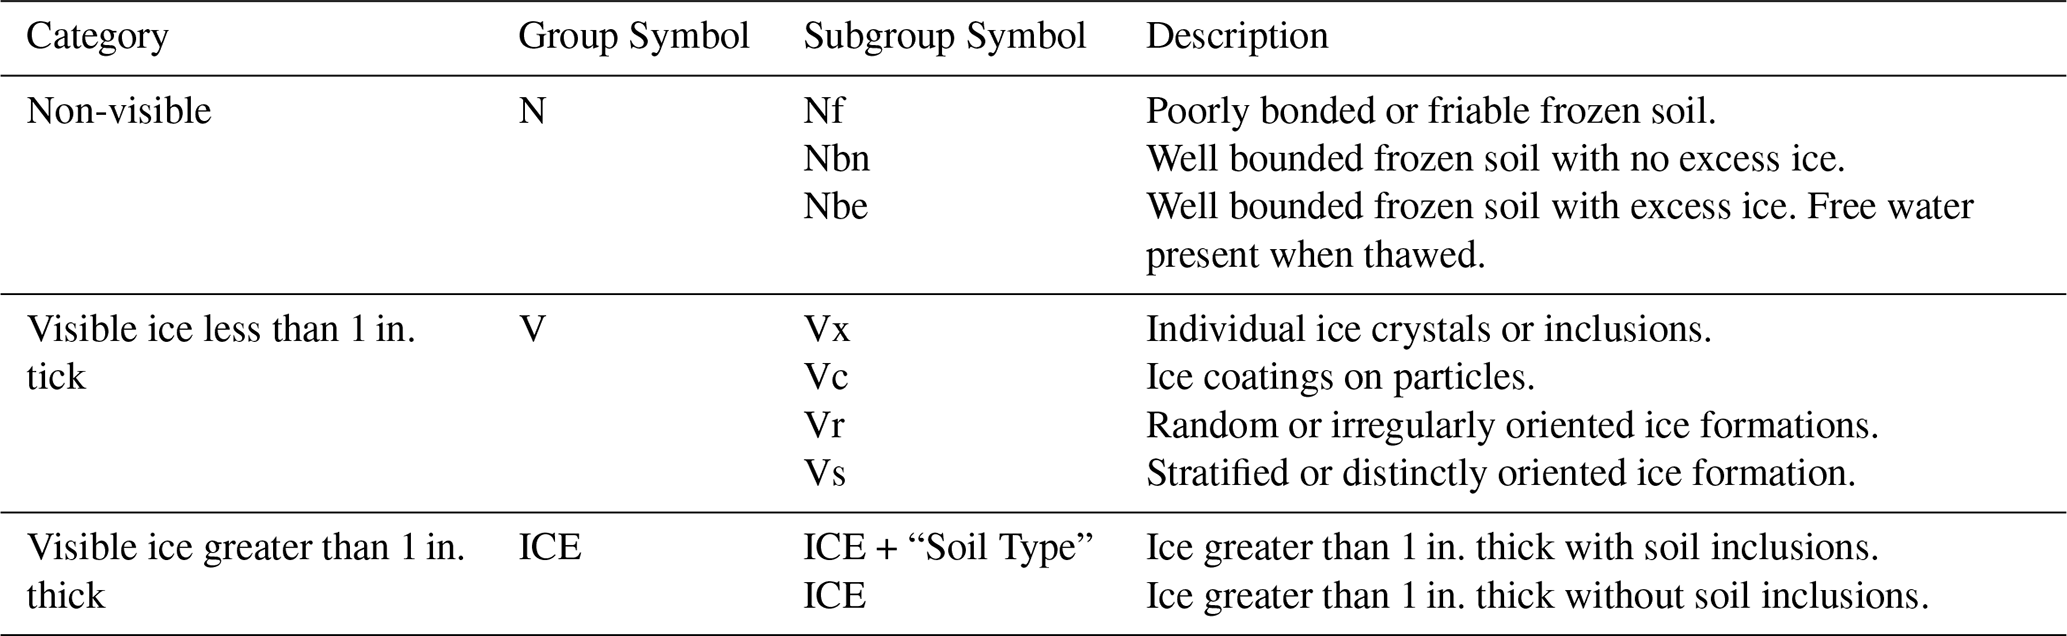
For data sourced from NESCL reports, the ground ice descriptions were extracted from borehole logs and incorporated into the PTS dataset. This classification adhered to the NRC 7576 guidelines, categorizing ground ice into three major classes based on visual examination: non-visible (N class), visible (V class), and visible ice greater than 1 in. thick (ICE class). Table A2 outlines the subgroup symbols used within each category along with their general descriptions as specified in the NRC 7576 guidelines.
Table A2Ground ice classification symbols and descriptions based on visual examination following the NRC 7576 guideline.
A4 Homogenizing thaw settlement test results in the PTS dataset
The test results in the original sources were reported in various formats. To homogenize these results, the following procedures were applied.
In cases where both the initial sample height and vertical deformation during each loading step were provided, thaw strain and void ratio were calculated using the following equations:
where Hf is the initial sample height in the frozen state and is the height of thawed sample at vertical stress of σv.
In instances where only the void ratios or thaw strains at each vertical stress were reported, the missing variable for each loading step was derived using the following equation:
where is the thaw strain measured at a vertical stress of σv, is the thawed void ratio at a vertical stress of σv, and ef is the frozen void ratio.
To incorporate this information into the dataset, a variable, reported_test_result_type, was added to the PTS dataset. This variable differentiates between values that were directly reported and those derived through conversion from one variable to another. The following values were used to differentiate between various cases:
-
delta_h-sigma_v: deformation measurements and initial sample dimensions are available; it was used to obtain the thaw strain and void ratio for each loading step.
-
e-sigma_v: test results were reported as void ratio against vertical stress; Eq. (A2) was applied to derive the thaw strain based on void ratios.
-
strain-sigma_v: test results were reported as thaw strain against vertical stress; Eq. (A3) was applied to derive the void ratio based on thaw strain.
-
e-sigma_v and strain-sigma_v: both the void ratio and thaw strain at each loading step were reported in the original sources. Checks were conducted to ensure compatibility; in the case of discrepancies, the test result was flagged.
A5 Derivations of various thaw stain components
The idealized void ratio–vertical stress relationship (as depicted in Fig. 2b) was used to differentiate various thaw strain components, such as phase change, drainage of excess water, and compression of thawed soil, all contributing to the total thaw strain under a given applied vertical stress.
The portion of thaw strain attributed to phase change (εpc) can be calculated using the following equation:
where ef is the frozen void ratio and denotes the initial thawed void ratio. Given that , Eq. (2) can be simplified to
The portion of thaw strain attributed to the expulsion of excess water (εew) can be estimated using following equation:
where ef is the frozen void ratio and denotes the initial void ratio after thawing. Given that , Eq. (4) can be simplified to
Since, for ice-poor samples, , this portion is zero for the samples classified as ice-poor.
The portion of thaw strain attributed to soil compression (εsc) at any given vertical stress can be calculated using the following equation:
where ef is the frozen void ratio, denotes the compression index of thawed soil, σv-th is the threshold vertical stress marking the initiation of soil's compression during each test, and σv is the vertical stress. For each thaw settlement test, various components of thaw strain were calculated to provide an insight into the contribution of each to the total thaw strain. A vertical pressure of 100 kPa was applied to determine the portion of thaw strain attributed to soil compression and total thaw strain. Figure A1 presents box plots of each component and the total thaw strain for two groups of samples – ice-poor and ice-rich – while comparing three main soil groups.
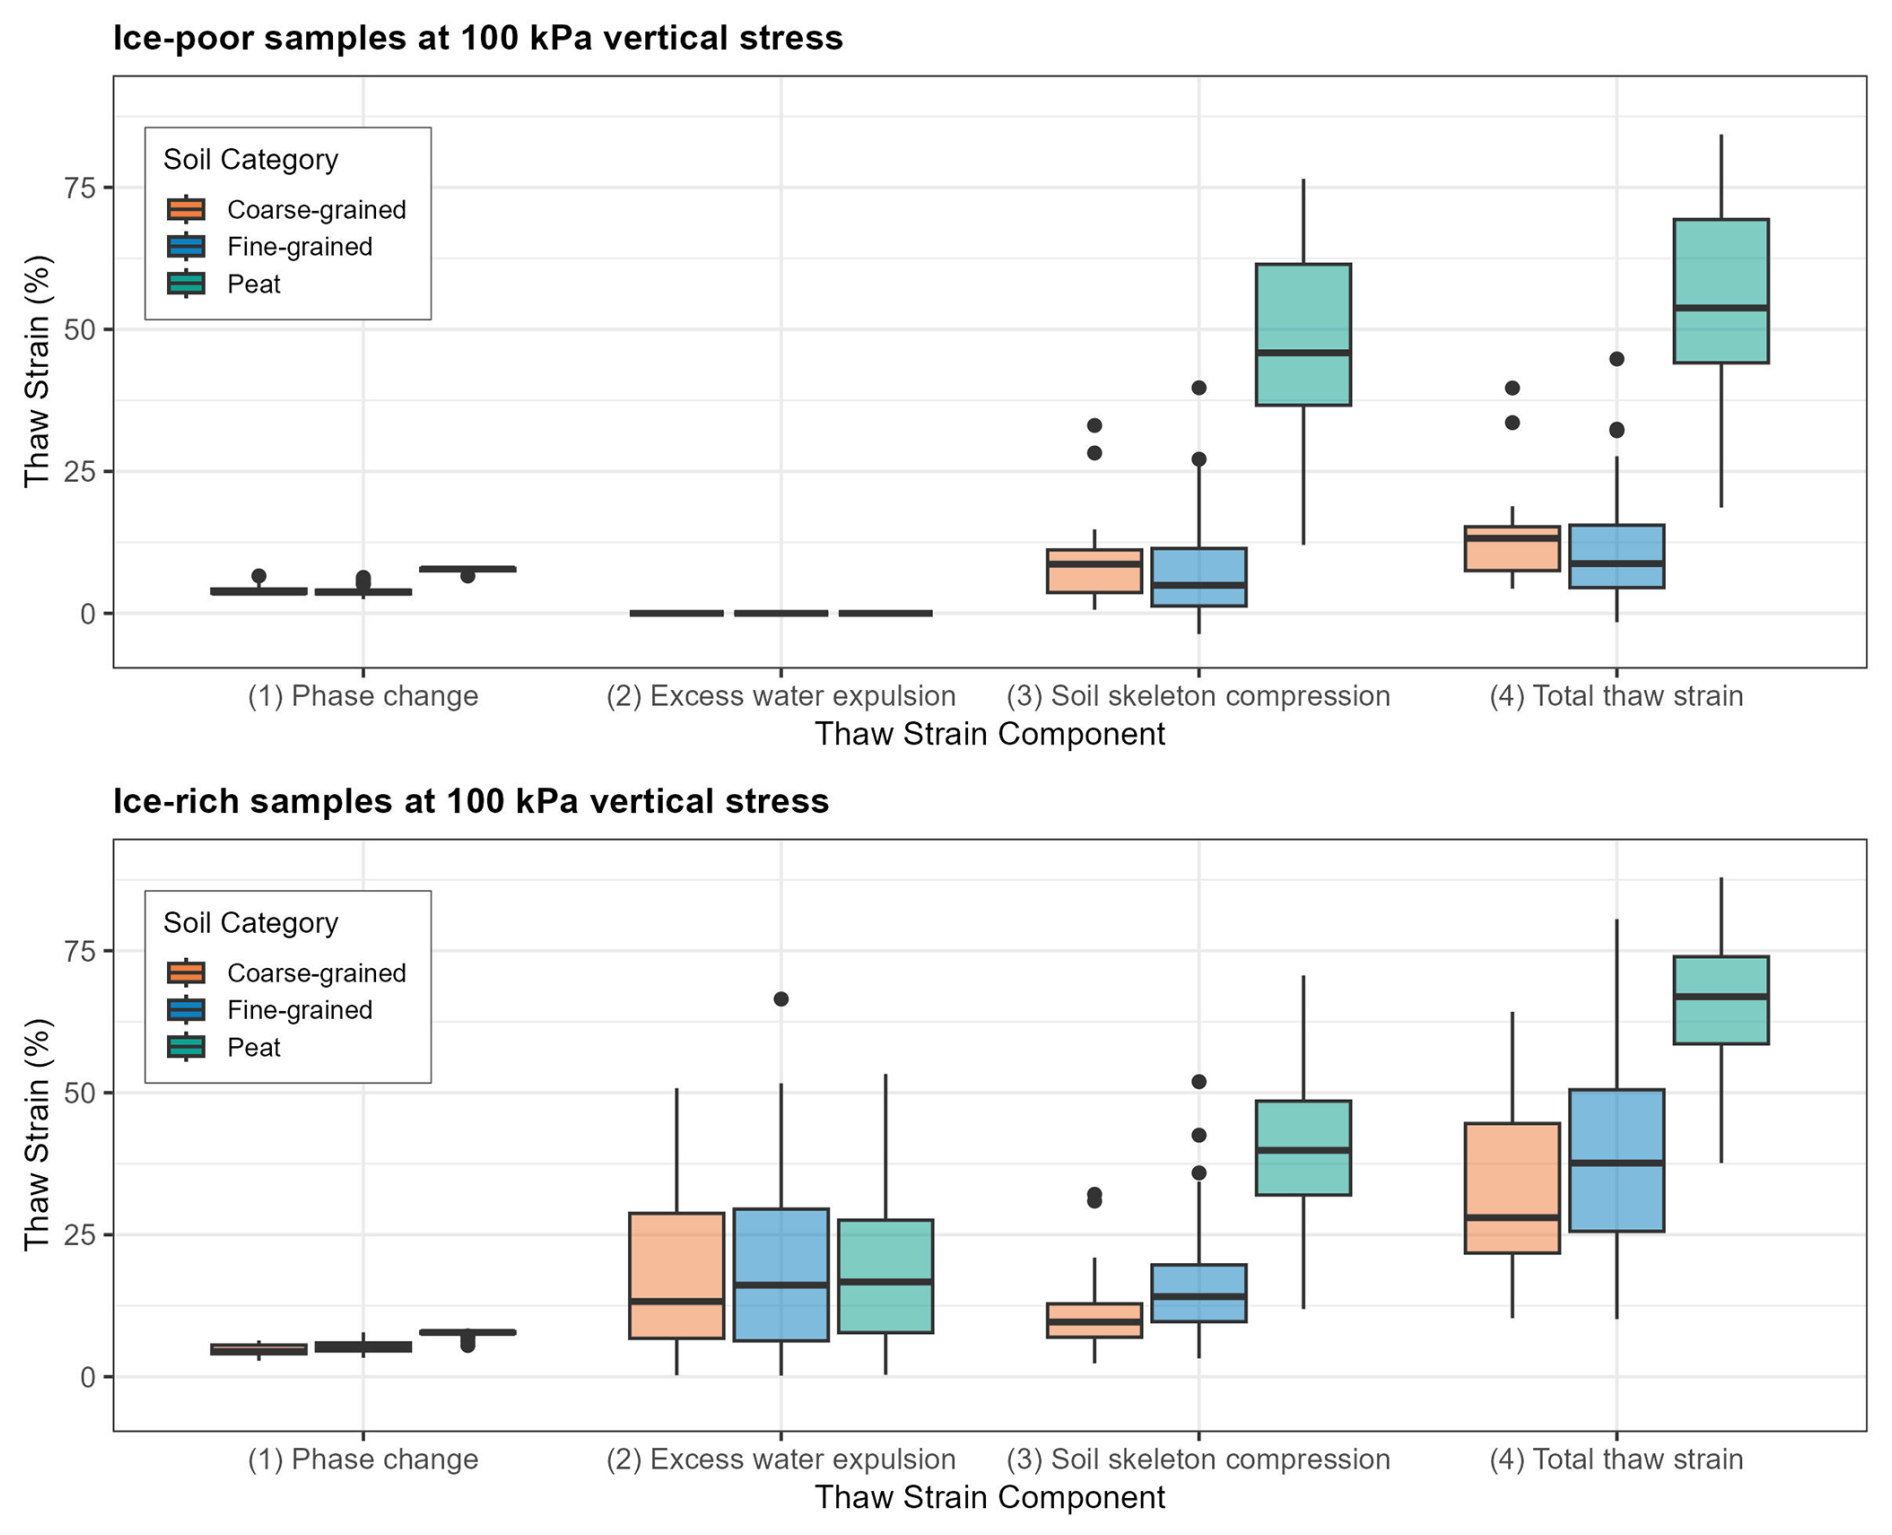
Figure A1Box plots showing the distribution of thaw strain components in ice-poor and ice-rich samples, with a comparison between three main soil groups in the PTS dataset.
ZM and JLH conceptualized the study. ZM curated the data, performed the formal analysis, developed the methodology, and prepared the original draft of the manuscript. JLH acquired the funding, supervised the project, and reviewed and edited the manuscript.
The contact author has declared that neither of the authors has any competing interests.
Publisher's note: Copernicus Publications remains neutral with regard to jurisdictional claims made in the text, published maps, institutional affiliations, or any other geographical representation in this paper. While Copernicus Publications makes every effort to include appropriate place names, the final responsibility lies with the authors.
We thank the original data collectors and institutions whose efforts made this dataset possible, including the Arctic Gas Pipeline project (1970s), the Centre for Nordic Studies at Université Laval, and the Yukon Research Centre at Yukon College. We also thank Simon Dumais for sharing his extracted data on fine-grained soils from the Arctic Gas Pipeline Project, which was used to cross-check and validate portions of the dataset, alongside the broader data extraction and compilation performed for this work.
This research has been supported by the Natural Sciences and Engineering Research Council of Canada (grant no. NETGP 523228 – 18).
This paper was edited by Achim A. Beylich and reviewed by two anonymous referees.
Allard, M., Chiasson, A., St-Amour, A. B., Aubé-Michaud, S., Mathon-Dufour, V., L'Hérault, E., Bilodeau, S., and Deslauriers, C.: Caractérisation géotechnique et cartographie améliorée du pergélisol dans les communautés nordiques du Nunavik, Rapport final, Centre d'études nordiques, Université Laval, Québec, 2020.
Allard, M., L'Hérault, E., Aubé-Michaud, S., Carbonneau, A. S., Mathon-Dufour, V., St-Amour, A. B., and Gauthier, S.: Facing the challenge of permafrost thaw in Nunavik communities: innovative integrated methodology, lessons learnt, and recommendations to stakeholders, Arct. Sci., 9, 657–677, https://doi.org/10.1139/as-2022-0024, 2023.
Andersland, O. B. and Ladanyi, B.: Frozen ground engineering, John Wiley & Sons, ISBN 978-0-471-61549-1, 2003.
Aubé-Michaud, S., Allard, M., Chiasson, A., St-Amour, A. B., Mathon-Dufour, V., L'Hérault, E., Bilodeau, S., and Deslauriers, C.: Caractérisation géotechnique et cartographie améliorée du pergélisol dans les communautés nordiques du Nunavik Ivujivik, Ivujivik, Québec, 112 pp., https://doi.org/10.60918/2702, 2020a.
Aubé-Michaud, S., Chiasson, A., Allard, M., St-Amour, A. B., Mathon-Dufour, V., L'Hérault, E., Bilodeau, S., and Deslauriers, C.: Caractérisation géotechnique et cartographie améliorée du pergélisol dans les communautés nordiques du Nunavik, Kangiqsualujjuaq, Québec, 121 pp., https://doi.org/10.60918/2605, 2020b.
Aydin, O. and Yassikaya, M. Y.: Validity and reliability analysis of the PlotDigitizer software program for data extraction from single-case graphs, Perspect. Behav. Sci., 45, 239–257, 2022.
Benkert, B., Fortier, D., Lipovsky, P. S., Lewkowicz, A. G., de Grandpré, I., Grandmont, K., Turner, D. G., Laxton, S., Moote, K., and Roy, L.-P.: Ross River landscape hazards: Geoscience mapping for climate change adaptation planning, Northern Climate ExChange, YukonResearch Centre, Yukon College, 2015a.
Benkert, B., Fortier, D., Lipovsky, P. S., Lewkowicz, A. G., Roy, L.-P., de Grandpré, I., Grandmont, K., Turner, D. G., Laxton, S., and Moote, K.: Faro Landscape Hazards: Geoscience Mapping for Climate Change Adaptation Planning, Northern Climate ExChange, YukonResearch Centre, Yukon College, 2015b.
Benkert, B., Kennedy, K., Fortier, D., Lewkowicz, A. G., Roy, L.-P., Grandmont, K., de Grandpré, I., McKenna, K. M., and Moote, K.: Dawson City landscape hazards: Geoscience mapping for climate change adaptation planning, Northern Climate ExChange, YukonResearch Centre, Yukon College, 2015c.
Benkert, B., Kennedy, K., Fortier, D., Lewkowicz, A. G., Roy, L.-P., de Grandpré, I., Grandmont, K., Drukis, S., Colpron, M., and Light, E.: Old Crow landscape hazards: Geoscience mapping for climate change adaptation planning, Northern Climate ExChange, YukonResearch Centre, Yukon College, 2016.
Brooks, H.: Quantitative Risk Analysis for Linear Infrastructure Supported by Permafrost: Methodology and Computer Program, Doctoral dissertation, Laval University, 2019.
Canadian Arctic Gas Study Limited and Northern Engineering Services Company: Thaw-Settlement Test Data, Fort Simpson to Zama Lake, Northern Engineering Services, Calgary, 1977.
Canadian Geotechnical Society: Canadian Foundation Engineering Manual, 5th edn., Canadian Science Publishing, Vancouver, British Columbia, Canada, 888 pp., ISBN 978-0-920505-50-2, 2023.
Cayen, J.: canadianmaps: Effortlessly Create Stunning Canadian Map-R package version 1.3.0, https://CRAN.R-project.org/package=canadianmaps (last access: 20 December 2024), 2023.
Chiasson, A., Allard, M., Aubé-Michaud, S., St-Amour, A. B., Mathon-Dufour, V., L'Hérault, E., Bilodeau, S., and Deslauriers, C.: Caractérisation géotechnique et cartographie améliorée du pergélisol dans les communautés nordiques du Nunavik, Kuujjuaq, Québec, 96 pp., https://doi.org/10.60918/2544, 2020a.
Chiasson, A., Allard, M., St-Amour, A. B., Mathon-Dufour, V., Aubé-Michaud, S., L'Hérault, E., Bilodeau, S., and Deslauriers, C.: Caractérisation géotechnique et cartographie améliorée du pergélisol dans les communautés nordiques du Nunavik, Kangiqsujuaq, Québec, 109 pp., https://doi.org/10.60918/2424, 2020b.
Dumais, S.: Modélisation de la consolidation au dégel à grandes déformations, PhD thesis, Laval University, Québec, Canada, 200 pp., Canadiana Identifier ncf11877063, 2019.
Dumais, S. and Konrad, J.-M.: Framework for thaw consolidation of fine-grained soils, Can. Geotech. J., 61, 931–944, https://doi.org/10.1139/cgj-2022-0502, 2023.
Dumais, S. and Konrad, J.-M.: Thaw Consolidation Properties of Fine-Grained Permafrost Soils of the Mackenzie Valley, Canada, J. Cold Reg. Eng., 38, 04023020, https://doi.org/10.1061/JCRGEI.CRENG-720, 2024.
Flynn, D., Alfaro, M., Graham, J., and Arenson, L. U.: Observed Deformations of an Existing Highway Embankment on Degrading Permafrost, in: GEOQuébec 2015, 68th Canadian Geotechnical Conference, 7th Canadian Permafrost Conference, 20–23 September 2015 Québec City, Quebec, 2015.
Fortier, R., LeBlanc, A. M., and Yu, W.: Impacts of permafrost degradation on a road embankment at Umiujaq in Nunavik (Quebec), Canada, Can. Geotech. J., 48, 720–740, https://doi.org/10.1139/t10-101, 2011.
Hanna, A. J., Saunders, R. J., Lem, G. N., and Carlson, L. E.: Alaska highway gas pipeline project (Yukon) section thaw settlement design approach, in: Proceedings of the Fourth International Conference on Permafrost, 17–22 July 1983, University of Alaska, Fairbanks, Alaska, USA, 1983.
Harris, S. A., French, H. M., Heginbottom, J. A., Johnston, G. H., Ladanyi, B., Sego, D., and Everdingen, R. O.: Glossary of permafrost and related ground-ice terms, Associate Committee on Geotechnical Research, National Research Council of Canada, Ottawa, 156, https://doi.org/10.4224/20386561, 1988.
Hjort, J., Karjalainen, O., Aalto, J., Westermann, S., Romanovsky, V. E., Nelson, F. E., Etzelmüller, B., and Luoto, M.: Degrading permafrost puts Arctic infrastructure at risk by mid-century, Nat. Commun., 9, 5147, https://doi.org/10.1038/s41467-018-07557-4, 2018.
Hjort, J., Streletskiy, D., Doré, G., Wu, Q., Bjella, K., and Luoto, M.: Impacts of permafrost degradation on infrastructure, Nat. Rev. Earth Environ., 3, 24–38, https://doi.org/10.1038/s43017-021-00247-8, 2022.
Ladanyi, B.: La conception et la réhabilitation des infrastructures de transports en régions nordiques, Études et Recherches en Transport, Ministère des Transports du Québec, Direction des communications, Rapport RTQ-94-07, Montréal, Canada, ISBN 2550255054, 1996.
Lewkowicz, A. G., Wolfe, S. A., Roujanski V., Hoeve, E., O'Neill, H. B., Gruber, S., Roy-Léveillée, P., Brown, N., Koenig, C. E. M., Brooks, H., Rudy, A. C. A., Bonnaventure, P. P., and Paquette, M.: An Illustrated Permafrost Dictionary, Canadian Permafrost Association, https://doi.org/10.52381/CPA.permafrostdictionary.1, 2024.
L'Hérault, E., Allard, M., Barrette, C., Doré, G., and Guimond, A.: Assessment of permafrost conditions and thermal disturbances diagnosis under airfields and access roads to support adaptation strategies to climate warming: case studies from northern Quebec, The 4th European Conference on Permafrost – IPA Regional Conference (EUCOP4), 18 to 21 June 2014, Évora, Portugal, 2014.
Luscher, U. and Afifi, S. S.: Thaw Consolidation of Alaskan Silts and Granular Soils, in: North American Contribution to the 2nd International Conference on Permafrost, 13–28 July 1973, Yakutsk, Russian Soviet Federative Socialist Republic, National Academy of Sciences, Washington, D.C., ISBN 0-309-02115-4, 1973.
Mohammadi, Z.: ThawSettlement_DataPaper: ESSD Submission Dataset (Version essd-pts-final), Zenodo [code and data set], https://doi.org/10.5281/zenodo.15192369, 2025.
Mohammadi, Z. and Hayley, J. L.: Estimating Thaw Settlement of Coarse-Grained Permafrost Sediments, Can. Geotech. J., 62, 1–18, https://doi.org/10.1139/cgj-2023-0492, 2024a.
Mohammadi, Z. and Hayley, J. L.: Estimating Thaw Settlement of Highly Organic Permafrost, in: Geo-Congress 2024, 25–28 February 2024, Vancouver, BC, Canada, 780–790, https://doi.org/10.1061/9780784485330.079, 2024b.
Mohammadi, Z. and Hayley, J. L.: Permafrost Thaw Settlement Dataset (Version 1.2.1), Zenodo [data set], https://doi.org/10.5281/zenodo.15192404, 2024c.
Nelson, R. A., Luscher, U., Rooney, J. W., and Stramler, A. A.: Thaw Strain Data and Thaw Settlement Prediction for Alaskan Soils, in: Permafrost, 4th Int. Conf., 17–22 July 1983, University of Alaska, Fairbanks, Alaska, USA, 912–917, 1983.
NESCL (Northern Engineering Services Company Limited): Geotechnical Data Report Proposed Arctic Gas Pipeline Cross Delta Alternative Route Cannel Depth Anomaly Drilling and Sampling Program: Prepared for Canadian Arctic Gas Study Limited, Northern Engineering Services Company Limited, 1975.
Nixon, J. F. and Ladanyi, B.: Thaw Consolidation, in: Geotechnical Engineering for Cold Regions, edited by: Andersland, O. B. and Anderson, D. M., McGraw-Hill, ISBN 0-07-001615-1, 1978.
Nixon, J. F. and Morgenstern, N. R.: The Residual Stress in Thawing Soils, Can. Geotech. J., 10, 571–580, https://doi.org/10.1139/t73-053, 1973.
Nixon, J. F. and Morgenstern, N. R.: Thaw–Consolidation Tests on Undisturbed Fine-grained Permafrost, Can. Geotech. J., 11, 202–214, https://doi.org/10.1139/t74-012, 1974.
Northern Engineering Services Company Limited (NESCL): Thaw-Settlement Test Data, Fort Simpson Area, Northern Engineering Services Company Limited, 1976.
Northern Engineering Services Company Limited (NESCL): Laboratory Testing for Thaw Slope Stability: Discontinuous Permafrost Zone, Northern Engineering Services Company Limited, 1977a.
Northern Engineering Services Company Limited (NESCL): Laboratory Testing Program for Thaw-Slope Stability, Continuous Permafrost Zone, Northern Engineering Services Company Limited, 1977b.
Northern Engineering Services Company Limited (NESCL): Thaw Settlement Studies, Proposed Arctic Gas Pipeline Route, Northern Engineering Services Company Limited, 1977c.
Northern Engineering Services Company Limited (NESCL): Thaw Settlement Studies, Proposed Arctic Gas Pipeline Route: Prepared for Canadian Arctic Gas Study Limited, Northern Engineering Services Limited, Calgary, 1977d.
R Core Team: R: A Language and Environment for Statistical Computing, R Foundation for Statistical Computing, Vienna, Austria, https://www.R-project.org/ (last access: 1 August 2025), 2023.
Schneider von Deimling, T., Lee, H., Ingeman-Nielsen, T., Westermann, S., Romanovsky, V., Lamoureux, S., Walker, D. A., Chadburn, S., Trochim, E., Cai, L., Nitzbon, J., Jacobi, S., and Langer, M.: Consequences of permafrost degradation for Arctic infrastructure – bridging the model gap between regional and engineering scales, The Cryosphere, 15, 2451–2471, https://doi.org/10.5194/tc-15-2451-2021, 2021.
Speer, T. L., Watson, G. H., and Rowley, R. K.: Effects of ground-ice variability and resulting thaw settlements on buried warm-oil pipelines, in: North American Contribution to the 2nd International Conference on Permafrost, 13–28 July 1973, Yakutsk, Russian Soviet Federative Socialist Republic, National Academy of Sciences, Washington, D.C., 746–752, ISBN 0-309-02115-4, 1973.
St-Amour, A. B., Allard, M., Chiasson, A., Aubé-Michaud, S., Mathon-Dufour, V., L'Hérault, E., Bilodeau, S., and Deslauriers, C.: Caractérisation géotechnique et cartographie améliorée du pergélisol dans les communautés nordiques du Nunavik, Inukjuak, Québec, 112 pp., https://doi.org/10.60918/2603, 2020.
Tsytovich, N. A.: Bases and foundations on frozen soil, National Academy of Sciences, National Research Council, https://doi.org/10.4224/20358453, 1960.
Wang, Y., Way, R. G., Beer, J., Forget, A., Tutton, R., and Purcell, M. C.: Significant underestimation of peatland permafrost along the Labrador Sea coastline in northern Canada, The Cryosphere, 17, 63–78, https://doi.org/10.5194/tc-17-63-2023, 2023.
Watson, G. H., Rowley, R. K., and Slusarchuk, W.: Performance of warm-oil pipeline buried in permafrost, in: North American Contribution to the 2nd International Conference on Permafrost, 13–28 July 1973, Yakutsk, Russian Soviet Federative Socialist Republic, National Academy of Sciences, Washington, D.C., 759–766, ISBN 0-309-02115-4, 1973a.
Watson, G. H., Slusarchuk, W., and Rowley, R. K.: Determination of some frozen and thawed properties of permafrost soils, Can. Geotech. J., 10, 592–606, 1973b.
Yao, X., Qi, J., Liu, M., and Yu, F.: Pore Water Pressure Distribution and Dissipation During Thaw Consolidation, Transport Porous Med., 116, 435–451, https://doi.org/10.1007/s11242-016-0782-z, 2017.
- Abstract
- Introduction
- Background
- Data aggregation
- Comparison of thaw settlement parameters across soil categories
- Validation of existing thaw strain prediction tools
- Uncertainty and limitations
- Data availability
- Code availability
- Conclusions
- Appendix A: Supplementary information and data
- Author contributions
- Competing interests
- Disclaimer
- Acknowledgements
- Financial support
- Review statement
- References