the Creative Commons Attribution 4.0 License.
the Creative Commons Attribution 4.0 License.
 | 11 Aug 2025
Aerosol single-scattering albedo derived by merging OMI/POLDER satellite products and AERONET ground observations
Yueming Dong
Zhenyu Zhang
Chongzhao Zhang
Qiurui Li
Accurate global aerosol single-scattering albedo (SSA) data are critical for assessing aerosol radiative effects and identifying aerosol composition. However, current satellite-based SSA retrievals are both limited and highly uncertain, whereas the more accurate ground-based observations lack global coverage. In this study, we employ an ensemble Kalman filter (EnKF) data synergy technique to construct two monthly mean SSA datasets over land by synergizing the Ozone Monitoring Instrument (OMI) and Polarization and Directionality of the Earth's Reflectance (POLDER) instrument with Aerosol Robotic Network (AERONET) observations, namely, the Merged-OMI and Merged-POLDER datasets. The background ensemble is constructed with members using all monthly mean OMI/POLDER SSA available to represent the variability of the SSA field. Then, AERONET measurements are assimilated into each satellite dataset using the EnKF approach. The merged datasets show substantial improvements against the original products, with the correlation coefficient increased by up to 100 % and the mean absolute bias (MAB) and root mean square error (RMSE) reduced by more than 30 % compared with the AERONET results. Cross-validation using independent AERONET observations shows an average increase of 64 % in correlation, an 11 % reduction in RMSE, and a 10 % reduction in MAB for the Merged-OMI dataset, as well as similar – although weaker – improvement for Merged-POLDER mainly due to the smaller sample size. This study confirms the effectiveness of the EnKF technique in extending the information obtained from ground stations to larger regions. The two merged datasets generated in this study, available at https://doi.org/10.5281/zenodo.14294462 (Dong, 2025), can offer more accurate SSA estimates for assessing aerosol radiative forcing and improving climate modeling, serving as an important resource for advancing global aerosol research.
- Article
(17792 KB) - Full-text XML
-
Supplement
(22881 KB) - BibTeX
- EndNote


The scattering and absorption property of aerosols, denoted by the single-scattering albedo (SSA) parameter, is critical for assessing aerosol radiative and climate effects (Hansen et al., 1997; Li et al., 2022; Ramanathan et al., 2001), as well as characterizing aerosol type (Dubovik et al., 2002; Omar et al., 2005; Zhang and Li, 2019). It has been identified as a major source of uncertainty in quantifying aerosol climate effects, contributing to over 30 % of the uncertainty in aerosol direct forcing in climate models (Loeb and Su, 2010; Zhang et al., 2022). Moreover, because most satellite-based aerosol optical depth (AOD) retrieval algorithms rely on assumed SSA values, inaccuracies in these assumptions can lead to significant errors in AOD retrievals (Mielonen et al., 2011; Wu et al., 2016; Zhang et al., 2024). Therefore, accurate knowledge of global SSA is needed to reduce uncertainties in global climate change assessments and improve satellite-based AOD retrievals (Kahn, 2012; Li et al., 2022; Thorsen et al., 2021).
Aerosol SSA observations can be derived from satellite- and ground-based remote sensing platforms. Ground-based remote sensing can provide SSA measurements at relatively high accuracy (Dubovik and King, 2000; Sinyuk et al., 2020). For example, SSA retrieved from the Aerosol Robotic Network (AERONET) ground-based sun photometers can have uncertainties within ±0.03 when AOD exceeds 0.4 at 440 nm and is typically used to validate satellite retrieval products (Dubovik and King, 2000). However, the spatial coverage of ground-based stations with consistent SSA measurements is still quite limited, the SSA data of which are far from enough for large-scale global aerosol studies. On the other hand, satellite remote sensing is an indispensable tool in obtaining global SSA information because of its extensive coverage. However, global satellite SSA products are largely limited and highly uncertain due to the great difficulties in their retrieval.
The reflectance at the top of the atmosphere (TOA) observed by satellites comprises a mixture of signals from various sources, including aerosols, gas molecules, and the surface. Most conventional sensors, such as the Moderate Resolution Imaging Spectroradiometer (MODIS), measure only single-view radiation intensity in the visible to near-infrared bands and have insufficient information to retrieve SSA (Dong et al., 2023; Levy et al., 2013). Even with more advanced satellite instruments, retrieving SSA remains challenging due to its high sensitivity to surface reflectance and aerosol vertical distribution (Li et al., 2022; Mahowald and Dufresne, 2004). Currently, global operational satellite SSA products are mainly derived from ultraviolet (UV) or multi-angle polarization (MAP) observations. UV sensors, such as the Ozone Monitoring Instrument (OMI) and Tropospheric Ozone Monitoring Instrument (TROPOMI), can measure SSA according to the upwelling spectral dependence of Rayleigh scattering over sufficiently dark surfaces (Torres et al., 1998, 2020). OMI has been providing SSA retrievals using this method for over 20 years. However, the UV-based SSA products from OMI exhibit significant uncertainties (Jethva et al., 2014), primarily due to the high sensitivity of the UV method to aerosol vertical distribution (Torres et al., 2007). The MAP configuration is widely regarded as the most promising satellite technique for retrieving SSA. The multi-angle view geometry can effectively separate aerosol and surface signals, while the polarization measurements provide high sensitivity to aerosol microphysical properties (Dubovik et al., 2019; Mishchenko et al., 2007). SSA retrievals from MAP instruments, such as the Polarization and Directionality of the Earth's Reflectance (POLDER) instrument and the Directional Polarimetric Camera (DPC), have been validated with moderate accuracy against the AERONET observations, although both of them exhibit obvious systematic biases (Chen et al., 2020; Dong et al., 2024). Other approaches, including combining satellite and ground-based observations or integrating data from multiple satellite sensors, have also been explored but fail to offer global long-term SSA products due to their limited general applicability (Devi and Satheesh, 2022; Dong et al., 2023; Lee et al., 2007). Overall, the existing satellite SSA products usually suffer from significant uncertainties and cannot meet the accuracy required for constraining aerosol radiative forcing on a global scale. Schutgens et al. (2021) intercompared four mainstream satellite SSA products and found that SSA retrievals are generally less accurate than those of AOD. Among them, the MAP SSA product demonstrated the best performance, with the highest correlation of ∼0.77 against AERONET, yet it still exhibited considerable uncertainty. Nonetheless, satellite-based SSA products remain valuable for model evaluation, as their uncertainties are significantly lower than those of current climate models. For instance, Chen et al. (2022) utilized the POLDER/Generalized Retrieval of Aerosol and Surface Properties (GRASP) product to constrain global emissions of absorbing aerosols and successfully reduced the 95 % confidence interval of black carbon direct radiative forcing by a factor of 2. However, this improvement remains insufficient for comprehensive climate change assessments. Considering that the uncertainty interval of ±0.03 is regarded as the upper limit for constraining aerosol radiative forcing, with errors of ±0.03 in SSA leading up to 30 % uncertainties in estimating aerosol direct radiative forcing (Zhang et al., 2022), substantial efforts are still required to derive more accurate global SSA estimates.
As such, a promising approach to obtain accurate global SSA observations is to combine the advantages of ground-based and satellite measurements. Numerous studies made attempts to merge aerosol products from multi-sensors with ground-based observations, using various data-fusion approaches such as the spatial statistical fusion method (Jinnagara Puttaswamy et al., 2014; Nguyen et al., 2012), the universal kriging method (Chatterjee et al., 2010; Zhao et al., 2017), the Bayesian maximum entropy method (Tang et al., 2016; Zhu et al., 2023), and the maximum likelihood estimate method (Xu et al., 2015). In particular, Li et al. (2020) developed a data synergy method based on the ensemble Kalman filter (EnKF) and applied it to produce a merged global AOD dataset using multi-source satellite and ground-based AOD measurements. The EnKF approach constructs an ensemble dataset with sufficient members to capture the variability of AOD at each location and its spatial covariability with other locations, which enables appropriate weights to be assigned to ground-based observations in the data synergy, resulting in substantial improvements in merged data compared to individual satellite data. Therefore, this method has demonstrated strong efficacy and general applicability in integrating ground-based and satellite observations. Overall, the merged datasets show enhanced accuracy compared to individual satellite datasets and offer wider spatial coverage than ground-based datasets, significantly contributing to improved climate models and more accurate estimates of aerosol radiative effects (Kahn et al., 2023). However, the majority of these works focused on merging AOD and fine-mode AOD, whereas there is a significant lack of research on multi-source data fusion for SSA.
In this study, we attempt to generate two merged global land SSA datasets by separately combining OMI and POLDER products with AERONET observations. Our data synergy method follows the EnKF approach developed by Li et al. (2020). OMI and POLDER are separately merged with AERONET due to the large difference and bias between both the data quality and record length of these two datasets. Section 2 describes the details of the methods and data used. Section 3 presents the merged data and the validation of the results. A brief comparison between the Merged-OMI and Merged-POLDER datasets is discussed in Sect. 4, and the final section offers a conclusion with the acquisition of the merged datasets.
2.1 Satellite SSA datasets
To construct an appropriate ensemble with relatively large spread in the data synergy, it is crucial to use a satellite dataset with a long observation period and extensive global coverage. For this purpose, we utilize monthly mean SSA products derived from OMI on board Aura (Torres, 2015) and POLDER on board Polarization and Anisotropy of Reflectances for Atmospheric Sciences coupled with Observations from a Lidar (PARASOL) (Dubovik et al., 2011, 2014). These two sensors offer the longest continuous global SSA observations available to date, and their SSA products have been validated with moderate accuracy. Below is a detailed overview of these two sensors and related SSA products.
OMI on board NASA's Aura satellite has been providing TOA reflectance measurements in three spectral bands ranging from 270 to 500 nm since 2004. A large swath of about 2600 km enables OMI to complete a global scan almost every day with a nadir spatial resolution of 13 km×24 km. Here, we use the monthly mean Level-2G global gridded SSA product OMAERUVG at 0.25°×0.25° for 2004–2023, which is retrieved by the near-UV algorithm (Torres et al., 2007, 2013) (downloaded from http://daac.gsfc.nasa.gov/, last access: 20 April 2025). Jethva et al. (2014) assessed OMI OMAERUV SSA products and found that 46 % and 69 % of OMI SSA retrievals are within the error envelope (EE) of ±0.03 and ±0.05, respectively, compared to AERONET data. The OMAERUV algorithm performs better for carbonaceous and desert dust aerosols, with 52 % and 77 % of samples falling into the EE of ±0.03 and ±0.05. Based on the well-known sensitivity of Rayleigh scattering to aerosol absorption in the UV spectrum, the near-UV algorithm provides SSA retrievals at 354, 388, and 500 nm. For the data fusion, the OMI SSA retrievals are interpolated to the AERONET-measured wavelength of 440 nm (Dong et al., 2023). Specifically, we first calculate the monthly mean AOD and absorption AOD (AAOD) at 440 nm from daily observations, requiring at least three valid daily observations per month. The monthly SSA is then derived from the corresponding monthly AOD and AAOD. To ensure the reliability of the SSA data, AOD threshold filtering is applied to the daily data. Only daily observations with AOD at 440 nm greater than 0.4 are used in the monthly averaging of AOD and AAOD, consistent with the AERONET Level 2.0 criteria. Then, we average the 0.25°×0.25° gridded data to 1°×1° as the background field. The multiyear averaged monthly means are further removed to construct an OMI-based ensemble with 231 members using all monthly mean OMI SSA available from October 2004 to December 2023. At certain grid cells, missing values may occur in some months (as shown in Figs. S1 and S2 in the Supplement). To ensure statistical robustness, we require that each grid cell contain no fewer than 30 ensemble members for both the OMI and POLDER datasets. The standard deviation of all 0.25° grids within the larger 1° grid is used to represent the variability at each location in the OMI-based data fusion (as shown in Fig. S1).
The third POLDER sensor on board PARASOL provided the longest MAP observation records to date, operational from 2005 to 2013. POLDER features eight spectral channels ranging from 443 to 1020 nm, including three polarimetric channels centered at 490, 670, and 865 nm (Tanré et al., 2011). It can observe the target pixel from up to 16 viewing angles. The MAP configuration of POLDER significantly enhances the aerosol retrieval capabilities. Several algorithms have been developed for POLDER, yielding retrievals of multiple aerosol parameters with relatively high accuracy (Dubovik et al., 2019). Two representative algorithms are the Generalized Retrieval of Aerosol and Surface Properties (GRASP) (Dubovik et al., 2011, 2014) and the Remote sensing of Trace gas and Aerosol Products (RemoTAP) (Fu and Hasekamp, 2018; Hasekamp and Landgraf, 2007). Although the RemoTAP algorithm performs better in SSA retrieval than GRASP, only 1 year of POLDER/RemoTAP data are available, with many missing values resulting from the strict quality control in the algorithm, which is insufficient to construct an ensemble with large spread (Hasekamp et al., 2024). Here, we use the POLDER/GRASP High-Precision Level 3 aerosol product (v1.2) at 0.1°×0.1° for 2005–2013 (Chen et al., 2020) (downloaded from https://www.grasp-open.com, last access: 20 April 2025). Chen et al. (2020) evaluated the performance of the POLDER/GRASP aerosol products, showing that SSA can achieve relatively high accuracy, with an R value of 0.54 and a total bias of 0.03 (for GRASP/HP SSA at 670 nm). The monthly mean SSA is calculated using the same method as for OMI. However, we follow the GRASP quality control criteria by retaining only daily observations with AOD at 443 nm greater than 0.3 for the monthly averaging. The POLDER/GRASP SSA products at five bands (i.e., 443, 565, 670, 865, and 1020 nm) are used in the data fusion after averaging to 1°×1° data. Similar to OMI, a POLDER-based ensemble is constructed with 106 members using all monthly mean POLDER SSA available from March 2005 to December 2013. We also calculate the standard deviation of all 0.1° grids within each 1° grid as the representation error in the POLDER-based data fusion (as shown in Fig. S2).
For clarity, the merged SSA based on the OMI OMAERUV product is referred to as the Merged-OMI SSA, while the merged SSA based on the POLDER GRASP High-Precision product is referred to as the Merged-POLDER SSA.
2.2 AERONET ground SSA measurements
The Aerosol Robotic Network (AERONET), operational since 1993, is the largest global network for ground-based aerosol monitoring (Holben et al., 1998). AERONET derives SSA at four discrete wavelength bands (i.e., 440, 670, 865, and 1020 nm) from both direct beam solar radiation and diffuse sky radiance measured by sun photometers (Dubovik and King, 2000). AERONET SSA errors typically decrease as AOD increases, with errors generally within ±0.03 for AOD≥0.4 at 440 nm (Sinyuk et al., 2020).
Here, we use Version 3 Level 2.0 monthly AERONET aerosol products (cloud-screened and quality assured) (Sinyuk et al., 2020), ensuring that the daily SSA error is within ±0.03. The AERONET monthly mean SSA is calculated using the same approach as that applied to the satellite products described in Sect. 2.1. In addition to the SSA at the four operational wavelengths, we also use the spectrally interpolated SSA at 550 nm to generate the merged SSA at 550 nm based on the POLDER dataset. A total of 754 AERONET sites provided monthly SSA data during the OMI observation period (2004–2023), all of which are included in the data fusion based on OMI/OMAERUV SSA products. Of these sites, 452 provided effective monthly SSA data during the POLDER observation period (2005–2013), which are used in the data fusion based on POLDER/GRASP SSA products. Note that all available AERONET observations are assimilated into the background satellite dataset, but only those sites with more than 10 samples during the period of OMI/POLDER are presented in the global maps of evaluation and validation, which will be described in Sect. 3 in detail.
2.3 The EnKF-based data synergy approach
Here, we adopt the EnKF-based data synergy approach developed by Li et al. (2020) with several adjustments and improvements. The EnKF is a flexible data assimilation tool based on the Kalman filter (KF), which estimates the state of a dynamic system by utilizing an ensemble of observation samples (Evensen, 1994). When assimilating ground-based site observations into satellite grid products, the resulting synergy field is a weighted average of the background satellite field and the ground-based observations. Greater weights are assigned to the estimates where the ground-based observations have lower uncertainties (i.e., smaller errors). To be specific, the ground observation y of a true state variable x for a given dynamic system model can be defined as:
H is the observation operator that maps from the scattered observation sites to the satellite grid space, and ε is the observation error of ground-based measurements.
In the synergy, the state variable can be calculated as:
where the superscript a is the synergy field and b is the background field. K represents the Kalman gain, expressed as:
where R denotes the error covariance matrix of the observations.
In our study, we assimilate monthly ground-based SSA observations into satellite grid SSA products at 1°×1° resolution. Specifically, the state variable x is the true SSA value in each 1°×1° grid. y denotes the SSA observations obtained from ground-based AERONET sites. The observation error consists of the measurement error and the representation error. The measurement error reflects the SSA errors of AERONET sun-photometer retrievals and is set to 0.03, as described in Sect. 2.2. The representativeness error indicates the variability of SSA within each 1°×1° grid. Here, we adapt the method proposed by Li et al. (2016). The representation error is approximated as the standard deviation of all subgrid satellite SSA values within each 1°×1° grid, as described in Sect. 2.1.
In the EnKF, an ensemble is constructed to approximate the distribution of the state variable x. Therefore, the sample covariance of the ensemble can be utilized to represent the true background covariance. Assumed to follow a multivariate normal distribution, the background error is expressed as the background covariance matrix P of the ensemble dataset X in the EnKF:
where N is the number of samples in the ensemble. Here, we construct two ensembles using all monthly mean SSA data available for Merged-OMI and Merged-POLDER separately, as described in Sect. 2.1.
Theoretically, EnKF assumes that the size of the ensemble dataset is sufficient to represent the bulk variance of x and that its distribution is ideally unbiased. However, spurious correlation may arise in practice due to insufficient samples or sampling biases in the ensemble (Anderson, 2001). This issue refers to erroneous relationships between locations that are physically distant and not meaningfully correlated, which can lead to incorrect influences of distant observations on the state variable x in the EnKF. To address this problem, we apply the covariance localization by truncating long-range correlations in the error covariance matrix beyond a predetermined distance l. Therefore, the covariance matrix accounts only for the impact of observations within the specified distance l from each location, thereby avoiding the influence of distant observations (Hamill et al., 2001; Houtekamer and Mitchell, 2001). In this study, we follow the approach of Gaspari and Cohn (1999) and Li et al. (2020) to denote the localized covariance Plocal as the product of the background covariance matrix P and the localization function ρ. For a given location, the correlation of observations from other locations decreases with increasing distance and becomes zero at a distance of 2c. The relationship between c and the truncation distance l is generally set as (Lorenc, 2003):
Then, the localization function ρ is calculated as:
where z represents the Euclidean distance between two locations. Here, we consider l to be 3000 km as a global average optimal value after testing the distance from 1000 to 5000 km.
2.4 Evaluation approaches
To evaluate the performance of the merged dataset, we examine the statistical parameters, including the linear regression equation (slope and intercept), the mean absolute bias (MAB), the correlation coefficient (R), and the root-mean-square error (RMSE). Following Li et al. (2020), two cross-validation (CV) methods are applied to assess the effectiveness of the EnKF approach at locations where surface observations are not assimilated. These methods are the regional 3-fold cross-validation (Region-3-CV) and the leave-one-out cross-validation (LOO-CV). The Region-3-CV is a regional adaptation of the traditional K-fold CV. Specifically, we select nine typical regions globally (i.e., North America, South America, Europe, North Africa, the Sahel, the Middle East, India, East Asia, and Southeast Asia), each containing more than three AERONET sites. In each region, a site-based 3-fold CV is performed, i.e., the sites are divided into three subsets, two of which are used for data fusion at each iteration, and then the performance of the regional merged result is tested at the sites not involved in the fusion process. Regional CV is preferred over global CV due to the limited spatial representativeness of surface sites within a 3000 km distance, as discussed in Sect. 2.3. Remote sites are excluded from the regional validation, as they do not influence the merged result. For the LOO-CV, we still use all the sites selected in the Region-3-CV as the whole evaluation dataset and iterate through each site as a validation set, with the remaining sites used for data fusion. This process is repeated until all sites have been validated once, providing an assessment of the EnKF performance across the full dataset. Note that only AERONET sites with at least 20 samples during the OMI/POLDER period are used in both CV methods.
In this study, we utilize the monthly mean SSA products from OMI and POLDER separately as the background SSA fields. AERONET SSA observations are assimilated into these satellite background fields using the EnKF approach, resulting in the Merged-OMI SSA data at 440 nm from October 2004 to December 2023 and the Merged-POLDER SSA data at 440, 550 (565), 670, 865, and 1020 nm from March 2005 to December 2013. We primarily focus on the data synergy over global land area, as there are few AERONET stations located over the ocean. Additionally, the ensemble spread over ocean is relatively large, with potentially large retrieval uncertainties under low aerosol loadings there (as shown in Figs. S1 and S2).
3.1 Analysis of a representative case
To illustrate how our EnKF method integrates ground-based and satellite observations from different sources, we first show a representative case in the Sahel before presenting the global synergy results. We select the Banizoumbou site, with more than 100 AERONET SSA observations, and assimilate these observations into the satellite background field to examine the performance of the merged data at this site as well as at nearby sites.
Figure 1 presents the comparison between the Merged-POLDER SSA and the original POLDER data at 670 nm for the Banizoumbou site. Similar results can be obtained from the Merged-OMI SSA at 440 nm, which are shown in Figs. S3 and S4 in the Supplement. Although the original POLDER SSA (blue line in Fig. 1a) shows reasonable agreement with AERONET SSA at Banizoumbou, the POLDER/GRASP product tends to underestimate SSA in most cases, with several exceptions of overestimation in 2006 and 2010. These biases are largely corrected in the merged data (red line in Fig. 1a). Figure 1b also demonstrates that the merged data exhibit higher consistency with AERONET compared to the original POLDER SSA, with the R value increasing by 86 % from 0.35 to 0.65, the MAB decreasing by 40 % from 0.035 to 0.021, and the RMSE reducing by 39 % from 0.044 to 0.027. These improvements are expected, as the merged results at this site represent an error weighted mean of the original POLDER retrievals and AERONET observations.
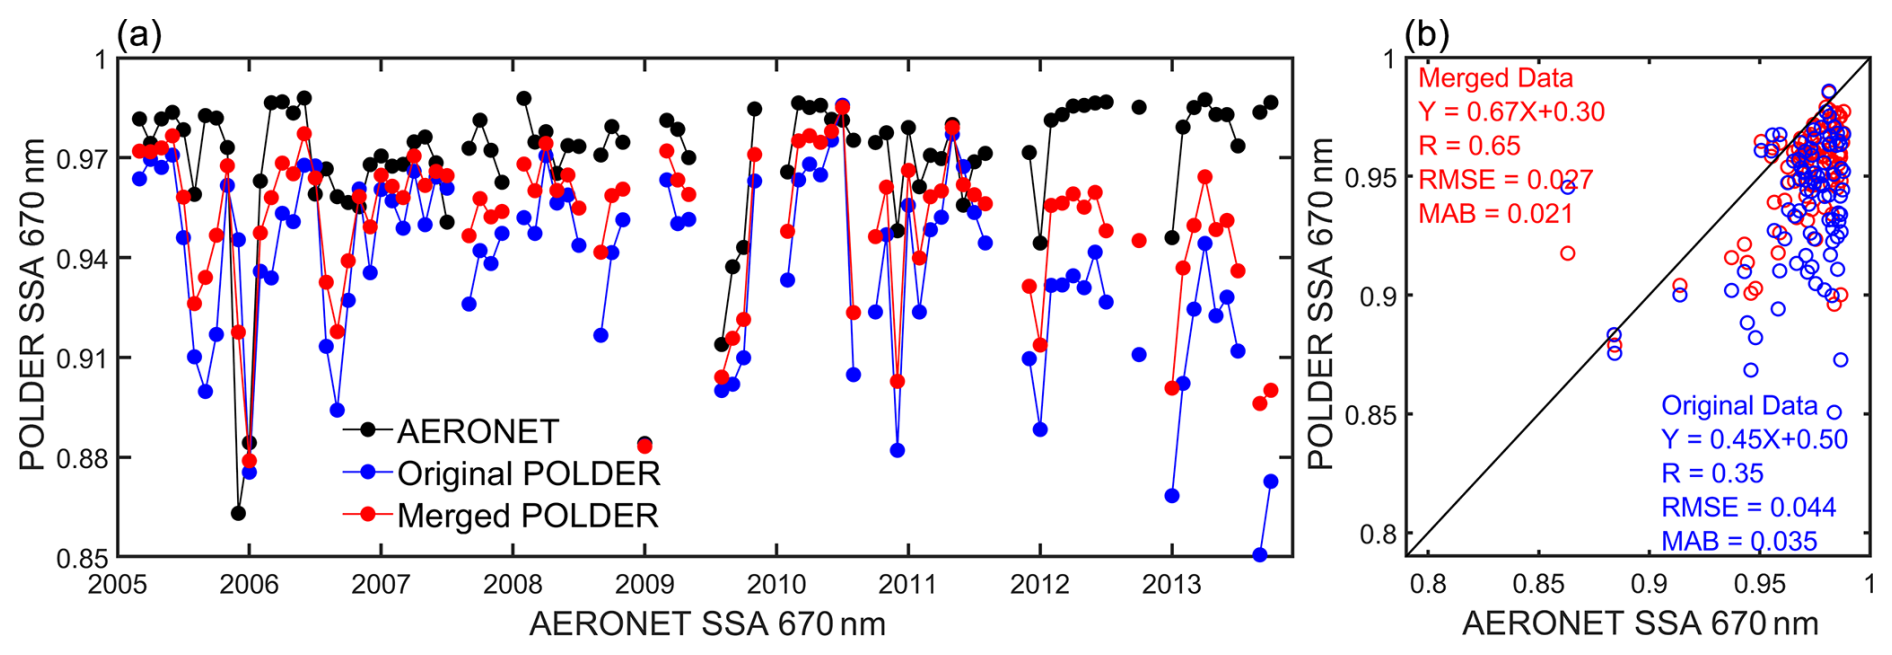
Figure 1Example case of data synergy at the Banizoumbou site located in the Sahel: (a) the time series of monthly mean SSA at 670 nm and (b) the scatterplot of the original POLDER and the merged SSA at 670 nm compared to the AERONET observations.
A more important concern is whether the merged data can improve SSA estimates at nearby sites, where observations are not assimilated. We examine the performance of the merged data in the entire Sahel region, and the relative changes in the accuracy of the merged data against the original POLDER SSA are shown in Fig. 2. In addition to the Banizoumbou site (marked as a triangle), SSA estimates for all the other eight nearby sites (the circles in Fig. 2) show remarkable improvements, with the R values increasing by 10 %, the MAB decreasing by 19 %, and the RMSE decreasing by 25 % on average. Although the improvements at these nearby sites are less pronounced than those at Banizoumbou, the results of this case clearly demonstrate the effectiveness of the EnKF data synergy method in extending the information to a greater area. It can enhance the spatial impact of AERONET site observations and reduce the uncertainties of satellite-derived SSA at both local and regional scales.
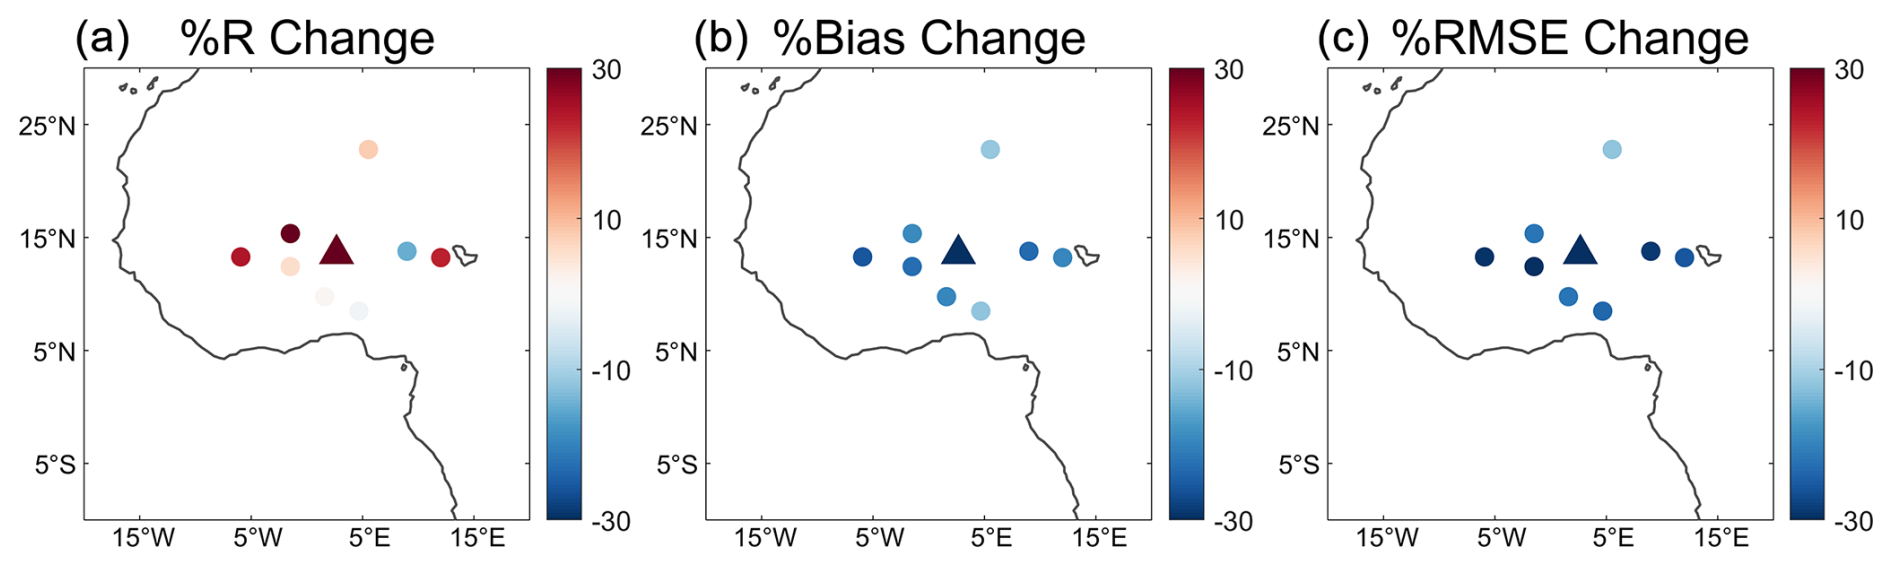
Figure 2After assimilating the observations at the Banizoumbou site, the changes in (a) R, (b) MAB, and (c) RMSE compared with the original POLDER SSA at 670 nm relative to AERONET sites in the Sahel.
3.2 Evaluation of Merged-OMI data
The overall performance of the Merged-OMI result is examined in this section. A total of 10 204 monthly SSA observations at 754 AERONET sites are assimilated into the background OMI field during the period from 2004 to 2023. Figure 3 evaluates the original OMI data and the Merged-OMI SSA at 440 nm compared with AERONET observations, respectively. The original OMI SSA against AERONET shows a moderate correlation, with an R value of 0.53, an RMSE of 0.031, and an MAB value of 0.024. Many improvements are noticed in the Merged-OMI SSA, reaching a higher R value of 0.73, a lower RMSE value of 0.025, and a lower MAB value of 0.019. The systematic bias is significantly corrected, with the slope of the regression equation increasing from 0.39 to 0.62, which affirms the effectiveness of the EnKF approach.
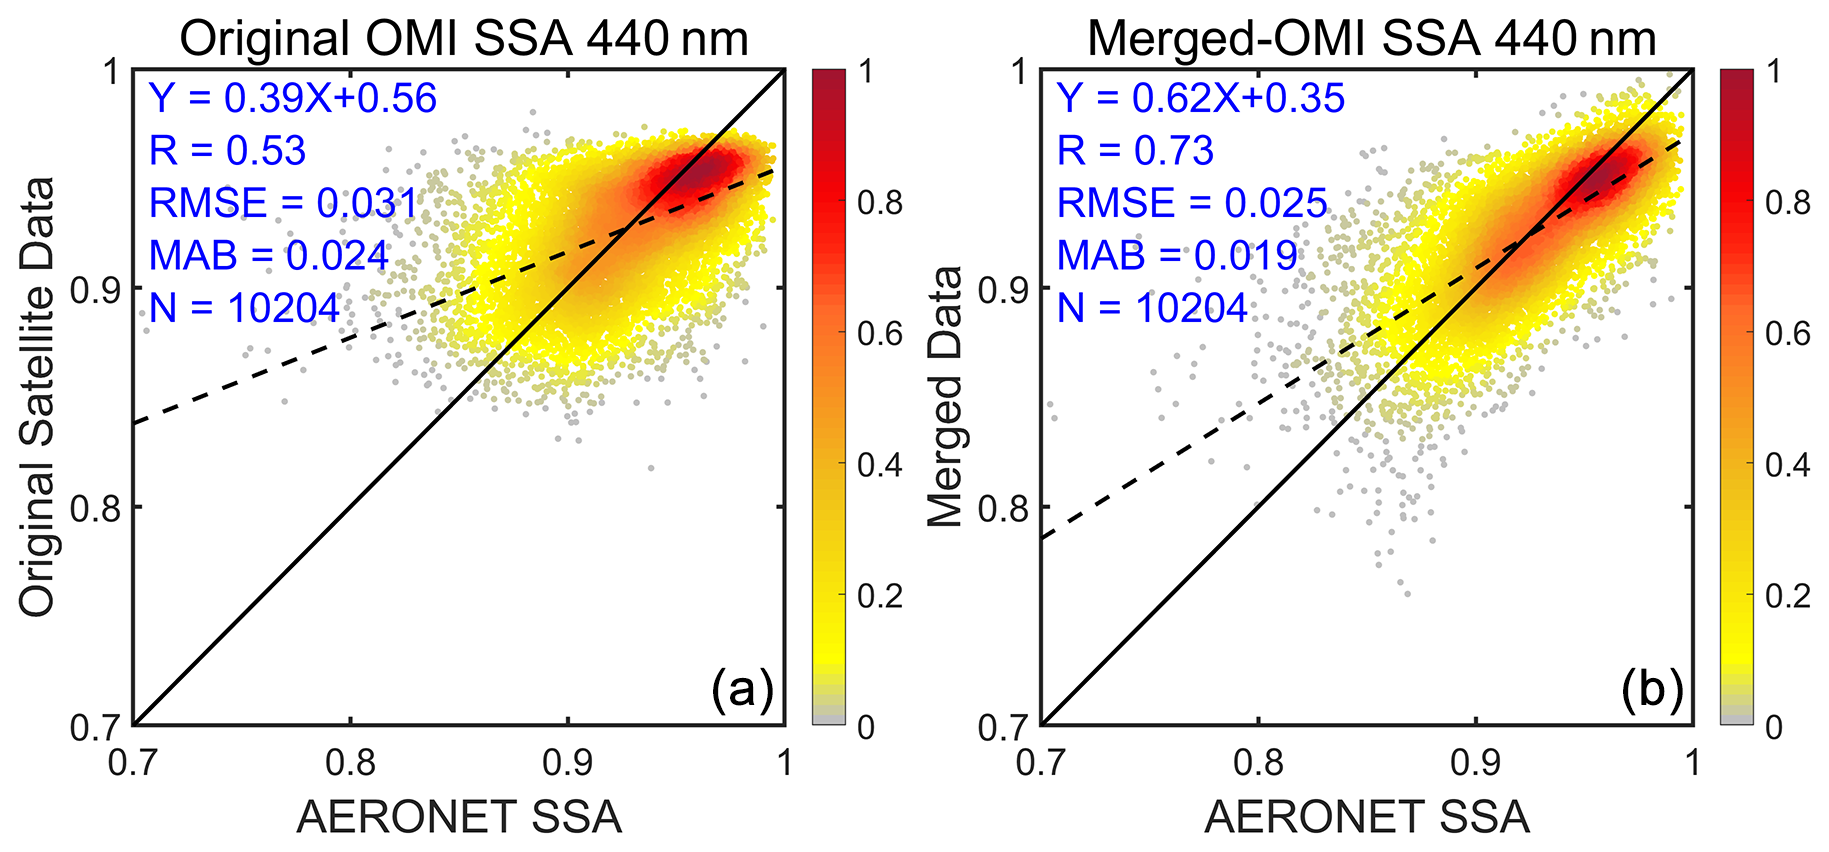
Figure 3The density scatterplots of the original OMI SSA and the Merged-OMI SSA compared with AERONET SSA at 440 nm.
We further compare the spatial distribution of the original OMI and the Merged-OMI datasets to gain an overview of the effect of the EnKF approach on a global scale. Figure 4 displays the global annual SSA distribution at 440 nm of the Merged-OMI and the original OMI data, along with their differences. There are 241 AERONET sites with more than 10 samples during the OMI period in 2004–2023, marked with circles in Fig. 4. The original OMI data show an underestimation of the annual SSA in North Africa, the Middle East, and North America and an overestimation in the Sahel, South Africa, India, East Asia, and Southeast Asia. These biases have been largely corrected in the Merged-OMI data. Especially in the Middle East, India, East Asia, and Southeast Asia, the changes in the annual mean SSA are ∼0.02. A more detailed seasonal analysis is demonstrated in Fig. 5. The seasonal performances are generally consistent with the annual results but with some notable regional differences. Specifically, in India, East Asia, and Southeast Asia, the original OMI SSA is consistently biased high throughout the year, with the most pronounced overestimation occurring in March, April, and May (MAM). Frequent dust storms and long-range transport in MAM typically result in lower SSA in India and East Asia (Proestakis et al., 2018; Zhu et al., 2007), whereas active biomass burning events also contribute to the lower SSA in Southeast Asia (Li et al., 2020). Consequently, the original OMI data in MAM tend to show more significant overestimation in these regions, where the largest improvements in the Merged-OMI data are also noticed in MAM. The Middle East is characterized by predominant dust aerosols, and significant underestimation of the original OMI SSA is observed during active dust periods of MAM and June, July, and August (JJA) (Engelstaedter et al., 2006), with effective corrections in the Merged-OMI data. North America exhibits slight positive change in the Merged-OMI data to correct the underestimation of the original OMI SSA in JJA and September, October, and November (SON). In South Africa, the Merged-OMI SSA decreases the positive biases caused by the overestimation in the original OMI SSA during the biomass burning seasons in MAM, JJA, and SON. In North Africa, the original OMI SSA is overestimated in MAM and December, January, and February (DJF) but underestimated in JJA. The Merged-OMI data largely adjust these seasonal biases but show an indistinct difference in the annual mean SSA due to the balancing of seasonal over- and underestimations. Similar situations can also be observed in the Sahel, where the original SSA is significantly underestimated for dust aerosols in MAM but overestimated for biomass burning aerosols in DJF. The opposing effects of the seasonal corrections are neutralized in the Merged-OMI data, resulting in a limited difference in the annual mean SSA. It is important to emphasize that the observed changes are not confined to the AERONET sites but extend to the regional scale. These results confirm that the EnKF-based fusion approach enhances the representativeness of ground-based observations, allowing localized data to inform and improve satellite retrievals over larger regions.
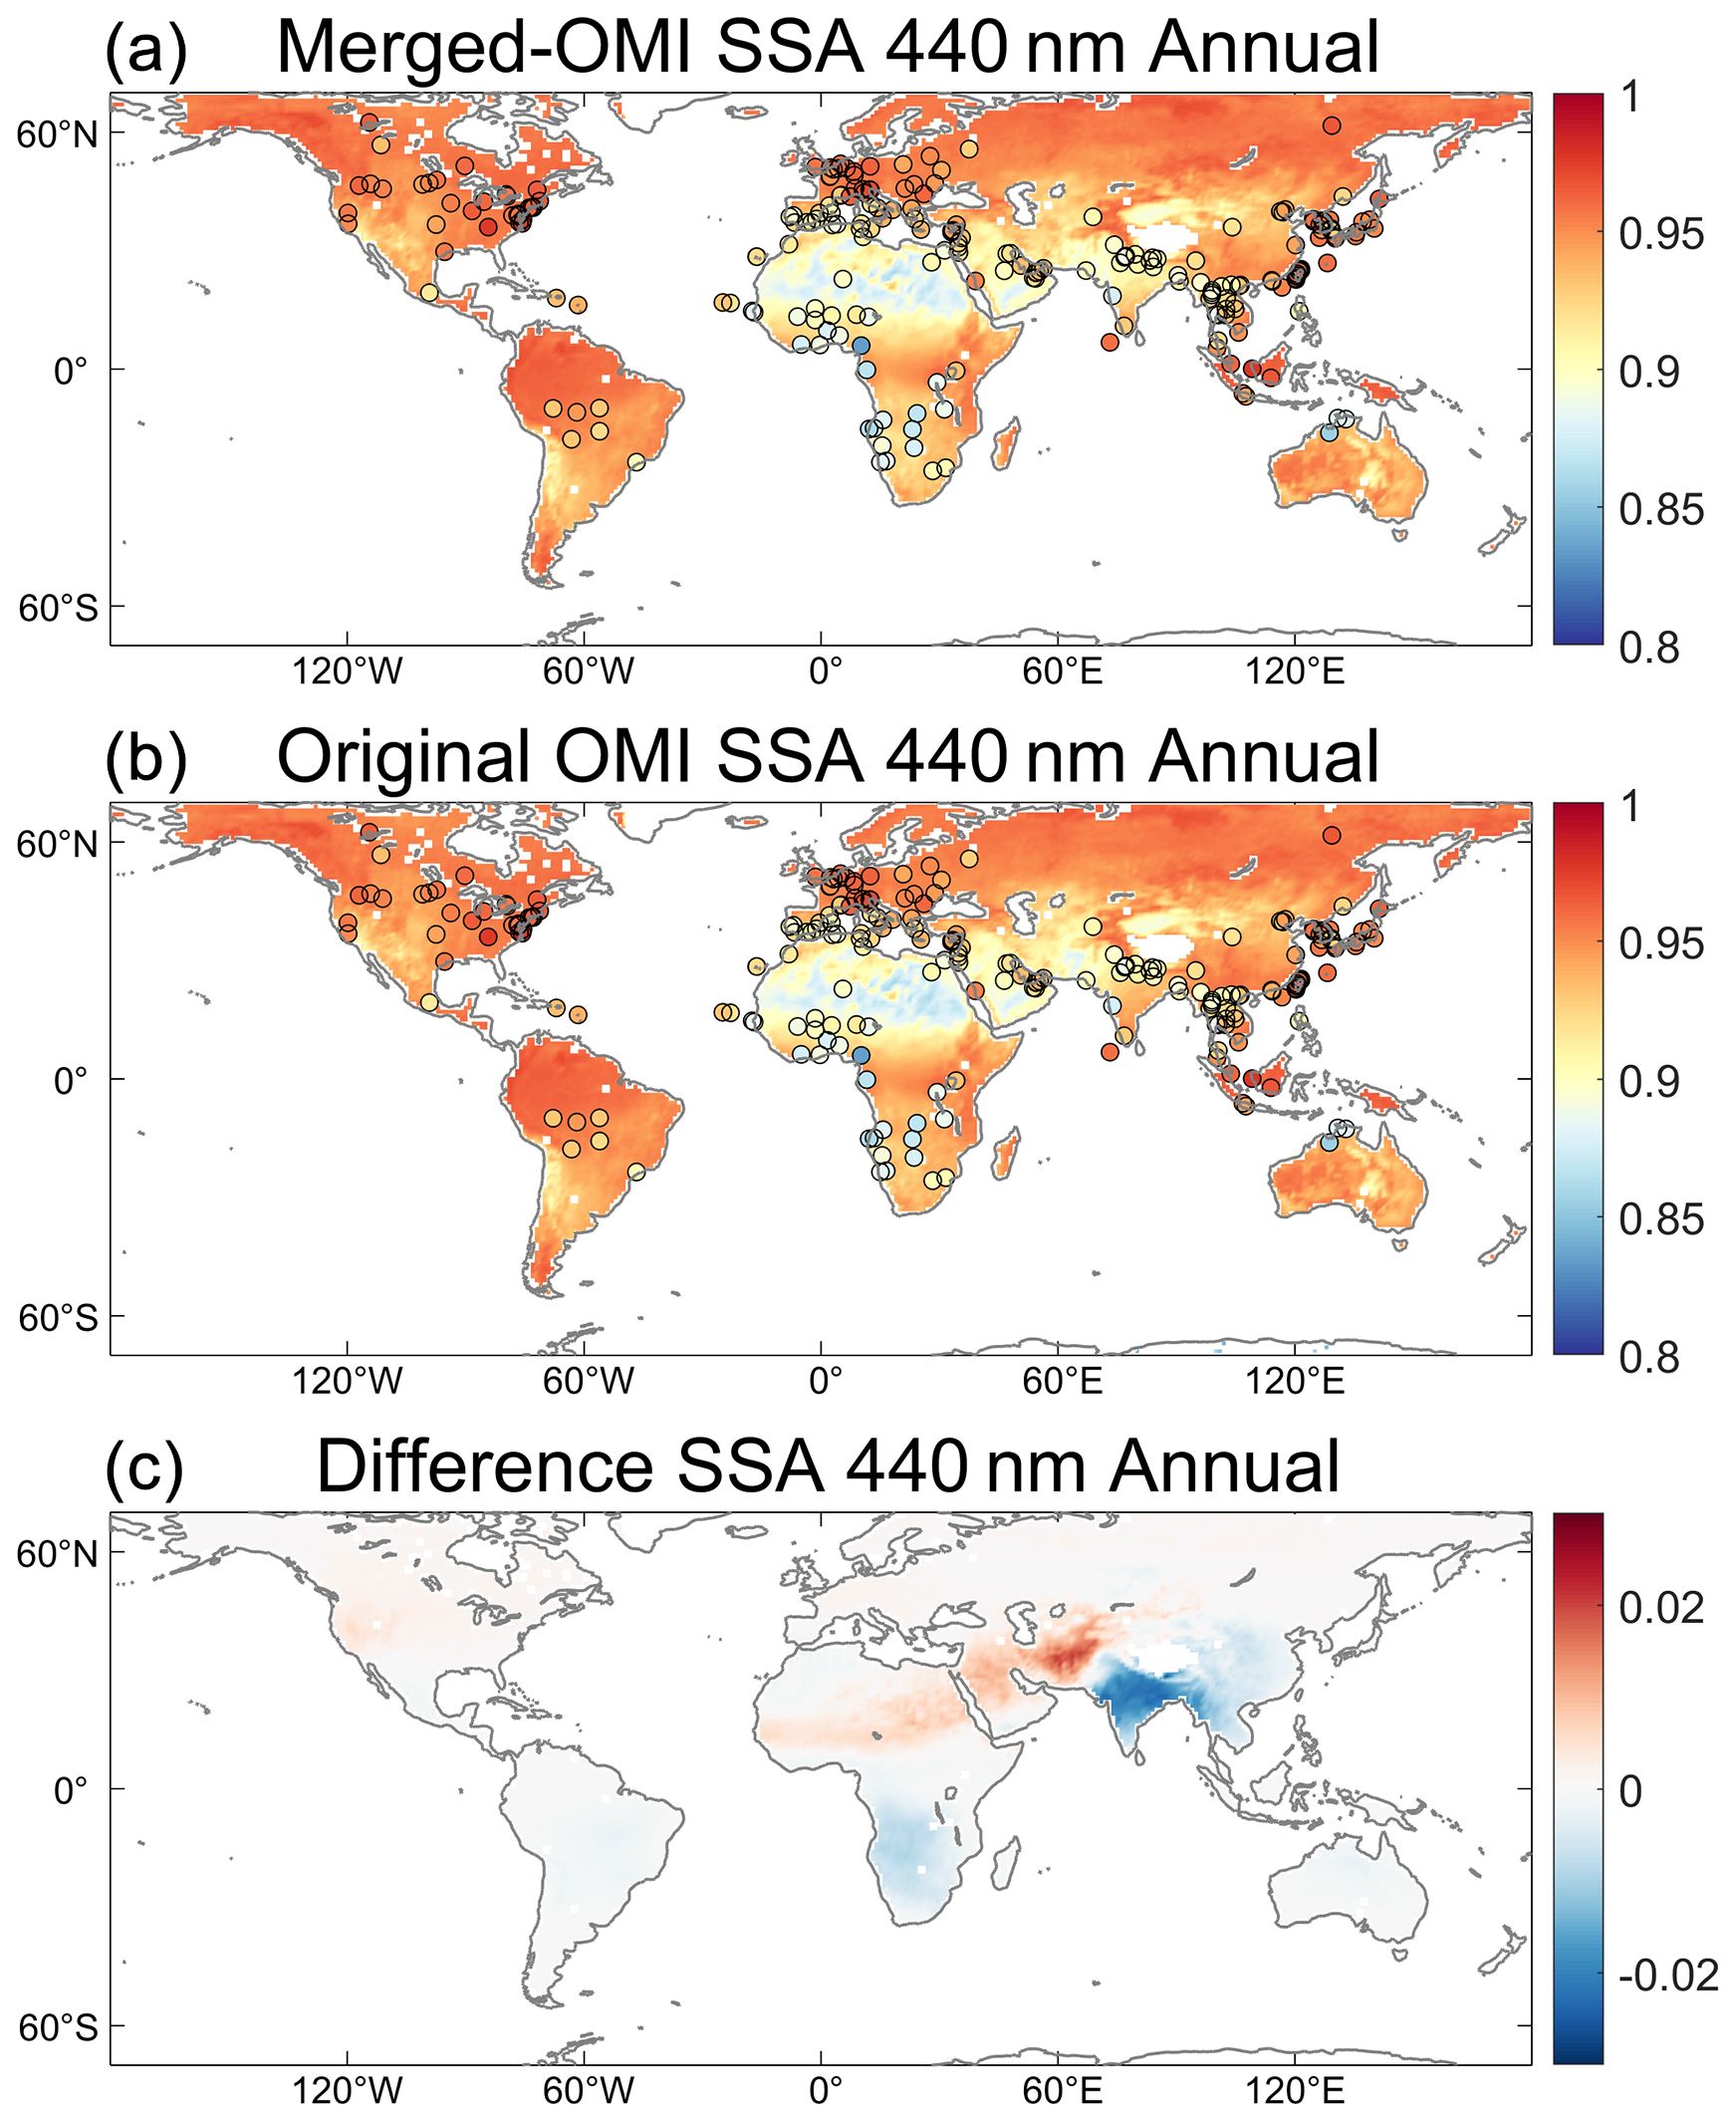
Figure 4(a) The annual mean SSA at 440 nm for the Merged-OMI data, (b) the annual mean SSA at 440 nm for the original OMI data, and (c) their differences (merged – original). Circles in (a) and (b) mark the observations at AERONET sites.
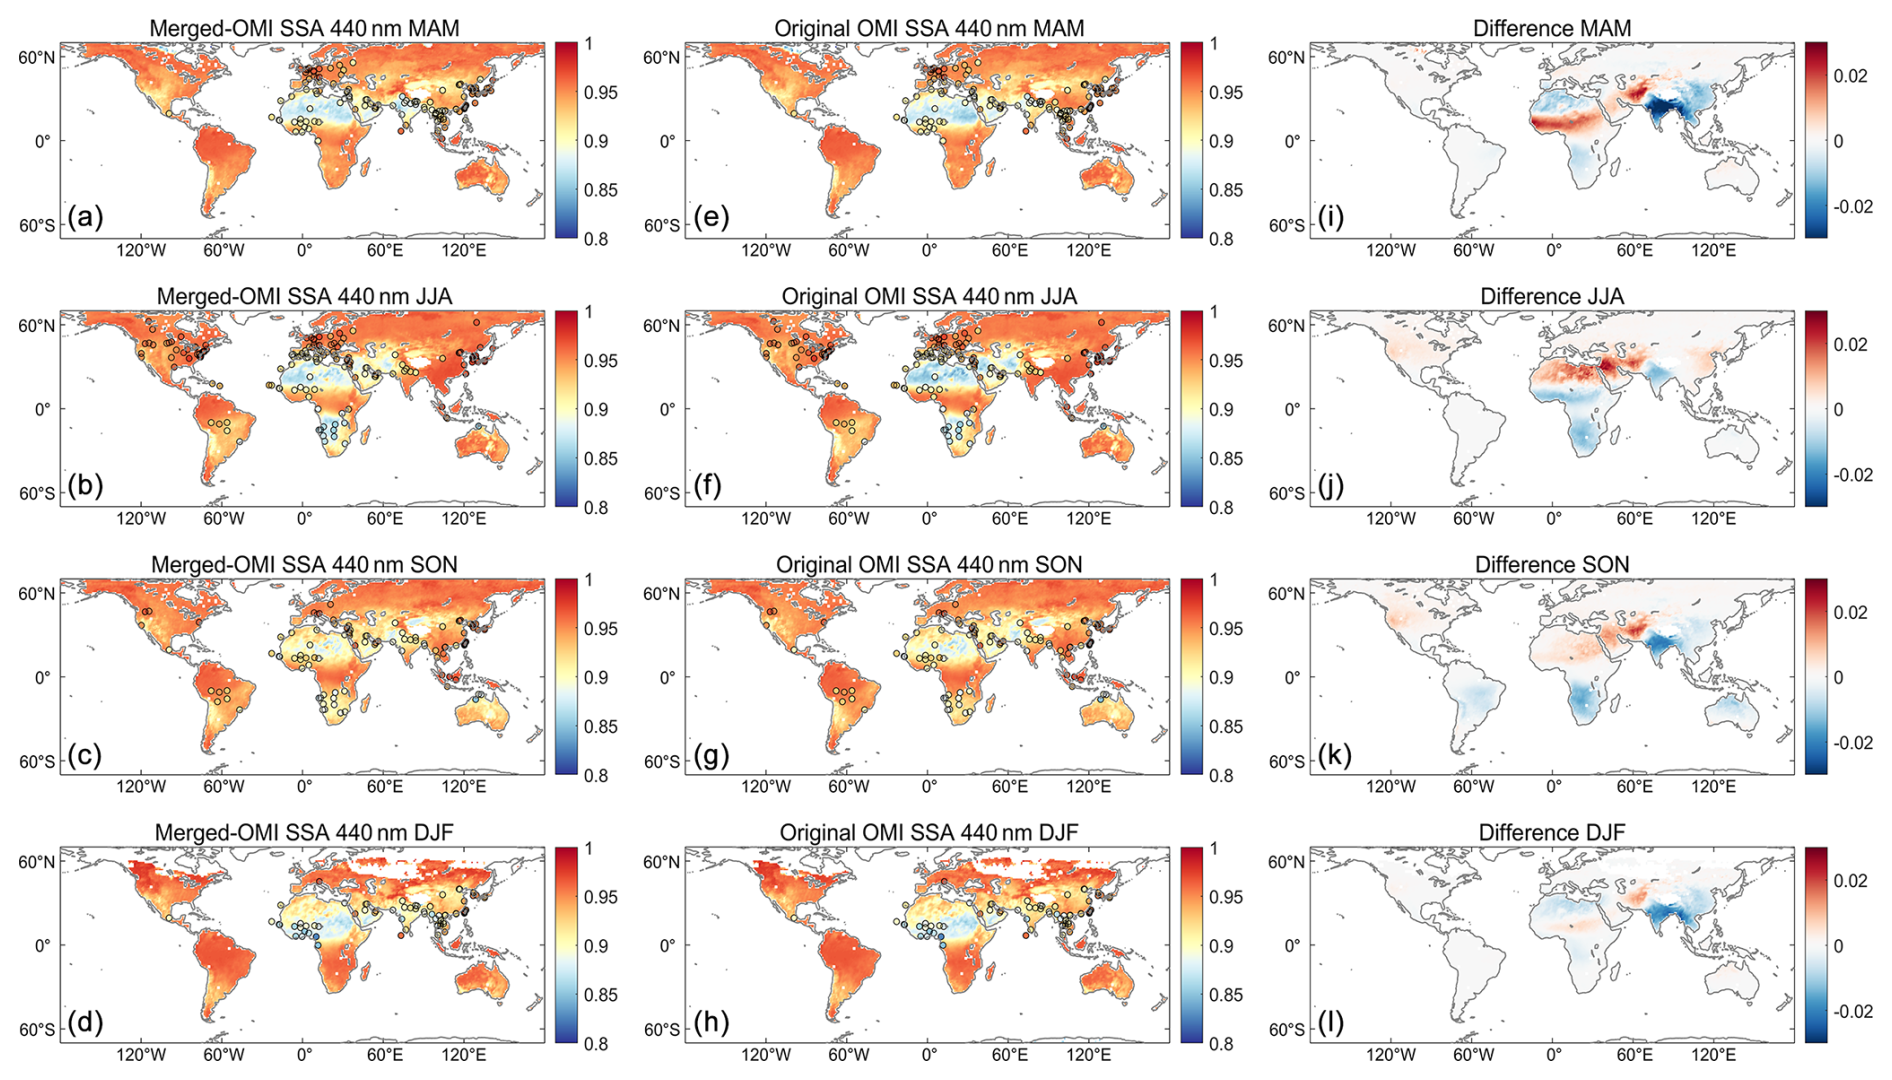
Figure 5The same figure as Fig. 4 but for the seasonal mean SSA at 440 nm.
To quantify the performance of the Merged-OMI dataset in different regions, we further examine the spatial distribution of the three statistical parameters (i.e., R, MAB, and RMSE) of the original OMI SSA compared to AERONET observations and their relative changes in the Merged-OMI data. Note that all the statistical parameters are calculated only at 142 AERONET sites with at least 20 monthly samples. As shown in Fig. 6, the Merged-OMI data have substantial improvements at most AERONET sites, with increases in R values and reductions in both MAB and RMSE values. Especially in the Middle East, Europe, and most of the Sahel, the increase in R values can reach as much as 100 %, while the MAB and RMSE values decrease by ∼30 % or more. Moderate improvements can be observed in North Africa, South America, and East and Southeast Asia. Despite there being very few AERONET sites, the Merged-OMI SSA in North America and Oceania still exhibits notable reductions in the MAB and RMSE values, correcting the large deviations in the original OMI data from AERONET. In South America, the original OMI SSA performs well, with relatively low MAB and RMSE, and the Merged-OMI data also exhibit a slight improvement. However, the performance of the Merged-OMI SSA decreased at several sites in the Sahel and India. This may be attributed to insufficient spatial sampling of AERONET or large regional variabilities of SSA, which result in the poor representativeness of AERONET sites in these regions. To address this issue, our future work will further evaluate the representativeness of AERONET sites in different regions to refine the EnKF data synergy method.
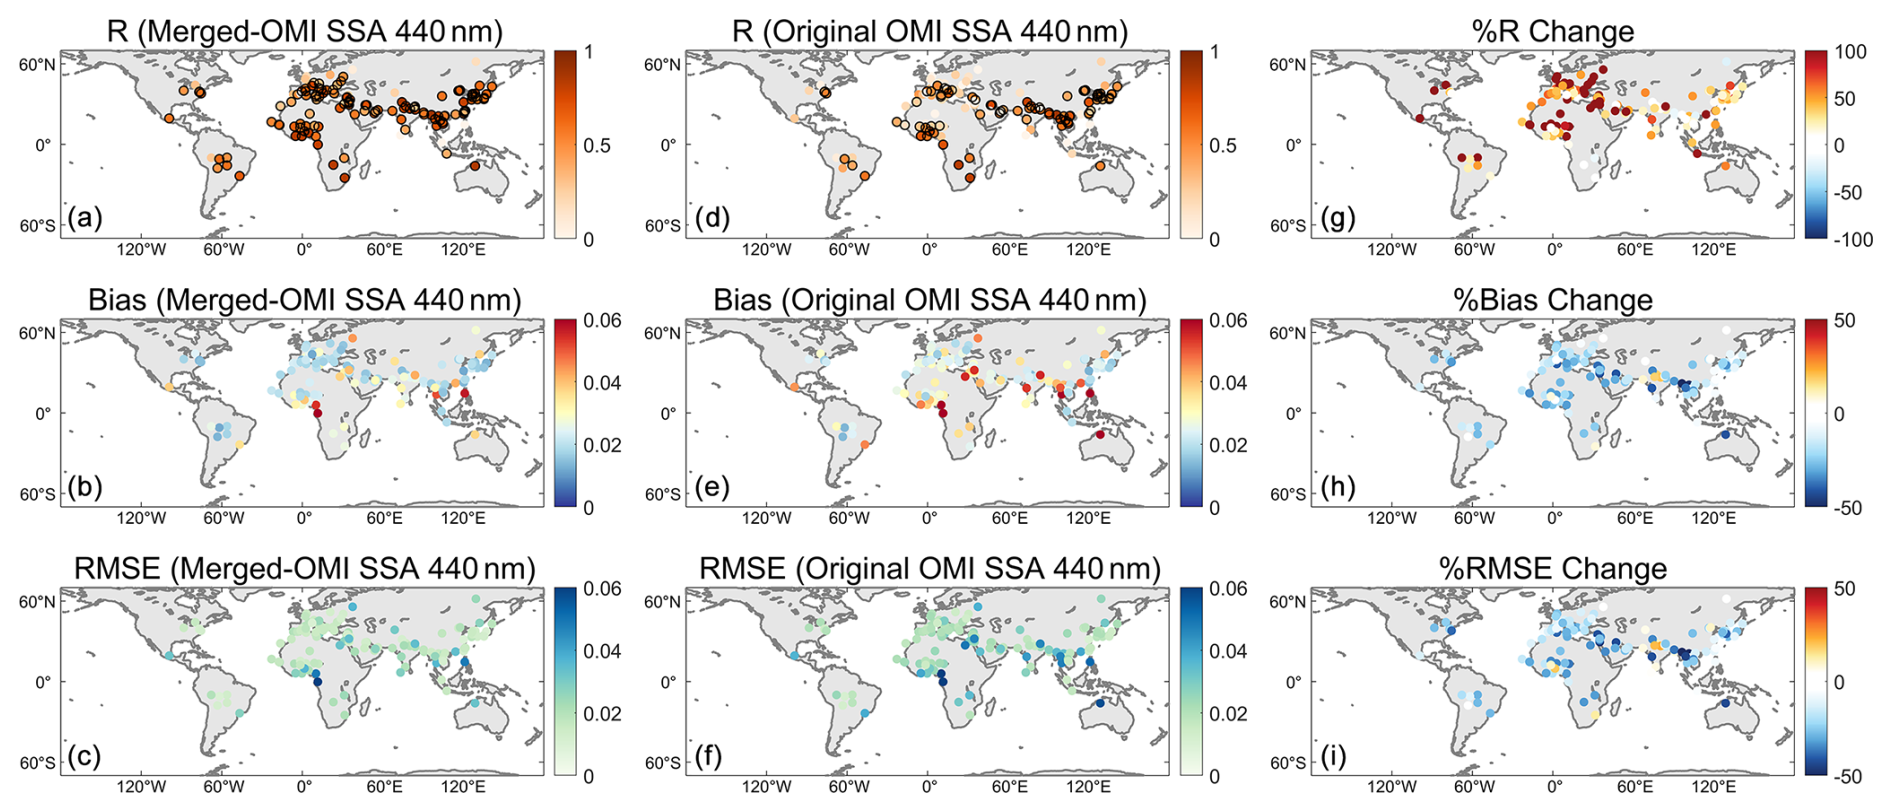
Figure 6Global distribution of R (a, d, g), MAB (b, e, h), and RMSE (c, f, i) in comparison to AERONET for the monthly mean Merged-OMI SSA at 440 nm (a–c), original OMI SSA at 440 nm (d–f), and their relative changes (g–i). Circles in (a) and (b) indicate significance at the 95 % confidence level.
3.3 Cross-validation of Merged-OMI data
To fully evaluate the performance of the data synergy, it is more critical to examine the performance at regions where ground-based observations are not assimilated or not available. For this purpose, we employ the Region-3-CV and LOO-CV as described in Sect. 2. The globe is divided into 13 regions, similar to Li et al. (2020). However, only nine of them have at least three effective sites (with more than 20 samples, as described in Sect. 2.1) during the OMI period in 2004–2023, which are then used for the validation of the results (Fig. S5 in the Supplement). These nine regions are North America, South America, Europe, North Africa, the Sahel, the Middle East, India, East Asia, and Southeast Asia, respectively.
Figure 7 evaluates the LOO-CV and the Region-3-CV OMI SSA at 440 nm against AERONET observations. Both CV schemes show notable improvements compared with the original OMI SSA. For the LOO-CV results, the R value increases from 0.55 to 0.62, the MAB reduces from 0.023 to 0.021, and the RMSE decreases from 0.030 to 0.028. Similar improvements are observed with the Region-3-CV, where the R value increases from 0.57 to 0.66, the MAB decreases from 0.023 to 0.020, and the RMSE reduces from 0.030 to 0.027. On average, both CV methods show an approximately 15 % improvement in correlation and, respectively, 10 % and 13 % RMSE and bias reductions. These CV results confirm the effectiveness of the EnKF approach in regions where the ground observations are not assimilated.
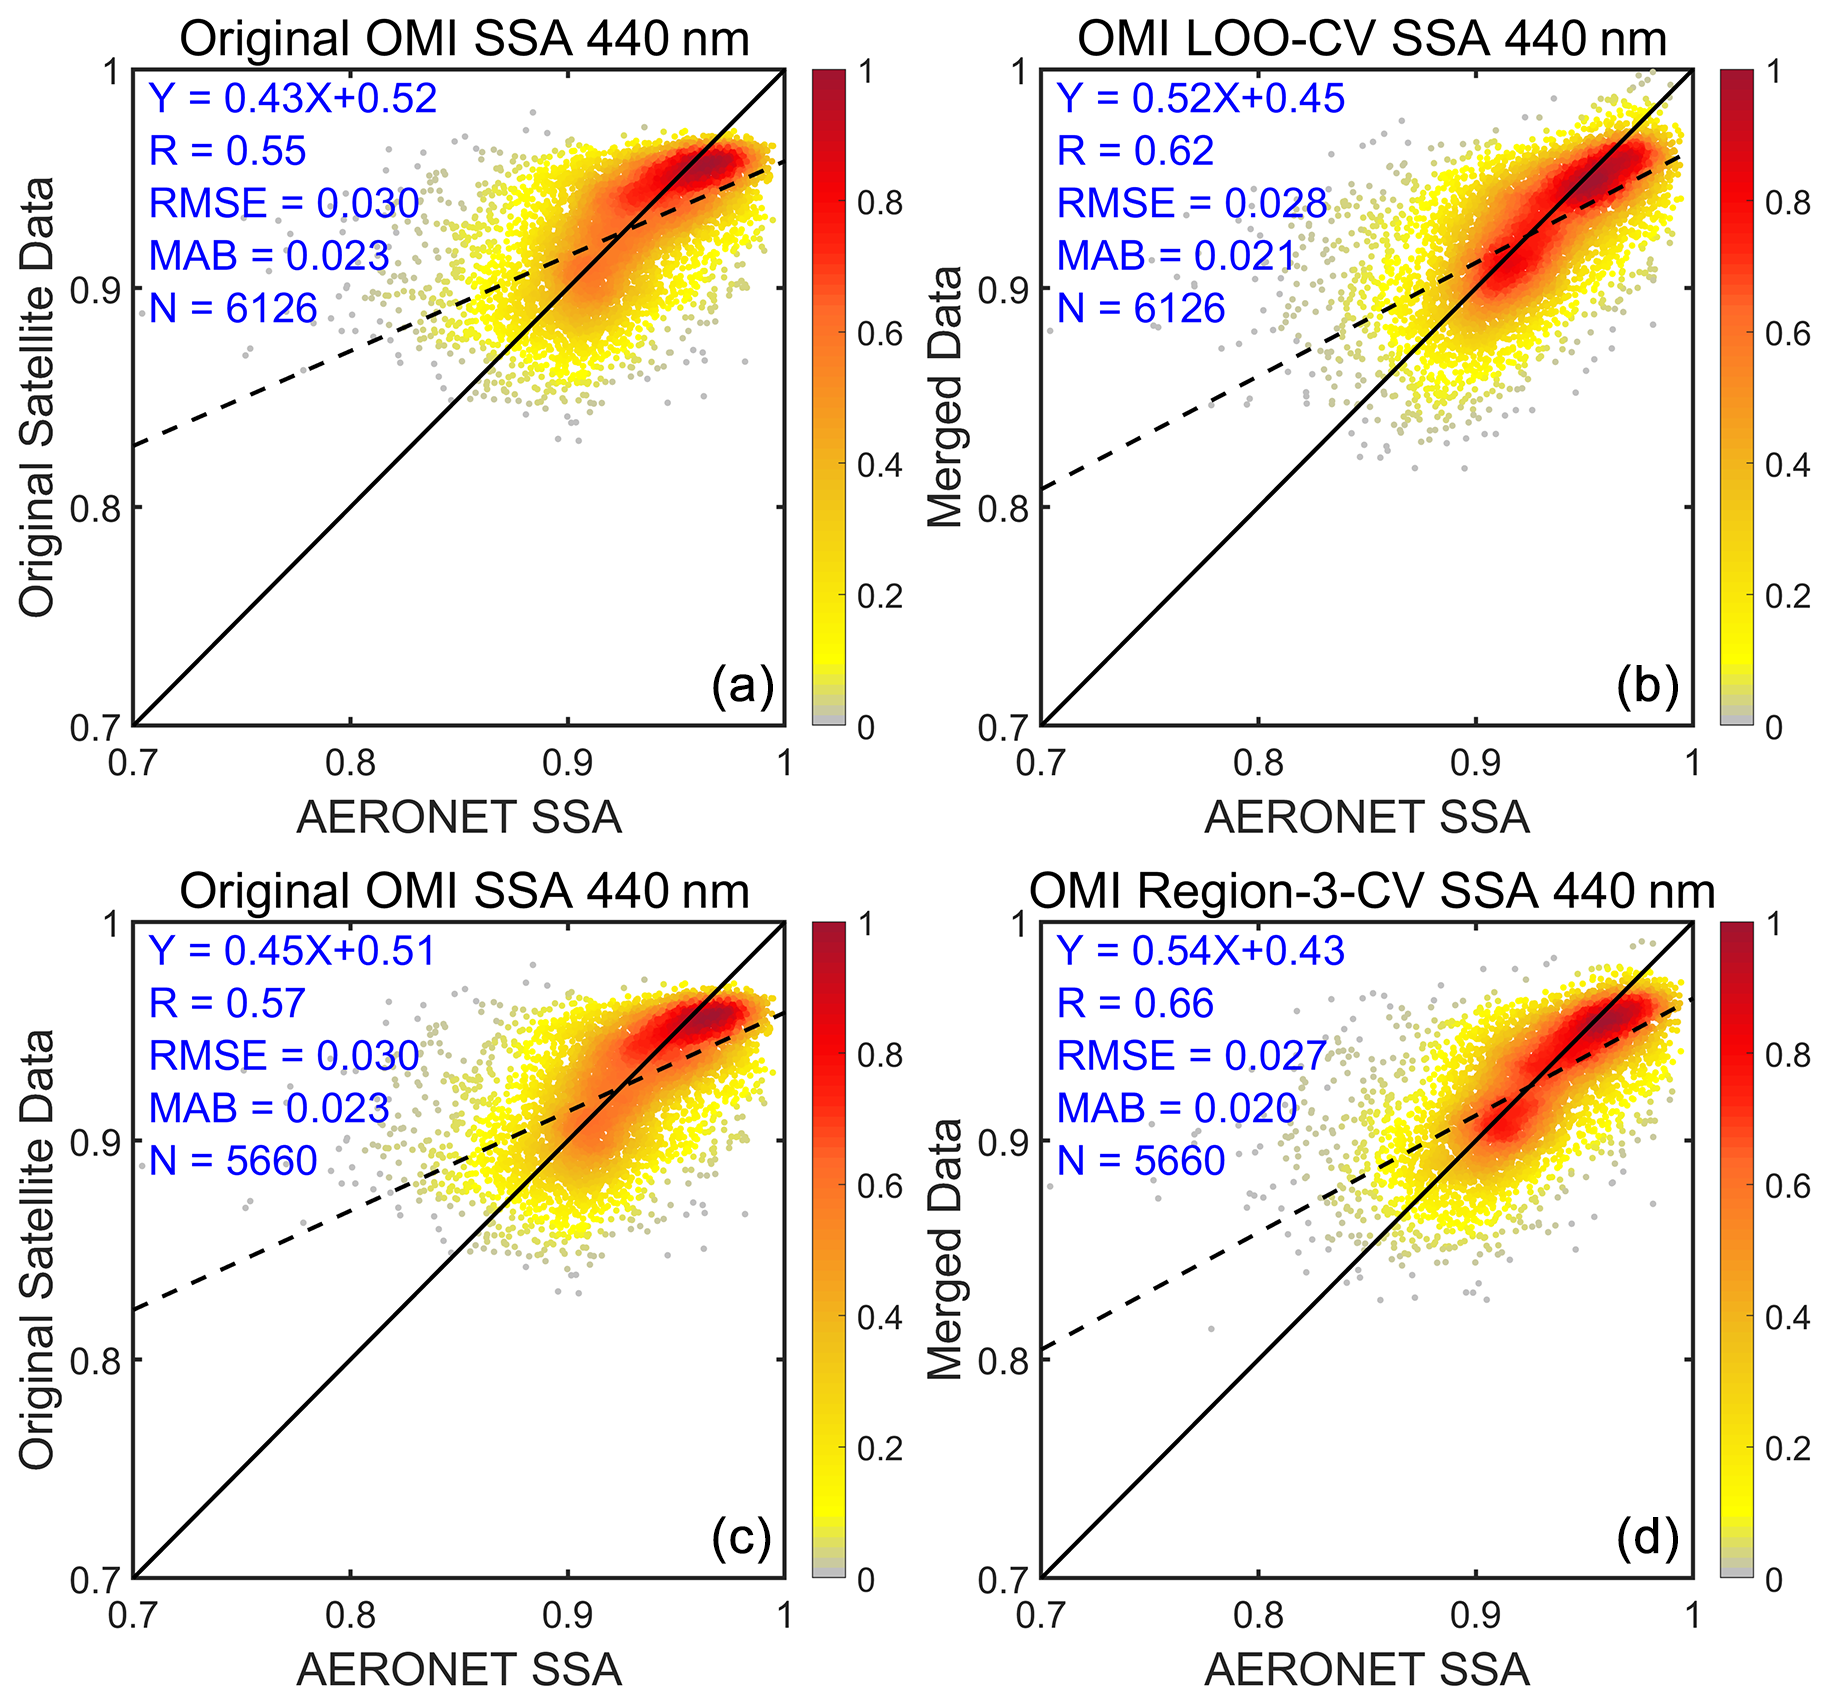
Figure 7The density scatterplots of (a) the original OMI SSA for LOO-CV, (b) the OMI LOO-CV SSA, (c) the original OMI SSA for Region-3-CV, and (d) the OMI Region-3-CV SSA compared with the AERONET SSA at 440 nm.
Further spatial analysis in Fig. 8 indicates that both CV schemes produce similar spatial patterns, with Region-3-CV yielding slightly better results. The majority of AERONET sites are characterized by increased R values and decreased MAB and RMSE values, although the magnitude of these changes is smaller than that shown in Fig. 6. Globally, the Region-3-CV results show average reductions in MAB and RMSE of 11 % and 10 %, respectively, with an average 64 % increase in R values. The decreases in MAB and RMSE can even exceed 30 % at certain sites. Of the 120 validation sites, 113 sites exhibit decreased MAB and RMSE, and 103 sites show increased correlations. The LOO-CV results show a similar spatial pattern but weaker improvements overall. This can be attributed to the shorter distances among the sites within a region, allowing for stronger spatial correlation and influence from nearby sites. As a result, Region-3-CV can better preserve the impact of observations at closely situated AERONET sites. Note that the truncation distance we adapt in the localization function as described in Sect. 2.3 is an optimal value for a global scale, whereas the optimal truncation distance may vary with location. In cases where the truncation distances for some sites are smaller than our predefined threshold, LOO-CV may bring uncertainties from the observations at remote sites with poorer representativeness and spurious correlation, which may cause weaker results than Region-3-CV. In the future, we will further investigate the differences of the representativeness and the truncation distances for ground-based sites in different regions to refine our data synergy scheme. Additionally, the lack of sufficient high-quality AERONET SSA observations makes it difficult to validate the performance of the assimilation in South Africa and Oceania.
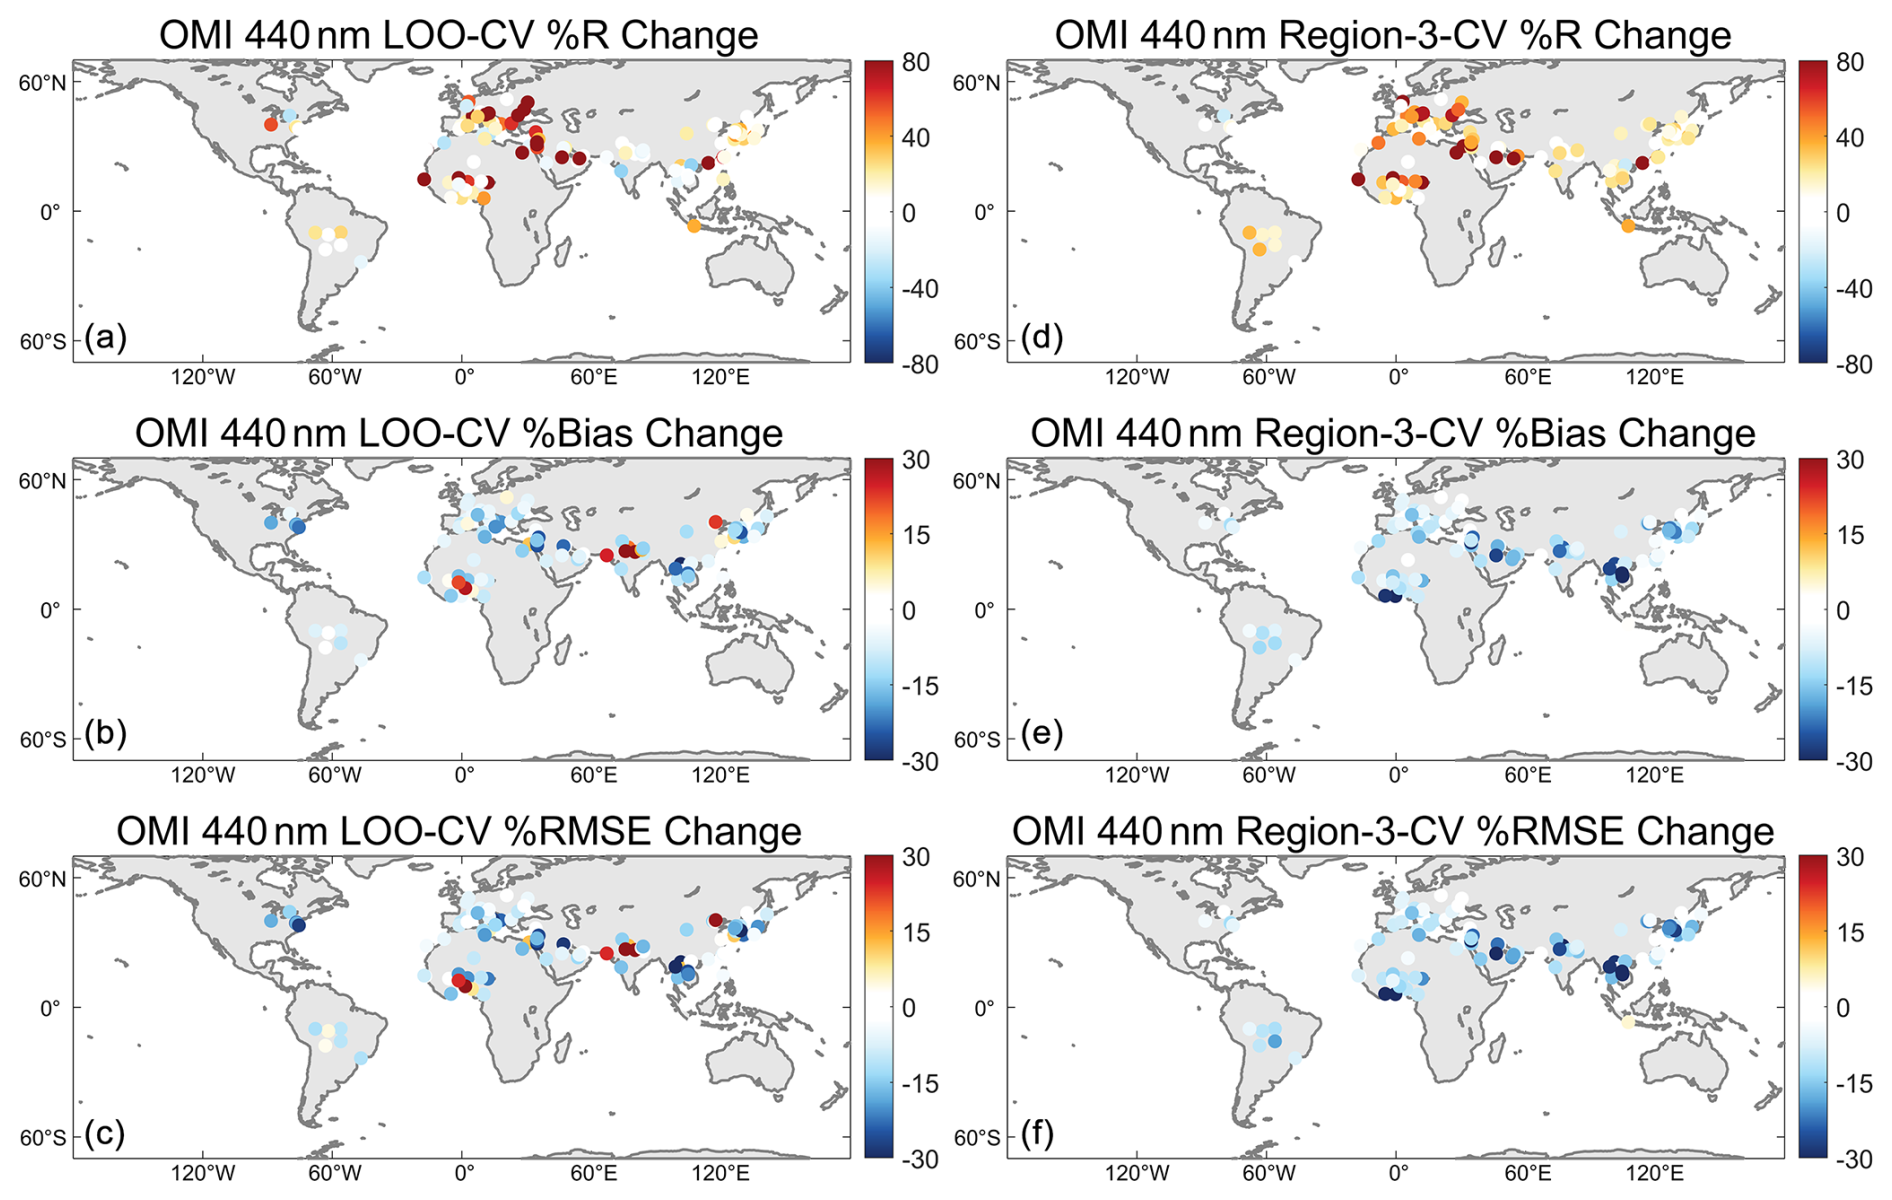
Figure 8Global distribution of the overall changes in R (a, d), MAB (b, e), and RMSE (c, f) for LOO-CV (a–c) and Region-3-CV (d–f) based on OMI SSA at 440 nm.
Nevertheless, both the Merged-OMI data and corresponding CV results exhibit significant improvements compared to the original OMI SSA, which indicate the effectiveness of the EnKF data synergy approach in reducing the uncertainties of background satellite SSA estimates.
3.4 Evaluation of Merged-POLDER data
Because OMI can provide SSA data only at wavelengths up to 500 nm, a Merged-POLDER dataset is constructed to provide SSA at visible and near-infrared bands. Specifically, we assimilate a total of ∼3700 monthly mean SSA observations at 452 AERONET sites into the background POLDER SSA field at 440, 550 (565), 670, 865, and 1020 nm.
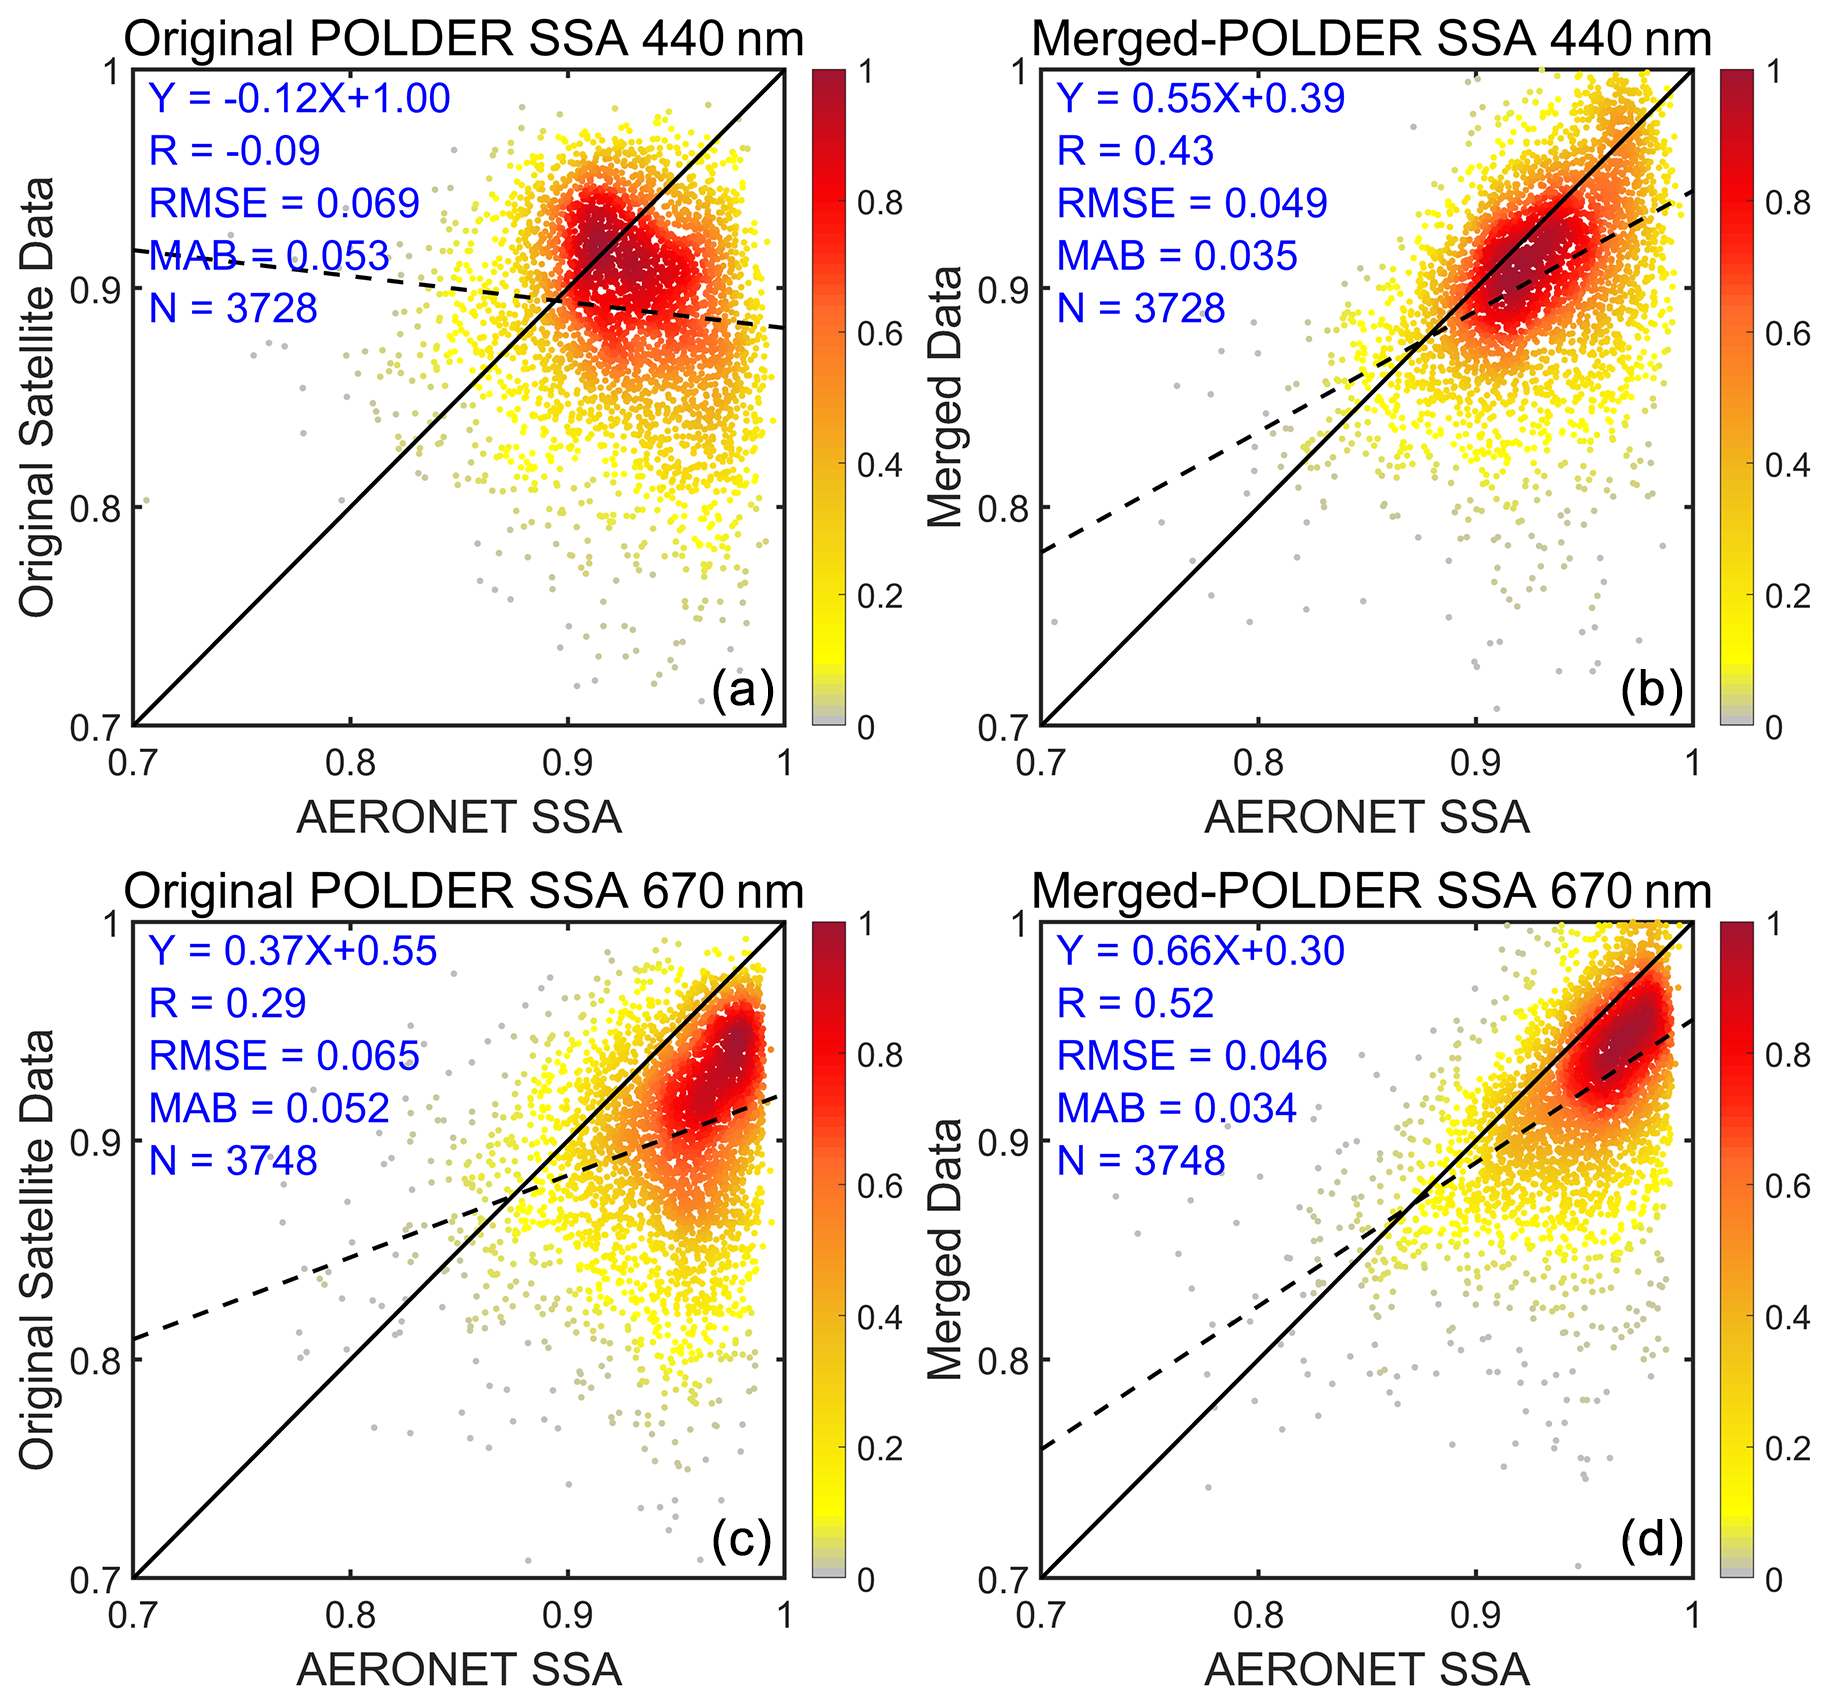
Figure 9The same figure as Fig. 3 but for the original and the merged SSA based on POLDER at 440 and 670 nm.
Figures 9 and S6 in the Supplement present the density scatterplots of the original POLDER data and the Merged-POLDER data with respect to the AERONET SSA at five spectral bands. The original POLDER SSA shows the worst performance at 440 nm among the five wavelengths, probably due to instrument drift and aging (Fougnie, 2016), and improves as the wavelength increases. The results for 550, 865, and 1020 nm are similar to those at 670 nm. Therefore, we mainly focus on the results for 440 and 670 nm. The original POLDER SSA almost has no correlation with AERONET at 440 nm and exhibits moderate correlations at the other four wavelengths. Significant improvements can be observed in the Merged-POLDER data at all wavelengths. The Merged-POLDER SSA at 440 nm shows an R value increasing from −0.09 (not significant) to 0.43 against AERONET, with the MAB and RMSE decreasing from 0.053 and 0.069 to 0.035 and 0.049, respectively. Although the Merged-POLDER data at 440 nm shows significant improvement over the original POLDER data, it still underperforms compared to the Merged-OMI SSA at 440 nm. Thus, we recommend using the Merged-OMI data at 440 nm. At 670 nm, the R value for POLDER-SSA increases from 0.29 to 0.52, and MAB and RMSE decrease from 0.052 and 0.065 to 0.034 and 0.046, respectively. Meanwhile, the original POLDER product exhibits significant systematic negative biases at 670 nm and the other three wavelengths, which are effectively corrected in the merged dataset.
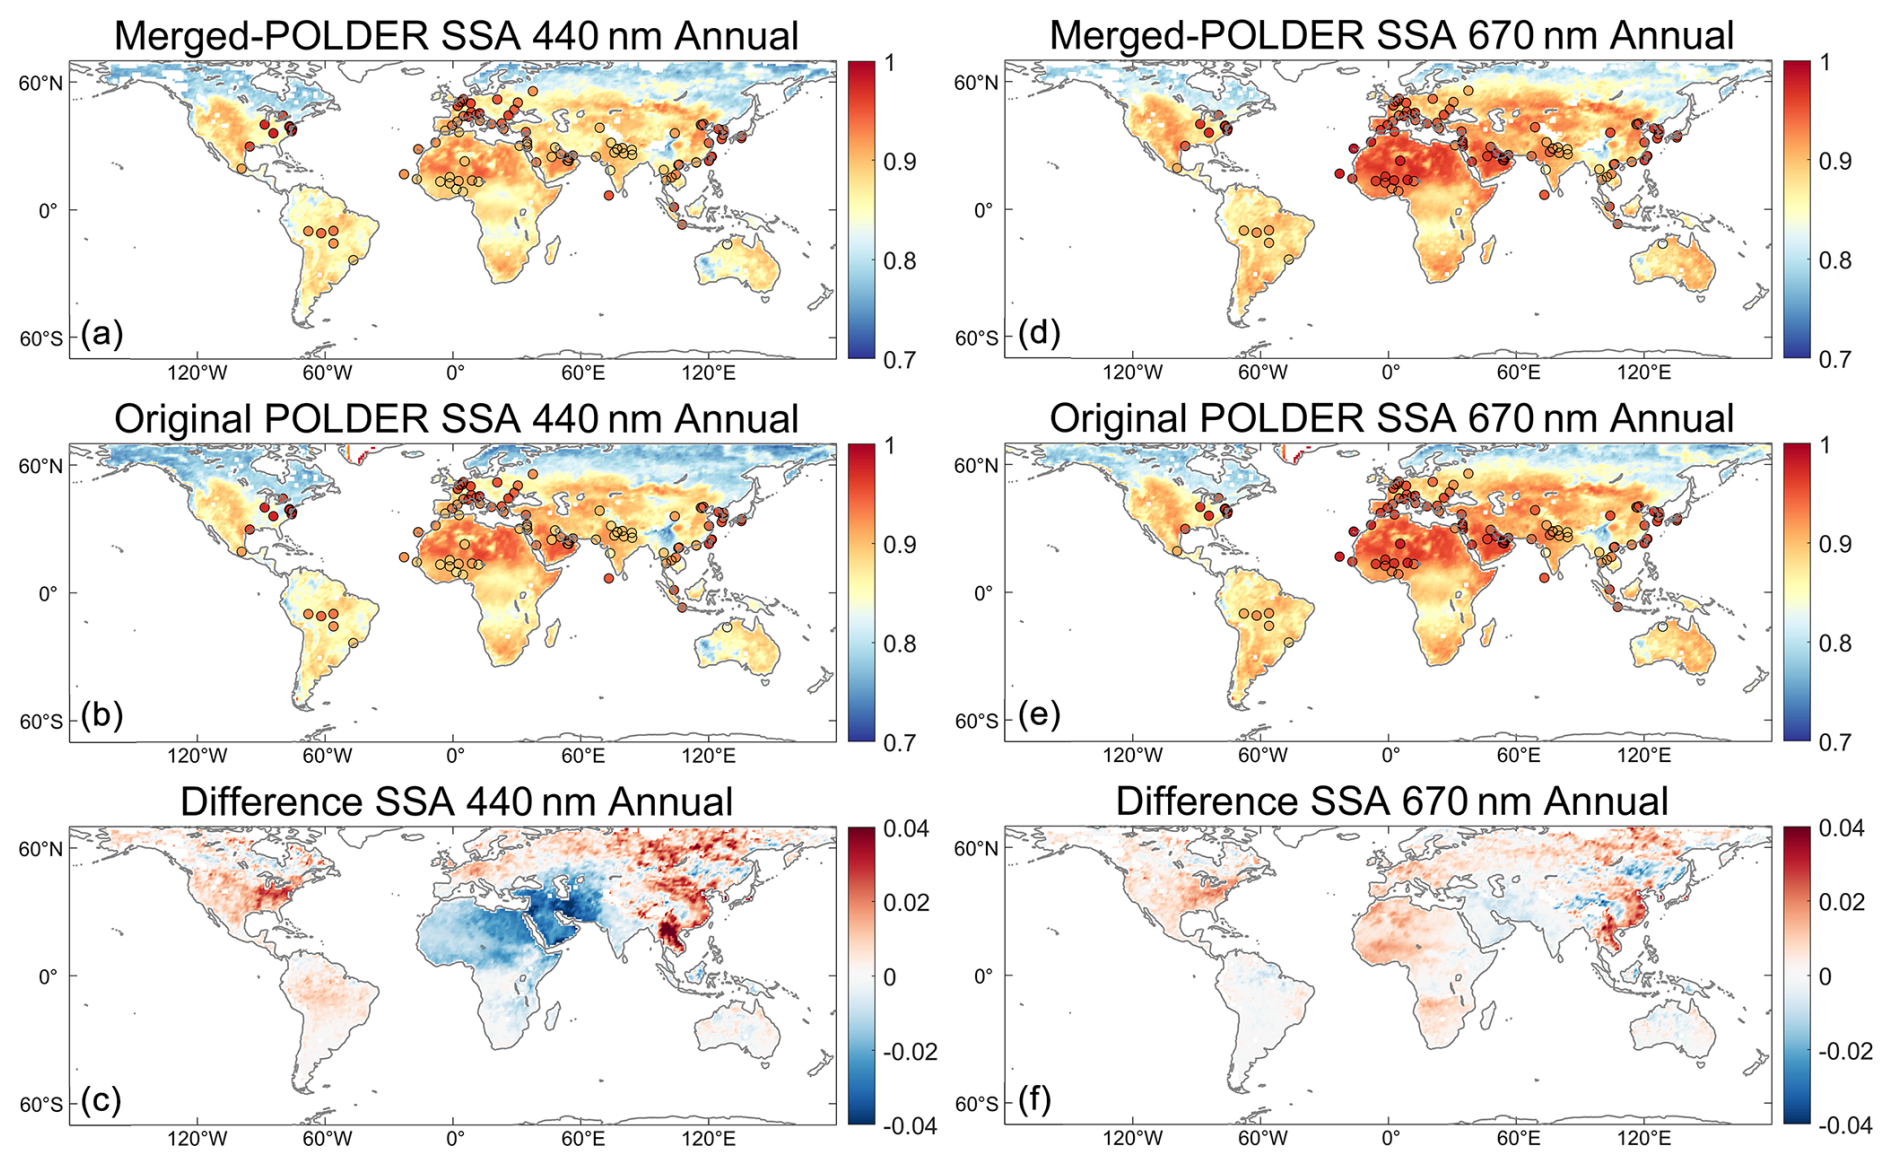
Figure 10The same figure as Fig. 4 but for the original and the merged SSA based on POLDER at 440 and 670 nm.
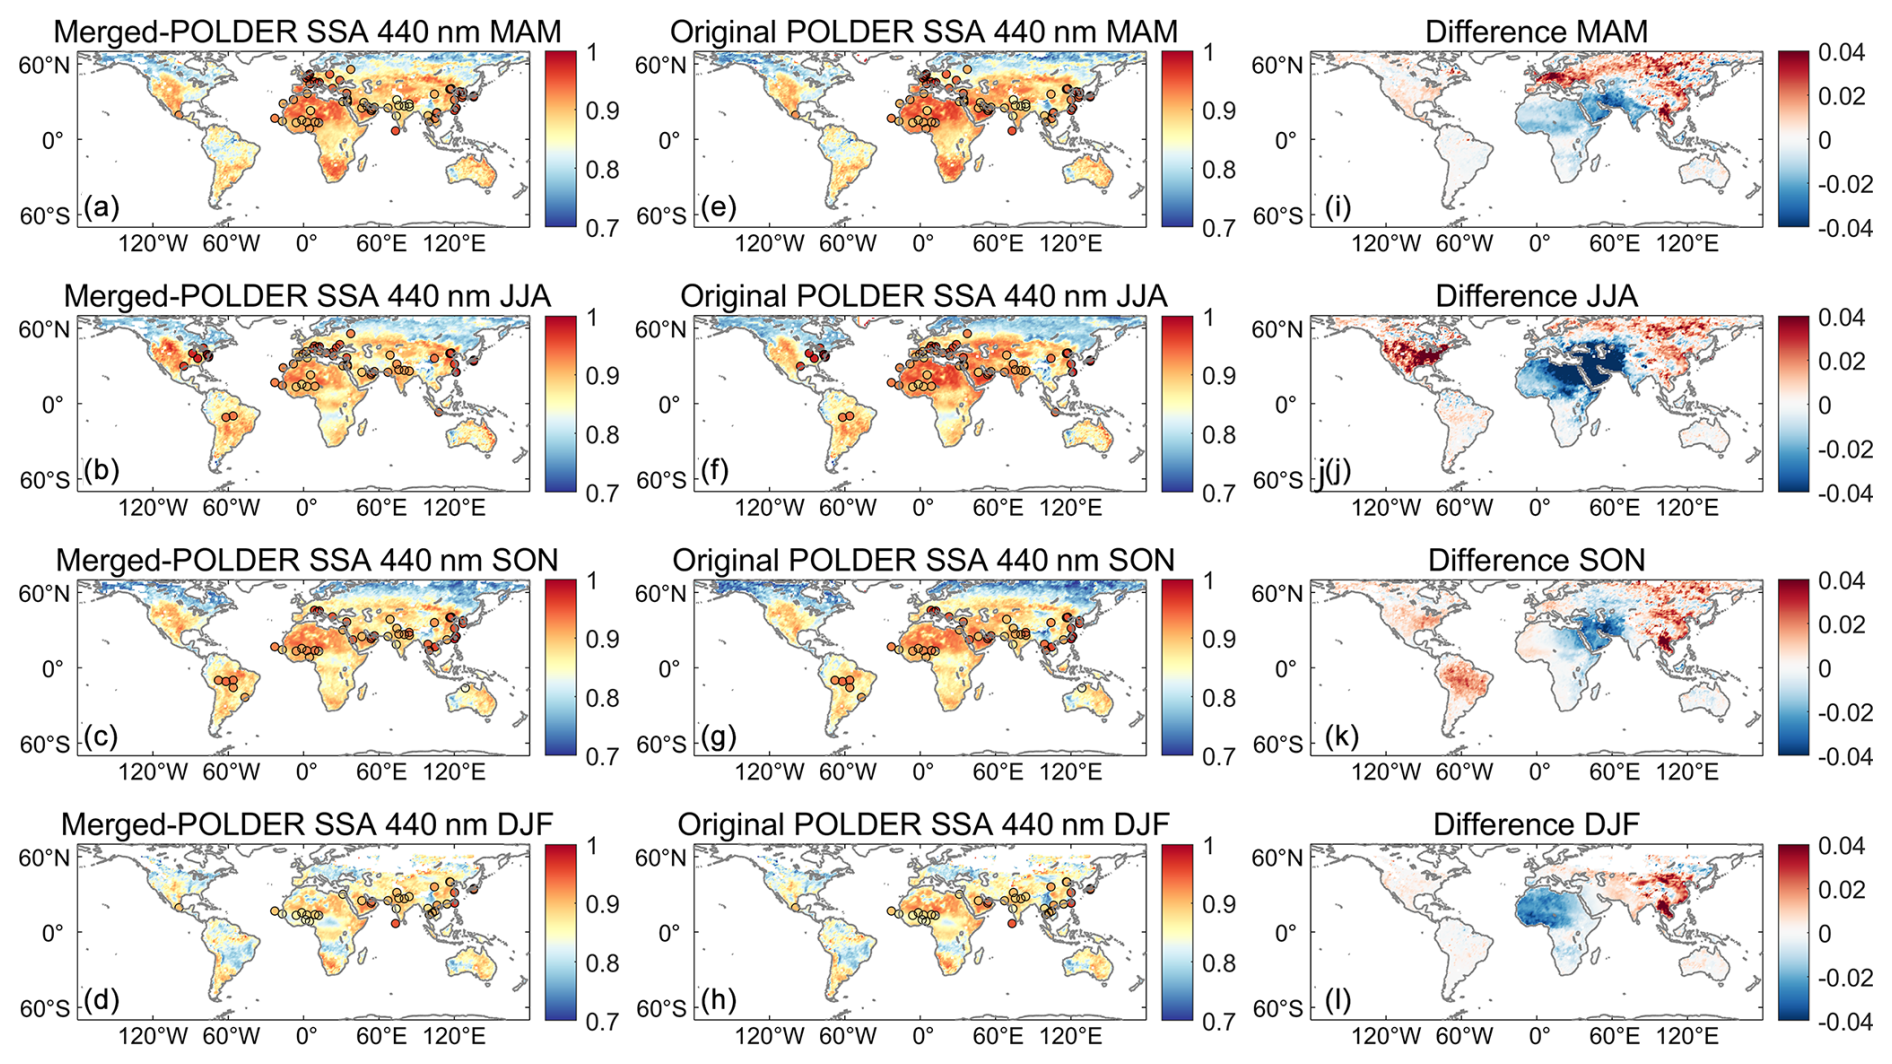
Figure 11The same figure as Fig. 5 but for the original and the merged SSA based on POLDER at 440 nm.
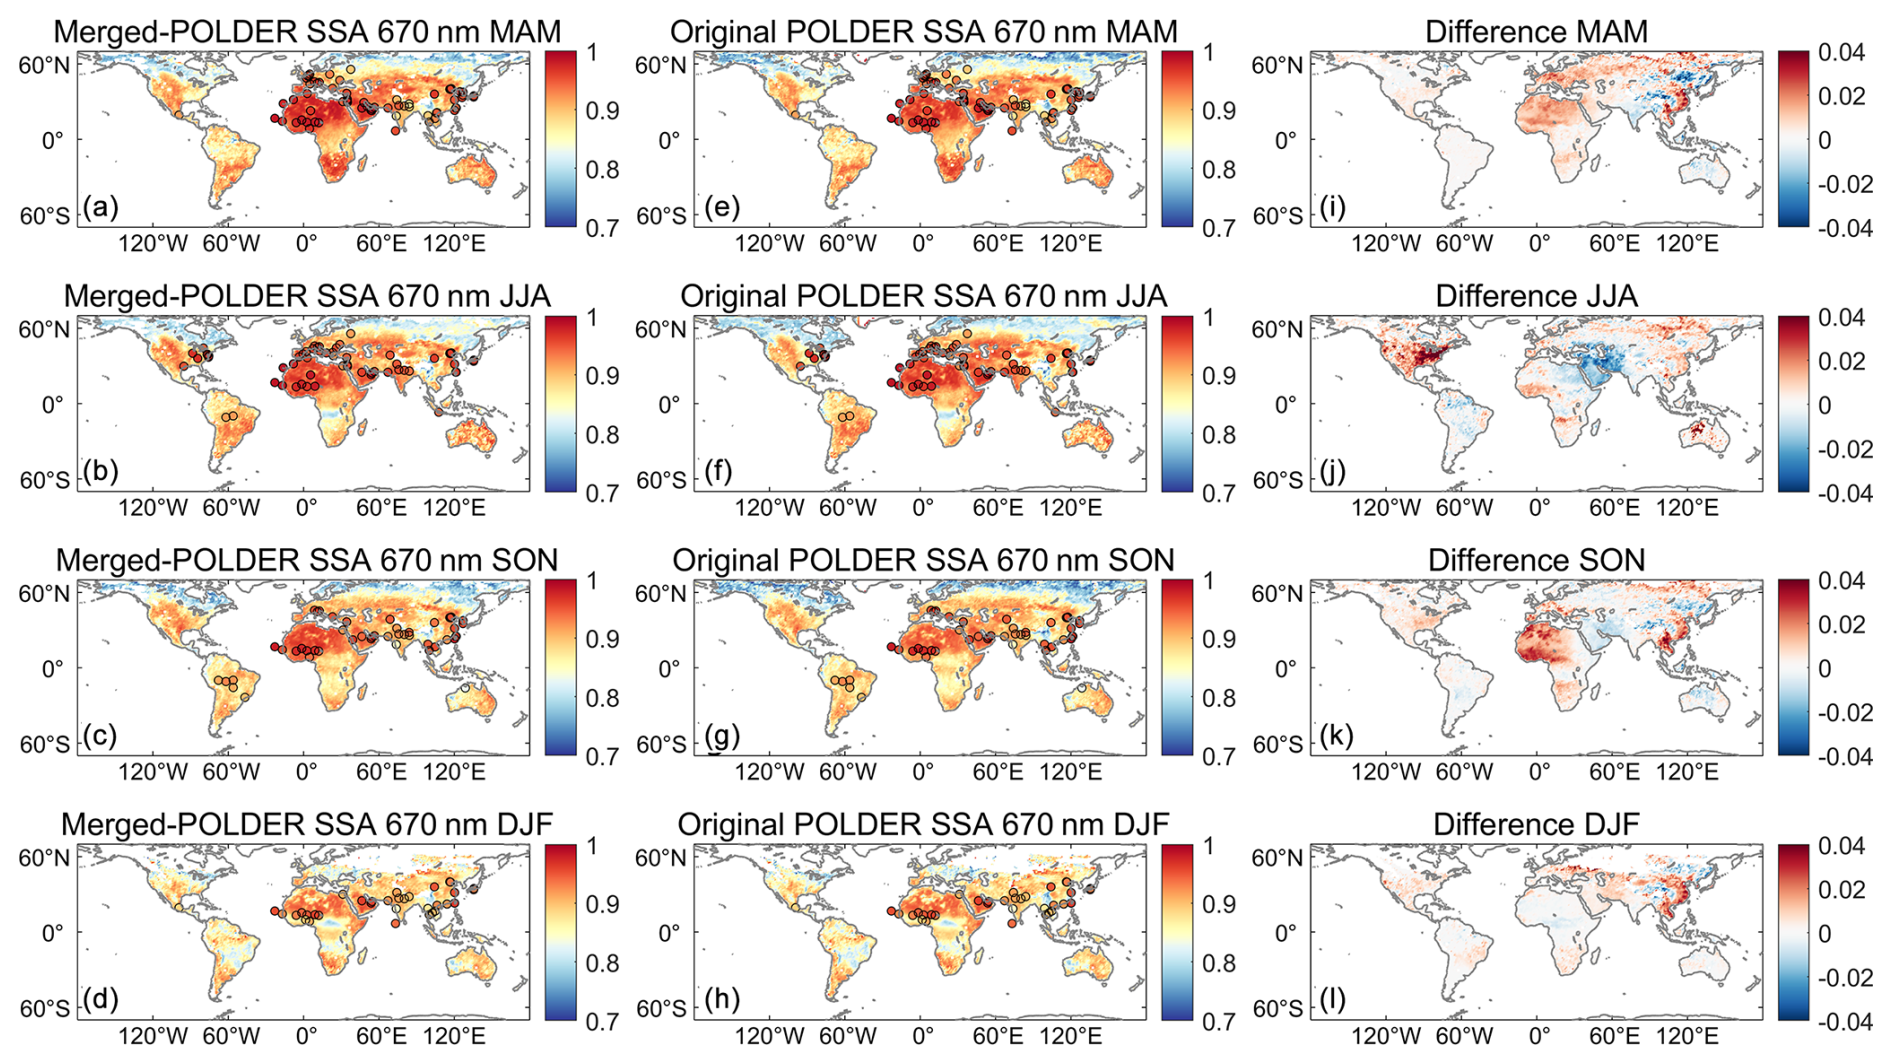
Figure 12The same figure as Fig. 5 but for the original and the merged SSA based on POLDER at 670 nm.
Figures 10 and S7 in the Supplement describe the spatial distribution of the annual mean SSA from the original POLDER data and the Merged-POLDER data, alongside the observation values from 109 AERONET sites with at least 10 samples during the POLDER observation period. At 440 nm, the original POLDER data tend to overestimate the SSA for dust aerosols, with a positive bias in dust source regions such as North Africa, and underestimate in other regions, with a strong negative bias. These biases are notably corrected in the merged data. As for 670 nm, the Merged-POLDER data largely correct the serious negative biases in the original POLDER data. The seasonal results generally share the same features as the annual results in Figs. 11, 12, and S8–S10 in the Supplement. The Merged-POLDER SSA at 440 nm evidently corrects the positive bias in dust-dominated regions, with the most notable improvement occurring in the Middle East in JJA. In other regions, the negative biases reduced in the merged data at 440 nm. Overestimations in the original data at 670 nm are mainly observed in regions with seasonal biomass burning events, such as the Middle East in JJA and SON and the Sahel in DJF, whereas POLDER SSA tends to underestimate in the other regions. These biases are mostly reduced in the Merged-POLDER SSA. However, the positive bias in the original data is overcorrected in the Middle East, resulting in a larger negative bias in the Merged-POLDER data. Despite this, the global performance of the Merged-POLDER data demonstrates the overall effectiveness of the EnKF data synergy technique.
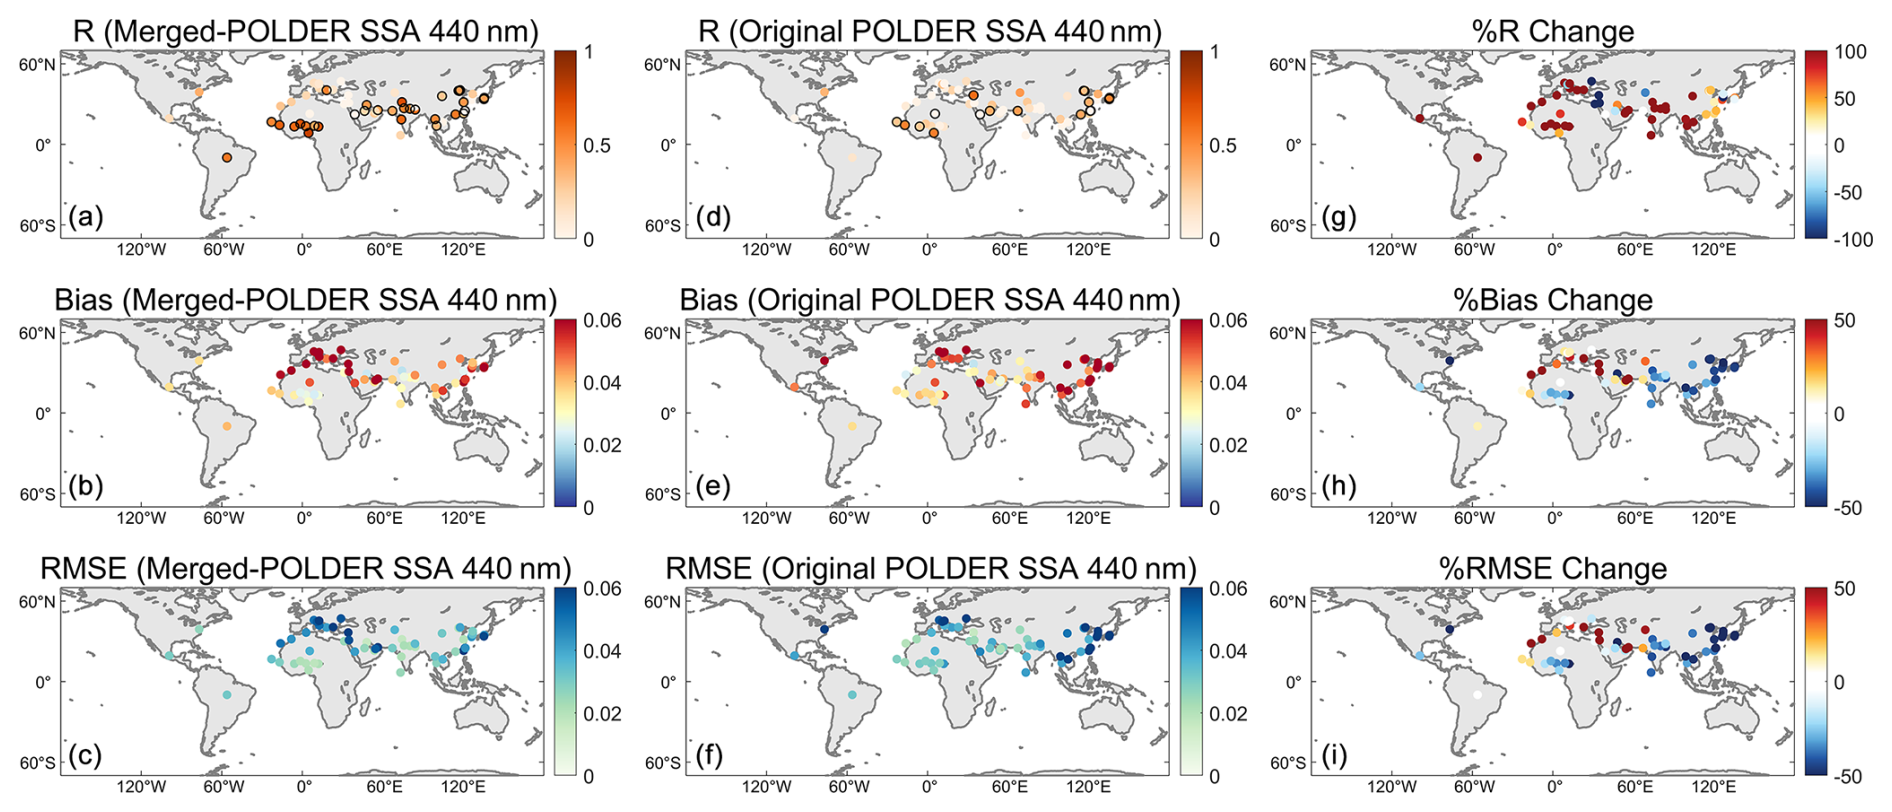
Figure 13The same figure as Fig. 6 but for the original and the merged SSA based on POLDER at 440 nm.
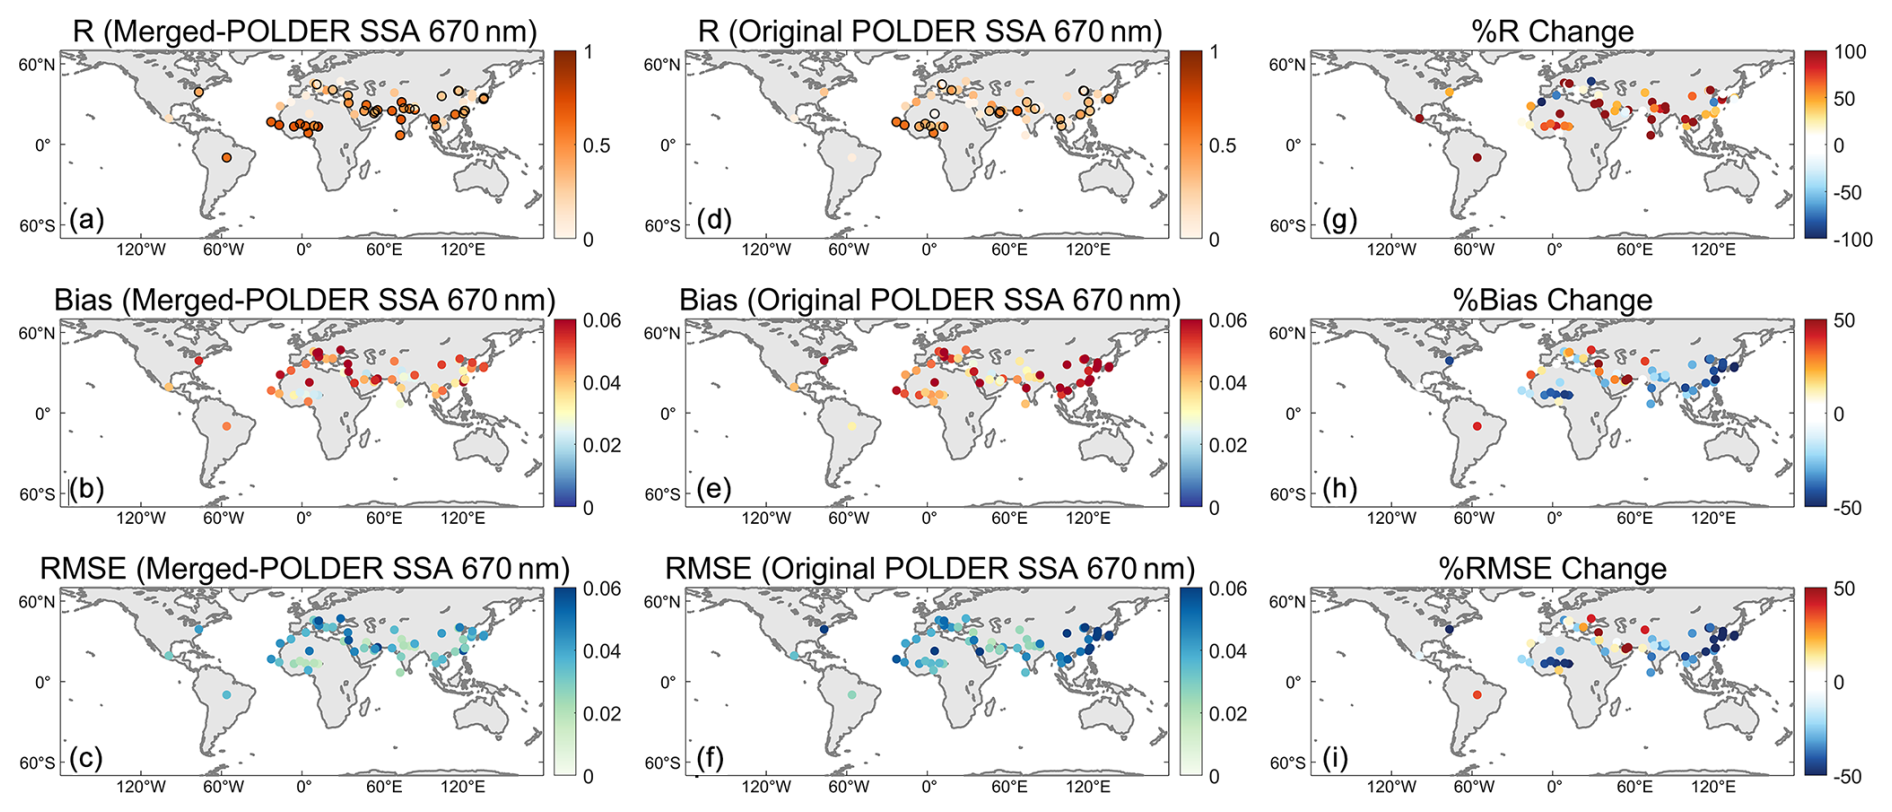
Figure 14The same figure as Fig. 6 but for the original and the merged SSA based on POLDER at 670 nm.
We further evaluate the performance of the Merged-POLDER dataset across different regions in Figs. 13, 14, and S11–S13 in the Supplement. Only 58 sites provided at least 20 observation samples during the POLDER observation period, which are used to calculate the evaluation statistics. At most of the sites, the Merged-POLDER data show a significant improvement in correlation with the AERONET SSA, with substantial reductions in the MAB and RMSE values. The improvement at 670 nm is similar to that at 440 nm. Notably, in the Sahel, India, and Southeast Asia, the R values of the Merged-POLDER data improve by up to 100 % compared to the original POLDER data, with MAB and RMSE values decreasing by up to 50 %. The Merged-POLDER SSA also exhibits moderate improvements in East Asia. Although there is a lack of observations in North and South America, a significant reduction in bias and RMSE can still be noticed in the Merged-POLDER data across the two regions. However, over North Africa, Europe, and the Middle East, the performance of Merged-POLDER appears less satisfactory at several sites. Further analysis reveals that observations at these sites may have low spatial representativeness and disagree with nearby sites (see Figs. S14–S27 in the Supplement). Possible explanations are (1) the relatively high spatial variability of SSA in the surrounding regions and (2) data quality issues within the ensemble samples at surrounding grid boxes, such as significant negative correlations with AERONET observations and non-Gaussian error distributions (as indicated by the failure to pass the significance test in Fig. S2). These factors may prevent the ensemble samples from accurately reflecting the true background covariance.
3.5 Cross-validation of Merged-POLDER data
The Region-3-CV and LOO-CV are also performed for the Merged-POLDER SSA. Note that there are only 51 effective sites with more than 20 samples in 2005–2013 used for POLDER CV (Fig. S28 in the Supplement). Figures 15 and S29 in the Supplement present the evaluation of the LOO-CV and the Region-3-CV POLDER SSA with respect to AERONET observations. Similar to the OMI results, both CV schemes applied for Merged-POLDER demonstrate significant improvements over the original POLDER SSA. At 440 nm, LOO-CV yields notable results, with the R value increasing from −0.03 (not significant) to 0.12, the MAB reducing from 0.046 to 0.041, and the RMSE dropping from 0.061 to 0.057. The Region-3-CV yields more pronounced improvements than the LOO-CV, where the R value increases from −0.07 (not significant) to 0.36, the MAB decreases from 0.040 to 0.029, and the RMSE reduces from 0.056 to 0.040. The CV performances for the POLDER SSA at other wavelengths are similar to those at 440 nm. These CV results further confirm the spatial extension effect of the EnKF method.
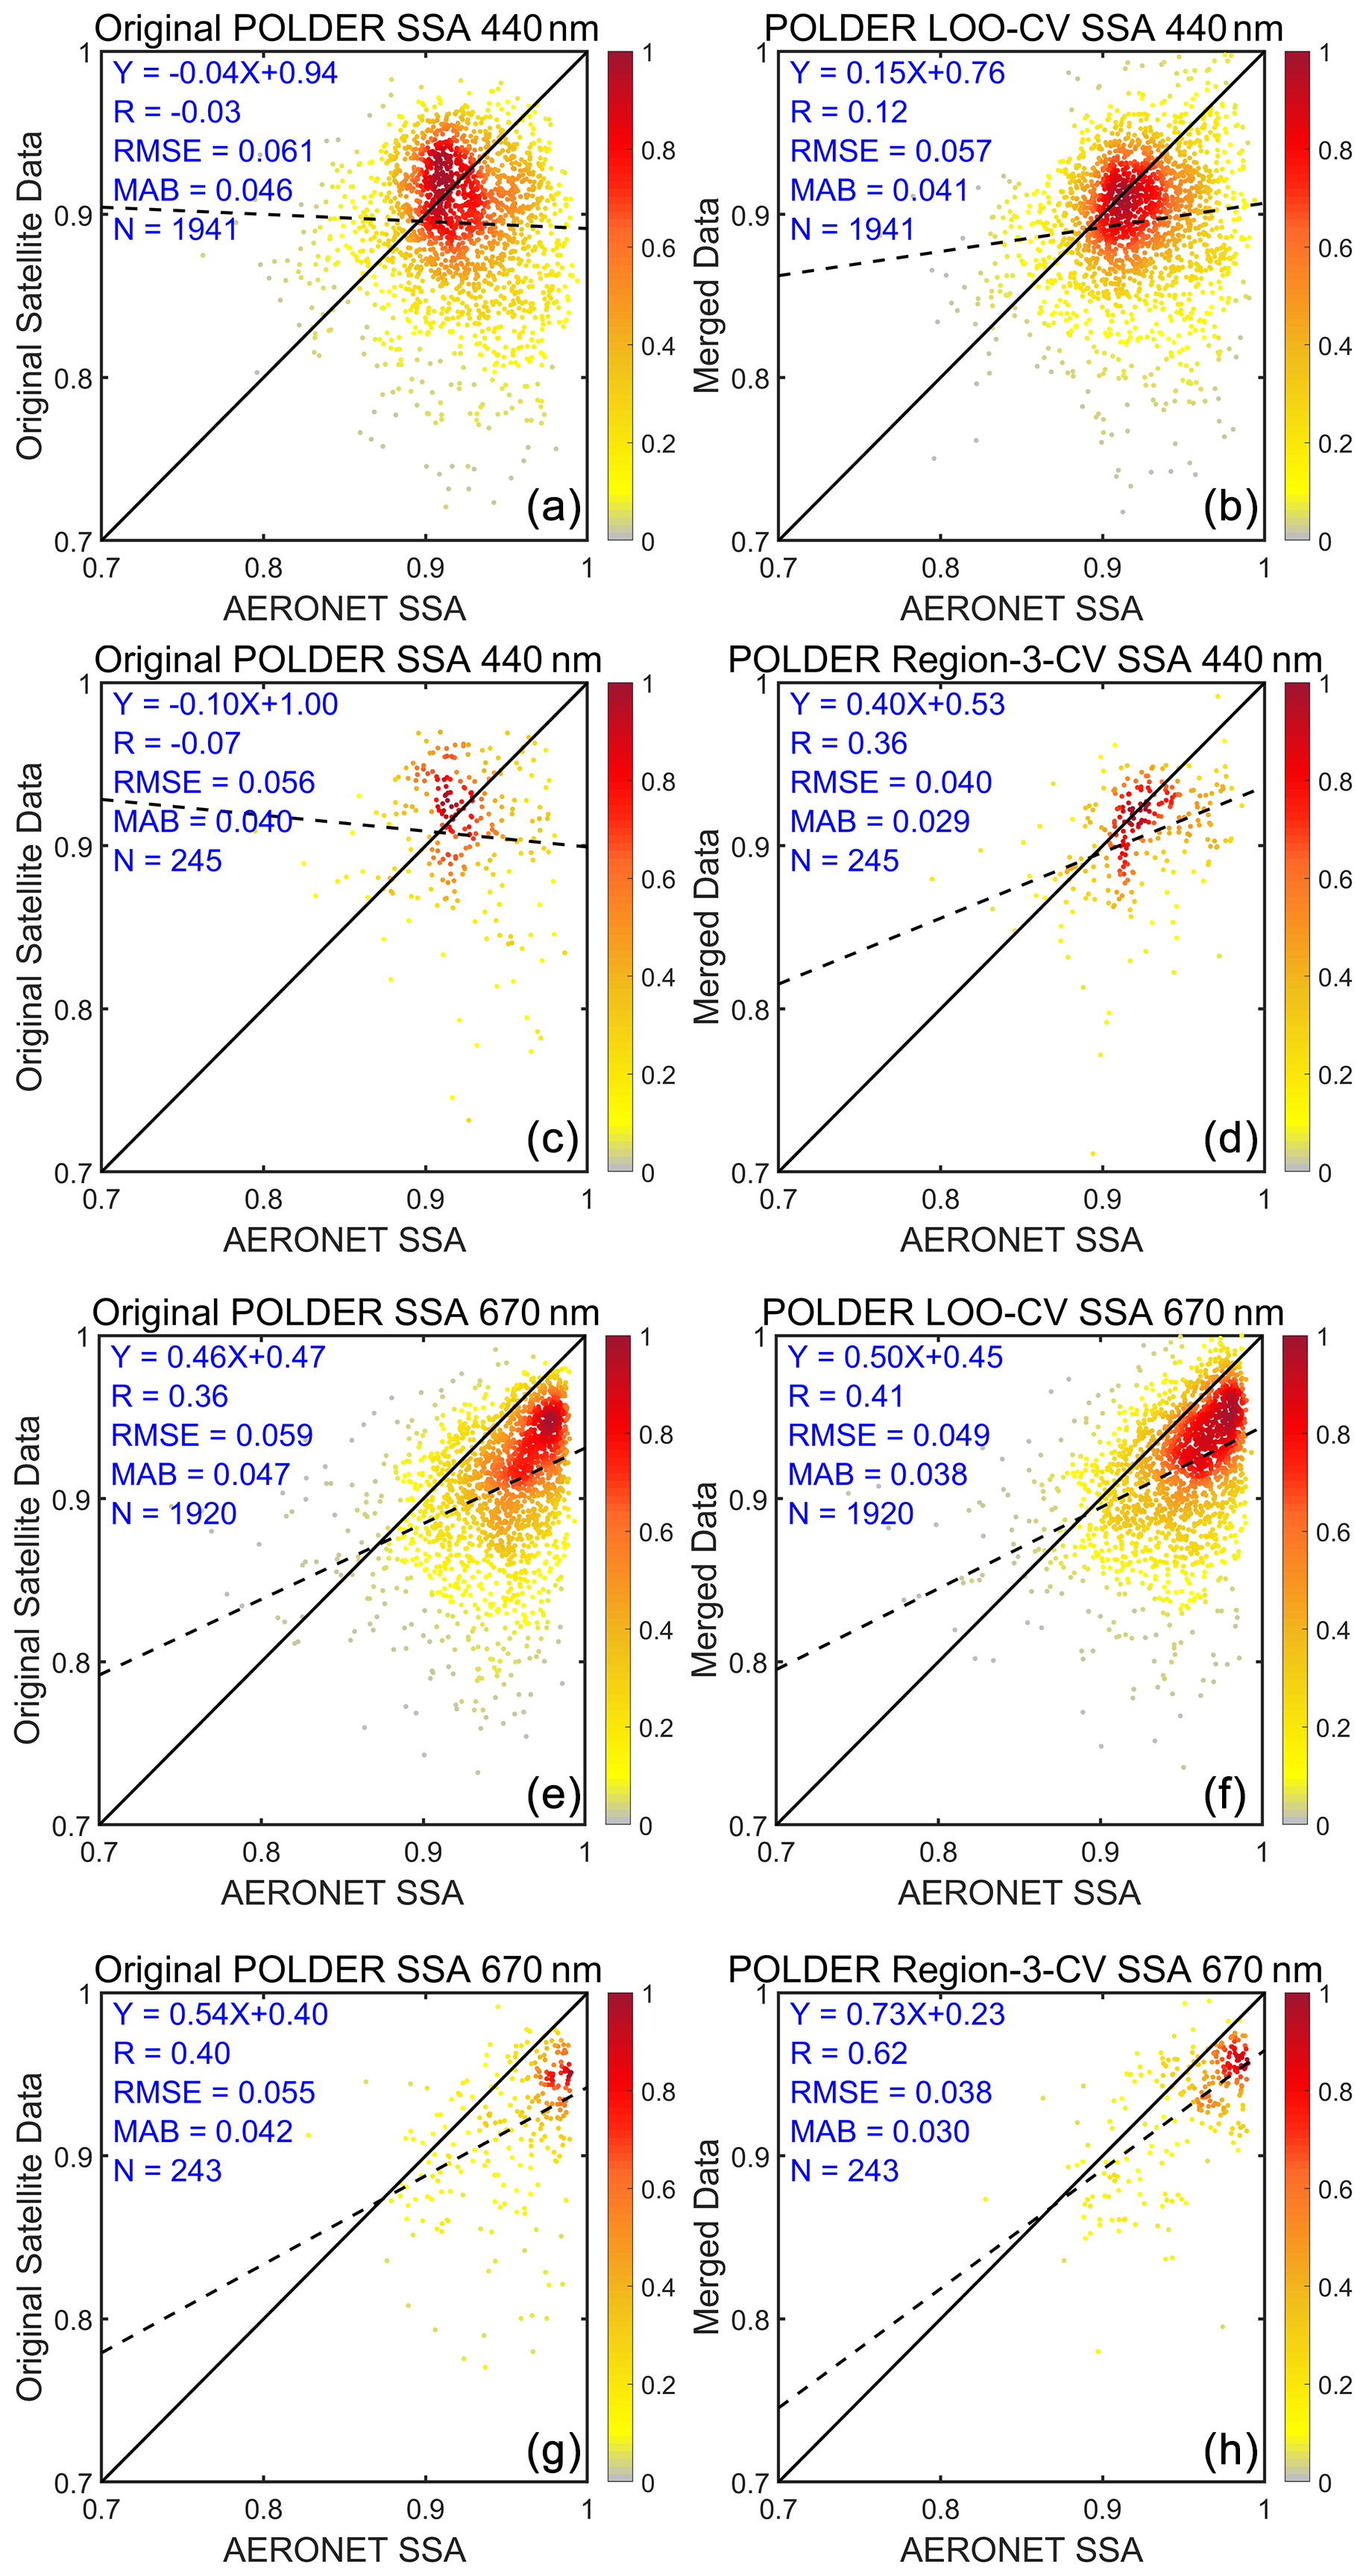
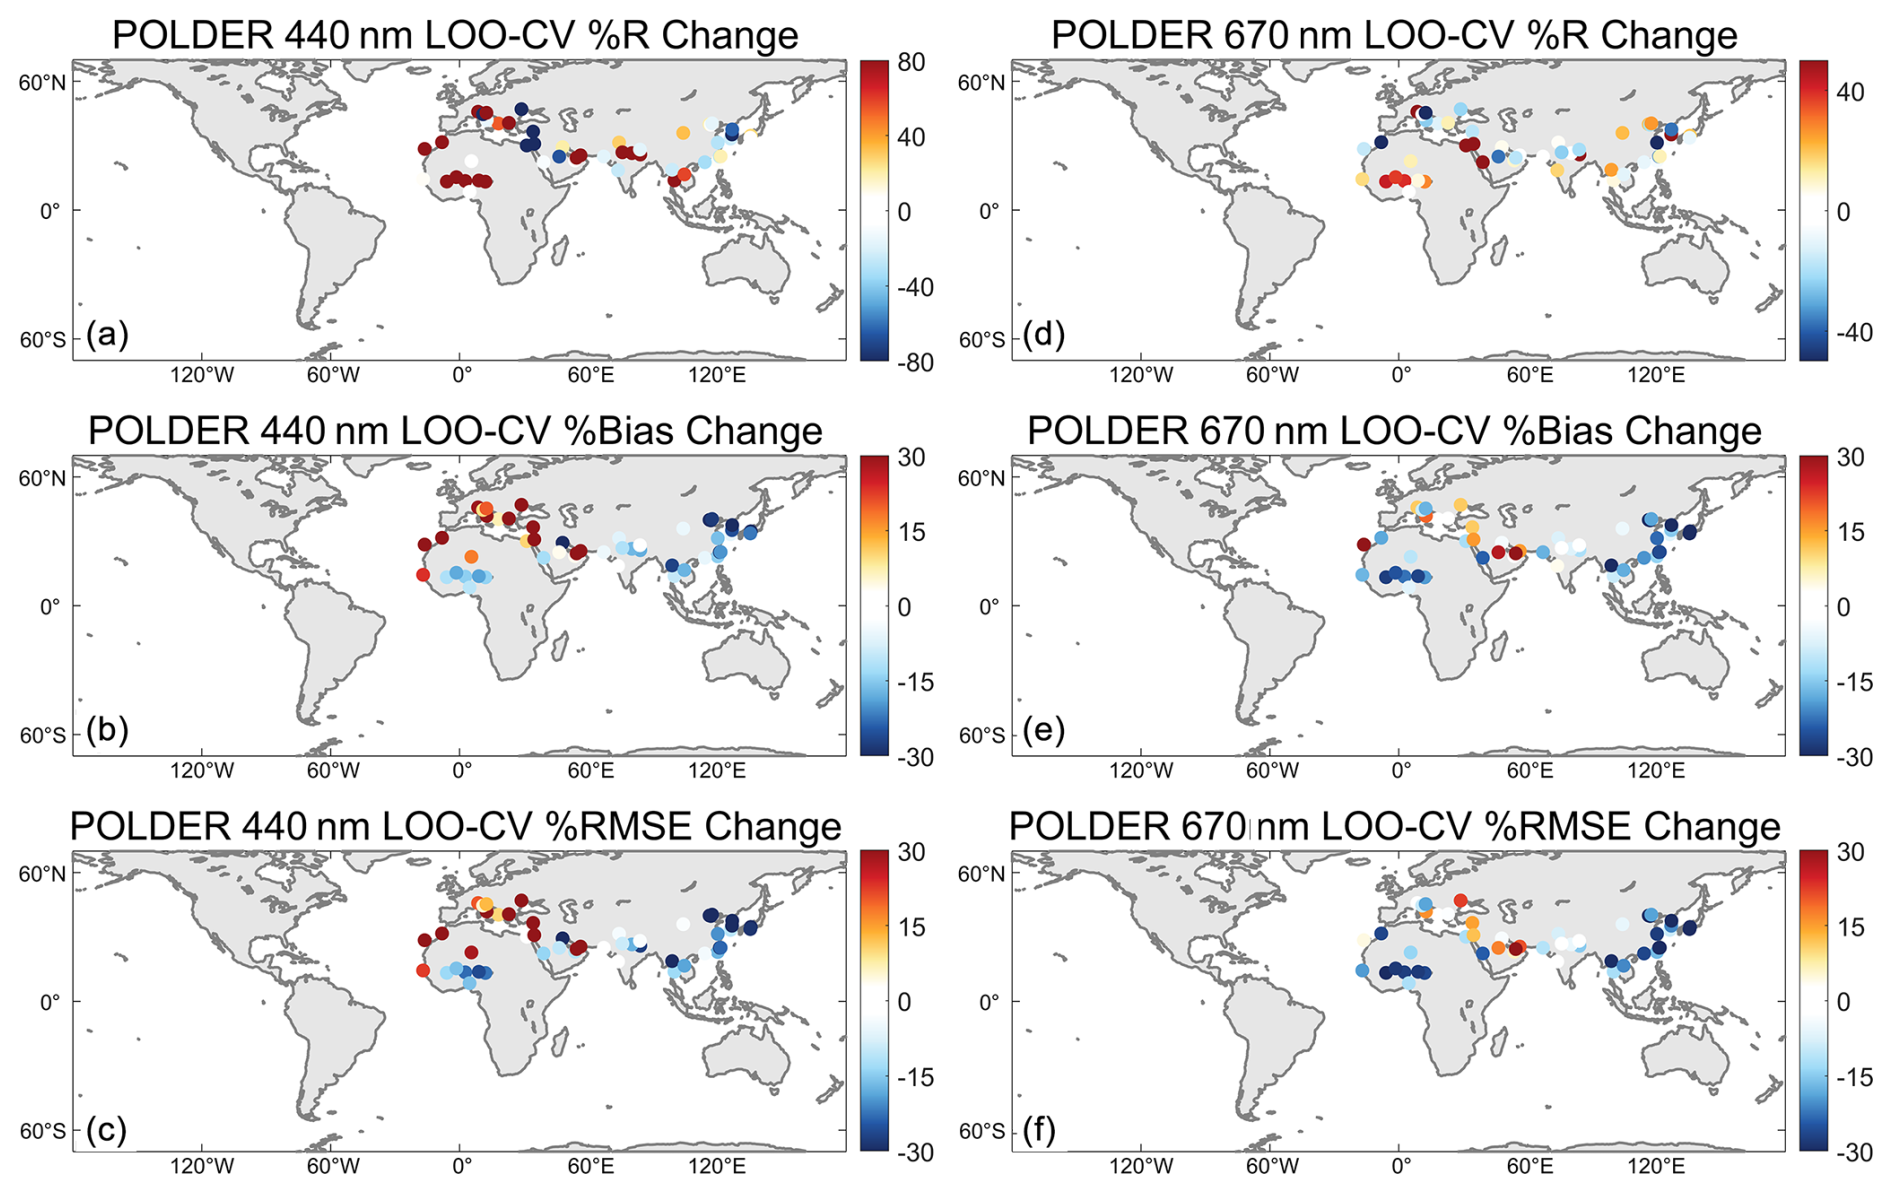
Figure 16The same figure as Fig. 8 but for the POLDER SSA at 440 and 670 nm.
Because too few validation samples in the Region-3-CV limit the site-level evaluation, only the spatial distribution of the LOO-CV results is presented in Figs. 16 and S30 in the Supplement. With only 51 sites available for LOO-CV in 2005–2013, the results based on POLDER are not as satisfactory as those based on OMI. Nonetheless, the MAB and RMSE at most sites decrease, except for some sites in Europe and the Middle East. For the latter, both the Merged-POLDER data and LOO-CV show decreased performance compared to the original POLDER data, which could be possibly caused by the high aerosol variabilities and the data quality issue of the ensemble dataset, as discussed in Sect. 3.4.
Overall, the performance of the Merged-POLDER data is less satisfactory than that of the Merged-OMI data, mainly due to the shorter observation period of POLDER. On the one hand, a 9-year POLDER satellite dataset results in a smaller ensemble size, which introduces greater uncertainties in estimating the covariance matrix of the background field. On the other hand, POLDER SSA shows larger variability than OMI SSA at most locations (Fig. S31 in the Supplement), which adversely impacts the accuracy of the synergy results. Nevertheless, the Merged-POLDER data still show significant improvements over the original datasets at all wavelengths, although the EnKF approach still requires further regional adaptation, especially for regions like the Middle East and Europe.
As mentioned above, current SSA observations still face great challenges. In this study, the EnKF approach is utilized to derive more accurate global merged SSA data by combining the advantages of both satellite and ground-based observations. Nonetheless, there are several issues to keep in mind in the implementation of the EnKF.
The key point of EnKF is determining the errors associated with both the surface observations and the background satellite field. For surface observation errors, we represent them as the sum of measurement errors (AERONET SSA errors) and representativeness errors. The representativeness errors are estimated using the standard deviation of SSA from all 0.25° OMI data (or 0.1° POLDER data) within each 1°×1° grid box. However, even 0.1° grid satellite data may smooth out many of the local-scale aerosol variations, such as the differences in emission sources or topography, which could introduce uncertainties into the merged data.
Regarding the background field errors, the ideal solution would be to construct a sufficiently large ensemble of multiple satellite products to approximate the variability of the background field. For instance, Li et al. (2020) constructed an ensemble of 474 members by combining monthly AOD data from 11 satellite datasets, which effectively captured the AOD variability as well as its spatial covariability. However, because long-term SSA satellite products are scarce due to either insufficient information content or high uncertainty of the observations, only POLDER and OMI SSA products are separately used to construct the background ensemble. The OMI-based ensemble and the POLDER-based ensemble contain 231 and 106 samples, respectively. Although both POLDER and OMI provide SSA retrievals at 440 nm, the differences between the two datasets are substantial due to the poor retrieval capability of POLDER at 440 nm. Thus, it is not appropriate to combine the two datasets into a single ensemble dataset.
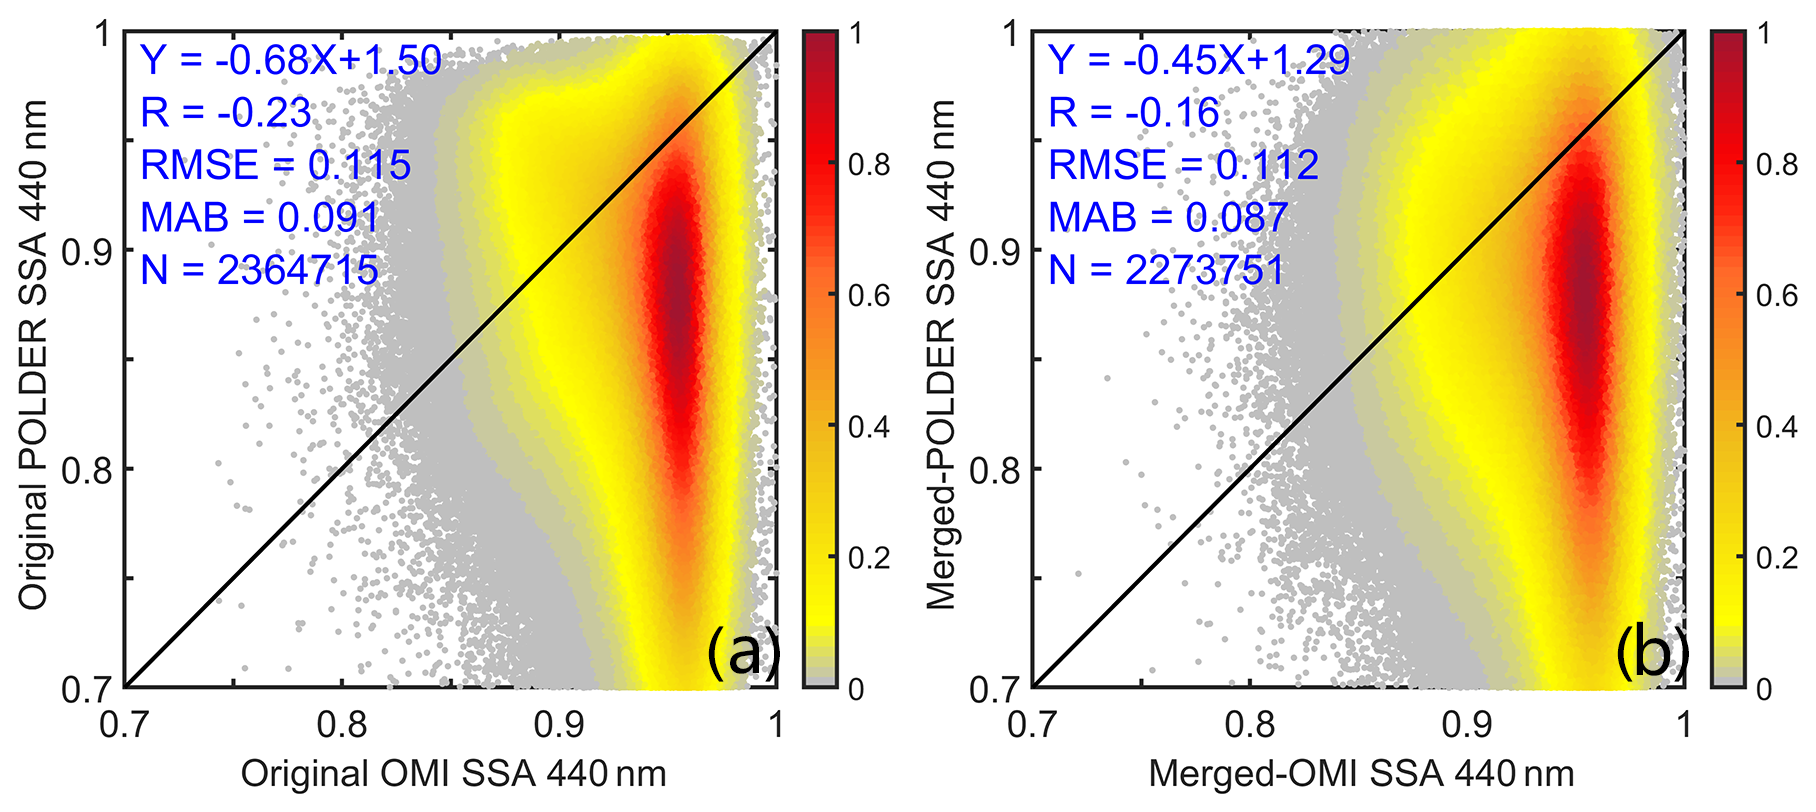
Figure 17The density scatterplot of the comparison between the two original and merged SSA datasets at 440 nm.
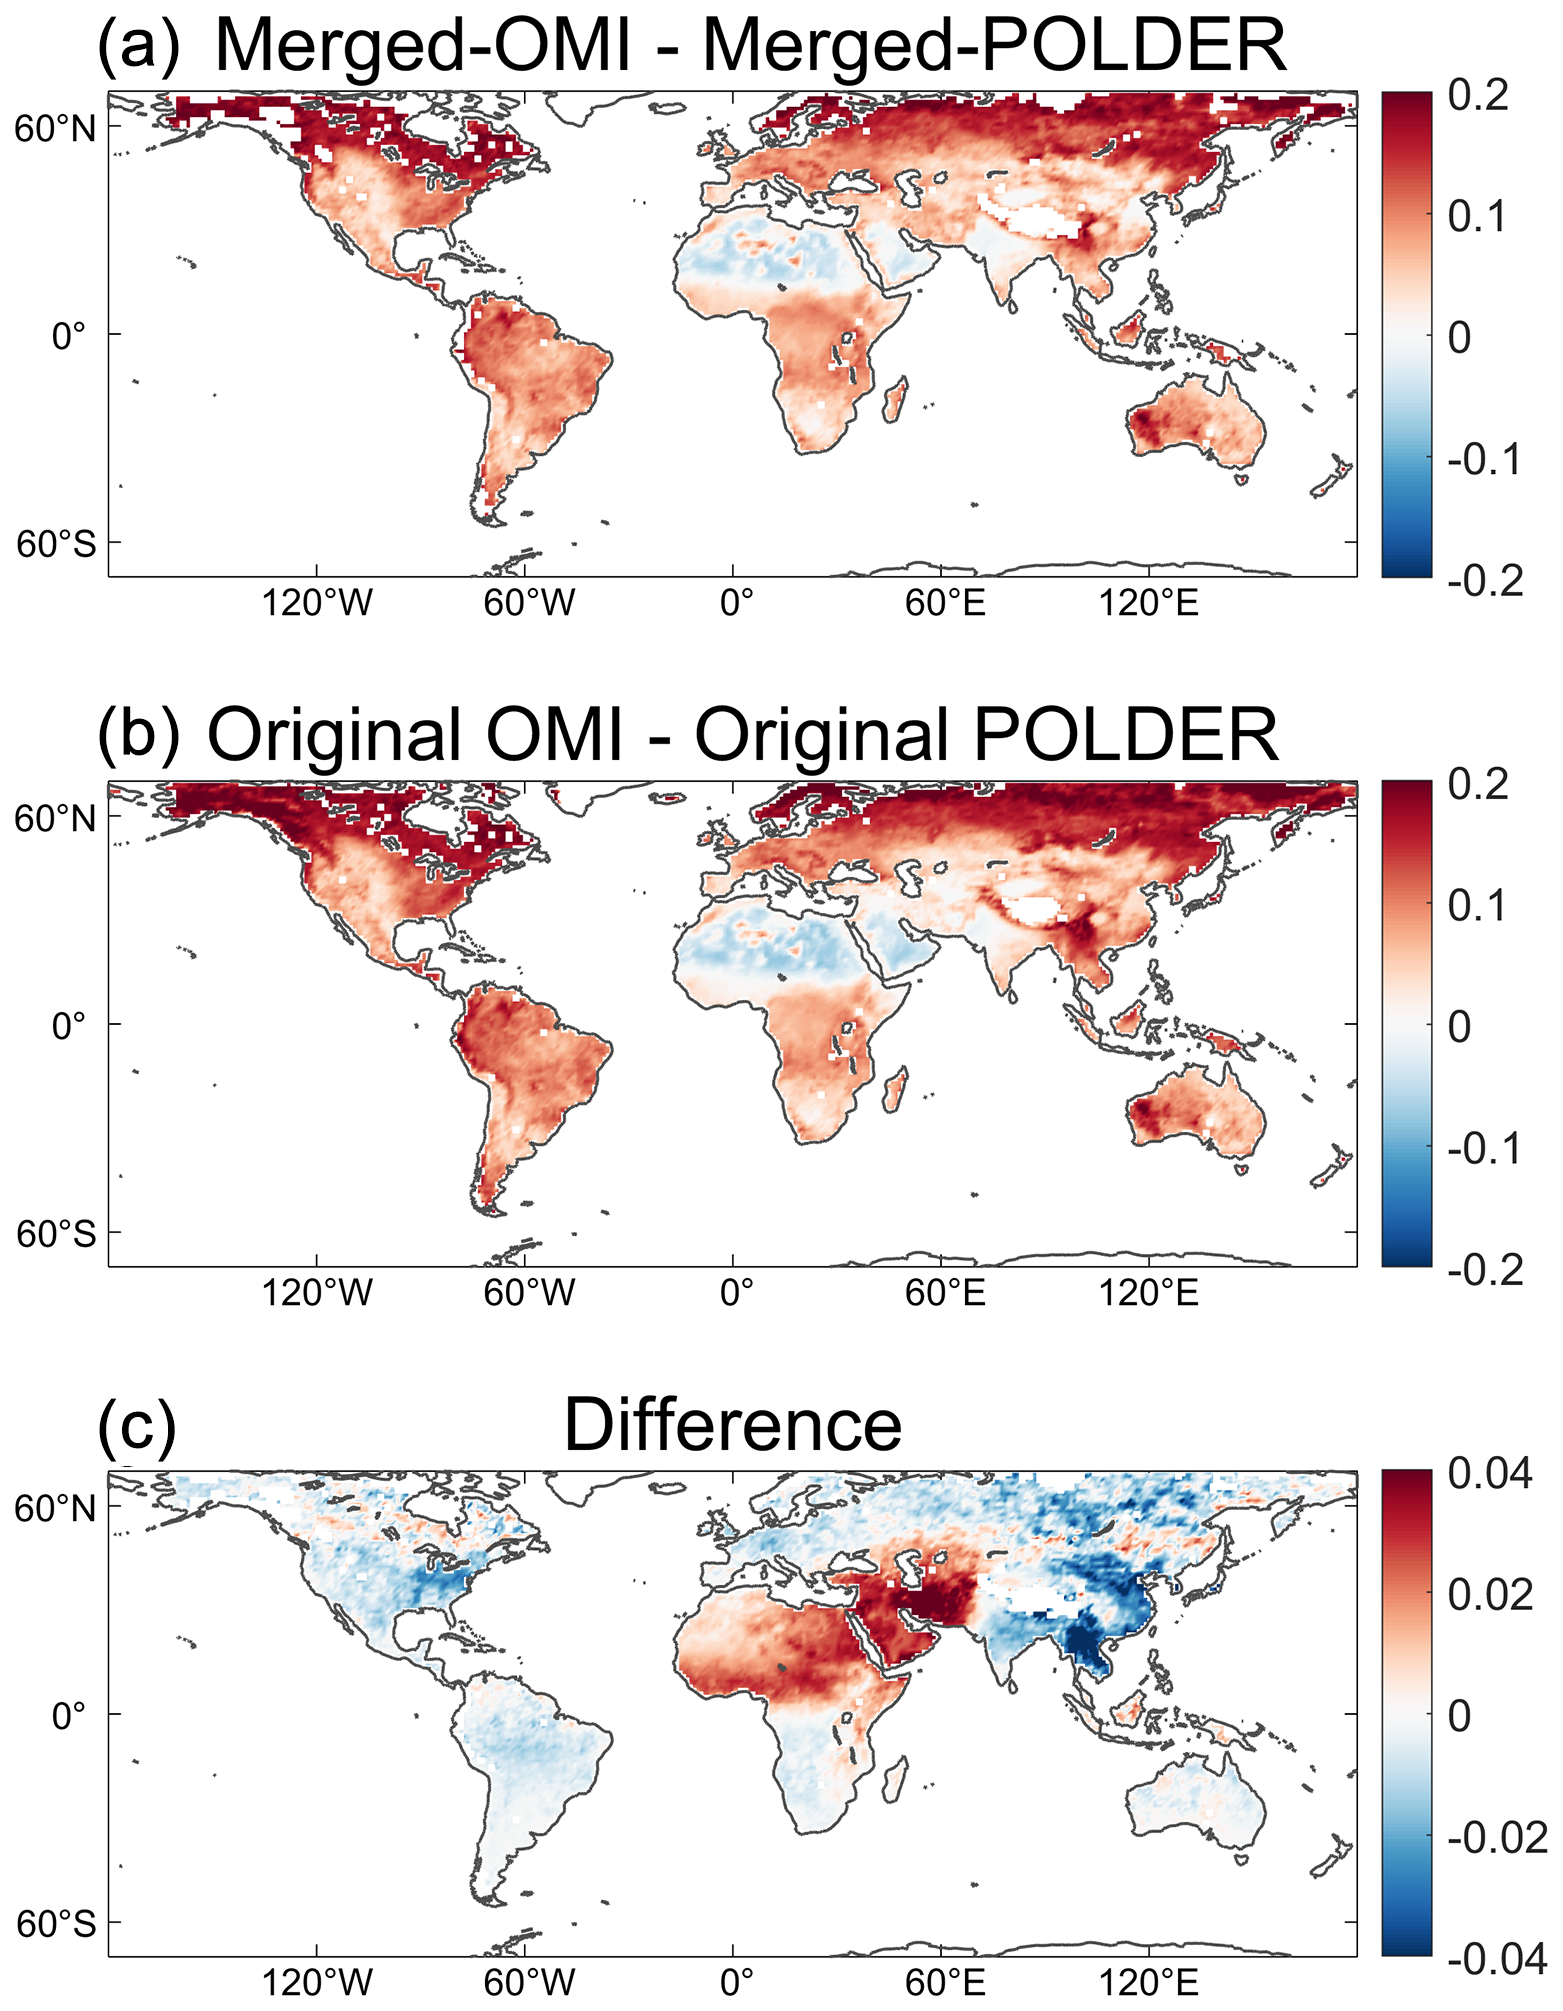
Figure 18(a) The differences between the Merged-OMI and Merged-POLDER SSA at 440 nm, (b) the differences between the original OMI and POLDER SSA at 440 nm, and (c) the differences between (a) and (b).
Figures 17 and 18 show the comparison between the original and the merged OMI and POLDER SSA at 440 nm from 2005 to 2013. The two datasets do not exhibit a significantly positive correlation. POLDER typically overestimates SSA for dust aerosols and underestimates SSA for other aerosol types. These differences are especially pronounced in dust source regions such as North Africa and the Middle East. Although the two merged datasets significantly reduce the systemic biases in the original datasets, a large difference remains between the Merged-POLDER and Merged-OMI datasets. Further efforts are still needed to improve the accuracy of the satellite products and reduce discrepancies between the datasets.
Additionally, the effectiveness of the EnKF synergy method depends on the high quality and spatial representativeness of ground-based site observations. In this study, we used AERONET Level 2.0 SSA data to ensure the accuracy of the SSA measurements. However, the strict quality control in Level 2.0 SSA products limits the number of available AERONET stations. Compared to AOD, Level 2.0 SSA data are provided at much fewer AERONET sites with lower temporal frequency, mainly due to the AOD threshold required in the retrieval. To ensure an SSA uncertainty within ±0.03, Level 2.0 SSA data are available only when AOD is larger than 0.4 at 440 nm, which strongly limits the number of AERONET observations available for data synergy. This also highlights the urgent need to establish a denser and higher-quality surface aerosol observation network. The location of the AERONET sites is also critical, as they should be preferably established in places with high repetitiveness. This is an important issue to be explored in our next study.
The merged global land SSA datasets generated in this study are available at https://doi.org/10.5281/zenodo.14294462 (Dong, 2025). The two datasets are provided in NETCDF4 format, covering latitudes from −89.5 to 89.5° and longitudes from −179.5 to 179.5°, with a spatial resolution of 1°. The Merged-OMI dataset offers SSA at 440 nm from October 2004 to December 2023, while the Merged-POLDER dataset provides SSA at 440, 550, 670, 865, and 1020 nm from March 2005 to December 2013.
In this study, we construct two high-accuracy global land SSA datasets using an EnKF data synergy approach from a combination of AERONET SSA observations and two satellite SSA datasets (i.e., POLDER and OMI). Specifically, each satellite SSA dataset is used to build an ensemble that reflects the variability of the background field. Then, we assimilate AERONET SSA observations into the background field by EnKF, which can effectively propagate the effect of the individual site observations across a broader spatial extent.
Both the Merged-OMI and the Merged-POLDER datasets demonstrate significantly higher consistency with the AERONET data compared to the original satellite datasets. The global averaged R values increase by up to 100 %, with reductions in the MAB and RMSE values by more than 30 %. The improvements in the two merged datasets are not constrained locally but spread across a larger region scale. The Region-3-CV and LOO-CV schemes further prove the effectiveness of our method in improving the estimation at places without ground sites. For the OMI-based synergy, CV results show that the R value increases by 64 %, MAB decreases by 11 %, and RMSE decreases by 10 %. The POLDER-based CV results also demonstrate better performance for the merged dataset, although they are weaker than the OMI-based CV results because of the much fewer samples in the POLDER validation dataset.
Overall, we have successfully integrated the satellite- and ground-based SSA data using an EnKF method, despite the limited availability of both satellite products and ground-based observations. The resulting merged datasets provide more accurate SSA estimates on a global scale compared to the original satellite data, particularly in regions where ground-based observations are not available. Our merged datasets hold great potential for improving climate models and advancing our understanding of aerosol radiative effects. With the ongoing deployment of ground-based sites and advanced spaceborne sensors to monitor global aerosols, we expect to incorporate SSA data from multi-sources and generate longer-term global SSA datasets with higher accuracy.
The supplement related to this article is available online at https://doi.org/10.5194/essd-17-3873-2025-supplement.
JL designed the research. YD implemented the research. ZZ, CZ, and QL helped collect and preprocess the data. YD wrote the paper with contributions from all of the co-authors.
The contact author has declared that none of the authors has any competing interests.
Publisher's note: Copernicus Publications remains neutral with regard to jurisdictional claims made in the text, published maps, institutional affiliations, or any other geographical representation in this paper. While Copernicus Publications makes every effort to include appropriate place names, the final responsibility lies with the authors.
We gratefully acknowledge AERONET for supporting the sun-photometer network and NASA for providing the OMI data. We also appreciate being able to use the POLDER data, which are based on POLDER/PARASOL Level-1 data originally provided by CNES (http://www.icare.univ-lille1.fr/, last access: 9 December 2024), processed at the AERIS/ICARE Data and Services Center with the GRASP software (https://www.grasp-open.com, last access: 20 April 2025), developed by Dubovik et al. (2011, 2014). This study was funded by the National Natural Science Foundation of China (NSFC grant no. 42425503), National Key Research and Development Program of China (grant no. 2023YFF0805401), and NSFC grants 52175144 and 52375121.
This research has been supported by the National Natural Science Foundation of China (NSFC grant no. 42425503), National Key Research and Development Program of China (grant no. 2023YFF0805401), and NSFC grants 52175144 and 52375121.
This paper was edited by Jing Wei and reviewed by two anonymous referees.
Anderson, J. L.: An ensemble adjustment Kalman filter for data assimilation, Mon. Weather Rev., 129, 2884–2903, 2001. a
Chatterjee, A., Michalak, A. M., Kahn, R. A., Paradise, S. R., Braverman, A. J., and Miller, C. E.: A geostatistical data fusion technique for merging remote sensing and ground based observations of aerosol optical thickness, J. Geophys. Res.-Atmos., 115, D20207, https://doi.org/10.1029/2009JD013765, 2010. a
Chen, C., Dubovik, O., Fuertes, D., Litvinov, P., Lapyonok, T., Lopatin, A., Ducos, F., Derimian, Y., Herman, M., Tanré, D., Remer, L. A., Lyapustin, A., Sayer, A. M., Levy, R. C., Hsu, N. C., Descloitres, J., Li, L., Torres, B., Karol, Y., Herrera, M., Herreras, M., Aspetsberger, M., Wanzenboeck, M., Bindreiter, L., Marth, D., Hangler, A., and Federspiel, C.: Validation of GRASP algorithm product from POLDER/PARASOL data and assessment of multi-angular polarimetry potential for aerosol monitoring, Earth Syst. Sci. Data, 12, 3573–3620, https://doi.org/10.5194/essd-12-3573-2020, 2020. a, b, c
Chen, C., Dubovik, O., Schuster, G. L., Chin, M., Henze, D. K., Lapyonok, T., Li, Z., Derimian, Y., and Zhang, Y.: Multi-angular polarimetric remote sensing to pinpoint global aerosol absorption and direct radiative forcing, Nat. Commun., 13, 7459, https://doi.org/10.1038/s41467-022-35147-y, 2022. a
Devi, A. and Satheesh, S. K.: Global maps of aerosol single scattering albedo using combined CERES-MODIS retrieval, Atmos. Chem. Phys., 22, 5365–5376, https://doi.org/10.5194/acp-22-5365-2022, 2022. a
Dong, Y.: Merged-OMI and Merged-POLDER aerosol single scattering albedo, Zenodo [code], https://doi.org/10.5281/zenodo.14294462, 2025. a, b
Dong, Y., Li, J., Yan, X., Li, C., Jiang, Z., Xiong, C., Chang, L., Zhang, L., Ying, T., and Zhang, Z.: Retrieval of aerosol single scattering albedo using joint satellite and surface visibility measurements, Remote Sens. Environ., 294, 113654, https://doi.org/10.1016/j.rse.2023.113654, 2023. a, b, c
Dong, Y., Li, J., Zhang, Z., Zheng, Y., Zhang, C., and Li, Z.: Machine learning based retrieval of aerosol and surface properties over land from the Gaofen-5 Directional Polarimetric Camera measurements, IEEE T. Geosci. Remote, 62, 4106315, https://doi.org/10.1109/TGRS.2024.3419169, 2024. a
Dubovik, O. and King, M. D.: A flexible inversion algorithm for retrieval of aerosol optical properties from Sun and sky radiance measurements, J. Geophys. Res.-Atmos., 105, 20673–20696, 2000. a, b, c
Dubovik, O., Holben, B., Eck, T. F., Smirnov, A., Kaufman, Y. J., King, M. D., Tanré, D., and Slutsker, I.: Variability of absorption and optical properties of key aerosol types observed in worldwide locations, J. Atmos. Sci., 59, 590–608, 2002. a
Dubovik, O., Herman, M., Holdak, A., Lapyonok, T., Tanré, D., Deuzé, J. L., Ducos, F., Sinyuk, A., and Lopatin, A.: Statistically optimized inversion algorithm for enhanced retrieval of aerosol properties from spectral multi-angle polarimetric satellite observations, Atmos. Meas. Tech., 4, 975–1018, https://doi.org/10.5194/amt-4-975-2011, 2011. a, b, c
Dubovik, O., Lapyonok, T., Litvinov, P., Herman, M., Fuertes, D., Ducos, F., Lopatin, A., Chaikovsky, A., Torres, B., and Derimian, Y.: GRASP: a versatile algorithm for characterizing the atmosphere, SPIE Newsroom, 25, 2–1201408, 2014. a, b, c
Dubovik, O., Li, Z., Mishchenko, M. I., Tanre, D., Karol, Y., Bojkov, B., Cairns, B., Diner, D. J., Espinosa, W. R., and Goloub, P.: Polarimetric remote sensing of atmospheric aerosols: instruments, methodologies, results, and perspectives, J. Quant. Spectrosc. Ra., 224, 474–511, 2019. a, b
Engelstaedter, S., Tegen, I., and Washington, R.: North African dust emissions and transport, Earth-Sci. Rev., 79, 73–100, 2006. a
Evensen, G.: Sequential data assimilation with a nonlinear quasi geostrophic model using Monte Carlo methods to forecast error statistics, J. Geophys. Res.-Oceans, 99, 10143–10162, 1994. a
Fougnie, B.: Improvement of the PARASOL radiometric in-flight calibration based on synergy between various methods using natural targets, IEEE T. Geosci. Remote, 54, 2140–2152, https://doi.org/10.1109/TGRS.2015.2496322, 2016. a
Fu, G. and Hasekamp, O.: Retrieval of aerosol microphysical and optical properties over land using a multimode approach, Atmos. Meas. Tech., 11, 6627–6650, https://doi.org/10.5194/amt-11-6627-2018, 2018. a
Gaspari, G. and Cohn, S. E.: Construction of correlation functions in two and three dimensions, Q. J. Roy. Meteor. Soc., 125, 723–757, 1999. a
Hamill, T. M., Whitaker, J. S., and Snyder, C.: Distance-dependent filtering of background error covariance estimates in an ensemble Kalman filter, Mon. Weather Rev., 129, 2776–2790, 2001. a
Hansen, J., Sato, M., and Ruedy, R.: Radiative forcing and climate response, J. Geophys. Res.-Atmos., 102, 6831–6864, 1997. a
Hasekamp, O. P. and Landgraf, J.: Retrieval of aerosol properties over land surfaces: capabilities of multiple-viewing-angle intensity and polarization measurements, Appl. Optics, 46, 3332–3344, 2007. a
Hasekamp, O., Litvinov, P., Fu, G., Chen, C., and Dubovik, O.: Algorithm evaluation for polarimetric remote sensing of atmospheric aerosols, Atmos. Meas. Tech., 17, 1497–1525, https://doi.org/10.5194/amt-17-1497-2024, 2024. a
Holben, B. N., Eck, T. F., Slutsker, I. a., Tanre, D., Buis, J., Setzer, A., Vermote, E., Reagan, J. A., Kaufman, Y., and Nakajima, T.: AERONET – a federated instrument network and data archive for aerosol characterization, Remote Sens. Environ., 66, 1–16, 1998. a
Houtekamer, P. L. and Mitchell, H. L.: A sequential ensemble Kalman filter for atmospheric data assimilation, Mon. Weather Rev., 129, 123–137, 2001. a
Jethva, H., Torres, O., and Ahn, C.: Global assessment of OMI aerosol single scattering albedo using ground based AERONET inversion, J. Geophys. Res.-Atmos., 119, 9020–9040, 2014. a, b
Jinnagara Puttaswamy, S., Nguyen, H. M., Braverman, A., Hu, X., and Liu, Y.: Statistical data fusion of multi-sensor AOD over the continental United States, Geocarto Int., 29, 48–64, 2014. a
Kahn, R. A.: Reducing the uncertainties in direct aerosol radiative forcing, Surv. Geophys., 33, 701–721, 2012. a
Kahn, R. A., Andrews, E., Brock, C. A., Chin, M., Feingold, G., Gettelman, A., Levy, R. C., Murphy, D. M., Nenes, A., and Pierce, J. R.: Reducing aerosol forcing uncertainty by combining models with satellite and within the atmosphere observations: a three way street, Rev. Geophys., 61, e2022RG000796, https://doi.org/10.1029/2022RG000796, 2023. a
Lee, K. H., Li, Z., Wong, M. S., Xin, J., Wang, Y., Hao, W., and Zhao, F.: Aerosol single scattering albedo estimated across China from a combination of ground and satellite measurements, J. Geophys. Res.-Atmos., 112, D22S15, https://doi.org/10.1029/2007JD009077, 2007. a
Levy, R. C., Mattoo, S., Munchak, L. A., Remer, L. A., Sayer, A. M., Patadia, F., and Hsu, N. C.: The Collection 6 MODIS aerosol products over land and ocean, Atmos. Meas. Tech., 6, 2989–3034, https://doi.org/10.5194/amt-6-2989-2013, 2013. a
Li, J., Li, X., Carlson, B. E., Kahn, R. A., Lacis, A. A., Dubovik, O., and Nakajima, T.: Reducing multisensor satellite monthly mean aerosol optical depth uncertainty: 1. Objective assessment of current AERONET locations, J. Geophys. Res.-Atmos., 121, 13609–13627, 2016. a
Li, J., Kahn, R. A., Wei, J., Carlson, B. E., Lacis, A. A., Li, Z., Li, X., Dubovik, O., and Nakajima, T.: Synergy of satellite and ground based aerosol optical depth measurements using an ensemble Kalman filter approach, J. Geophys. Res.-Atmos., 125, e2019JD031884, https://doi.org/10.1029/2019JD031884, 2020. a, b, c, d, e, f, g, h
Li, J., Carlson, B. E., Yung, Y. L., Lv, D., Hansen, J., Penner, J. E., Liao, H., Ramaswamy, V., Kahn, R. A., Zhang, P., Dubovik, O., Ding, A., Lacis, A., Zhang, L., and Dong, Y.: Scattering and absorbing aerosols in the climate system, Nature Reviews Earth and Environment, 3, 363–379, 2022. a, b, c
Loeb, N. G. and Su, W.: Direct aerosol radiative forcing uncertainty based on a radiative perturbation analysis, J. Climate, 23, 5288–5293, 2010. a
Lorenc, A. C.: The potential of the ensemble Kalman filter for NWP – a comparison with 4D Var, Q. J. Roy. Meteor. Soc., 129, 3183–3203, 2003. a
Mahowald, N. M. and Dufresne, J.: Sensitivity of TOMS aerosol index to boundary layer height: Implications for detection of mineral aerosol sources, Geophys. Res. Lett., 31, L03103, https://doi.org/10.1029/2003GL018865, 2004. a
Mielonen, T., Levy, R. C., Aaltonen, V., Komppula, M., de Leeuw, G., Huttunen, J., Lihavainen, H., Kolmonen, P., Lehtinen, K. E. J., and Arola, A.: Evaluating the assumptions of surface reflectance and aerosol type selection within the MODIS aerosol retrieval over land: the problem of dust type selection, Atmos. Meas. Tech., 4, 201–214, https://doi.org/10.5194/amt-4-201-2011, 2011. a
Mishchenko, M. I., Cairns, B., Kopp, G., Schueler, C. F., Fafaul, B. A., Hansen, J. E., Hooker, R. J., Itchkawich, T., Maring, H. B., and Travis, L. D.: Accurate monitoring of terrestrial aerosols and total solar irradiance: introducing the Glory mission, B. Am. Meteorol. Soc., 88, 677–692, 2007. a
Nguyen, H., Cressie, N., and Braverman, A.: Spatial statistical data fusion for remote sensing applications, J. Am. Stat. Assoc., 107, 1004–1018, 2012. a
Omar, A. H., Won, J., Winker, D. M., Yoon, S., Dubovik, O., and McCormick, M. P.: Development of global aerosol models using cluster analysis of Aerosol Robotic Network (AERONET) measurements, J. Geophys. Res.-Atmos., 110, D10S14, https://doi.org/10.1029/2004JD004874, 2005. a
Proestakis, E., Amiridis, V., Marinou, E., Georgoulias, A. K., Solomos, S., Kazadzis, S., Chimot, J., Che, H., Alexandri, G., Binietoglou, I., Daskalopoulou, V., Kourtidis, K. A., de Leeuw, G., and van der A, R. J.: Nine-year spatial and temporal evolution of desert dust aerosols over South and East Asia as revealed by CALIOP, Atmos. Chem. Phys., 18, 1337–1362, https://doi.org/10.5194/acp-18-1337-2018, 2018. a
Ramanathan, V., Crutzen, P., Kiehl, J., and Rosenfeld, D.: Aerosols, climate, and the hydrological cycle, Science, 294, 2119–2124, 2001. a
Schutgens, N., Dubovik, O., Hasekamp, O., Torres, O., Jethva, H., Leonard, P. J. T., Litvinov, P., Redemann, J., Shinozuka, Y., de Leeuw, G., Kinne, S., Popp, T., Schulz, M., and Stier, P.: AEROCOM and AEROSAT AAOD and SSA study – Part 1: Evaluation and intercomparison of satellite measurements, Atmos. Chem. Phys., 21, 6895–6917, https://doi.org/10.5194/acp-21-6895-2021, 2021. a
Sinyuk, A., Holben, B. N., Eck, T. F., Giles, D. M., Slutsker, I., Korkin, S., Schafer, J. S., Smirnov, A., Sorokin, M., and Lyapustin, A.: The AERONET Version 3 aerosol retrieval algorithm, associated uncertainties and comparisons to Version 2, Atmos. Meas. Tech., 13, 3375–3411, https://doi.org/10.5194/amt-13-3375-2020, 2020. a, b, c
Tang, Q., Bo, Y., and Zhu, Y.: Spatiotemporal fusion of multiple satellite aerosol optical depth (AOD) products using Bayesian maximum entropy method, J. Geophys. Res.-Atmos., 121, 4034–4048, 2016. a
Tanré, D., Bréon, F. M., Deuzé, J. L., Dubovik, O., Ducos, F., François, P., Goloub, P., Herman, M., Lifermann, A., and Waquet, F.: Remote sensing of aerosols by using polarized, directional and spectral measurements within the A-Train: the PARASOL mission, Atmos. Meas. Tech., 4, 1383–1395, https://doi.org/10.5194/amt-4-1383-2011, 2011. a
Thorsen, T. J., Winker, D. M., and Ferrare, R. A.: Uncertainty in observational estimates of the aerosol direct radiative effect and forcing, J. Climate, 34, 195–214, 2021. a
Torres, O.: OMI/Aura Near UV Aerosol Optical Depth and Single Scattering Albedo Daily L2 Global Gridded 0.25 degree × 0.25 degree V3, Greenbelt, MD, USA, Goddard Earth Sciences Data and Information Services Center (GES DISC) [data set], https://doi.org/10.5067/Aura/OMI/DATA2005, 2015. a
Torres, O., Bhartia, P., Herman, J., Ahmad, Z., and Gleason, J.: Derivation of aerosol properties from satellite measurements of backscattered ultraviolet radiation: theoretical basis, J. Geophys. Res.-Atmos., 103, 17099–17110, 1998. a
Torres, O., Tanskanen, A., Veihelmann, B., Ahn, C., Braak, R., Bhartia, P. K., Veefkind, P., and Levelt, P.: Aerosols and surface UV products from ozone monitoring instrument observations: an overview, J. Geophys. Res.-Atmos., 112, D24S47, https://doi.org/10.1029/2007JD008809, 2007. a, b
Torres, O., Ahn, C., and Chen, Z.: Improvements to the OMI near-UV aerosol algorithm using A-train CALIOP and AIRS observations, Atmos. Meas. Tech., 6, 3257–3270, https://doi.org/10.5194/amt-6-3257-2013, 2013. a
Torres, O., Jethva, H., Ahn, C., Jaross, G., and Loyola, D. G.: TROPOMI aerosol products: evaluation and observations of synoptic-scale carbonaceous aerosol plumes during 2018–2020, Atmos. Meas. Tech., 13, 6789–6806, https://doi.org/10.5194/amt-13-6789-2020, 2020. a
Wu, L., Hasekamp, O., van Diedenhoven, B., Cairns, B., Yorks, J. E., and Chowdhary, J.: Passive remote sensing of aerosol layer height using near UV multiangle polarization measurements, Geophys. Res. Lett., 43, 8783–8790, 2016. a
Xu, H., Guang, J., Xue, Y., De Leeuw, G., Che, Y., Guo, J., He, X., and Wang, T.: A consistent aerosol optical depth (AOD) dataset over mainland China by integration of several AOD products, Atmos. Environ., 114, 48–56, 2015. a
Zhang, L. and Li, J.: Variability of major aerosol types in China classified using AERONET measurements, Remote Sens.-Basel, 11, 2334, https://doi.org/10.3390/rs11202334, 2019. a
Zhang, L., Li, J., Jiang, Z., Dong, Y., Ying, T., and Zhang, Z.: Clear-sky direct aerosol radiative forcing uncertainty associated with aerosol optical properties based on CMIP6 models, J. Climate, 35, 3007–3019, 2022. a, b
Zhang, Z., Li, J., Dong, Y., Zhang, C., Ying, T., and Li, Q.: Long-term trends in aerosol single scattering albedo cause bias in MODIS aerosol optical depth trends, IEEE T. Geosci. Remote, 62, 4109209, https://doi.org/10.1109/TGRS.2024.3424981, 2024. a
Zhao, A., Li, Z., Zhang, Y., Zhang, Y., and Li, D.: Merging modis and ground-based fine mode fraction of aerosols based on the geostatistical data fusion method, Atmosphere, 8, 117, https://doi.org/10.3390/atmos8070117, 2017. a
Zhu, A., Ramanathan, V., Li, F., and Kim, D.: Dust plumes over the Pacific, Indian, and Atlantic oceans: climatology and radiative impact, J. Geophys. Res.-Atmos., 112, D16208, https://doi.org/10.1029/2007JD008427, 2007. a
Zhu, H., Cheng, T., Li, X., Ye, X., Fan, D., Tang, T., and Zhang, L.: Fusion of multisource satellite AOD products via Bayesian maximum entropy with explicit a priori knowledge, IEEE T. Geosci. Remote, 61, 1–12, 2023. a