the Creative Commons Attribution 4.0 License.
the Creative Commons Attribution 4.0 License.
 | 30 Jul 2025
Northern Hemisphere in situ snow water equivalent dataset (NorSWE, 1979–2021)
Colleen Mortimer
Vincent Vionnet
In situ observations of snow water equivalent (SWE) are critical for climate applications and resource management, yet there is no global database of in situ SWE observations. Here, we present the Northern Hemisphere in situ snow water equivalent dataset (NorSWE), consisting of over 11.5 million SWE observations from more than 10 000 different locations across the Northern Hemisphere spanning the modern satellite era (1979–2021). NorSWE builds on an existing framework applied to Canadian data (CanSWE; Vionnet et al., 2021). It includes SWE observations from manual snow courses covering Canada, the United States, Norway, Finland, and Russia and from automated sensors (snow pillows, snow scales, and automated passive gamma radiation sensors) in Canada, the United States, Norway, and Nepal. Airborne passive gamma SWE estimates provide additional coverage over North America. Exceptionally, to expand coverage over Europe, we also include single-point manual SWE observations from 11 sites in Switzerland. In addition to SWE, snow depth (SD) and derived bulk snow density are included when available. A consistent quality control is applied to all records, and the final dataset is delivered as a single NetCDF file that is publicly available at https://doi.org/10.5281/zenodo.15263370 (Mortimer and Vionnet, 2025).
- Article
(2972 KB) - Full-text XML
-
Supplement
(827 KB) - BibTeX
- EndNote


Accurate knowledge of the amount of water stored in the seasonal snowpack is critical for risk and resource management, including for flood and drought forecasting (e.g. Barnett et al., 2005; Fyfe et al., 2017; Huning and AghaKouchak, 2020; Vionnet et al., 2020), water supply for agriculture (Biemans et al., 2019; Qin et al., 2020) and human consumption (Foster et al., 2011; Sturm et al., 2017), hydropower operations (Magnusson et al., 2020), and ecosystem and climate monitoring (Meredith et al., 2022; Thornton et al., 2021; Gottlieb and Mankin, 2024). It is quantified by the snow water equivalent (SWE, also known as the water equivalent of snow cover), which is “the vertical depth of water that would be obtained if the snow cover melted completely, which equates to the snow-cover mass per unit area” (WMO, 2024). At global scales, SWE can be estimated from climate models (Mudryk et al., 2020); reanalyses (Mudryk et al., 2025, and references therein); and, to some extent, passive microwave satellite observations (Pulliainen et al., 2020), but these methods usually produce SWE estimates at medium to coarse spatial resolutions (5–25 km), and their accuracy must be verified against ground-based measurements. In situ, SWE can be measured manually using snow pits or a snow tube (WMO, 2024); automated sensors such as snow pillows (Beaumont, 1965), snow scales (Johnson, 2004; Smith et al., 2017), and passive gamma radiation sensors (Kodama et al., 1979; Paquet et al., 2008); or the analysis of GNSS signals (Henkel et al., 2018; Steiner et al., 2022). SWE can be estimated from in situ snow depth (SD, formally abbreviated as HS; WMO, 2024) measurements using snow density models relating SD to SWE, as in the Northern Hemispheric dataset NH-SWE (Fontrodona-Bach et al., 2023) and the airborne lidar-based Airborne Snow Observatory (ASO, Painter et al., 2016); however, these are not direct observations of SWE. Rather, they rely on ancillary data and direct in situ observations, such as those provided in our dataset, for their development.
Snow cover varies spatially, influenced by land cover and microclimates, so that SWE measured at a single point or from automated sensors, which have footprints m2, may not be representative of a larger area (López-Moreno et al., 2020; Meromy et al., 2013). Therefore, for manual SWE observation, it is common practice to collect multiple SWE and SD measurements along a predefined route, referred to as a multi-point gravimetric snow survey, a snow course, or a snow transect (WMO, 2024). These multiple measurements are averaged together to provide a single SWE value for the area of interest. At larger scales still, SWE is estimated from airborne surveys of passive gamma radiation by relating the attenuation of gamma radiation emitted from the upper layers of the soil by the intervening water mass (solid or liquid) after accounting for the background soil moisture (Carroll, 2001). This principle, also employed by automated gamma radiation sensors (e.g. Choquette et al., 2013), has been used operationally in the United States (National Operational Hydrologic Remote Sensing Center – NOHRSC) since 1979. Direct comparisons of airborne gamma and snow course measurements showed reasonable correspondence (correlation >0.7) in non-mountain areas up to distances of at least 50 km (Mortimer et al., 2024).
Although manual in situ SWE measurements have been conducted for nearly a century (Helmes et al., 2008; Bulygina et al., 2011), there is no standard global database to archive these observations, nor is there a standard approach to measuring SWE (Pirazzini et al., 2018, for Europe). Some national agencies such as the All-Russia Research Institute of Hydrometeorological Information – World Data Center (RIHMI-WDC) and the Finish Environmental Institute (SYKE) maintain a comprehensive national network of repeated manual snow surveys whose data are archived and searchable. Elsewhere, such as Canada and the United States, SWE is measured separately by various agencies, government departments, and hydropower companies, some of which are consolidated into larger databases – for example, the Canadian historical Snow Water Equivalent dataset (CanSWE) (Vionnet et al., 2021) and the Natural Resources Conservation Service (NRCS) through its regional data collection offices (Fleming et al., 2023). It is under this fragmented landscape that we compiled available in situ SWE measurements covering North America, Norway, Finland, Switzerland, Russia, and Nepal into a single dataset: the Northern Hemisphere in situ snow water equivalent dataset (NorSWE, Mortimer and Vionnet, 2025). NorSWE was initially compiled to support the evaluation of gridded SWE products (Elias Chereque et al., 2024; Mortimer et al., 2024; Mudryk et al., 2025), and so we concentrated on compiling snow courses and airborne gamma SWE, which are more spatially representative than automated instruments. To support the evaluation of hydrological models (e.g. Arnal et al., 2024), which requires a higher temporal frequency than what is available from the snow courses, we added automated SWE measurements from snow pillows, snow scales, and automated passive gamma radiation sensors over North America, Norway, and Nepal. To fill data gaps in Europe, we, exceptionally, include single-point manual SWE and SD observations from the Swiss GCOS network (Marty, 2020). NorSWE covers the period 1979–2021 and is available as a single NetCDF file following the conventions of CanSWE (Vionnet et al., 2021). Dataset development generally followed Vionnet et al. (2021), with additional procedures and data attributes to support the non-Canadian data sources described herein. This paper is organized as follows: Section 2 describes the types of measurements included in the dataset, Sects. 3 through 5 outline the data processing and quality control (QC) procedures, Sect. 6 summarizes the published dataset, Sects. 7 and 8 discuss its usage and limitations, and a brief conclusion is given in Sect. 9.
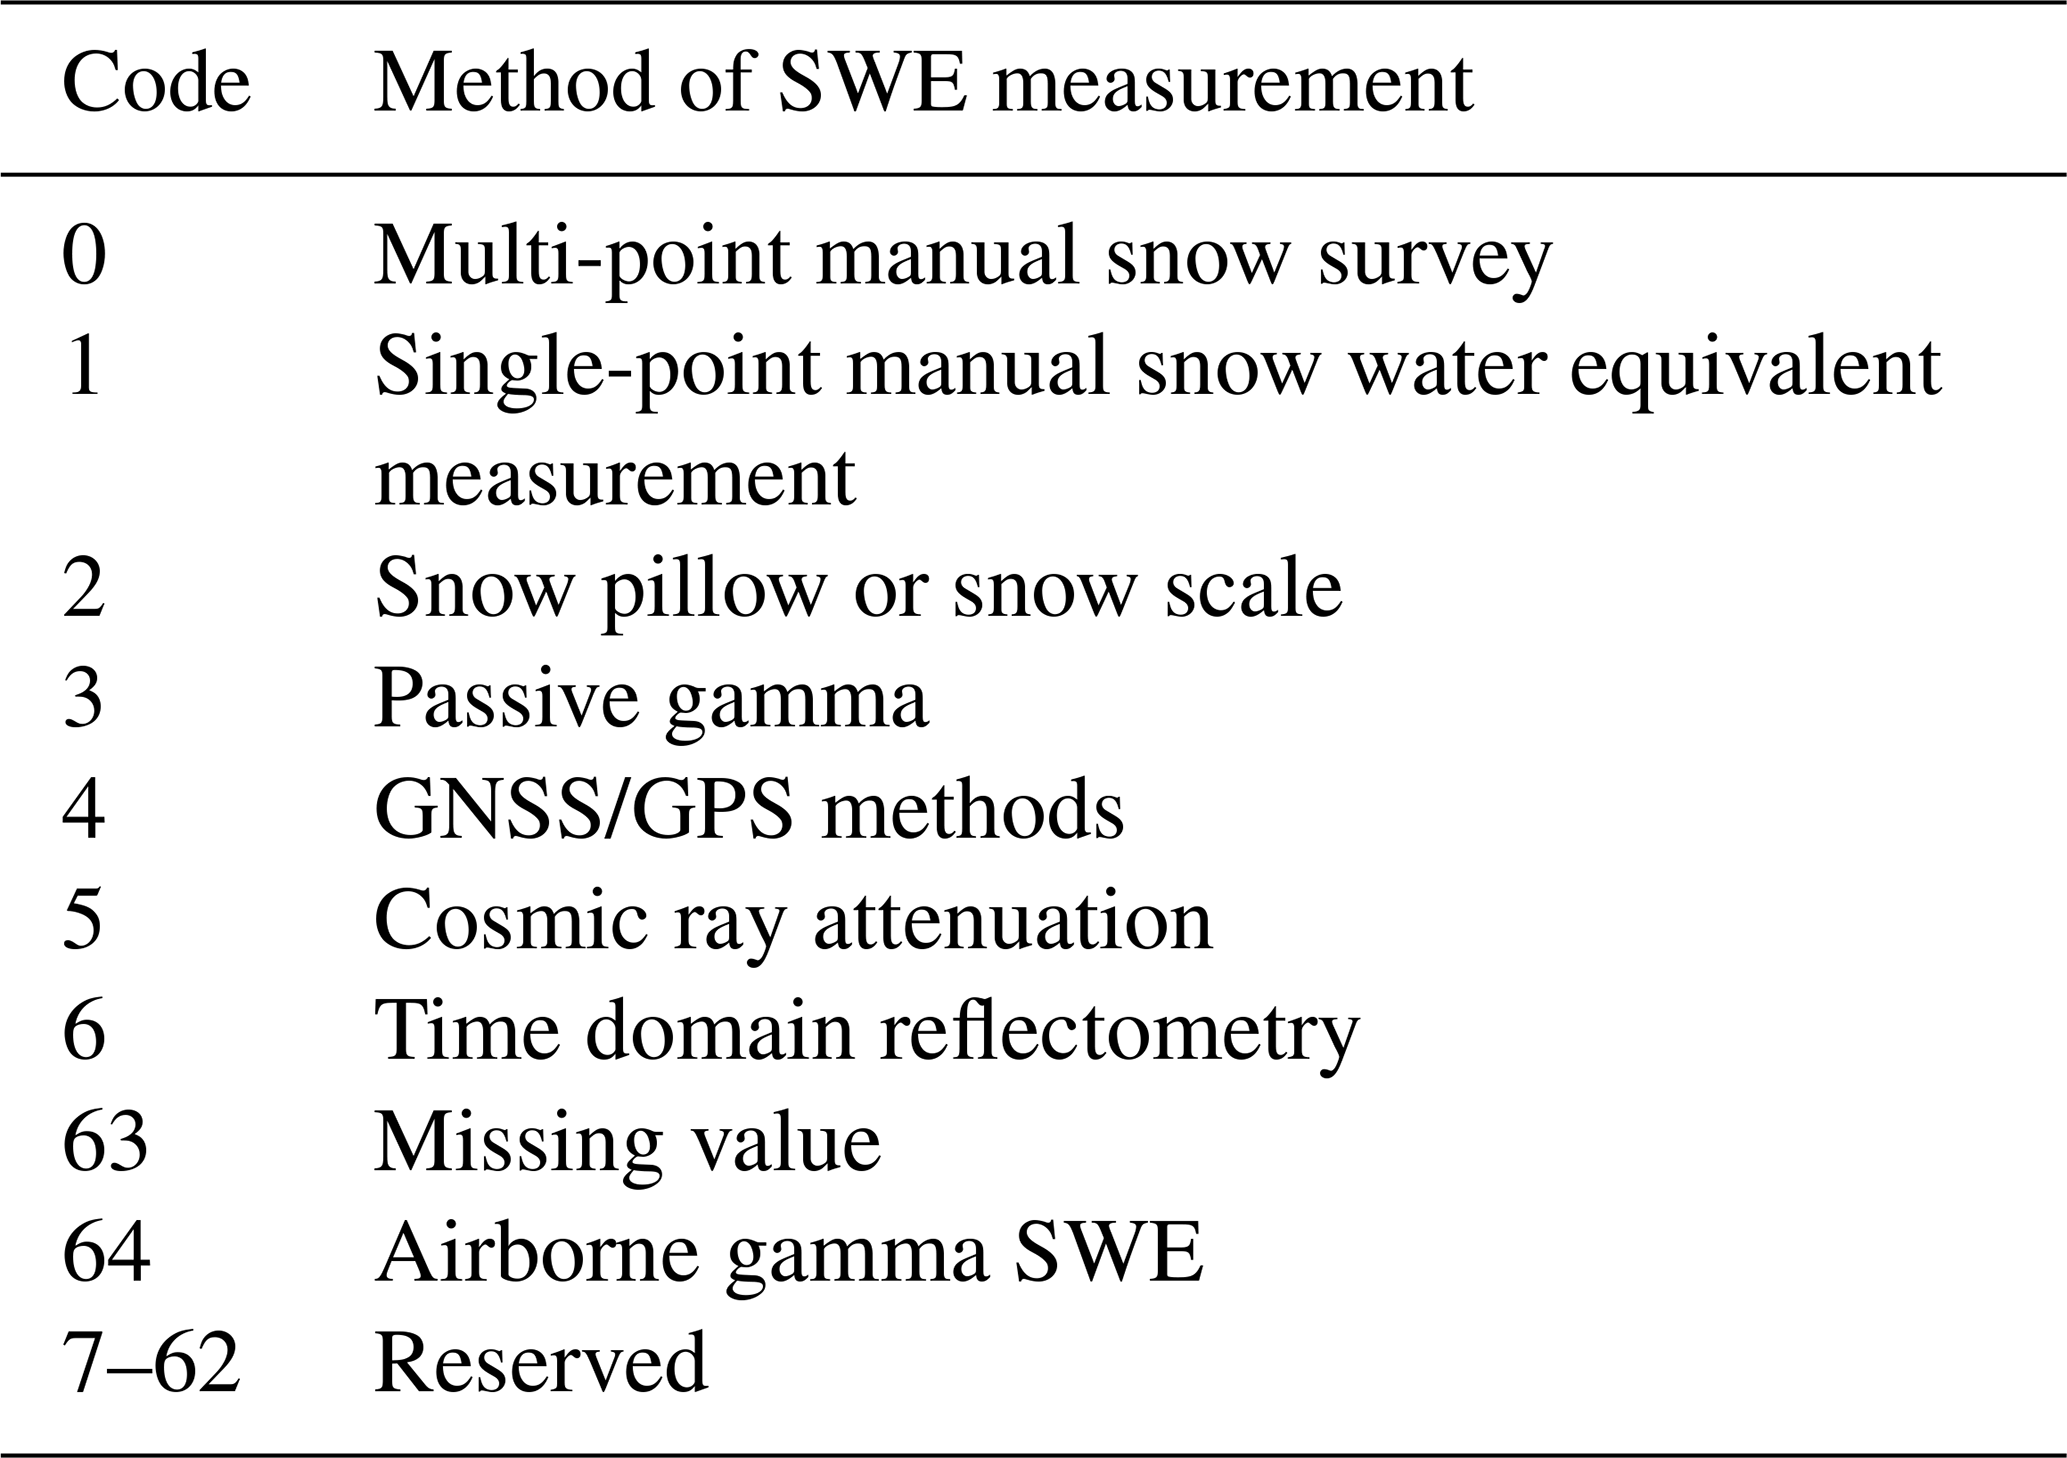
NorSWE includes SWE observations from manual gravimetric snow surveys, airborne gamma SWE, automated snow pillows, snow scales, and passive gamma radiation sensors from the sources listed in Table 1. Exceptionally, it also includes single-point manual observations from select sites in Switzerland. The measurement type codes (Table 2) follow the WMO BUFR table (FM 94 BUFR code table 0 03 028; WMO, 2025), except for airborne gamma, to which we assign code 64 in order to differentiate it from passive gamma radiation sensors (Table 3).
Table 1Data sources included in NorSWE.
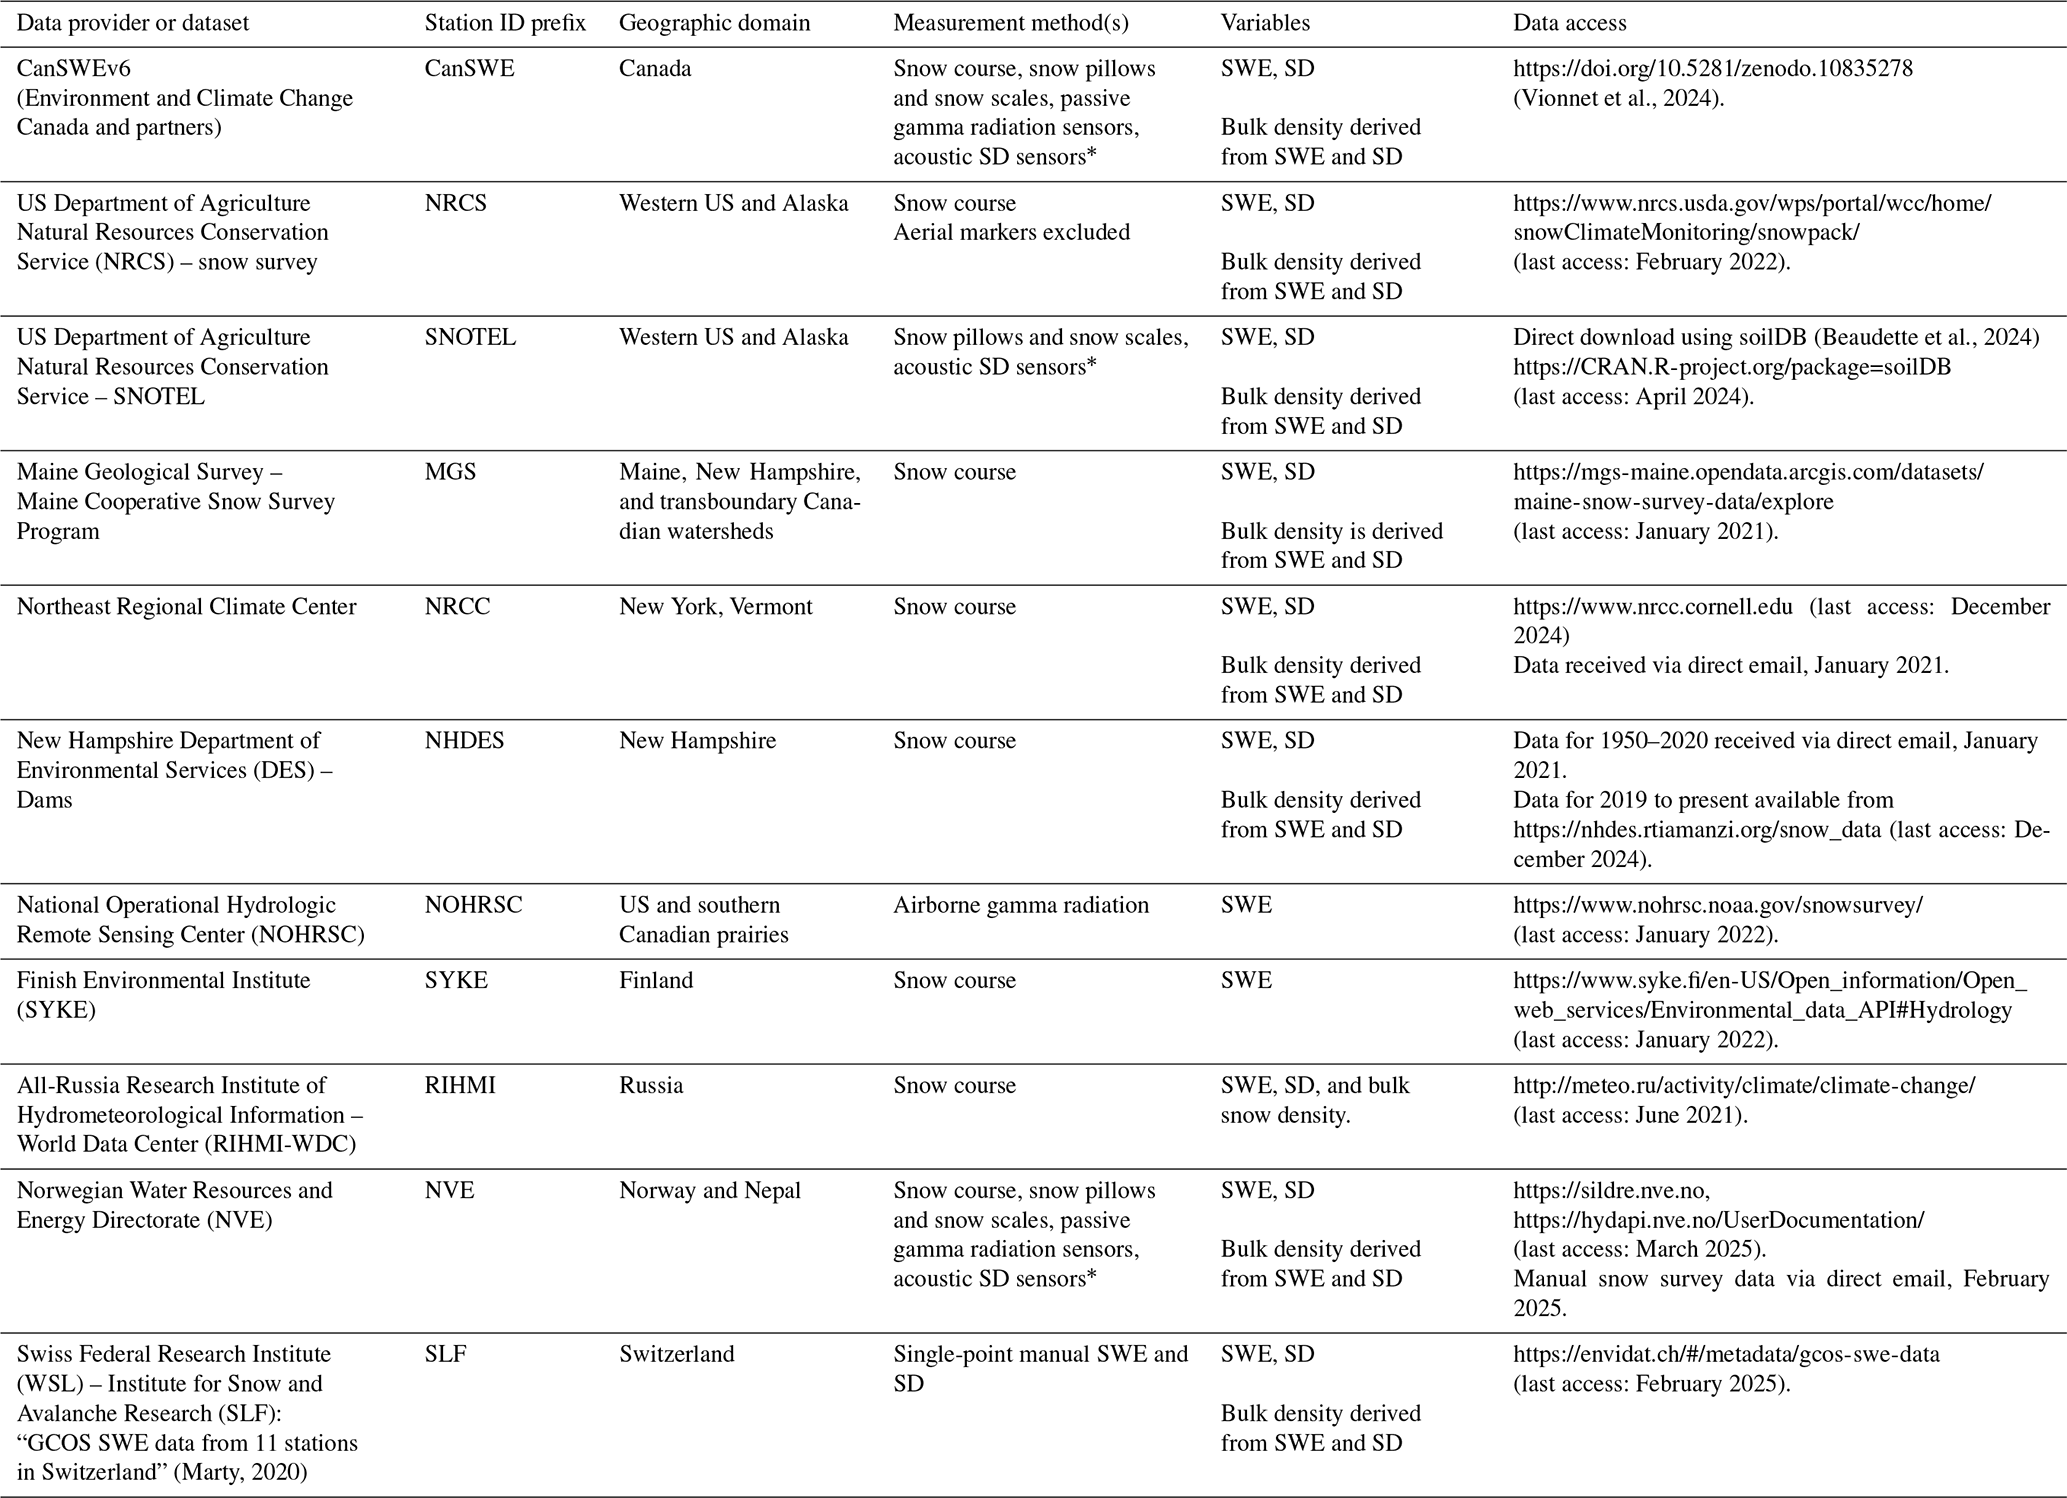
∗ SD measurements from acoustic sensors are included when co-located with an automated SWE sensor.
Table 2Description of variables in the NorSWE NetCDF file.
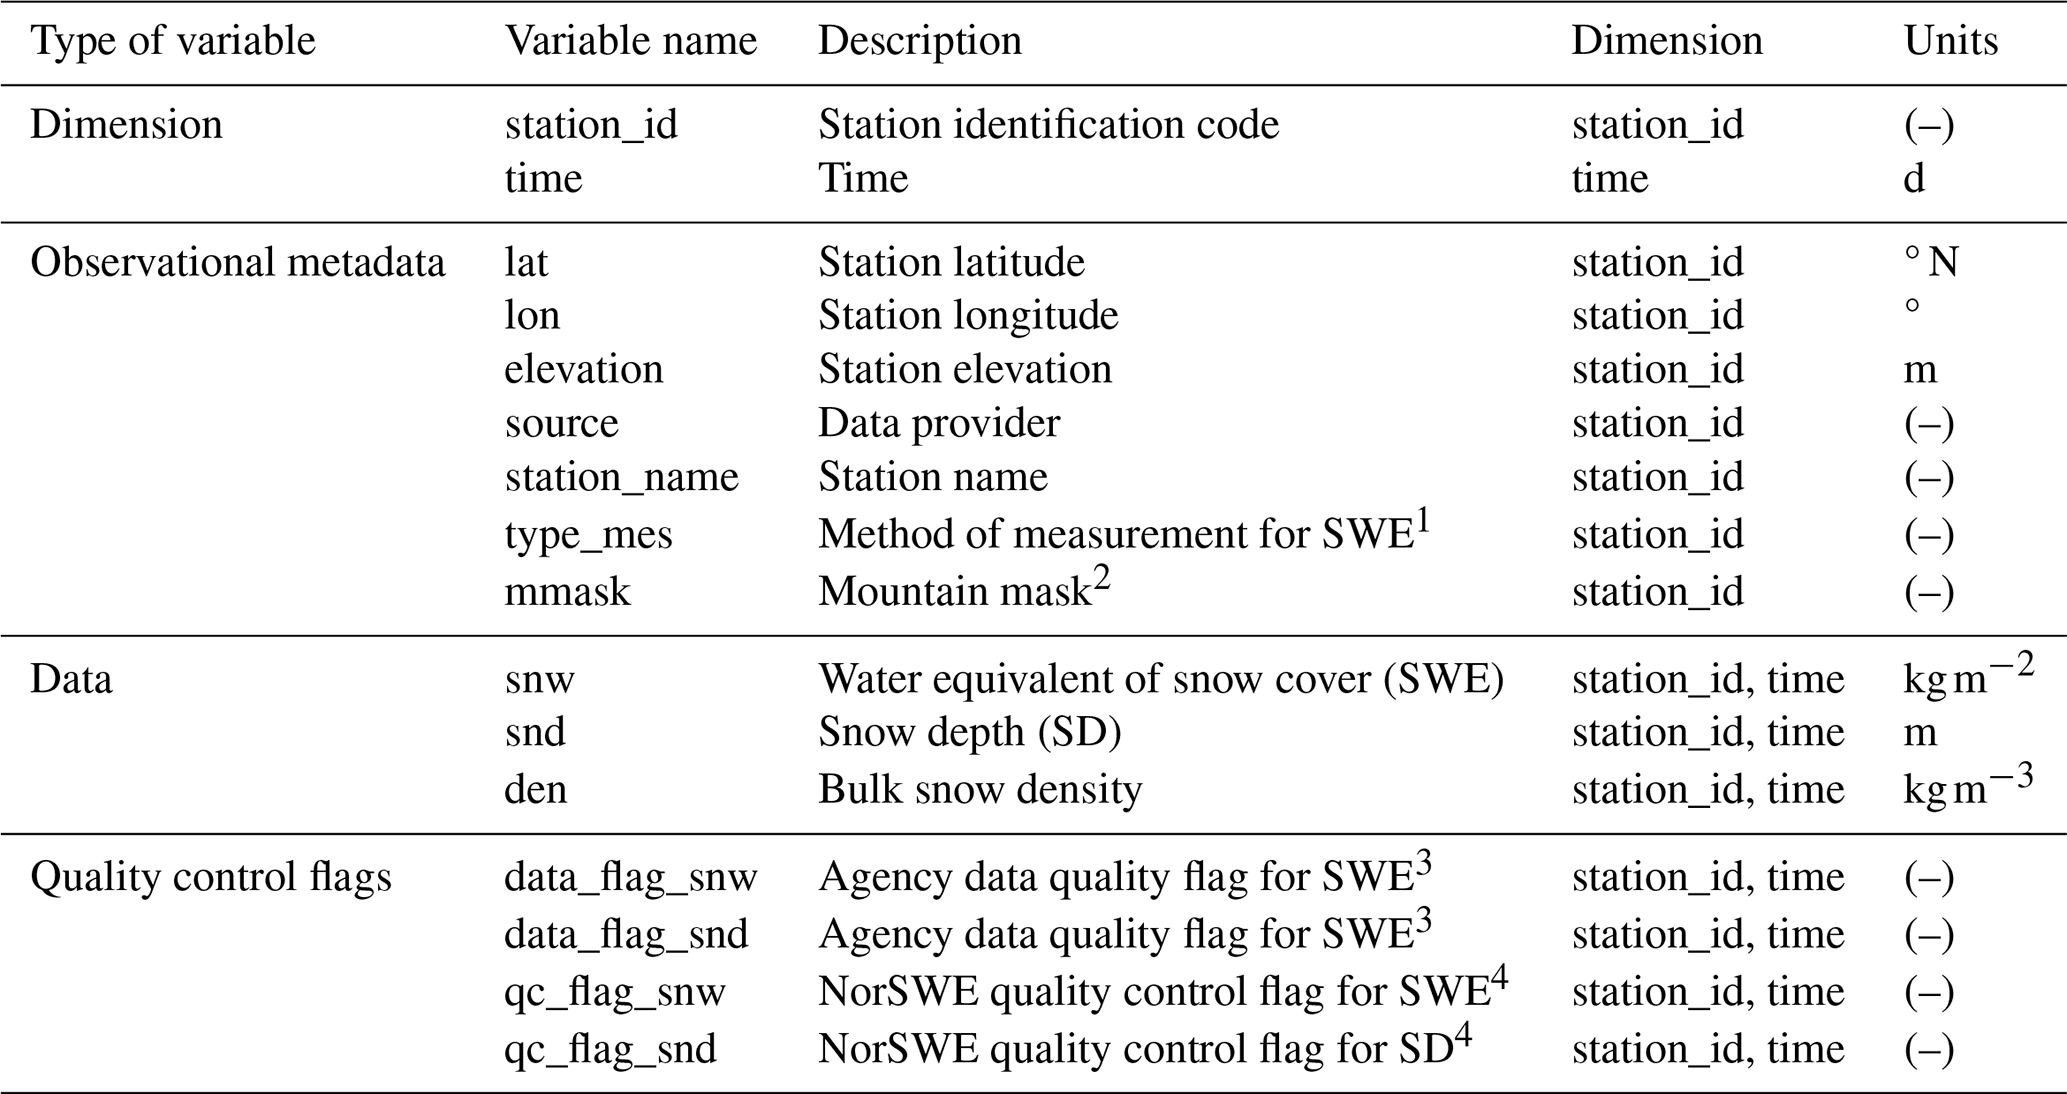
1 See Table 3. 2 See Sect. 3. 3 See Table 5. 4 See Table 8.
Table 3WMO BUFR (WMO, 2025) SWE measurement codes and non-WMO code for airborne gamma SWE.
2.1 Manual measurements
2.1.1 Gravimetric snow surveys
Gravimetric snow surveys, also known as snow courses or snow transects, consist of multiple depth and density measurements collected along a predefined route that are averaged to obtain a single representative SWE value for the entire route (WMO, 2024; Table 4 and references therein). In general, a double-sampling technique is employed where SD and SWE measurements are collected at multiple points (–15) along the route, with additional SD measurements () collected between these SWE sampling locations. We gathered snow course data from multiple agencies in Canada (consolidated in CanSWE, Vionnet et al., 2021), the United States, Norway, Finland, and Russia (Table 1). Table 4 provides general sampling procedures for the contributing datasets; however, even within a given contributing agency, protocols may vary and differ from those listed. Measurement uncertainty for various snow samplers ranges from ∼3 % to 13 % (Sturm et al., 2010; Stranden and Grønsten, 2011; Table 2 in Dixon and Boon, 2012, and references therein; USDA, 2012; López-Moreno et al., 2020). This value does not include operator error, which can increase the uncertainty. Figure 1 shows the location of the manual snow survey contained in NorSWE.
Table 4Manual snow survey sampling protocol and equipment. Precise sampling protocols may differ from those described below, especially where multiple entities contribute data to a single agency.
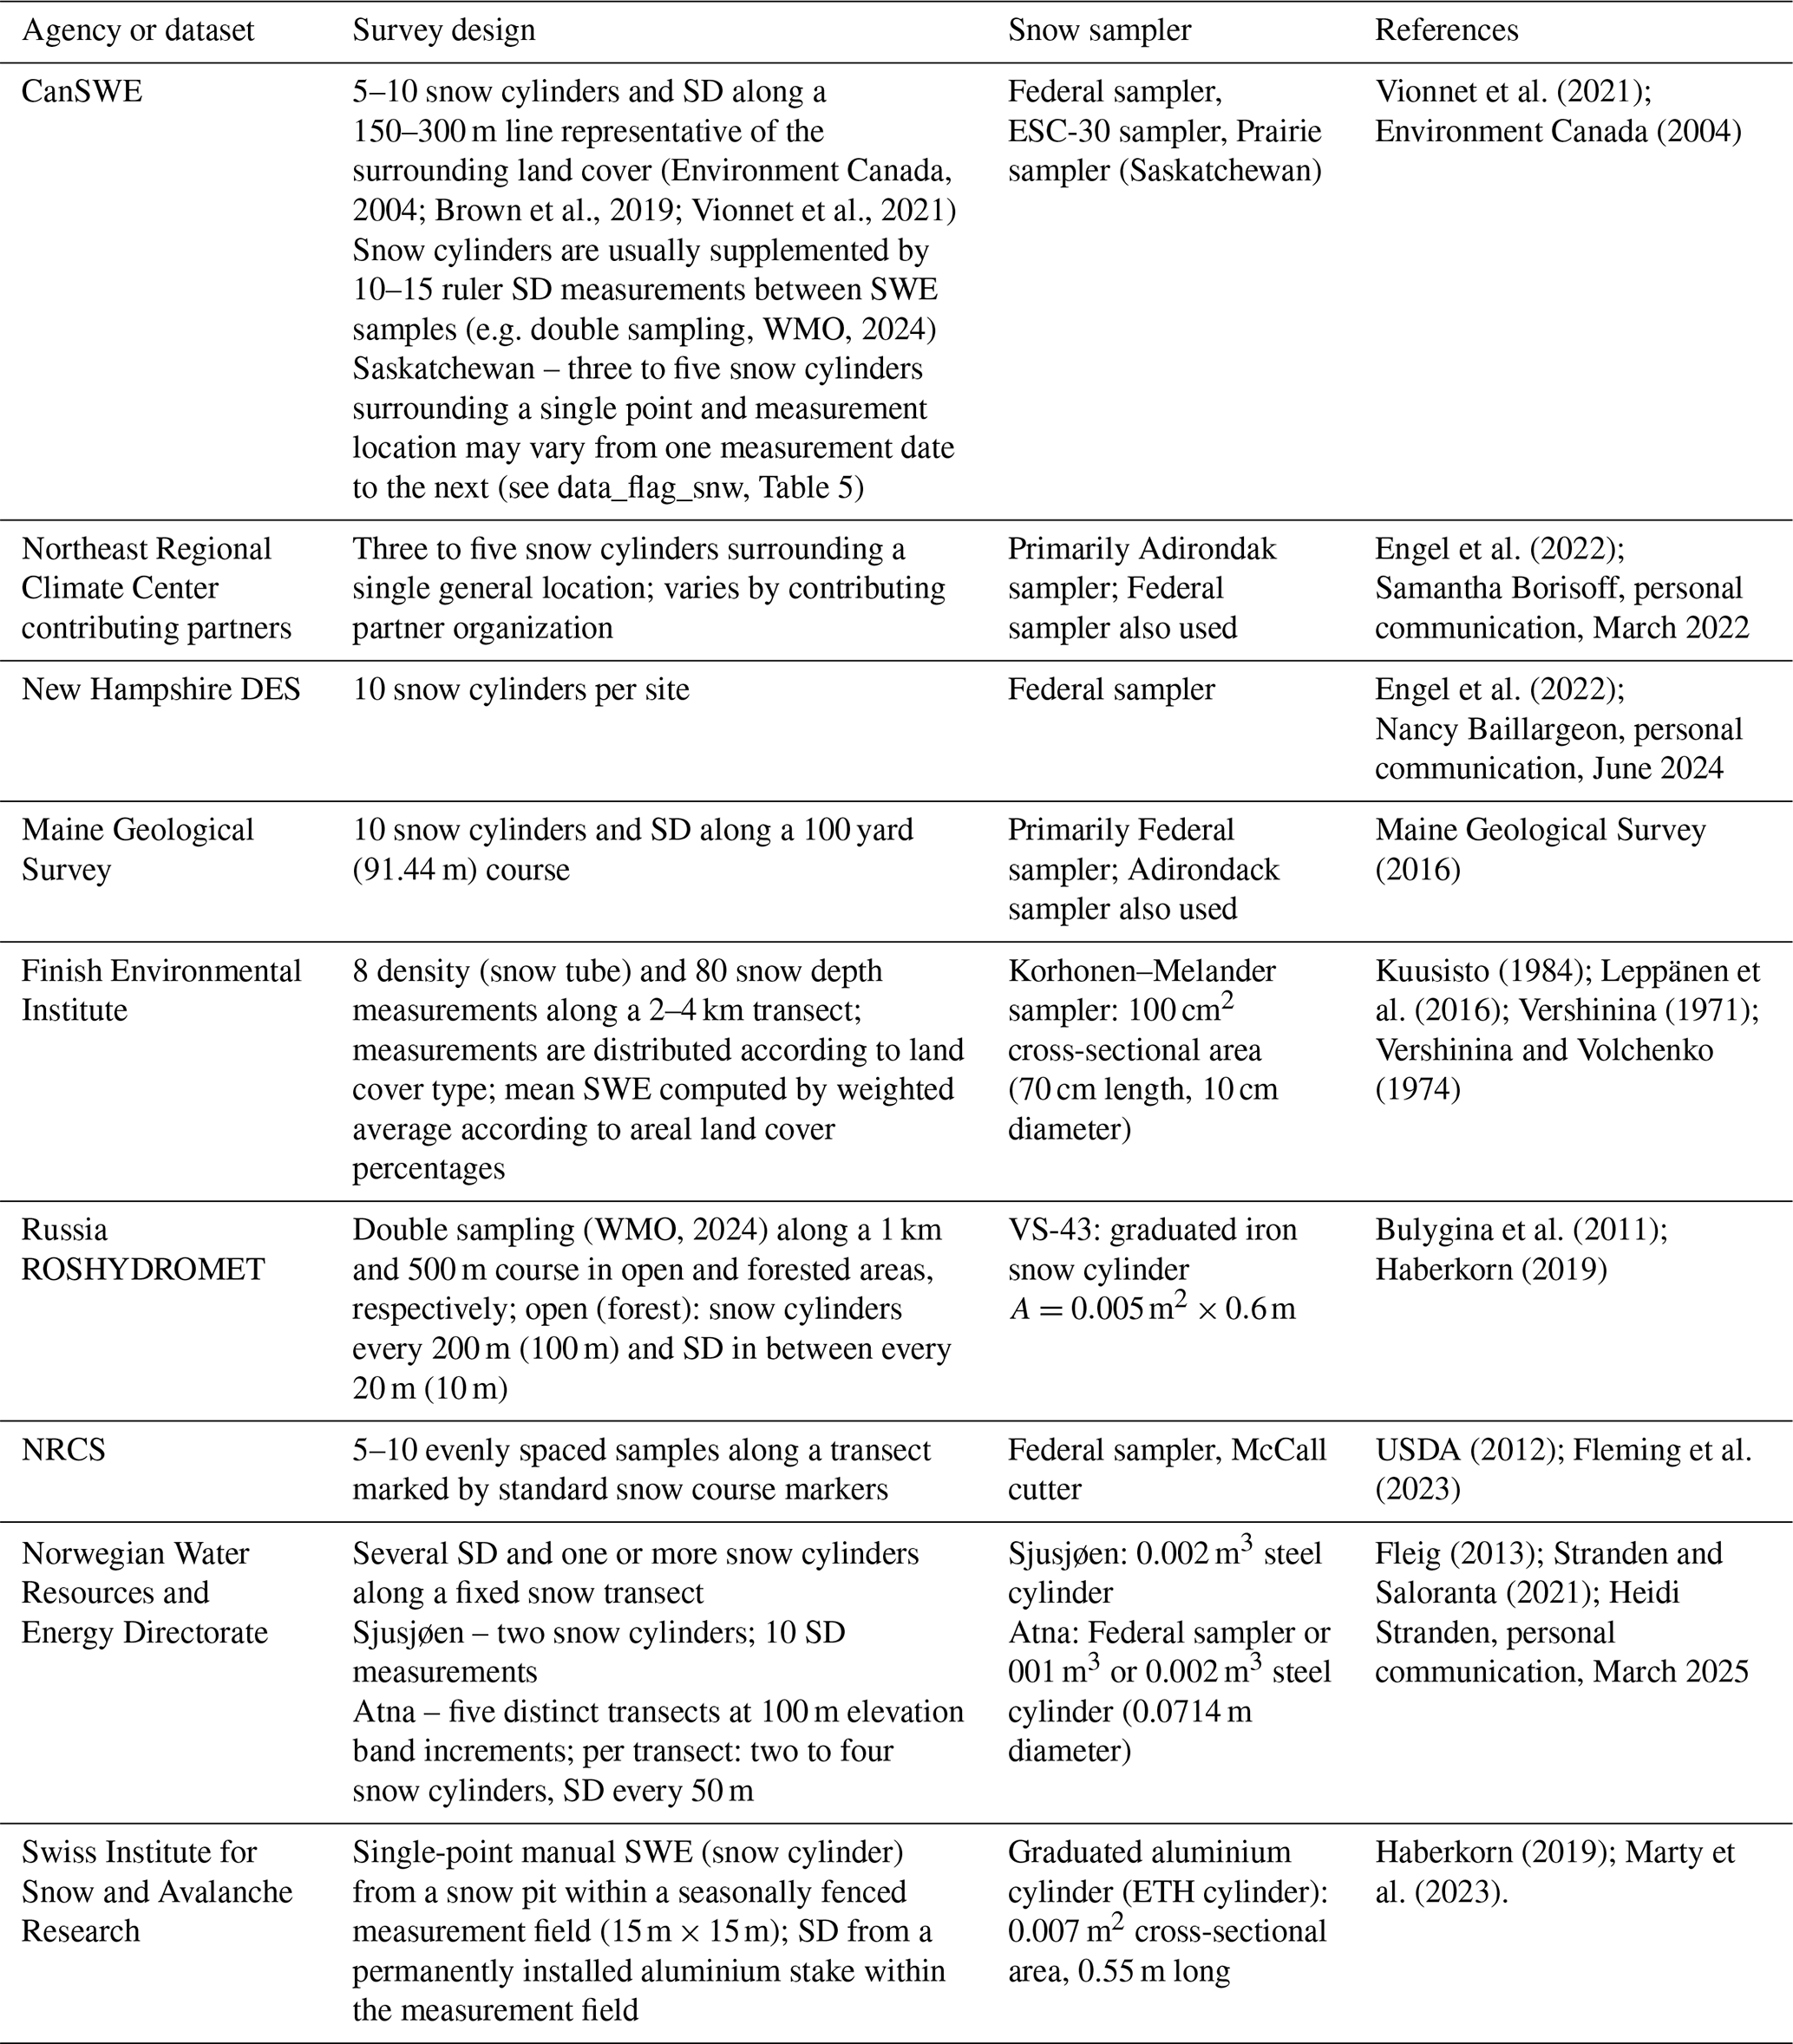
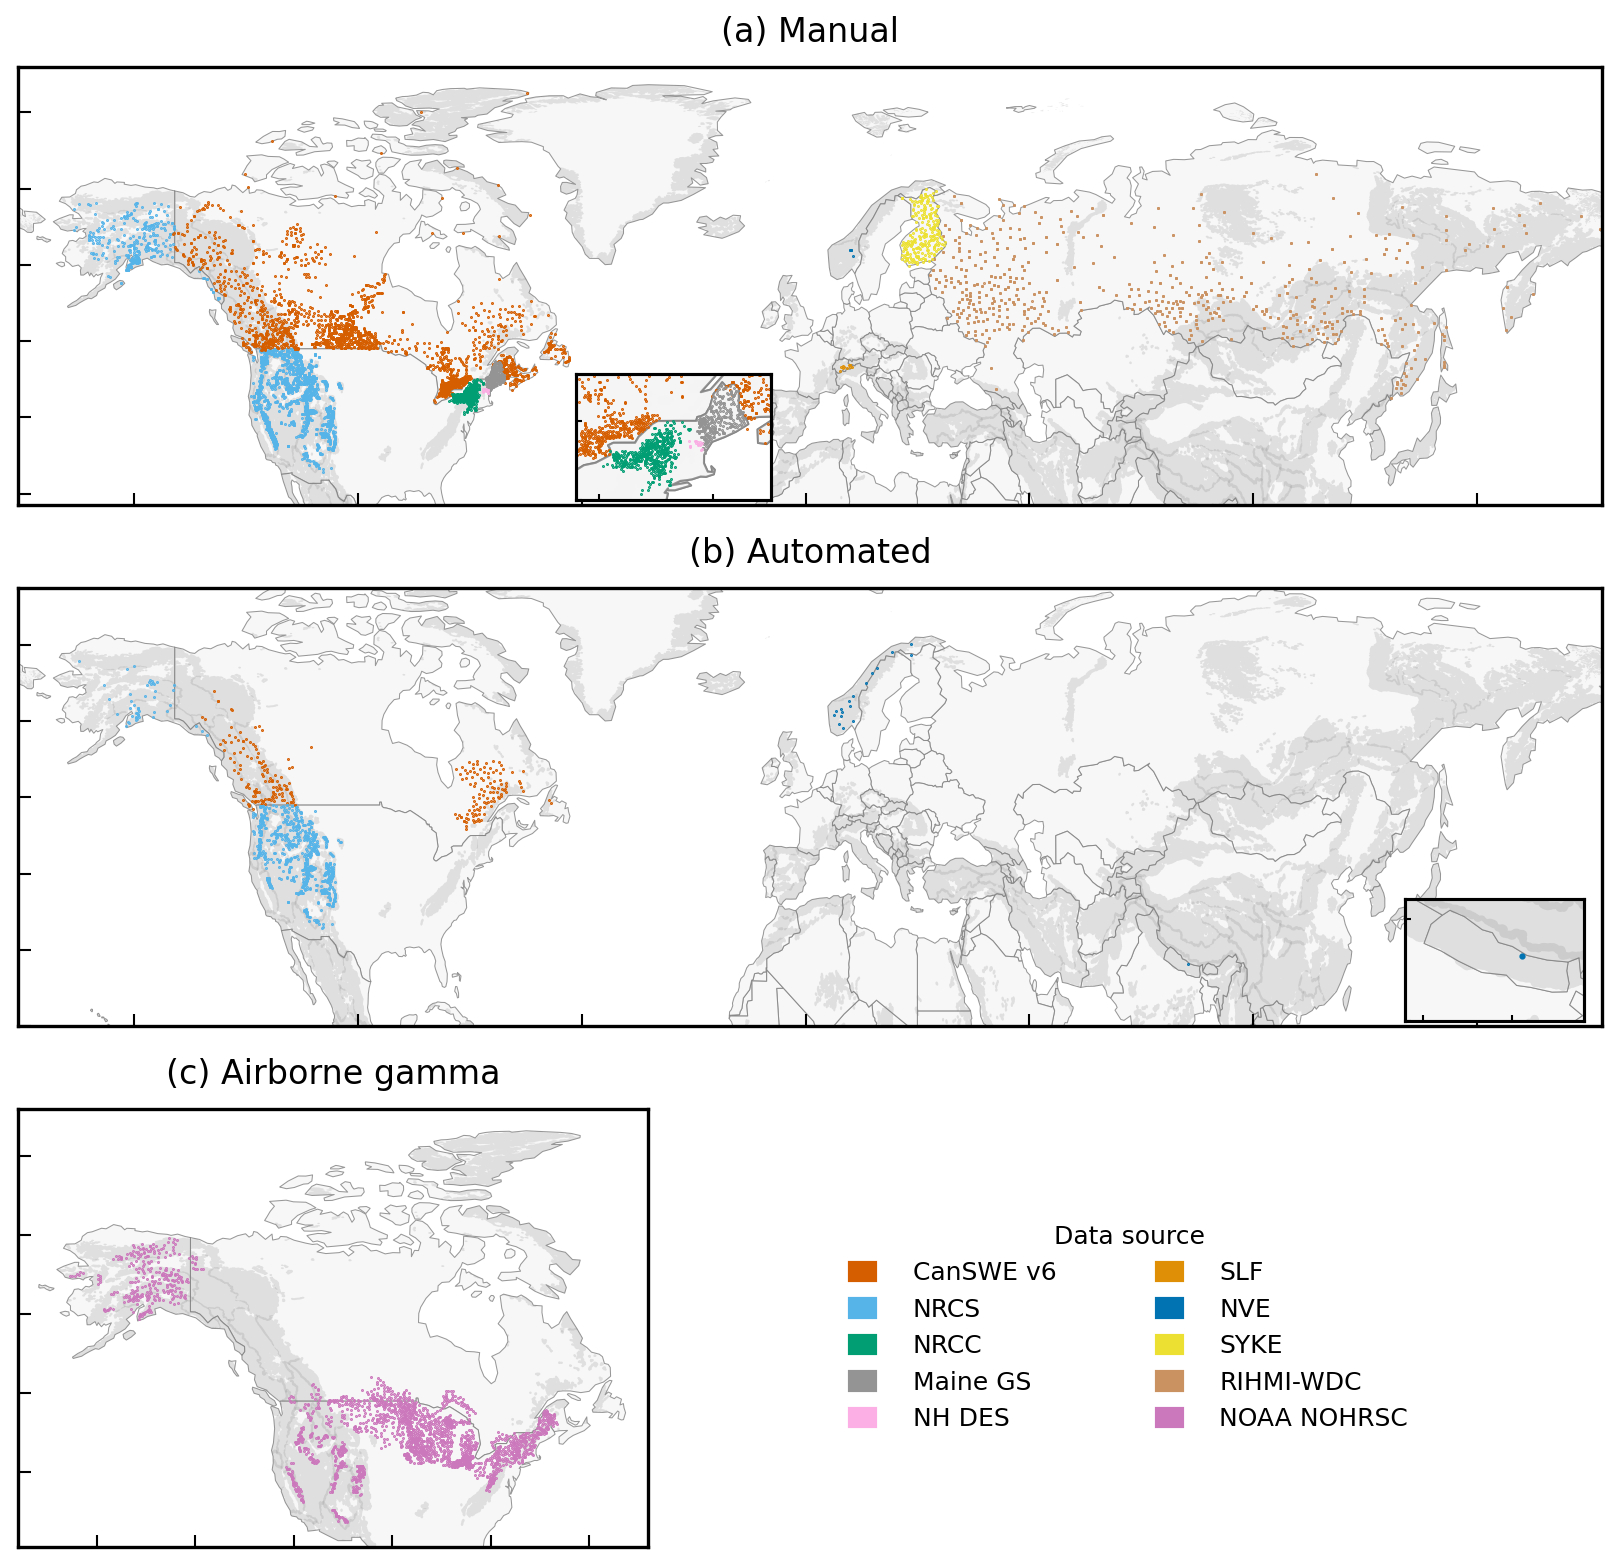
Figure 1Spatial distribution of NorSWE sites by measurement type (manual, automated, airborne) and data source. Grey shading indicates mountain mask as detailed in Sect. 3.
2.1.2 Single-point manual measurements – Switzerland
Switzerland maintains a public database of 11 sites with long-term quality-controlled observations and traceable metadata, referred to as the “GCOS SWE data from 11 stations in Switzerland” (Marty, 2020). SWE is measured in a snow pit within a seasonally marked measurement field (Haberkorn, 2019; Marty et al., 2023). The measurement uncertainty for various snow samplers is as in Sect. 2.1.1. However, in deep mountain snowpacks common to the Swiss Alps, multiple samples are often required to cover the full snow depth, which can increase the error (López-Moreno et al., 2020; Marty et al., 2023). The reported SD is from a permanent stake within the measurement field, but it is not immediately adjacent to the snow pit (Table 4), which can introduce additional uncertainty into the derived bulk density (Marty et al., 2023). The focus of NorSWE is on snow courses and airborne gamma SWE, which are more spatially representative than single-point measurements and data from automated sensors which provide frequent, often daily, observations critical for hydrological modelling and forecasting. The Swiss GCOS data do not meet these criteria but are exceptionally included to help fill a data gap over Europe.
2.2 Automated measurements
The automated SWE observations in NorSWE cover Canada, the United States, Norway, and Nepal. When available, we also include snow depth measurements from co-located snow depth sensors.
2.2.1 Passive gamma radiation sensors
Measurements from automated passive gamma radiation sensors (GMON, Choquette et al., 2013) deployed in central and eastern Canada by Hydro-Québec and the Government of Newfoundland and Labrador were taken directly from CanSWE v6. Manitoba Hydro's passive gamma observations only began in 2022, so they are not included in NorSWE. A passive gamma radiation sensor is also used as the primary instrument at one site in Norway (Breidvatn). GMON sensors relate the attenuation of naturally emitted gamma radiation from the upper layers of the soil to SWE after accounting for the background soil moisture. The measurement footprint is ∼50–100 m2, and the measurement range is 0–600 mm; readings are typically taken every 6 h (distributed hourly). The stated accuracy of common automated passive gamma instruments is ±15 mm up to 300 mm and 15 % from 300 to 600 mm (Campbell Scientific, 2017) but can be as low as 5 % with careful site-specific calibration (see Royer et al., 2021, and references therein). When deployed in the field, measurement uncertainty varies according to environmental factors and soil moisture conditions and may exceed the manufacturer specifications (Stranden et al., 2015; Smith et al., 2017; Royer et al., 2021). The GMON sensors deployed by Hydro-Québec and the Norwegian Water Resources and Energy Directorate (NVE) also have a co-located hourly recording sonic snow depth sensor.
2.2.2 Snow pillows and snow scales
The snow pillow and snow scale data cover western North America, Norway, and Nepal (Fig. 1) and were obtained from CanSWE v6, the US SNOTEL network, and the NVE (Table 1). Snow pillows measure SWE based on the overlying hydrostatic pressure on a bladder filled with anti-freeze (Beaumont, 1965). The measurement footprint and instrument accuracy vary by model but are generally around 6 to 9 m2 and %, respectively (Stranden et al., 2015; USDA, 2012). Snow pillows are prone to errors (both overestimations and underestimations) when the temperature at the ground–snow interface is at the melting point (Johnson and Marks, 2004). The SNOTEL and NVE sites are equipped with a co-located acoustic snow depth sensor, as are roughly half of the Canadian sites. Compiled and quality-controlled snow pillow datasets for western North America that aim to address biases between accumulated precipitation and SWE (Meyer et al., 2012) are available elsewhere (e.g. Yan et al., 2018; Sun et al., 2019; Musselman, 2021). Due to differing QC procedures (see Sect. 4), the snow pillow data in NorSWE may differ slightly from those contained in these other datasets. In many regions, snow pillows are gradually being replaced with the more environmentally friendly snow scales (Stranden et al., 2024). NorSWE does not differentiate between these two instruments because they are not differentiated in the WMO BUFR codes (WMO, 2025; Table 3).
2.3 Airborne gamma SWE
NorSWE includes SWE estimates from the NOHRSC snow survey program (https://www.nohrsc.noaa.gov/snowsurvey/, last access: January 2022; Carroll, 2001). This network consists of approximately 2400 flight lines in 25 US states and 7 Canadian provinces (Carroll, 2001) as shown in Fig. 1. Flight lines are 10–15 km long and 300 m wide. Surveys are conducted once per year near peak SWE, with occasional flights being added to capture hydrologically important conditions. The method, which is limited to mm SWE, relates the attenuation of gamma radiation emitted from the upper ∼20 cm of the soil by the water mass of the snowpack (liquid or solid phase) after accounting for the background soil moisture (Carroll, 2001). Snow-free radiation and soil moisture conditions are obtained from a snow-free flight, usually conducted in the fall. In the absence of a fall flight, a subjective estimate (SE), a default value (DV, typically 35 %), or another ground-based measurement (GM or GI) of soil moisture content is used. Error simulations and comparisons with coincident ground-based observations have reported accuracies of 4 % to 10 % in prairie and agricultural environments (Carroll et al., 1983) and up to ∼12 % in forested areas (Carroll and Vose, 1984; Vogel et al., 1985; Carroll and Carroll, 1989a), although some studies have reported larger errors (Glynn et al., 1988; Fig. 9 in Cho et al., 2020a). A comprehensive accuracy assessment of NOHRSC airborne gamma SWE showed strong correlation with the University of Arizona SWE product across all land covers and forest fractions (Cho et al., 2020b). Underestimation often occurs when there is significant SWE variability along a flight line (Cork and Loijens, 1980; Carroll and Carroll, 1989b). Inaccurate characterization of the soil moisture, often due to changes in the soil moisture after the fall reference flight, is a common source of error (Carroll and Carroll, 1989b; Cho et al., 2020a). Other known sources of error include biomass, rock outcrops, navigation, and gamma count statistics (Glynn et al., 1988; Cork and Loijens, 1980; Carroll and Carroll, 1989b). The airborne gamma SWE data do not include coincident observations of snow depth.
Data from each source listed in Table 1 were obtained either through direct download or through email exchange. Data processing followed the steps shown in Fig. 2. Data cleaning involved removing duplicate stations and observations, correcting obvious errors in measurement dates, removing records flagged as erroneous, adding a mountain classification, and finally converting to a standard NetCDF format. Sites intersecting with either a 2° slope mask derived from the GETASSE30 DEM or the Global Mountain Biodiversity Assessment (GMBA) Mountain Inventory v2 (Snethlage et al., 2022a, b; https://www.earthenv.org/mountains, last access: June 2023) with a 25 km buffer were flagged as mountain. This broad mountain classification, which is used during quality control (Sect. 4), is consistent with that applied in Mortimer et al. (2024) and Mudryk et al. (2025). Data harmonization involved converting imperial units to metric units, harmonizing agency-specific quality flags, applying a consistent quality control, checking for duplicate sites between agencies, and finally merging the datasets into a single NetCDF file.
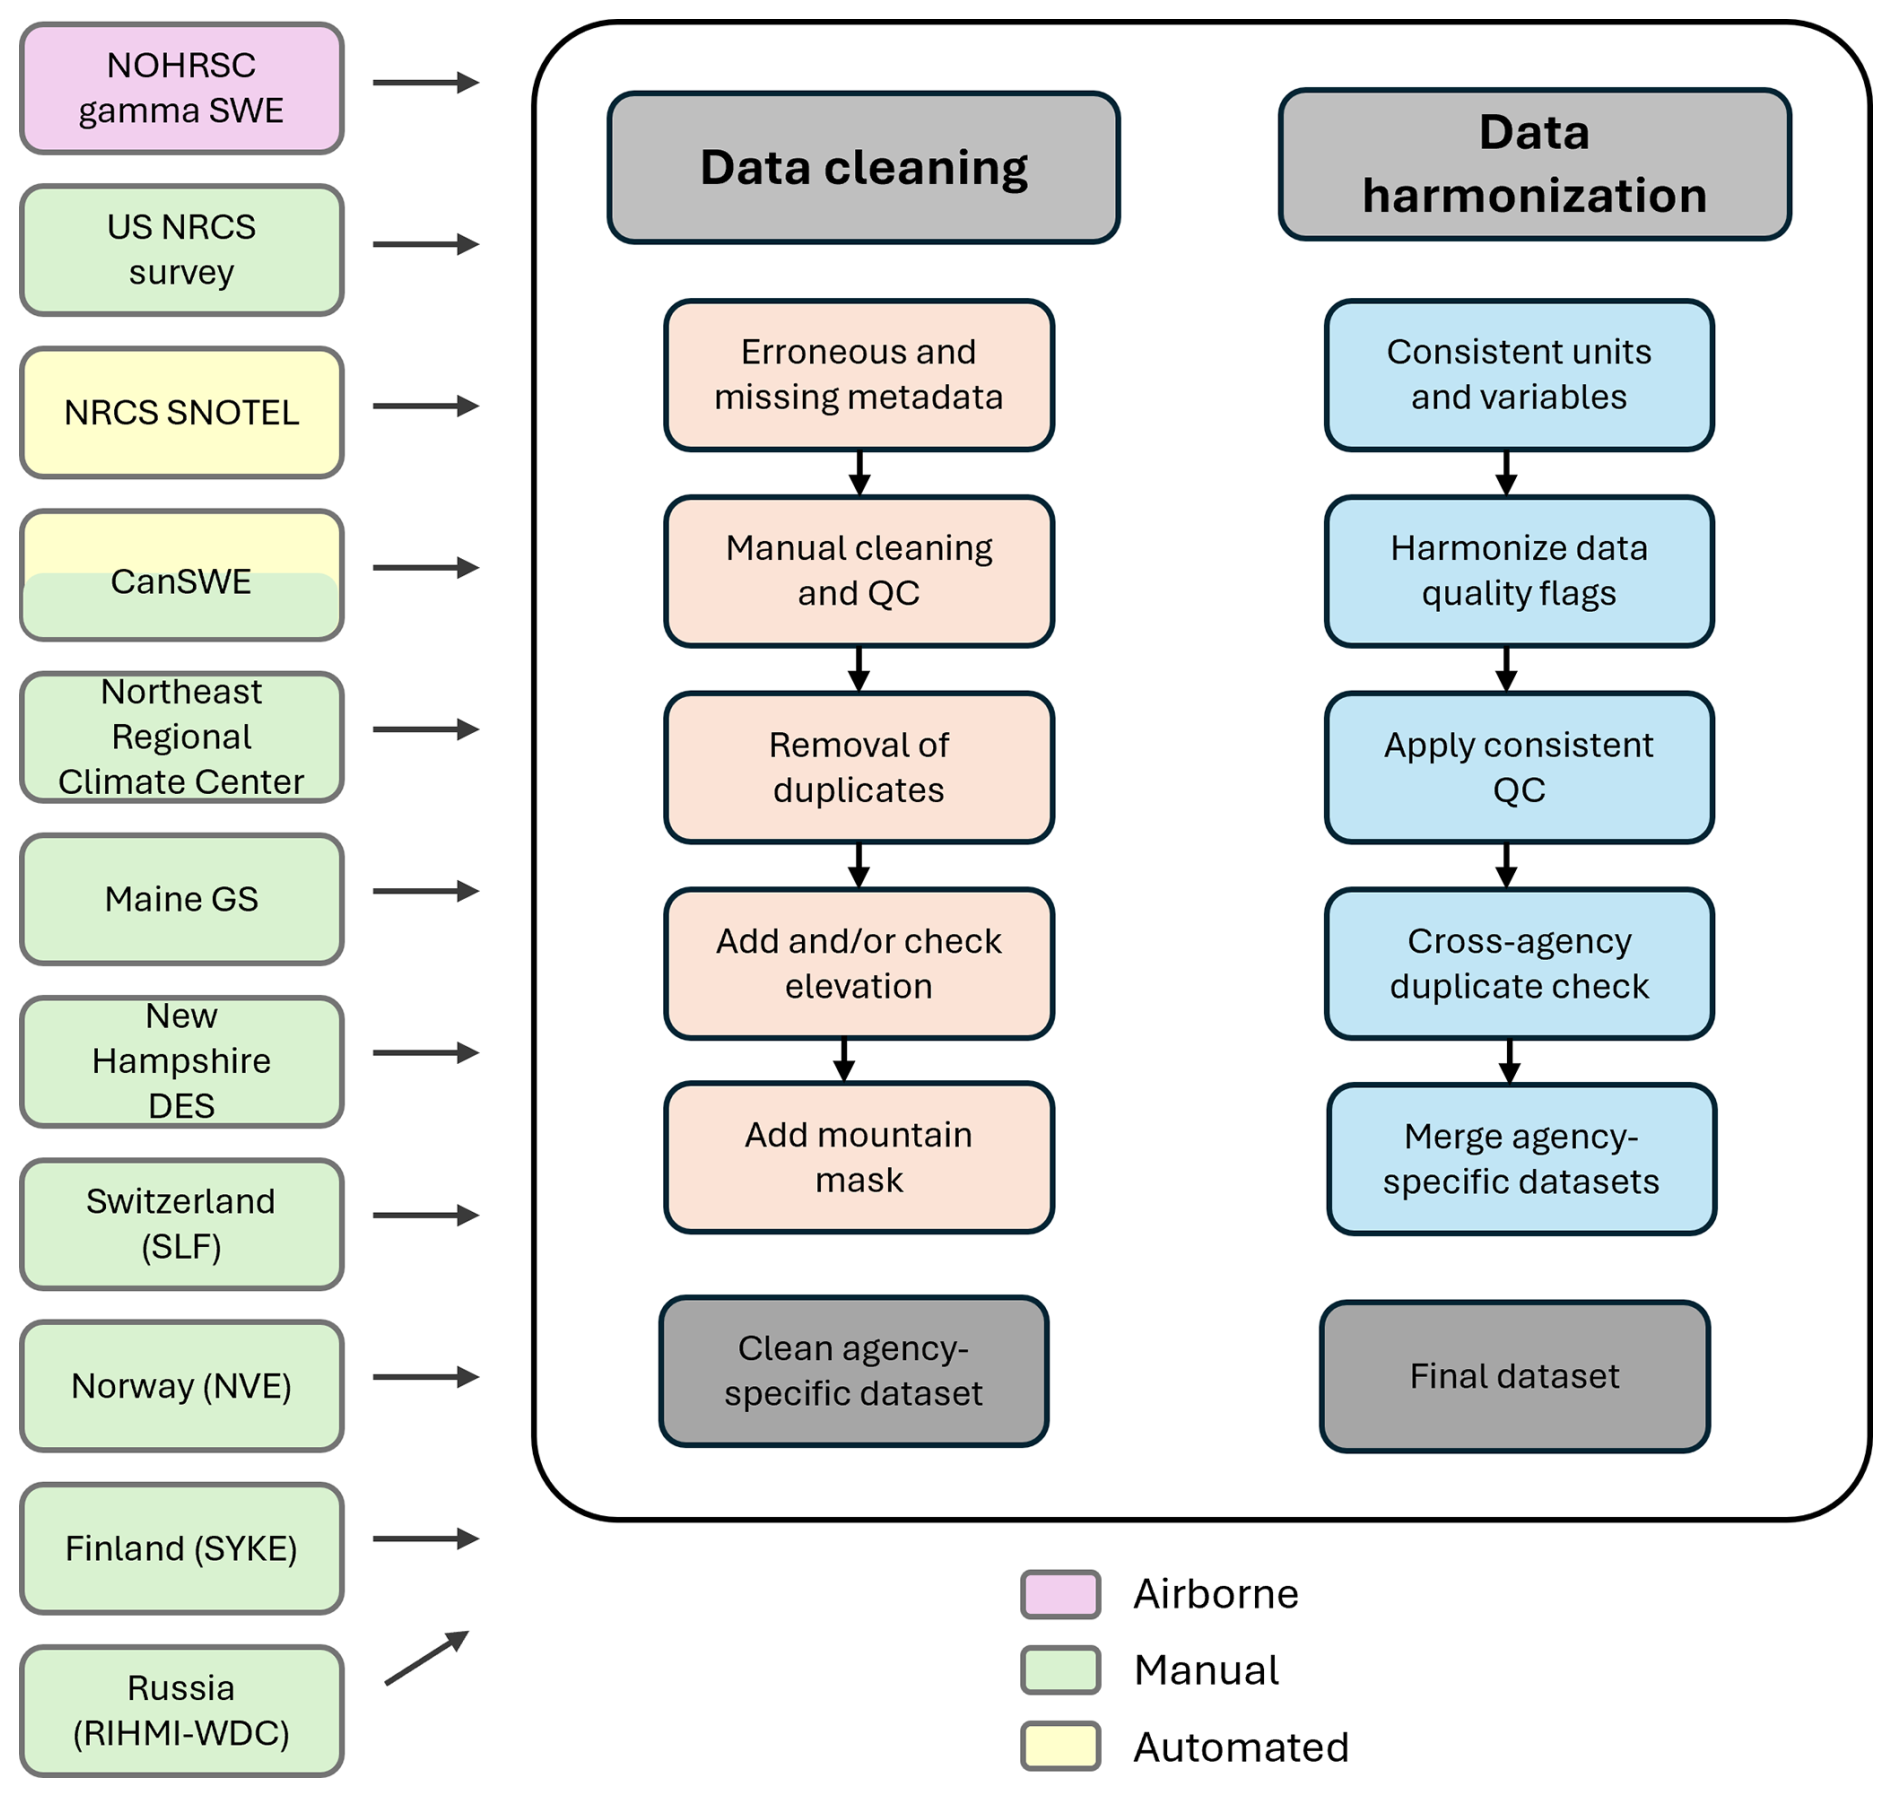
Figure 2Schematic of data processing steps. See Tables 1 and 2 for information on the contributing datasets, listed on the left-hand side.
Data for the agencies listed in Table 1 were cleaned and reformatted to a modified version of the CanSWE NetCDF (Table 2). Station metadata include a unique station ID; a station name; coordinates consisting of a single latitude, longitude, and elevation; the data source; the measurement method; and a mountain flag (Table 2). Station IDs were constructed by prepending the source abbreviation listed in Table 1 to the original station ID, except for Russia (see Sect. 3.2 and Table 6). Where elevations were not provided for a given site or network (e.g. Russia and Finland), they were obtained from the USGS National Elevation Dataset (Gesch et al., 2002). The primary snow variable of interest is SWE. SD and derived bulk snow density, calculated from SD and SWE, are provided when available. Each site, identified by a unique station ID, is permitted only one set of snow observations (snw, snd, and den) per day; duplicate observations were removed during data processing (Sect. 5). The minimum time resolution in NorSWE is daily.
NorSWE includes two types of flags describing the data quality: agency quality flags and QC flags. QC flags indicate where an observation did not pass our internal quality control (See Sect. 4) and was set to NaN. Agency quality flags (Table 5) incorporate information from the data provider. These can be flags assigned by the agency to indicate certain snow conditions – for example, patchy or trace amounts of snow – or to flag observations that were modified or removed during an agency's QC procedures – for example revised data (“R”). Some agencies include one or more comments along with each observation instead of data flags. We coded these comments into flag values using keywords and phrases. For example, records with the comments “skiff” or “patchy” were assigned a “T” flag. An exception to the use of the agency quality flag variable is the airborne gamma SWE data, which did not have corresponding agency quality information. Instead, we use this variable to store information about the soil moisture estimation method (Sect. 3.6).
Table 5Data flags in NorSWE. Not all data flags are used by all data sources.
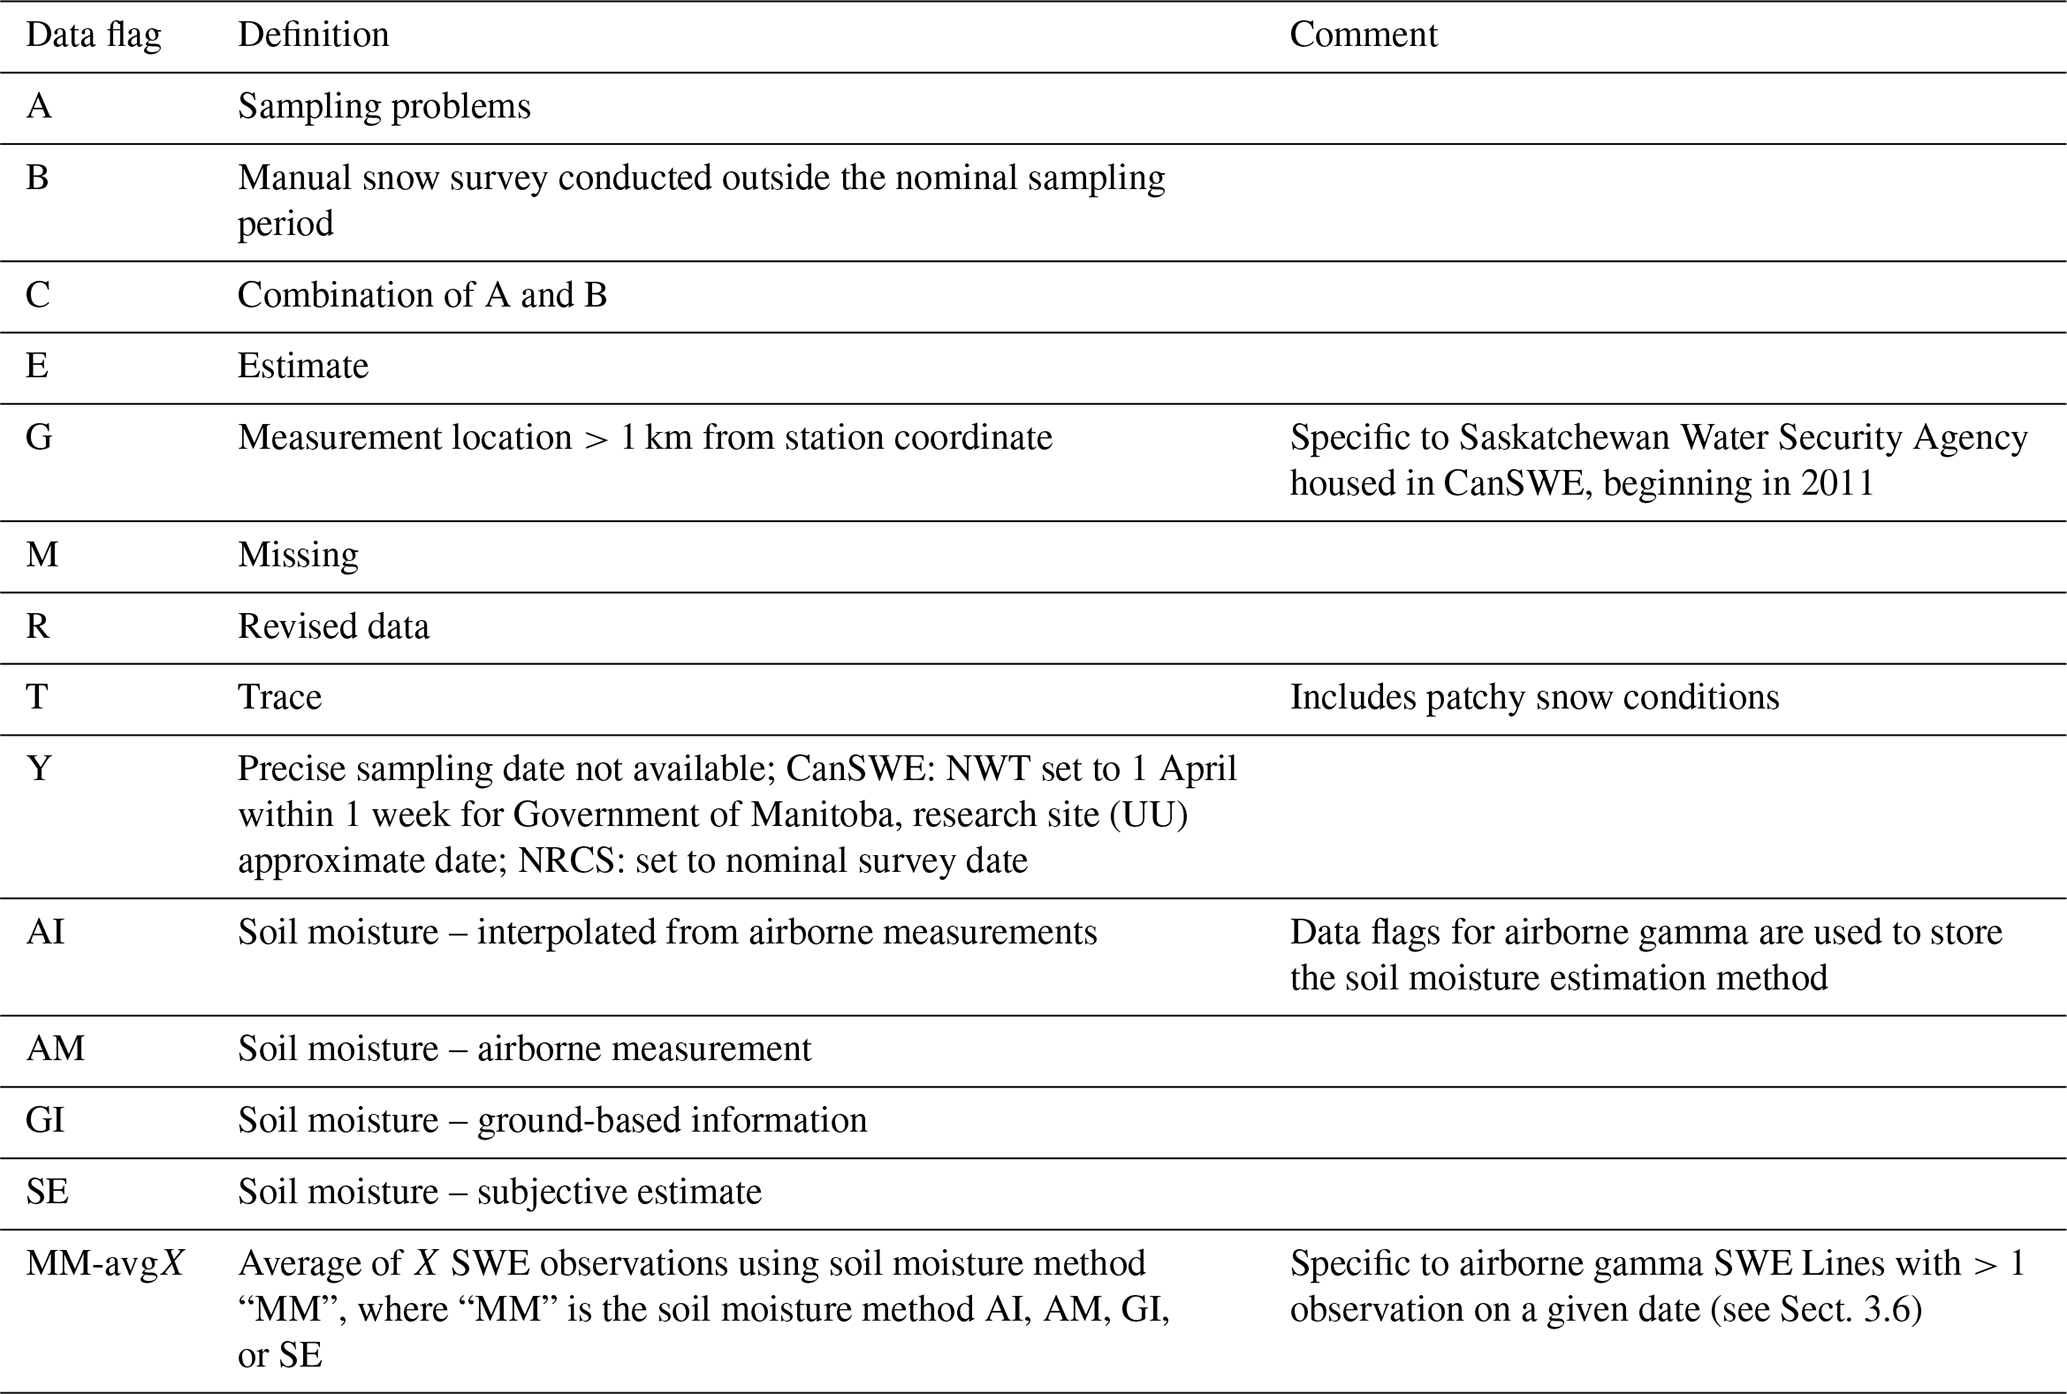
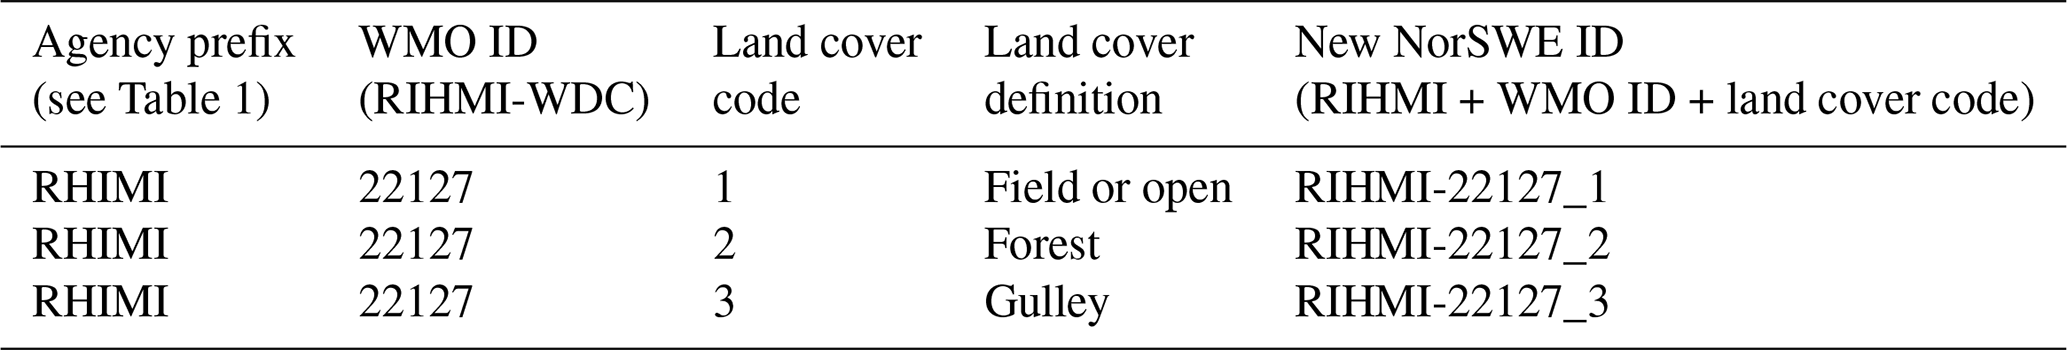
Table 6Station ID construction for RIHMI-WDC (Russia) for example site no. 22127 (Lovozero). Not all sites have snow courses for all three land cover types. Station coordinates are the same for each snow course, although transects and sampling frequencies differ (Sect. 3.2).
Agency-specific processing steps are described below, except for Finland (SYKE) and Switzerland (SLF), which did not require additional processing beyond the general steps outlined above.
3.1 Canada (CanSWE)
The CanSWE v6 dataset is included “as is”, except for the fact that we removed the secondary and tertiary station names and IDs to simplify the dataset and added a mountain variable (see Sect. 4). Further, we prepended CanSWE to the original station ID and CanSWEv6 to the original source variable. In CanSWE, only one automated observation per day corresponding to 18:00 UTC is included. In NorSWE, the 18:00 UTC timestamp was dropped to conform to the minimum daily time resolution (Sect. 3). As described in Vionnet et al. (2021), when only hourly data are available (British Columbia Ministry of Environment and Hydro-Québec), we apply a 24 h median filter (Stone, 1995) and then extract the record corresponding to 18:00 UTC.
3.2 Russia (RIHMI-WDC)
RIHMI-WDC assigns the same WMO ID to up to three distinct snow courses covering different land covers (field or open – 1, forest – 2, and 3 gulley – 3; Bulygina et al., 2011). These distinct snow courses have different sampling frequencies depending on the land cover. Prior to the spring melt period, sampling of field or open sites is conducted every 10 d when at least half of the visible area is snow covered. Forest sites are sampled once per month prior to 20 January and every 10 d thereafter (Table 4, Bulygina et al., 2011). Measurement frequency is every 5 d during spring snowmelt regardless of land cover type. Land cover type is provided by RIHMI-WDC as a separate variable which is not included in the NorSWE NetCDF format (Table 2). To maintain these distinct snow courses while conforming to our NetCDF format, we generated new station IDs by appending the land cover flag to the WMO ID as demonstrated in Table 6.
3.3 Northeastern US (Maine GS, NH-DES, NRCC)
Data covering the northeastern US were obtained from three sources: the Maine Geological Survey (Maine GS), the New Hampshire Department of Environmental Services (NH-DES), and the Northeast Regional Climate Centre (NRCC). Each required substantive manual cleaning to remove duplicate records and inaccurate dates and to correct errors in the metadata. Sites with missing coordinates were dropped, as were records flagged as erroneous by the providing agency. For Maine specifically, records with a confidence level marked as “questionable” (n=302) or “dummy site” (n=852) were removed, as were those with the error codes of “inconsistent or duplicate data within 1, 2, or 3 d” (n=156). To avoid creating duplicate records, we removed all sites from Maine GS with source or station IDs containing Quebec, New Brunswick, or variations thereof (n=1392). Quality flags accompanying the original data were retained and harmonized as in Table 5.
3.4 Western US and Alaska (NRCS)
Snow survey data from the US Natural Resources Conservation Service were obtained directly using the GitHub repository https://github.com/CH-Earth/snowcourse (last access: April 2024). NRCS data compile observations from state-level data collection offices across the western US and Alaska. Some states, such as California (https://cdec.water.ca.gov/snow.html, last access: March 2025), also provide these observations through their own data portals. To ensure broad consistency across the region and to avoid introducing duplicate records, we chose to draw only from the NRCS database. Records missing exact dates were assigned the date of the nominal survey period, and a “Y” quality flag was assigned (Table 5). In some remote areas of the western US that are challenging to access, the NRCS uses aerial markers instead of snow courses. The marker consists of a large vertical mast (typically a pipe) with horizontal cross bars that can be seen from a survey aircraft. SD is observed during flyover, and SWE is calculated using an estimated snow density. As these are not direct observations of SWE, we exclude them from NorSWE. Aerial markers were identified as sites with IDs ending in AM or containing AERIAL. This approach, which removed 127 sites, does not account for changes in measurement method over time – sites classified as being aerial markers may include some snow course observations and vice versa. Automated data from the SNOTEL network were obtained using https://ncss-tech.github.io/AQP/soilDB/fetchSCAN-demo.html (last access: April 2024) (Beaudette et al., 2024). Daily SD and SWE were downloaded separately and merged by station ID.
3.5 Norway (NVE)
Daily snow observations and metadata for active automated stations managed by the Norwegian Water Resources and Energy Directorate, including one located in Nepal, were obtained using the NVE hydrological application programming interface (API) (https://hydapi.nve.no, last access: April 2025). Discontinued sites were excluded because these sites were usually abandoned due to measurement issues (Stranden et al., 2015). The SWE and SD observations are daily averages timestamped to 11:00 UTC. The 11:00 UTC timestamp was dropped to conform with the minimum time resolution of NorSWE (Sect. 3). NVE correction flags were assigned an R flag (revised data, Table 5), except for data marked as interpolated, which were dropped. We include all data regardless of NVE quality flag (unknown, primary controlled, secondary controlled) but use the daily data rather than hourly data because they undergo a higher level of quality control. Manual snow survey data were obtained for two locations – Atna and Sjusjøen. The Atna location has five separate transects at 100 m elevation bands between 800 and 1200 m a.s.l. Each transect has a unique station ID and coordinates. The manual data did not have accompanying quality information or station elevations. For Atna, we use the elevation of the corresponding elevation band; the Sjusjøen elevation was taken from USGS National Elevation Dataset (Gesch et al., 2002) (Sect. 3).
3.6 US and southern Canada airborne gamma SWE (NOHRSC)
Metadata for the airborne gamma SWE flight lines were derived from the GIS shapefile “NOHRSC Flight Lines.shp” (obtained from https://www.nohrsc.noaa.gov/gisdatasets, last access: January 2022) as detailed in Table 7. The flight line NAME became the station ID, and station names were constructed from the NAME and River Basin variables. For coordinates, we used the flight line midpoint provided in the file. We calculated missing midpoint coordinates from the flight line endpoints. NOHRSC assigns SWE estimates at or above the method's detection limit of 1000 mm a value of 999.0 mm. We excluded these records (n=32) from our dataset. Finally, we include information about the soil moisture measurement method in the data_flag_snw variable. Typically, NOHRSC provides two separate SWE estimates: one based on the measured or estimated soil moisture conditions and one using a soil moisture value of 35 % (Carroll, 2001). We only included SWE calculated using either a measured or an estimated soil moisture. In some cases, multiple SWE values are provided for the same date as updated or new soil moisture conditions become available. When this was the case, we averaged these multiple measurements because the last upload or modification date was not consistently available. These averaged records make up <1 % of the airborne gamma SWE records and are identified by “-avgX” appended to the soil moisture estimation code, where X is the number of records averaged, which ranged from two to three. There were no instances of different measurement methods being averaged together.
Table 7Derivation of variables in NorSWE from the NOHRSC Flight Lines shapefile (https://www.nohrsc.noaa.gov/gisdatasets/, last access: January 2022). The first two letters of the station ID refer to the state or region.
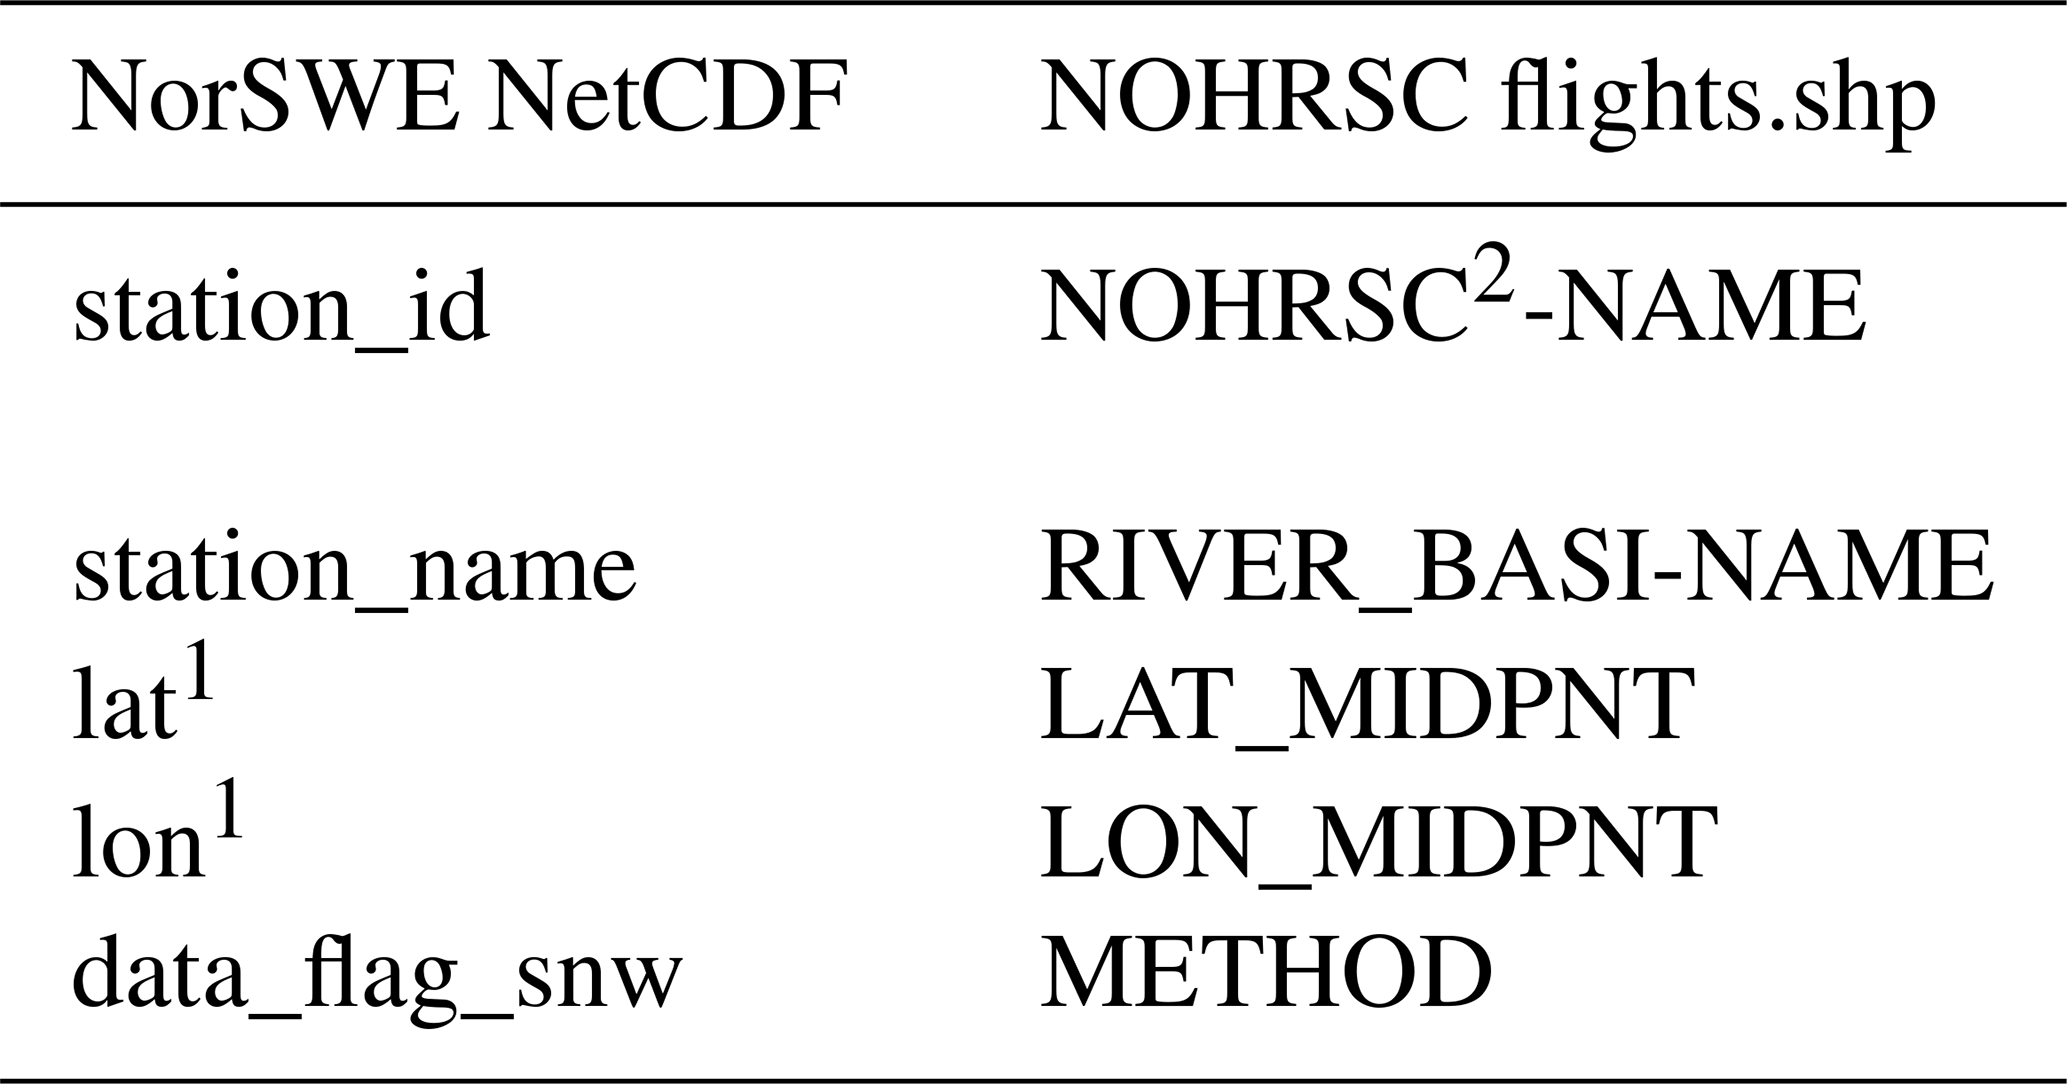
1 If LAT_MID and LON_MID were missing, latitude and longitude were calculated from the flight line endpoints. 2 NOHRSC prepended to “NAME”.
The level of prior quality control of the included datasets differs by agency. Some agencies apply their own quality checks prior to data distribution (e.g. SNOTEL, Fleming et al., 2023), while others share their data as is. Even when quality control is applied by the collecting agency, the methodology is rarely published, often relies on expert judgement, and may not have been applied consistently throughout the time series. This limits our ability to standardize existing QC approaches across constituent datasets and necessitates the application of our own procedure for the merged dataset. To ensure reproducibility of the quality control, we chose not to implement procedures that rely on ancillary data such as precipitation and temperature (e.g. Johnson and Marks, 2004; Yan et al., 2018; Brown et al., 2021) and instead apply only self-contained methods. Ancillary data are not always consistently available and can be subject to version changes and updates. We encourage users to conduct additional QC using locally available ancillary data when possible. Measurement uncertainty differs according to sensor type, measurement equipment, and operational protocols (Sect. 2; López-Moreno et al., 2020; Royer et al., 2021; Beaudoin-Galaise and Jutras, 2022, and references therein); these differences are not addressed in our QC procedure.
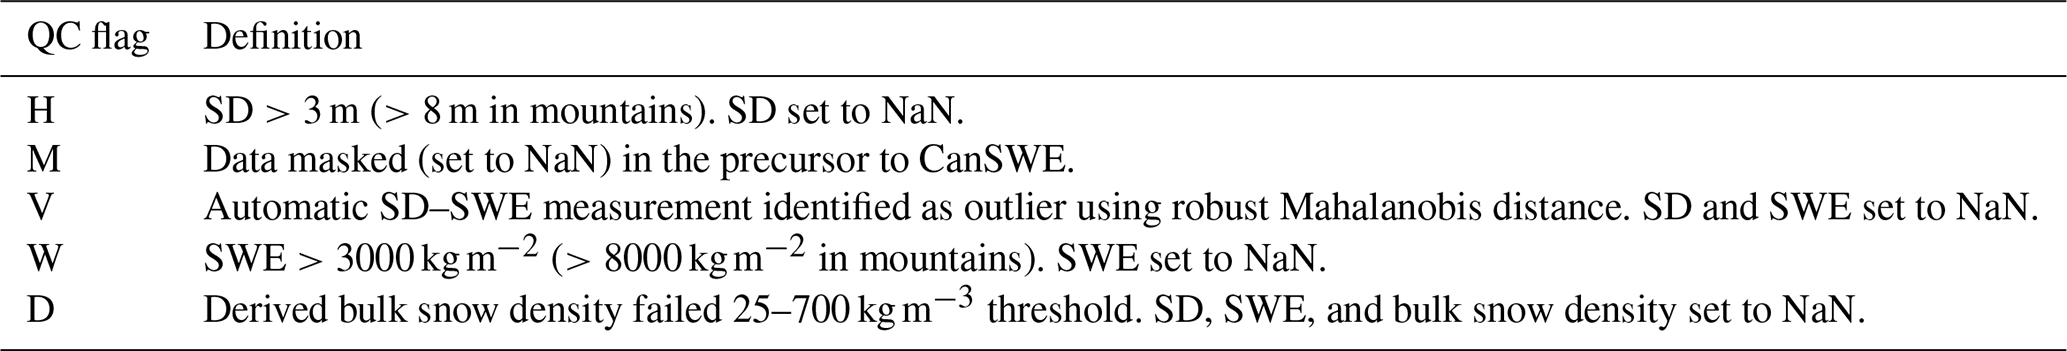
Data from each source were subjected to the quality control described in Vionnet et al. (2021), which itself was adopted from Braaten (1998). The QC consists of range thresholding and, for automated sites, an automated outlier detection. Table 8 outlines the quality control flags used in NorSWE. The infrequency of snow course and airborne gamma observations renders QC methods that require near-continuous time series, such as spike checks and automated outlier detection, useless; thus, only range thresholding is applied to these records. Ranges for SD, SWE, and bulk density are 0–3 m (0–8 m for mountain sites), 0–3000 kg m−2 (0–8000 kg m−2 for mountain sites), and 25–700 kg m−3. This approach differs slightly from that of CanSWE, which applies the higher thresholds to sites west of 113° W. This change had no impact on the CanSWE data; thus, metadata aside (see Sect. 3.1), the CanSWE records contained in NorSWE are the same as in the original (CanSWE v6). Observations outside of these ranges were set to NaN, and a QC flag was assigned according to Table 8. Thresholds were applied to SD and SWE separately. For example, if a record fell outside the SD range but inside the SWE range then only the SD record was set to null, and qc_flag_snd was assigned the flag “H”. If a record failed the snow density test, both SWE and SD were set to null, and a “D” flag was assigned to both qc_flag_snd and qc_flag_snw.
Table 8Quality control flags in NorSWE. NaN stands for not a number.
The automated data were subject to an additional QC step following Hill et al. (2019) (as described in Vionnet et al., 2021). Spurious SD–SWE pairs were identified via the robust-sample Mahalanobis distance (Leys et al., 2018), which is the distance of a point from the mean of a multivariate distribution based on the minimum covariance determinant. Further details are provided in Leys et al. (2018), Hill et al. (2019), Vionnet et al. (2021), and references therein. The test requires a multivariate dataset and so is only applicable to automated sites with both SD and SWE. We required sites to have at least 20 records (SD–SWE pairs) to run this test. Outliers, defined as the upper 0.001 quantile of a Chi-squared distribution with p degrees of freedom, were set to null, and a QC flag of “V” was assigned to both qc_flag_snd and qc_flag_snw. This method is reasonable when it comes to removing extreme outliers, but it has a tendency to also remove valid data during the snow onset and snowmelt periods.
The cleaned and quality-controlled NetCDF files from each contributing agency were merged into a single file after removing duplicate sites and observations between networks (Fig. 2, right-hand column). Duplication of records often occurs when a watershed spans multiple jurisdictions (for example, southern Canada and the northern USA) and when data are shared between agencies who each assign their own station IDs.
Duplicate sites were defined as those with similar locations, snow observations, station names, or IDs as follows. First, we identified all sites from neighbouring agencies with matching station names and inspected those matched sites that were within 5 km of each other. If the paired sites had matching coordinates and snow records (within rounding precision), we retained the site from the agency whose jurisdiction it intersected with. The duplicated site, along with its complete snow record, was dropped. For example, if a site in New Hampshire was found in both the NH-DES and Maine GS databases, we kept the record from NH-DES and dropped the site and its complete observation record from the Maine GS database. Next, from the remaining sites, we identified all sites (same measurement type) within 2 km of any site from a neighbouring agency (e.g. all snow course sites in CanSWE within 2 km of an NRCS snow course site). The records and station metadata from the matched sites were manually inspected (compared coordinates, elevations, names, IDs, and snow observations), and duplicate sites were dropped. This step removed 63 sites: 56 from CanSWE and 7 from Maine GS (Table S1 in the Supplement).
The CanSWE v6 dataset, with duplicate sites removed and with modified metadata (Sect. 3.1), was used as the base dataset. The cleaned datasets from the other 10 agencies listed in Table 1 were added to this base dataset, and the time period was restricted to 1979–2021.
The final dataset contains 11 593 790 valid SWE observations (11 762 366 when including flagged values set to NaN) from 10 153 different sites. There are 947 962 SWE observations from 6672 snow course sites across North America, Norway, Finland, and Russia and an additional 4000 observations from 11 single-point snow pit sites in Switzerland. Together, 2357 airborne gamma flight lines provide 30 889 SWE observations over the US and southern Canada. Automated sites account for only 11 % of the sites in NorSWE, but, owing to their higher sampling frequency, these account for 92 % of the SWE observations. The 1113 automated sites are largely restricted to North America, with 17 in Norway and 1 in Nepal. By (automated) type, there are 10 700 949 snow pillow observations from 1001 sites across western North America, Norway, and Nepal and 134 216 GMON observations from 113 sites in Quebec as well as Newfoundland and Labrador, Canada, and Norway.
Spatially, sites are well distributed across Russia, northern tundra regions excepted, and inland Norway, and there is dense coverage over Finland (Fig. 1). In North America, sites are concentrated around populated regions and in the Mountain West but are sparse in the north. This is reflected in the distribution of sites according to the global seasonal-snow classification (Fig. 3, Sturm and Liston, 2021), where there is an overrepresentation of montane forest, which covers most of the southern populated areas (Fig. 3b), and an underrepresentation of the tundra and boreal forest snow classes, whether analysed for North America (Canada and US only; see Fig. S1 in the Supplement) or for the complete Northern Hemisphere (Fig. 3). Over half of the sites in North America intersect with our mountain mask (Sect. 3) compared to 15 % of Eurasian sites, although all but two Norway sites intersect with the mountain mask.
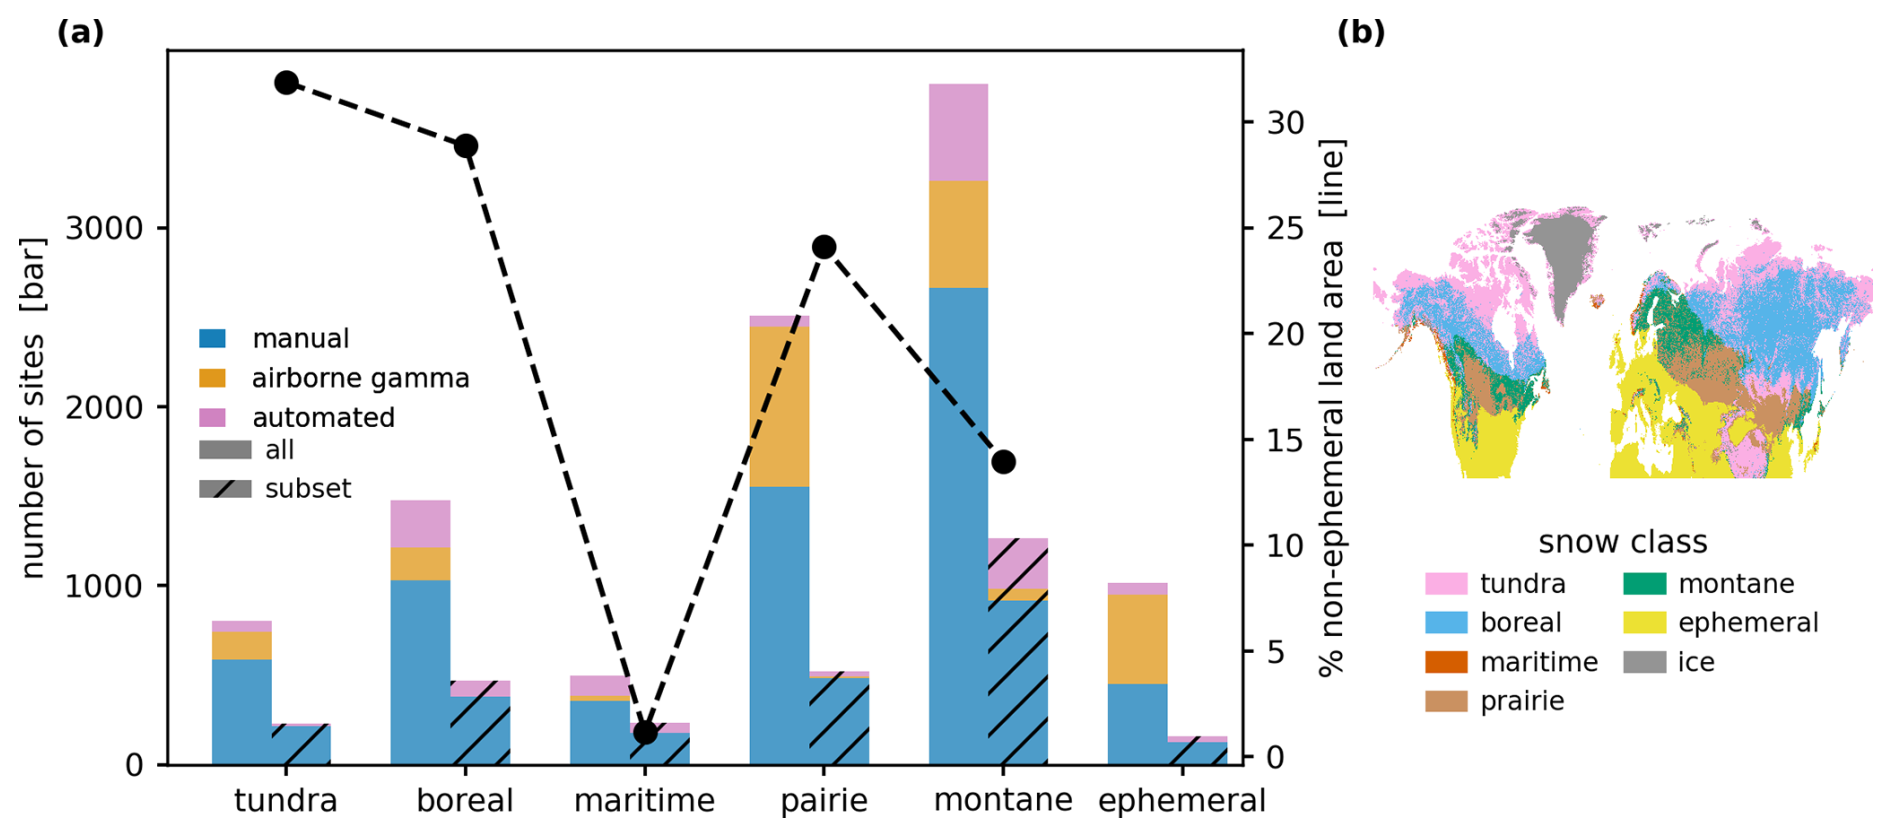
Figure 3(a) NorSWE site distribution by snow class (Sturm and Liston, 2021) for the complete dataset (solid bars) and for a temporally consistent subset (hatched bars) versus the proportional land area by snow class (dashed black line). The temporally consistent subset consists of sites with at least one measurement in each pentad starting in 1980 and with measurements in at least 30 different years between 1979 and 2021 (Fig. 5). The ephemeral snow class is excluded from the land area calculations because it does not differentiate between no snow and ephemeral. Permanent land ice is also excluded. (b) Map showing the geographical extent of Sturm and Liston (2021) snow classes. Montane: montane forest. Boreal: boreal forest.
The number of manual observations in NorSWE has decreased over its time span, while the number of automated measurements has increased (Fig. 4). While automated instruments provide an alternative to the labour-intensive manual snow courses, which can be challenging and costly to conduct in remote locations (Pomeroy and Gray, 1995), the shift away from manual observations can be problematic for the continuity of long-term records without thorough site-specific intercomparisons (e.g. Smith et al., 2017). Further, not all sites in our dataset are sampled consistently throughout the dataset's time span. In a given year, there are between 3662 and 5295 different sites with at least one SWE measurement (Fig. 4, sum of a and b).
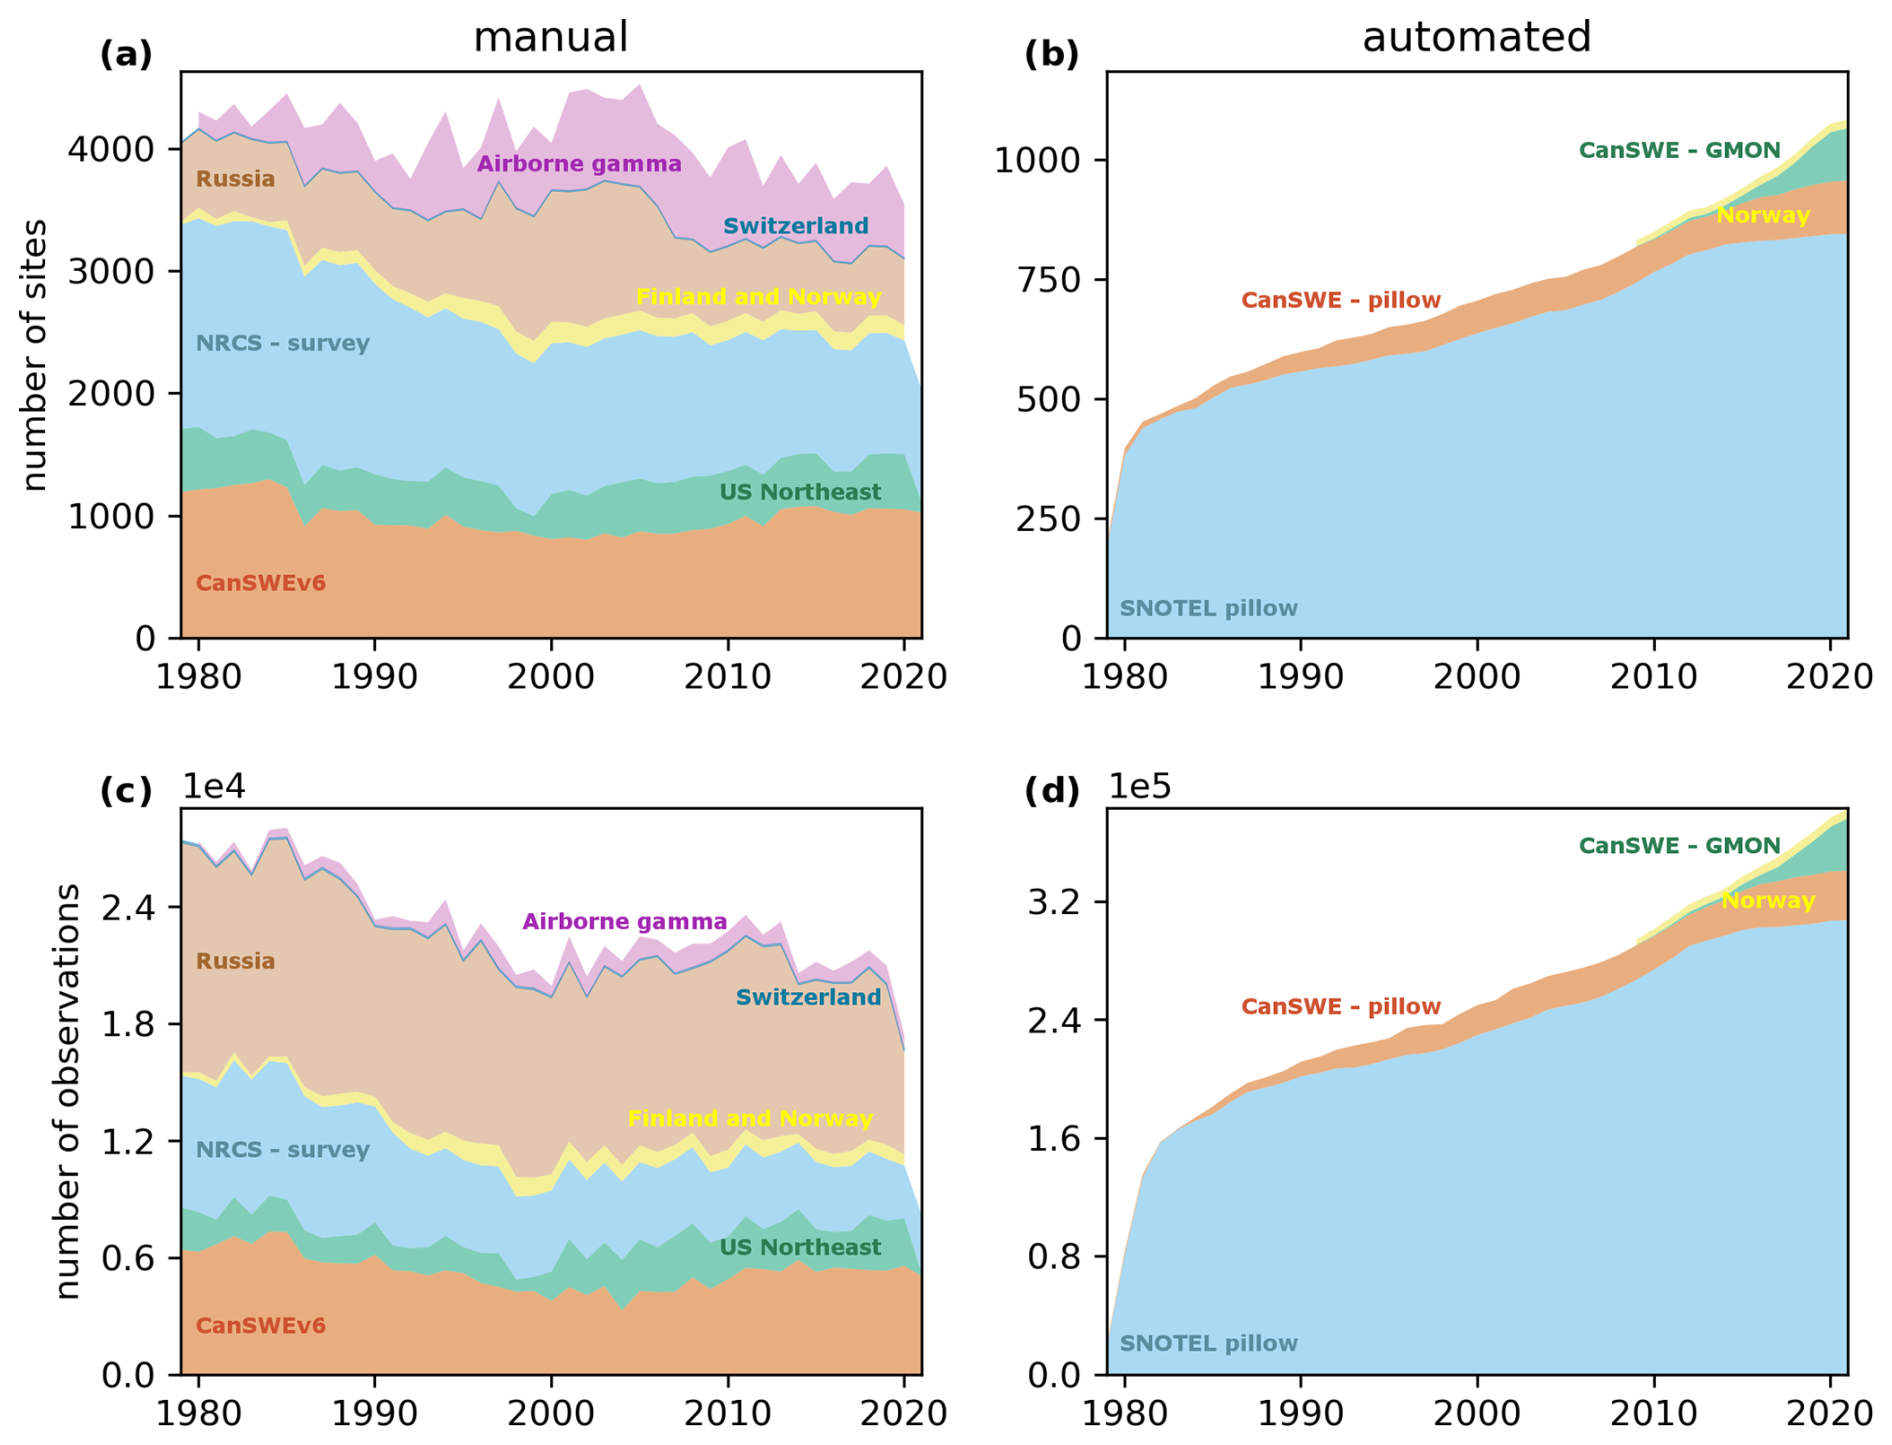
Figure 4Number of manual (a, c) and automated (b, d) observations contained in NorSWE. For display purposes, Maine GS, NH-DES, and NRCC are combined as are the SYKE and NVE manual sites. Russia typically has one to three snow courses for a given site, covering different land covers which are counted separately in NorSWE (Sect. 3.2). Approximately half of the SNOTEL and one-third of the CanSWE and NVE automated SWE values are 0 mm.
To understand the distribution of consistently sampled sites in NorSWE, we identified sites with at least one measurement in each pentad starting in 1980 and with measurements in at least 30 different years between 1979 and 2021 (Fig. 5). The SLF, SNOTEL, RIHMI-WDC, and NH-DES networks are the most consistent over time, with at least half of their sites being retained. Similarly to the full suite of sites, the temporally consistent subset has well-distributed coverage over Finland and Russia, northern regions excepted. In North America, although the density of the temporally consistent sites is lower compared to the full complement, coverage remains good in the east and west, maritime Canada excepted. Critically, however, there are almost no sites with consistent long-term (>30 years) records in the central prairies, resulting in an increased underrepresentation of the prairie snow class (Fig. 3, hatched bars; Figs. S1 and S2). The lack of North American prairie sites is largely attributed to the curtailment of Canada's ground observing networks, starting in the 1980s, and to the cessation of the Meteorological Survey of Canada (MSC) annual Snow Cover Data (SCD) summaries in 1985 (Brown et al., 2000), combined with inconsistent airborne gamma surveys (Fig. S3). The end of the MSC SCD program, which compiled coordinated SWE observations from agencies across Canada, resulted in the loss of historical data collected after this date and before the establishment of CanSWE's precursor, the Canadian Historical Snow Survey Dataset (Brown et al., 2019). Only four Norwegian sites were retained because most NVE sites have only been operational since the late 1990s. The airborne gamma SWE network has the smallest proportion of long-term consistent sites, with only 3 % of flight lines meeting our criteria. Airborne gamma observations in Alaska only began in 2003, and flights in much of the western US mountains ceased in the late 2000s and early 2010s (Fig. S3).
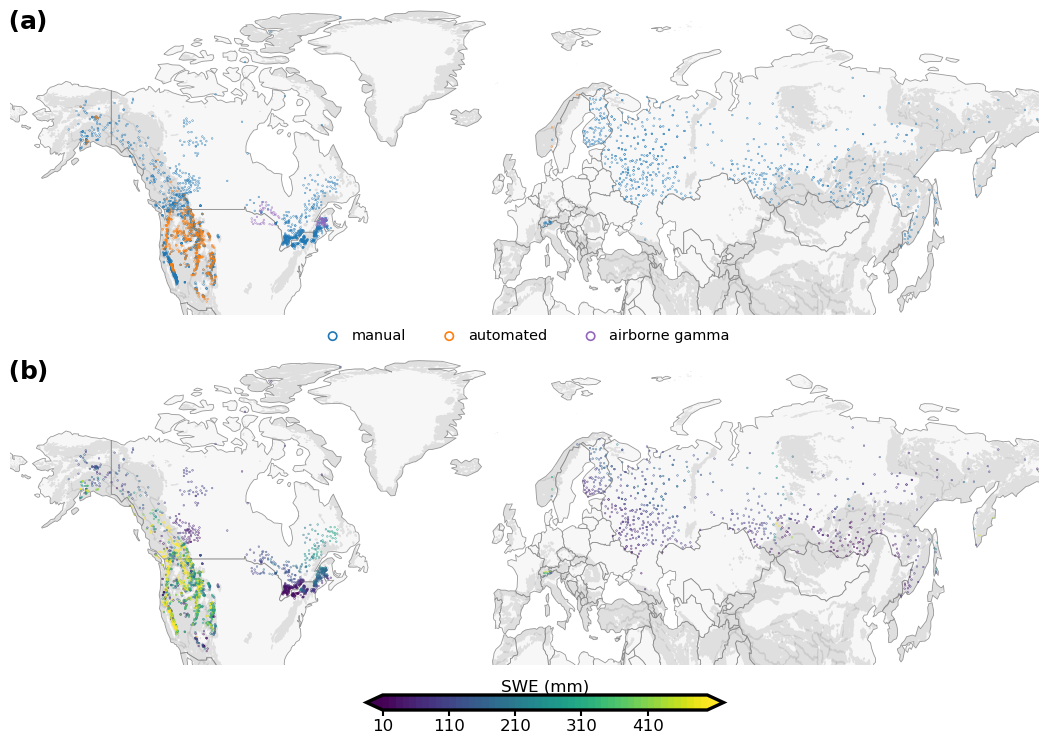
Figure 5Sites in NorSWE with at least 30 years of observations and at least 1 year in each pentad, starting in 1980, by measurement type (a). (b) Mean March SWE for the sites in (a).
Lastly, to understand the station representativity according to elevation, we compare site elevations with snow class (ephemeral excluded), as well as with mountain and non-mountain land-mass hypsometries (Fig. 6). The ephemeral snow class is excluded because it includes both ephemeral and no-snow areas. The hypsometries were derived by intersecting the Global Seasonal-Snow Classification v1, 30 arcsec (Liston and Sturm, 2021), reprojected to EASE2 Grid with 1 km spacing, with the Copernicus GLO-30 DEM (https://doi.org/10.5270/ESA-c5d3d65, Copernicus Program, 2023). The elevation distribution of non-mountain sites (Fig. 6f) matches that of the terrain, but the elevation distribution of the mountain sites is biased high. The latter reflects that sites in mountain areas tend to be located in the upper reaches of headwater catchments to provide the necessary information for various operational activities. It may also partially reflect the broad mountain mask used in NorSWE (Sect. 3), where the 25 km buffer applied to the GMBA Mountain Inventory v2 can extend into lower-elevation non-mountain areas. Despite the mountain sites being biased high compared to the mountain area hypsometry, they still miss the highest-elevation terrain.
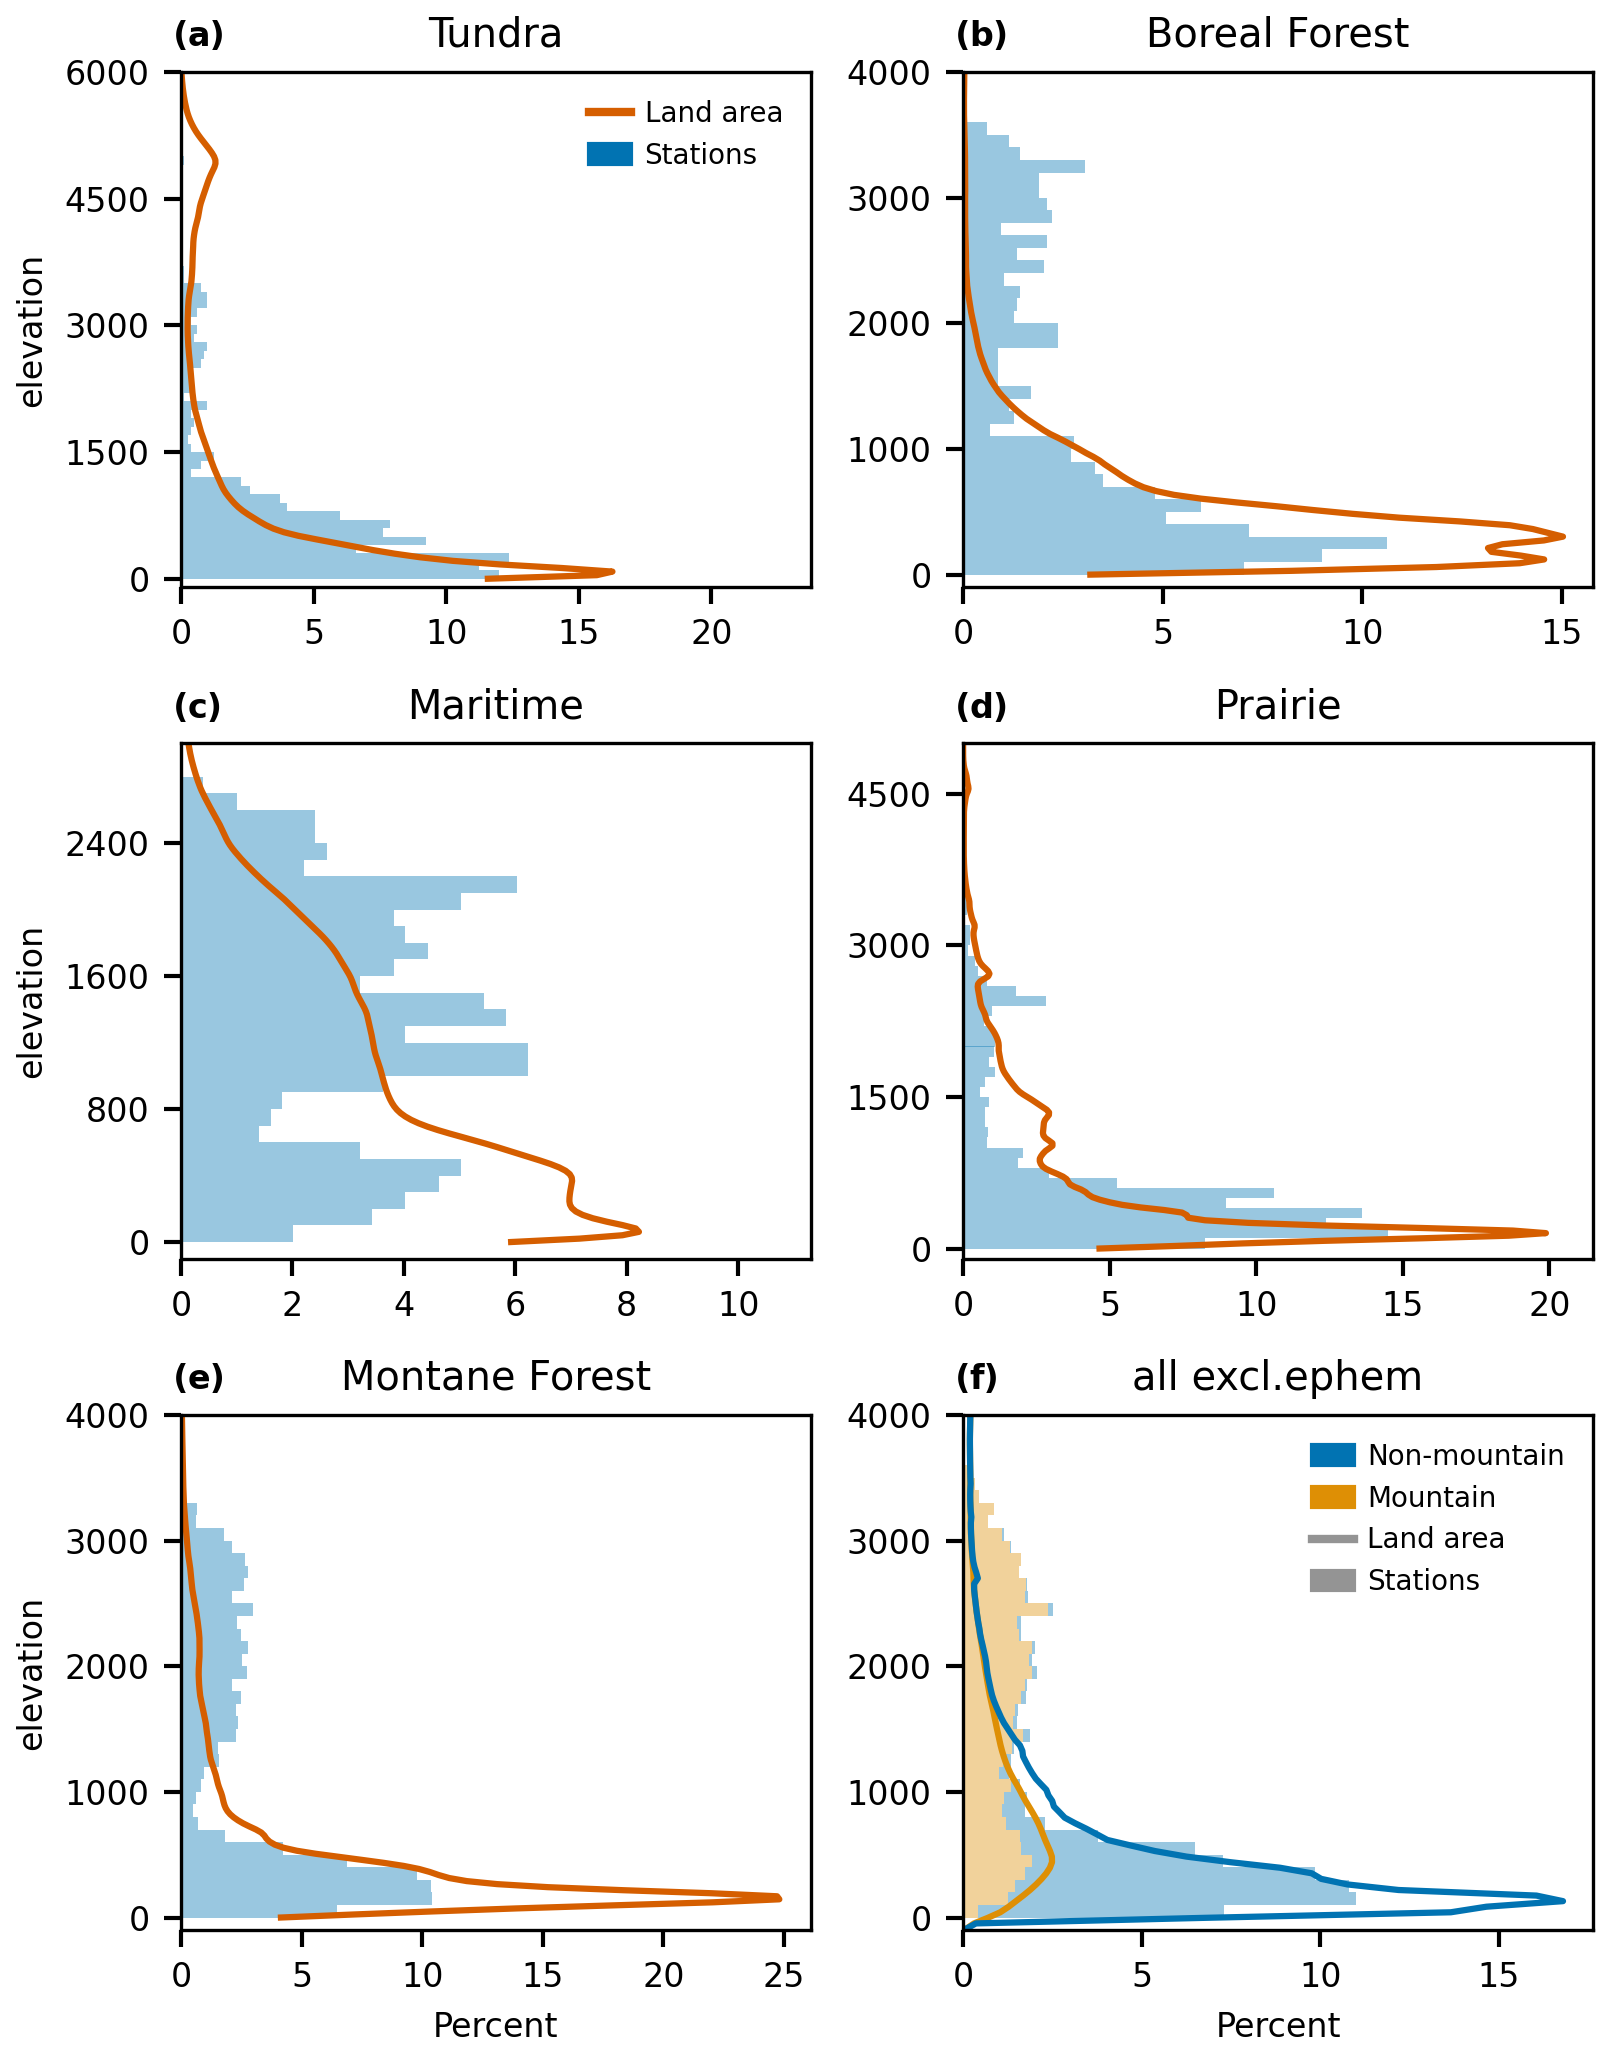
Figure 6Elevation (m a.s.l.) distribution of NorSWE sites (blue bars) and land area north of 30° N (orange line) according to Sturm and Liston (2021) snow classes (a–e). Panel (f) shows the elevation distribution of sites (bars) and of the land area north of 30° N (lines) of the five snow classes shown in (a)–(e), separated into mountain and non-mountain (Sect. 3).
By snow class, there is representative elevation sampling of the prairie and tundra snow classes, except for the highest elevations of the tundra class. Much of the unsampled high-elevation tundra snow is found in High Mountain Asia and in the mountains of the Canadian Arctic Archipelago, where publicly available in situ snow information is lacking. The elevation distributions of sites in the boreal forest, montane forest, and maritime snow classes are biased high compared to the average terrain. In these snow classes, there are generally two peaks: a larger one centred around 200–500 m, which aligns with the snow class and is consistent with the non-mountain hypsometry and site distribution (Fig. 6f), and a smaller one between 2000 and 3500 m. The second peak, which does not align with the snow class elevation distribution, mirrors the distribution of mountain sites (e.g. Fig. 6f). This pattern is reversed for maritime snow.
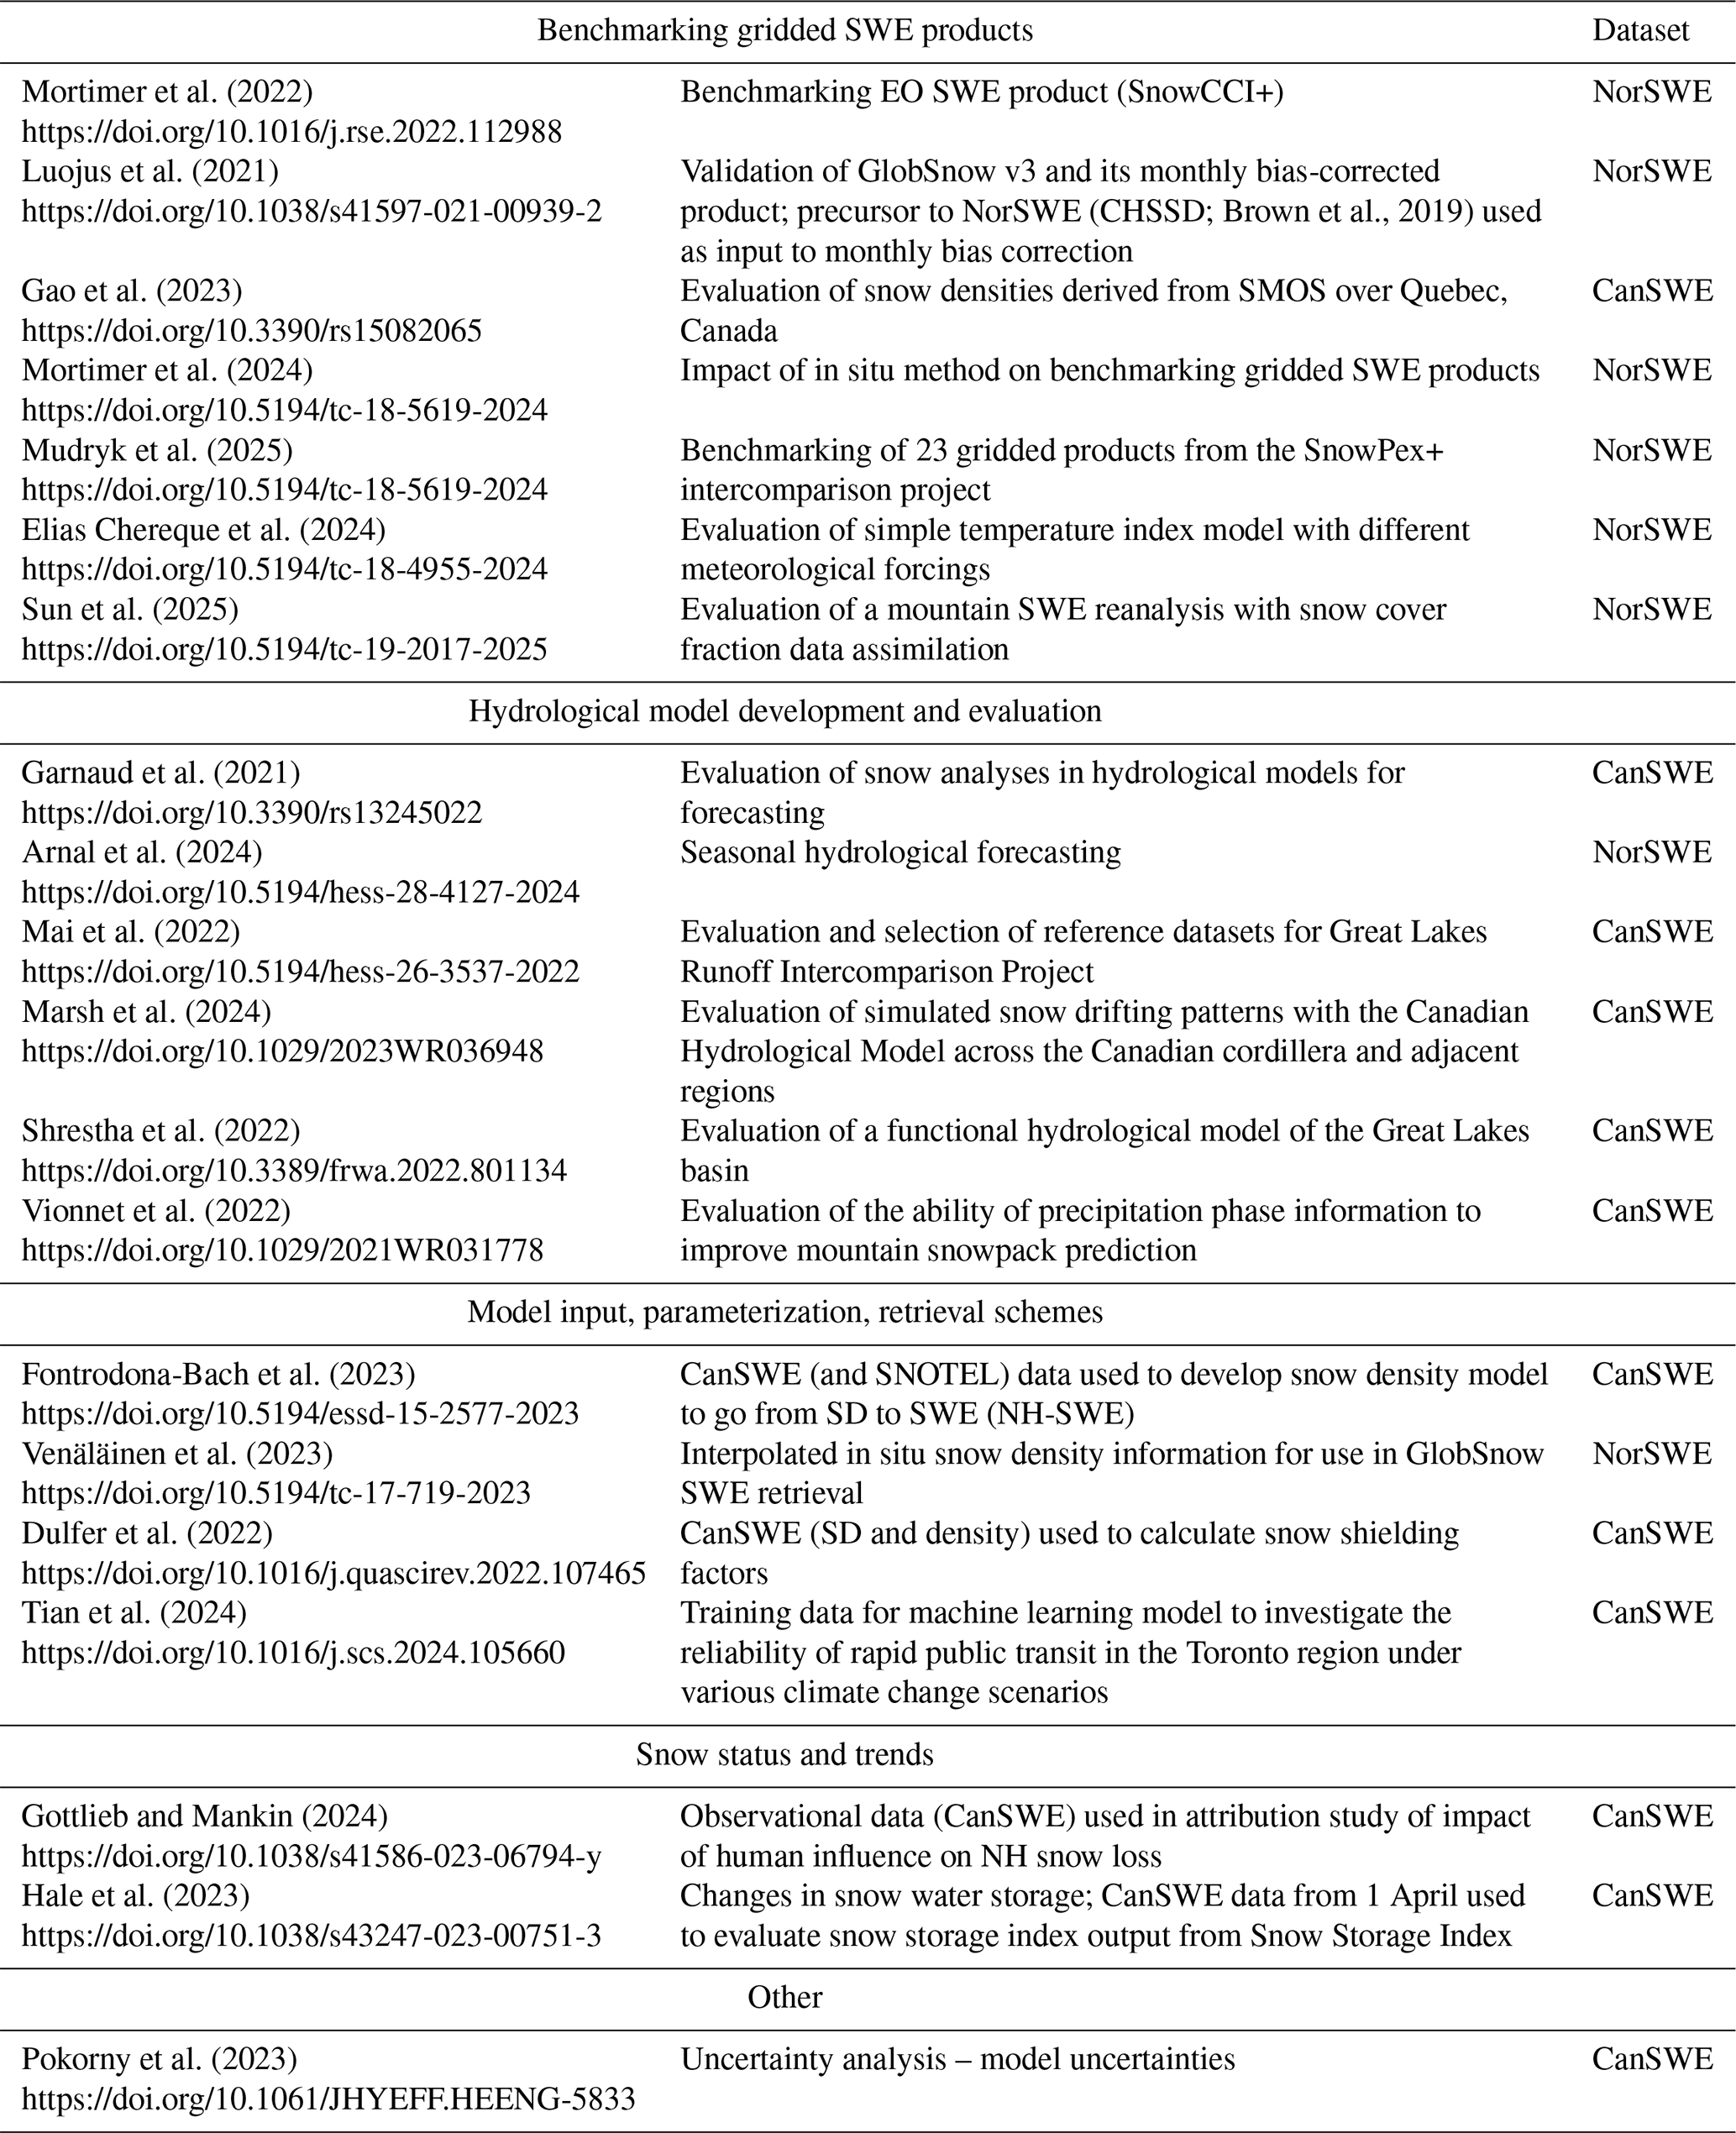
Repeated in situ SWE measurements, such as those contained in our dataset, are critical to understand current climate, state, and trends. SWE time series from manual snow courses (see Table A1 in the Appendix for uses of CanSWE and NorSWE), such as those contained in our dataset, have been used to quantify changes in snow water storage and SWE both regionally (e.g. Bulygina et al., 2011; Hale et al., 2023) and on a hemispheric scale (e.g. Gottlieb and Mankin, 2024) and to tie model-based trends to a ground truth (Mudryk et al., 2025). They have also been used to benchmark SWE and/or density estimates from satellite data (Luojus et al., 2021; Mortimer et al., 2020, 2022; Gao et al., 2023), reanalysis products, and climate models (Mortimer et al., 2020; Elias Chereque et al., 2024; Mudryk et al., 2025) and to understand their uncertainties (Pokorny et al., 2023). Snow density information from a version of our dataset is used to parameterize spatially and temporally varying snow densities applied within the satellite-based GlobSnow and SnowCCI SWE algorithms (Venäläinen et al., 2021, 2023). Automated data from the well-known and easily accessible SNOTEL network are used extensively, as detailed in Fleming et al. (2023). Beyond those data, automated CanSWE data have been used to evaluate hydrological and snowpack models (e.g. Garnaud et al., 2021; Vionnet et al., 2022; Arnal et al., 2024; Marsh et al., 2024) and to validate SWE reconstructions (Sun et al., 2025).
Further, paired SWE–SD measurements are needed to train and validate snow density models used to convert the more plentiful SD observations to SWE (e.g. Sturm et al., 2010; Hill et al., 2019; Sturm and Liston, 2021; Fontrodona-Bach et al., 2023). Such models, detailed elsewhere (see Avanzi et al., 2015, and references therein; Fontrodona-Bach et al., 2023, and references therein), can fill data gaps by providing estimates of water content when only height is available. However, they require in situ SWE information for their formulation and evaluation, and the quality of these models is strongly tied to the representativeness of available in situ data. For example, density information from CanSWE and SNOTEL was used to train the snow density model used in NH-SWE (Fontrodona-Bach et al., 2023). Comparisons of the aforementioned model with that from Hill et al. (2019), which also included in situ data from the northeastern US, suggests that the inclusion of more data (e.g. NorSWE) would likely improve NH-SWE, especially over the northeastern US.
In situ SWE observations can also help inform high-quality spatially and temporally continuous gridded SWE estimates, exemplified by the University of Arizona SWE product (Broxton et al., 2019). SWE observations from SNOTEL and SD from the US Cooperative network are assimilated with gridded temperature and precipitation (PRISM) data to provide high-quality daily SWE and SD estimates over the Coterminous US at a 4 km spatial resolution (Zeng et al., 2018). Data contained in NorSWE could help facilitate the creation of similar datasets at both regional and hemispheric scales. Finally, beyond the snow science community, readily available in situ SWE, SD, and snow density information is often required to parameterize physical models (e.g. Dulfer et al., 2022) or as training data for various machine learning applications (Tian et al., 2024).
NorSWE was initially created to evaluate medium- and coarse-resolution gridded SWE products (∼5–50 km) over the modern satellite period. As such, we focused on snow courses and airborne gamma SWE measurements which are more representative of the surrounding land cover than single-point measurements (Meromy et al., 2013). Automated point data were later added to support specific studies (e.g. Arnal et al., 2024). Although we, exceptionally, included observations from 11 single-point manual sites in Switzerland (Sect. 2.1.2; Marty, 2020), our criteria excludes networks that rely primarily on single-point SWE measurements (Haberkorn, 2019). The restricted time period (1979–2021) omits historical data collected before 1979 from NorSWE, and it does not extend to the present day. Older observations are available from some of the constituent datasets and can be accessed through the links in Table 1. Extending our dataset to the present day is challenging because, for some agencies, there can be lag of a year or more between data collection and distribution. Another limitation of our dataset is the crude quality control procedure applied to the manual SWE data that relies on common SWE ranges for Canada (Braaten, 1998), which may not be appropriate globally. The infrequent nature of snow course and airborne gamma SWE measurements makes it difficult to apply spike checks and similar procedures to identify erroneous data. Machine learning approaches could be explored to develop improved self-contained QC methods for these less frequent observations.
To our knowledge, NorSWE is the most comprehensive in situ SWE dataset for North America covering the modern satellite era. The inclusion of SWE observations from Switzerland, Norway, Finland, Russia, and Nepal provides coverage of most Northern Hemisphere snow conditions, but there are considerable data gaps in south-central Asia and in Europe despite the exception of including the SLF “GCOS SWE data from 11 stations in Switzerland” (Marty, 2020). Notably, however, these gaps do not necessarily represent an absence of observations. We are aware of networks and sites (see, for example, Haberkorn et al., 2019, for Europe and Engel et al., 2022, for the northeastern US) that were either not made available to the authors or did not meet our initial criteria of long-term snow courses or automated sensors (i.e. they were only operational for a short time period and/or provide snow depth and not SWE). Recent initiatives such as the WMO Joint Body for the Status of Mountain Snow Cover (https://mountainresearchinitiative.org/flagship-activities/joint-body-on-the-status-of-mountain-snow-cover/, last access: December 2024) may uncover additional sources that could be included in a future version of NorSWE.
NorSWE is distributed as a single NetCDF file following the Climate and Forecasts (CF) metadata conventions. The NetCDF file is distributed as a compressed zipped file (NorSWE-NorEEN_1979-2021_v3.zip) available at https://doi.org/10.5281/zenodo.15263370 (Mortimer and Vionnet, 2025).
NorSWE (Mortimer and Vionnet, 2025) is a first step towards the consolidation and dissemination of in situ SWE data over the Northern Hemisphere. It combines data from 11 different sources into a single NetCDF file, with a consistent quality control applied to provide comprehensive coverage of North America, as well as of Switzerland, Norway, Finland, Russia, and Nepal, over the period 1979–2021. It includes both manual and automated observations from four primary methods: snow courses, airborne gamma, snow pillows, and GMON sensors. Single-point manual observations over Switzerland are, exceptionally, included to address data gaps over Europe. Altogether, NorSWE includes 11 593 790 SWE observations from 10 153 different locations. Precursors to this dataset have been used in climate monitoring and research, the development and evaluation of snow products, hydrological modelling, and other activities requiring snow information. NorSWE was possible thanks to the cooperation of individual agencies and to an increase in open data policies. We hope that this dataset will motivate additional agencies to engage in similar data aggregation initiatives.
Table A1Demonstration of the uses of NorSWE and its precursor, CanSWE. NorSWE includes v1 and its unpublished precursors. Uses of SNOTEL data are detailed in Fleming et al. (2023).
The supplement related to this article is available online at https://doi.org/10.5194/essd-17-3619-2025-supplement.
CM produced the NorSWE dataset and prepared the article with contributions from VV. VV contributed the SNOTEL and NRCS data, contributed code to produce the dataset, and edited the paper.
The contact author has declared that neither of the authors has any competing interests.
Publisher's note: Copernicus Publications remains neutral with regard to jurisdictional claims made in the text, published maps, institutional affiliations, or any other geographical representation in this paper. While Copernicus Publications makes every effort to include appropriate place names, the final responsibility lies with the authors.
We gratefully acknowledge the field observers that collected manual snow observations and maintain the automatic stations, as well as the agencies and personnel who maintain these records. The authors of NorSWE do not own any of these data. Data are redistributed under the following licenses without any guarantee of the quality and/or accuracy of these data. Data from The Norwegian Water Resources and Energy Directorate are distributed – and modified as described herein – under the Norwegian licence for Open Government data (NLOD). CanSWE data are redistributed under the Open Government Licence – Canada (https://open.canada.ca/en/open-government-licence-canada, last access: November 2024). Hydro-Québec data (http://www.hydroquebec.com/, last access: November 2024) are available under the terms of a Creative Commons Attribution – Non Commercial – Share A Like 4.0 International (https://creativecommons.org/licenses/by-nc-sa/4.0/, last access: November 2024) (CC BY-NC-SA 4.0). Finnish Environmental Institute (SYKE) data are redistributed under Creative Commons Attribution 4.0 International (CC BY 4.0). GCOS SWE data from 11 stations in Switzerland are redistributed under the Open Database License (ODbL) “Attribution Share-Alike for Databases”.
The authors of NorSWE have modified the original data as outlined in the text. We recommend that the users of NorSWE reference the data providers of the relevant agencies as outlined in Table 4.
This paper was edited by Dalei Hao and reviewed by Adrià Fontrodona-Bach, Alexander Gottlieb, and one anonymous referee.
Arnal, L., Clark, M. P., Pietroniro, A., Vionnet, V., Casson, D. R., Whitfield, P. H., Fortin, V., Wood, A. W., Knoben, W. J. M., Newton, B. W., and Walford, C.: FROSTBYTE: a reproducible data-driven workflow for probabilistic seasonal streamflow forecasting in snow-fed river basins across North America, Hydrol. Earth Syst. Sci., 28, 4127–4155, https://doi.org/10.5194/hess-28-4127-2024, 2024.
Avanzi, F., De Michele C., and Ghezzi, A.: On the performances of empirical regressions for the estimation of bulk snow density, Geogr. Fis. Din. Quat., 38, 105–112, https://doi.org/10.4461/GFDQ.2015.38.10, 2015.
Barnett, T. P., Adam, J. C., and Lettenmaier, D. P.: Potential impacts of a warming climate on water availability in snow-dominated regions, Nature, 438, 303–309, https://doi.org/10.1038/nature04141, 2005.
Beaudette, D., Skovlin, J., Roecker, S., and Brown, A.: soilDB: Soil Database Interface. R package version 2.8.5 [code], https://CRAN.R-project.org/package=soilDB (last access: April 2024), 2024.
Beaudoin-Galaise, M. and Jutras, S.: Comparison of manual snow water equivalent (SWE) measurements: seeking the reference for a true SWE value in a boreal biome, The Cryosphere, 16, 3199–3214, https://doi.org/10.5194/tc-16-3199-2022, 2022.
Beaumont, R. T.: Mt. Hood pressure pillow snow gage, J. Appl. Meteorol., 4, 626–631, https://doi.org/10.1175/1520-0450(1965)004<0626:MHPPSG>2.0.CO;2, 1965.
Biemans, H., Siderius, C., Lutz, A. F., Nepal, S., Ahmad, B., Hassan, T., von Bloh, W., Wijngaard, R. R., Wester, P., Shrestha, A. B., and Immerzeel, W. W.: Importance of Snow and Glacier Meltwater for Agriculture on the Indo-Gangetic Plain, Nat. Sustain., 2, 594–601, https://doi.org/10.1038/s41893-019-0305-3, 2019.
Braaten, R.: Canadian Snow Water Equivalent Database Main Documentation, Main Documentation, Environment Canada, Climate Processes and Earth Observation Division, 25 pp., http://data.ec.gc.ca/data/climate/systems/canadian-historical-snow-survey-data/Braaten_1998_Canadian_SWE_Database.pdf (last access: September 2021), 1998.
Brown, R. D., Walker, A., and Goodison, B.: Seasonal snow cover monitoring in Canada: An assessment of Canadian contributions for global climate monitoring, Proceedings of the 57th Eastern Snow Conference, 17–19 May 2000, Syracuse, New York, USA, 131–142, ISBN 0-920081-22-3, 2000.
Brown, R. D., Fang, B., and Mudryk, L.: Update of Canadian historical snow survey data and analysis of snow water equivalent trends, 1967–2016, Atmos. Ocean, 57, 149–156, https://doi.org/10.1080/07055900.2019.1598843, 2019.
Brown, R. D., Smith, C., Derksen, C., and Mudryk, L.: Canadian in situ snow cover trends for 1955–2017 including an assessment of the impact of Automation, Atmos. Ocean, 59, 77–92, https://doi.org/10.1080/07055900.2021.1911781, 2021.
Broxton, P., Zeng, X., and Dawson, N.: Daily 4 km Gridded SWE and Snow Depth from Assimilated In-Situ and Modeled Data over the Conterminous US (NSIDC-0719, Version 1), NASA National Snow and Ice Data Center Distributed Active Archive Center, Boulder Colorado, USA [data set], https://doi.org/10.5067/0GGPB220EX6A, 2019.
Bulygina, O. N., Groisman, P. Ya., Razuvaev, V. N., and Korshunova, N. N.: Changes in snow cover characteristics over Northern Eurasia since 1996, Environ. Res. Lett., 6, 045204, https://doi.org/10.1088/1748-9326/6/4/045204, 2011.
Campbell Scientific (Canada) Corp.: CS725 Snow Water Equivalent Sensor Instruction Manual, https://s.campbellsci.com/documents/ca/manuals/cs725_man.pdf (last access: September 2024), January 2017.
Carroll, S. S. and Carroll, T. R.: Effect of forest biomass on airborne snow water equivalent estimates obtained by measuring terrestrial gamma radiation, Remote Sens. Environ., 27, 313–319, https://doi.org/10.1016/0034-4257(89)90091-6, 1989a.
Carroll, S. S. and Carroll, T. R.: Effect of uneven snow cover on airborne snow water equivalent estimates obtained by measuring terrestrial gamma radiation, Water Resour. Res., 25, 1505–1510, https://doi.org/10.1029/WR025i007p01505, 1989b.
Carroll, T. R.: Airborne Gamma Radiation Snow Survey Program: A user's guide, Version 5.0, National Operational Hydrologic Remote Sensing Center (NOHRSC), Chanhassen, 14, https://www.nohrsc.noaa.gov/special/tom/gamma50.pdf (last access: November 2024), 2001.
Carroll, T. R. and Vose, G. D.: Airborne snow water equivalent measurements over a forested environment using terrestrial gamma radiation, in: Proceedings of the 41st Eastern Snow Conference, 7–8 June 1984, New Carrolton, Maryland, USA, 29, 101–115, ISBN 0-920081-06-1, 1984.
Carroll, T. R., Glynn, J. E., and Goodison, B. E.: A comparison of U. S. and Canadian airborne gamma radiation snow water equivalent measurements, P. West. Snow Conf., 51, 27–37, 1983.
Cho, E., Jacobs, J. M., Schroeder, R., Tuttle, S. E., and Olheiser, C.: Improvement of operational airborne gamma radiation using SMAP soil moisture, Remote Sens. Environ., 240, 111668, https://doi.org/10.1016/j.rse.2020.111668, 2020a.
Cho, E., Jacobs, J. M., and Vuyovich, C.: The value of long-term (40 years) airborne gamma radiation SWE record for evaluating three observation-based gridded SWE datasets by seasonal snow and land cover classifications, Water Resour. Res., 56, e2019WR025813, https://doi.org/10.1029/2019WR025813, 2020b.
Choquette, Y., Ducharme, P., and Rogoza, J.: CS725, An Accurate Sensor for the Snow Water Equivalent and Soil Moisture Measurements, in: Proceedings ISSW 2013, 2013 International Snow Science Workshop, Grenoble – Chamonix Mont-Blanc, France, 931–936, https://arc.lib.montana.edu/snow-science/objects/ISSW13_paper_O2-09.pdf (last access: July 2025), 2013.
Copernicus Program: Copernicus DEM—Global and European digital elevation model (COP-DEM), GLO-30, https://doi.org/10.5270/ESA-c5d3d65, 2023.
Cork, H. F. and Loijens, H. S.: The effect of snow drifting on gamma survey results, J. Hydrol., 48, 41–51, https://doi.org/10.1016/0022-1694(80)90064-5, 1980.
Dixon, D. and Boon, S.: Comparison of the SnowHydro snow sampler with existing snow tube designs, Hydrol. Process., 26, 2555–2562, https://doi.org/10.1002/hyp.9317, 2012.
Dulfer, H. E., Margold, M., Darvill, C. M., and Stroeven, A. P.: Reconstructing the advance and retreat dynamics of the central sector of the last Cordilleran Ice Sheet, Quaternary Sci. Rev., 284, 107465, https://doi.org/10.1016/j.quascirev.2022.107465, 2022.
Elias Chereque, A., Kushner, P. J., Mudryk, L., Derksen, C., and Mortimer, C.: A simple snow temperature index model exposes discrepancies between reanalysis snow water equivalent products, The Cryosphere, 18, 4955–4969, https://doi.org/10.5194/tc-18-4955-2024, 2024.
Engel, C., Hastings, R., Giovando, J., Gabel, E., Duncan, C., and Dahl, T.: Summary of Ground-Based Snow Measurements for the Northeastern United States, Engineer Research and Development Special Report No. 22–1, US Army Corps of Engineers, https://doi.org/10.21079/11681/44122, 2022.
Environment Canada, Meteorological Service of Canada: Snow Surveying – Manual of Standards Snow Surveying Procedures Draft, 3rd edn., last updated January 2004, Toronto, Canada, 18 pp., 2004.
Fleig, A. (Ed.): Norwegian hydrological reference dataset for climate change studies, Report no. 2 – 2013, Norwegian Water Resources and Energy Directorate, Oslo, Norway, 84 pp., ISBN 978-82-410-0869-6, 2013.
Fleming, S. W., Zukiewicz, L., Strobel, M. L., Hofman, H., and Goodbody, A. G.: SNOTEL, the Soil Climate Analysis Network, and Water Supply Forecasting at the Natural Resources Conservation Service: Past, Present, and Future, J. Am. Water Resour. As., 59, 585–599, https://doi.org/10.1111/1752-1688.13104, 2023.
Fontrodona-Bach, A., Schaefli, B., Woods, R., Teuling, A. J., and Larsen, J. R.: NH-SWE: Northern Hemisphere Snow Water Equivalent dataset based on in situ snow depth time series, Earth Syst. Sci. Data, 15, 2577–2599, https://doi.org/10.5194/essd-15-2577-2023, 2023.
Foster, J. L., Hall, D. K., Eylander, J. B., Riggs, G. A., Nghiem, S. V., Tedesco, M., Kim, E., Montesano, P. M., Kelly, R. E. J., Casey, K. A., and Choudhury, B.: A blended global snow product using visible, passive microwave and scatterometer satellite data, Int. J. Remote Sens., 32, 1371–1395, https://doi.org/10.1080/01431160903548013, 2011.
Fyfe, J. C., Derksen, C., Mudryk, L., Flato, G. M., Santer, B. D., Swart, N. C., Molotch, N. P., Zhang, X., Wan, H., Arora, V. K., Scinocca, J., and Jiao, Y.: Large near-term projected snowpack loss over the western United States, Nat. Commun., 8, 1–7, https://doi.org/10.1038/ncomms14996, 2017.
Gao, X., Pan, J., Peng, Z., Zhao, T., Bai, Y., Yang, J., Jiang, L., Shi, J., and Husi, L.: Snow density retrieval in Quebec using space-borne SMOS observations, Remote Sens.-Basel, 15, 2065, https://doi.org/10.3390/rs15082065, 2023.
Garnaud, C., Vionnet, V., Gaborit, É., Fortin, V., Bilodeau, B., Carrera, M., and Durnford, D.: Improving Snow Analyses for Hydrological Forecasting at ECCC Using Satellite-Derived Data, Remote Sens.-Basel, 13, 5022, https://doi.org/10.3390/rs13245022, 2021.
Gesch, D., Oimoen, M., Greenlee, S., Nelson, C., Steuck, M., and Tyler, D.: The National Elevation Dataset, Photogramm. Eng. Rem. S., 68, 5–32, 2002.
Glynn, J. E., Carroll, T. R., Holman, P. B., and Grasty, R. L.: An airborne gamma ray snow survey of a forested covered area with a deep snowpack, Remote Sens. Environ., 26, 149–160, https://doi.org/10.1016/0034-4257(88)90093-4, 1988.
Gottlieb, A. R. and Mankin, J. S.: Evidence of human influence on Northern Hemisphere snow loss, Nature, 625, 293–300, https://doi.org/10.1038/s41586-023-06794-y, 2024.
Haberkorn, A. (Ed.): European Snow Booklet – an Inventory of Snow Measurements in Europe, EnviDat, 363 pp., https://doi.org/10.16904/envidat.59, 2019.
Hale, K. E., Jennings, K. S., Musselman, K. N., Livneh, B., and Molotch, N. P.: Recent decreases in snow water storage in western North America, Comm. Earth Environ., 4, 170, https://doi.org/10.1038/s43247-023-00751-3, 2023.
Helms, D., Phillips, S. E., and Reich, P. F. (Eds.): The history of snow survey and water supply forecasting: Interviews with US Department of Agriculture Pioneers, No. 8, Natural Resources Conservation Service, US Department of Agriculture, Washington DC, https://www.nrcs.usda.gov/sites/default/files/2022-09/History-Of-Snow-Survey.pdf (last access: July 2025), 2008.
Henkel, P., Koch, F., Appel, F., Bach, H., Prasch, M., Schmid, L., Schweizer, J., and Mauser, W.: Snow water equivalent of dry snow derived from GNSS carrier phases, IEEE T. Geosci. Remote, 56, 3561–3572, https://doi.org/10.1109/TGRS.2018.2802494, 2018.
Hill, D. F., Burakowski, E. A., Crumley, R. L., Keon, J., Hu, J. M., Arendt, A. A., Wikstrom Jones, K., and Wolken, G. J.: Converting snow depth to snow water equivalent using climatological variables, The Cryosphere, 13, 1767–1784, https://doi.org/10.5194/tc-13-1767-2019, 2019.
Huning, L. A. and AghaKouchak, A.: Global snow drought hot spots and characteristics, P. Natl. Acad. Sci. USA, 117, 19753–19759, https://doi.org/10.1073/pnas.1915921117, 2020.
Johnson, J. B.: A theory of pressure sensor performance in snow, Hydrol. Process., 18, 53–64, https://doi.org/10.1002/hyp.1310, 2004.
Johnson, J. B. and Marks, D.: The detection and correction of snow water equivalent pressure sensor errors, Hydrol. Process., 18, 3513–3525, https://doi.org/10.1002/hyp.5795, 2004.
Kodama, M., Nakai, K., Kawasaki, S., and Wada, M.: An application of cosmic-ray neutron measurements to the determination of the snow-water equivalent, J. Hydrol., 41, 85–92, https://doi.org/10.1016/0022-1694(79)90107-0, 1979.
Kuusisto, E.: Snow accumulation and snowmelt in Finland, vol. 55, Water Research Institute, Helsinki, 149 pp., ISBN 951-46-7494-4, 1984.
Leppänen, L., Kontu, A., Hannula, H.-R., Sjöblom, H., and Pulliainen, J.: Sodankylä manual snow survey program, Geosci. Instrum. Method. Data Syst., 5, 163–179, https://doi.org/10.5194/gi-5-163-2016, 2016.
Leys, C., Klein, O., Dominicy, Y., and Ley, C.: Detecting multivariate outliers: Use a robust variant of the Mahalanobis distance, J. Exp. Soc. Psychol., 74, 150–156, https://doi.org/10.1016/j.jesp.2017.09.011, 2018.
Liston, G. E. and Sturm, M.: Global Seasonal-Snow Classification (NSIDC-0768, Version 1). 30 arcsec, NASA National Snow and Ice Data Center Distributed Active Archive Center, Boulder, Colorado USA [data set], https://doi.org/10.5067/99FTCYYYLAQ0, 2021.
López-Moreno, J. I., Leppänen, L., Luks, B., Holko, L., Picard, G., Sanmiguel Vallelado, A., Alonso González, E., Finger, D. C., Arslan, A. N., Gillemot, K., Sensoy, A., Sorman, A., Ertaş, M. C., Fassnacht, S. R., Fierz, C., and Marty, C.: Intercomparison of measurements of bulk snow density and water equivalent of snow cover with snow core samplers: Instrumental bias and variability induced by observers, Hydrol. Process., 34, 3120–3133, https://doi.org/10.1002/hyp.13785, 2020.
Luojus, K., Pulliainen, J., Takala, M., Lemmetyinen, J., Mortimer, C., Derksen, C., Mudryk, L., Moisander, M., Venäläinen, P., Hiltunen, M., Ikonen, J., Smolander, T., Cohen, J., Salminen, M., Veijola, K., and Norberg, J.: GlobSnow v3.0 Northern Hemisphere snow water equivalent dataset, Sci. Data, 8, 163, https://doi.org/10.1038/s41597-021-00939-2, 2021.
Magnusson, J., Nævdal, G., Matt, F., Burkhart, J. F., and Winstral, A.: Improving hydropower inflow forecasts by assimilating snow data, Hydrol. Res., 51, 226–237, https://doi.org/10.2166/nh.2020.025, 2020.
Mai, J., Shen, H., Tolson, B. A., Gaborit, É., Arsenault, R., Craig, J. R., Fortin, V., Fry, L. M., Gauch, M., Klotz, D., Kratzert, F., O'Brien, N., Princz, D. G., Rasiya Koya, S., Roy, T., Seglenieks, F., Shrestha, N. K., Temgoua, A. G. T., Vionnet, V., and Waddell, J. W.: The Great Lakes Runoff Intercomparison Project Phase 4: the Great Lakes (GRIP-GL), Hydrol. Earth Syst. Sci., 26, 3537–3572, https://doi.org/10.5194/hess-26-3537-2022, 2022.
Maine Geological Survey: Maine Cooperative Snow Survey Snow Measurements Standard Operating Procedure, revised 4 October 2016, 9 pp., 2016.
Marsh, C. B., Lv, Z., Vionnet, V., Harder, P., Spiteri, R. J., and Pomeroy, J. W.: Snowdrift-permitting simulations of seasonal snowpack processes over large mountain extents, Water Resour. Res., 60, e2023WR036948, https://doi.org/10.1029/2023WR036948, 2024.
Marty, C.: GCOS SWE data from 11 stations in Switzerland, EnviDat [data set], last updated 2024, https://doi.org/10.16904/15, 2020.
Marty, C., Rohrer, M. B., Huss, M., and Stähli, M.: Multi-decadal observations in the Alps reveal less and wetter snow, with increasing variability, Front. Earth Sci., 11, 1165861, https://doi.org/10.3389/feart.2023.1165861, 2023.
Meredith, M., Sommerkorn, M., Cassotta, S., Derksen, C., Ekaykin, A., Hollowed, A., Kofinas, G., Mackintosh, A., J. Melbourne-Thomas, J., Muelbert, M. M. C., Ottersen, G., Pritchard, H., and Schuur, E. A. G.: Polar Regions, in: IPCC Special Report on the Ocean and Cryosphere in a Changing Climate, edited by: Pörtner, H.-O., Roberts, D. C., Masson-Delmotte, V., Zhai, P., Tignor, M., Poloczanska, E., Mintenbeck, K., Alegría, A., Nicolai, M., Okem, A., Petzold, J., Rama, B., and Weyer, N. M., https://doi.org/10.1017/9781009157964, Cambridge University Press, 2022.
Meromy, L., Molotch, N. P., Link, T. E., Fassnacht, S. R., and Rice, R.: Subgrid variability of snow water equivalent at operational snow stations in the western USA, Hydrol. Process., 27, 2383–2400, https://doi.org/10.1002/hyp.9355, 2013.
Meyer, J. D. D., Jin, J., and Wang, S.-Y.: Systematic Patterns of the Inconsistency between Snow Water Equivalent and Accumulated Precipitation as Reported by the Snowpack Telemetry Network, J. Hydrometeorol., 13, 1970–1976, https://doi.org/10.1175/JHM-D-12-066.1, 2012.
Mortimer, C. and Vionnet, V.: Northern Hemisphere historical in-situ Snow Water Equivalent dataset (NorSWE, 1979–2021) (3.0), Zenodo [data set], https://doi.org/10.5281/zenodo.15263370, 2025.
Mortimer, C., Mudryk, L., Derksen, C., Luojus, K., Brown, R., Kelly, R., and Tedesco, M.: Evaluation of long-term Northern Hemisphere snow water equivalent products, The Cryosphere, 14, 1579–1594, https://doi.org/10.5194/tc-14-1579-2020, 2020.
Mortimer, C., Mudryk, L., Derksen, C., Brady, M., Luojus, K., Venäläinen, P., Moisander, M., Lemmetyinen, J., Takala, M., Tanis, C., and Pulliainen, J.: Benchmarking algorithm changes to the Snow CCI+ snow water equivalent product, Remote Sens. Environ., 274, 112988, https://doi.org/10.1016/j.rse.2022.112988, 2022.
Mortimer, C., Mudryk, L., Cho, E., Derksen, C., Brady, M., and Vuyovich, C.: Use of multiple reference data sources to cross-validate gridded snow water equivalent products over North America, The Cryosphere, 18, 5619–5639, https://doi.org/10.5194/tc-18-5619-2024, 2024.
Mudryk, L., Santolaria-Otín, M., Krinner, G., Ménégoz, M., Derksen, C., Brutel-Vuilmet, C., Brady, M., and Essery, R.: Historical Northern Hemisphere snow cover trends and projected changes in the CMIP6 multi-model ensemble, The Cryosphere, 14, 2495–2514, https://doi.org/10.5194/tc-14-2495-2020, 2020.
Mudryk, L., Mortimer, C., Derksen, C., Elias Chereque, A., and Kushner, P.: Benchmarking of snow water equivalent (SWE) products based on outcomes of the SnowPEx+ Intercomparison Project, The Cryosphere, 19, 201–218, https://doi.org/10.5194/tc-19-201-2025, 2025.
Musselman, K. N.: Daily snow water equivalent (SWE) observations from 1065 stations in western North America for years 1960–2019, Zenodo [data set], https://doi.org/10.5281/zenodo.4546864, 2021.
Painter, T. H., Berisford, D. F., Boardman, J. W., Bormann, K. J., Deems, J. S., Gehrke, F., Hedrick, A., Joyce, Laidlaw, M. R., Marks, D., Mattmann, C., McGurk, B., Ramirez, P., Richardson, M., Skiles, S. M., Seidel, F. C., and Winstral, A.: The Airborne Snow Observatory: Fusion of scanning lidar, imaging spectrometer, and physically-based modeling for mapping snow water equivalent and snow albedo, Remote Sens. Environ., 184, 169–152, https://doi.org/10.1016/j.rse.2016.06.018, 2016.
Paquet, E., Laval, M., Basalaev, L. M., Belov, A., Eroshenko, E., Kartyshov, V., Struminsky, A., and Yanke, V.: An Application of Cosmic-Ray Neutron Measurements to the Determination of the Snow Water Equivalent, in: Proceedings of the 30th International Cosmic Ray Conference, Merida, Mexico, 3–11 July 2008, https://indico.nucleares.unam.mx/event/4/session/39/contribution/1000/material/paper/0.pdf (last access: 21 September 2021), 2008.
Pirazzini, R., Leppänen, L., Picard, G., López-Moreno, J. I., Marty, C., Macelloni, G., Kontu, A., von Lerber, A., Tamis, C. M., Schneebeli, M., de Rosnay, P., and Arslan, A. N.: European In-Situ Snow Measurements: Practices and Purposes, Sensors-Basel, 18, 2016, https://doi.org/10.3390/s18072016, 2018.
Pokorny, S., Stadnyk, T. A., and Ali, G.: Evaluating Operational Risk in Environmental Modeling: Assessment of Reliability and Sharpness for Ensemble Selection, J. Hydrol. Eng., 28, 8, https://doi.org/10.1061/JHYEFF.HEENG-5833, 2023.
Pomeroy, J. W. and Gray, D. M.: Snowcover accumulation relocation and management, National Hydrology Research Institute Science Rep. 7, 144 pp., https://hdl.handle.net/10388/15161 (last access: October 2024), 1995.
Pulliainen, J., Luojus, K., Derksen, C., Mudryk, L., Lemmetyinen, J., Salminen, M., Ikonen, J., Takala, M., Cohen, J., Smolander, T., and Norberg, J.: Patterns and trends of Northern Hemisphere snow mass from 1980 to 2018, Nature, 581, 294–298. https://doi.org/10.1038/s41586-020-2258-0, 2020.
Qin, Y., Abatzoglou, J. T., Siebert, S., Huning, L. S., AghaKouchak, A., Mankin, J. S., Hong, C., Tong, D., Davis, S. J., and Mueller, N. D.: Agricultural Risks from Changing Snowmelt, Nat. Clim. Change, 10, 459–465, https://doi.org/10.1038/s41558-020-0746-8, 2020.
Royer, A., Roy, A., Jutras, S., and Langlois, A.: Review article: Performance assessment of radiation-based field sensors for monitoring the water equivalent of snow cover (SWE), The Cryosphere, 15, 5079–5098, https://doi.org/10.5194/tc-15-5079-2021, 2021.
Shrestha, N. K., Seglenieks, F., Temgoua, A. G. T., and Dehghan, A.: The Impacts of Climate Change on Land Hydroclimatology of the Laurentian Great Lakes Basin, Front. Water, 4, 2022, https://doi.org/10.3389/frwa.2022.801134, 2022.
Smith, C. D., Kontu, A., Laffin, R., and Pomeroy, J. W.: An assessment of two automated snow water equivalent instruments during the WMO Solid Precipitation Intercomparison Experiment, The Cryosphere, 11, 101–116, https://doi.org/10.5194/tc-11-101-2017, 2017.
Snethlage, M. A., Geschke, J., Spehn, E. M., Ranipeta, A., Yoccoz, N. G., Körner, Ch., Jetz, W., Fischer, M., and Urbach, D.: A hierarchical inventory of the world's mountains for global comparative mountain science, Sci. Data, 9, 149, https://doi.org/10.1038/s41597-022-01256-y, 2022a.
Snethlage, M. A., Geschke, J., Spehn, E. M., Ranipeta, A., Yoccoz, N. G., Körner, Ch., Jetz, W., Fischer, M., and Urbach, D.: GMBA Mountain Inventory v2, GMBA-EarthEnv. [data set], https://doi.org/10.48601/earthenv-t9k2-1407 (last access: June 2023), 2022b.
Steiner, L., Studemann, G., Grimm, D. E., Marty, C., and Leinss, S.: (Near) Real-time snow water equivalent observation using GNSS refractometry and RTKLIB, Sensors-Basel, 22, 6918, https://doi.org/10.3390/s22186918, 2022.
Stone, D. C.: Application of median filtering to noisy data, Can. J. Chem., 73, 1573–1581, https://doi.org/10.1139/v95-195, 1995.
Stranden, H. and Saloranta, T.: NVE's snow reference datasets for climate change studies, 6 pp., last updated December 2021, https://www.nve.no/media/13163/nve_snow_reference_datasets_2021.pdf (last access: February 2025), 2021.
Stranden, H. B. and Grønsten, H. A.: Filefjell forskningsstasjon: Evaluering av måledata for snø, sesongene 2009/2010 og 2010/2011, NVE rapport 23/2011, 2011.
Stranden, H. B., Haugen, T., Skaugen, T., and Møen, K.: Design and Performance of the NVE Snow Scales, Cold Reg. Sci. Technol., 217, 104039, https://doi.org/10.1016/j.coldregions.2023.104039, 2024.
Stranden, H. N., Lirbuh, B., and Møen, K. M.: Recommendations for automatic measurements of snow water equivalent in NVE, Report no. 96 – 2015, Norwegian Water Resources and Energy Directorate, Oslo, Norway, 35 pp., ISBN 978-82-410-1148-1, 2015.
Sturm, M. and Liston, G. E.: Revisiting the global seasonal Snow classification: an updated dataset for earth system applications, J. Hydrometeorol., 22, 2917–2938, https://doi.org/10.1175/JHM-D-21-0070.1, 2021.
Sturm, M., Taras, B., Liston, G., Derksen, C., Jonas, T., and Lea, J.: Estimating snow water equivalent using snow depth data and climate classes, J. Hydrometeorol. 11, 1380–1394, https://doi.org/10.1175/2010JHM1202.1, 2010.
Sturm, M., Goldstein, M. A., and Parr, C.: Water and Life from Snow: A Trillion Dollar Science Question, Water Resour. Res., 53, 3534–3544, https://doi.org/10.1002/2017WR020840, 2017.
Sun, H., Fang, Y., Margulis, S. A., Mortimer, C., Mudryk, L., and Derksen, C.: Evaluation of the Snow Climate Change Initiative (Snow CCI) snow-covered area product within a mountain snow water equivalent reanalysis, The Cryosphere, 19, 2017–2036, https://doi.org/10.5194/tc-19-2017-2025, 2025.
Sun, N., Yan, H., Wigmosta, M., Skaggs, R., Leung, R., and Hou, Z.: Regional snow parameters estimation for large-domain hydrological applications in the western United States, J Geophys. Res.-Atmos., 124, 5296–5313, https://doi.org/10.1029/2018JD030140, 2019.
Thornton, J. M., Palazzi, E., Pepin, N. C., Cristofanelli, P., Essery, R., Kotlarski, S., Giuliani, G., Guigoz, Y., Kulonen, A., Pritchard, D., Li, X., Fowler, H. J., Randin, C. F., Shahgedanova, M., Steinbacher, M., Zebisch M., and Adler, C.: Toward a Definition of Essential Mountain Climate Variables, One Earth, 4, 805–827, https://doi.org/10.1016/j.oneear.2021.05.005, 2021.
Tian, X., Lu, C., Song, Z., An, C., Wan, S., Peng, H., Feng, Q., and Chen, Z.: Quantifying weather-induced unreliable public transportation service in cold regions under future climate model scenarios, Sustain. Cities Soc., 113, 105660, https://doi.org/10.1016/j.scs.2024.105660, 2024.
United States Department of Agriculture National Resources Conservation Servies: Title 210-National Engineering Handbook, Part 622 Snow Survey and Water Supply Forecasting, 210-VI-NEH, Chap. 2: Data Parameters. Amendment 43, US Department of Agriculture, Washington, DC, https://directives.sc.egov.usda.gov/landingpage/46ec6eaf-5d3b-432a-a0e0-df8e7c5cab98 (last access: November 2024), 2012.
Venäläinen, P., Luojus, K., Lemmetyinen, J., Pulliainen, J., Moisander, M., and Takala, M.: Impact of dynamic snow density on GlobSnow snow water equivalent retrieval accuracy, The Cryosphere, 15, 2969–2981, https://doi.org/10.5194/tc-15-2969-2021, 2021.
Venäläinen, P., Luojus, K., Mortimer, C., Lemmetyinen, J., Pulliainen, J., Takala, M., Moisander, M., and Zschenderlein, L.: Implementing spatially and temporally varying snow densities into the GlobSnow snow water equivalent retrieval, The Cryosphere, 17, 719–736, https://doi.org/10.5194/tc-17-719-2023, 2023.
Vershinina, L.: Assessment of the accuracy in determining water equivalent of snow cover, in: Determination of the water equivalent of snow cover, Keter Press, Jerusalem, 100–127, ISBN 7065 1090 9, 1971.
Vershinina, L. and Volchenko, V.: Maximum water equivalents of snow in the northwestern regions of the European USSR, Soviet Hydrology, 13, 1–11, 1974.
Vionnet, V., Fortin, V., Gaborit, E., Roy, G., Abrahamowicz, M., Gasset, N., and Pomeroy, J. W.: Assessing the factors governing the ability to predict late-spring flooding in cold-region mountain basins, Hydrol. Earth Syst. Sci., 24, 2141–2165, https://doi.org/10.5194/hess-24-2141-2020, 2020.
Vionnet, V., Mortimer, C., Brady, M., Arnal, L., and Brown, R.: Canadian historical Snow Water Equivalent dataset (CanSWE, 1928–2020), Earth Syst. Sci. Data, 13, 4603–4619, https://doi.org/10.5194/essd-13-4603-2021, 2021.
Vionnet, V., Verville, M., Fortin, V., Brugman, M., Abrahamowicz, M., Lemay, F., Thériault, J. M., Lafaysse, M., and Milbrandt, J. A.: Snow level from post-processing of atmospheric model improves snowfall estimate and snowpack prediction in mountains, Water Resour. Res., 58, e2021WR031778, https://doi.org/10.1029/2021WR031778, 2022.
Vionnet, V., Mortimer, C., Brady, M., Arnal, L., and Brown, R.: Canadian historical Snow Water Equivalent dataset (CanSWE, 1928–2023) (Version v6), Zenodo [data set], https://doi.org/10.5281/zenodo.10835278, 2024.
Vogel, R. M., Carroll, T. R., and Carroll, S. S.: Simulation of airborne snow water equivalent measurement errors made over a forest environment, Proceedings of symposium Watershed management in the eighties, edited by: Jones, B. and Ward, T. J., 30 April–1 May, Denver, Colorado, USA, American Society of Civil Engineers, 248=-255, ISBN 0-87262-449-8, 1985
WMO (Ed.): Guide to instruments and methods of observation: Volume II – Measurement of Cryospheric Variables, 2024 edition, World Meteorological Organization, Geneva, WMO-No. 8, 52 pp., https://doi.org/10.59327/WMO/CIMO/2, 2024.
WMO (Ed.): Manual on Codes: International codes Volume 1.2, Annex II to the WMO Technical Regulations, Part B – Binary Codes; Part C – Common Features to Binary and Alphanumeric Codes, WMO-No.-306, 2025 Edn., World Meteorological Organization WMO, Geneva, Switzerland, ISBN 978-92-63-10306-2, 2025.
Yan, H., Sun, N., Wigmosta, M., Skaggs, R., Hou, Z., and Leung, R.: Next-generation intensity-duration-frequency curves for hydrologic design in snow-dominated environments, Water Resour. Res., 54, 1093–1108, https://doi.org/10.1002/2017WR021290, 2018.
Zeng, X., Broxton, P., and Dawson, N.: Snowpack change from 1982 to 2016 over Conterminous United States, Geophys. Res. Lett., 45, 12940–12947, https://doi.org/10.1029/2018GL079621, 2018.
- Abstract
- Introduction
- SWE measurement methods included
- Data cleaning and formatting
- Quality control
- Merging the datasets
- Dataset summary
- Dataset usage
- Gaps and limitations
- Data availability
- Conclusion
- Appendix A: Uses of CanSWE and NorSWE v1
- Author contributions
- Competing interests
- Disclaimer
- Acknowledgements
- Review statement
- References
- Supplement