the Creative Commons Attribution 4.0 License.
the Creative Commons Attribution 4.0 License.
 | 28 Jul 2025
A revisiting of early 18th-century environmental data to identify Gulf of Lion properties before the industrial era
Marina Locritani
Sara Garvani
Giancarlo Tamburello
Antonio Guarnieri
Giuseppe Manzella
The work Histoire physique de la mer, authored by Luigi Ferdinando Marsili (or Marsigli) and published in 1725, is one of the earliest texts detailing observations of the physical, biological, and bathymetric characteristics of the sea, mainly concentrating on the Gulf of Lion in southern France's Mediterranean area. Nonetheless, understanding Marsili's findings is difficult due to the application of non-standard measurement units and the imprecision of georeferencing data. The MACMAP project (A Multidisciplinary Analysis of Climate Change Indicators in the Mediterranean and Polar Regions), which is funded by the Istituto Nazionale di Geofisica e Vulcanologia, has involved a thorough recalibration of Marsili's observations. This project focused on transforming water weight measurements obtained from different locations in the Gulf of Lion from June 1806 to January 1807 into water density values. The sampling sites were digitised, bathymetric profiles were reconstructed, and tide amplitudes were examined. The main objective is to make these historical data available to compare with current measurements. The data are available under the following DOIs: http://oceano.bo.ingv.it/erddap/search/index.html?page=1&itemsPerPage=1000&searchFor=marsili (Locritani et al., 2024b), https://doi.org/10.13127/histoiremarsili/sealevel (Locritani et al., 2024a), and https://doi.org/10.13127/histoiremarsili/waterdensity (Locritani and Garvani, 2024).
- Article
(8872 KB) - Full-text XML
- BibTeX
- EndNote


The study of oceanography took a methodological turn with the “recommendations” made in 1666 (Moray and Hooke, 1666), which emphasised the need for “diligent” observations from “masters of ships, pilots, and other fit individuals during their sea voyages”. These recommendations outlined various measures, along with the methodologies and technologies that should be employed. A significant enhancement to the concept of “diligent observations” at sea was introduced by Luigi Ferdinando Marsili, a member of the Société Royale des Sciences de Montpellier, who stressed the importance of a robust sampling strategy to analyse the “physical nature of the sea”. Marsili's contributions to oceanography were largely recognised again during the 300th anniversary of his birth, thanks primarily to Olson and Olson (1958), “Luigi Ferdinando Marsigli, the lost father of oceanography”, as well as Margaret Deacon's book (Deacon, 1971).
Marsili led a dynamic life as a traveller, soldier, and scientist (see Appendix B for more details). His most renowned work, Osservazioni Interne al Bosforo Tracio (1681), outlines the two-layer circulation model that later elucidated the flow into and out of the Gibraltar Strait. Also significant is Histoire physique de la mer (Marsili, 1725), an extensively illustrated publication offering invaluable historical and scientific insights into the Gulf of Lion (the digital version of this volume can be accessed here: https://www.google.it/books/edition/Histoire_physique_de_la_mer/RpsSxRY4bRcC, last access: 17 July 2025).
Marsili was affiliated with the Paris Académie Royale des Sciences and the Royal Society of London. He greatly admired Robert Boyle but was critical of Boyle's work De fundo maris, which he addressed in the first chapter of the Histoire, where he asserted the necessity of verifying observations without dismissing sailors' theories. To fully grasp the innovative concepts in the Histoire, one must understand the author's discussions with other Académie des Sciences de Paris members. Initially, Marsili believed that stony formations like coral and Madrepores were not true plants (contrary to the views of Joseph Pitton de Tournefort and others), but rather “drips” created by the sea's viscous material (Archives Départementales de l'Héraut; Memoires de la Société Royale in Histoire de la Société royale des sciences établie à Montpellier, 1778), as noted by McConnell (1990). Through his observations, Marsili ultimately realised his assumption was mistaken. However, it is crucial to acknowledge his investigative approach, grounded in the Baconian framework of science, which posits that understanding nature begins with collecting and methodically examining facts. To assess coral growth and explore those “drips” or “coral milk”, he conducted physical measurements of various sea properties, including sea level, currents, and water density.
Marsili's goals extended beyond simply determining whether corals were flowers or something different. He sought to create a comprehensive natural history of the sea, its seabed, wind effects, and fish characteristics. His ambition was to compile a significant treatise on the Earth's organic structure. A key component of this research involved studying lakes and sea structures, underpinned by the belief in a morphological and lithological connection between mountains and the seabed, all vital for his theoretical development. “My intention […] is to show the organic structure of the Earth” (first chapter of the Histoire, dedicated to the marine basin). Marsili explored the Languedoc mountains, but while this research remained unpublished, his investigations of the sea first culminated in the Brieve ristretto (Marsili, 1711), an essay printed in Venice, and later in the Histoire of 1725.
This is not the first time that Marsili's measurements have been analysed by comparing them with contemporary data. This comparison supports the accuracy and meticulousness of the Bolognese general's data collection methods. The seawater weight data gathered by Marsili in the Constantinople Channel, as detailed in Osservazioni intorno al Bosforo Tracio, were examined by Soffientino and Pilson (2005). Their analysis indicated that Marsili's findings were inconsistent with current data because they were treated as salinity data before being adjusted to align with the figures in Zupko's work (Zupko, 1981). In contrast, Pinardi et al. (2018) interpreted the Bosphorus seawater weight data as density data, finding them consistent with modern measurements.
The data contained in the Marsili book and re-analysed in this paper could be used for the study of environmental changes (natural/man-induced) (Adamson, 2015; Adamson et al., 2018; Wilkinson et al., 2011), with the awareness of the error that occurs in the measurements, or for comparison with other historical data taken in other places (Camuffo and Sturaro, 2003, 2004; Camuffo, 2023; Folland and Parker, 1995).
This paper compares physical data – seawater weight, bathymetric profiles, and sea level variations – found in Histoire physique de la mer to current measurements. This research is part of the MACMAP project (A Multidisciplinary Analysis of Climate Change Indicators in the Mediterranean and Polar Regions), which receives funding from the Istituto Nazionale di Geofisica e Vulcanologia.
Data on seawater weight from the Histoire physique de la mer were transformed into density values using details from the book's preface (Marsili, 1725). A specific, unnumbered page in the preface states
J'ai pesé les Corps solides avec la Balance ordinaire, mais très-exacte, me servant de la livre composée de douze onces, l'once de huit dragmes, & la de la dragme de soixante grains; & les fluides avec l'Areometre de erre, de la forme, grandeur, & poids que l'on trouvera décrits. [I have weighed solid bodies with ordinary scales, but very accurately, using the twelve-ounce pound, the eight-ounce dragme, and the sixty-grain dragme; and fluids with the Areometer, of the shape, size and weight that will be described.]
The locations of the sampling stations were determined using maps and georeferenced within a geographic system, facilitating a comparison between Marsili's data and contemporary measurements from the exact locations. Marsili's water samples represent one of the earliest examples of modern field sampling. He employs a methodical approach that aligns with the reproducibility principle of measurements, enabling comparisons between 17th-century-collected data and current datasets (Pinardi et al., 2018).
The bathymetric profiles illustrated in Table III of Histoire have been digitised and contrasted with the transects presented in Table II, which have been georeferenced for this study. The findings have been analysed alongside “modern” data. Variations in sea level listed in Tables X and XI of Histoire have also been examined and compared with “modern” data.
2.1 The Histoire physique de la mer
Luigi Ferdinando Marsili's Histoire physique de la mer details the physical, biological, and bathymetric attributes of the Provençal coastal region up to the shelf break. Across all his works, from the Opus danubialis to the Histoire physique de la mer, Marsili embraced a humble yet ambitious “Baconian” approach to science. During his tenure as a military engineer, he undertook comprehensive scientific studies that equipped him with a systematic method, which became particularly beneficial after settling on France's southern coast in 1706. While engaged in maritime research, he authored a treatise on the seabed and its waters, dedicating a significant portion to corals and other lithophytes erroneously identified as plants.
The Histoire was initially printed across 173 pp., featuring 40 plates depicting animals, minerals, fossils, and plants, presented as 12 fold-out plates containing large-scale data, maps of the Gulf of Lion, and coastal profiles. Luigi Ferdinando Marsili employed a strong methodology for obtaining quantitative, well-organised in situ seawater density measurements, including precise time and location specifications. Marsili's primary instruments for data collection consisted of a thermometer, an areometer to assess water weight, a sampler for surface and depth water collection, a “depth gauge”, and a metered pole for evaluating sea level variations.
2.1.1 Bathymetry and sea level
In the first chapter, Du Bassin (Marsili, 1725) illustrates the bathymetry using graphs that detail the continental shelf's edge. Marsili measured the Gulf of Lion's depth at 14 points, which he represented on a bathymetric chart. These findings allowed him to outline both the seabed and coastal profiles. This volume contains the initial map of the Gulf of Lion, showcasing the bathymetric slope that separates the continental shelf from the abyssal plain (Table I, p. 3, titled Carte du Golfe del Lion entre le Cap Sisie en Provence et le Cap de Quiers en Roussillon; see Fig. 1). Another map depicts the coastline from Cap Canaille to the Croisette and the nearby islands within Cassis' territory in Provence (Carte Particuliere de la Coste, Table II, p. 4; see Fig. 2). Bathymetric profiles can be found in Table III, p. 4 (Profils ou Coupes du Bassin de la Mer), Table IV, p. 4 (Profils ou Coupes du Bassin de la Mer sur la Coste de Provence), and Table V, p. 7 (Porte Miou). In the volume's preface, Marsili credits the prior research that informed his reconstruction of the Gulf of Lion's bathymetry, including De Basville's study of the Languedoc coast and De Chazelles' map of Provence and Roussillon, the latter of whom was also an Engineer des Galères and a member of the Paris Academy of Sciences and a hydrography professor in Marseilles.
Marsili determined the depth using a traditional method involving a weight on a graduated rope. He heavily relied on measurements provided by fishermen, who would say “the abyss has no bottom” (l'Abîme n'a point de fond) when depths were beyond their measuring lines. Marsili considered this saying inaccurate, as he aligned with the prevailing thought of his time that sea bathymetry reflected terrestrial altimetry.
To gauge changes in sea level near a coastal section and the Cassis Sea basin, Marsili employed a metered pole. From 4 January to 9 April 1707, he recorded the water's elevations and depressions at various times. He details his study of sea level variation conducted at Cassis port in the third chapter of Histoire.
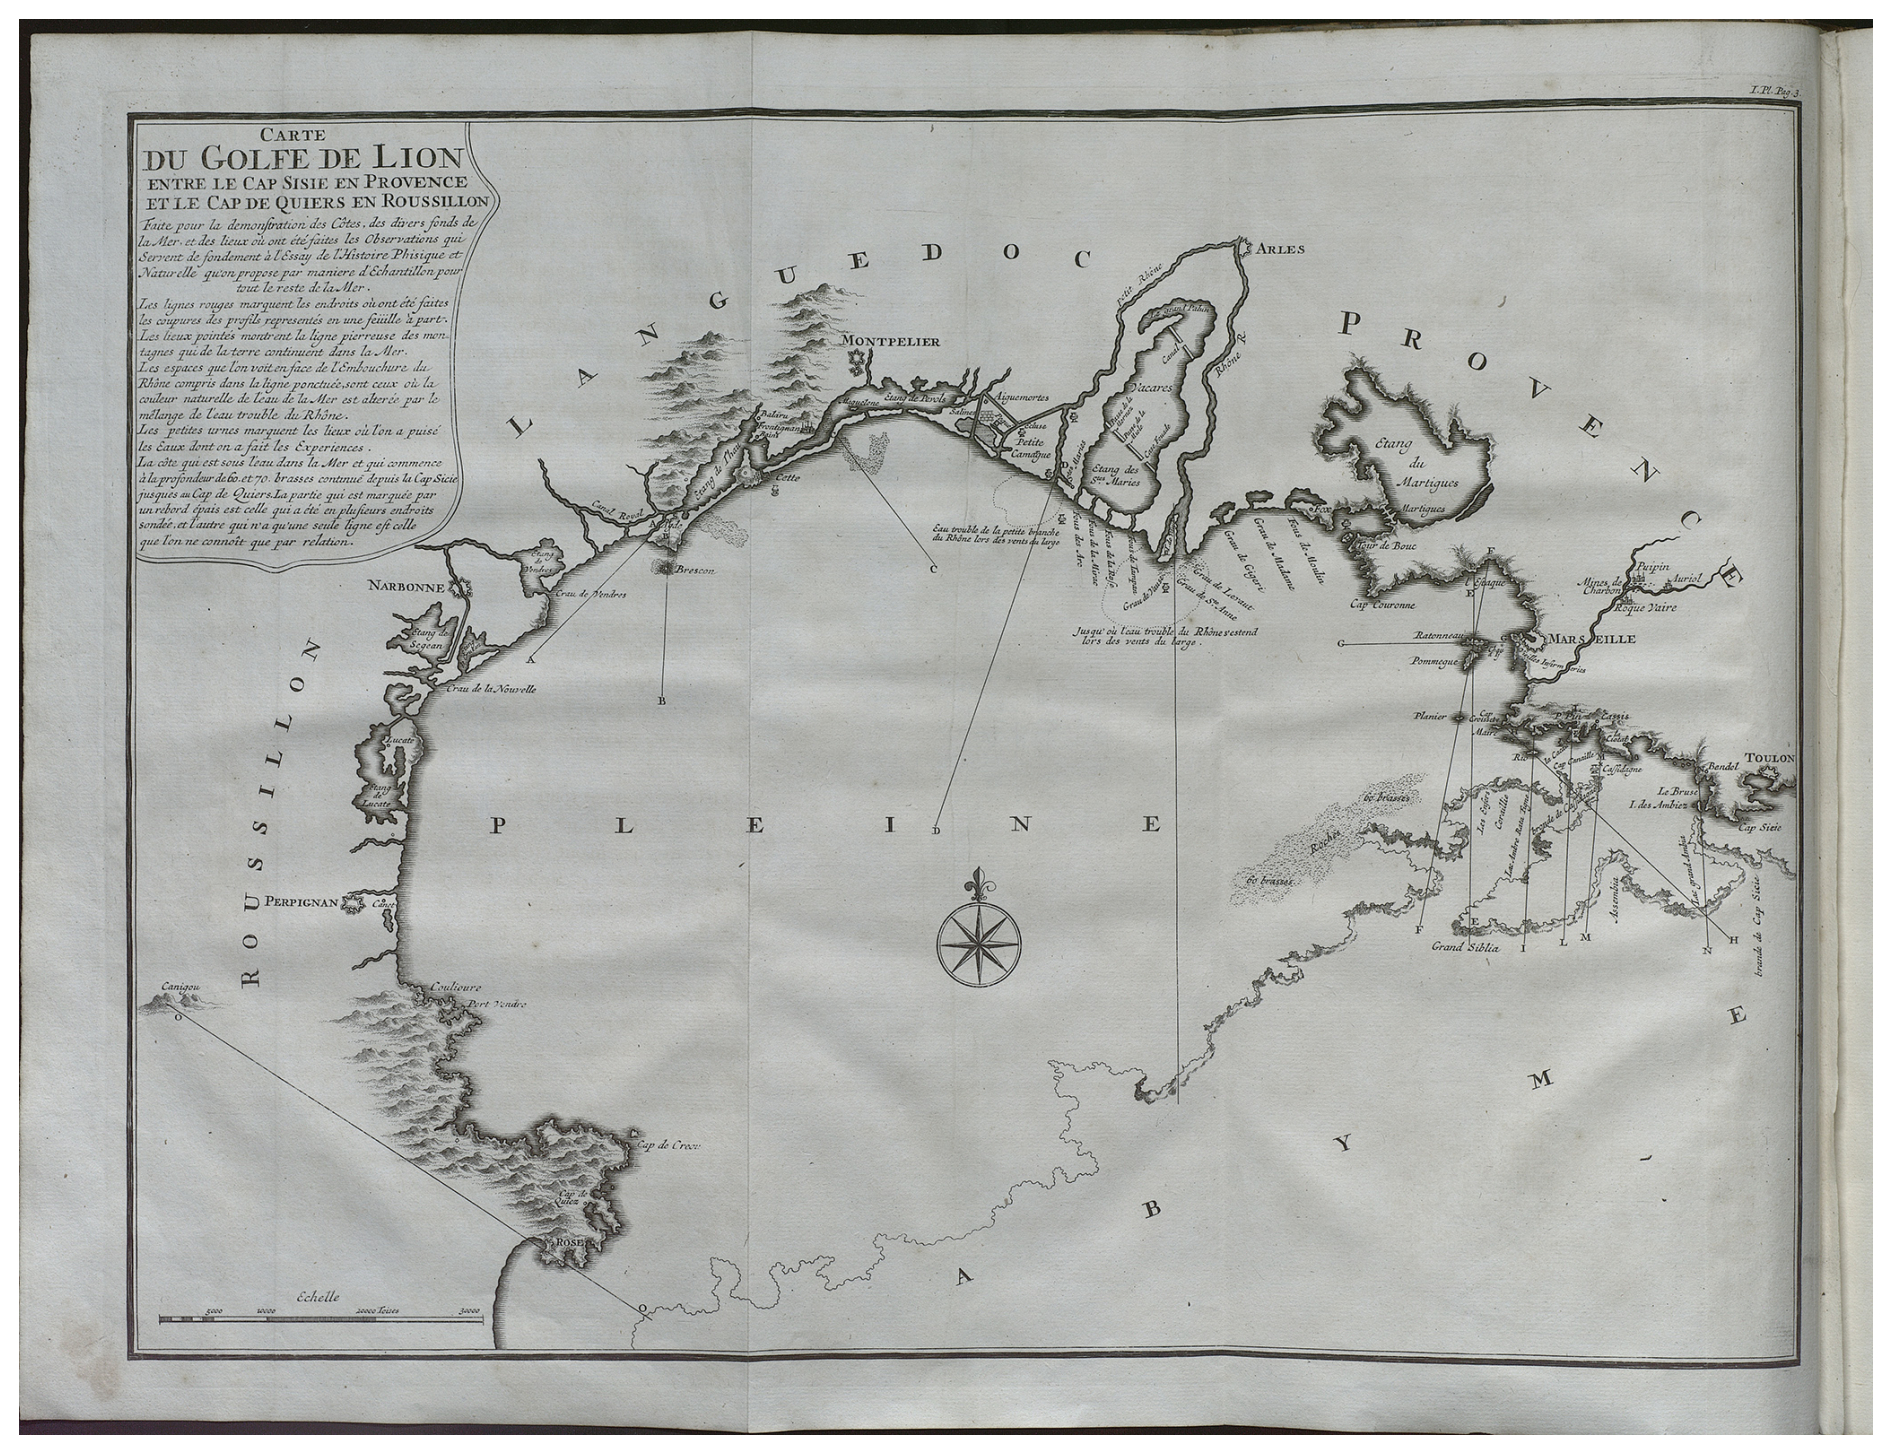
Figure 1Maps included in Histoire physique de la mer in Carte du Golfe del Lion entre le Cap Sisie en Provence et le Cap de Quiers en Roussillon (Table I, p. 3).
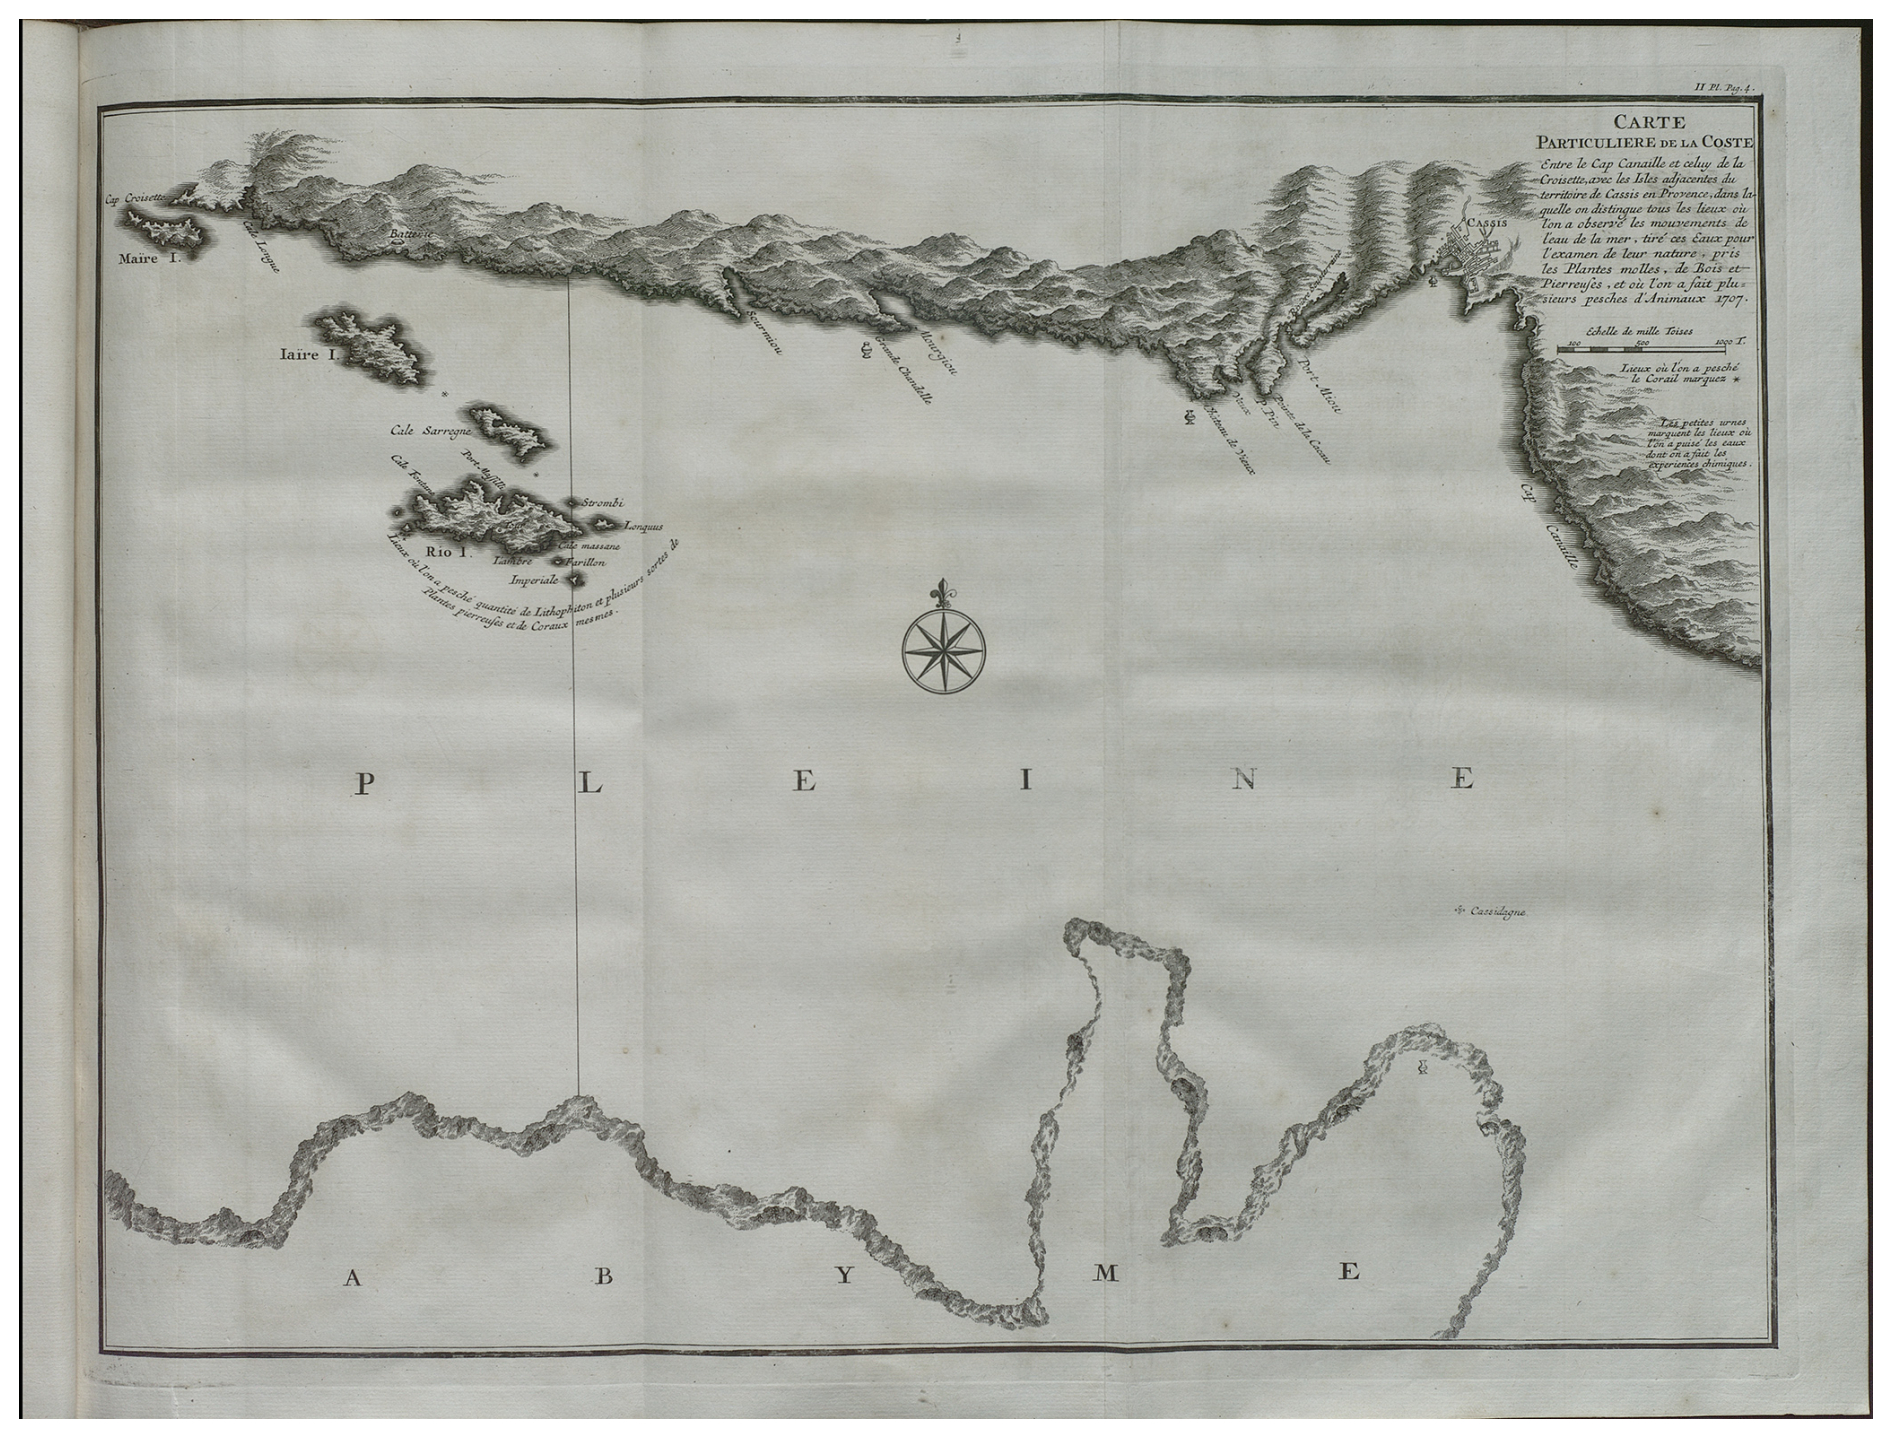
Figure 2Maps included in Histoire Physique de la Mer in Carte Particuliere de la Coste, Table II, p. 4.
2.1.2 Physical characteristics
The Histoire details temperature and salinity, featuring illustrations of the instruments used and the data collection tables. Information on temperature can be found in Table VI (p. 16) titled des Experiences fautes avec le Thermometre dans la mer à differentes profondeurs. The seawater temperature was measured using a Florence thermometer, as suggested by Cotte (1774). Marsili likely utilised a three-hook wine-spirit thermometer, similar to those detailed by Camuffo (2020). Measurements were taken at the sea surface and various depths by securing the thermometer to a rope weighted appropriately. Marsili's thermometer was attached to a wooden board, featuring a double scale that is numbered in reverse: 1–55 and 55–1. The thermometer consisted of worked glass supported by three iron wires attached to the board. Two horizontal hooks were standard, located above and below, while an unusual third vertical hook at the top prevented the thermometer from sliding down (Cotte, 1774; Camuffo, 2020). Cotte was unable to convert the temperature readings from Marsili's scale to Reaumur units, and sadly, Marsili's thermometer was lost in a maritime conflict in 1707 with an enemy brig or pirate vessel. Consequently, the thermometer's scale remains unknown today, and we lack information about the duration for which the instrument was submerged, despite Marsili's meticulous record of the time immersion.
In Marsili's time, the concept of water density was understood in terms of sea gravity. As noted by Manzella et al. (2022), measurements of gravity and salinity were conducted using a known-sized vial with a narrow neck or a graduated glass tube. Gravity was assessed by weighing the water, while salinity was calculated based on the weight of the residue left after evaporation.
The water weight was gauged using the hydrostatic ampoule (also known as the hydrostatic carafe or areometer; see Locritani and Garvani, 2024, and Appendix B), which consists of a sealed glass sphere with a tapering neck (Montanari, 1696). Viviani, a student of Galileo, described the measurement process: the ampoules needed to include enough lead flakes so they would float in the liquid being assessed. Additional known-weight rings were placed on the neck until the ampoule was submerged. The weight of these rings that caused the ampoule to sink equaled the weight of the measured water. For further details, see Pinardi et al. (2018). Seawater samples were collected using a wooden container sealed with a valve. Marsili first weighed the seawater on board the vessel and then used a balance later in a lab. The reference water was sourced from a well near Marsili's lab in Cassis. Marsili gathered water samples between Cap Canaille and Cap Croisette, which he subsequently analysed in his lab using a thermometer and the hydrostatic ampoule or balance. The hydrostatic method involved measuring an object's weight by submerging it in a liquid of known weight. The second chapter includes tables and figures that present data on the weight of salty and fresh waters, a description of the areometer or hydrostatic ampoule, and the salt concentration in the water samples.
2.1.3 Vegetation
The fourth chapter of the Histoire, titled “De la vegetation des plantes”, is the largest section. It features 40 copper-engraved illustrations by Matthys Pool (1676–1740), depicting animals, minerals, fossils, and plants, all numbered with corresponding references in the text. This section includes many plates that portray corals, which Marsili classified as “plants”. Each plate indicates the location where the corals were discovered and describes how they were gathered by fishermen, along with the local names or those assigned by Marsili, as Linnaeus' nomenclature had not yet been adopted.
3.1 Bathymetry
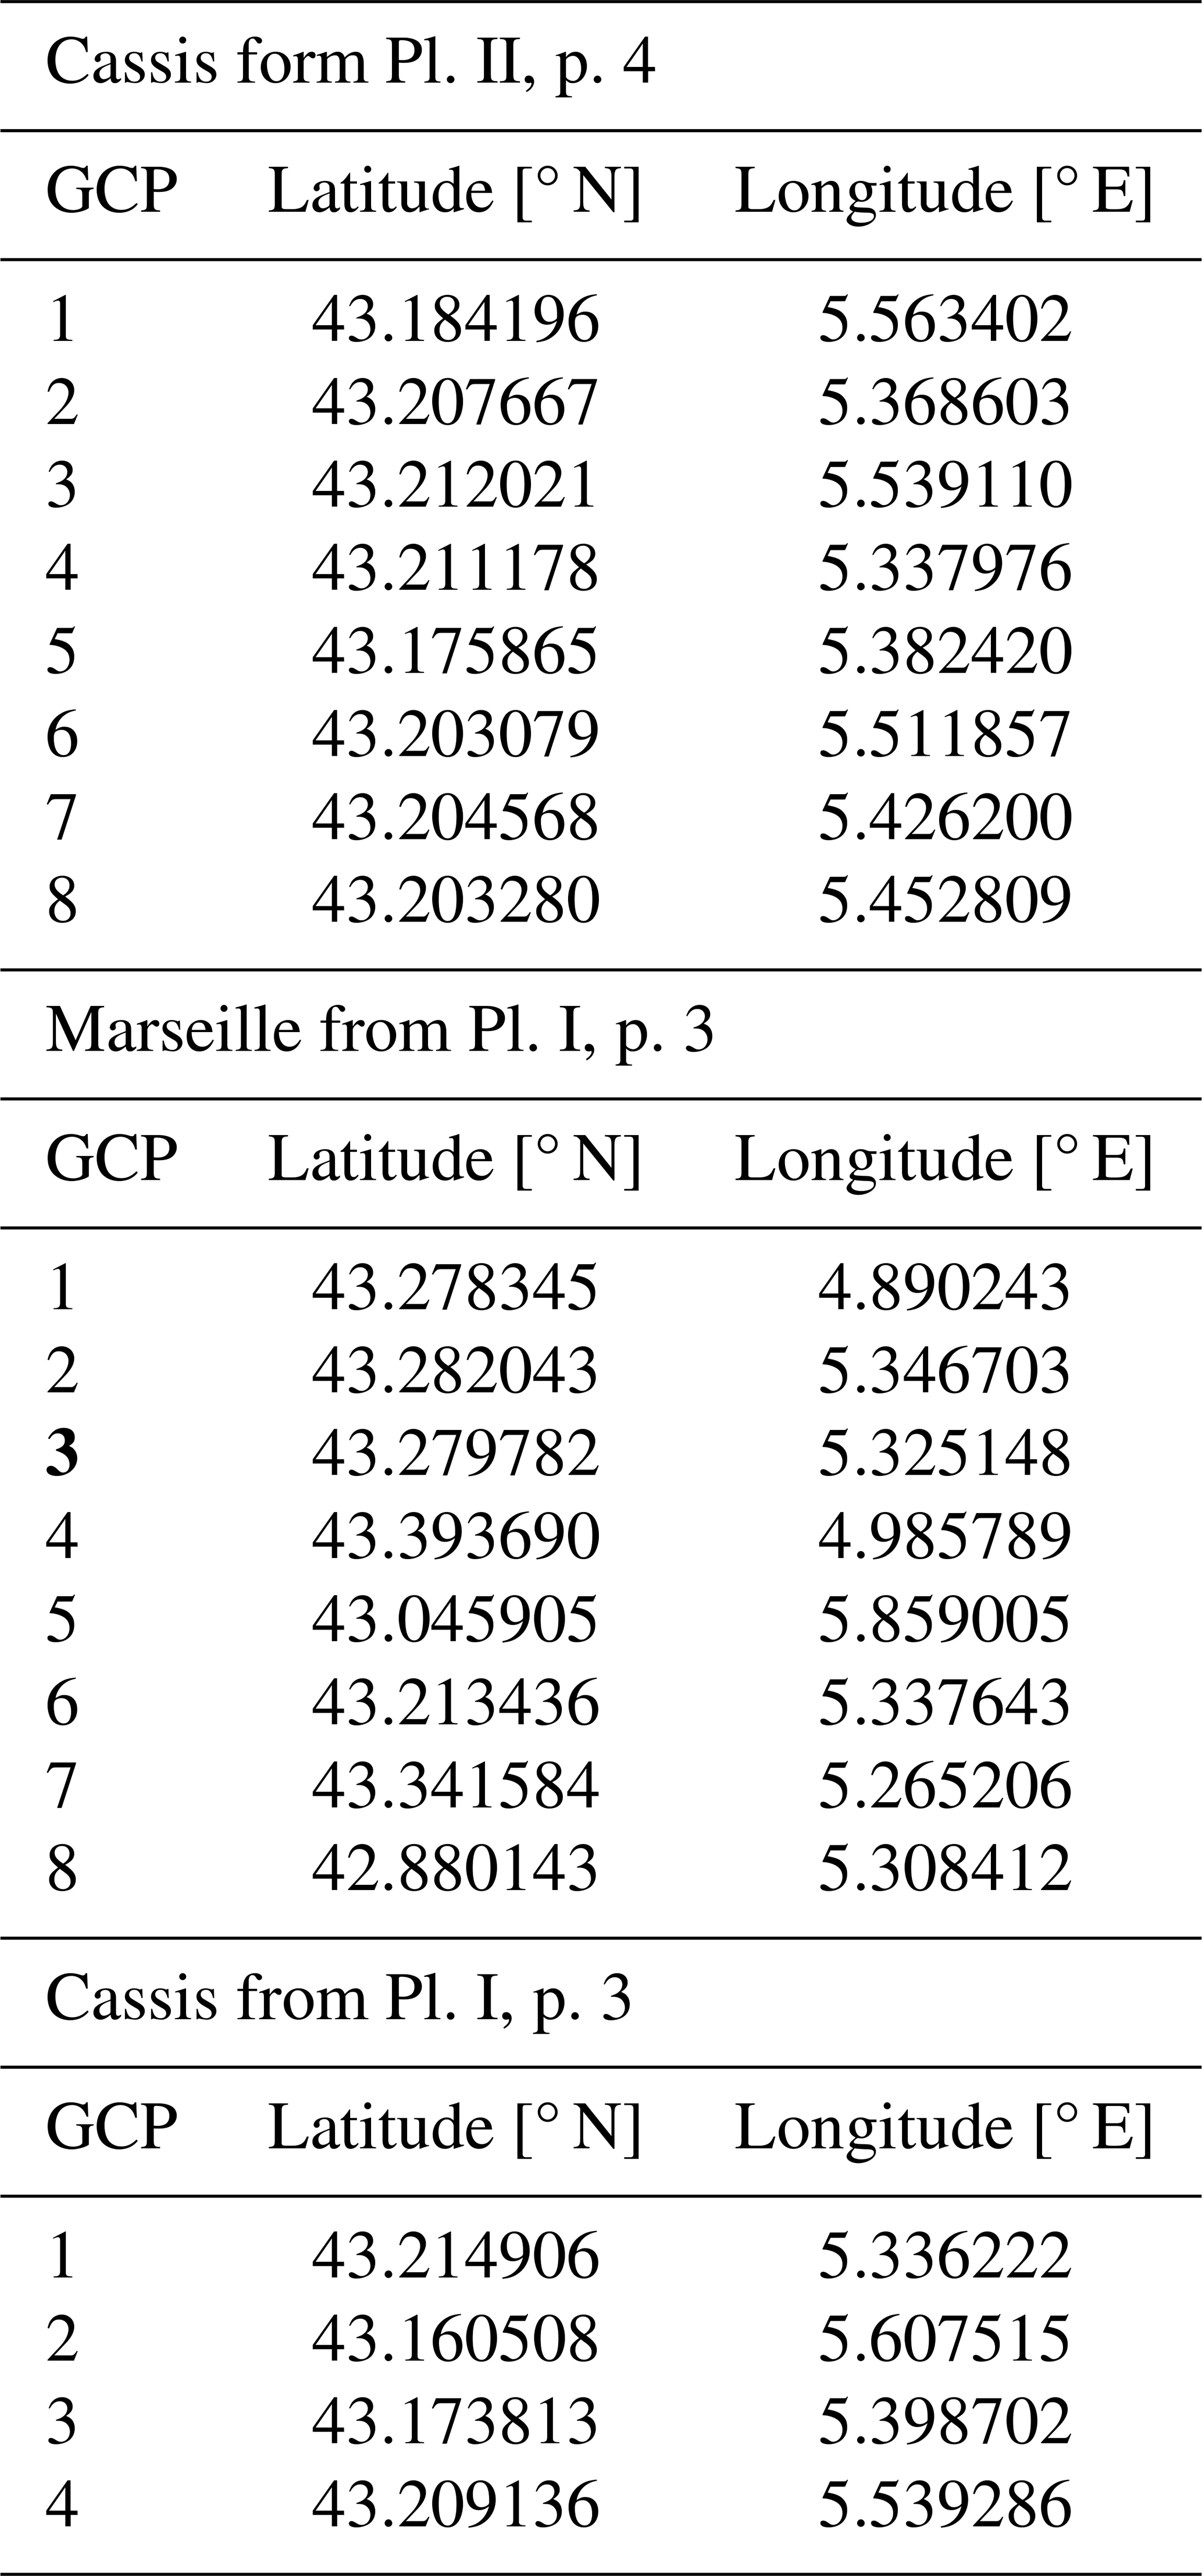
The initial step in extracting historically significant information from historical-geographical maps involves defining a set of immutable and identifiable ground control points (GCPs) for georeferencing them in QGIS and then digitising the sampling points. The scale of the Marsili distances is expressed in “toises” or “teses”, which correspond to 1.2 brasses marine (fathoms), an ancient unit of length roughly equal to 0.32 ft. or 1.95 m, and according to Angelo Martini's metrology manual, 1 m is approximately 0.001 mile marine (Martini, 1881). The direction and length of the transect propagation is measured in miles, nearly equivalent to nautical miles; specifically, 1 marine mile equals 1851 m, as noted by Martini (1881, p. 466). In the initial phase, lengths from the Marsili maps were obtained using Adobe Illustrator 2022 and compared with those in contemporary maps (Google Satellite in QGIS 3.22). The mean, standard deviation, and root mean square for lengths between pairs of GCPs from both the Marsili and Google Satellite maps were calculated in QGIS 3.22. Following recommendations by Hvizdák et al. (2023), a statistically adequate sample requires GCPs greater than 30, which poses challenges with historical maps. To align the ancient and modern maps more closely, a restricted area near Marseille (from Toulon to Port de Bouc) was selected, resulting in 8 GCPs being recorded and an additional 4 GCPs zoomed in on the Cassis area. The second map was entirely georeferenced using these 8 GCPs. The coordinates of the GCPs are detailed in Table 1. Subsequently, the maps were georeferenced in QGIS 3.22 applying “thin plate spline” interpolation and the “nearest neighbour” sampling method.
Table 1GCP used to georeferenced the Marsili maps (Gulf of Lion map – Pl. I, p. 3 in the Marseille coastal area and the Cassis coastal area and Cassis map – Pl. II, p. 4) in QGIS 3.2.
Additionally, the EMODnet_satellite_coastline_MSL (https://doi.org/10.12770/cf51df64-56f9-4a99-b1aa-36b8d7b743a1, EMODnet Bathymetry Consortium, 2024) has been superimposed onto the georeferenced historical maps. Upon completing this georeferencing, we could extrapolate the coordinates of the small urns and the positions of the transects.
The bathymetric profiles were digitised using WebPlotDigitizer (Rohatgi, 2017). The profile length in nautical miles (nmi) is indicated in the legend at the upper-right corner of the original figure. This facilitated the conversion of the horizontal length from pixels to nautical miles. The maps display lines representing transects along which Marsili conducted bathymetric measurements. Descriptions in the Histoire's tables provide starting points, total transect length, and depth measurements in fathoms in a few locations (brasses; 1 ftm is 1.624197 m, Martini, 1881); these data were used to convert the depths from pixels to metres. Some profiles lacked depth information; therefore, they were digitised in adimensional units (zero for sea level and −1 for the profile's maximum depth). To compare with current bathymetry, the spatial coordinates of the georeferenced transects from the maps were utilised to extrapolate bathymetric values from EMODnet (https://emodnet.ec.europa.eu/geoviewer/, last access: 17 July 2025) and Gebco 2023 (https://download.gebco.net/, last access: 17 July 2025) data in QGIS 3.22.
3.2 Sea level in Cassis
The Marsili sea level measurements were conducted not in a well but likely in a protected coastal area using a 68-pouce rod, referred to as an inch rod by Marsili (1 French inch is roughly 2.7 cm, according to Martini, 1881). A timing issue exists; the measurements lacked precise timestamps (e.g. measurements include sunrise, noon, sunset around 21:00 LT, and midnight). For the analysis, measurements from sunrise to sunset were assumed to be recorded at roughly 06:45, noon, 18:45, 21:00, and midnight. It is also assumed that each time point included two measurements (maximum and minimum) to mitigate wave effects through averaging.
A data series was created using Marsili's data from 5 January to 10 April 1707. The minimum and maximum values were averaged at each time interval, and then the mean was subtracted. The resultant series exhibited significant noise, leading to the application of multiple filters to identify key signals. A primary low-pass filter was introduced to smooth the time series. Notably, periodicities of about 5–7 and 13–14 d were observed, which may relate to atmospheric influences (Esposito and Manzella, 1982).
3.3 Density
Water weight measurements were recorded in ounces, drachmas, and grains. Maps marked the water sampling sites using the amphora symbol. To convert the weight to kg m−3, it was assumed that 1 pound corresponds to 12 ounces, 1 ounce to 8 drachmas, and 1 drachma to 60 grains (Marsili, 1725). The transformation formula used to convert weight to density is (Pinardi et al., 2018), where ρ represents the density of water in kg m−3; 1000 is the density of distilled water in kg m−3; P is the weight of seawater in grains as measured by Marsili; and Pr is the weight of reference water in grains taken from Plate VIII (p. 23) of the Histoire that shows the weights of distilled surface water, which Marsili uses as the reference water (1 ounce, 3 drachmas, 30 grains equivalent to 1000 kg m−3); see Table A1 in Appendix A. The minimum potential error in the measurements was assessed by considering values below 1000 kg m−3 for freshwater (such as rivers, fountains, and wells). These data have been compared with the water density measurements from SeaDataNet covering the same sites from 1990 to 2018.
4.1 Measurement sections: historical map analysis
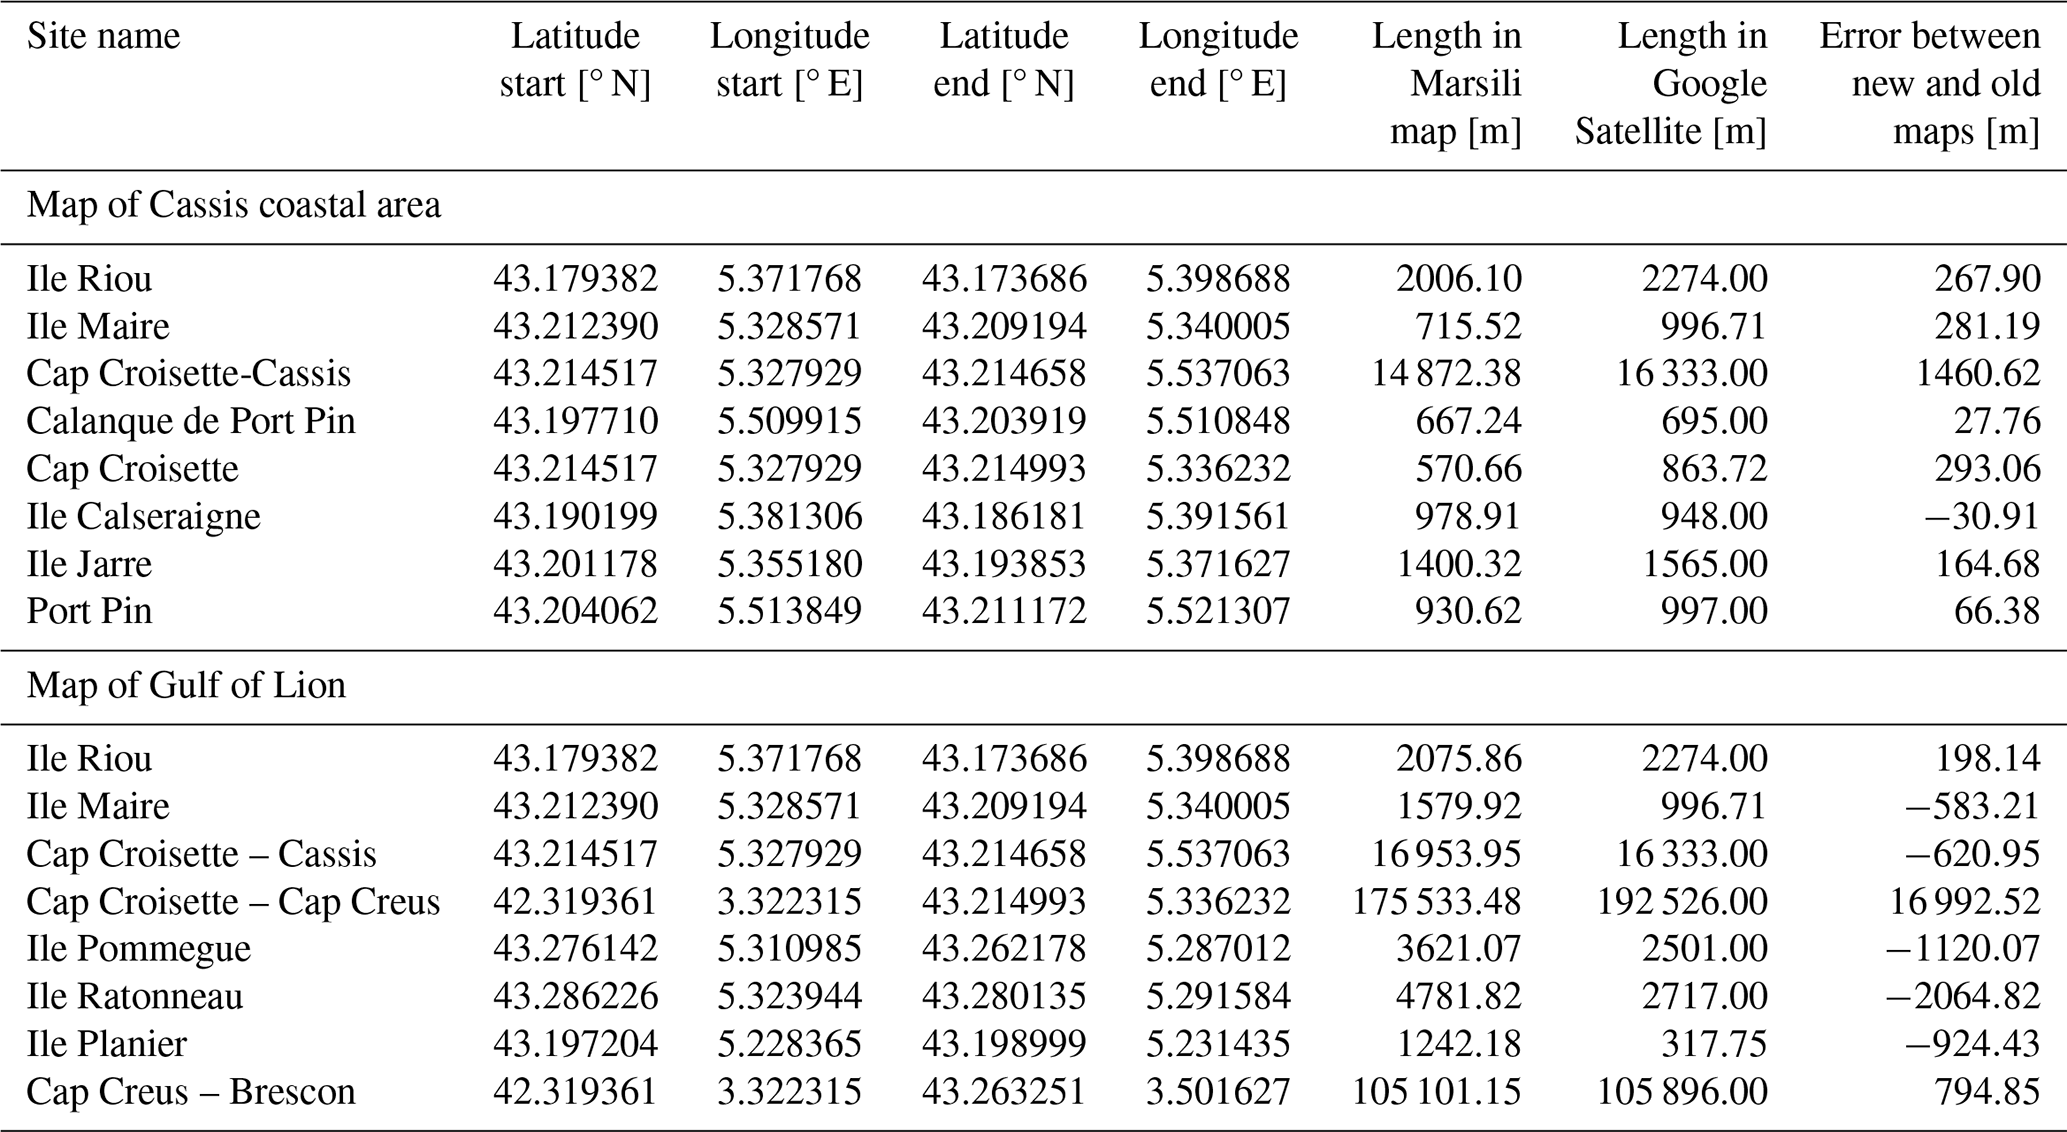
Marsili's maps include scales that indicate lengths of 10 000, 5000, 1000, 500, or 100 “teses”. Due to the numerous variations, it was necessary to evaluate the consistency within distances and then compute the lengths. Table 1 lists 20 GCPs selected for length calculations from the Marsili maps, showing the relative lengths measured between pairs of GCPs in both maps, along with the differences in lengths (errors). Table 2 presents the relative difference between lengths in the two different maps. The RMSE for lengths measured on the Gulf du Lion map is 6087 m, while for the lengths measured on Cassis map it is 548 m. The errors are uneven as highlighted by Table 2. Improved results are achieved by remapping the coastline and bathymetric lines for more localised areas (refer to Fig. A1 in Appendix A). This adjustment reduces the error, resulting in a comparison with EMODnet coastlines and bathymetric lines showing an error of 631.38 ± 559.72 m for the Gulf of Lion and 163.83 ± 157.33 m for the Cassis area.
Table 2Comparison between the lengths measured in the Marsili maps (Gulf of Lion map – Pl. I, p. 3; Cassis map – Pl. II, p. 4) and a modern map (Google Satellite in QGIS 3.2). The first column lists the names of the 16 sites (the first 8 in the Cassis map – Pl. II, p. 4; the second eight in the Gulf du Lion map – Pl. I, p. 3). The second to fifth columns indicate the starting and ending points coordinates, the sixth and seventh columns indicate the lengths measured in the Marsili and Google Satellite maps, and the last column reports the relative difference between lengths.
4.2 Bathymetry: profiles
Figure 3 illustrates the transects design from Marsili's maps found in Histoire, Table I, and reconstructed as a bathymetric profile in Table III. Figure 4 showcases a comparative analysis of the depth profiles recorded by Marsili, converted into metres, alongside those obtained from the EMODnet dataset. One significant observation is that Marsili underestimates depths greater than 100 m. This discrepancy likely stems from the limitations of the measurement techniques available during his era, which impeded accurate depth readings. Additionally, our attempts to georeference Marsili's maps unveiled more challenges; the spatial alignment of his depth profiles does not correctly match the geographical features reflected in the EMODnet data. For example, in Marsili's profile F6, a straight line intersection with both Les Iles and Planier islands, reveals an inconsistency, as such a cross-sectional view would not realistically occur in mapping scenarios like those of EMODnet. Marsili's depiction of seafloor features notably shifts towards the coastline. This issue is especially apparent in profiles E5 and G7, as shown in Fig. 4a–c.
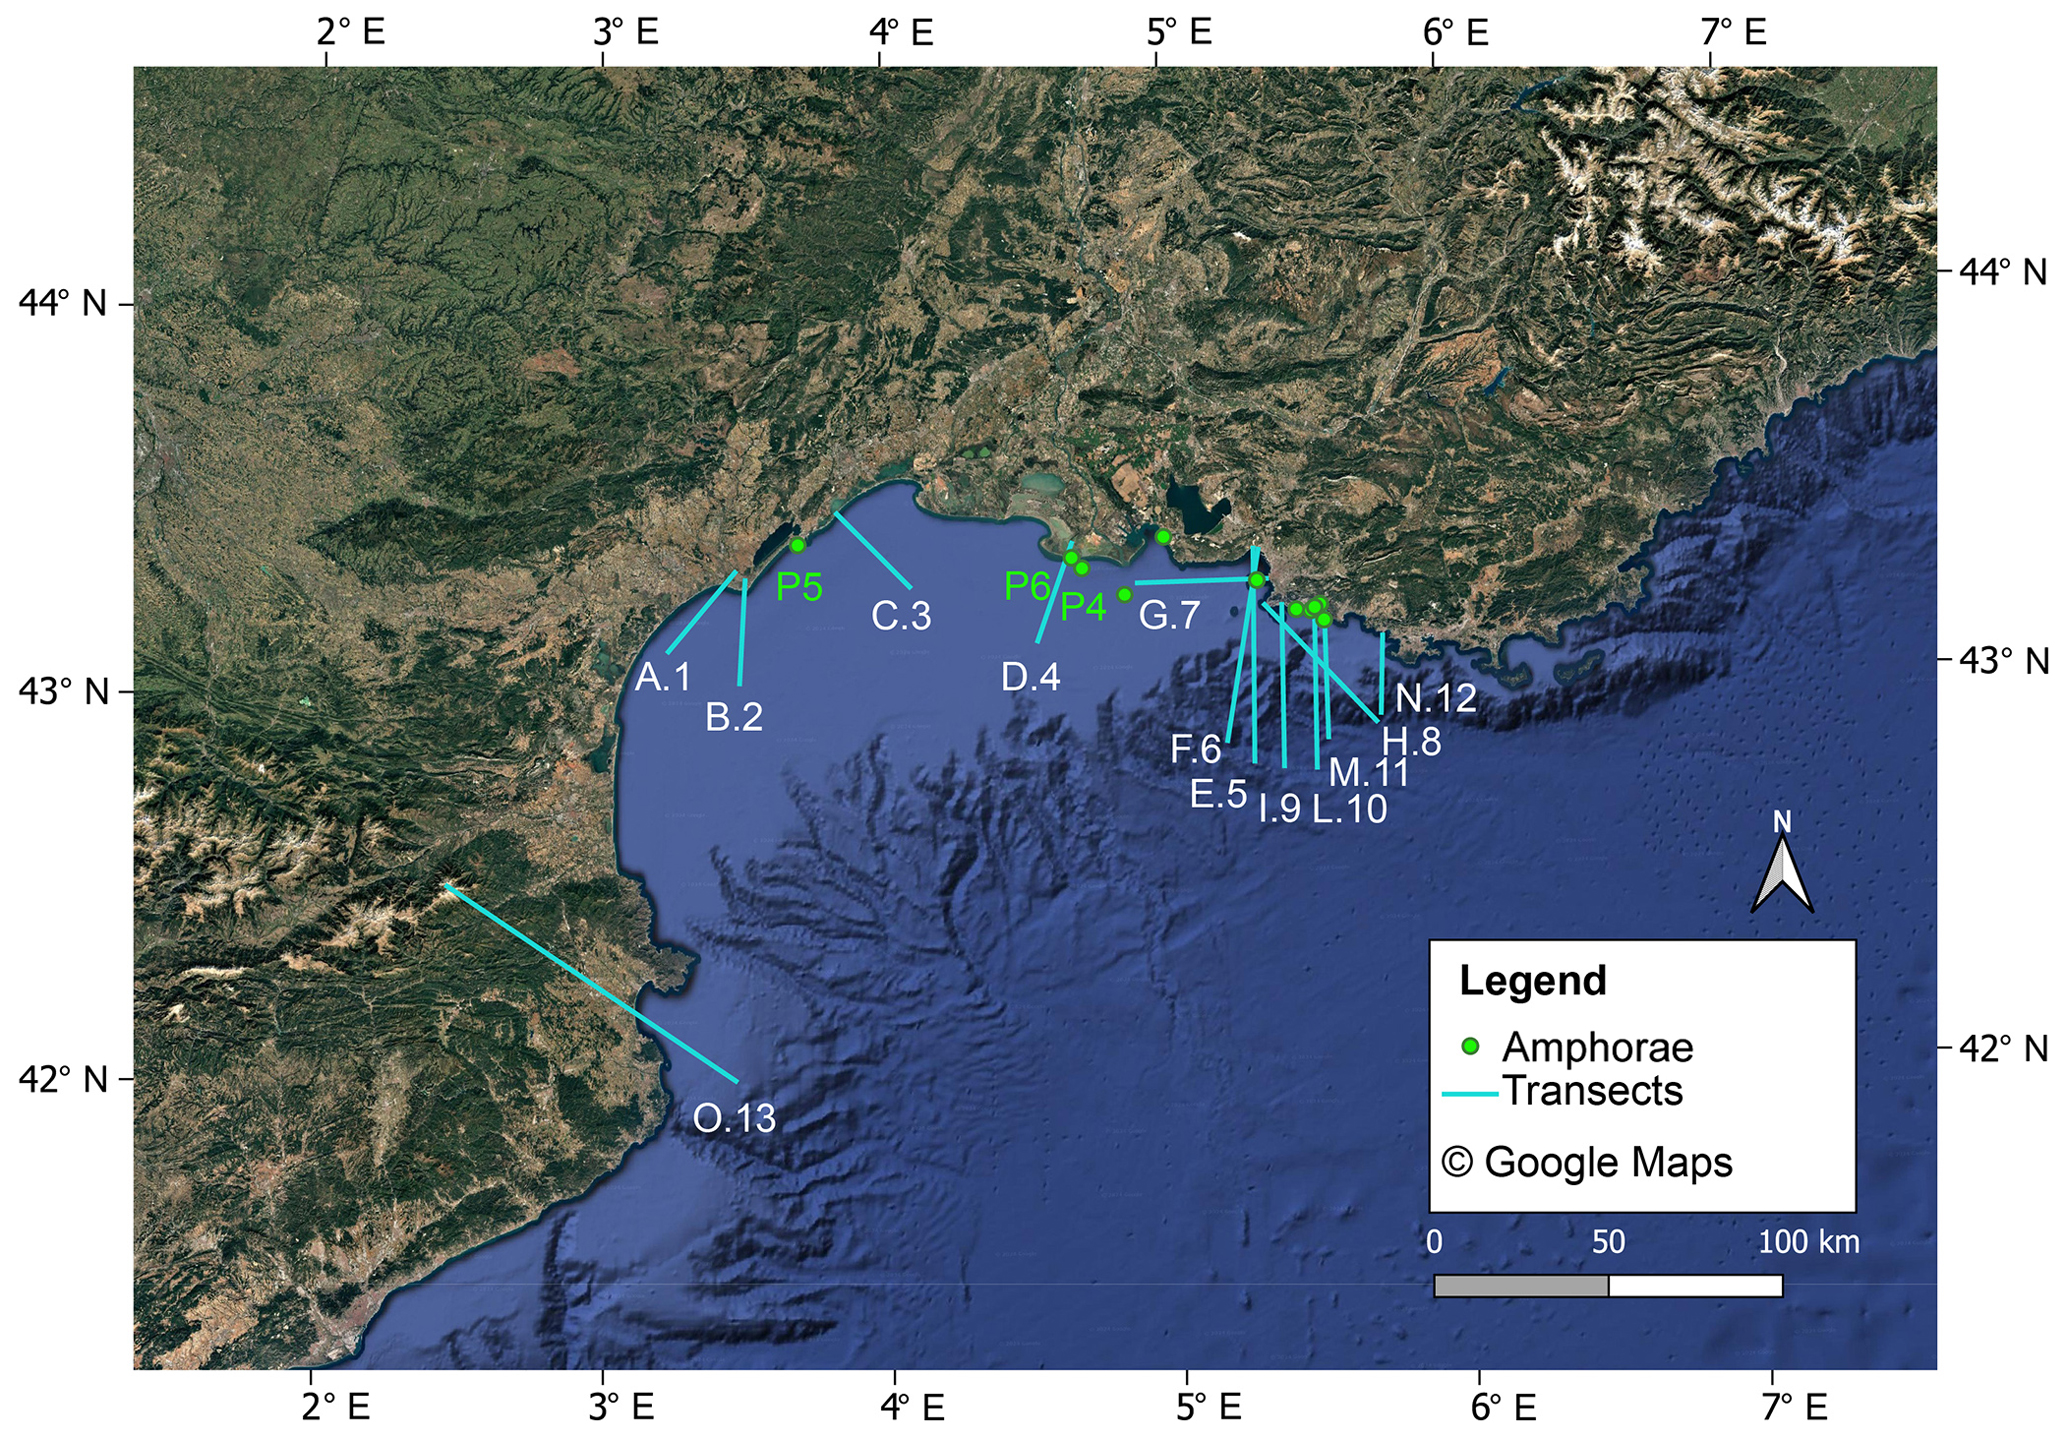
Figure 3The map shows the points (P4, P5, P6) in which amphorae have been drawn in the Marsili maps on Histoire (Tables I and II). The amphorae represent the sampling points for water weight measurements. Moreover, the figure shows the transects (A1, B2, C3, D4, E5, F6, G7, H8, I9, L10, M11, N12) drawn in the Marsili maps in Histoire (Table I). The map has been extrapolated to Google Satellite in QGIS 3.2.
Despite these differences, Marsili has accurately pinpointed certain geographical features. For example, he clearly outlined the continental shelf in profiles E5 and F6 (see Fig. 4a–b) and recognised a canyon in profile H8 (Fig. 4d). These correspondences add credibility to Marsili's work, indicating that although his methods might have led to some inaccuracies, he effectively captured essential elements of the seafloor topology that are still pertinent today.
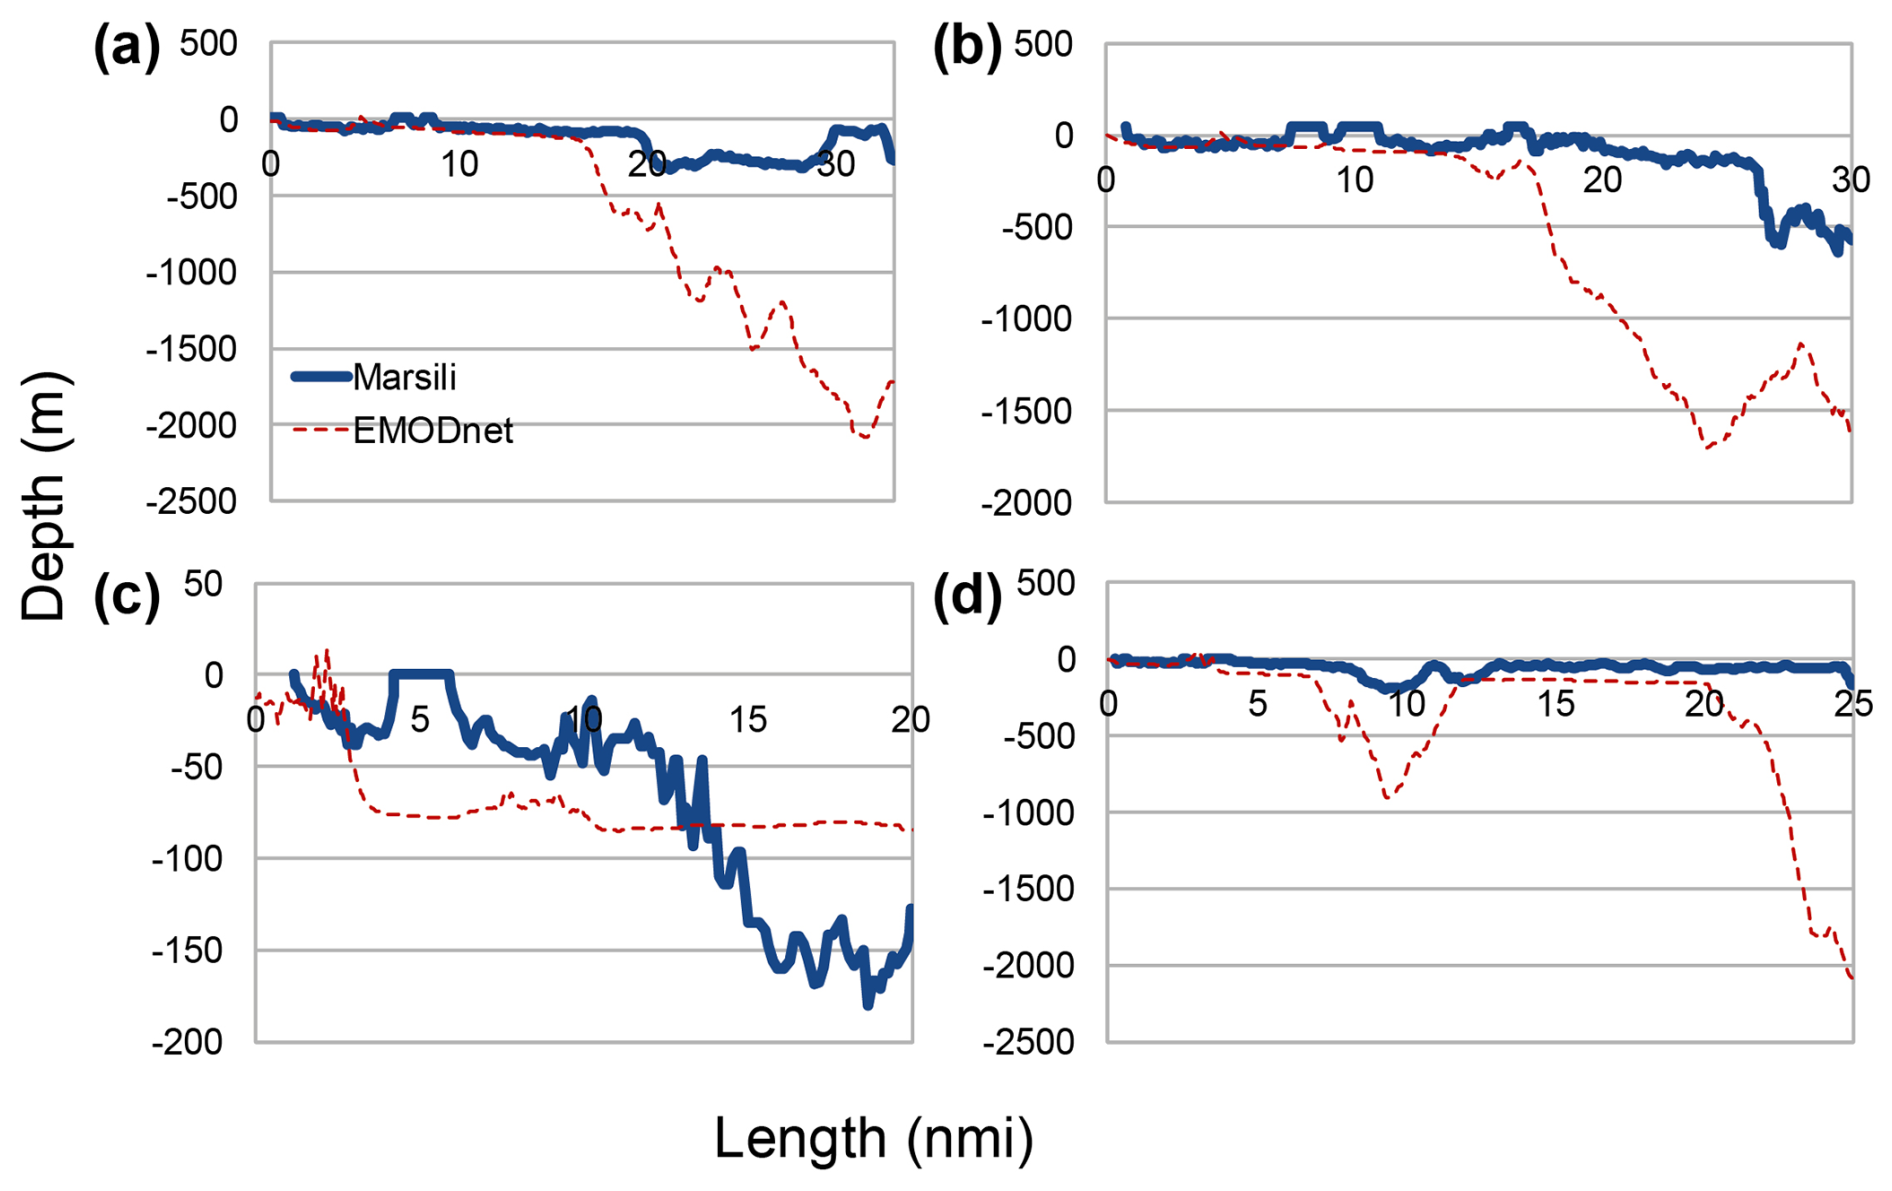
Figure 4Comparison between matching EMODnet depth profiles and (a) profile E5, (b) profile F6, (c) profile G7, and (d) profile H8 extracted from the figures shown in pp. 3 and 4 of Marsili's work.
4.3 Sea level in Cassis
Applying a bandpass filter to the dataset helps isolate the primary tidal components (M2 and K1) during specific times, such as the first 2 weeks of March, revealing oscillations consistent with the M2 tides. The resulting amplitude measures around 10–12 cm, surpassing the 6.8 cm determined by Wöppelmann and Marcos (2016) in Marseille, which is close to Cassis. While the values obtained are credible, a more refined methodology and thorough analysis are necessary for accurately extracting tidal components from the Marsili data.
4.4 The water weight measurements
Seawater density is fundamentally tied to the technologies and methods employed in its calculation. One of the earliest instruments to gauge seawater's “gravity” or weight was the explorator qualitum. Following this, specific gravity was evaluated, which is the weight of seawater relative to an equal volume of freshwater. A significant issue arose from the choice of sample water. Robert Hooke (1635–1703) conducted specific gravity measurements using Thames water collected at low tide in Greenwich (Derham, 1726), while Marsili opted for well water. Phipps became the first to utilise distilled water during his voyage toward the North Pole in 1774 (Phipps, 1774). Manzella and Novellino (2022) provide descriptions of the methodologies and technologies for measuring seawater density.
Using a “non-standard” reference water can introduce errors that must be considered in data analysis. To assess the quality of the Marsili data, a comparison was made with measurements from recent years. Historical data from the Mediterranean Sea, spanning 1806 to 2022, were selected based on proximity to the Marsili measurement points. The TEOS-10 framework was employed to calculate the physical properties of seawater using measurements taken between 1990 and 2018.
The historical archive spans the Mediterranean Sea from 1806 to 2022. This collective dataset includes data from SeaDataNet (https://doi.org/10.12770/2a2aa0c5-4054-4a62-a18b-3835b304fe64, IFREMER/IDM/SISMER et al., 2020), NESDIS/NOAA, and public repositories like SEANOE and PANGAEA, alongside contributions based on personal knowledge. It should be noted that the archive does not fully cover all positions for the Marsili observations; where there was considerable variability, minimum and maximum values are provided.
Table 3 presents water density converted from Histoire (Pl. VII, p. 23, Table I). Data were gathered at various locations in the Gulf of Lion between 18 June 1706 and 18 January 1707 (illustrated in Figs. 3 and 5 with green points). In contrast to the data collected by Marsili in his treatise on the Thracian Bosphorus (Osservazioni intorno al Bosforo Tracio, 1685), Marsili specified in the Histoire (Prefaces) the reference water data he used, and he employed the same system of weight measurements (ounces, drachmas, grains) for both reference water and seawater measurements. In a previous study (Pinardi et al., 2018) on the conversion of water weight data to density data from the Thracian Bosphorus, it was necessary to identify the type of grains used and to take into account the conversion factors (α and β) from grains to kilogram units to calculate density. In this study, this is not necessary because, knowing the reference water and the relative unit measurements, it is possible to use the simplified formula (Pinardi et al., 2018) instead of the more detailed one used by Pinardi et al. (2018). Furthermore, the presence of water weighs the data on fresh water (rivers, springs, and wells) extrapolated from Pl. VII, p. 23, Table 2 of the Histoire (see Table A2 in Appendix A) and allows us to estimate the minimum possible error associated with the measurements, evaluated taking into account the certainly wrong values (minor of 1000 kg m−3). For example Marsili measured 1 ounce, 3 drachmas, 28 grains equivalent to 997.10 kg m−3 to the Montpellier fountain of St. Giles. This value is surely wrong; when calculating the difference between 1000 kg m−3 and the mean eighth wrong value (998.77 kg m−3) present in Pl. VII, Table 2, the result is ±1.23 kg m−3.
Table 3The table shows the sampling points coordinates (the amphorae in Marsili maps) in which Marsili took water samples to measure water weight. Each coordinate is associated with a site and a date indicated by Marsili in Pl. VII, p. 23. The following columns show the measure of water weight converted in water surface density by Marsili data and the average surface water density extrapolated by SeaDataNet data (from 1990 to 2018).
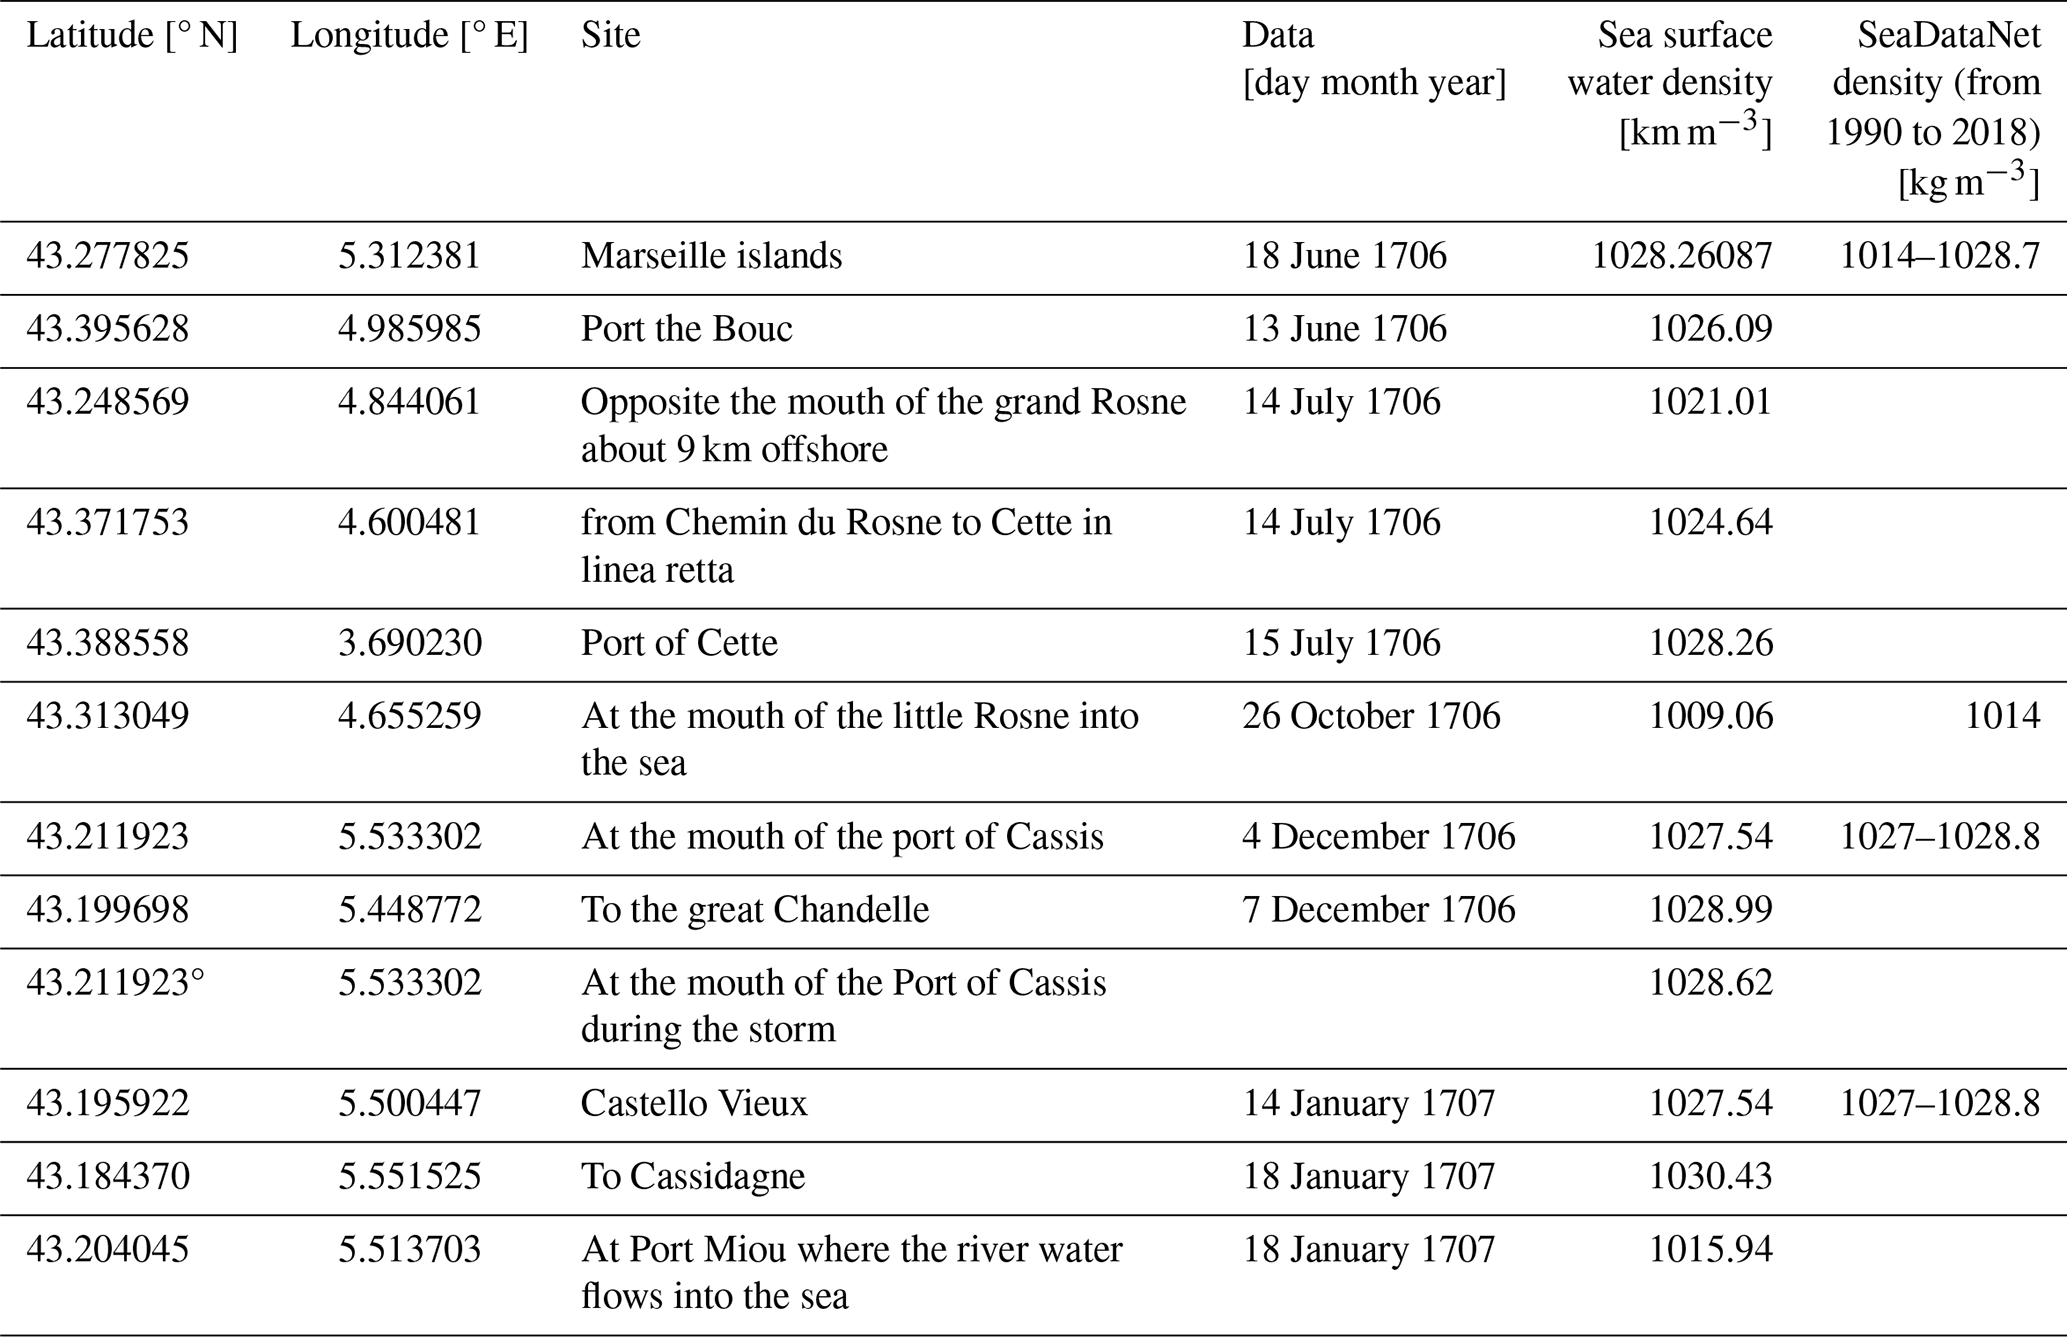
Table 3 indicates that Marsili's measurements align well with the latest data. The density value of 1030.43 calculated on 18 January 1707, is relatively high yet still falls within the range of the estimated minimum error.
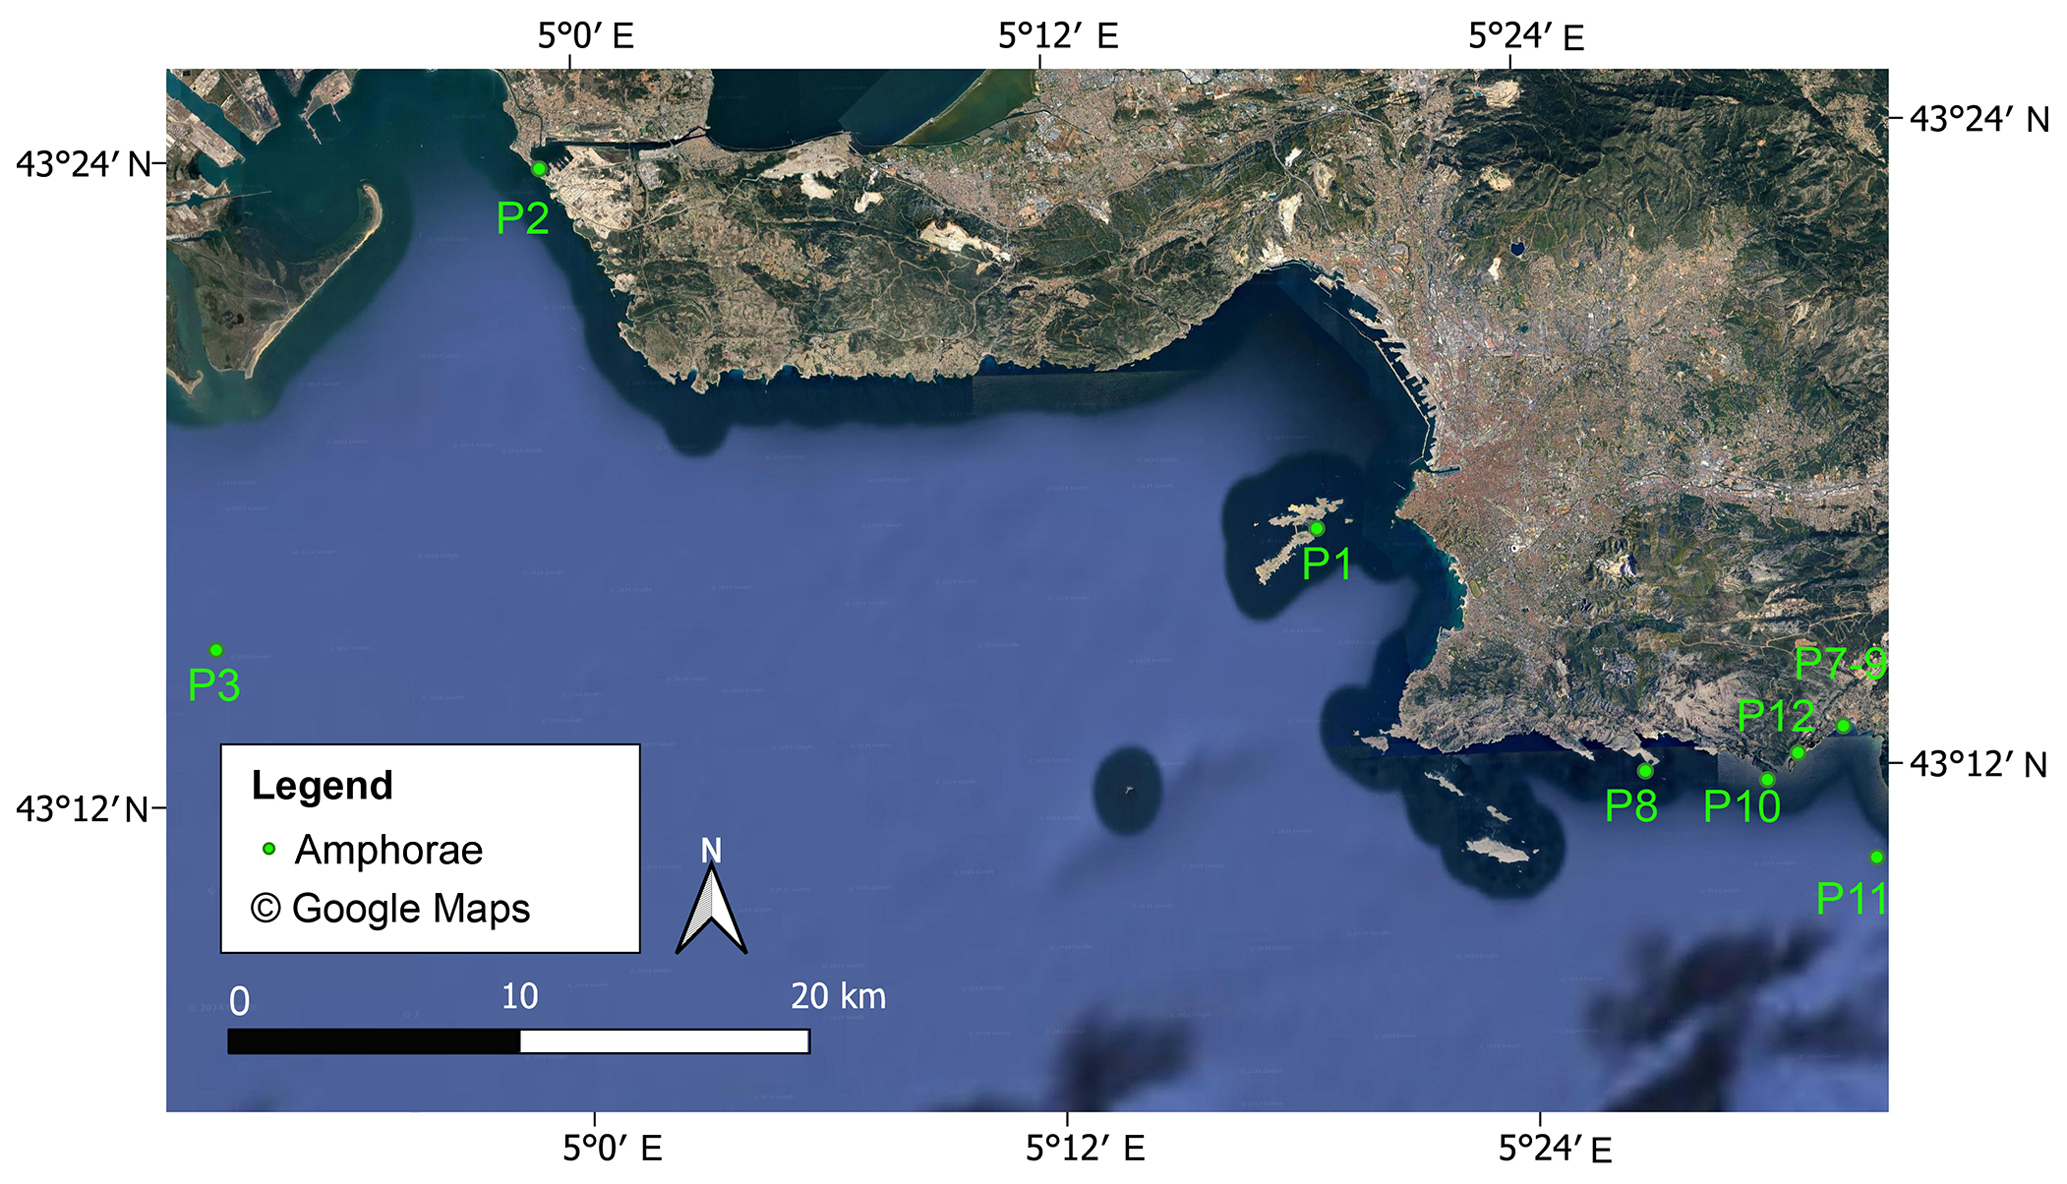
Figure 5The map shows the points (P1, P2, P3, P7, P8, P9, P10, P11, P12) in which amphorae have been drawn in the Marsili maps on Histoire (Tables I and II). The amphorae represent the sampling points for water weight measurements.
The data are available at
-
http://oceano.bo.ingv.it/erddap/search/index.html?page=1&itemsPerPage=1000&searchFor=cassis (last access: 17 July 2025) and https://doi.org/10.13127/histoiremarsili/sealevel (Locritani et al., 2024a).
-
http://oceano.bo.ingv.it/erddap/search/index.html?page=1&itemsPerPage=1000&searchFor=water+density+marsili (last access: 17 July 2025) and https://doi.org/10.13127/histoiremarsili/waterdensity (Locritani and Garvani, 2024).
-
http://oceano.bo.ingv.it/erddap/search/index.html?page=1&itemsPerPage=1000&searchFor=marsili (last access: 17 July 2025) and https://progetti.ingv.it/it/progetti-dipartimentali/ambiente/macmap#datasets (last access: 17 July 2025, Locritani et al., 2024b).
This study presents a comprehensive analysis of 18th-century maritime observations in the Gulf of Lion, focusing on data derived from the significant historical text by Marsili. Collected between 1706 and 1707, this dataset represents one of the earliest systematic efforts to document the oceanographic characteristics of the region.
While Marsili's data collection methods do not adhere to contemporary standards due to the instrumentation limitations and the accuracy of units available in his time, we have taken steps to evaluate the relevance of his findings. We aim to contextualise the results within modern frameworks by applying error margins to the various measurements. For instance, several parameters, including the weight of surface seawater, were in reasonable agreement with mean values observed over the last two centuries, suggesting that Marsili's observations hold some validity despite methodological limitations.
In this article and in Appendix A it is demonstrated that to have a good matching between the distances calculated from the Marsili maps and the real ones it is necessary to consider a correct coastline, which was one of the major efforts made for this paper.
Conversely, data related to tidal patterns require more rigorous methodologies and analyses. The precision of Marsili's maps was variable, with minimum errors estimated at around 160 m, indicating potential discrepancies in geographic representation. These inaccuracies highlight the challenges faced by early oceanographers, yet they also underscore the pioneering nature of Marsili's work.
Despite these limitations, Marsili's contributions remain invaluable. His work not only provided the first systematic description of the Gulf of Lion's continental shelf and abyssal regions but also laid the groundwork for future oceanographic studies in the area. By bridging the historical insights and contemporary analysis, this study reaffirms the significance of early oceanographic research and its relevance to our understanding of marine environments today. Through this exploration, we honour Marsili's legacy while acknowledging the evolution of oceanographic methodologies over the centuries.
Table A1Reconstructed water density measured from surface water, distilled surface water, and water cistern, fountains, and wells calculated from the data included in Pl. VIII, p. 23 of Histoire.
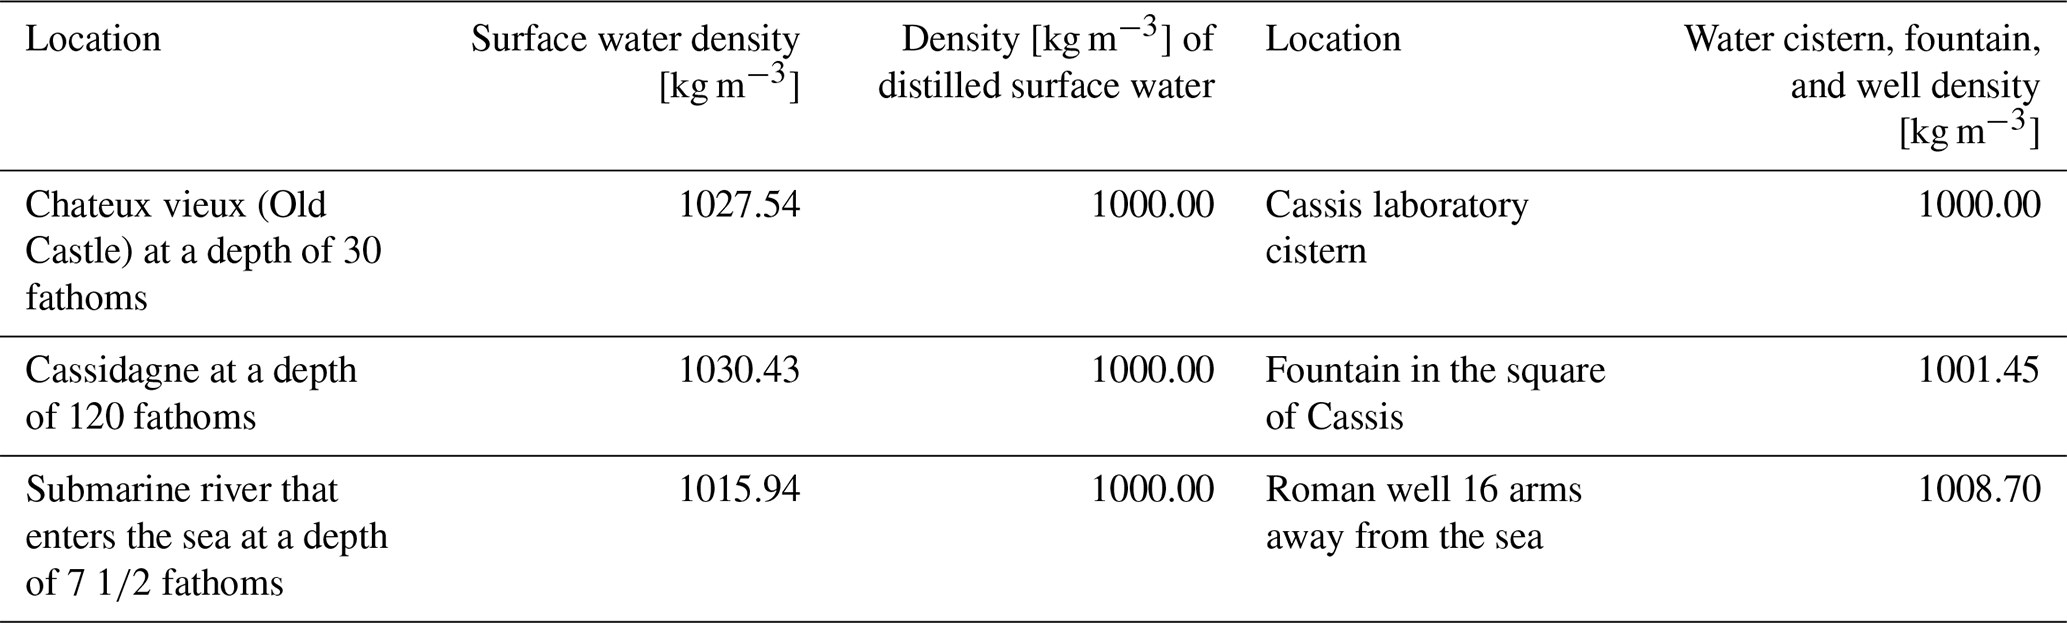
Table A2Reconstructed water density measured from water rivers, fountains, and wells calculated from the data included in Pl. VII, p. 23 of Histoire.
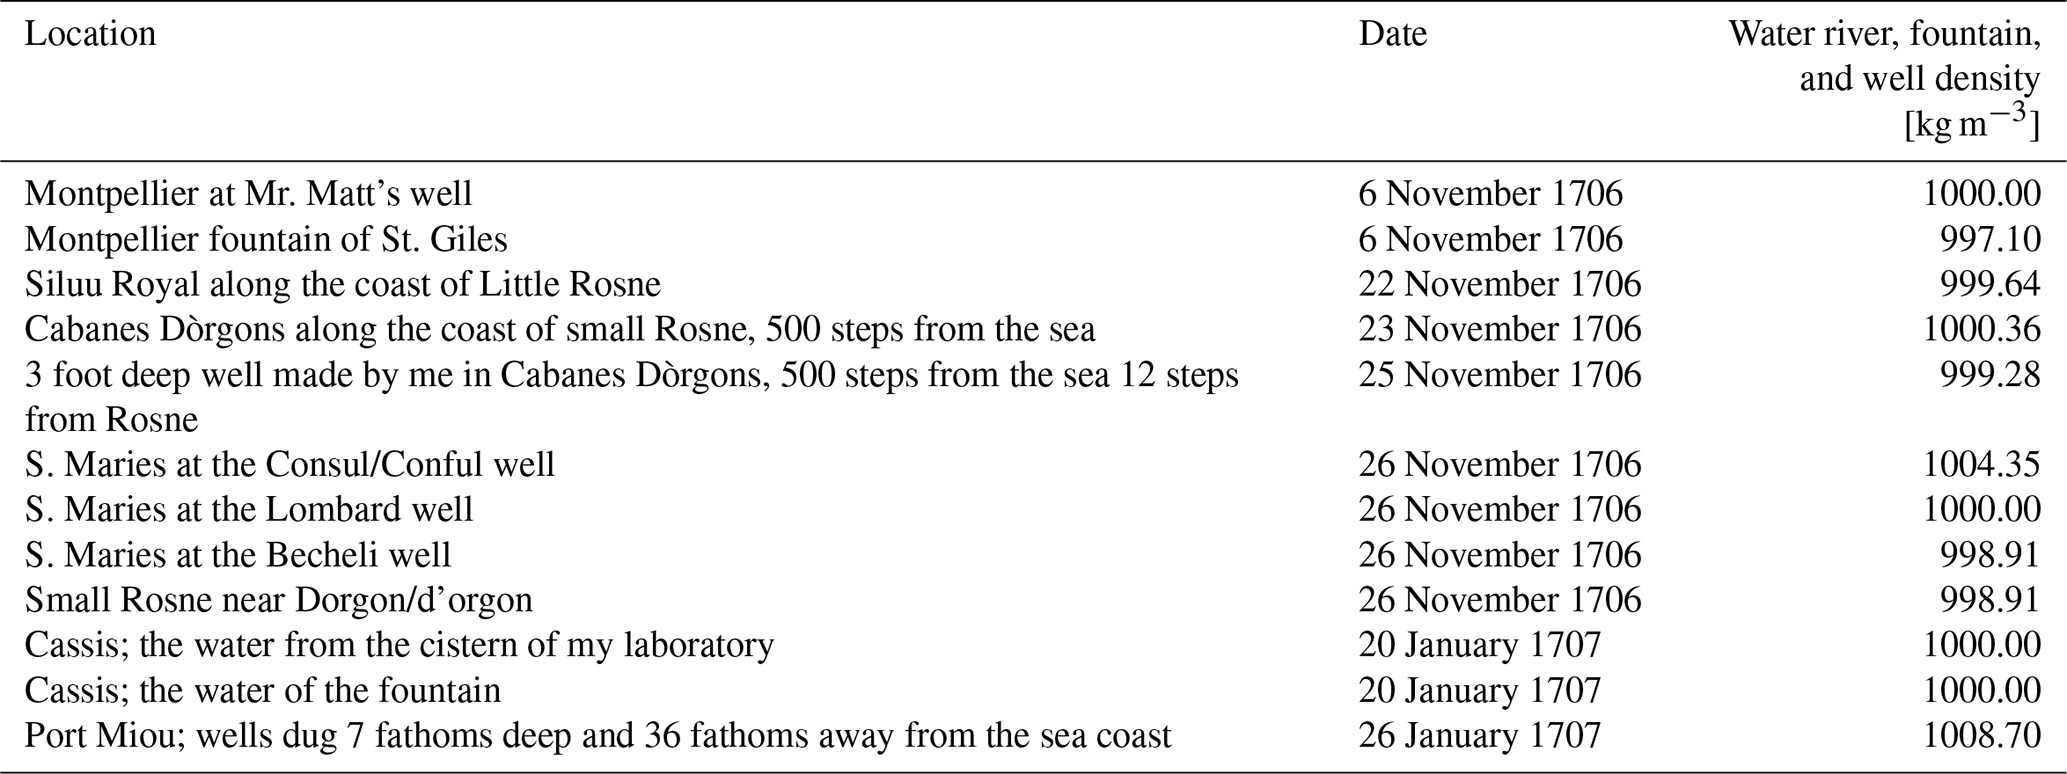
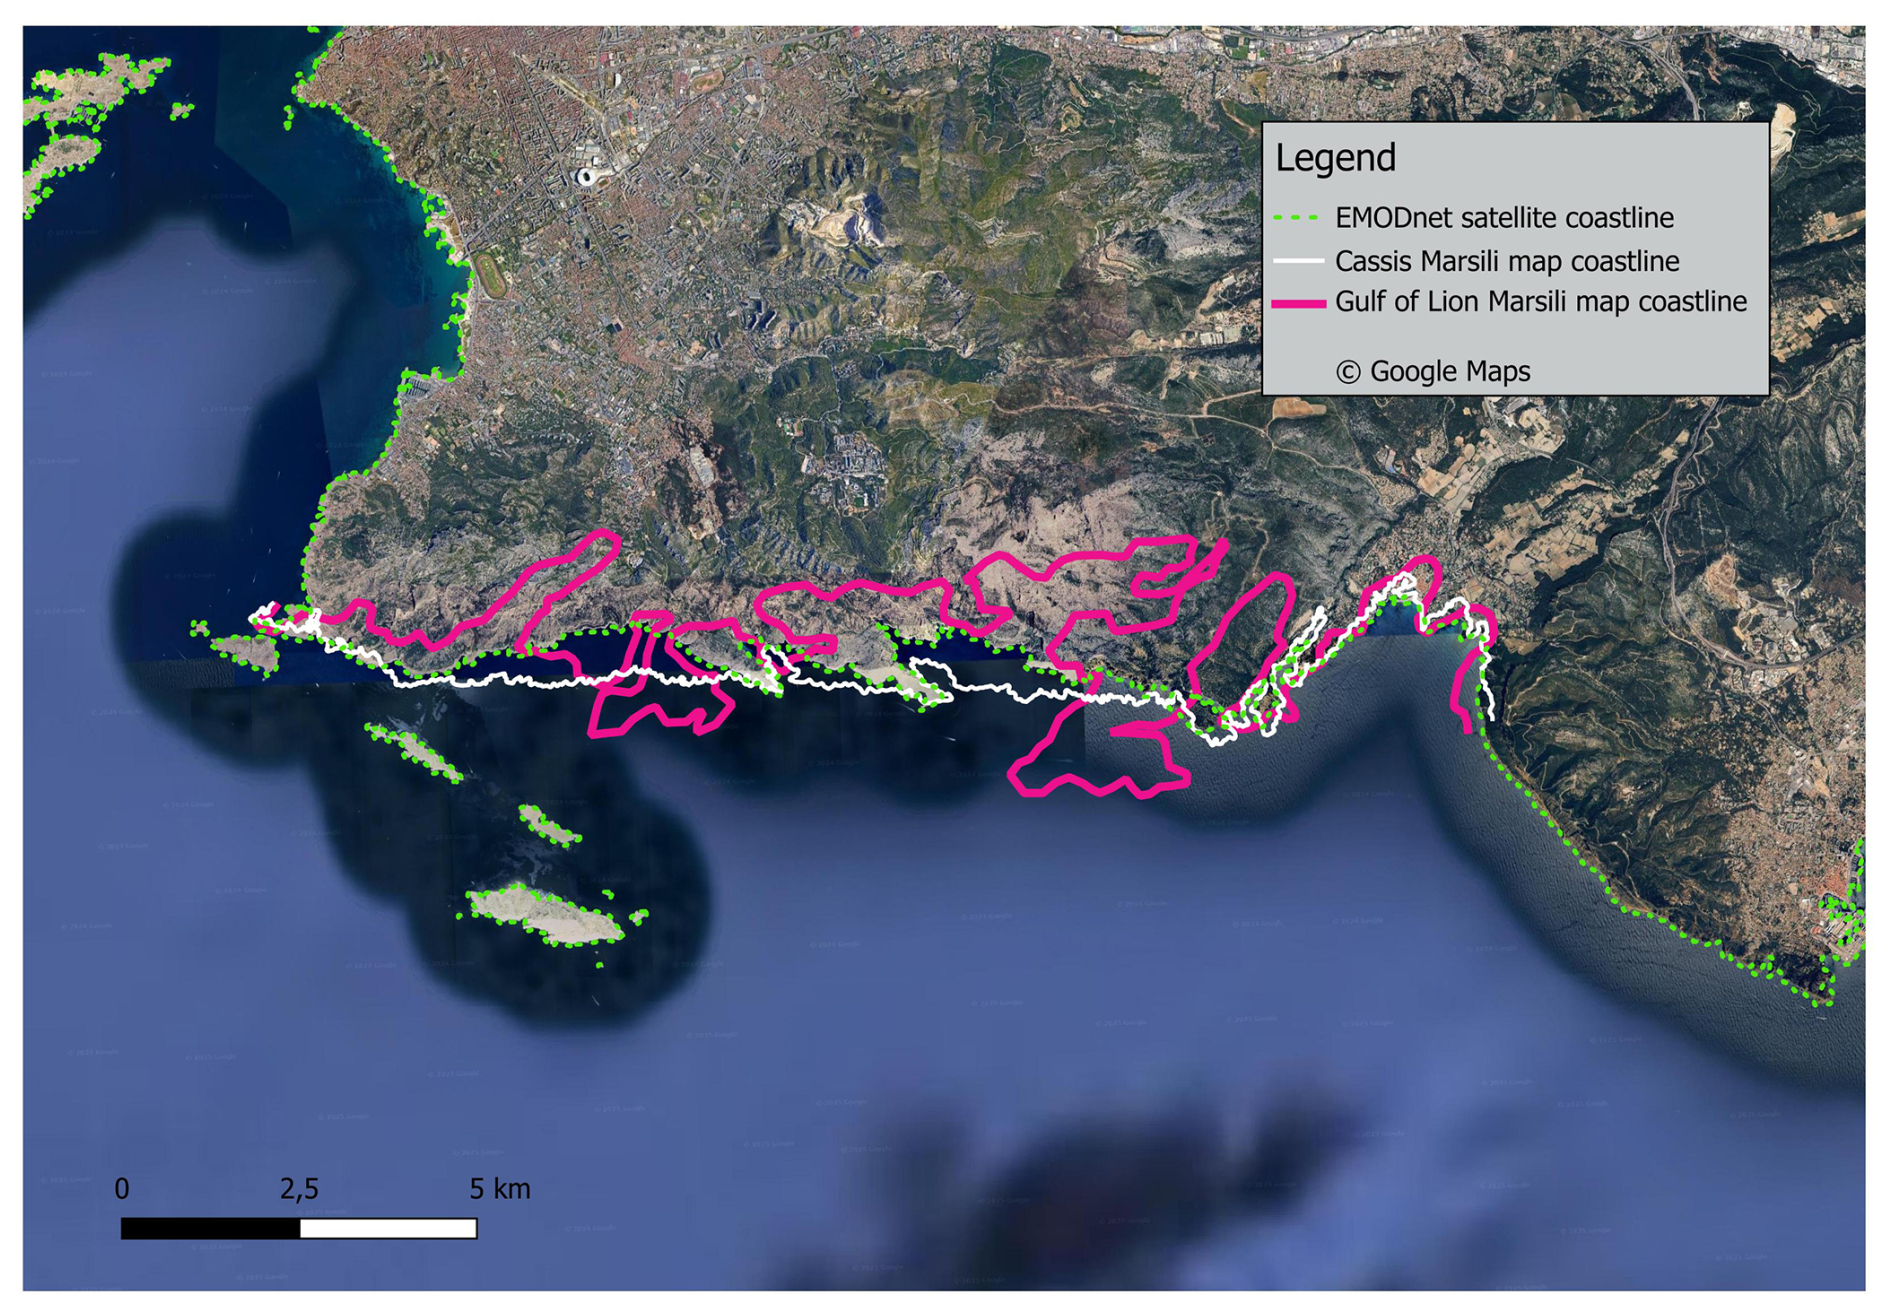
Figure A1Comparison of three coastlines in the area near Cassis. The dotted green one is the coastline extrapolated from EMODnet data, the pink line represents the digitised coastline derived from the historical map of the Gulf of Lion. In contrast, the white line depicts the coastline extrapolated from the historical map of Cassis. The map has been extrapolated to Google Satellite in QGIS 3.2.
Luigi Ferdinando Marsili (Bologna, 1658–1730) was a natural scientist and soldier whose remarkable and idiosyncratic accomplishments in both fields warrant recognition. During his youth, Marsili accompanied his father and other family members on various journeys, which allowed him to become acquainted with numerous distinguished scholars, including the renowned librarian Antonio Magliabechi (1633–1714), the medical philosopher Tomaso Cornelio (1614–1684), and Giovanni Borelli (1608–1679). These formative experiences fostered in Marsili a profound and enduring interest in the marvels of the natural world. Marsili pursued extensive studies, albeit with irregular intervals. At the University of Bologna, he studied under the anatomist Marcello Malpighi (1628–1694), the botanist Lelio Trionfetti (1647–1722), and the mathematician and astronomer Geminiano Montanari (1632–1687), with whom he maintained a regular correspondence. As a result of the influence of his teachers, Marsili was able to embrace the contemporary principles, methodologies, and approaches of the Royal Society of London. In particular, Marsili was profoundly influenced by the instructions on experimentation and instrumentation that he received from his mentor, Geminiano Montanari. In 1665, Montanari established the Accademia della Traccia or dei Filosofi in Bologna. This institution combined mathematical and experimental approaches and emphasised the instrumentation, discoveries, and experiments conducted by the Royal Society. Marsili's expertise was also significantly shaped by one of the founders of the Royal Society. Robert Boyle (1627–1691) operationalised Marsili's procedure by translating the intentions expressed by Boyle in his treatises (Tracts consisting of observations about the saltness of the sea, London, Boyle, 1674), this involved adapting the procedure to the specific context.
Marsili's first book of 1681, Osservazioni intorno al Bosforo Tracio, dedicated to Queen Christina of Sweden, reported observations and experiments he had carried out during and shortly after his year-long visit to Istanbul in 1679 and 1680 (Marsili, 1681). While this work is recognised by oceanographers as the first description of a simple laboratory-scale hydrological experiment to show how differences in the density of two water masses lead to two-layer currents, another treatise by Marsili consecrated him as the lost father of oceanography (Olson and Olson, 1958): Histoire physique de la mer, published in 1725.
This remarkable treatise was written during the time Marsili spent in France. After a few years of training in chemistry in Paris (1704–1706), Marsili expressed his desire to study the organic structure of the Earth. He first travelled to Montpellier, where he was accepted as a member of the newly formed “Société Royale”, modelled on the Paris Academy of Science (Carpine-Lancre and McConnell, 1985), during which time he contributed by providing a list of valuable correspondents and suggesting essential books and journals for the society to acquire. He illustrated the components of Société Royale des Sciences de Montpellier research with watercolour illustrations, including a location map, a sectional drawing of the seabed showing where the coral was dredged, and the apparatus used. At first, Marsili thought it was a mineral concretion like those he had seen in petrified springs. The true nature of coral – mineral, plant, or animal – was debated from antiquity until the late 18th century. After Montpellier, Marsili moved on to Cassis, where he regularly joined the coral fishermen, taking temperature readings, making soundings, and collecting water samples. Marsili observed the tides, studied waves and currents, and documented the colours of the water. In his laboratory on land, he measured the gravity of seawater samples, analysed corals, and used a microscope to study their structure and function.
In a letter to Abbé M. Bignon, he outlined his research intentions:
I have begun research on the history of the sea, where I hope to treat the nature of the water of the sea and its diverse movements; of the differences of the bottoms of the sea, which seem to me to be related to the structure of the mountains, of the effect of winds on this water, of the nature of fish developed through analysis of the vegetation growing on the bottom of the sea.
This productive period, spanning a mere 2 years, was interrupted by Marsili's second call to military service, this time by Pope Clement XI. In 1708, Marsili briefly departed for the Adriatic coast to command the Papal States' troops, seizing the opportunity to conduct limited oceanographic studies in those waters. Upon his return to Cassis, he commenced work on his treatise, publishing a brief extract in 1711: Brieve ristretto del saggio fisico. In 1715, he was once more summoned to serve the Pope. This was to be his final deployment. Upon the cessation of hostilities, he relinquished his military obligations and subsequently dedicated the remainder of his life to the pursuit of his studies. His extensive collection of scientific materials was donated to his hometown of Bologna on 13 March 1714, which marked the establishment of the Bologna Institute of Science and Art. In 1715, he was elected to the Paris Academy of Sciences. He subsequently travelled to England, where he formed a friendship with Newton and Halley. In 1722, he was elected a Fellow of the Royal Society. The results of his 2-year research at Cassis were published in 1725 in the form of his monumental work, Histoire physique de la mer, which he dedicated to the Academy of Sciences in Paris. The work was eventually published in Amsterdam in 1725.
Areometer or hydrostatic ampulla note
The instrument employed for the measurement of weight in both surface and deep water is designated as a hydrostatic ampulla, hydrostatic bulb, or areometer. The description of an instrument called a “hydrostatic ampulla”, constructed following Montanari's technical instructions and closely resembling the apparatus utilised by Marsili in the Sea of Provence, can be found in a posthumous publication by Montanari in the cultural journal La Galleria di Minerva in 1704 (Montanari, 1696). The water weight instrument, which consisted of a small, long-necked bottle weighted with sufficient lead shot to enable it to float upright, was used by Marsili in the Bosphorus. This instrument was purchased by Montanari himself (Soffientino and Pilson, 2005). It is noteworthy that Marsili himself stated regarding the use of the hydrostatic bulb that
l'altra parte che compone la natura di queste acque è il sapore salso, universale a tutti i mari che più, e meno sono di esso abbondanti, come l'esperienza me l'ha mostrato mediante il peso rilevato con l'Ampolla Idrostatica, secondo gli insegnamenti datimi dal Sig. Dott. Montanari, celebre matematico, e mio riverito Maestro, che fin da primi anni cominciò a dimostrarmi i principi di simili studi, e tra gli altri, il fondamento dell'uso di tale Istromento, e la perfezzione alla quale col suo nobile ingegno l'ha ridotto; e ne conservo una lettera in cui se ne parla diffusamente. [The other part that makes up the nature of these waters is the salty taste, universal to all seas, whether they are more or less abundant in salt, as experience has shown me by means of the weight detected with the Hydrostatic Ampulla, according to the teachings given me by Sig. Dott. Montanari, a renowned mathematician, and my revered Master, who from early years began to demonstrate to me the principles of such studies, and among others, the foundation of the use of such an instrument, and the perfection to which with his noble wit he has reduced it; and I preserve a letter in which it is spoken of at length.] (Marsili, 1681, p. 71)
In the Histoire physique de la mer, the areometer is illustrated in Plate VII, accompanied by its weight in air (1 ounce, 3 drachms, and 10 grains) and the lead rings with the corresponding weights. The ampoule is used to measure density, which was also referred to as “gravity”. When Marsili measures a weight, he is measuring gravity. From the concept of generic gravity, we move on to that of specific gravity, whereby the measurement is related to a sample. This is a concept that emerged from the French Revolution onwards and is now used for water. However, Marsili uses rainwater instead.
ML conceptualised and administrated the research, validated the georeferenced maps, and wrote the original draft preparation. SG investigated the historical part of the project and wrote original draft preparation. GM validated the sea level data; supervised the entire study; and wrote, reviewed, and edited the text. GT validated the bathymetric data and wrote original draft preparation. AG was the MACMAP project coordinator.
At least one of the (co-)authors is a member of the editorial board of Earth System Science Data. The peer-review process was guided by an independent editor, and the authors also have no other competing interests to declare.
Publisher's note: Copernicus Publications remains neutral with regard to jurisdictional claims made in the text, published maps, institutional affiliations, or any other geographical representation in this paper. While Copernicus Publications makes every effort to include appropriate place names, the final responsibility lies with the authors.
The authors are deeply indebted to the owner of the volume Histoire physique de la mer (Marsili, 1725), who allowed our study on the original book. The authors acknowledge Grammarly and ChatGPT, which were used to help correct the grammar of the entire paper and rephrase sentences in the conclusion section prior to copy-editing.
This research has been developed in the framework of the MACMAP (A Multidisciplinary Analysis of Climate change indicators in the Mediterranean And Polar regions) project funded by Istituto Nazionale di Geofisica e Vulcanologia (Environment Department) (https://progetti.ingv.it/index.php/it/progetti-dipartimentali/ambiente/macmap, last access: 24 July 2025).
This paper was edited by Salvatore Marullo and reviewed by Paola Malanotte-Rizzoli and one anonymous referee.
Adamson, G. C. D.: Private diaries as information sources in climate research, WIRes Rev. Clim. Change, 6, 599–611, https://doi.org/10.1002/wcc.365, 2015.
Adamson, G. C. D., Hannaford, M. J., and Rohland, E. J.: Re-thinking the present: the role of a historical focus in climate change adaptation research, Global Environ. Change, 48, 195–205, 2018.
Archives Départementales de l'Héraut: Registre de la Société royale des sciences de Montpellier, Hérault D., 116, 1706.
Boyle, R.: Observations And Experiments About The Saltiness Of The Sea, In tracts consisting of observations about the saltiness of the sea: an account of a statical hygroscope and its uses, London, R. Davis, 1–40, 1674.
Camuffo, D.: Key problems in early wine-spirit thermometers and the “true Réaumur” thermometer, Climatic Change, 163, 1–20, https://doi.org/10.1007/s10584-020-02910-3, 2020.
Camuffo, D.: The Treatise on Waters by Cornaro (1560) and a quantitative assessment of the historical sea surges “Acqua Alta” in Venice, Climatic Change, 176, 18, https://doi.org/10.1007/s10584-023-03492-6, 2023.
Camuffo, D. and Sturaro, G.: Sixty-cm Submersion of Venice Discovered Thanks to Canaletto's Paintings, Climatic Change, 58, 333–343, https://doi.org/10.1023/A:1023902120717, 2003.
Camuffo, D. and Sturaro, G.: Use of proxy-documentary and instrumental data to assess the risk factors leading to sea flooding in Venice, Global Planet. Change, 40, 93–103, https://doi.org/10.1016/S0921-8181(03)00100-0, 2004.
Carpine-Lancre, J. and McConnell, A.: Le comte L.F. Marsigli et la Société royale des sciences de Montpellier, “Actes du 110e Congrès national des sociétés savantes. Montpellier 1985”, Paris, C.T.H.S, I, 33–44, IT\ICCU\UBO\4690917, 1985.
Cotte, L.: Traité de Météorologie, contenant 1. l'Histoire des Observations Meteorologiques. 2. Un Traite des Meteores. 3. l'Histoire et la description du Barometre, du Thermometre, et des autres Instrumens meteorologiques. 4. Les Tables des Observations meteoro, De l'imprimerie Royale, A Paris, IT\ICCU\NAPE\01448, 1774.
Deacon, M.: Scientists and the Sea, 1650–1900: a study of marine science, London-New York, Academic Press, IT\ICCU\UBO\0294370, ISBN 1859283527, 1971.
Derham, F. R. S.: Philosophical Experiments and Observation of the Late Eminent Dr. Robert Hook S.R.S. And Geom. Prof. Gresh and Other Eminent Virtuoso's in His Time, Royal Society, 403 pp., IT\ICCU\UBOE\109572, 1726.
EMODnet Bathymetry Consortium: EMODnet Digital Bathymetry, DTM 2024, https://doi.org/10.12770/cf51df64-56f9-4a99-b1aa-36b8d7b743a1, 2024.
Esposito, A. and Manzella, G.: Current Circulation in the Ligurian Sea, edited by: Nihoul, J. C. J., Elsevier Oceanography Series, Elsevier, Vol. 34, 187–203, ISBN 9780444420770, https://doi.org/10.1016/S0422-9894(08)71245-5, 1982.
Folland, C. K. and Parker, D. E.: Correction of instrumental biases in historical sea surface temperature data, Q. J. Roy. Meteor. Soc., 121, 319–367, 1995.
Hvizdák, L., Tometzová, D., Iannaccone, B., Šoltésová, M., Domaracká, L., and Kyšel'a, K.: Old Mine Map Georeferencing: Case of Marsigli's 1696 Map of the Smolník Mines, ISPRS Int. Geo-Inf., 12, 345, https://doi.org/10.3390/ijgi12080345, 2023.
IFREMER/IDM/SISMER, Simoncelli, S., Schaap, D., and Schlitzer, R.: Mediterranean Sea – Temperature and salinity Historical Data Collection SeaDataCloud V2, https://doi.org/10.12770/2a2aa0c5-4054-4a62-a18b-3835b304fe64, 2020.
Locritani, M. and Garvani, S.: Water density data extrapolated by water weight measurements reported in Histoire Physique de la mer (1725) of L.F. Marsli. Istituto Nazionale di Geofisica e Vulcanologia (INGV), ERDDAP [data set], https://doi.org/10.13127/histoiremarsili/waterdensity, 2024.
Locritani, M., Garvani, S., and Manzella, G.: Sea Level data reported in Histoire Physique de la mer (1725) of L.F. Marsili and transformed to calculate the M2 tidal amplitude. Istituto Nazionale di Geofisica e Vulcanologia (INGV), ERDDAP [data set], https://doi.org/10.13127/histoiremarsili/sealevel, 2024a.
Locritani, M., Garvani, S., Tamburello, G., and Fratianni, C.: Bathymetric measurements reported in Histoire Physique de la mer (1725) of L.F. Marsili. Istituto Nazionale di Geofisica e Vulcanologia (INGV), ERDDAP [data set], http://oceano.bo.ingv.it/erddap/search/index.html?page=1&itemsPerPage=1000&searchFor=marsili, 2024b.
Manzella, G. and Novellino, A.: Ocean Science Data, Collection, Managements, Networking and Services, Elsevier, the Netherlands, https://books.google.it/books?hl=it&lr=&id=-BwpEAAAQBAJ&oi=fnd&pg=PP1&ots=FvIVuRk3Ty&sig=7t43MTjts98vgLRXqAhnoO47wkw#v=onepage&q&f=false (last access: 24 July 2025), 2022.
Marsili, L. F.: Osservazioni intorno al Bosforo Tracio overo Canale di Costantinopoli, rappresentate in lettera alla sacra real maestà di Cristina regina di Svezia, Roma, Nicolò Angelo Tinassi, IT\ICCU\UFIE\001269, 1681.
Marsili, L. F.: Brieve ristretto del saggio fisico intorno alla storia del mare scritta alla Regia Accademia delle Scienze di Parigi. Ora esposto in una lettera all'eccellentiss, signor Cristino Martinelli, Venezia, presso Andrea Poletti, IT\ICCU\RMSE\000883, 1711.
Marsili, L. F.: Histoire physique de la mer. Ouvrage enrichi de figures dessinées d'après le naturel. Par Louis Ferdinand comte de Marsilli, membre de l'Academie royale des sciences de Paris, A Amsterdam aux de'pens de la Compagnie, IT\ICCU\PUVE\000546, 1725.
Martini, A.: Manuale di metrologia, Torino, Lotscher, IT\ICCU\SBL\0052845, 1881.
McConnell, A.: The flowers of coral. Some unpublished conflicts from Montpellier and Paris during the early 18th century, “History and Philosophy of Life Science”, XII, 51–66, IT\ICCU\UBO\1798875, 1990.
Montanari, G.: Lettera postuma di Geminiano Montanari, Istruzione scritta gia' da tempo all'illustrissimo et eccellentissimo sig. Pietro Grimani dal Signor Geminiano Montanari, primo professore delle matematiche … sopra il modo di conoscere la differenza del peso de' fluidi fra loro. Pubblicata in La Galeria di Minerva overo Notizie Universali, Girolamo Albrizzi, 390 pp., 1696.
Moray, R. and Hooke, R.: Directions for Observations and Experiments to Be Made by Masters of Ships, Pilots, and Other Fit Persons in Their Sea-Voyages, Philosophical Transactions (1665–1678), 2, 433–448, JSTOR, http://www.jstor.org/stable/101197 (last access: 14 October 2024), 1666.
Olson, F. C. W. and Olson, M. A.: Luigi Ferdinando Marsigli, The lost father of oceanography, Quarterly Journal of the Florida Academy of Sciences, Vol. 21, No. 3, 227–234, JSTOR, http://www.jstor.org/stable/24315236 (last access: 4 November 2024), 1958.
Phipps, C. J.: A Voyage Towards the North Pole Undertaken by His Majesty's Command 1773, Published by London Printed by W. Bowyer and J. Nichols, for J. Nourse, Bookseller to His Majes, IT\ICCU\LIGE\009473, 1774.
Pinardi, N., Özsoy, E., Latif, M. A, Moroni, F., Grandi, A., Manzella, G., De Strobel, F., and Lyubartsev, V.: Measuring the Sea: Marsili's Oceanographic Cruise (1679–80) and the Roots of Oceanography, J. Phys. Oceanogr., 48, 845–860, https://doi.org/10.1175/JPO-D-17-0168.1, 2018.
Rohatgi, A.: WebPlotDigitizer 4.0, https://automeris.io/WebPlotDigitizer/ (last access: 18 July 2025), 2017.
Société Royale des Sciences de Montpellier: Memoires de la Société Royale in Histoire de la Société royale des sciences établie à Montpellier avec les mémoires de mathématiques et de physique, tirés des registres de cette société, tome second, 456 pp., IT\ICCU\TO0\0185632, 1778.
Soffientino, B. and Pilson, M. E. Q.: The Bosporus Strait: A special place in the history of oceanography, Oceanography, 18, 16–23, https://doi.org/10.5670/oceanog.2005.38, 2005.
Wilkinson, C., Woodruff, S. D., Brohan, P., Claesson, S., Freeman, E., Koek, F., and Wheeler, D.: Recovery of logbooks and international marine data: the RECLAIM project, Int. J. Climatol., 31, 968–979, 2011.
Wöppelmann, G. and Marcos, M.: Vertical land motion as a key to understanding sea level change and variability, Rev. Geophys., 54, 64–92, 2016.
Zupko, R. E.: Italian Weights and Measures from the Middle Ages to the Nineteenth Century, American Philosophical Society, Memoir 145, Philadelphia, PA, 179 pp., IT\ICCU\PUV\0197644, 1981.
- Abstract
- Introduction
- Material and methods
- Data conversion
- Results and discussion
- Data availability
- Conclusion
- Appendix A
- Appendix B: Marsili biography and the scientific contest of reference
- Author contributions
- Competing interests
- Disclaimer
- Acknowledgements
- Financial support
- Review statement
- References