the Creative Commons Attribution 4.0 License.
the Creative Commons Attribution 4.0 License.
 | 24 Jul 2025
A high-resolution divergence and vorticity dataset in Beijing derived from radar wind profiler mesonet measurements
Xiaoran Guo
Deli Meng
Yuping Sun
Zhen Zhang
Hui Xu
Liping Zeng
Juan Chen
Ning Li
Tianmeng Chen
Low-level convergence and cyclonic circulation are one of the most important dynamic variables in governing the initiation and development of convective storms. Our ability to obtain high-resolution horizontal divergence and vertical vorticity profiles, nevertheless, remains limited largely due to the lack of vertical wind observations. To fill this data gap, a high-density mesonet consisting of six radar wind profiler (RWP) sites has been operated in Beijing, which has allowed for continuous observations of three-dimensional winds with high vertical resolution. This paper aims to produce a temporally continuous horizontal divergence and vertical vorticity dataset at the vertical resolution of 120 m, which is derived from horizontal winds measured by the RWP mesonet in Beijing using the triangle method. This dataset is generated at intervals of 6 min for the whole year of 2023, covering the altitude range of 0.51–4.11 km. The dynamic variables from RWP mesonet are found to scatter sharply as opposed to those from ERA5 that are concentrated around zero, especially at high altitudes. In particular, the negative divergence and positive vorticity are detected in the low-level troposphere up to 1 h in advance of the occurrence of rainfall events, and their magnitudes increasingly become greater when the time comes closer to the rainfall onset, exhibiting the key role that the dataset plays in rainfall nowcasting. This is indicative of, to some extent, the effectiveness of the high-resolution divergence and vorticity dataset in Beijing. The dataset is publicly available at https://doi.org/10.5281/zenodo.15297246 (Guo and Guo, 2024), which is of significance for a multitude of scientific research and applications, including convection initiation and air quality forecasting. Therefore, the findings highlight the urgent need for exploiting the dynamic variables from RWP mesonet measurements to better characterize the pre-storm environment.
- Article
(3116 KB) - Full-text XML
- BibTeX
- EndNote


Atmospheric dynamic conditions, such as vorticity, divergence, and vertical velocity, play a critical role in inferring convection initiation (CI) and the subsequent development of mesoscale convective systems (MCSs) (Ulanski and Garstang, 1978; Weckwerth and Parsons, 2006; Wilson and Roberts, 2006; Lock and Houston, 2014; Weckwerth et al., 2019; Guo et al., 2024). In recent decades, a variety of previous observational analyses based on passive surface stations and weather radars reveals the positive correlation between surface convergence and the formation of new convective cells (Purdom, 1976; Fankhauser et al., 1995; Kalthoff et al., 2009; Bai et al., 2019). The sustained and enhanced updraft forced by local convergence is conducive to the initiation or intensification of convective cells, especially in unstable and deep moist environments. Furthermore, the interaction between wind shear and vertical vorticity structures produces favorable atmospheric conditions for cyclogenesis in both midlatitude and tropical regions during the warm season (Bosart and Sanders, 1981; Zhang and Fritsch, 1986). The pressure drop caused by the cyclonic rotation of the low-level mesocyclone further accelerates the lifting, as described by the mesoscale vertical vorticity equation used in vertical velocity analyses (Yanai and Nitta, 1967; Brandes and Ziegler, 1993; Shapiro et al., 2009).
Additionally, the radiosonde sounding arrays have been used to obtain the vertical wind profiles that are further applied for retrievals of atmospheric dynamic variables over large spatial scales exceeding 500 km. In this case, the wind gradients are objectively determined by the linear interpolation to grid points using observations of distant stations with inevitable errors (Lee and Browning, 1994). Afterwards, many follow-up studies have confirmed its possibility of realistically calculating the mass divergence of the air over an area using soundings or dropsondes distributed along the perimeter of this area (e.g., Holland, 1970; Nitta and Esbensen, 1974; Lenschow et al., 1999, 2007). On the other hand, vertical vorticity can be directly determined from Stokes' theorem using closed integrals of the horizontal velocity tangent component enclosing the area. For instance, Davies-Jones (1993) investigated the algorithms used to estimate vertical vorticity profiles and associated errors over sub-synoptic-scale regions from a small number of observing stations. During an airborne field campaign over the tropical Atlantic near Barbados, the dropsondes with horizontal wind profile measurements were released with high frequency along circular flight patterns to estimate vertical profiles of the area-averaged mass divergence and vorticity (Bony and Stevens, 2019). Nevertheless, it has proven that the triangle method is more practical in operation if observations are irregularly distributed (Bellamy, 1949).
Nowadays, divergence and vorticity over smaller areas, with linear dimensions on the order of 100 km, have attracted widespread attention due to the importance of mesoscale vertical motions (Bony et al., 2017). With the advent of dense remote sensing instruments, more accurate retrievals of divergence and vorticity profiles are more possible due to wind fields with higher precision and resolution. A new generation of ground-based radar wind profiler (RWP) networks has been operated in China as of 2008 (Guo et al., 2021a), which consisted of over 260 stations by the end of 2023. It has good spatial coverage with six RWP sites over Beijing which provide continuous observations of high-resolution three-dimensional wind fields (Liu et al., 2019; Guo et al., 2023). In our previous studies (e.g., Guo et al., 2023, 2024; Chen et al., 2024), the vertically resolved dynamic parameters were calculated from the measurements of the RWP mesonet to identify the pre-storm conditions and forecast the ensuing evolution of MCSs.
In the present study, a long-term horizontal divergence and vertical vorticity datasets covering the whole year of 2023 are generated which have crucial implications for the identification and evaluation of vertical motion and convection development. The rest of the paper is organized as follows. Section 2 describes the fundamental datasets and the calculation methodology used here. A comparison analysis is conducted of dynamic variable profiles between RWP retrieval and the ERA5 reanalysis in Sect. 3. Section 4 represents the variation patterns of these two dynamic parameters preceding rainfall events. The main conclusions are given in the final section.
2.1 Radar wind profiler measurements
Figure 1a presents the RWP mesonet deployed in Beijing at the following stations: Huairou (HR; 40.36° N, 116.63° E), Yanqing (YQ; 40.45° N, 115.97° E), Shangdianzi (SDZ; 40.66° N, 117.11° E), Pinggu (PG; 40.17° N, 117.12° E), Haidian (HD; 39.98° N, 116.28° E), and Beijing Weather Observatory (BWO; 39.79° N, 116.47° E). These RWPs are Ce Feng Leida-6 (CFL-6) tropospheric wind profilers, which are produced by the 23rd Institute of China Aerospace Science and Industry Corporation (Table 1). They provide measurements of horizontal and vertical winds and the refractive index structure parameter at 6 min intervals. The vertical resolution is 120 m from 0.15 to 4.11 km above ground level (a.g.l.) in low-operating mode and 240 m from 4.11 to 10.11 km a.g.l. in high-operating mode (Liu et al., 2019).
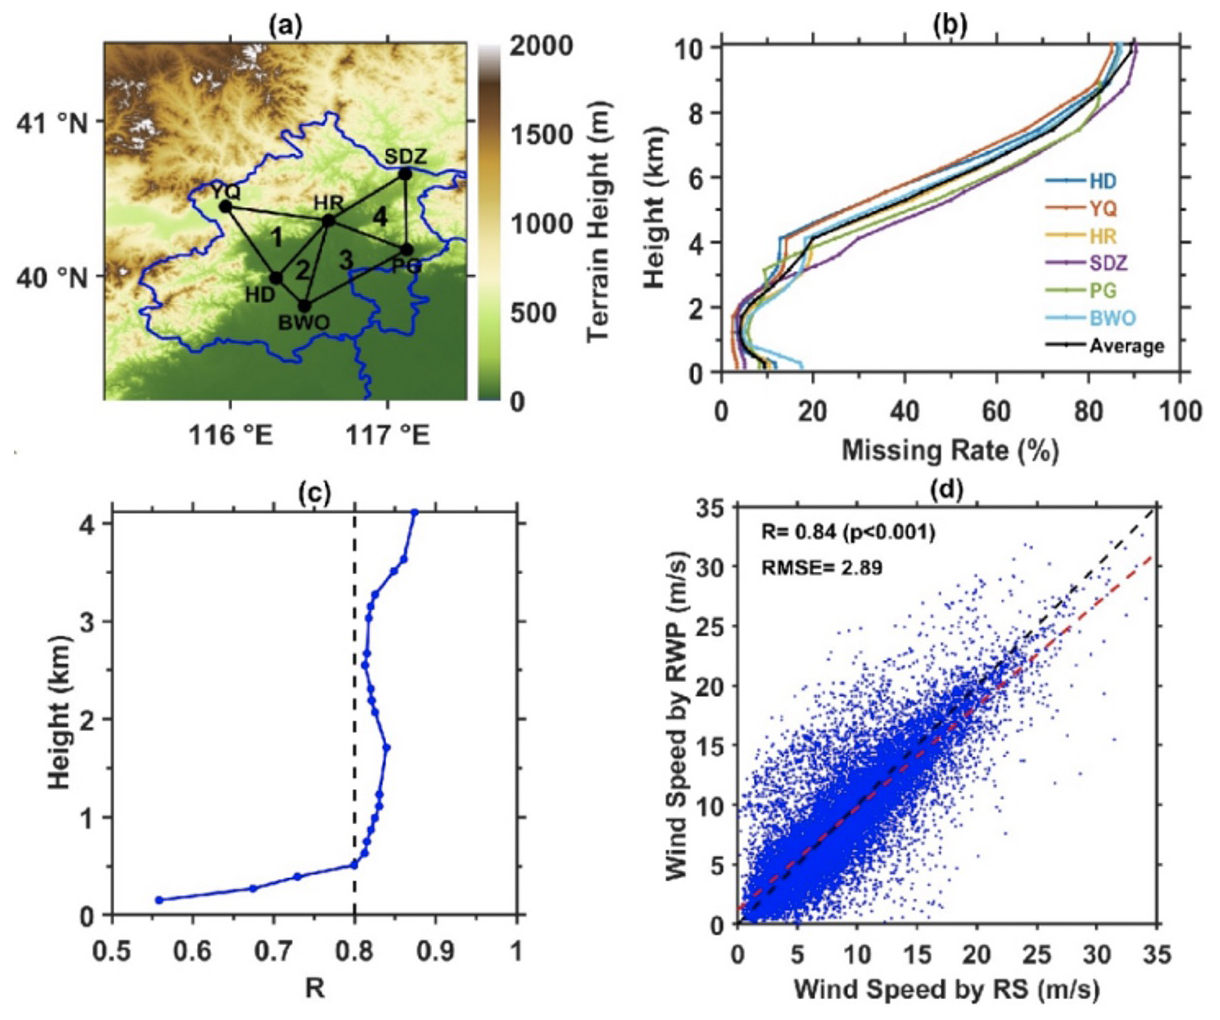
Figure 1(a) Locations of the six radar wind profiler (RWP) stations (black dots). The blue line denotes the administrative boundaries at the provincial level. Four black triangles with numbers denote the regions used to calculate the horizontal divergence and vertical vorticity with the triangle method. (b) The missing rate of horizontal wind speeds at different heights derived from six RWPs. (c) Vertical profile of the correlation coefficient (R) between horizontal wind speeds derived from the RWP and those from the upper-air soundings (RS) at the Beijing Weather Observatory (BWO). (d) Scatterplots of the horizontal wind speeds in the range of 0.51–4.11 km above ground level (a.g.l.) from the RWP versus RS at the BWO. The red and black dashed lines denote the linear regression and 1:1 line, respectively.
Table 1General characteristics of the CFL-6 radar wind profiler.
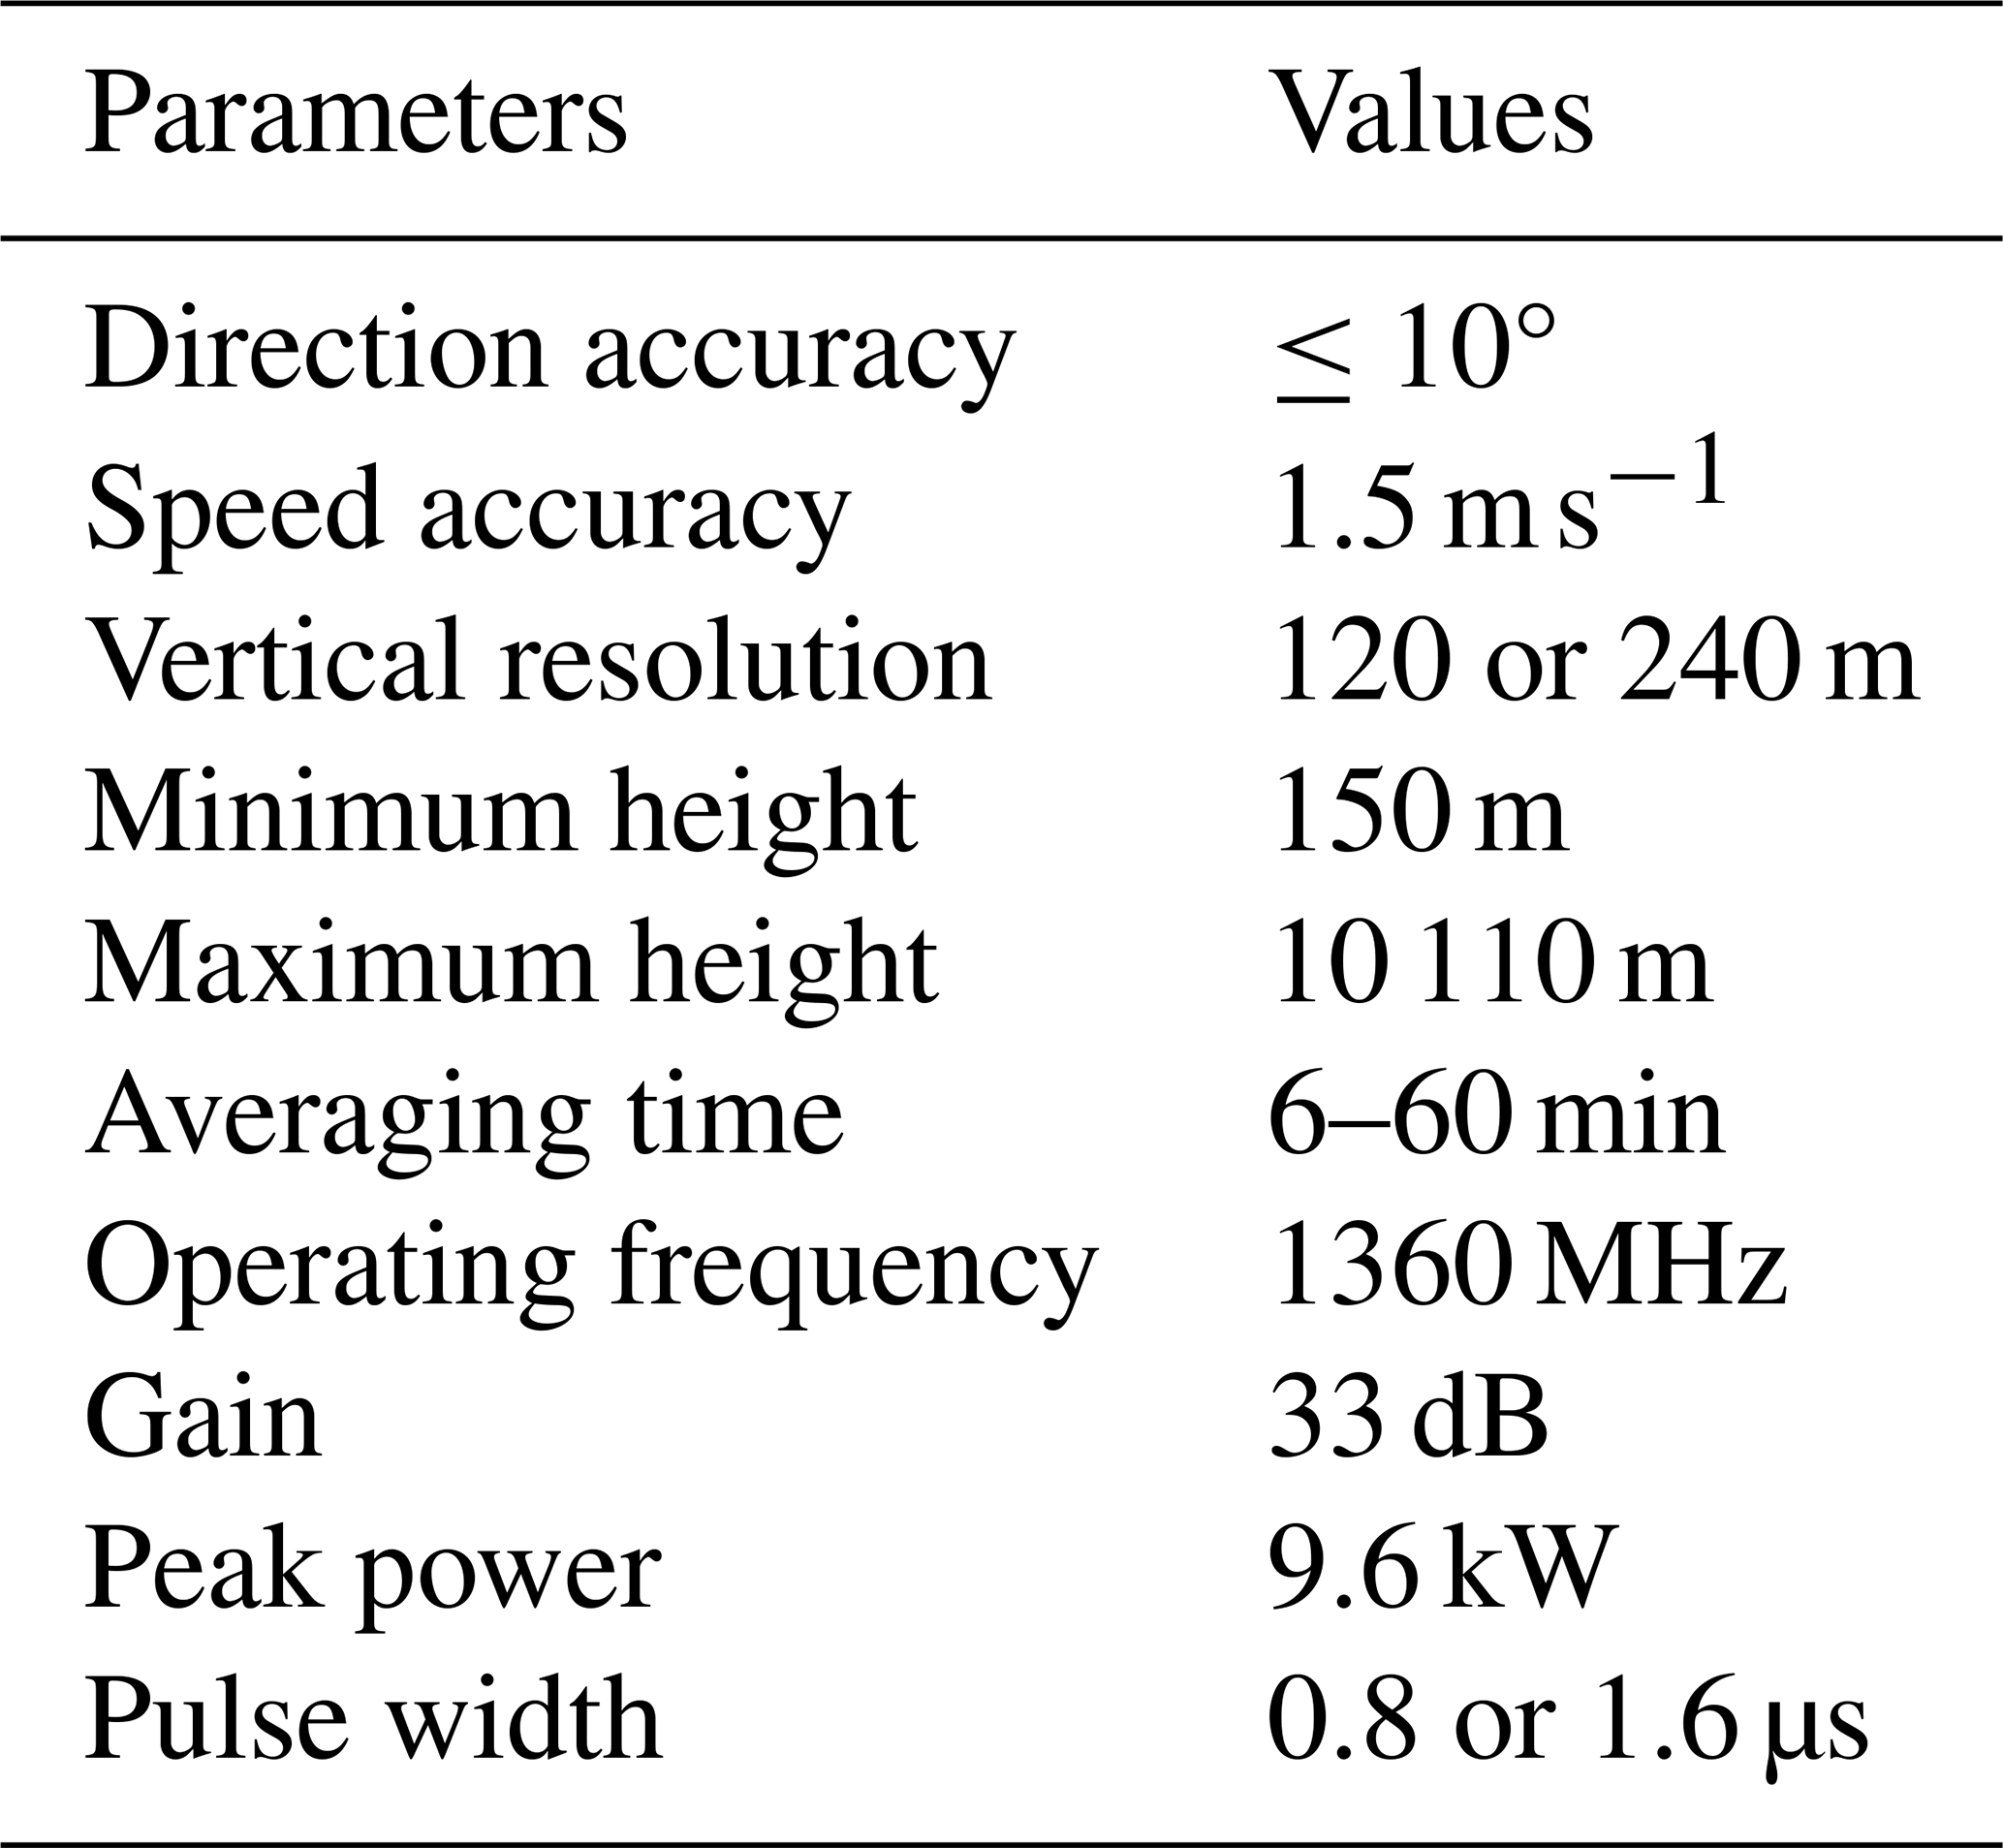
The RWPs detect vertically resolved wind fields by transmitting and receiving electromagnetic beams in five directions, comprising a zenith and four inclined directions of 15° in the east, south, west, and north, respectively. By analyzing the Doppler shifts in radial velocities from any three beams, horizontal and vertical wind components are retrieved. However, the falling of small targets (particulate scatterers) and raindrops may cause the potential biases of vertical velocity in such a way that vertical velocity cannot usually be used directly (Angevine, 1996; Wang et al., 2014; McCaffrey et al., 2017). The fluctuating component of the horizontal velocity is not affected under varying meteorological conditions since it is much larger in magnitude.
To ensure the integrity of the data, a test of the acquisition rate of the horizontal wind profiles spanning the whole year of 2023 is conducted. As shown in Fig. 1b, the observations below 4.11 km a.g.l. for six RWPs relatively meet the requirements of continuity in time with an average missing value rate of less than 20 %. These relatively low acquisition of the RWP data at high altitude could be attributed to the well-known limitations that the radar signal attenuation constitutes the inherent uncertainty sources. Therefore, the horizontal winds derived from six RWPs at the heights of 0.15–4.11 km a.g.l. in 2023 are collected in this study.
2.2 Evaluation of horizontal winds of the RWP
To further evaluate the data quality of the RWPs, horizontal wind speeds at every level from the BWO are validated against the coincident radiosonde measurements. Upper-air sounding balloons are launched at the BWO twice daily at 08:00, and 20:00 local standard time (LST), providing the vertical profiles of temperature, pressure, relative humidity, and horizontal winds with a vertical resolution of 5–8 m (Guo et al., 2021b). During summer months (June, July, and August), an intensive observation campaign was conducted at most radiosonde stations of China with an additional balloon launches at 14:00 LST. As shown in Fig. 1c, the correlation coefficient (R) is found to be greater than 0.8 from 0.51 to 4.11 km a.g.l. Nevertheless, the accuracy and reliability of the RWP data below 0.51 km are limited by the interference of near-surface clutter. Scatterplots obtained by aggregating all the samples between 0.51 and 4.11 km a.g.l. produce a correlation coefficient (R) value as high as 0.84 (Fig. 1d). Thus, the horizontal winds derived from RWPs at heights of 0.51–4.11 km a.g.l. are believed to be reliable enough and therefore are adopted here for the generation of atmospheric dynamic dataset.
2.3 Rain gauge measurements and reanalysis
Rainfall at 1 min interval is directly acquired from the rain gauge measurements at automated surface stations over Beijing. Here, 6 min accumulated rainfall is synchronized with the RWP measurements at 6 min intervals. These rain gauge measurements have undergone rigorous quality control and have been made publicly available by the China Meteorological Administration.
ERA5 is the fifth-generation atmospheric reanalysis of ECMWF (European Centre for Medium-Range Weather Forecasts), which benefits from advancements in data assimilation, model physics, and dynamics (Hersbach et al., 2020). The ERA5 dataset can provide divergence and vorticity on 37 pressure levels with a spatial resolution of 0.25°×0.25° at hourly intervals. Additionally, the planetary boundary layer (PBL) height product is directly obtained from the ERA5 reanalysis.
2.4 Calculation of horizontal divergence and vertical vorticity
Generally, the horizontal divergence (D) and vertical vorticity (ζ) are represented by pairs of partial derivatives of velocity to reflect the change in air velocities with distance. By applying Gauss's theorem, horizontal divergence (D) is expressed by the relative expansion rate of the air mass. The triangle method, as proposed by Bellamy (1949), computes the divergence based on the rate of change in a fluid triangle initially coincident with the network composed by any three points A, B, and C. We assume that (xi,yi) is the location of three vortex points are the zonal and meridional component of horizontal wind, respectively. As the air parcel at (xi,yi) moves to after the infinitesimally short time Δt, a new triangle will form. The resultant horizontal divergence D over the fluid triangle can be defined as
where σ and σ′ denote the area of the triangle ABC and , which can be formulated by
Here, i, j, and k represent the unit vectors of zonal, meridional, and vertical axes in the coordinate system, respectively. By substituting Eqs. (3) and (2) into Eq. (1) and simplifying the equation, the triangle-area-averaged horizontal divergence is as follows:
The vertical vorticity ζ can be estimated directly from Stokes theorem as
Circulation along the triangle ABC can be calculated by
By substituting Eqs. (2) and (6) into Eq. (5), we conclude that the vertical vorticity is as follows:
These equations are then applied to the abovementioned wind measurements from the RWP mesonet in order to calculate the profile of horizontal divergence and vertical vorticity. Four triangles from west to east are constructed based on the positions of RWP stations in Beijing. It is noteworthy that the denominator of Eqs. (4) and (7) is equal to the area of the triangle from Eq. (2). That is to say, the value of divergence and vorticity is inversely proportional to the area of the triangle. Therefore, the magnitudes of the results are larger for triangle 2, which could be attributed partly to the smallest area of triangle 2 being used for area-averaged calculations compared to those of other triangles. This coincides with the fact that the gradient of velocity between two points, including , , , and , will increase when the distance is shortened. Considering the six RWPs located at different terrain elevations, the horizontal velocities measured by each RWP are interpolated to the same altitude that starts upwards from 0.51 to 4.11 km above mean sea level (a.m.s.l.) with a vertical resolution of 120 m. The temporally continuous dataset of horizontal divergence and vertical vorticity derived from the RWP mesonet in Beijing during 2023 is publicly available at https://doi.org/10.5281/zenodo.15297246 (Guo and Guo, 2024).
Due to the widespread usage of the ERA5 reanalysis in characterizing the stable condition of the atmosphere, evaluating its performance in representing the vertical profiles becomes crucial. The divergence and vorticity fields derived from the RWP mesonet are compared with the ERA5 reanalysis on the non-precipitation day in this section. To match the spatial resolution of the ERA5 dataset on the grid of 0.25°×0.25° to the RWP mesonet, divergence and vorticity profiles of all the grids within this triangle are averaged for each triangle. Simultaneously, observed profiles at 1 h interval are applied in accordance with the temporal resolution of the reanalysis.
It is well known that the PBL is the lowermost part of the troposphere that governs the exchange of momentum, mass, and heat between the surface and atmosphere (Adler and Kalthoff, 2014; Dai et al., 2014; Dodson and Griswold, 2021; Su et al., 2023). Considering that the altitude z is used in this study instead of height above ground level, zi for a given triangle equals to the terrain height plus the PBL height. To better reveal how the divergence and vorticity vary with PBL, z can be normalized by zi to provide a non-dimensional vertical coordinate for horizontal divergence and vertical vorticity in the following analysis. The layers in the range of 0.51–4.11 km a.m.s.l. are classified as near-surface, low-level, and mid-level layer according to the criteria of , , and , respectively. Figure 2 shows the normal distribution of the two dynamic parameters derived from the RWP mesonet and ERA5 reanalysis for all non-precipitation day in 2023. Overall, the distributions of observed parameters on the different altitude layer are similar. The value of divergence and vorticity by the ERA5 reanalysis are more significantly concentrated in zero, indicating that the ERA5 reanalysis underestimates the amplitude compared with RWP mesonet measurements. The higher peak probability is found in the low-level and mid-level troposphere. This illustrates that the ERA5 reanalysis does not detect divergence and vorticity at higher altitudes well, which resembles the results of previous studies (Taszarek et al., 2021). We speculate the difference may have likely resulted from insufficient wind profiling measurements in China being assimilated into ERA models.
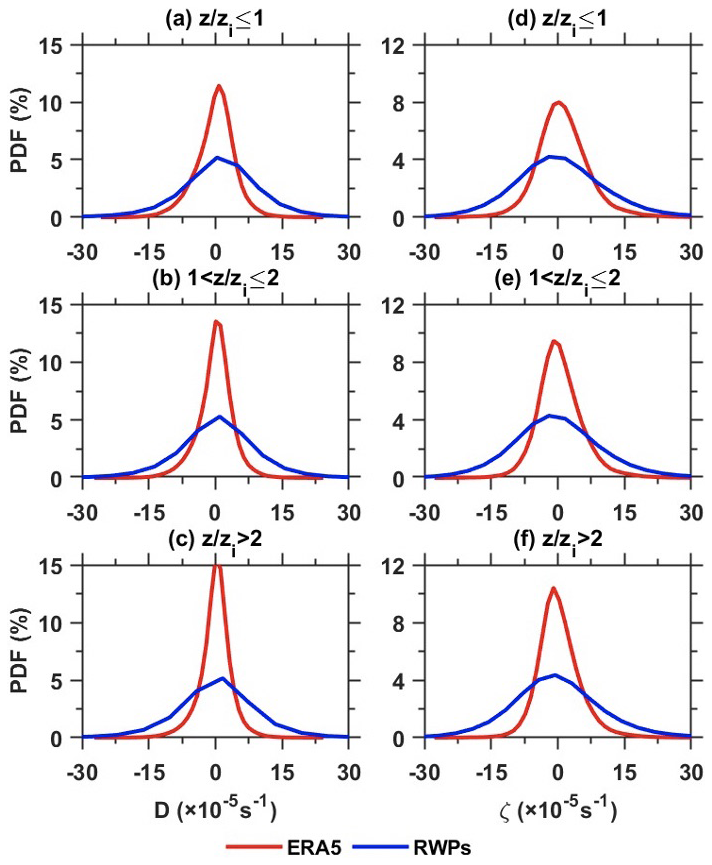
Figure 2The probability density function (PDF) of horizontal divergence (D) estimated from the measurements of the RWP mesonet (blue line) and ERA5 reanalysis (red line) at the height of (a) , (b) , and (c) ; (d–f) the same as (a)–(c) but for the PDF of vertical vorticity (ζ).
To further explore the overall differences in vertical profiles between reanalysis datasets and observations more quantitatively, divergence and vorticity from RWP mesonet measurements are validated against ERA5 after interpolating the reanalysis to the corresponding level. As shown in Fig. 3a–c, the ERA5 reanalysis cannot characterize the potential horizontal and vertical motion in a non-precipitation environment with a correlation coefficient (R) of less than 0.1. It is also evident that ERA5 exhibits a substantial underestimation of divergence, especially at higher altitudes. What is noteworthy is that the ERA5 reanalysis exhibits better performance in representing vertical vorticity with R reaching 0.3 even though the disparity is still apparent (Fig. 3d–f). This could be due to the magnitude of vorticity being greater than that of divergence.
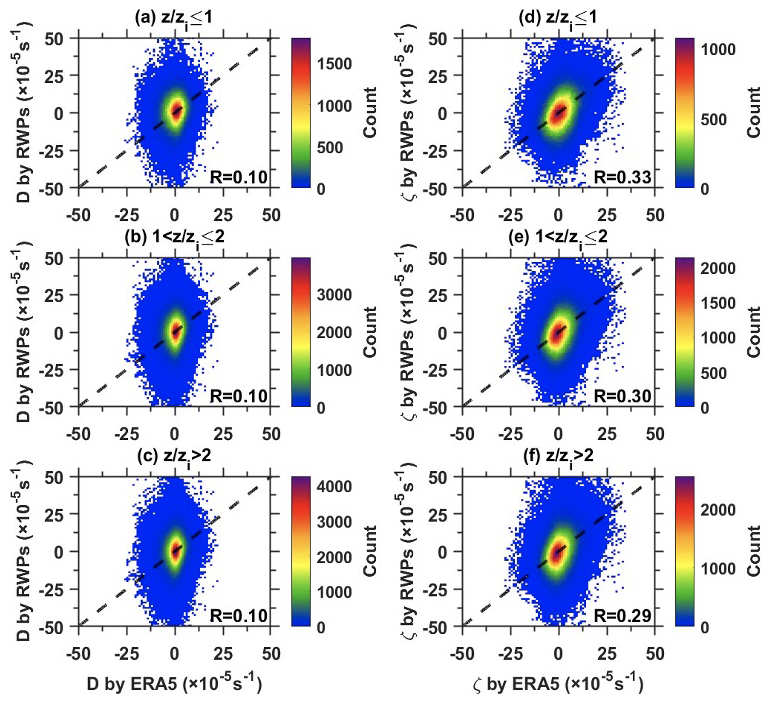
Figure 3Scatterplots of the horizontal divergence (D) from the measurements of the RWP mesonet versus the ERA5 reanalysis at the heights of (a) , (b) , and (c) with the 1:1 line shown as black dashed lines, respectively. The color bar indicates the counts of data points. (d–f) The same as (a)–(c) but for the vertical vorticity (ζ).
4.1 Statistical characteristics of the two dynamic variables
The ERA5 reanalysis with lower temporal resolution is recognized to have a limited capability of characterizing the temporally continuous evolution of atmospheric motion in a pre-storm environment over a mesoscale region. It is desirable to fill this gap with height-resolved dynamic variables as calculated with RWP mesonet measurements at 6 min intervals. In this section, we attempt to explore how the horizontal divergence and vertical vorticity derived from the RWP mesonet could be used as precursors for the pre-storm environment conditions. The triangle-area-averaged 6 min rainfall amount (mm), which is obtained from 29, 42, 49, and 15 rain gauges in triangles 1, 2, 3, and 4, respectively, is used to identify rainfall events occurring during the whole year of 2023 over Beijing's RWP mesonet. For each triangle, all rainfall moments are selected when the 6 min accumulated triangle-area-averaged rainfall is greater than zero. Considering the intermittent nature of rainfall, all the adjacent rainfall events separated by less than 2 h are classified as the same rainfall event. That is to say, the interval between two rainfall events is required to be at least 2 h. The first and last rainfall moment of every rainfall event is defined as the occurrence and ending time of rainfall event, respectively. To avoid the impact of data errors, the rainfall events with a duration of less than 30 min are discarded. Finally, a total of 462 rainfall events are identified over the RWP mesonet in 2023.
Figure 4a and b present the normalized contoured frequency by altitude (NCFAD) for all profiles of the horizontal divergence and vertical vorticity as observed by the RWP mesonet in non-precipitation days, respectively. Specifically, the values of horizontal divergence and vertical vorticity are overall distributed around zero above 2.5 km a.m.s.l. The magnitude of vorticity is greater than that of divergence with more vertical fluctuation in the mid-troposphere. Weak diffluence as indicated by positive divergence values exists in the lower troposphere below 2 km a.m.s.l. By comparison, the pre-storm dynamic environment within 1 h preceding rainfall events (Fig. 4c and d) exhibits significant difference, which implies the presence of complex vertical motion in this unstable atmosphere. The divergence below 1 km a.m.s.l. significantly concentrates from s−1 to zero before rainfall events (Fig. 4c). As indicated in Fig. 4d, the lowest layer is dominated by positive vorticity centering near 1 km a.m.s.l.
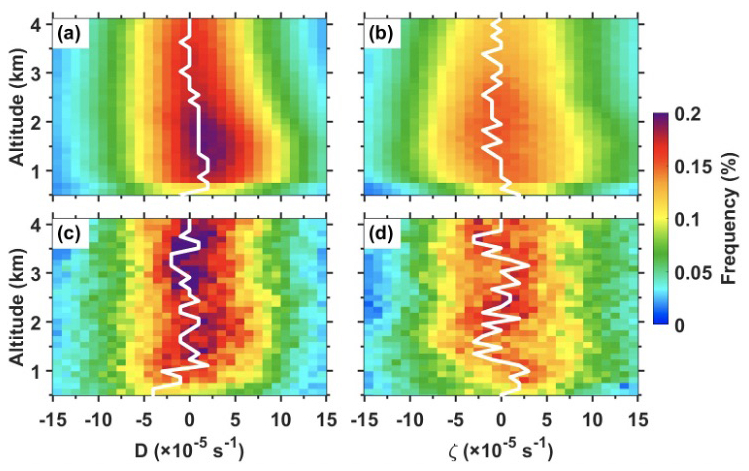
Figure 4Normalized contoured frequency by altitude (NCFAD) for the horizontal divergence (a) and vertical vorticity (b) between 0.51 and 4.11 km a.m.s.l. as calculated by RWP mesonet measurements in non-precipitation days of 2023 in Beijing. The white line represents the profile of maximum frequency distribution. (c, d) Same as (a) and (b), except for the frequency distribution within 1 h preceding rainfall events.
Using dynamic parameters with higher temporal resolution obtained from the RWP mesonet, our aim is to further explore potential patterns or trends in the pre-rainfall convection environment during the lead time. Figure 5a and b show the evolutions of average profiles of horizontal divergence and vertical vorticity at a 12 min interval before the occurrence of rainfall events. The significant increase in average convergence below 1.5 km a.m.s.l. within 48 min ahead of precipitation (Fig. 5a) is largely contributed to by the fact that near-surface air tends to strongly converge into the pre-squall mesotrough when a convective system approaches. The main convection was collocated with low-level convergence and mid-level divergence placed ahead of the precipitation center. These patterns are consistent with previous studies (Wilson and Schreiber, 1986; Zhang et al., 1989; Qin and Chen, 2017; Yin et al., 2020).
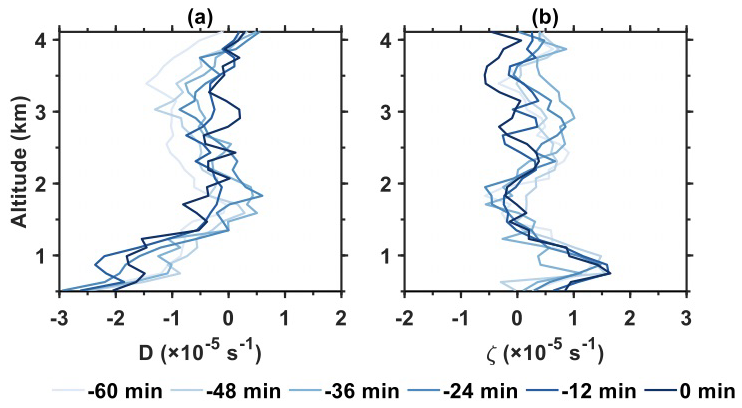
Figure 5Evolution of the profiles of horizontal divergence (a) and vertical vorticity (b) between 0.51 and 4.11 km a.m.s.l. averaged over 12 min, which are calculated from the RWP mesonet (blue line) in Beijing within 1 h before the onset of rainfall events in 2023.
Similarly, the increase in vertical vorticity shown in Fig. 5b might be associated with significant horizontal wind shear. The preexisting ambient wind field before the arrival of MCSs is critical to system organization since the orientation of its vertical shear directly influences an asymmetric precipitation structure with mesoscale rotation. In addition, the mesoscale convectively vortex (MCV) may result from deep and moist convection prior to the passage of the MCS (Wang et al., 1993). Trier et al. (1997) indicated that the MCS-induced horizontal flow and its associated vertical shear are critical factors which influence the development of the vortex. This southwesterly flow, enhanced by the MCV circulation, transports moisture northward in the lower troposphere, thereby creating potential instability ahead of the vortex center. Such an environment is favorable for convection and further leads to heavy precipitation (Johnson et al., 1989; Hendricks et al., 2004; Lai et al., 2011).
4.2 Temporal patterns of divergence during a convective process
Due to the direct connection between horizontal divergence and vertical motion, we attempt to further discuss how the RWP-derived divergence could practically benefit short-term forecasting of a convective rainfall event. The evolution of 30 min accumulated rainfall from rain gauge measurements is given in Fig. 6. After 04:00 LST on 22 July 2023, an early-morning event occurred in Beijing with a maximum rainfall rate exceeding 10 mm within 30 min. This event was associated with the transport of moisture as the subtropical storm moved northward. The main region of precipitation was located to the southeast of Beijing before 05:00 LST, and there was no significant rainfall within the RWP mesonet (Fig. 6a and b). As the major convective storm slowly propagated northward and approached the edge of triangle 3 after 05:00 LST (Fig. 6c), the precipitation then took place. Interestingly, a few new cells at the meso-γ-scale formed in triangle 1 at the same time (Fig. 6d and e) and expanded rapidly to other triangles (Fig. 6f and h). The uneven precipitation caused by these isolated and scattered convection cells was a difficult problem in monitoring and nowcasting. Of relevance to this study was the potential application of the RWP-derived divergence profiles for capture the CI and subsequent rainfall.
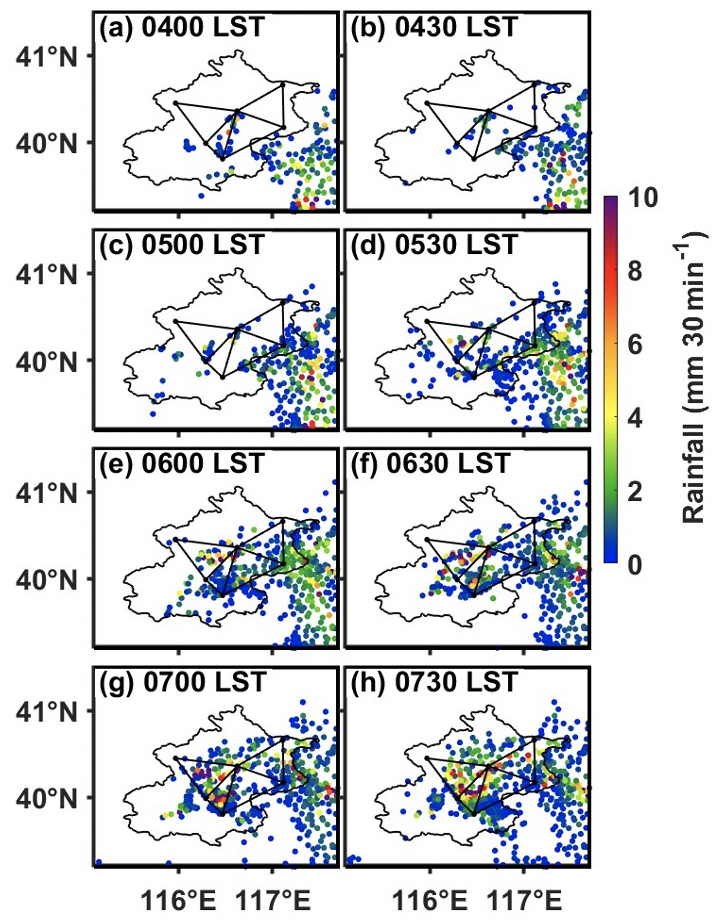
Figure 6Accumulated precipitation (mm per 30 min; colored dots) at (a) 04:00 (b) 04:30, (c) 05:00, (d) 05:30, (e) 06:00, (f) 06:30, (g) 07:00, and (h) 07:30 LST on 22 July 2023. The RWP mesonet is also plotted (see Fig. 1a for the location).
Figure 7a–d display the time series of the rainfall rates and vertical profiles of the area-averaged divergence during the period of 04:00–07:30 LST on 22 July 2023 in triangles 1–4, respectively. Specifically, one can see the presence of weak convergence below 2 km a.m.s.l. with significant divergence above after 04:00 LST in triangle 1 (Fig. 7a). Subsequently, the convergence layer deepened up to 3.5 km a.g.l. from 04:30 LST. The low-level convergence simultaneously strengthened with the maximum value of s−1 near 1 km a.m.s.l. at 04:48 LST. The signals of prevailing convergence in the lower troposphere provided favorable upward motions for the important lifting of water vapor in the PBL ahead of the convective rainfall. The more intense convergence and upward motion were also well detected in triangle 2 below 1.23 km a.m.s.l. after 04:48 LST (Fig. 7b), which coincided with the generation of rainfall in triangle 1. The inflow over triangle 2 could be attributed to the fact that cold downdraft air in triangle 1 tended to converge into the mesotrough ahead of convection. Even considering the strongest convergence of triangle 2 resulted from the smallest area to a certain extent, such a significant enhanced trend was evident. Similarly, the rainfall in triangle 2 started at 05:30 LST, which is closely related to pronounced convergence and upward motion in the lower troposphere.
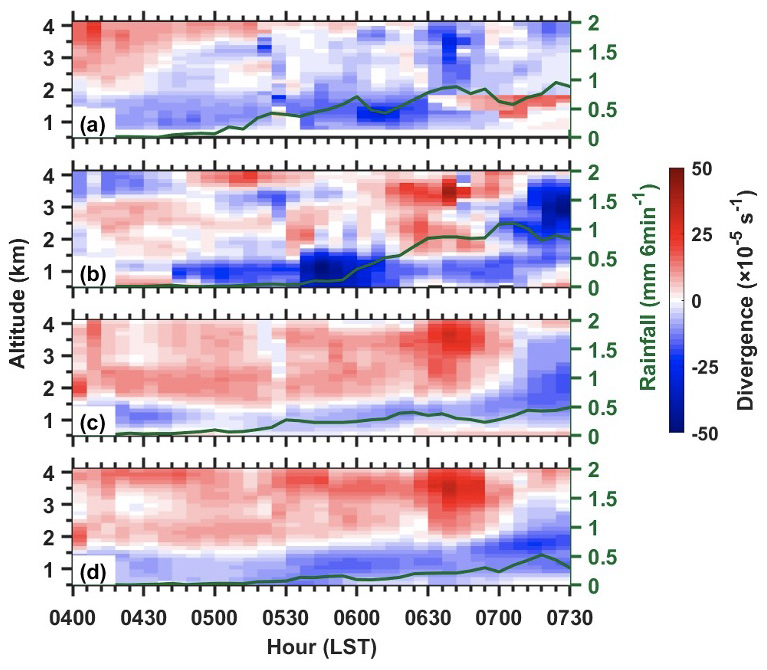
Figure 7The vertical profiles of the triangle-averaged divergence (10−5 s−1, shading) derived from the RWP mesonet in Beijing at 120 m vertical resolution between 0.51 and 4.11 km a.m.s.l. at 6 min intervals during the period of 04:00–07:30 LST on 22 July 2023 for (a) triangle 1, (b) triangle 2, (c) triangle 3, and (d) triangle 4 (see their distributions in Fig. 1a). Green dotted lines represent the triangle-area-averaged rainfall amount (mm per 6 min).
As shown in Fig. 7c and d, the relationship between vertical profiles of divergence and rainfall for triangles 3 and 4 during the rainy period was analogous to that for triangles 1 and 2. Nevertheless, triangles 3 and 4 experienced relatively weaker low-level convergence below 1.5 km a.m.s.l. The presence of dominated divergence layer above is not conducive to the extension of upward movement and formation of convective clouds. The weaker peak area-averaged rainfall rate was seen in triangles 3 and 4 in contrast. Clearly, it has been proven that the RWP mesonet has the capability of detecting the continuous vertical profiles of divergence leading to the onset of precipitation at high spatial and temporal resolutions. However, the development of convection is also affected by many other thermal and dynamic variables, and it should be noted that it is feasible to qualitatively determine the change in rainfall rather than quantitatively.
The divergence and vorticity dataset over Beijing can be accessed at https://doi.org/10.5281/zenodo.15297246 (Guo and Guo, 2024). We are grateful to ECMWF for providing ERA5 hourly data by Copernicus Climate Change Service (C3S) Climate Data Store (CDS), which are available at https://doi.org/10.24381/cds.bd0915c6 (Hersbach et al., 2023). The meteorological measurements of automatic weather stations are obtained from the National Meteorological Information Center of China Meteorological Administration (https://data.cma.cn, CMA, 2025) after registration.
The generation and organization of convergence and rotation are the recurring theme of baroclinic convection in midlatitudes during the warm season. Owing to relatively few direct observations, the detailed structure of MCSs has not been exactly explored. The unique aspect of this study is the analysis of the enhanced observations derived from the new-generation ground-based RWP mesonet in Beijing. The RWP mesonet is shown being capable of continuously observing the horizontal wind fields in the lower troposphere with ultra-high vertical and temporal resolutions. The horizontal wind measurements are then used to calculate the vertical profiles of the triangle-area-averaged horizontal divergence and vertical vorticity, which is well indicative of the dynamic structure in the lower to mid-troposphere.
Compared to the vertical profiles with higher accuracy, ERA5 exhibits a substantial underestimation of divergence and vorticity, especially at higher altitudes. The ERA5 reanalysis cannot characterize the potential horizontal and vertical motion even in a non-precipitation environment. The limitation may be likely due to the lack of higher-level wind profiling measurements in China being assimilated into ERA models. In addition, the ERA5 reanalysis is unable to identify the propagation of MCSs and provide the real-time precursor signals of precipitation. The RWP-derived convergence and cyclonic circulation can provide useful information with a temporal resolution of 6 min for detecting rainfall initiation and filling the gap of sounding and reanalysis for nowcasting the occurrence of rainfall events.
For this purpose, a statistical analysis of the vertical divergence and vorticity profiles preceding rainfall events over the RWP mesonet in 2023 are performed. Results show that the patterns of increasing low-level convergence and cyclonic circulation are evident before the occurrence of rainfall events. This indicates the development of the corresponding upward motion, at least in the lower troposphere, prior to the arrival and the passage of the storm, respectively. The convergence near the surface, in combination with the low-level cyclonic rotation, provides favorable dynamic conditions to lift moist air for the subsequent formation of clouds and onset of the convective rainfall.
In conclusion, the RWP mesonet can be used to calculate the vertical profiles of divergence and vorticity in the lower to mid-troposphere that is more realistically compared to a reanalysis dataset. These dynamic variables from observations can provide useful information for characterizing the process of convection and detecting rainfall initiation in advance. It is imperative to apply them to nowcasting severe weather events as well as the improvement of initial conditions in numerical weather prediction models. While the results presented above are encouraging, the potential effects of the heterogeneous urban landscape and complex terrain of the Beijing region cannot be discussed temporarily. Furthermore, the observational gaps near the surface will be filled by wind lidars in a forthcoming study, which will be beneficial for exploring the bifurcation of flow by the high-rise buildings over the built-up area and revealing the mesoscale circulation by the urban heat island effect.
JG designed the research framework and conceptualized this study. XG and JG conducted the experiment and drafted the initial manuscript. TC and NL helped the data collection and carried out the quality control. LZ, JC, ZZ, and YS contributed to the revision of the manuscript. All authors participated in result interpretation.
The contact author has declared that none of the authors has any competing interests.
Publisher's note: Copernicus Publications remains neutral with regard to jurisdictional claims made in the text, published maps, institutional affiliations, or any other geographical representation in this paper. While Copernicus Publications makes every effort to include appropriate place names, the final responsibility lies with the authors.
. We appreciate tremendously the constructive comments and suggestions made by the editor and two anonymous reviewers that significantly improved the quality of our manuscript.
This paper was conceived jointly under the auspices of the National Natural Science Foundation of China (grant no. 42325501), the National Key Research and Development Program of China (grant no. 2024YFC3013001), the Chinese Academy of Meteorological Sciences (grant no. 2024Z003), and the Department of Science and Technology of Guizhou province (grant no. KXJZ [2024] 033).
This paper was edited by Chunlüe Zhou and reviewed by two anonymous referees.
Adler, B. and Kalthoff, N.: Multi-scale transport processes observed in the boundary layer over a mountainous island, Bound.-Lay. Meteorol., 153, 515–537, https://doi.org/10.1007/s10546-014-9957-8, 2014.
Angevine, W. M.: Errors in mean vertical velocities measured by boundary layer wind profilers, J. Atmos. Ocean. Tech., 14, 565, https://doi.org/10.1175/15200426(1997)014$<$0565:EIMVVM, 1996.
Bai, L., Meng, Z., Huang, Y., Zhang, Y., Niu, S., and Su, T.: Convection initiation resulting from the interaction between a quasi-stationary dryline and intersecting gust fronts: A case study, J. Geophys. Res.-Atmos., 124, 2379–2396, https://doi.org/10.1029/2018JD029832, 2019.
Bellamy, J. C.: Objective calculations of divergence, vertical velocity and vorticity, B. Am. Meteorol. Soc., 30, 45–49, https://doi.org/10.1175/1520-0477-30.2.45, 1949.
Bony, S. and Stevens, B.: Measuring area-averaged vertical motions with dropsondes, J. Atmos. Sci., 76, 767–783, https://doi.org/10.1175/JAS-D-18-0141.1, 2019.
Bony, S., Stevens, B., Ament, F., Bigorre, S., Chazette, P., Crewell, S., Delanoë, J., Emanuel, K., Farrell, D., Flamant, C., Gross, S., Hirsch, L., Karstensen, J., Mayer, B., Nuijens, L., Ruppert Jr., J. H., Sandu, I., Siebesma, P., Speich, S., Szczap, F., Totems, J., Vogel, R., Wendisch, M., and Wirth, M.: EUREC4A: A field campaign to elucidate the couplings between clouds, convection and circulation, Surv. Geophys., 38, 1529–1568, https://doi.org/10.1007/s10712-017-9428-0, 2017.
Bosart, L. F. and Sanders, F.: The Johnstown flood of July 1977: A long-lived convective storm, J. Atmos. Sci., 38, 1616–1642, https://doi.org/10.1175/1520-0469(1981)038<1616:TJFOJA>2.0.CO;2, 1981.
Brandes, E. A. and Ziegler, C. L.: Mesoscale downdraft influences on vertical vorticity in a mature mesoscale convective system, Mon. Weather Rev., 121, 1337–1353, https://doi.org/10.1175/1520-0493(1993)121<1337:MDIOVV>2.0.CO;2, 1993.
Chen, T., Guo, J., Guo, X., Zhang, Y., Xu, H., and Zhang, D.-L.: On the multiscale processes leading to an extreme gust wind event in East China: Insights from radar wind profiler mesonet observations, J. Geophys. Res.-Atmos., 129, e2024JD041484, https://doi.org/10.1029/2024JD041484, 2024.
CMA – China Meteorological Administration: https://data.cma.cn (last access: 23 July 2025), 2025.
Dai, C., Wang, Q., Kalogiros, J. A., Lenschow, D. H., Gao, Z., and Zhou, M.: Determining boundary-layer height from aircraft measurements, Bound.-Lay. Meteorol., 152, 277–302, https://doi.org/10.1007/s10546-014-9929-z, 2014.
Davies-Jones, R.: Useful, formulas for computing divergence, vorticity, and their errors from three or more stations, Mon. Weather Rev., 121, 713–725, 1993.
Dodson, D. S. and Small Griswold, J. D.: Turbulent and boundary layer characteristics during VOCALS-REx, Atmos. Chem. Phys., 21, 1937–1961, https://doi.org/10.5194/acp-21-1937-2021, 2021.
Fankhauser, J. C., Crook, N. A., Tuttle, J., Miller, L. J., and Wade, C. G.: Initiation of Deep Convection along Boundary Layer Convergence Lines in a Semitropical Environment, Mon. Weather Rev., 123, 291–314, 1995.
Guo, J. and Guo, X.: A temporally continuous divergence and vorticity dataset in Beijing derived from the radar wind profiler mesonet during 2023, Zenodo [data set], https://doi.org/10.5281/zenodo.15297246, 2024.
Guo, J., Liu, B., Gong, W., Shi, L., Zhang, Y., Ma, Y., Zhang, J., Chen, T., Bai, K., Stoffelen, A., de Leeuw, G., and Xu, X.: Technical note: First comparison of wind observations from ESA's satellite mission Aeolus and ground-based radar wind profiler network of China, Atmos. Chem. Phys., 21, 2945–2958, https://doi.org/10.5194/acp-21-2945-2021, 2021a.
Guo, J., Zhang, J., Yang, K., Liao, H., Zhang, S., Huang, K., Lv, Y., Shao, J., Yu, T., Tong, B., Li, J., Su, T., Yim, S. H. L., Stoffelen, A., Zhai, P., and Xu, X.: Investigation of near-global daytime boundary layer height using high-resolution radiosondes: first results and comparison with ERA5, MERRA-2, JRA-55, and NCEP-2 reanalyses, Atmos. Chem. Phys., 21, 17079–17097, https://doi.org/10.5194/acp-21-17079-2021, 2021b.
Guo, X., Guo, J., Zhang, D.-L., and Yun, Y.: Vertical divergence profiles as detected by two wind profiler mesonets over East China: implications for nowcasting convective storms, Q. J. Roy. Meteor. Soc., 149, 1629–1649, https://doi.org/10.1002/qj.4474, 2023.
Guo, X., Guo, J., Chen, T., Li, N., Zhang, F., and Sun, Y.: Revisiting the evolution of downhill thunderstorms over Beijing: a new perspective from a radar wind profiler mesonet, Atmos. Chem. Phys., 24, 8067–8083, https://doi.org/10.5194/acp-24-8067-2024, 2024.
Hendricks, E. A., Montgomery, M. T., and Davis, C. A.: On the role of “vortical” hot towers in formation of tropical cyclone Diana, J. Atmos. Sci., 61, 1209–1232, https://doi.org/10.1175/1520-0469(2004)061<1209:TROVHT>2.0.CO;2, 2004.
Hersbach, H., Bell, B., Berrisford, P., Hirahara, S., Horányi, A., Muñoz-Sabater, J., Nicolas, J., Peubey, C., Radu, R., Schepers, D., Simmons, A., Soci, C., Abdalla, S., Abellan, X., Balsamo, G., Bechtold, P., Biavati, G., Bidlot, J., Bonavita, M., De Chiara, G., Dahlgren, P., Dee, D., Diamantakis, M., Dragani, R., Flemming, J., Forbes, R., Fuentes, M., Geer, A., Haimberger, L., Healy, S., Hogan, R. J., Hólm, E., Janisková, M., Keeley, S., Laloyaux, P., Lopez, P., Lupu, C., Radnoti, G., de Rosnay, P., Rozum, I., Vamborg, F., Villaume, S., and Thépaut, J. N.: The ERA5 global reanalysis, Q. J. Roy. Meteor. Soc., 146, 1999–2049, https://doi.org/10.1002/qj.3803, 2020.
Hersbach, H., Bell, B., Berrisford, P., Biavati, G., Horányi, A., Muñoz Sabater, J., Nicolas, J., Peubey, C., Radu, R., Rozum, I., Schepers, D., Simmons, A., Soci, C., Dee, D., and Thépaut, J.-N.: ERA5 hourly data on pressure levels from 1940 to present, Copernicus Climate Change Service (C3S) Climate Data Store (CDS) [data set], https://doi.org/10.24381/cds.bd0915c6, 2023.
Holland, J. Z.: Preliminary report on the BOMEX sea-air interaction program, B. Am. Meteorol. Soc., 51, 809–820, https://doi.org/10.1175/1520-0477(1970)051<0809:PROTBS>2.0.CO;2, 1970.
Johnson, R. H., Chen, S., and Toth, J. J.: Circulations associated with a mature-to-decay midlatitude mesoscale convective system. Part I: Surface features-heat bursts and mesolow development, Mon. Weather Rev., 117, 942–959, https://doi.org/10.1175/1520-0493(1989)117<0942:CAWAMT>2.0.CO;2, 1989.
Kalthoff, N., Adler, B., Barthlott, C., Corsmeier, U., Mobbs, S., Crewell, S., Träumner, K., Kottmeier, C., Wieser, A., Smith, V., and Girolamo, P.: The impact of convergence zones on the initiation of deep convection: A case study from COPS, Atmos. Res., 93, 680–694, 2009.
Lai, H. W., Davis, C. A., and Jou, B. J.-D.: A subtropical oceanic mesoscale convective vortex observed during SoWMEX/TiMREX, Mon. Weather Rev., 139, 2367–2385, https://doi.org/10.1175/2010MWR3411.1, 2011.
Lee, J. L. and Browning, G. L.: Analysis of Errors in the Horizontal Divergence Derived from High Temporal Resolution of the Wind, Mon. Weather Rev., 122, 851–863, https://doi.org/10.1175/1520-0493(1994)122<0851:AOEITH>2.0.CO;2, 1994.
Lenschow, D. H., Krummel, P. B., and Siems, S. T.: Measuring entrainment, divergence, and vorticity on the mesoscale from aircraft, J. Atmos. Ocean. Tech., 16, 1384–1400, https://doi.org/10.1175/1520-0426(1999)016<1384:MEDAVO>2.0.CO;2, 1999.
Lenschow, D. H., Savic-Jovcic, V., and Stevens, B.: Divergence and vorticity from aircraft air motion measurements, J. Atmos. Ocean. Tech., 24, 2062–2072, https://doi.org/10.1175/2007JTECHA940.1, 2007.
Liu, B., Ma, Y., Guo, J., Gong, W., Zhang, Y., Mao, F., Li, J., Guo, X., and Shi, Y.: Boundary layer heights as derived from ground-based radar wind profiler in Beijing, IEEE T. Geosci. Remote, 57, 8095–8104, https://doi.org/10.1109/TGRS.2019.2918301, 2019.
Lock, N. A. and Houston, A. L.: Empirical examination of the factors regulating thunderstorm initiation, Mon. Weather Rev., 142, 240–258, https://doi.org/10.1175/MWR-D-13-00082.1, 2014.
McCaffrey, K., Bianco, L., Johnston, P., and Wilczak, J. M.: A comparison of vertical velocity variance measurements from wind profiling radars and sonic anemometers, Atmos. Meas. Tech., 10, 999–1015, https://doi.org/10.5194/amt-10-999-2017, 2017.
Nitta, T. and Esbensen, S.: Heat and moisture budget analyses using BOMEX data, Mon. Weather Rev., 102, 17–28, https://doi.org/10.1175/1520-0493(1974)102<0017:HAMBAU>2.0.CO;2, 1974.
Purdom, J. F. W.: Some uses of high-resolution GOES imagery in the mesoscale forecasting of convection and its behavior, Mon. Weather Rev., 104, 1474–1483, https://doi.org/10.1175/1520-0493(1976)104<1474:SUOHRG>2.0.CO;2, 1976.
Qin, R. and Chen, M.: Impact of a front–dryline merger on convection initiation near a mountain ridge in Beijing, Mon. Weather Rev., 145, 2611–2633, https://doi.org/10.1175/MWR-D-16-0369.1, 2017.
Shapiro, A., Potvin, C. K., and Jidong, G.: Use of a vertical vorticity equation in variational dual-Doppler wind analysis, J. Atmos. Ocean. Tech., 26, 2089–2106, 2009.
Su, T. N., Li, Z. Q., and Zheng, Y. T.: Cloud-Surface Coupling Alters the Morning Transition from Stable to Unstable Boundary Layer, Geophys. Res. Lett., 50, e2022GL102256, https://doi.org/10.1029/2022gl102256, 2023.
Taszarek, M., Pilguj, N., Allen, J. T., Gensini, V., Brooks, H. E., and Szuster, P.: Comparison of convective parameters derived from ERA5 and MERRA-2 with rawinsonde Data over Europe and North America, J. Climate, 34, 3211–3237, https://doi.org/10.1175/JCLI-D-20-0484.1, 2021.
Trier, S. B., Skamarock, W. C., and LeMone, M. A.: Structure and evolution of the 22 February 1993 TOGA Squall Line: Organization Mechanisms Inferred from Numerical Simulation, J. Atmos. Sci., 54, 386–407, https://doi.org/10.1175/1520-0469(1997)054<0386:SAEOTF>2.0.CO;2, 1997.
Ulanski, S. L. and Garstang, M.: The role of surface divergence and vorticity in the life cycle of convective rainfall. Part I: Observations and analysis, J. Atmos. Sci., 35, 1047–1062, https://doi.org/10.1175/1520-0469(1978)035<1063:TROSDA>2.0.CO;2, 1978.
Wang, L., Wang, G., Gu, Y., Li, H., Ma, L., Guo, J., and Qiao, L.: Application of Wind Profiler Radar Vertical Radial Velocity, Meteorological Monthly, 40, 290–296, https://doi.org/10.7519/j.issn.1000-0526.2014.03.004, 2014.
Wang, W., Kuo, Y. H., and Warner, T. T.: A diabatically driven mesoscale vortex in the lee of the Tibetan Plateau, Mon. Weather Rev., 121, 2542–2561, 1993.
Weckwerth, T. M. and Parsons, D. B.: A review of convection initiation and motivation for IHOP 2002, Mon. Weather Rev., 134, 5–22, https://doi.org/10.1175/MWR3067.1, 2006.
Weckwerth, T. M., Hanesiak, J., Wilson, J. W., Trier, S. B., Degelia, S. K., Gallus Jr., W. A., Roberts, R. D., and Wang, X.: Nocturnal convection initiation during PECAN 2015, B. Am. Meteorol. Soc., 100, 2223–2239, https://doi.org/10.1175/BAMS-D-18-0299.1, 2019.
Wilson, J. W. and Roberts, R. D.: Summary of convective storm initiation and evolution during IHOP: Observational and modeling perspective, Mon. Weather Rev., 134, 23–47, https://doi.org/10.1175/MWR3069.1, 2006.
Wilson, J. W. and Schreiber, W. E.: Initiation of convective storms at radar-observed boundary-layer convergence lines, Mon. Weather Rev., 114, 2516–2536, https://doi.org/10.1175/1520-0493(1986)114<2516:iocsar>2.0.co;2, 1986.
Yanai, M. and Nitta, T.: Computation of vertical motion and vorticity budget in a Caribbean easterly wave, J. Meteorol. Soc. Jpn., 45, 444–466, 1967.
Yin, J., Zhang, D.-L., Luo, Y., and Ma, R.: On the extreme rainfall event of 7 May 2017 over the coastal city of Guangzhou. Part I: Impacts of urbanization and orography, Mon. Weather Rev., 148, 955–979, https://doi.org/10.1175/MWR-D-19-0212.1, 2020.
Zhang, D. L. and Fritsch, J. M.: Numerical simulation of the Meso-β scale structure and evolution of the 1977 Johnstown flood. Part II: Inertially stable warm-core vortex and the mesoscale convective complex, J. Atmos. Sci., 43, 1913–1944, https://doi.org/10.1175/1520-0469(1986)043<1913:NSOTMS>2.0.CO;2, 1986.
Zhang, D.-L., Gao, K., and Parsons, D. B.: Numerical simulation of an intense squall line during 10–11 June 1985 PRE-STORM. Part I: Model verification, Mon. Weather Rev., 117, 960–994, https://doi.org/10.1175/1520-0493(1989)117<0960:NSOAIS>2.0.CO;2, 1989.
- Abstract
- Introduction
- Data and methodology
- Comparison analysis of dynamic variables from RWP and those from ERA5
- Height-resolved dynamic conditions preceding rainfall events
- Data availability
- Concluding remarks and summary
- Author contributions
- Competing interests
- Disclaimer
- Acknowledgements
- Financial support
- Review statement
- References