the Creative Commons Attribution 4.0 License.
the Creative Commons Attribution 4.0 License.
 | 31 Jan 2025
Climate change risks illustrated by the Intergovernmental Panel on Climate Change (IPCC) “burning embers”
Philippe Marbaix
Alexandre K. Magnan
Veruska Muccione
Peter W. Thorne
Zinta Zommers
The completion of the Sixth Assessment Cycle of the Intergovernmental Panel on Climate Change (IPCC) provides a unique opportunity to understand where the world stands on climate-change-related risks to natural and human systems at the global level, as well as for specific regions and sectors. Since its Third Assessment Report (AR3), released 2 decades ago, the IPCC has developed a synthetic representation of how risks increase with global warming, with risk levels reflected by the colours used, including shades of yellow and red, which led to the nickname “burning embers”. While initially designed to illustrate five overarching Reasons for Concern, these diagrams have been progressively applied to risks in specific systems and regions over the last 10 years. However, the information gathered through expert elicitation and the resulting quantitative risk assessments have hitherto remained scattered within and across reports and specific data files. This paper overcomes this limitation by developing a database containing all embers from AR3 to AR6 and an associated online “Climate Risks Embers Explorer” (CREE) to facilitate the exploration of the assessed risks. The data are also available in an archive file in a widely accessible format (https://doi.org/10.5281/zenodo.12626976, Marbaix et al., 2024). Important aspects of data homogenization are discussed, and an approach to structuring information on assessed risk increases is presented. Potential uses of the data are explored through aggregated analyses of risks and adaptation benefits, which show that, excluding high-adaptation cases, half of the assessed risk levels increase from a moderate risk to a high risk between 1.5 and 2 to 2.3 °C of global warming, a result which is consistent with the separate assessment of the Reasons for Concern by the IPCC. The database lays the groundwork for future risk assessments and the development of burning embers by providing a standardized baseline of risk data. It also highlights important areas for improvement in the forthcoming Seventh Assessment Cycle of the IPCC, particularly towards the systematic, homogeneous, and structured collection of information on illustrated risk increases; comprehensive coverage of impacted regions; a systematic consideration of adaptation and/or vulnerability levels; and, possibly, the coverage of risks from response measures. In the context of an ever-growing body of literature and knowledge, the facility described herein has the potential to help in synthesizing and illustrating risks across scales and systems in a more consistent and comprehensive way.
- Article
(8339 KB) - Full-text XML
-
Supplement
(1139 KB) - BibTeX
- EndNote


Since its creation in 1988, the Intergovernmental Panel on Climate Change (IPCC) has been tasked to regularly synthesize and assess the scientific literature on anthropogenic climate change causes, processes, impacts on ecosystems, and socio-economic consequences, as well as possible responses (IPCC, 1989; UN General Assembly, 1988). The synthesis work has raised important methodological challenges related to the wide variety of information provided by various disciplines, with multiple uncertainties leading to differences among expert judgements (Preface and Summary for Policymakers (SPM) in Watson et al., 1996). Risk analyses are heterogeneous in terms of the metrics used, the risk processes assessed, the natural and/or human systems analysed, and both the spatial and the temporal scales considered. Despite these difficulties, having a synthetic view of risks is particularly important to inform decision-making. This was particularly the case with regard to helping define what might constitute a “dangerous anthropogenic interference with the climate system”, which the Framework Convention aims to avoid according to its Article 2 (UNFCCC, 1992). With this objective in mind, the IPCC devoted a chapter of its Third Assessment Report (Smith et al., 2001) to bringing together scientific knowledge that could provide a global overview of the risks by creating a new concept: the Reasons for Concern (RFCs). These are divided into five topics: unique and vulnerable systems, extreme events, distribution of impacts, aggregated impacts, and large-scale singular events. For each of these concerns, the increase in risk as a function of global average temperature was presented using a colour scale illustrating the levels of risk (Ahmad et al., 2001; Smith et al., 2001). The colours chosen, from white to red, have given these diagrams the nickname of “burning embers”.
The Reasons for Concern have been re-assessed in each subsequent IPCC report, although the Fourth Assessment Report (AR4) only provided an updated assessment in text form, with the ember diagram published in a spin-off paper (Smith et al., 2009; Zommers et al., 2020). Starting with the Fifth Assessment Report (AR5), the burning-ember diagrams have been applied to more specific risks (IPCC, 2014b). The AR5 also introduced an extended risk scale, with four discrete risk levels instead of three (undetectable, moderate, high, and very high, with the latter being the one added; these are shown in Table 1; see also Zommers et al., 2020). At the same time, the confidence in the assessment of each risk transition (the levels of warming at which risk increases from one level to the next) began to be assessed and reported on (IPCC, 2014a; O'Neill et al., 2017a). Following standard IPCC practice, a high level of confidence indicates that robust evidence is available and that there is high agreement about the findings (Mastrandrea et al., 2010; Rawshan Ara Begum et al., 2022).
Table 1The risk scale used in the IPCC reports since the AR5 (adapted from O'Neill et al., 2022a).
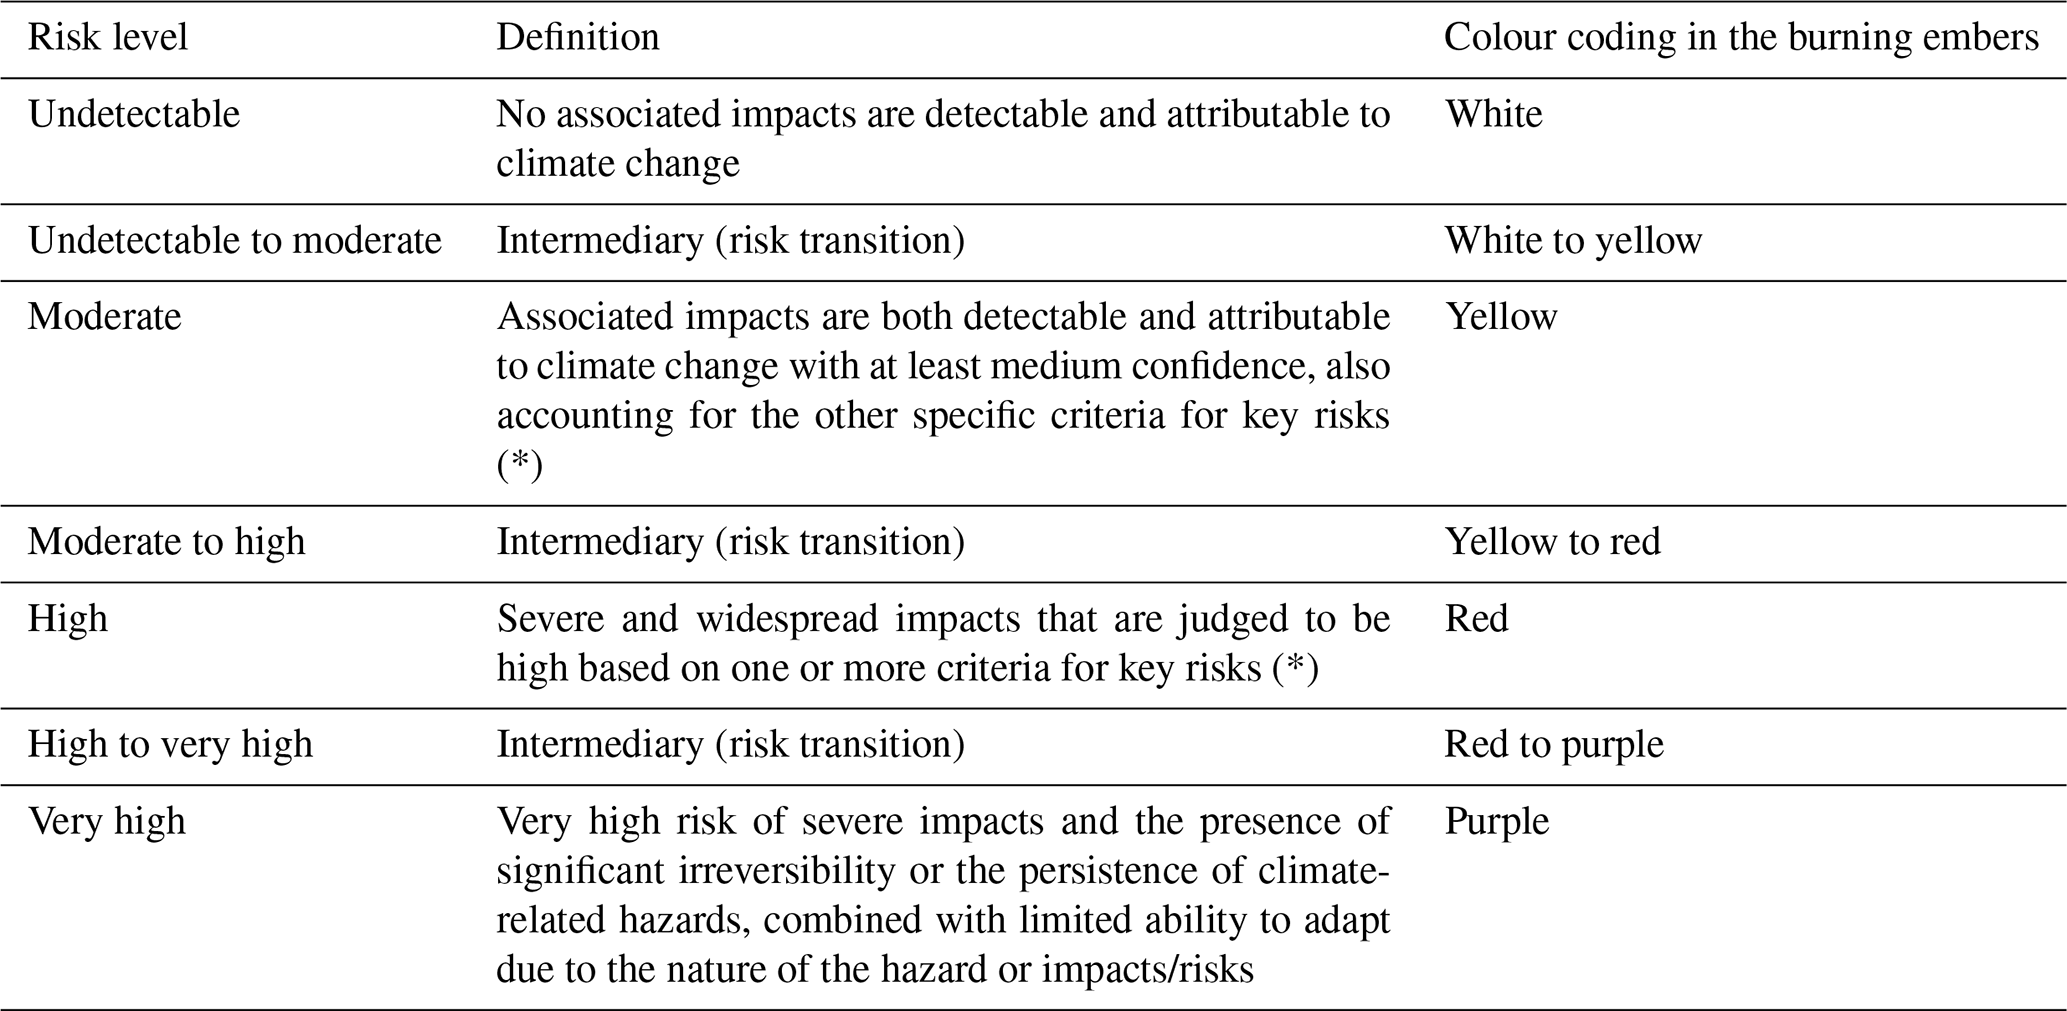
* Key risks refer to climate risks that have the potential to lead to severe consequences and that are therefore relevant to the interpretation of “dangerous anthropogenic interference with the climate system” (Magnan et al., 2023). The criteria for assessing key risks include the following (O'Neill et al., 2022a): the magnitude of the consequences (related to pervasiveness, degree of change, irreversibility, potential for thresholds, cascading effects to other systems), the likelihood of adverse consequences, the temporality or persistence, and the ability to respond to risk (including but not only through adaptation).
Information on future risks remains scattered in the literature; therefore, synthesis work remains a challenge which initiatives such as the Inter-Sectoral Impact Model Comparison Project (ISIMIP) are working to reduce by establishing a common analytical framework (Rosenzweig et al., 2017). The IPCC has developed its approach to synthesizing risks in a number of ways that may help to make it more systematic. In the AR4, it established criteria to define “key” vulnerabilities (Schneider et al., 2007), which formed the basis for the definition of “key risks” in the AR5 following changes in and clarifications of the conceptualization of vulnerability and risk (Oppenheimer et al., 2014). The AR5 and AR6 used this concept to identify the risks that need to be taken into account in assessing the RFCs (O'Neill et al., 2022a; Zommers et al., 2020). In the AR6, these criteria were used to select the risks illustrated in the burning-ember diagrams of some of the chapters (see, in particular, Bednar-Friedl et al., 2022a; Lawrence et al., 2022). While burning embers were based on literature reviews and expert judgements following the TAR (Third Assessment Report), a dedicated, structured expert elicitation process has been formalized more recently and has been progressively enacted (Zommers et al., 2020). The protocol involved several rounds of individual assessments of how risks change with climate, followed by sharing of the judgements and a discussion within the group dedicated to assessing a given climate risk.
More recently, the IPCC has progressively applied the burning-ember approach to various scales, from global to regional and local levels. In the Special Report on Climate Change and Land (SRCCL), the IPCC started to differentiate its analysis according to socio-economic development trajectories (Hurlbert et al., 2019a). Risks were assessed in the context of vulnerability, exposure, and/or adaptation potentials considered to be consistent with one of the Shared Socio-economic Pathways (SSPs) developed over the last decade (O'Neill et al., 2017b). The Special Report on the Ocean and Cryosphere (SROCC) assessed increasing risks due to sea level rise within a framework similar (but not identical) to that of burning embers; for the first time in this type of assessment, it distinguished two levels of implementation of response measures, which may include managed retreat and/or adaptation (IPCC, 2019; Oppenheimer et al., 2019).
The recent completion of the Sixth Assessment Cycle of the IPCC (AR6) offers the largest compilation of synthetic risk assessments in the form of burning embers to date (almost 90 % of all embers built so far occurred within the AR6 cycle), which provides a unique opportunity to understand climate risk in a more cross-region and cross-sector way – although the regional embers still only cover around half of the world. The semi-standardized expert elicitation method and the burning-ember diagrams provide consistency in the risk assessment across scales, systems, and sectors, offering a new overview of climate-related risks and forming a solid basis for risk communication and further research. The AR6 also made progress in terms of including adaptation scenarios when assessing future risks, hence also providing an opportunity to start understanding the potential role of adaptation efforts in terms of risk reduction at the global level (Magnan et al., 2021). In the end, all this material is seen to be important to feed into discussions under the United Nations Framework Convention on Climate Change (UNFCCC), and the AR6 outcomes have been widely recognized as an important contribution to the first Global Stocktake (UNFCCC, 2023).
While recent papers have made advances comparing risk and embers across different systems (Magnan et al., 2021), this paper goes a step further by considering all burning embers developed over the whole AR6 cycle. It introduces a database (Sect. 2) to gather all this material in a harmonized collection of information, facilitating and improving access to the results of past – and possibly future – burning-ember expert elicitation efforts. Based on this, it illustrates how such a structured database can be used to analyse climate risk across scales and systems, highlighting the potential role of mitigation and adaptation (Sect. 3), and discusses possible contributions to future risk assessments and the communication of their results (Sect. 4).
2.1 Objectives and structure of the database
2.1.1 Presentation of ember data
The information associated with a given burning ember can be divided into three categories: descriptive information about the risk being considered, (semi-) quantitative estimates of the global average temperature at which the risk for a given ember changes from one level to another and the associated confidence levels, and metadata including textual arguments for risk transitions. Figure 1 illustrates how the information associated with a given burning ember is presented in an online interface as an introduction to the content of the database. Ember data pages begin with the description of the risk under consideration. A table then provides the quantitative estimates of how risk increases with climate change and the associated confidence levels. This presentation is based on the practices in the Supplementary Material of IPCC reports since the Special Report on Global Warming of 1.5 °C (Hoegh-Guldberg et al., 2018; Zommers et al., 2020). The same structure is used in the input files for the Ember Factory software (Marbaix, 2020b), which was used to draw many of the AR6 embers. Finally, this view provides textual arguments for risk transitions and metadata. The database also contains information about how the embers are presented in figures, as explained below.
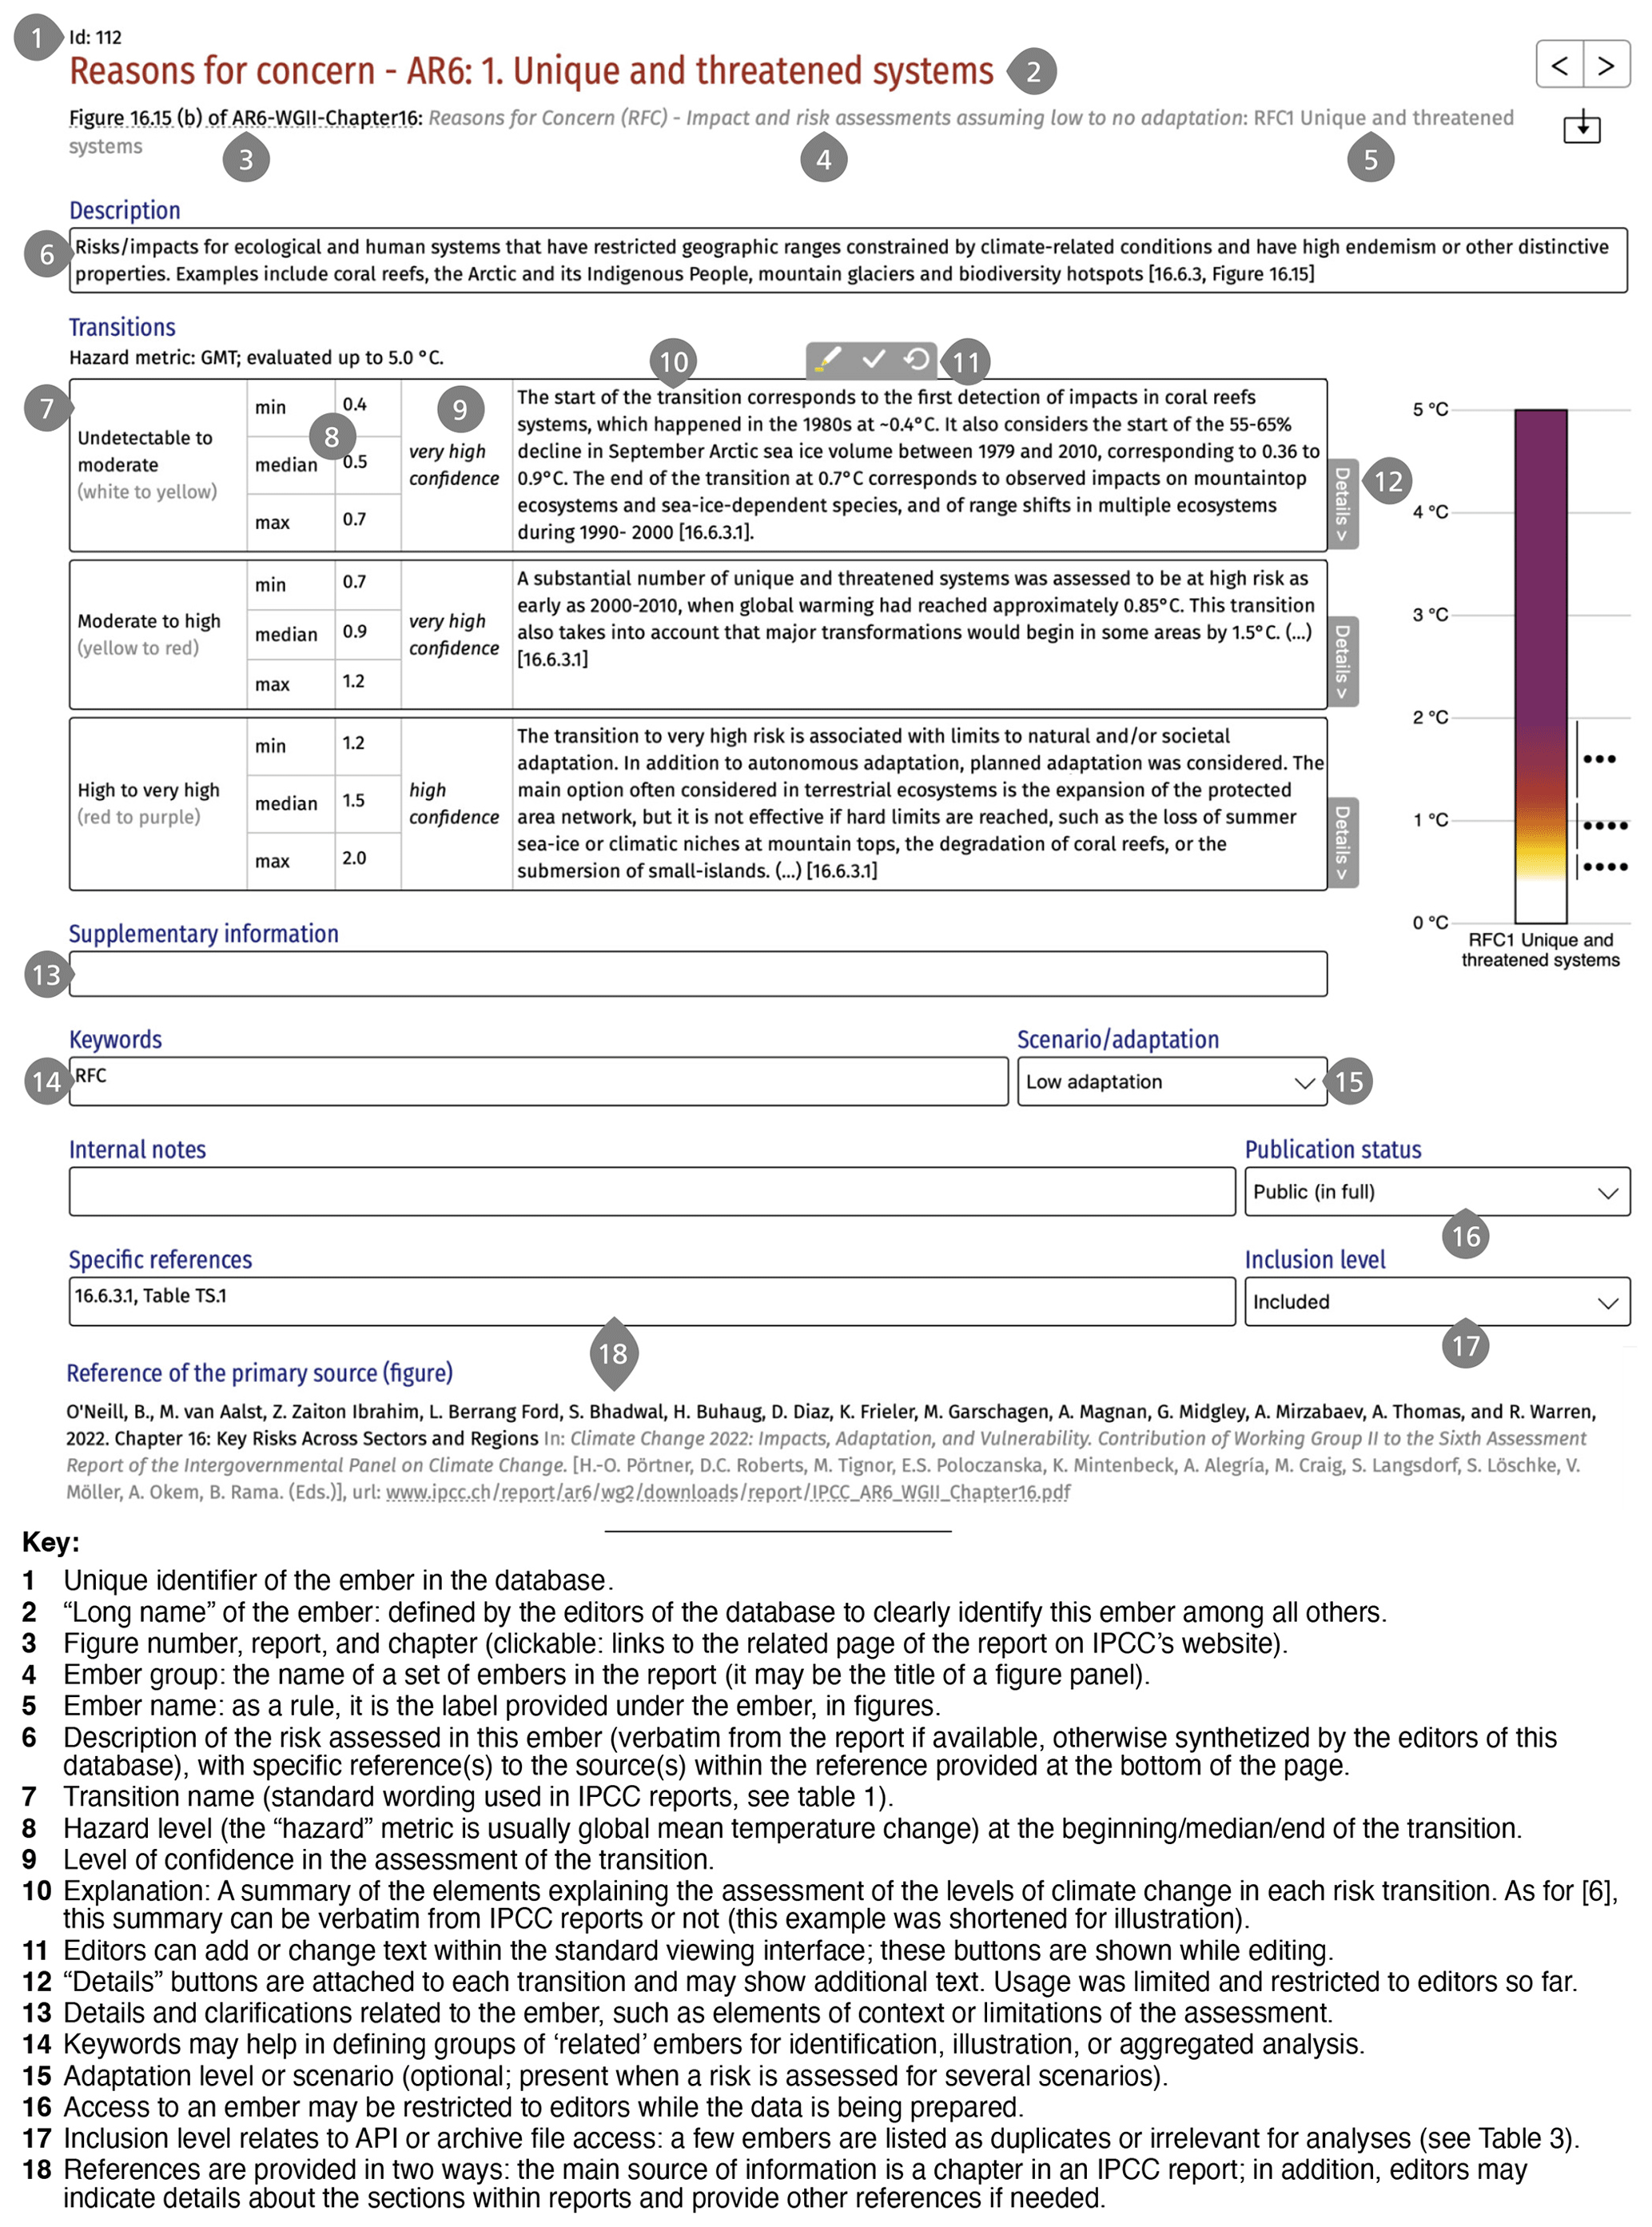
Figure 1Example burning-ember presentation in the online interface of the database. Encoding by authorized editors is possible for the “descriptive” text fields (2, 6, 10, 13, 14, 18). The assessed risks relate to a Reason for Concern (see Introduction; the data used in this example are from O'Neill et al. (2022b), and the text is based on O'Neill et al. (2022a)).
2.1.2 Risk transitions
The key information required to produce an ember diagram is the magnitude of climate change corresponding to the minimum (beginning) and maximum (ending) of each transition from one risk level to the next. In this database, the change against which risk is evaluated (the driver) is called the “hazard” – in line with IPCC glossaries (IPCC, 2022b). While most embers use global mean surface temperature change as a proxy for broader climate changes (hazards), a few embers relate to other metrics such as global sea level rise or CO2 concentration (IPCC, 2014b). For some embers, experts provided estimates of the median hazard within transitions, which defines the location of the 50 % change in colour on the diagrams. Finally, a confidence level (low, medium, high, very high) is associated with each assessed transition, starting with the AR6 cycle (Mach et al., 2017; Hoegh-Guldberg et al., 2018).
Descriptions of the assessed risk(s) and explanations of the risk transitions are provided in the reports in different ways: some chapters explicitly link information on risks to each ember and the transitions it illustrates (for example, Bednar-Friedl et al., 2022b; Parmesan et al., 2022), while others assess risks and present embers in a more separated way (for example Cissé et al., 2022). The details of how and to what extent each risk transition is explained vary from chapter to chapter. As the information provided on a given risk can be long and spread across sections of a chapter without direct reference to the figure containing the ember, it may not be easy to extract an accurate short description of the subject of each ember or the reasons for the risk increase. Given that this is the result of an expert elicitation process (Zommers et al., 2020), there may not be a unique explanation for the final diagram. In some cases, the detailed information may be unreachable unless one has a record of the expert elicitation processes beyond what is reported in the final publications. However, when looking at the assessed risks from a distance, it becomes very useful to have a synthetic description of the risks and transitions assessed in each ember. Given the difficulty of describing each of the embers, we perform this documentation effort for a selection of embers only, including some that are particularly useful in getting a global overview of risk, such as the RFCs. The intent is to show how useful such information gathering and harmonization could be, for example, for scientists and teachers to get a general understanding of a given climate risk in terms of what is at stake. We hope that this will motivate a more systematic approach in the future, ensuring that synthetic information about the scope of each ember and the explanation for the transitions is collected as part of the elicitation process.
2.1.3 Structure of the database
The database is presented in Fig. 2. The data tables shown with a blue frame store the data specific to each ember: the transitions, the description of the risks and risks changes, and ember-specific metadata such as keywords and the range of hazard change over which the assessment was conducted. For example, some embers were assessed over a smaller hazard range than others, particularly when the ember relates to a scenario (such as the Shared Socio-economic Pathway SSP1 (Riahi et al., 2017)) for which high levels of climate change are not expected. The other tables (in grey) provide (meta-) data common to several embers: information about the groups of embers presented in figures; information about figures, including the vertical axis of ember diagrams; and the full reference to the IPCC report from which a given figure arose.
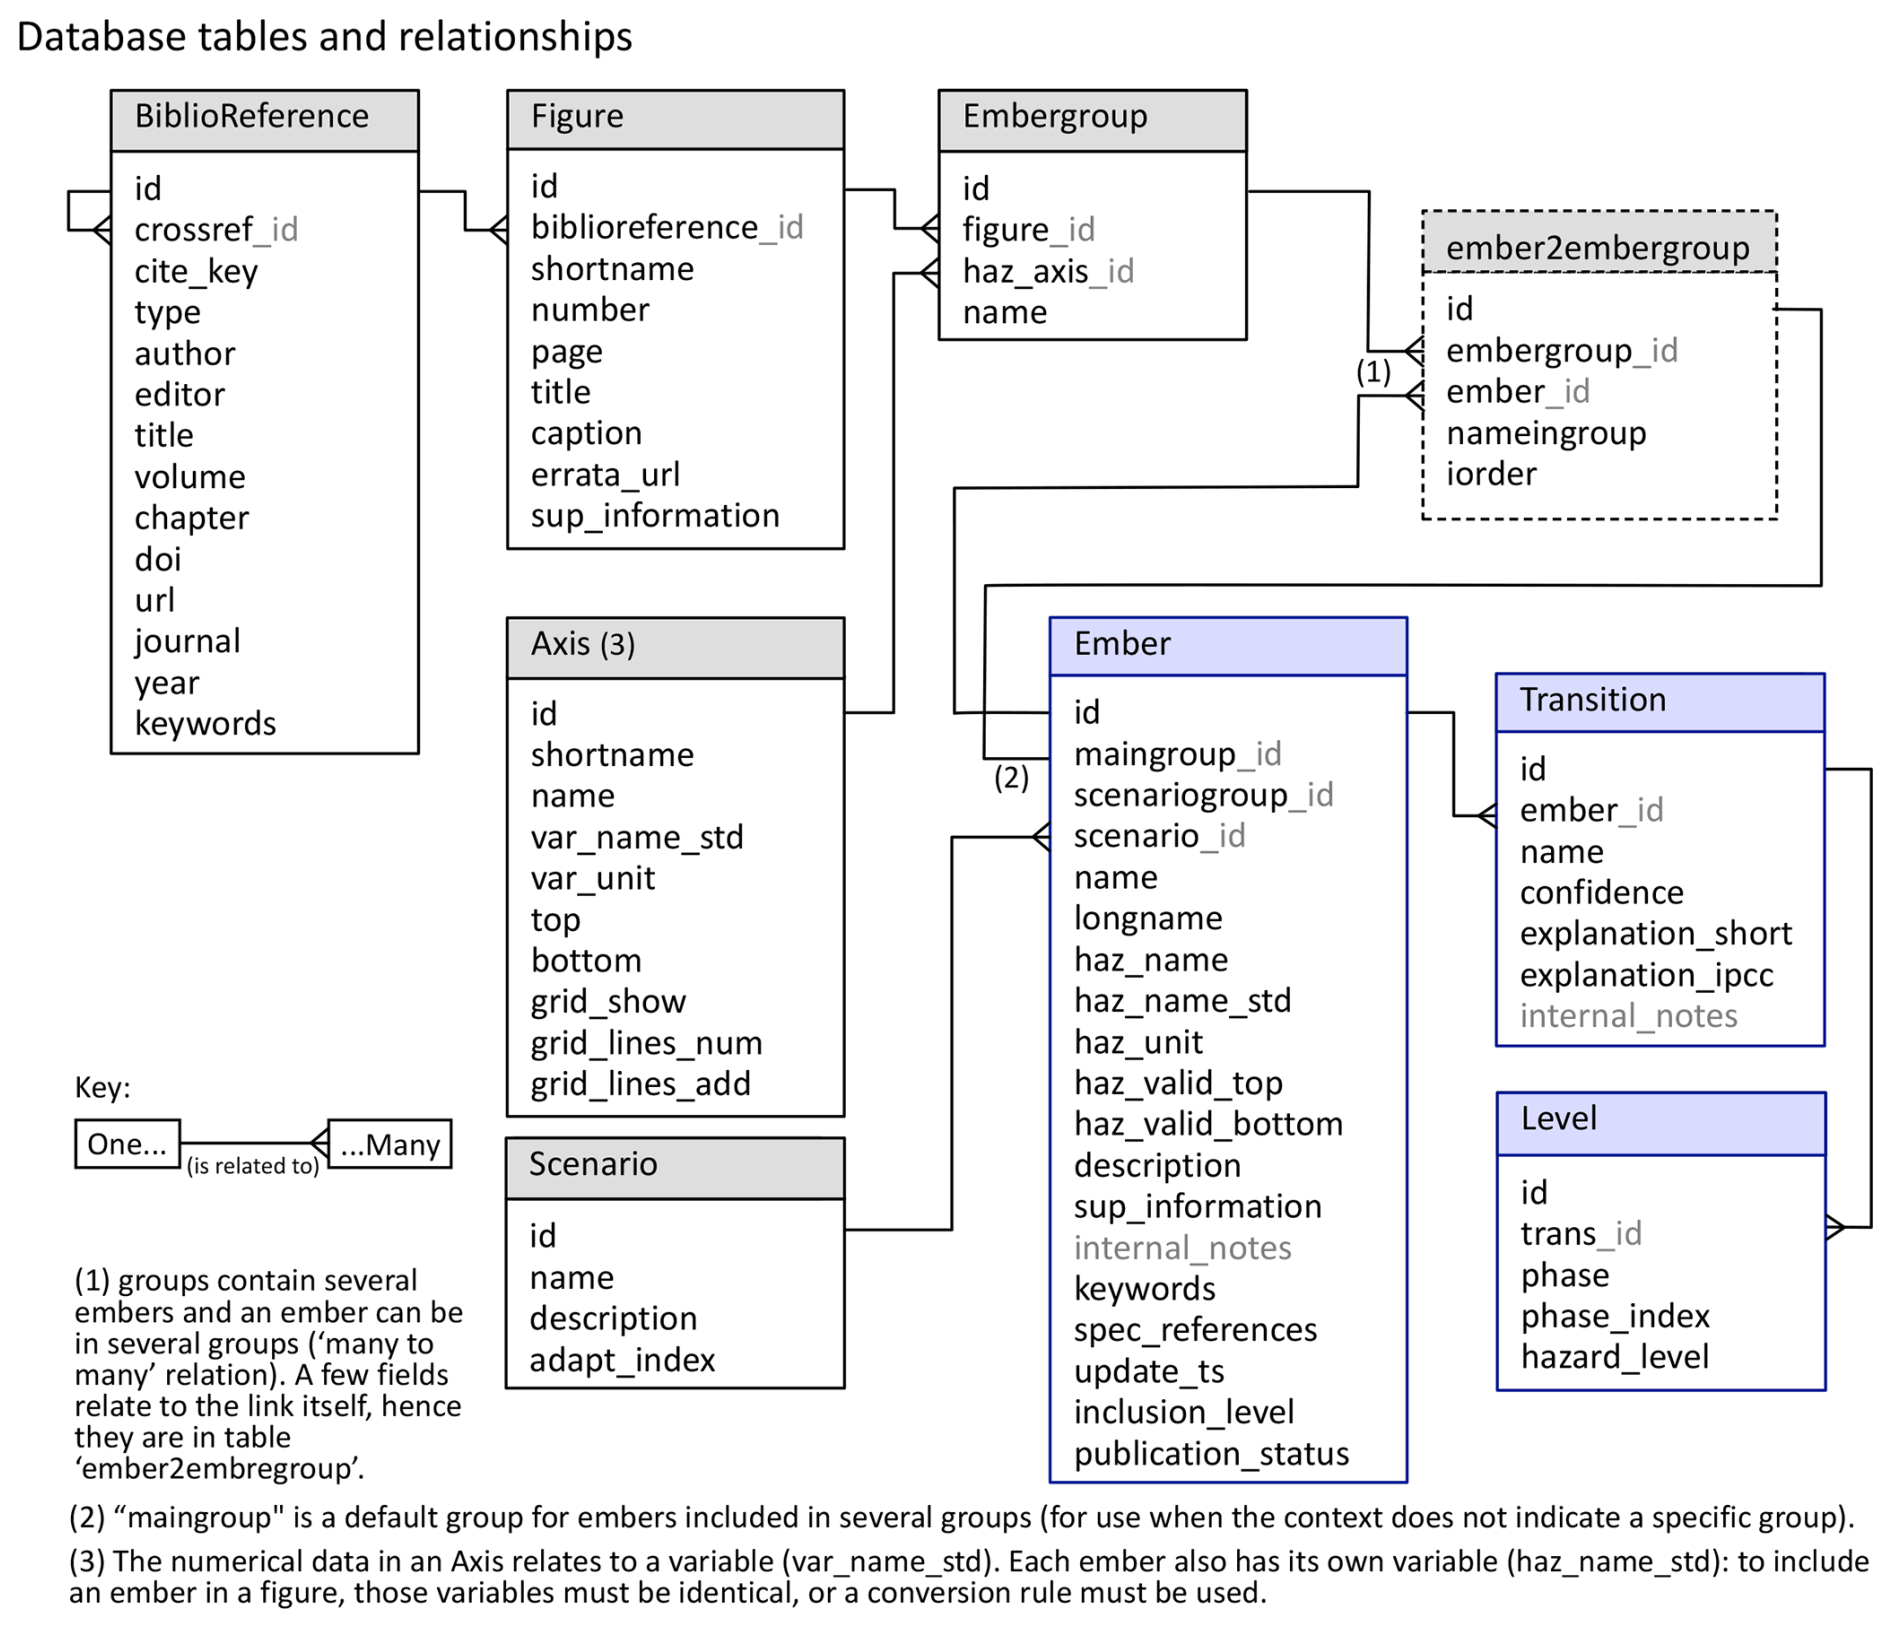
Figure 2Database tables, fields, and relationships, focusing on the main content (excluding user accounts providing editing access rights and other technical details). Tables with a blue frame store the assessment of risk changes shown in embers diagrams, and the other tables provide additional information on how this content should be illustrated and where it appears in IPCC reports. The names prefixed by haz_relate to “hazard”, that is, the variable used as the climate change metric (y axis of the embers). Greyed-out fields are editors only (see Sect. 2.5). All variables are described in Sect. S1.1 in the Supplement.
The structure provides the flexibility needed to accommodate all embers and figure configurations existing to date (since the first ember diagram in the AR3) while avoiding error-prone duplication of information. For example, a transition may include complex colour changes with more intermediary levels than the usual median, and an ember may appear in several figures. For the full documentation, see Sect. S1.1 in the Supplement, which lists all the fields stored in the database, along with a brief description of their function.
2.2 Compiling a homogeneous dataset
Since their first occurrence in the TAR, the design of ember diagrams has changed little, except for the addition of confidence levels, which first appeared in O'Neill et al. (2017a). However, numerical values of the assessed change in risk have only been made available from SR1.5 onwards (IPCC, 2018). Earlier data need to be extracted from the original figures; this was done for the RFC burning embers in (Zommers et al., 2020; Marbaix, 2020c). Reconstructing the data from the figure introduces some uncertainty with regard to the risk levels really assessed by the authors, but it is relatively small (about 0.1 °C; see the Supplement in Zommers et al., 2020) as compared to uncertainties in the knowledge of risk levels, and it is invisible or barely visible on reproduced ember diagrams. Nevertheless, it is evidently useful to systematically store the assessed risk levels and supporting information at the time of the assessment as this facilitates understanding, provides transparency, and makes it possible to verify that the data and the figure are consistent. The last embers for which the numerical data were still missing were those from the Synthesis report of the AR5, which contains the first embers illustrating specific risks (IPCC, 2014b); the data of said embers were extracted herein as previously done (Sect. S3, Zommers et al., 2020). The general availability of information on the embers and their evaluation increased during the AR6 cycle (starting in 2018), and the quantitative data were also made available by the IPCC through its data portal (IPCC Data Distribution Centre, 2024 (DDC)), for example, in Ibrahim Zaiton and Warren (2023) (data from O'Neill et al., 2022a). For all embers produced during the AR6 cycle, the data were obtained directly from the reports, except for Chap. 7 of the AR6 WGII, for which the data are only available from the DDC (Bindoff et al., 2019; Hoegh-Guldberg et al., 2018; Hurlbert et al., 2019a; IPCC, 2022a). The DDC provides a separate file for each figure of the AR6 cycle containing embers, without ember-specific information outside the numerical values. However, qualitative and descriptive information about risks and risk levels is critical in order to understand the basis of assessments or how judgements about risk transitions were made. While getting the numerical data to reproduce the embers has become easier in the recent IPCC reports, it remains difficult to get a synthetic description of the risks illustrated in each ember and an explanation for each risk transition. This information is rarely associated with the quantitative data and was not always collected in a systematic way.
Another important aspect that was not consistently registered together with ember data is a standardized name which uniquely identifies the climate change metric against which the risk has been assessed. GMST refers to the global mean surface temperature calculated from air temperature over continents and sea ice and from sea surface (water) temperature over the ocean. Because model projections provide global mean surface air temperature (GSAT), risks are generally assessed with respect to past GMST to which GSAT projections are added for the future. In the database, this combination is called the global mean temperature (GMT henceforth). For a long time, GMST and GSAT had been considered to be equivalent, but this was challenged by Cowtan et al. (2015), who showed that models warmed faster in GSAT than in GMST. Because of contradictory lines of evidence from climate models and direct observations, GMST and GSAT are assessed in the IPCC AR6 to be approximately equivalent, with an uncertainty of about 10 % (or 0.1 °C for present-day warming) (see CCB2.3 in Gulev et al., 2021, for a comprehensive discussion).
The reference period for GMT increases is also an important piece of information. In the AR3, the reference is 1990, with past changes assessed to be 0.6 °C above a period in the second half of the 19th century (Fig. 19-7 in Smith et al., 2001, and Sect. 2.2 in Folland et al., 2001). In subsequent reports, the period 1850–1900 is used as a proxy for the pre-industrial period, noting that anthropogenic changes happened before that period but were small (0.1 [−0.1–0.3] °C between around 1750 and 1850–1900) and more uncertain due to data limitations (AR6 WGI CCB1.2 in Chen et al., 2021). Our database provides GMT changes above the 19th-century baseline of each report; for the AR3, this may differ from a 1850–1900 reference by up to ∼0.1 °C.
Between the fifth and sixth assessments, GMT increased by about 0.19 °C (after 2012). In addition, the assessed warming between 1850–1900 and the recent past was increased between the AR5 and AR6 on a like-for-like basis owing to the incorporation of new insights about data biases and improved handling of data-sparse regions in datasets (CCB2.3 in Gulev et al., 2021). If the AR5 GMT levels were updated accordingly, the corresponding impacts would be associated with GMT changes increased by 0.08 °C (CCB2.3 in Gulev et al., 2021). However, for the Reasons for Concern embers, updating the assessment between the AR5 and AR6 led to several changes of roughly 1 °C, which were attributed to new evidence and knowledge (IPCC, 2023). Changes to our understanding of the level of warming that would lead to a given impact thus dwarf, by an order of magnitude, those changes associated with new knowledge on long-term warming to date. More generally, re-assessing GMT is only one aspect of the new knowledge that is obtained over time. Updating earlier embers to the AR6 GMT would generate “counterfactual” embers that would not differ much from the original ones: while the database may help in exploring this change, we refrained from doing so. Indeed, modifying past embers could be more confusing than useful, particularly as some RFC embers from the AR5 and AR6 reports were already copied side by side in the Synthesis report of the AR6 (Fig. SPM.4 in IPCC, 2023). In some cases, it might be difficult to make sure that a scaling of the temperature data is actually the right one as this may require details about the variables used in the sources of each assessment, which may be either hard or impossible to obtain years after the original work.
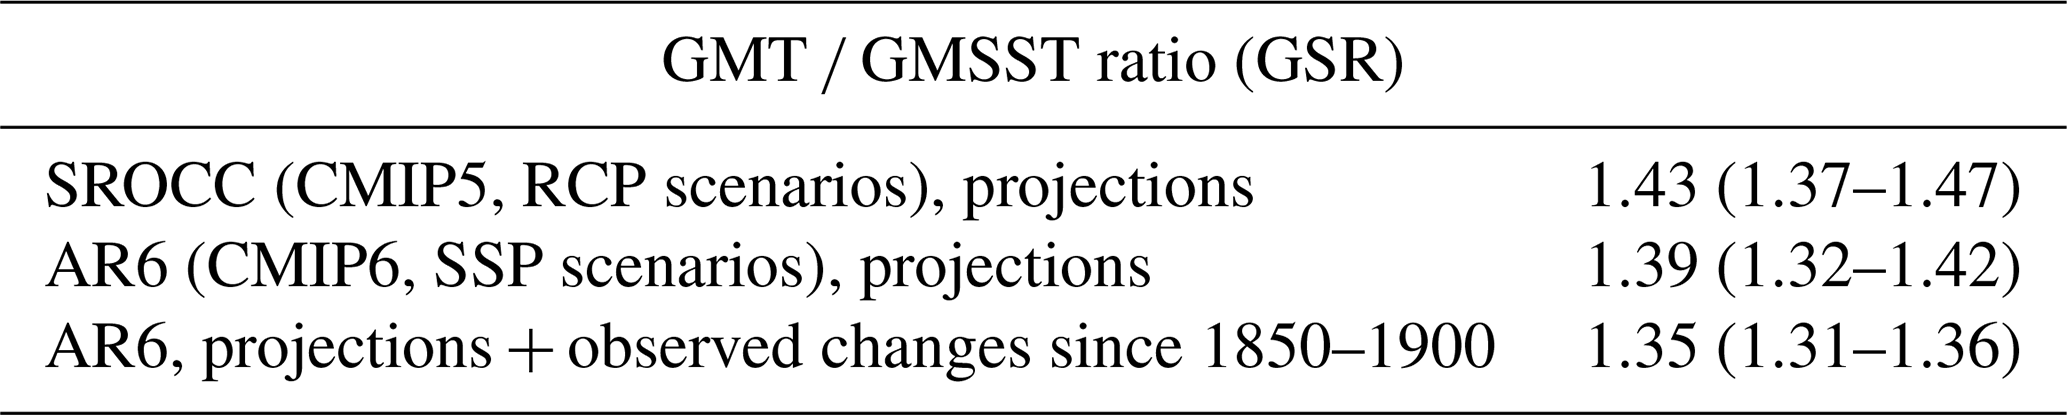
Several IPCC figures involve a conversion of global mean sea surface temperature (hereafter GMSST) to GMT to illustrate ocean-related risks with the same vertical axis as continental ones. In the SROCC, the IPCC fixed a constant conversion factor of GMT GMSST = 1.44 (Bindoff et al., 2019; IPCC, 2019). By contrast, observations over the 20th century suggest values around 1.25, while, conversely, models could be compatible with a scaling factor of up to roughly 1.5 depending on the scenario (Sect. S2, based on Abram et al., 2019; Fox-Kemper et al., 2021; Gulev et al., 2021; Lee et al., 2021). Risk estimates provided in embers are mainly built and interpreted using model projections. Given that the conversion factor derived from the AR6 projections remains quite close to the SROCC value, we keep the same factor (Box 1). This is implicitly done in the AR6 WGII as some of the SROCC embers were reproduced without change (IPCC, 2022d).
Impacts originally occur at a local or regional level: consequently, it is always necessary to “translate” global metrics such as GMT into changes in local or regional variables that drive impacts (which adds uncertainty) (cross-chapter box “CLIMATE” in Rawshan Ara Begum et al., 2022). Taking care of this “scaling” and documenting the approach is thus an important part of the evaluation of how risks increase with global warming, including for the production of ember diagrams. There might be difficulties, for example, when an expert elicitation is based on several sources with different approaches, but the communication of the results benefits from clear indications about the direct risk drivers and how they were linked to the global hazard metric.
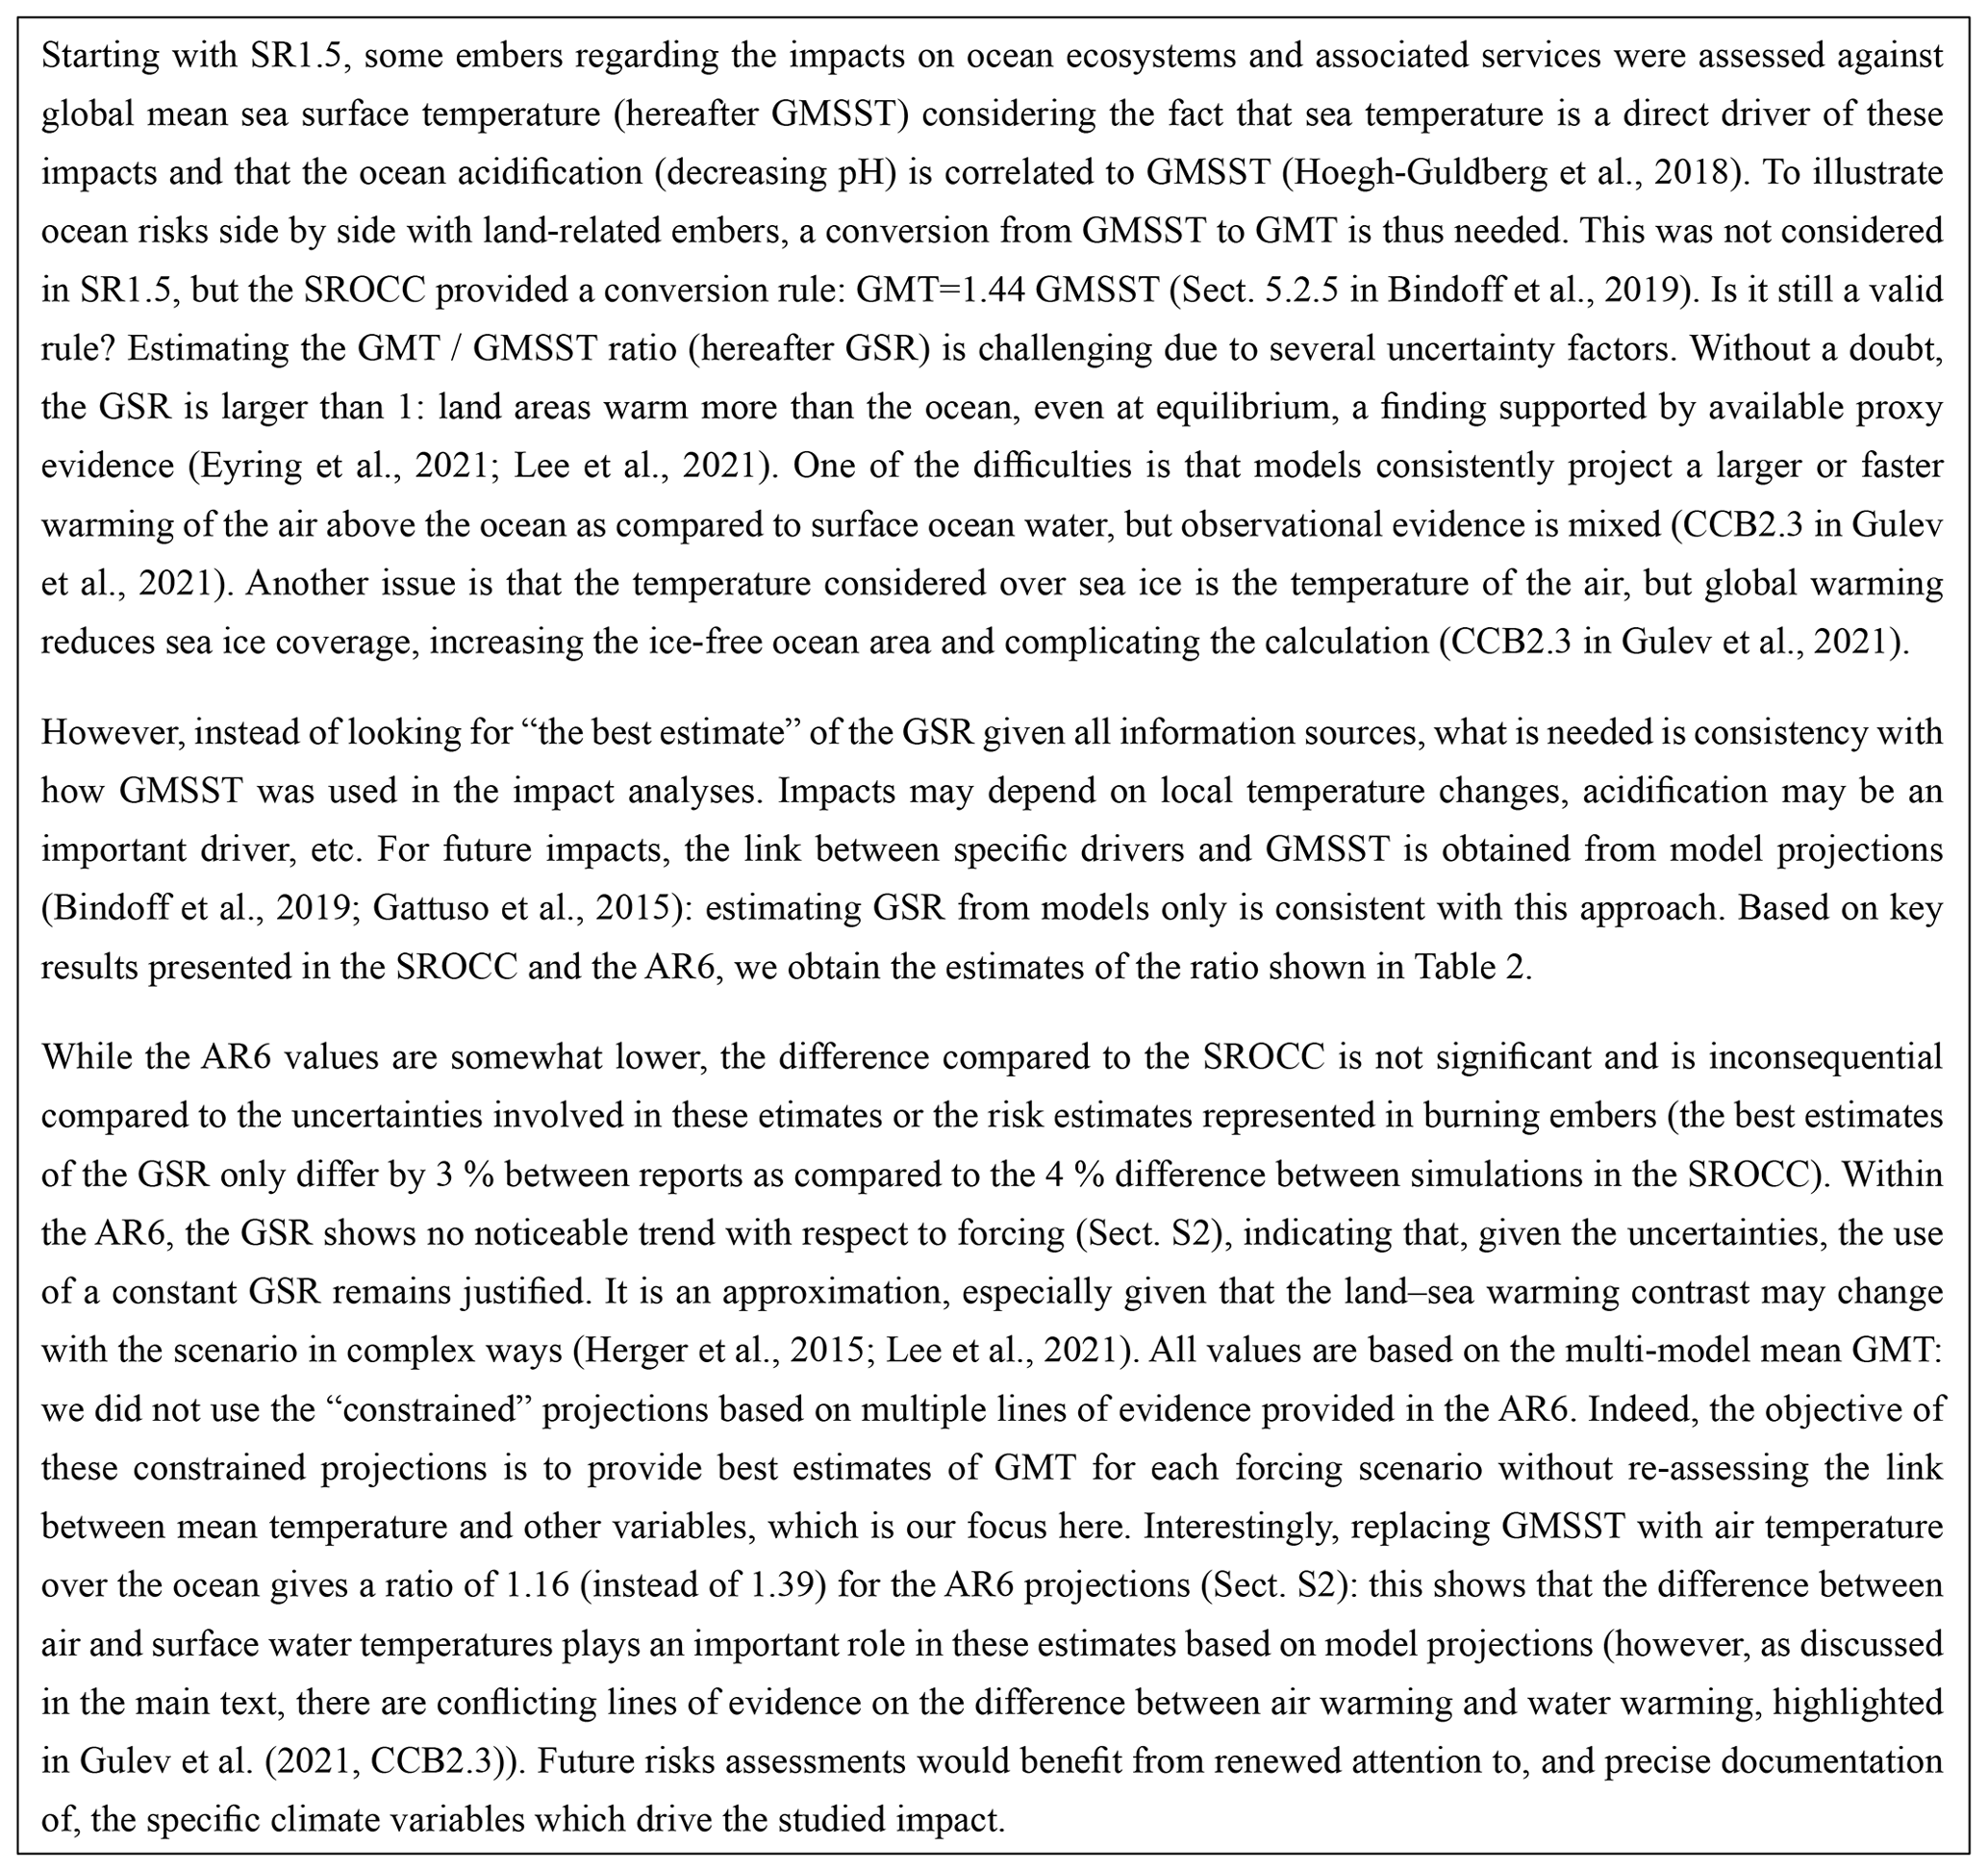
Table 2Estimates of the GMT GMSST ratio (GSR) based on GMT and GMSST assessed in IPCC reports. For projections, GMT is based on surface air temperature over the ocean, as well as over land; results are based on a linear regression across scenarios or time periods (full range between brackets). More information is available in Sect. S2.
2.3 Adaptation levels and scenarios
Understanding the extent to which adaptation can affect climate risk levels in the future or according to a given temperature change first emerged as an important component during the AR5 (IPCC, 2014a). While there is consensus on defining adaptation in the IPCC context – i.e. the process of adjustment to actual (in human and natural systems) or expected (in human systems or facilitated by human intervention) climate change and its effects in order to moderate harm or to exploit beneficial opportunities (IPCC, 2022c) – there is still no agreed-upon definition of future adaptation levels or adaptation scenarios. As a result, the AR6 assessments included adaptation levels and scenarios using different approaches, either considering the effectiveness of a wide range of adaptation options to reduce climate risks (IPCC, 2022a; Oppenheimer et al., 2019) or deriving an adaptation potential from the SSP framework (Hurlbert et al., 2019a). In the former approach, as illustrated in the Europe Chapter of the AR6 WGII (Bednar-Friedl et al., 2022a), authors assessed the effectiveness (low, medium, high) of discrete adaptation options based on the literature and a multi-round collective expert judgement exercise (Muccione et al., 2024) and then assessed how these options could be combined to reach different levels of risk reduction. In the SSP-centred approach, the set of socio-economic pathways explores a range of future societal conditions and related trends in demographics, economics, governance, etc. (Andrijevic et al., 2019; Jones and O'Neill, 2016; O'Neill et al., 2017a). These pathways are constructed to span a range of possible futures with respect to how difficult adaptation – and, separately, mitigation – would be in each socio-economic context. For example, SSP3 and SSP1, respectively, challenge or facilitate ambitious adaptation scenarios. As the literature on adaptation frequently used SSPs, the approaches were linked together, for example, by assuming that high adaptation happens when there are low challenges to adaptation, such as in SSP1 (even in the Europe Chapter of the AR6, some low-adaptation embers are based on the literature related to SSP1 (Bednar-Friedl et al., 2022a)).
However, making a direct link between low challenges in SSPs and high adaptation is a simplification that may not be entirely obvious. It is consistent because SSP1 includes hypotheses such as that of effective governance that would make adaptation policies more accessible, facilitating high adaptation, while factors such as slow growth and inequality assumed in SSP3 reduce the adaptation capacity (Tables 1 and 2 in O'Neill et al., 2017b). But SSP1 also includes lower population growth and sustainability hypotheses that would inherently result in lower exposure and vulnerability (Byers et al., 2018; O'Neill et al., 2022a), reducing the need for further changes specifically motivated by adaptation. By contrast, scenarios such as SSP3, with hypotheses that generate a baseline with high vulnerability and exposure, could be regarded as needing high-adaptation efforts (even more so if the scenario also comes with higher emissions and, hence, higher climate-related hazards). In summary, SSP3 illustrates a pathway that would result in high-adaptation needs but would make high adaptation hard to achieve, while SSP1 illustrates a situation where adaptation is easier but where fewer adaptation efforts are required due to a low vulnerability and exposure baseline. If high adaptation means achieving low vulnerability and exposure then it is consistent with SSP1 as commonly assumed; by contrast, if high adaptation is defined as “large efforts or changes for adaptation”, it could also be justified in the context of a high vulnerability and exposure baseline as defined in other scenarios. Indeed, the SSP framework does not specify adaptation responses: it assumes that these would be defined separately, within “shared reference policy assumptions” (O'Neill et al., 2020). However, developing such common assumptions is challenging, notably because adaptation is highly context and region dependent (O'Neill et al., 2020). This underlines the difficulty in establishing a common and agreed-upon framework for measuring adaptation levels and benefits and for designing adaptation scenarios. In this paper, we make a first attempt to highlight the challenges which we faced while regrouping embers in a common framework and to lay foundations for further explorations as part of the AR7 (see Sect. 4.2).
2.4 Overview of the embers compiled in the database
The AR6 defined a set of eight broad risk categories referred to as “representative key risks” (RKRs), summarized in Table 3. These RKRs have been designed to form key risk clusters while recognizing that some risks may feature in more than one RKR (Sect. 16.5.2.2 in O'Neil at al., 2022). On this basis, we attributed a main RKR to each ember and a second RKR (available in the database) when relevant. Table 3 shows the number of embers in each cluster defined by the main RKR, as well as the corresponding aggregate GMT for the mid-point within the transition from moderate to high risk in each ember. All embers are included in a main category with the exception of three that do not appear to fall clearly within the scope of a specific RKR (“Arctic mobility” from the AR6 cross-chapter box on polar regions (Constable et al., 2022), which has limited links with RKRs D, E, and C and the two embers relating to the “failure of institutions and governance to manage climate risks” in the Australasia chapter (Lawrence et al., 2022)). The largest cluster is by far RKR-B (54 embers), devoted to ecosystems and some of their services. For this reason, we divided it into subcategories related to terrestrial, ocean, and coastal risks. Conversely, RKR-C, devoted to infrastructure, is the main cluster for only six embers. However, other RKRs include risks which have adverse consequences for infrastructures – especially A (coastal systems) and G (water-related security, including floods). A total of 29 risks were assessed for at least two adaptation levels – a little more than a quarter of all assessed risks.
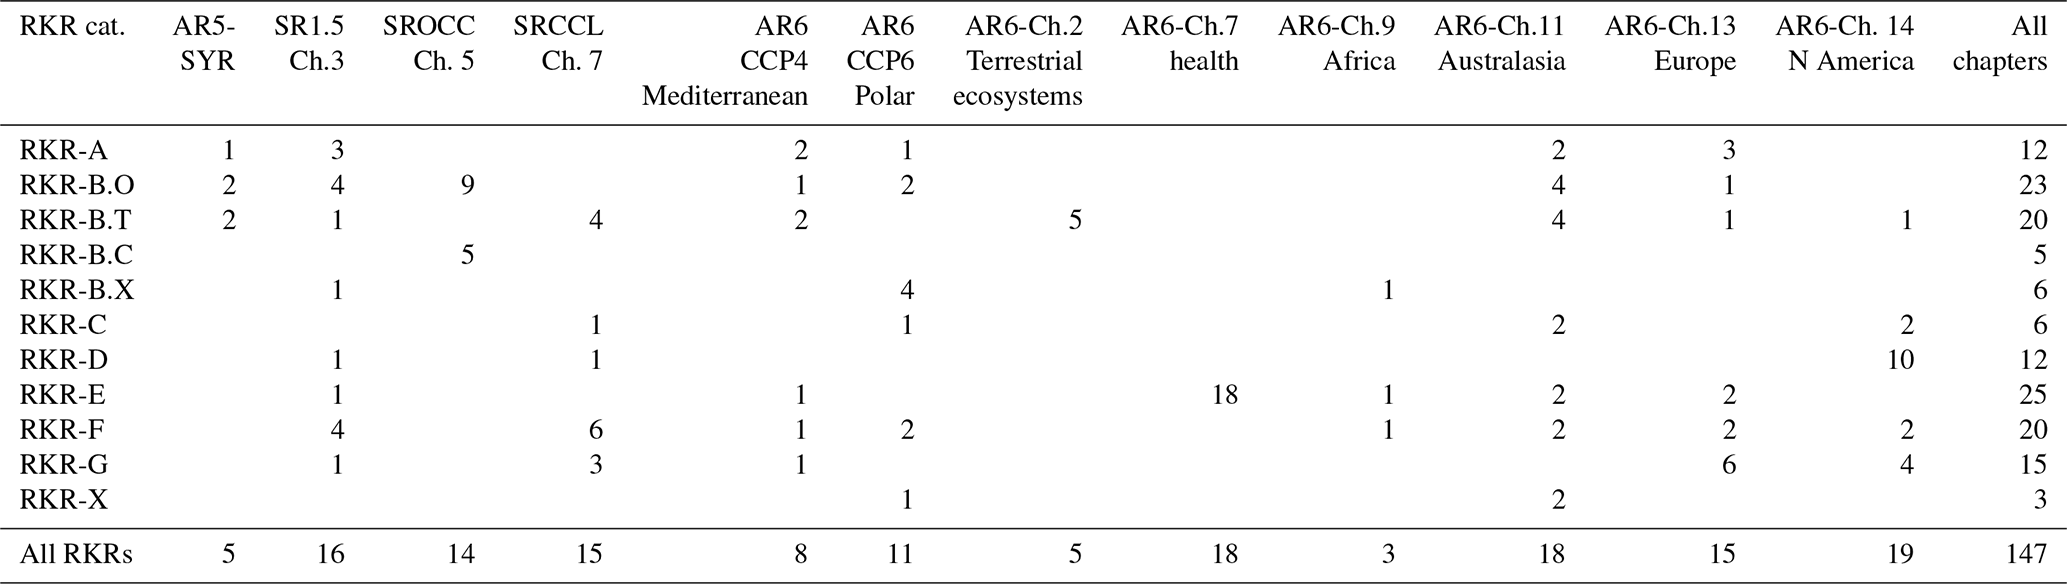
Table 4 shows the chapters from which the embers in each cluster are drawn. This gives an indication of the risks that have been assessed and presented as embers for each context or region. However, in some cases, a higher number of embers may correspond to a highly disaggregated presentation of risks rather than to a situation where more information is available. The WGII contribution to AR6 provides the first “regional” embers, focusing on impacts at the scale of continents. Given that impacts have a local nature, this is obviously useful to illustrate impacts in a more insightful way. However, only about half of the AR6 regional chapters provided embers: Africa, Australasia, Europe, and North America, along with cross-chapter papers focusing on the Mediterranean and polar regions. Missing continents are Asia and South America, and there are no embers focusing on, for example, small islands (although there are embers focusing on coastal flood risks).
Table 3Overview of all burning embers from IPCC reports (except for the five integrative Reasons for Concern, which were assessed five times between the TAR and the AR6), clustered in representative key risks (RKRs) from the AR6 (Table 16.6 in O'Neill et al., 2022a). Unless the assessment has changed between reports, each ember is included only once, ignoring repetitions in summaries and across reports of the AR6 cycle, even if the presentation is slightly different. The third column indicates the number of risks which were assessed for more than one adaptation level compared to the total number of assessed risks (counting each only once when adaptation variants were investigated). The last column is based on the GMT of the mid-point between moderate and high risk. Six embers, indicated by the numbers shown in brackets (+x), are not included in the analysis and diagrams presented in this paper: The “mangroves” ember from SR1.5 Fig. 3.18 was reassessed with slightly different numbers as part of the SROCC and is included there (for more information on the SR1.5 ember, enter its database identifier (ID) as search criteria in the CREE: 15). The ember for “open-ocean carbon uptake” from SR1.5 Fig. 3.18 (ID no. 21) is not included because the information relating to one of the risk transitions appears to be inconsistent. The ember for the “ability to achieve sustainable development goals” in SR1.5 Fig. 3.20 (ID no. 34) is not included due to incomplete information. The Supplement of the SRCCL provides data for three additional embers. These are included in the database for completeness, but the embers are not part of any figure in an IPCC report. The risks assessed are as follows: coastal degradation (ID no. 44), food access (ID no. 48), and food nutrition (ID no. 49).
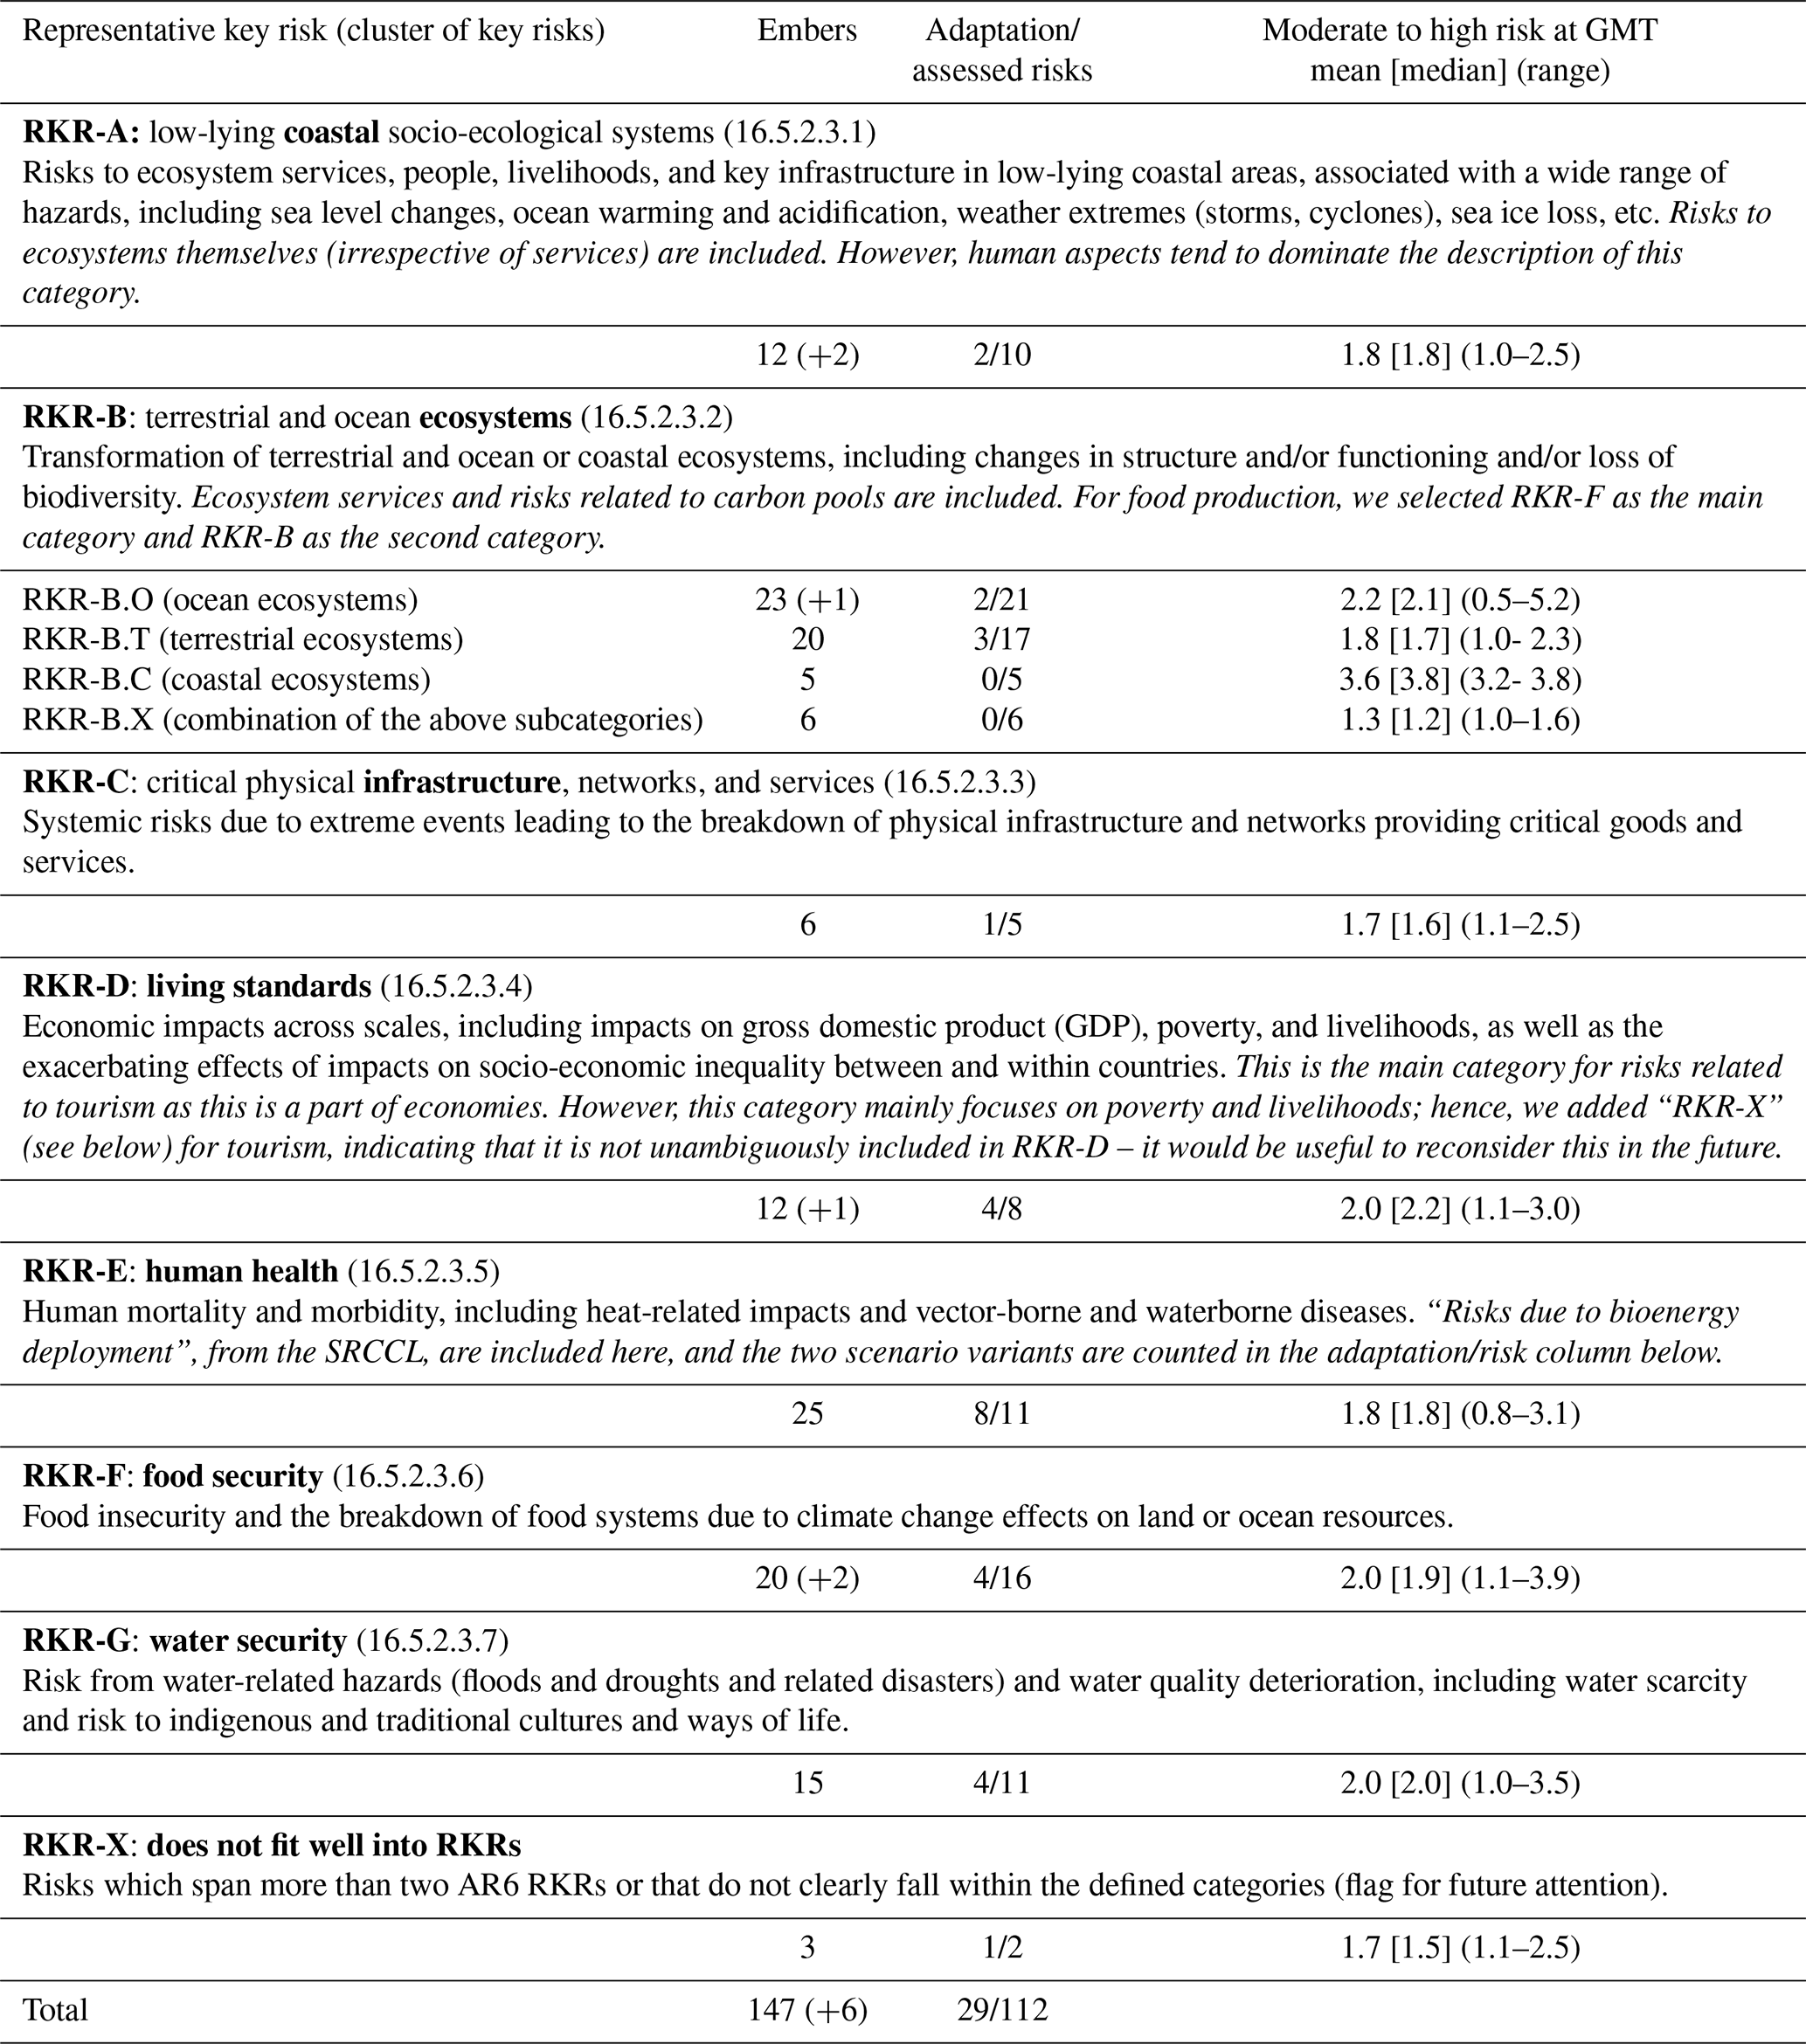
Table 4Distribution of embers among key risk categories and report chapters.
2.5 Database access
The content of the database can be accessed in several complementary ways: through a web interface, called the “Climate Risks Embers Explorer” (CREE), and through HTTP requests or an archive file, which can provide data to external code (Fig. 3).
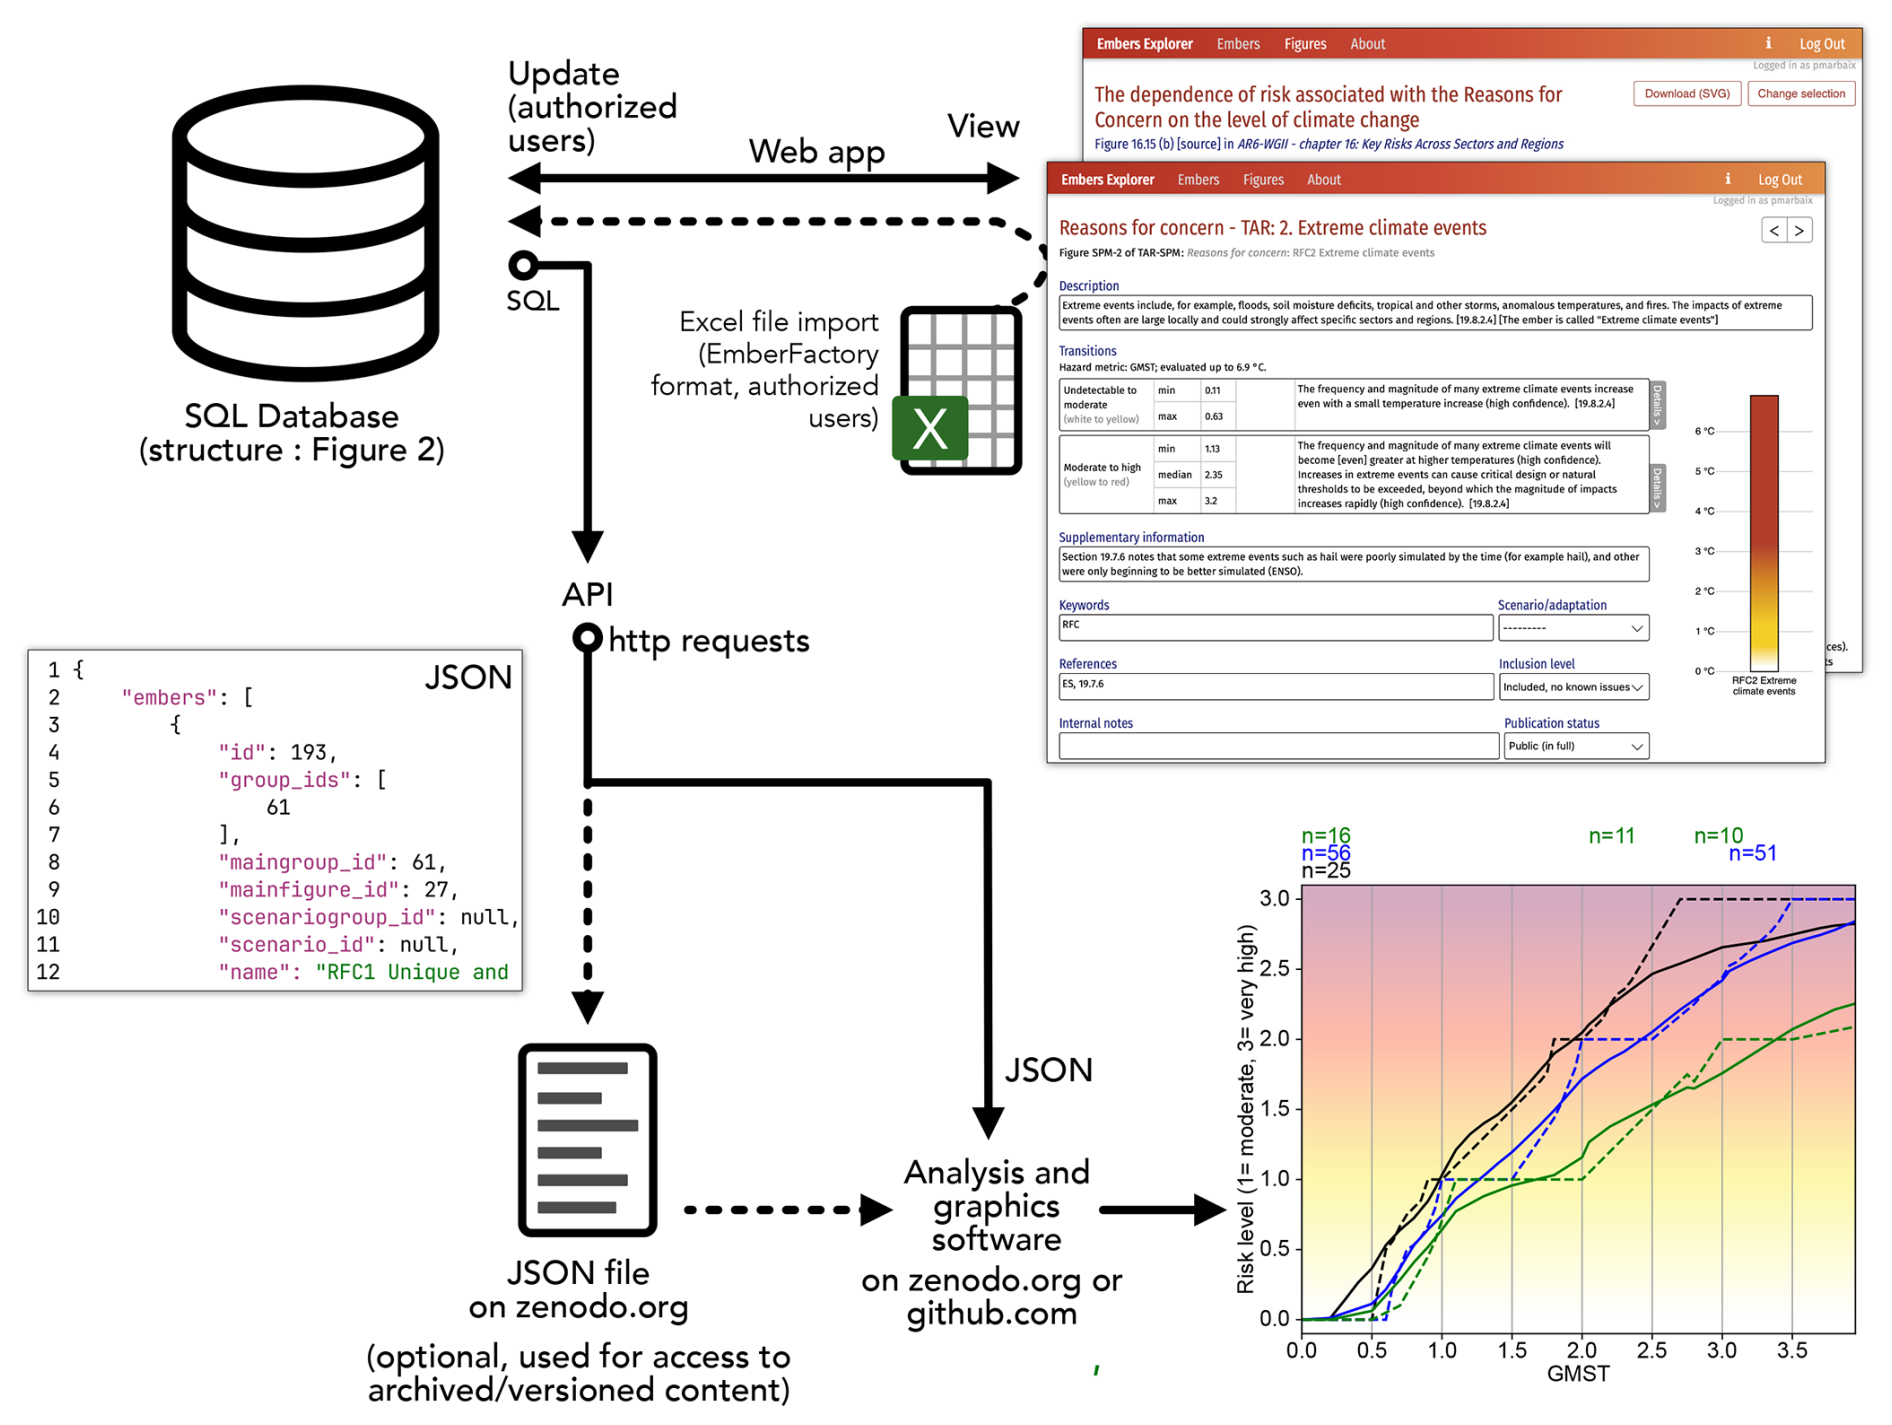
Figure 3Schematic view of data access options. Each field in the database and JSON files is described in Sect. S1.
The numerical data needed to draw the diagram are available for all embers, but the description of embers and transitions is complete for a fraction of all embers only: filling all descriptive fields is an ideal goal that can only be approached over the long term. Beyond the publicly available information, the database can store draft text when the “publication status” of an ember indicates that the description and/or explanation fields are not finalized. This draft information is not used in this paper and is only available to registered editors in preparation for future improvements, as explained in Sect. 2.5.3.
2.5.1 Database access from research software
External computer code can access the public content of the database through an application programme interface (API). HTTP requests need to be sent to https://climrisk.org/edb/api/combined_data (last access: 14 January 2025); responses are received in JSON format. Requests may target a subset of the embers according to their unique identifier, keywords, long name, source report, or scenario (Sect. S1.3).
The dataset published with this paper (Sect. 4) is an archive of the result of a request for all (public) information in the database, and so this file contains the same data as the result of HTTP requests. The structure of the JSON data is largely identical to the structure of the SQL database (illustrated in Fig. 2), with the same field names and minor simplifications (made possible by the fact that the file is not intended to be modified, unlike the database; details are presented in Sect. S1.2).
All figures and tables in this paper can be obtained from both approaches (file and API) using the same software (Sect. 5).
2.5.2 Climate Risks Embers Explorer (CREE)
The CREE web interface provides a searchable list of embers, a list of figures, and the possibility of selecting embers and getting them side by side in a figure: https://climrisk.org/cree/list (last access: 14 January 2025). References to the sources in IPCC reports are provided for each data item and related information. The ember diagrams are drawn by the “EmberMaker” software library (Marbaix, 2024b) from the information in the database: it can reconstruct the embers found in IPCC figures (but the additional details provided in the IPCC figures, if any, are not included; for these, a link to the relevant IPCC publication is provided). The main aim of this interface is to facilitate access to the burning embers and the information needed to understand the risk assessment which they communicate, with a view to being useful to teachers and researchers (Fig. 4).
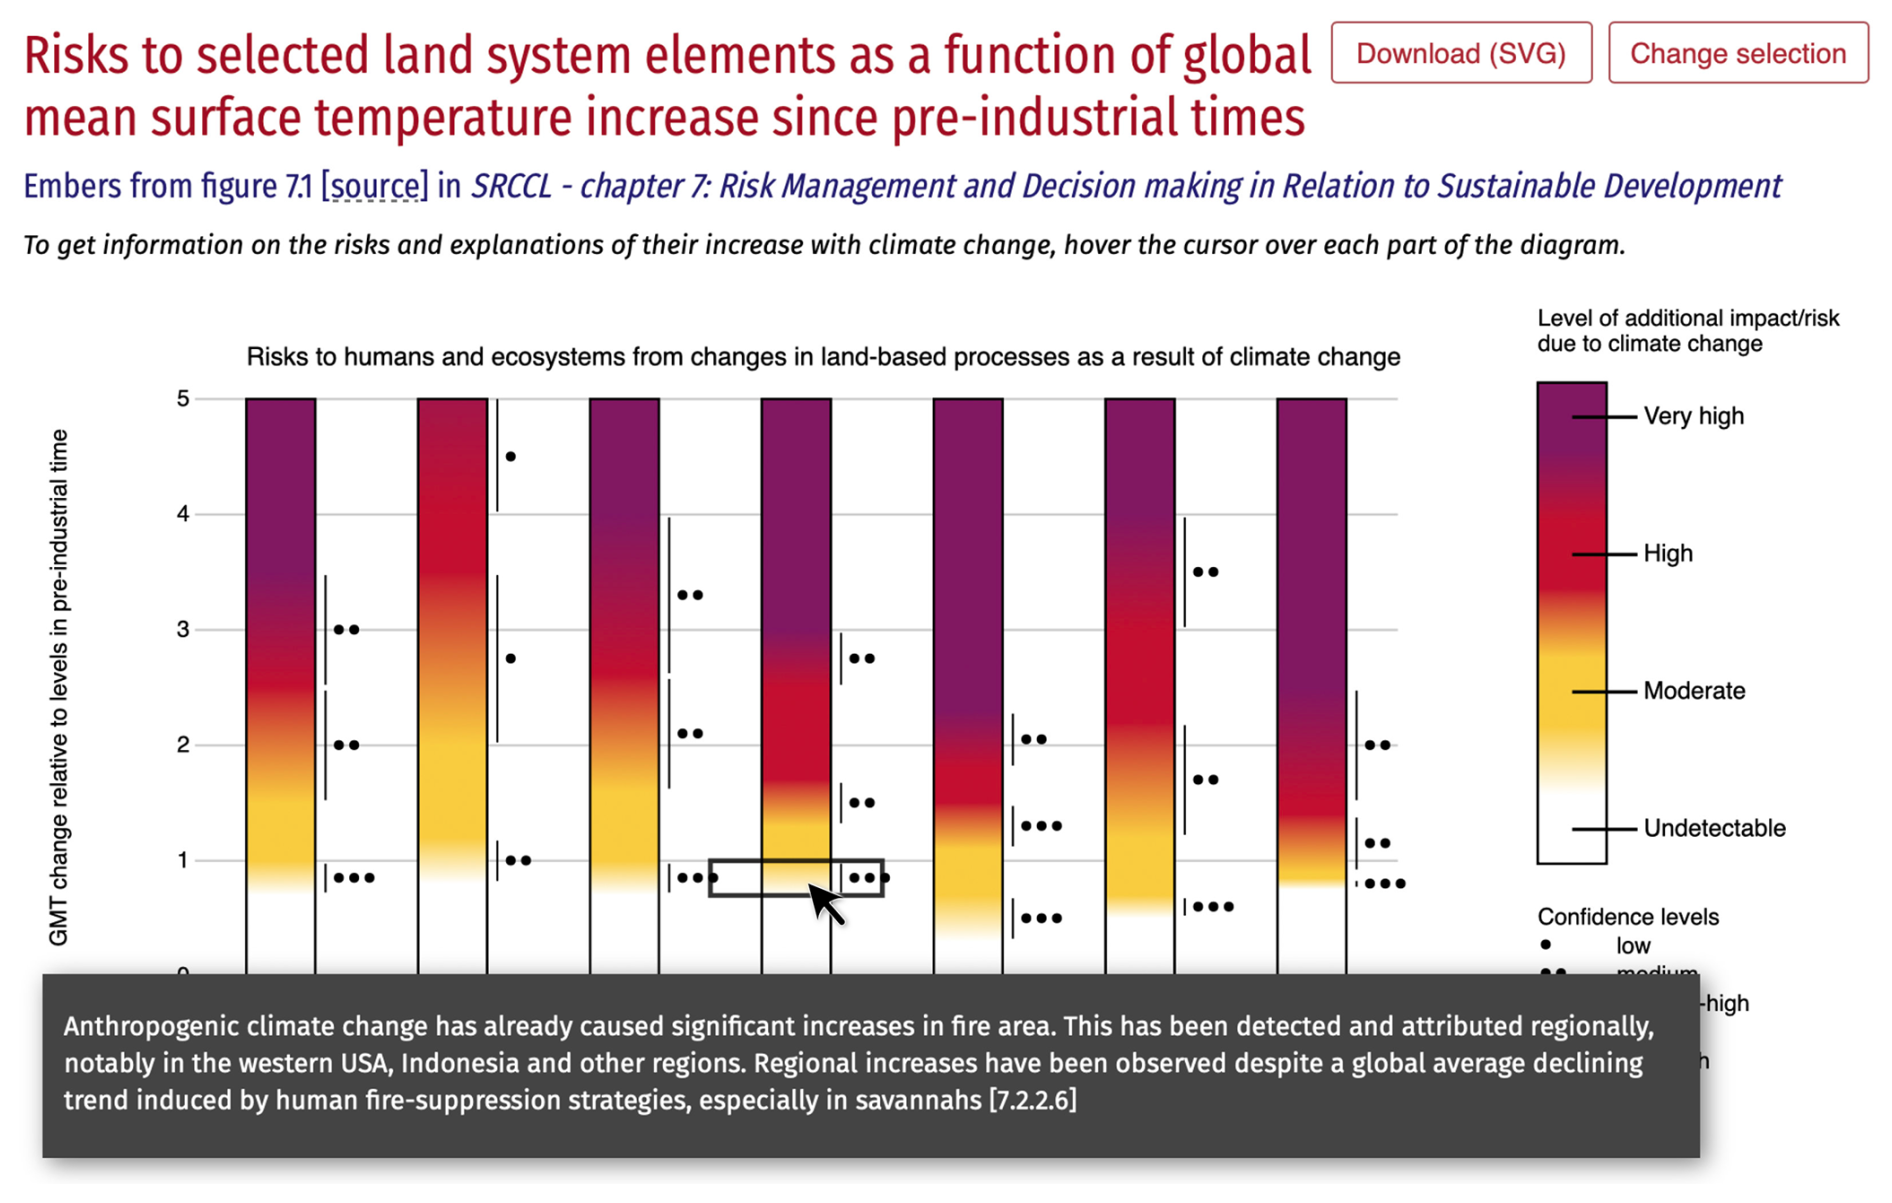
Figure 4The Climate Risks Embers Explorer is a web tool which mainly provides a searchable list of embers and a list of related figures in IPCC reports, with full references to these for further information. When descriptive information is available in the database, it can be visualized interactively, appearing on a figure when the user places the cursor over the name of an ember or a risk transition, as shown here. This figure has been produced by the CREE, using information from the database presented in this paper (for more information, see https://climrisk.org/cree/emberfigure?figure=5, last access: 14 January 2025); the data used in this example come from Hurlbert et al. (2019b), and the text is based on Hurlbert et al. (2019a).
2.5.3 Enhancing the database through collaboration
As explained above, the current database contains the numerical data for all embers assessed so far and the descriptive information for a significant fraction of these, but a comprehensive description of all embers is beyond the objectives of this paper. Improving and supplementing the information about embers assessed in past IPCC reports would benefit from broader collaborations, notably with researchers being involved in each assessment. We have made efforts to facilitate this collaboration by providing easy ways to contribute. For a quick start, it is possible to download the existing data from the page presenting an ember (it can be obtained as a Word file) and to send an edited copy to the database maintainers. Scientists willing to provide a larger contribution may create a login and ask for editor status. This identity verification step is necessary to ensure that editors are qualified and aware of what is expected and that contributions will be duly recognized. Editing is made as simple as possible: it is done through the same interface as data consultation. Editors can only change unpublished fields so that the content subject to editing is not shown to visitors until it is finalized (the publication status is set by database administrators). This process may be adjusted as experience is gained to make the benefit of contributions available to all while protecting the database against unwanted changes and ensuring the quality of its content. For this reason, all edits are confidentially logged with the name of the editing user, and care is taken for no content to be lost even in the event of a technical problem or human mistake (including by sending a full backup of the database to a distant server every day).
As it stands, this database is a contribution to a harmonized documentation of the knowledge synthesized through the construction of burning-ember diagrams since 2001, which provides the basis for the analysis in the remaining sections of this paper. The future availability of these data is ultimately guaranteed by the archive file. It illustrates the potential of the structured collection of information to facilitate future assessments, as well as to disseminate the results through an interface such as the CREE. Future development will require the continued assessment of the needs and potential benefits, as well as adequate support (see Sect. 4).
3.1 Aggregated measures of risks
3.1.1 Benefits and limitations of aggregated views
While climate change is a global phenomenon, its impacts start from the local interaction of hazard, exposure, and vulnerability. However, it is increasingly recognized that impacts are transmitted across systems (cascading impacts) and boundaries (Anisimov and Magnan, 2023; Challinor et al., 2018; O'Neill et al., 2022a). As a result of the complexity of impacts, including the wide range of scales involved, getting an overview of risks is a challenge, and it comes with inherent limitations. The TAR introduced globally aggregated impacts as part of the RFCs but warned of the limitations of aggregate analyses, which “treat gains for some as cancelling out losses for others” and where the weighting of each impact in the total is “necessarily subjective” (Smith et al., 2001). This report noted that this masks differences that are important for equity and added an RFC for the “distribution of impacts” to address these differences, particularly the higher vulnerability in developing countries (Zommers et al., 2020). Aggregating all impacts in a single metric remains challenging, as illustrated by the large range of estimates of global economic impacts presented in the AR6 (Cross-Working Group Box ECONOMIC in O'Neill et al., 2022a).
As the burning embers are assessed against a qualitative risk scale (Table 1), aggregation of the estimates across multiple risks requires a mapping of the named levels to a numerical risk index: we use 0 for undetectable, 1 for moderate, 2 for high, and 3 for very high risk. This approach was used previously to describe the RFCs (Marbaix, 2020a; Annex IV Sect. 56 in UNFCCC, 2015) and to aggregate the burning embers assessed in the special reports of the AR6 cycle (Magnan et al., 2021). The risk scale can be seen to be similar to the range of colours used in the diagrams, with fractional values representing the colour gradients (transitions) between the named risk levels. However, the necessity to choose a specific index has consequences, particularly when it is a linear one, as calculating a mean risk then means that a high risk is “valued” twice as much as a moderate risk. Magnan et al. (2021) summarize the limitations of the aggregated risk index as follows: (i) linearity, given that risk could increase faster, including exponentially and/or with jumps; (ii) a limited consideration for systemic feedbacks between different risks due to knowledge limitations (the aggregation method itself can hardly add such information); and (iii) differences in risk valuation among communities and sectors. Incidentally, the burning-ember diagrams themselves also have a limitation related to their risk scale as they cannot reflect the fact that risks may also increase within a given risk level (e.g. within “high risk”, before risks start to meet the criteria for “very high risk”).
Alternatives to the linear scale could be explored, for example, if risks are expected to grow quadratically or exponentially as a function of the defined risk levels. The latter would introduce an additional unknown parameter, namely the growth rate. In the end, whatever choice is made, results will be partly arbitrary. This linearity issue is mitigated when calculating the median risk index among a set of risks as it only implies that 50 % of the assessed risks are larger but not that risks above the median level are “equivalent” to (or compensate for) those below.
3.1.2 How risks increase with warming
Figure 5 illustrates aggregated risks calculated from the regional and global embers developed in the AR6 cycle reports. High-adaptation cases are ignored, with a view to obtaining a more homogenous set of data, because there are many risks for which adaptation has not been taken into account. The global picture is that the mean risk is increasing by roughly one level (e.g. from moderate to high) for an additional mean warming of 1 °C near 1.5–2 °C; the same conclusion was drawn from the AR5 results almost 10 years ago (UNFCCC, 2015), suggesting that, even as we gain more knowledge, some key conclusions remain valid. However, the median risk increases from moderate to high between 1.5 and 2 to 2.3 °C, almost twice as fast over that range (see below).
At a given temperature level, both median and mean risk levels are generally higher in the regional chapters than in the global chapters. The difference is very small below 1–1.5 °C (GMT increase above pre-industrial) and increases to reach about half of a transition between risk levels around 3 °C. In the regional group, very high risk is reached between 3 and 4 °C, while the global group stays closer to high risk. There are at least two reasons why we might expect such differences: first, the available embers do not comprehensively cover risks among regions and systems (Table 1). We do not know if a more comprehensive geographical coverage would give different results. Second, the risks are taken into account in different ways in the regional and system-based analyses; in particular, if a risk is high in several regions, it will “count” several times in the regional group, but in the global group, it will only appear once, and the aggregated results may show a lower global risk if some regions are affected little (at the regional level, a risk might be widespread, which is a criteria for assessing a risk as high or very high, while it may appear to be less common from a global perspective).
As an illustration of how the focus on certain risks and regions may influence the results, we test an alternative approach intended to bring a more constant weight “per main topic” instead of per ember: a weight is attributed to each ember so that the total weight is the same for each of the chapters (for the AR6) or for each figure (for the SRCCL and SR1.5). Those weights are applied to the calculations of mean, median, and other percentiles (Fig. 5e). The results of the “per-ember” and “per-chapter” uniform weightings are very similar. With the per-chapter weighting, the regional and global risk levels are roughly identical up to 1.0 °C, and then the difference between regional and global increases moderately, with similar levels of risks at all warming levels as in the “no weighting” case. The large similarity of this result compared to the previous one tends to support the argument that the way risks are assessed in regional chapters, as compared to in the system or global chapters, could possibly result from increased attention, in the regional chapters, to risks that might be high in specific regions, as hypothesized above. The difference between regional and system chapters shown here may then encourage paying attention to the way in which risks are expressed in the global analysis per system affected when the risks are not geographically homogeneous.
To further illustrate how risks change with temperature, Fig. 5d shows “aggregated embers” based on the median risk levels among embers (from Fig. 3a). For example, both regional and global aggregated embers show that, under about 0.6 °C, more than 50 % of the risks were considered to be undetectable. Above that, the majority of risks are increasing, with more than 50 % of the embers reaching moderate risk at roughly 1 °C (a level significantly exceeded by now, with the GMT increase in 2014–2023 estimated to be 1.20±0.12 °C with respect to 1850–1900 (WMO, 2024)). The transition is smoother for mean risk, which only reaches a moderate level between roughly 1.2 and 1.4 °C (approximately where we now stand globally); this is related to the fact that a few risks do not reach a moderate level until 1.5 °C (regional group) or even 2.5 °C (global group), as shown by the 10th percentile in panel (b). For a typical ember (at the median risk level), the transition from moderate to high occurs between 1.5 and 2 °C (regional group) or 1.5 and 2.3 °C (global group). Given the definition of high risk, this means that more than 50 % of the risks illustrated by embers are expected to become severe and widespread in those temperature ranges. This new illustration of aggregated risks confirms that impacts will escalate with every increment of global warming (IPCC, 2023), especially above 1.5 °C. The year 2023 almost reached 1.5 °C already (due to the combination of climate change and climate variability; WMO, 2024), and the AR6 concluded that, in most scenarios, this level would be reached on a multi-year average in the first half of the 2030s. Even keeping a 66 % chance of staying below 2 °C would require rapid; deep; and, in most cases, immediate greenhouse gas emission reductions (IPCC, 2023). Above 2.5 °C, 50 % of the risks assessed at the regional level start to transition to very high and are expected to be very high around 3.2 °C. This means that more than 50 % of assessed systems would face persistent and/or irreversible adverse impacts and would reach adaptation limits – which have already been reached in some sensitive ecosystems (O'Neill et al., 2022a).
So far, we have excluded the RFC embers from the analysis as they are already providing an aggregated overview of risks. It is thus interesting to compare our results with the two RFCs which have the most similar objectives: RFC4, focusing on global aggregate impacts, is an obvious candidate. RFC3, which illustrates the distribution of impacts, may share similarities with our aggregation of regional embers, even though it was not built for precisely the same objective. While our embers and the RFCs should not be expected to be identical, panel (d) confirms that they are quite close. A fraction of this “close matching” may be due to chance, but the main features of the aggregated embers are robust. This tends to confirm, through a partly independent analysis, that RFC3 and RFC4 do reflect a wide assessment of how risk increases with further global warming and that the RFCs are, indeed, strongly grounded in the underlying in-depth assessments, as would be hoped and expected.
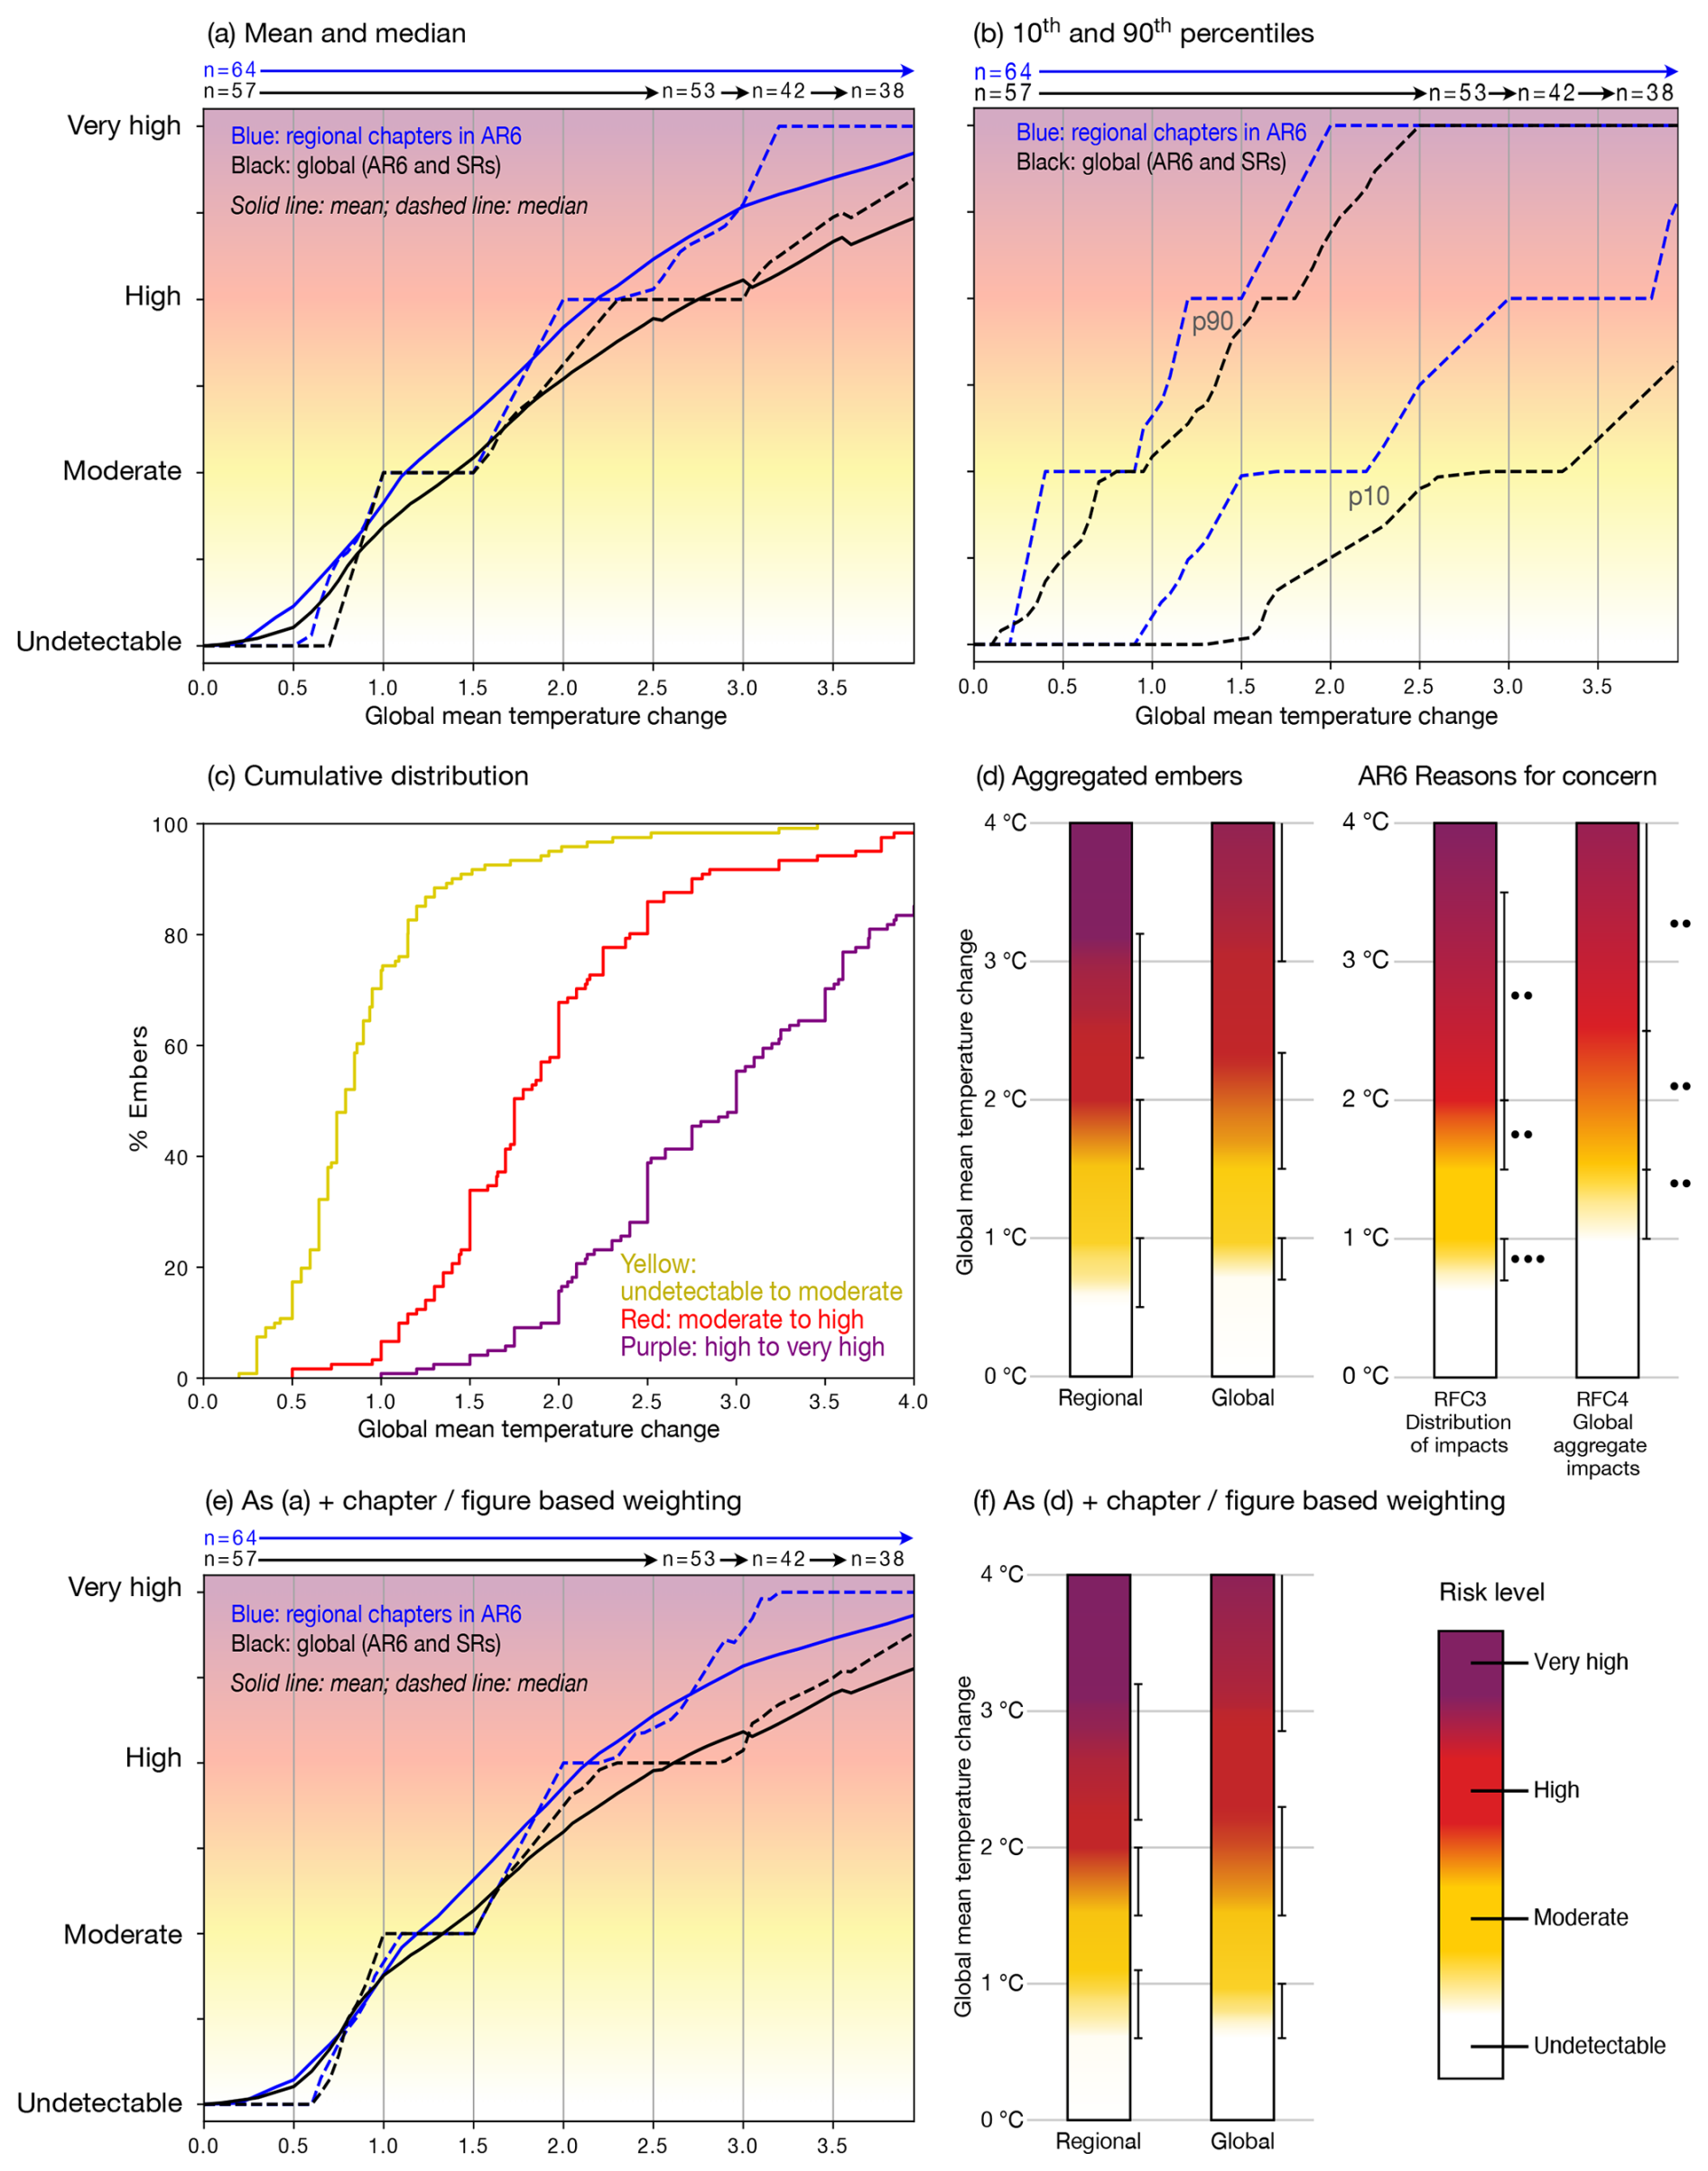
Figure 5Aggregated risks based on all burning-ember diagrams from the AR6 cycle (AR6, SROCC, SRCCL, and SR1.5), excluding the Reasons for Concern (shown separately), as well as high-adaptation alternatives (which were not considered in the RFCs and are included in Fig. 6). All panels except for panel (c) separate global assessments (focusing on systems) and regional ones (focusing on continents). The total number of included embers is 121 (for more information, see Table 3). (a) Average risk level for each global mean temperature increase (solid) and median risk level across embers (dashed). The small “glitches” in the global mean around 2.5, 3, and 3.5 °C result from the reduction in the number of available embers because risks were not assessed above a certain temperature level (in particular, beyond 2.5 °C in SR1.5); the number of embers taken into account is indicated on top of the figure. The upper limit of GMT is set to 4.0 °C because there are even fewer embers assessed above that level (in addition, very high levels of change may result in large uncertainties). Panel (b) shows the 10th and 90th percentiles among the sets of embers, similarly to panel (a). Panel (c) indicates the fraction of assessed embers for which a given GMT exceeds the midpoint of each of the three risk transitions. The left part of panel (d) compares embers constructed from the aggregation of regional or global embers. Transitions are based on the median risk among the set of embers at each temperature level. The right part of panel (d) reproduces the Reasons for Concern (RFCs) 3 and 4 from the AR6 (RFCs are excluded from all other parts of this figure). Panel (e) shows the same information as panel (a), except for weighting each ember in a way that allocates the same weight to each chapter or figure (see text). Panel (f) is the equivalent of panel (d), with weighting based on chapters or figures.
3.1.3 The mean and other aggregate metrics: a broader view on risk changes
We have thus far mainly concentrated on the behaviour of the medians. Other approaches, such as looking at the means, may help in getting a broader view on risk changes. The mean and the median can exhibit distinct behaviours, particularly at higher levels of warming (above 3 °C GMT), where the median risk is systematically higher than the mean risk. However, this is where the mean is less relevant: there is a “saturation” effect due to the absence of risk levels beyond very high risk. As shown in Fig. 5b, the 90th percentile reaches very high risk at 2 or 2.5 °C. Beyond this temperature level, more than 10 % of the risks are at the top of the risk scale (very high) so that the assessed level of risk cannot increase further. This may reflect saturation effects in the embers: for example, human lives and species cannot be lost twice – that is to say, there are certain impacts which, once they eventuate, cannot get any worse. Nevertheless, the risks will continue to increase beyond 2.5 °C: systems that have been affected little so far may become severely impacted, with interactions and cascading effects (Sect. 4). Panel (c) supplements this information by looking at another aggregated metric: it shows the cumulative number of embers for which risk is beyond the midpoint in a transition. For example, looking at 1.5 °C, about a third of the assessed risks are at least halfway between moderate and high risk, while a little less than 10 % of risks are already halfway to very high risk.
3.1.4 A closer look at specific risks which may stand out
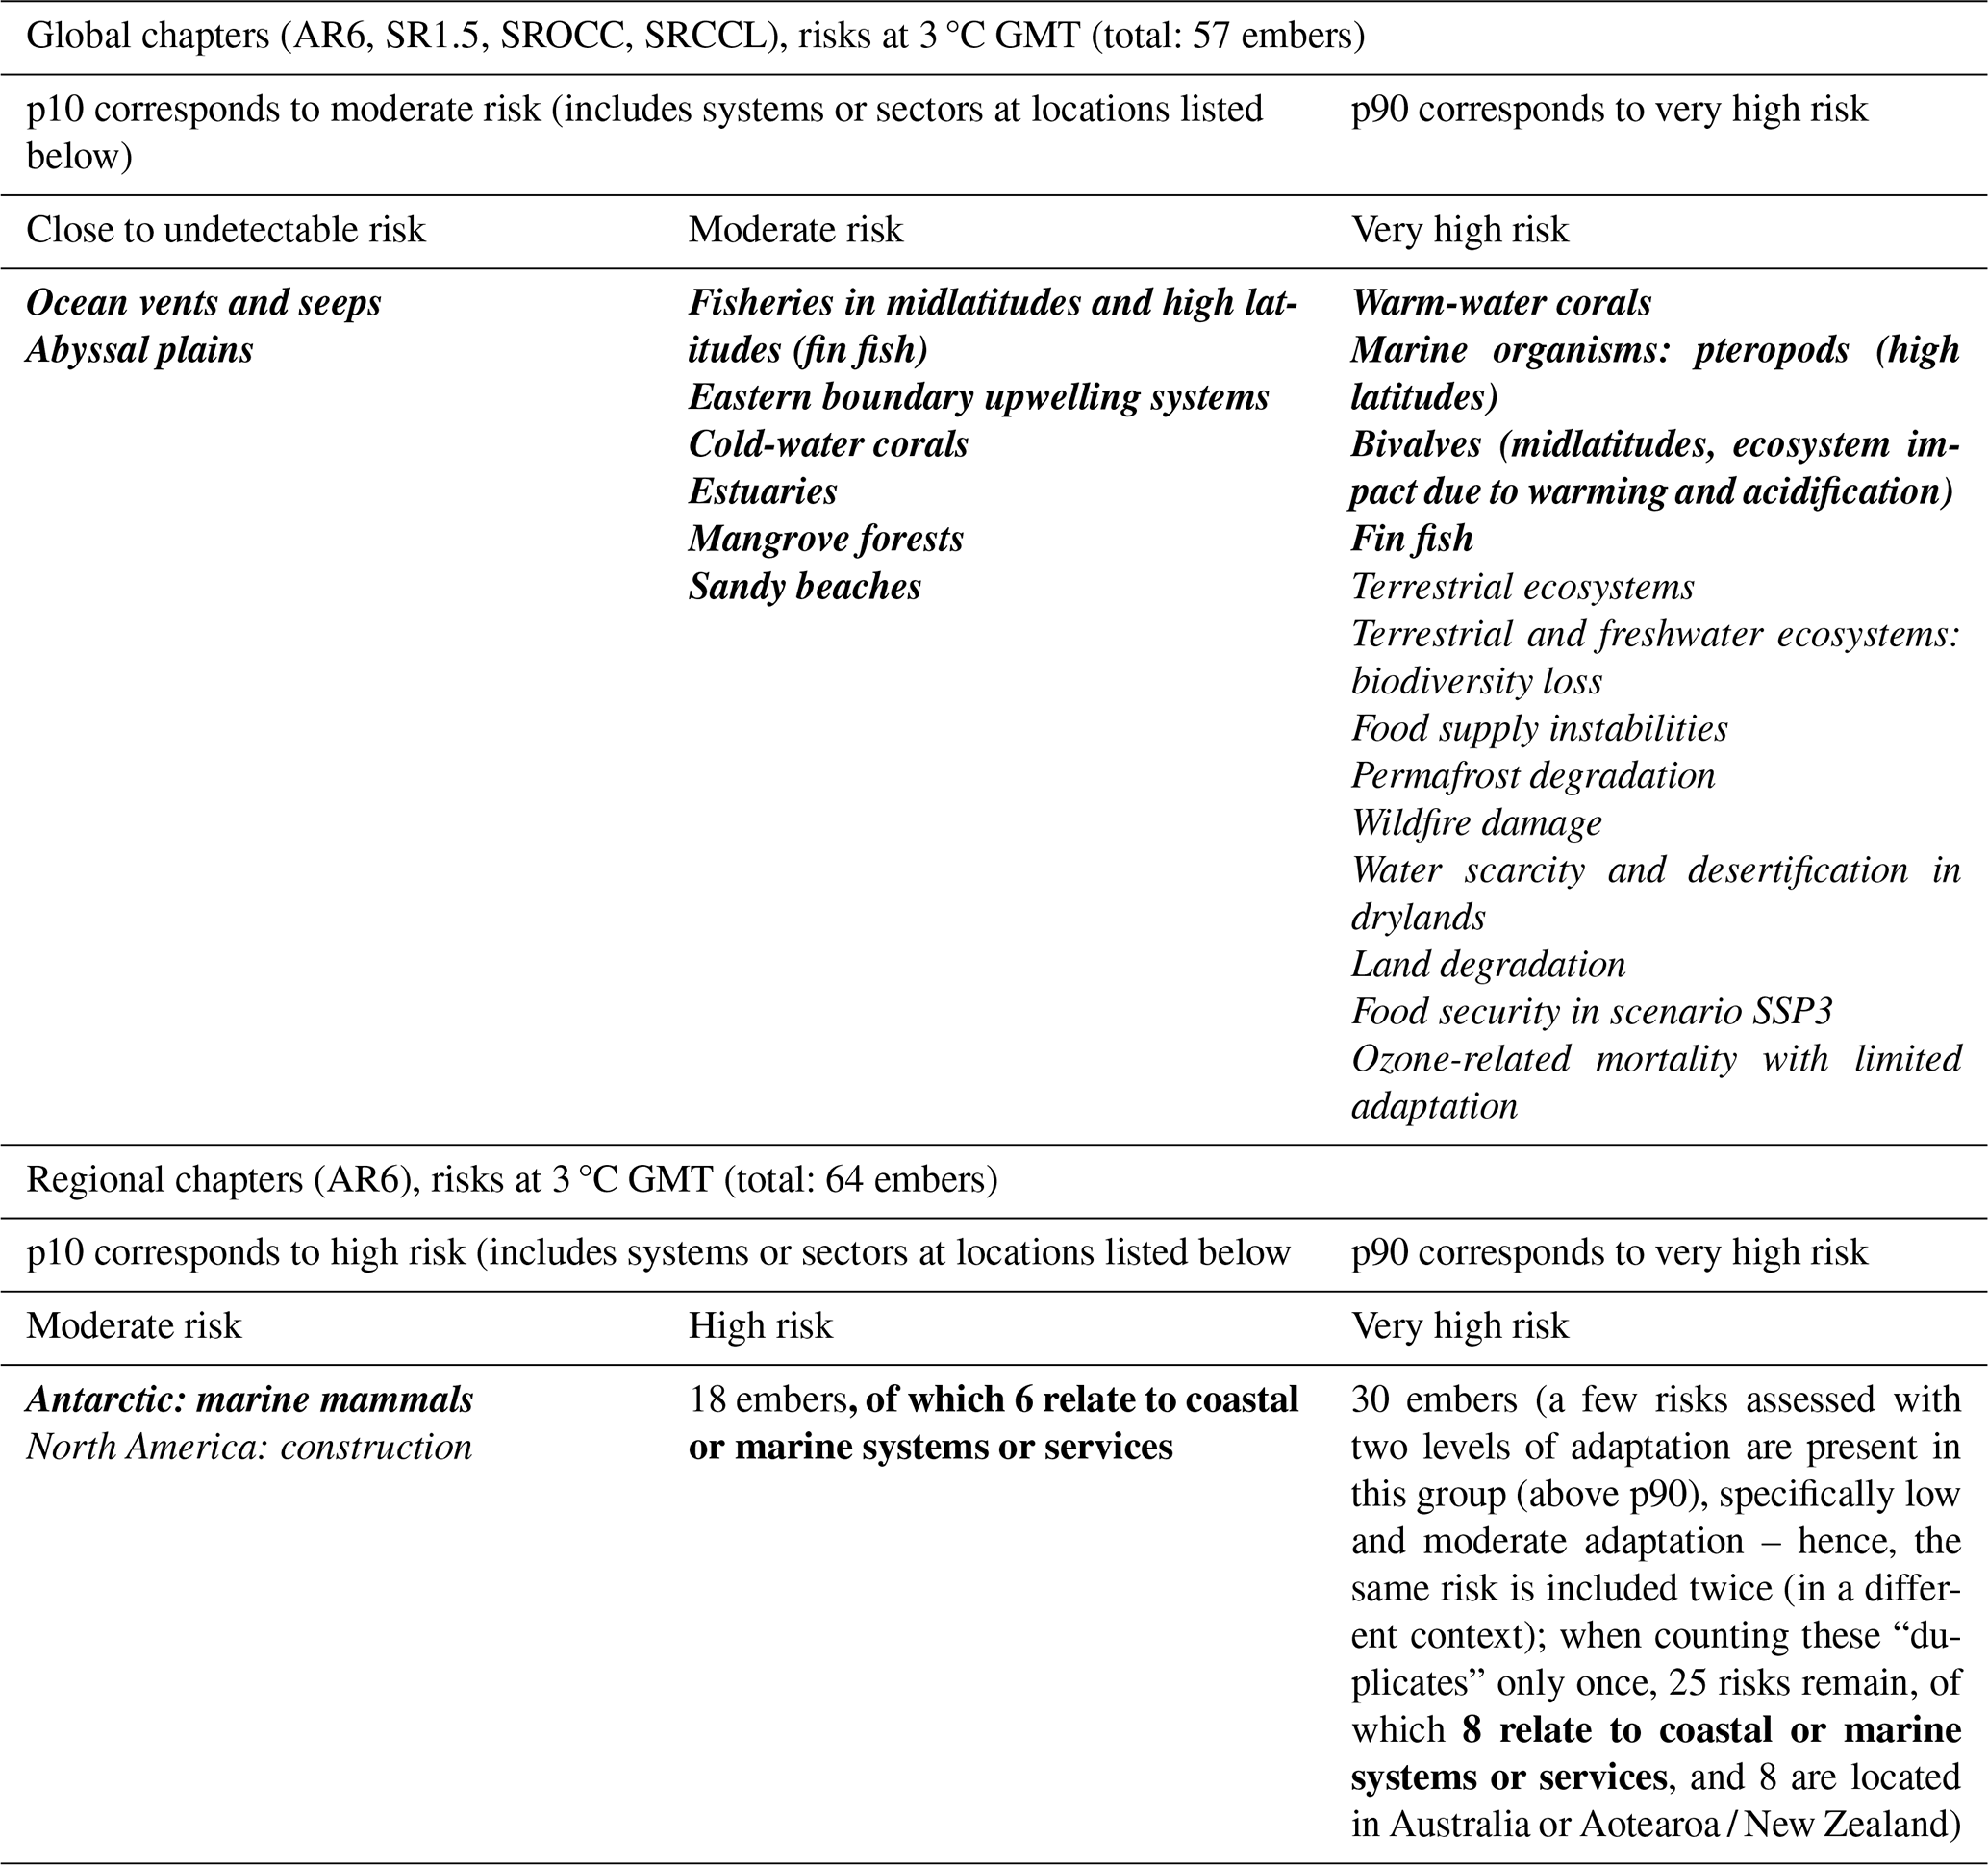
A specific group of embers that may require more attention relates to the risks which remain low even above 2.5 °C. The 10th percentile (p10) shown in panel (b) suggests that low risks are more prevalent in the global group: what would be the possible cause(s)? Could this adversely affect the aggregate results? Table 5 lists the specific embers which contribute to the lower and higher risk percentiles for a GMT increase of 3 °C. A distinctive feature of global embers showing risks up to p10 is that they all relate to ocean or coastal systems or services. In the case of coastal systems, this could be partly related to a possible overestimation of the GMT (used for aggregation) as compared to the GMSST that was assessed. This would be the case if, while the reports mention GMSSTs as the hazard metric, it was, in practice, difficult to account for the difference between coastal SSTs and ocean averages. If the risk assessment relates to coastal temperatures, converting to GMT may require a lower factor than for open-ocean temperatures. This would result in smaller increases in GMT for a given level of risk, or, in other words, it would increase the risk at a given temperature. If such a (moderate) underestimation of risk exists, it may possibly contribute to the large number of low-risk estimates for coastal risks. However, there are also a number of high-risk embers which relate to ocean and coastal systems, as shown in the p90 category in Table 5. All in all, we do not think that this is a game changer for the aggregated results, but it emphasizes that checking and harmonizing the details of assessments can be useful. The evolving knowledge that is, for example, related to a potential weakening or collapse of the Atlantic meridional overturning circulation and its consequences for marine ecosystems (e.g. Boot et al., 2024; Van Westen et al., 2024) suggests that updating the risk assessment for ocean systems could be an important focus in the AR7, especially given that the related embers were not updated in the AR6. Future studies should pay renewed attention to how local sea surface temperature, acidification, and sea level relate to GMT (or other global hazard metric) as this was a difficulty in SR1.5 and, to some extent, the SROCC (Sect. 2.2).
Another potential contributor to the higher incidence of low risk in ocean systems is that, while most chapter authors have limited their assessment to key risks selected for their severity (Sect. 1), ocean-related embers may include impacts that are not expected to become severe, except possibly under large emission scenarios (e.g. “vents and seeps” and “abyssal plains”; see Sect. 3.3). Within the regional embers, a large proportion of systems at very high risk is are in Australia and/or Aotearoa / New Zealand (Table 4). This may reflect the larger occurrence of endemic and/or otherwise particularly vulnerable systems, including corals, although we cannot rule out some heterogeneities in approach between chapters. This also highlights that other regions of similarly very high risk may be missing due to the incomplete coverage of regions in the AR6 embers.
Table 5Embers contributing to the lower (p10) and higher (p90) percentiles at 3 °C GMT. Ember names are in italics (for more information on specific risks, see Figs. 7 and 8 or the online tool presented in Sect. 2.5.2). Given their prominence in the global group, risks related to ocean or coastal systems are shown in bold. In the global group, all the risks evaluated as undetectable or moderate come from the SR1.5 or the SROCC. The percentiles are chosen for comparability with Fig. 5; as the risk scale stops at “very high”, at 3 °C, there is a significant saturation effect (see text), particularly for the regional chapters, for which the 50th percentile is already close to very high risk (Fig. 5a). As in Fig. 5, the assessments with high adaptation are not included.
A potentially useful lesson for future reports is that looking at the distribution of assessed risks in terms of severity at given levels of warming may reveal interesting features. This method, or other ways of looking for commonalities between assessed risks, may help to construct a synthesis and possibly to identify differences between groups of results that would warrant investigation to distinguish methodological causes (which may suggest further harmonization) from substantive ones (Sect. 4).
3.1.5 Confidence in assessed risk levels
The Ember Database also makes it possible to obtain an overview of the confidence levels attributed to the assessed risk transitions (for the embers of the AR6 cycle). About 40 % of the transitions were given high or very high confidence in both the regional and global embers (Table 6). Among global embers, 19 % were given very high confidence for the transition from undetectable to moderate risk; conclusive evidence appears to be more readily available for this transition: it largely comes from past events, and the moderate risk level does not require evidence of widespread risks, unlike for higher risk levels. Very high confidence is almost never reached for other transitions. At the opposite end of the spectrum, about 15 % of the transitions were assessed with low confidence, with a majority of this for the transition to very high risk. Larger risk and longer-term risks might be commensurately harder to assess and irreducibly more uncertain due to a number of factors. Low confidence is related to limited evidence, which may be due to the lower availability of studies about large changes, to which a focus on 1.5 and 2 °C following the Paris agreement may have contributed (Kemp et al., 2022). Reaching firm conclusions might be more difficult because risks result from a combination of more uncertain factors related to long-term societal changes and/or regional climate projections. However, the link between uncertainty and confidence is complex because uncertainty can be represented by a wide transition range, which tends to increase the confidence that the transition is indeed within that range (Zommers et al., 2020); this is illustrated in the assessment of the RFC related to aggregate impacts in the AR6: two ranges were assessed for the same transition, with more confidence in the larger one (O'Neill et al., 2022a).
Table 6Confidence levels for the risk transitions. The central part of the table provides the number of embers which received a given confidence level for a given transition. The second column indicates the mean GMT of the median of each transition (e.g. halfway between undetectable and moderate risk). The last column is the total number of embers for which a given transition was assessed.
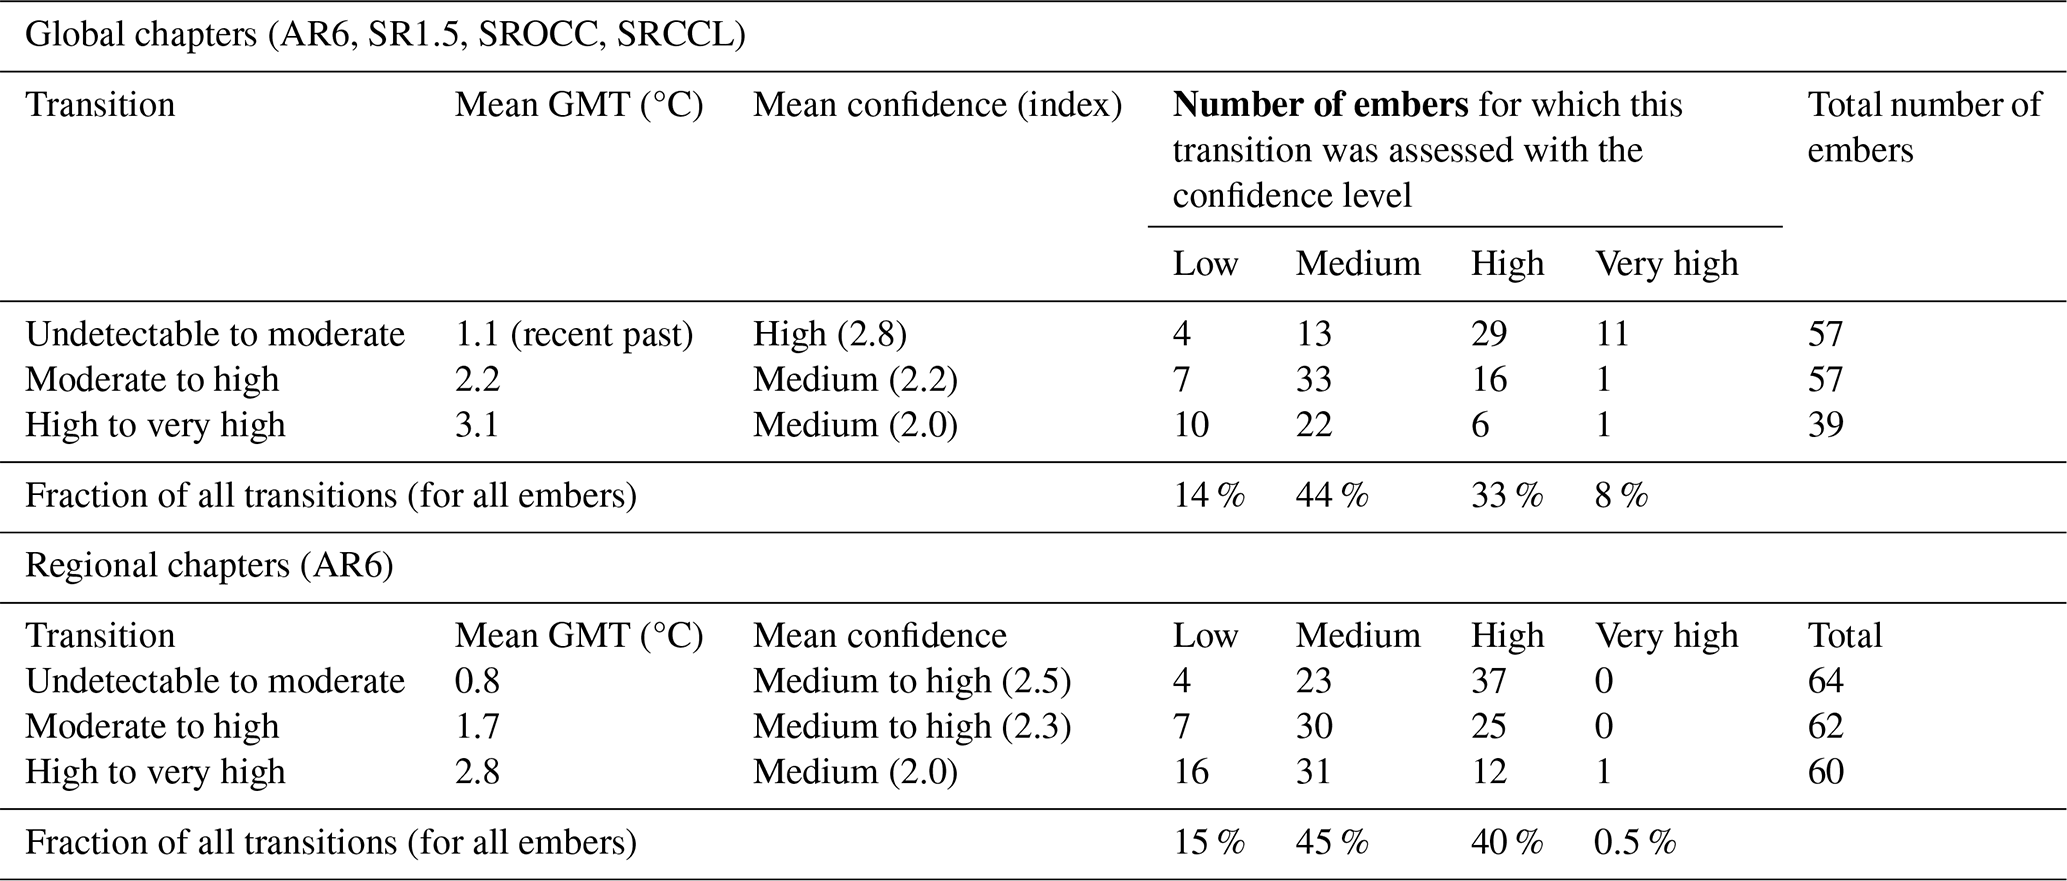
“Mean confidence” is the mean of a confidence index, defined as follows: 1 indicates low confidence, 2 indicates medium confidence, 3 indicates high confidence, and 4 indicates very-high confidence. Mean GMT and confidence are rounded to the first decimal place.
3.2 Human vs. natural systems and the potential role of adaptation
Figure 6 aggregates embers into three groups: risks for ecosystems, risks for other systems (including some ecosystems services) excluding the assessments considering high adaptation, and remaining risks with high adaptation. The three groups are exclusive as none of the embers relating to ecosystems consider a high-adaptation case. Results show that aggregated risks are generally higher for ecosystems compared to human systems, consistently with Magnan et al. (2021). Part of this result may be due to the limitations of autonomous adaptation in natural systems (especially at large warming rates), as well as insufficient knowledge regarding the effectiveness of different human interventions to support natural adaptation. As a result, authors of the AR6 chapter on Europe, for example, did not produce embers on terrestrial or marine ecosystems under high adaptation (Muccione et al., 2024). Another potential explanation for higher risks in natural systems is that these involve a more “direct” connection between climate and risks as compared to some of the human systems, which also depend on less- or non-climate-sensitive factors (e.g. urban planning, part of the economic production).
For risks affecting human systems and ecosystem services, the potential benefit from adaptation appears to be significant, for example, reducing the median risk at 2 °C from high to moderate. Up to 2 °C and under high adaptation, more than 50 % of the risks studied are still considered to be moderate. The same applies without high adaptation up to just over 1.5 °C. For the studied set of risks, adaptation helps in gaining 0.5 °C for the start of the transition to high risk and in gaining 1 °C for the point at which more than 50 % of the risks are assessed as high (end of the transition to high risk).
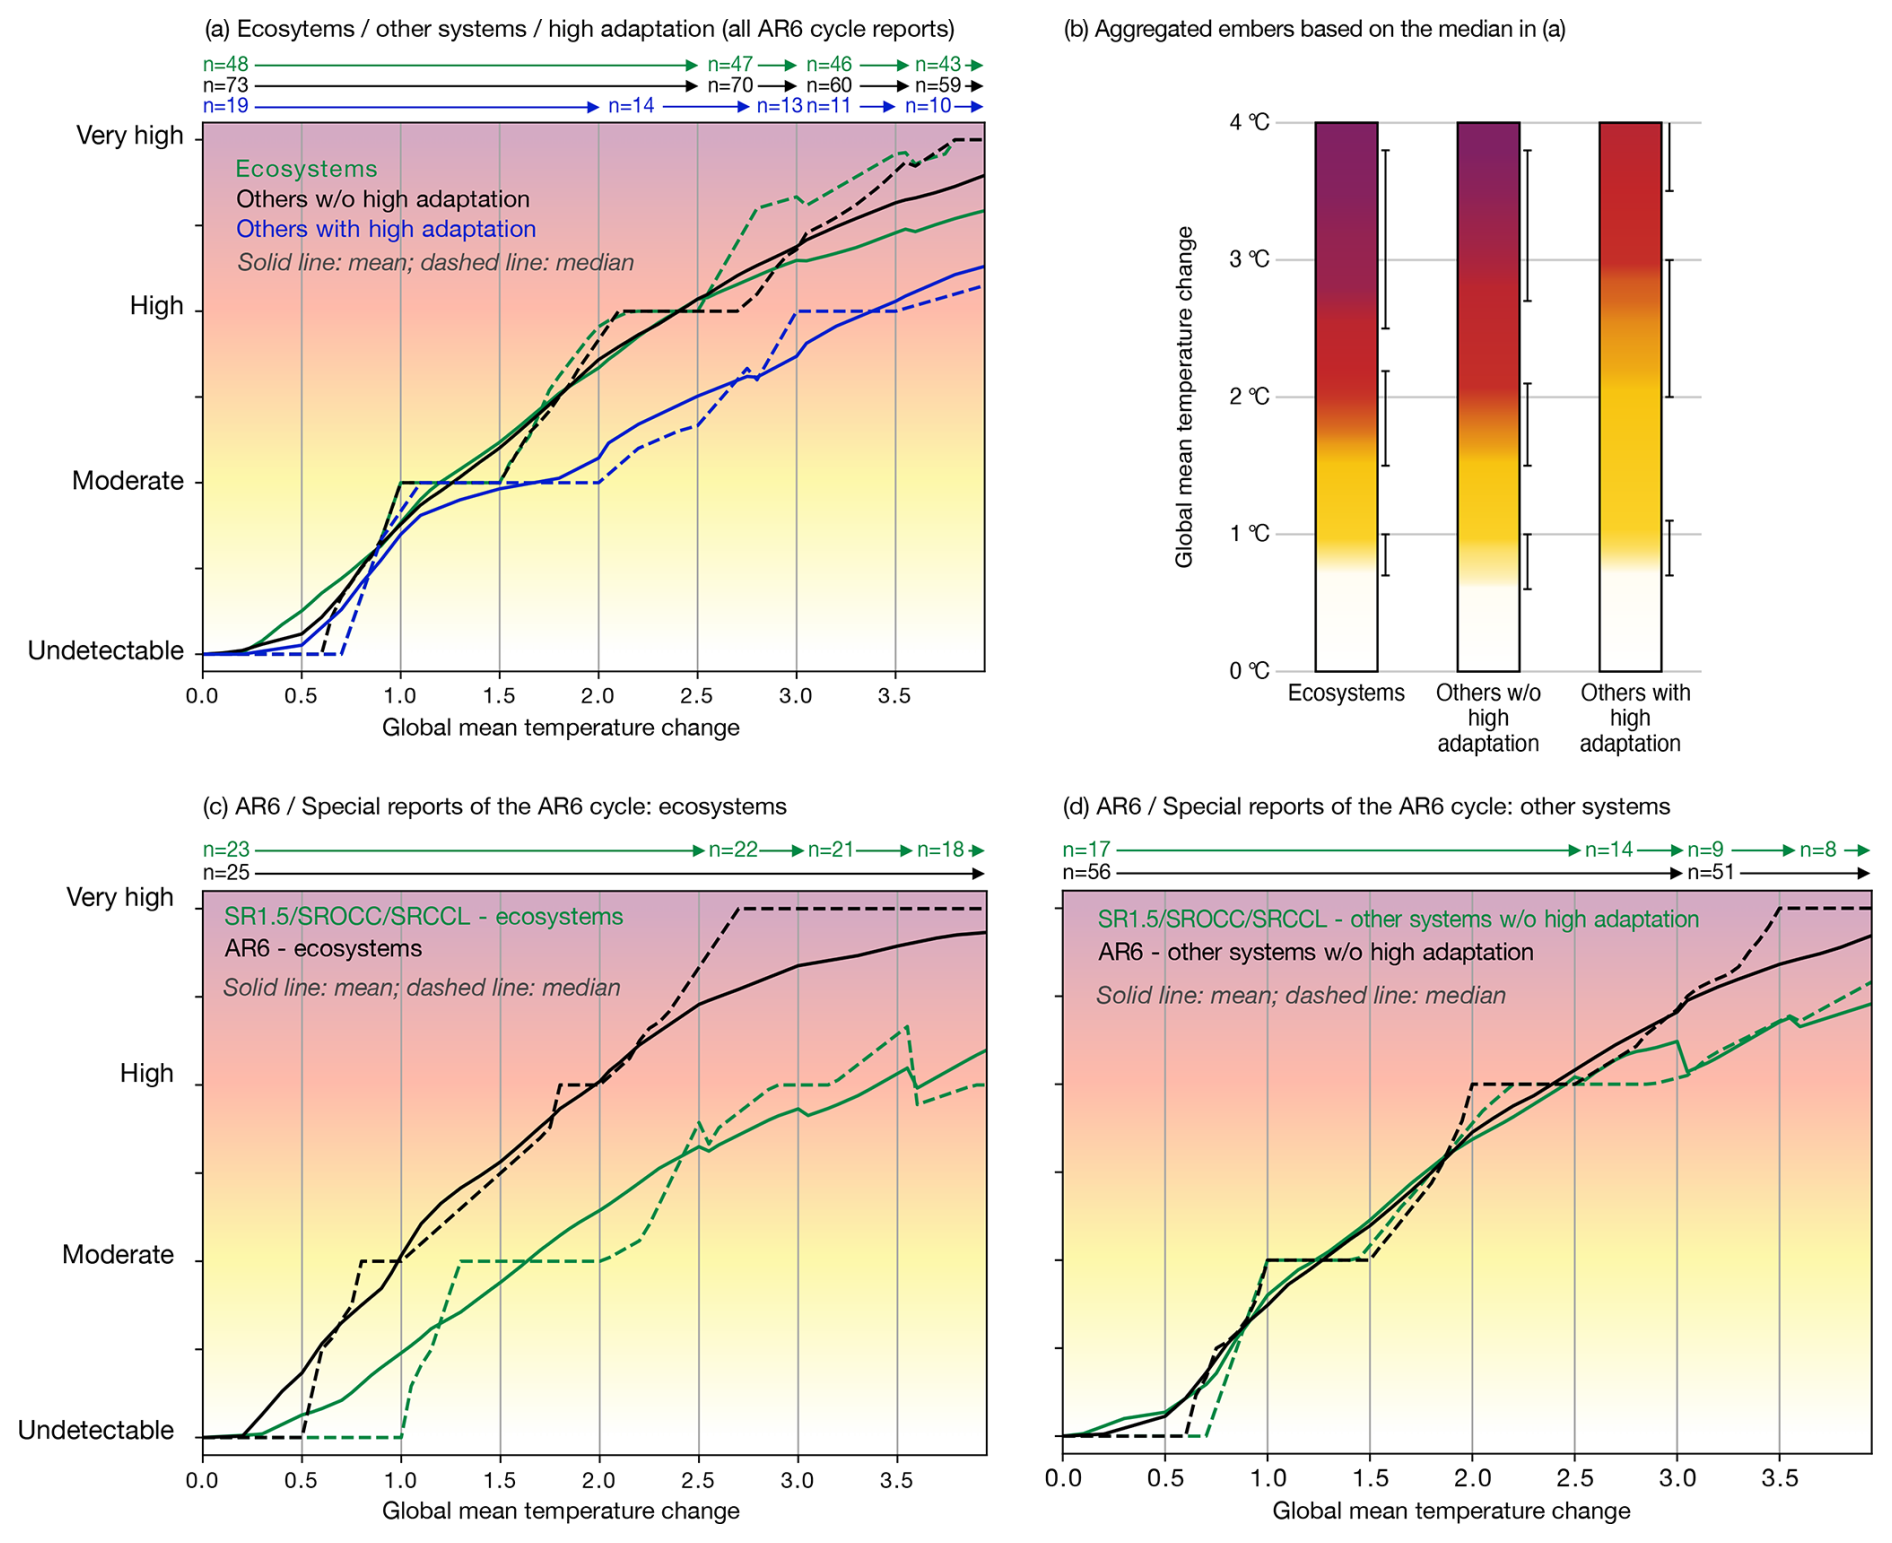
Figure 6(a) Aggregated risk levels for ecosystems (indicated in green) and all other risks assessed with a level of adaptation that is either undefined or, at most, moderate (black) and embers with a hypothesis of high adaptation (blue). The number of included embers is provided on top of the panel. (b) Representation of the median values as burning embers. Note that the volume of available data decreases as warming increases (see text), as shown in panel (a); the embers reflect the available data at each level of warming, particularly for the adaptation cases: there is no implication that adaptation would be “feasible and efficient” for all systems at all levels of warming. (c) Separation of the risks for ecosystems shown in (a) by source – the AR6 or special reports. (d) Same separation for other systems (without high adaptation).
Some of the high-adaptation cases were not assessed above 2 °C. This is notably the case when the analysis is based on a scenario that assumes socio-economic conditions favouring ambitious mitigation (in particular, SSP1), thus avoiding higher temperature increases. The few cases which were explicitly assessed in relation to scenarios relate scenarios SSP1, SSP2, or SSP3, which form a subset of the SSPs in which challenges to adaptation and mitigation are supposed to increase or decrease together (O'Neill et al., 2017b). As the assessment does not cover temperatures beyond those projected in each scenario, the corresponding embers were truncated to the nearest whole degree Celsius of projected warming in 2100 (IPCC, 2022d, 2023). Consequently, fewer high-adaptation scenarios are available at higher warming levels in the aggregated analysis. This situation may partly result from the selection of SSPs that were included in the available studies as the SSP framework itself would, in principle, allow other combinations of mitigation and adaptation (especially within SSP5 and intermediary scenarios that would still involve substantial use of fossil fuels). The alternative would be that the combination of high warming and high adaptation is less plausible if aspects of sustainability, as idealized in SSP1, are more effective in reducing risks when progressing together in a broader context. There is support for this hypothesis in the WGII contribution to the AR6 as it concludes (with medium confidence) that prospects for climate-resilient development – including mitigation and adaptation – will not be possible in some regions and subregions if the global warming level exceeds 2 °C (IPCC, 2022d). This relates to the issue of adaptation limits, for which important knowledge gaps remain (Berrang-Ford et al., 2021).
3.3 Risks across systems: contributing to the identification of hotspots?
To provide a concrete view of the risk changes, Figs. 7 and 8 present data from all embers of the AR6 cycle in a synthetic way, focusing on risks at 1.5, 2, and 2.5 °C GMT. This illustrates risks that can be avoided at lower levels of GMT (smaller circles) and via adaptation (lines connecting circles for the same GMT).
3.3.1 Risks increase with temperature
Consistently with the aggregated results in the previous sections, each 1 °C rise in GMT increases many risks by roughly one category (e.g. from medium to high), but there is considerable variation between risks and risk areas. For example, risks for ocean ecosystems and species at 2 °C span the whole range from undetectable (cold-water corals, abyssal plains, vents and seeps) to very high risks (warm-water corals), a broader view on risks that is made possible by the large number of embers assessments in the SROCC. The diversity of risk levels is a reminder that it is important to assess and illustrate risks with different characteristics separately via distinct embers, with particular attention being paid to rapidly increasing risks. It is a key justification for the development of the “non-aggregated” Figs. 7 and 8, which supplement the aggregated views.
Comparing risk levels should not give the impression that some risks are identified as more worrying than others as the nature of risks differ, and the relative importance of risks depends on value judgements (Sect. 3.1 and Smith et al., 2001). With this in mind, it is possible to identify systems that are roughly at high risk at 1.5 °C GMT (in the absence of an explicit consideration of increased adaptation): food supply instabilities, desertification associated with water scarcity in drylands, coastal flooding, and warm-water corals. Focusing on regional analyses, high risks at 1.5 °C are mainly found for the polar regions, especially for the Arctic (sea birds, sea ice ecosystems, permafrost), Australia and Aotearoa / New Zealand (including coral reefs, other high-biodiversity ocean ecosystems, and human settlements), and the Mediterranean region (marine ecosystems and delayed risks of coastal flooding). However, this does not mean that risks in other regions remain low, especially in the low latitudes, given the absence of embers in several chapters and the limited number of risks assessed in this form for Africa – most of these regions are highly vulnerable and have already experienced large impacts (Sect. A.2.2 in IPCC, 2023). It will be important to ensure comprehensive coverage in future reports. To achieve this, the data gap for little-studied regions, particularly in developing countries, needs to be filled – a key challenge for scientific research.
Some risks increase by significantly more than one risk level in the 1.5–2.5 °C range, suggesting that limiting warming could be particularly effective in minimizing these risks; these include risks to terrestrial and freshwater ecosystems and biodiversity, as well as to some marine systems (bivalves and fish), and land degradation. Regional analyses add other large increases in risks within this temperature range for health (through heat-related mortality and morbidity and infectious diseases in Africa), coastal flood risks, and food production.
3.3.2 Insights into adaptation
In line with Table 3, Figs. 7 and 8 show that only a limited number of burning embers were assessed for different adaptation scenarios.
These figures provide a disaggregated perspective on the substantial shift in risk reduction that can be expected from medium- to high-adaptation efforts, especially when it comes to avoiding high and very high risk levels. This can be seen for health, food insecurity, and desertification (Fig. 7), as well as for the Europe set of embers and some aspects of tourism in North America (Fig. 8). Australia–Aotearoa / New Zealand sets exhibit shorter lines joining risk levels without and with adaptation, but high adaptation was not considered, and the result still shows room for risk reduction. Summing up the cases for which adaptation has been considered, the risk reduction potential appears to be substantial, at least up to a warming level of 2.5 °C. However, high levels of adaptation may require transformative changes that may involve trade-offs, and risk reduction through adaptation will not be equally effective in all sectors or in all regions and social groups (see Sect. 4.1 and 6.2 for further discussion).
A few examples in the database illustrate that introducing different adaptation scenarios into risk assessment may allow for a more in-depth assessment of the plausible range of future risks. For example, SR1.5 assesses heat-related morbidity and mortality considering only autonomous adaptation and finds a range from above moderate to high (for the illustrated GMT range of 1.5 to 2.5 °C); the inclusion of three adaptation scenarios, however, allows the AR6 WGII to identify, for the same health risks and temperature range, a wider risk range, from moderate to very high (this range thus extends both under and above the previous estimate, depending on the adaptation level).
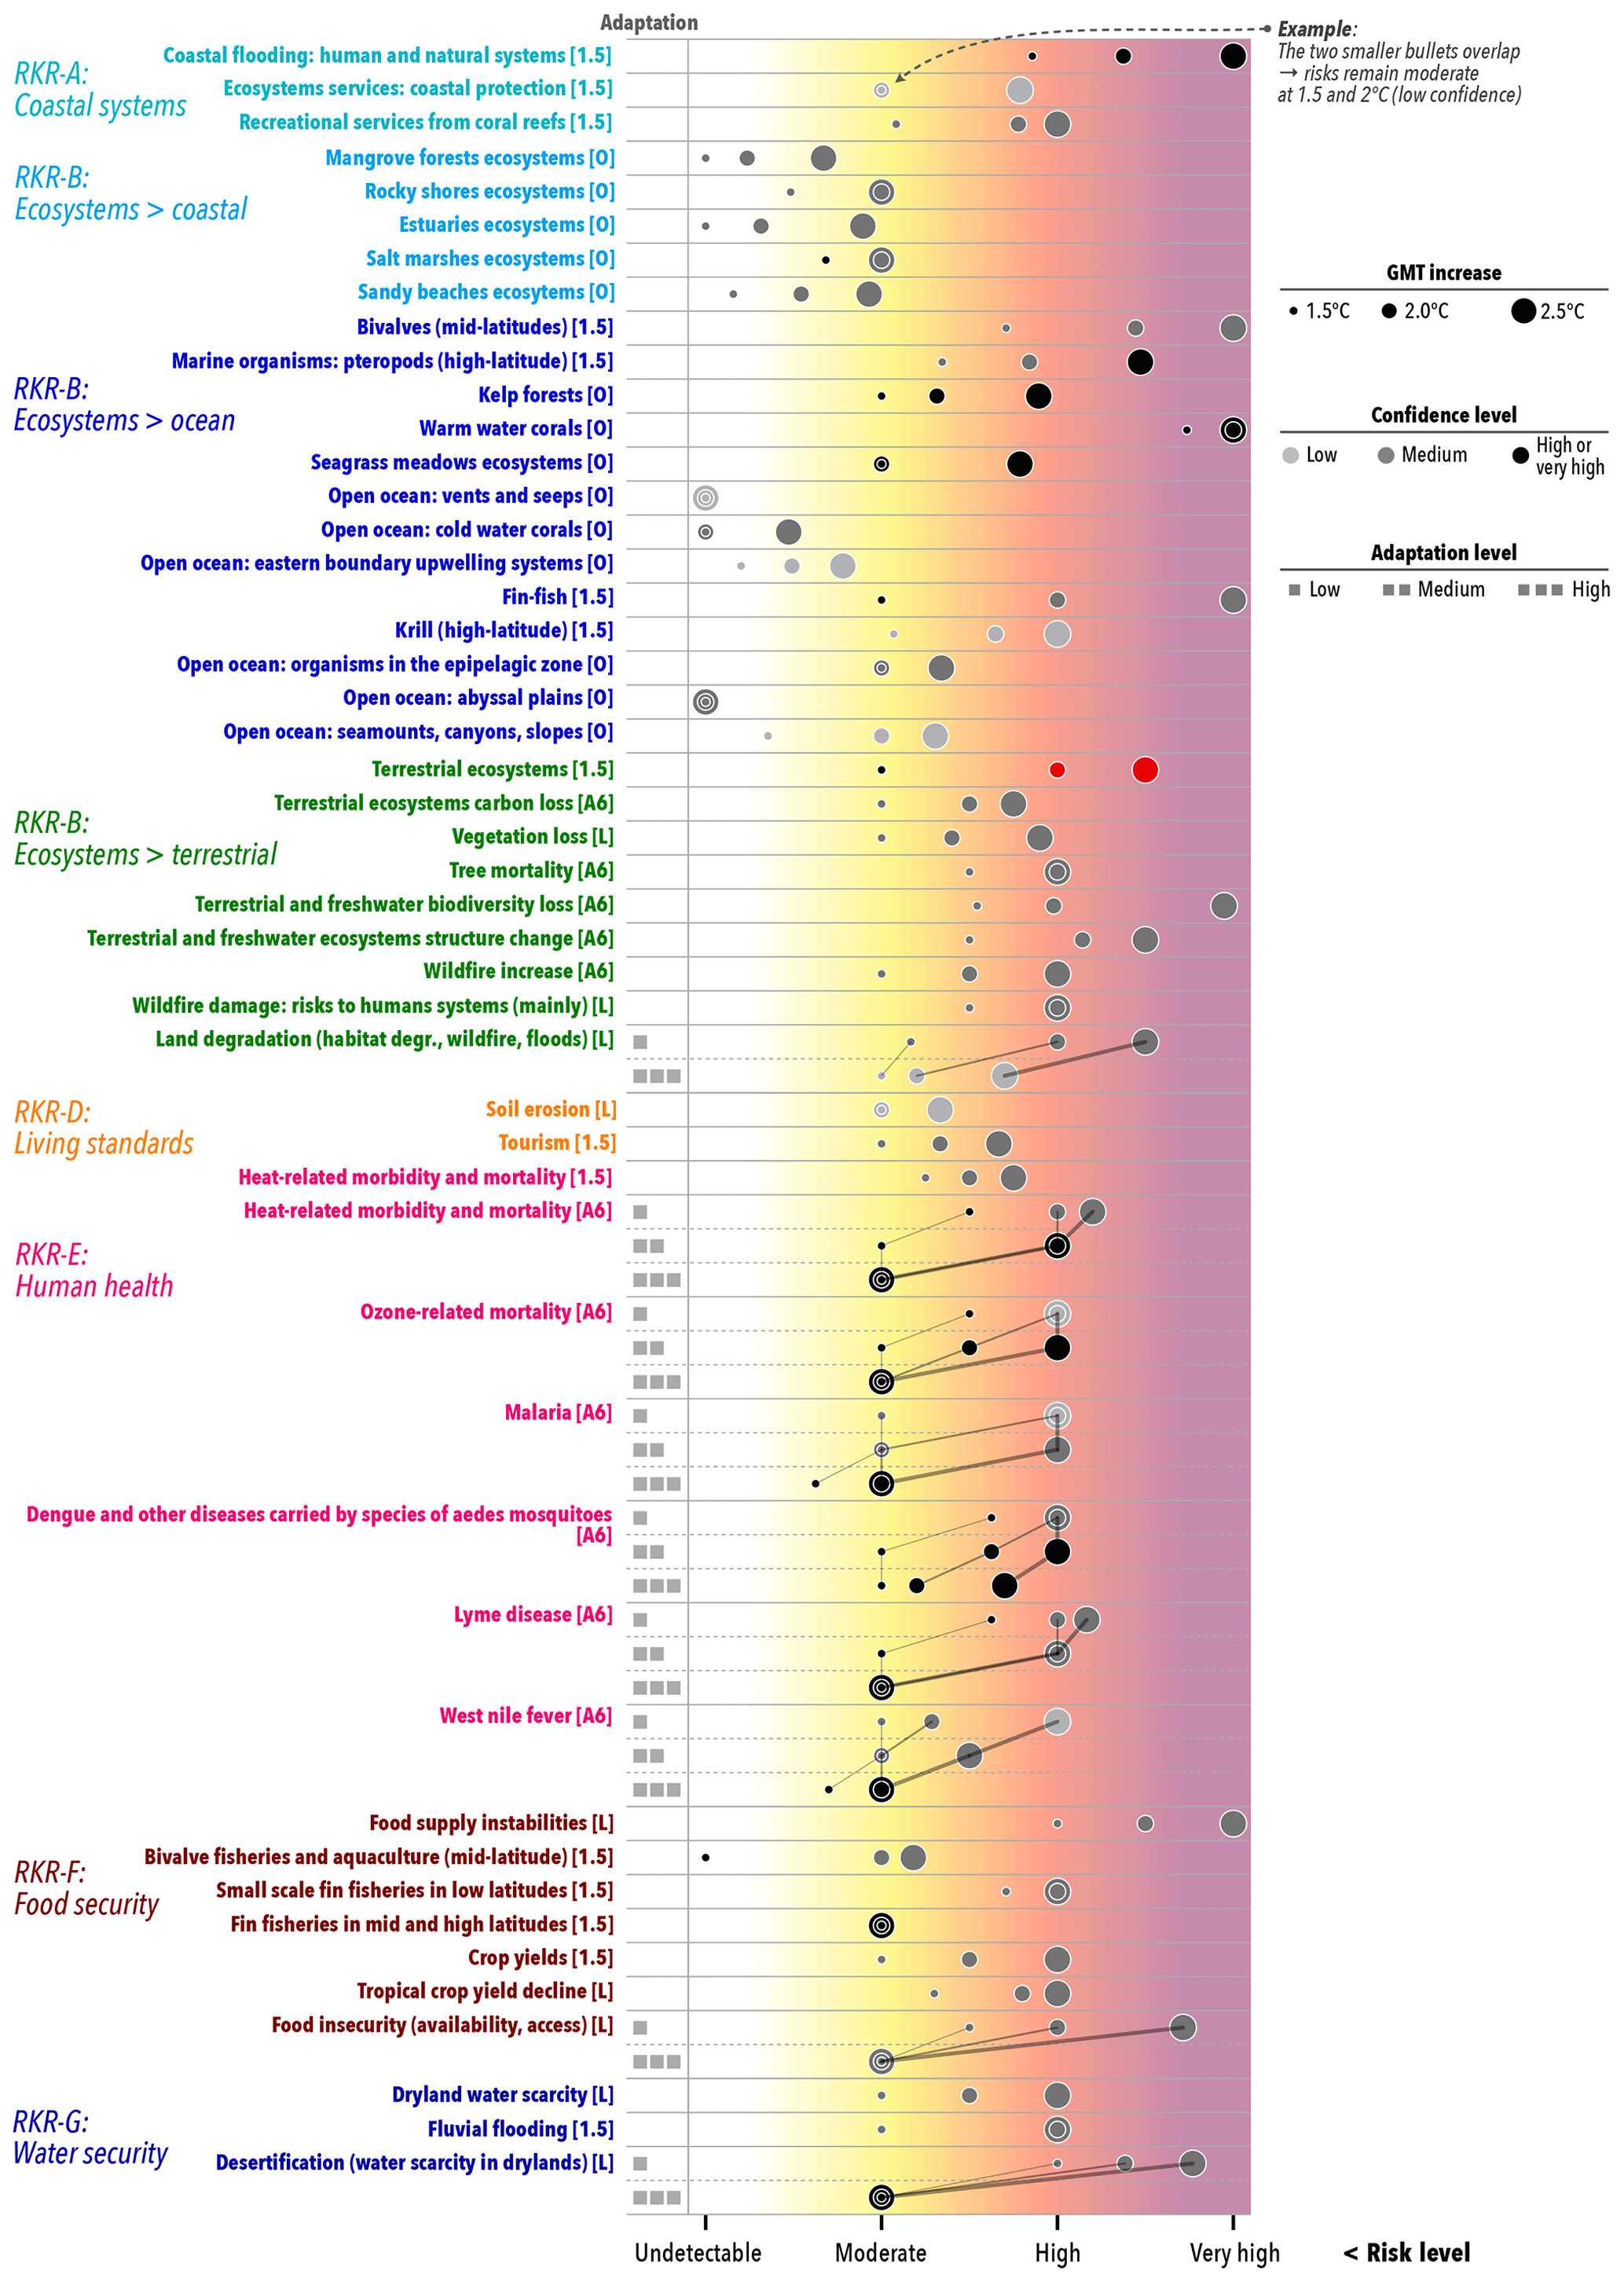
Figure 7Risks to different systems as assessed in embers presented in special reports (SR1.5 (1.5), SRCCL (L), and SROCC (O)) and in the AR6 (A6). Three levels of warming (1.5, 2, and 2.5 °C GMT) are represented by increasing the dot symbol sizes. The lines connecting the dots represent potential risk reduction through adaptation (square symbols on the left indicate adaptation levels); the thickness of these lines reflects the GMT in the same way as the size of the dots. GMT increases beyond 2.5 °C are not shown because they are not available for some embers (from SR1.5 or with high adaptation).
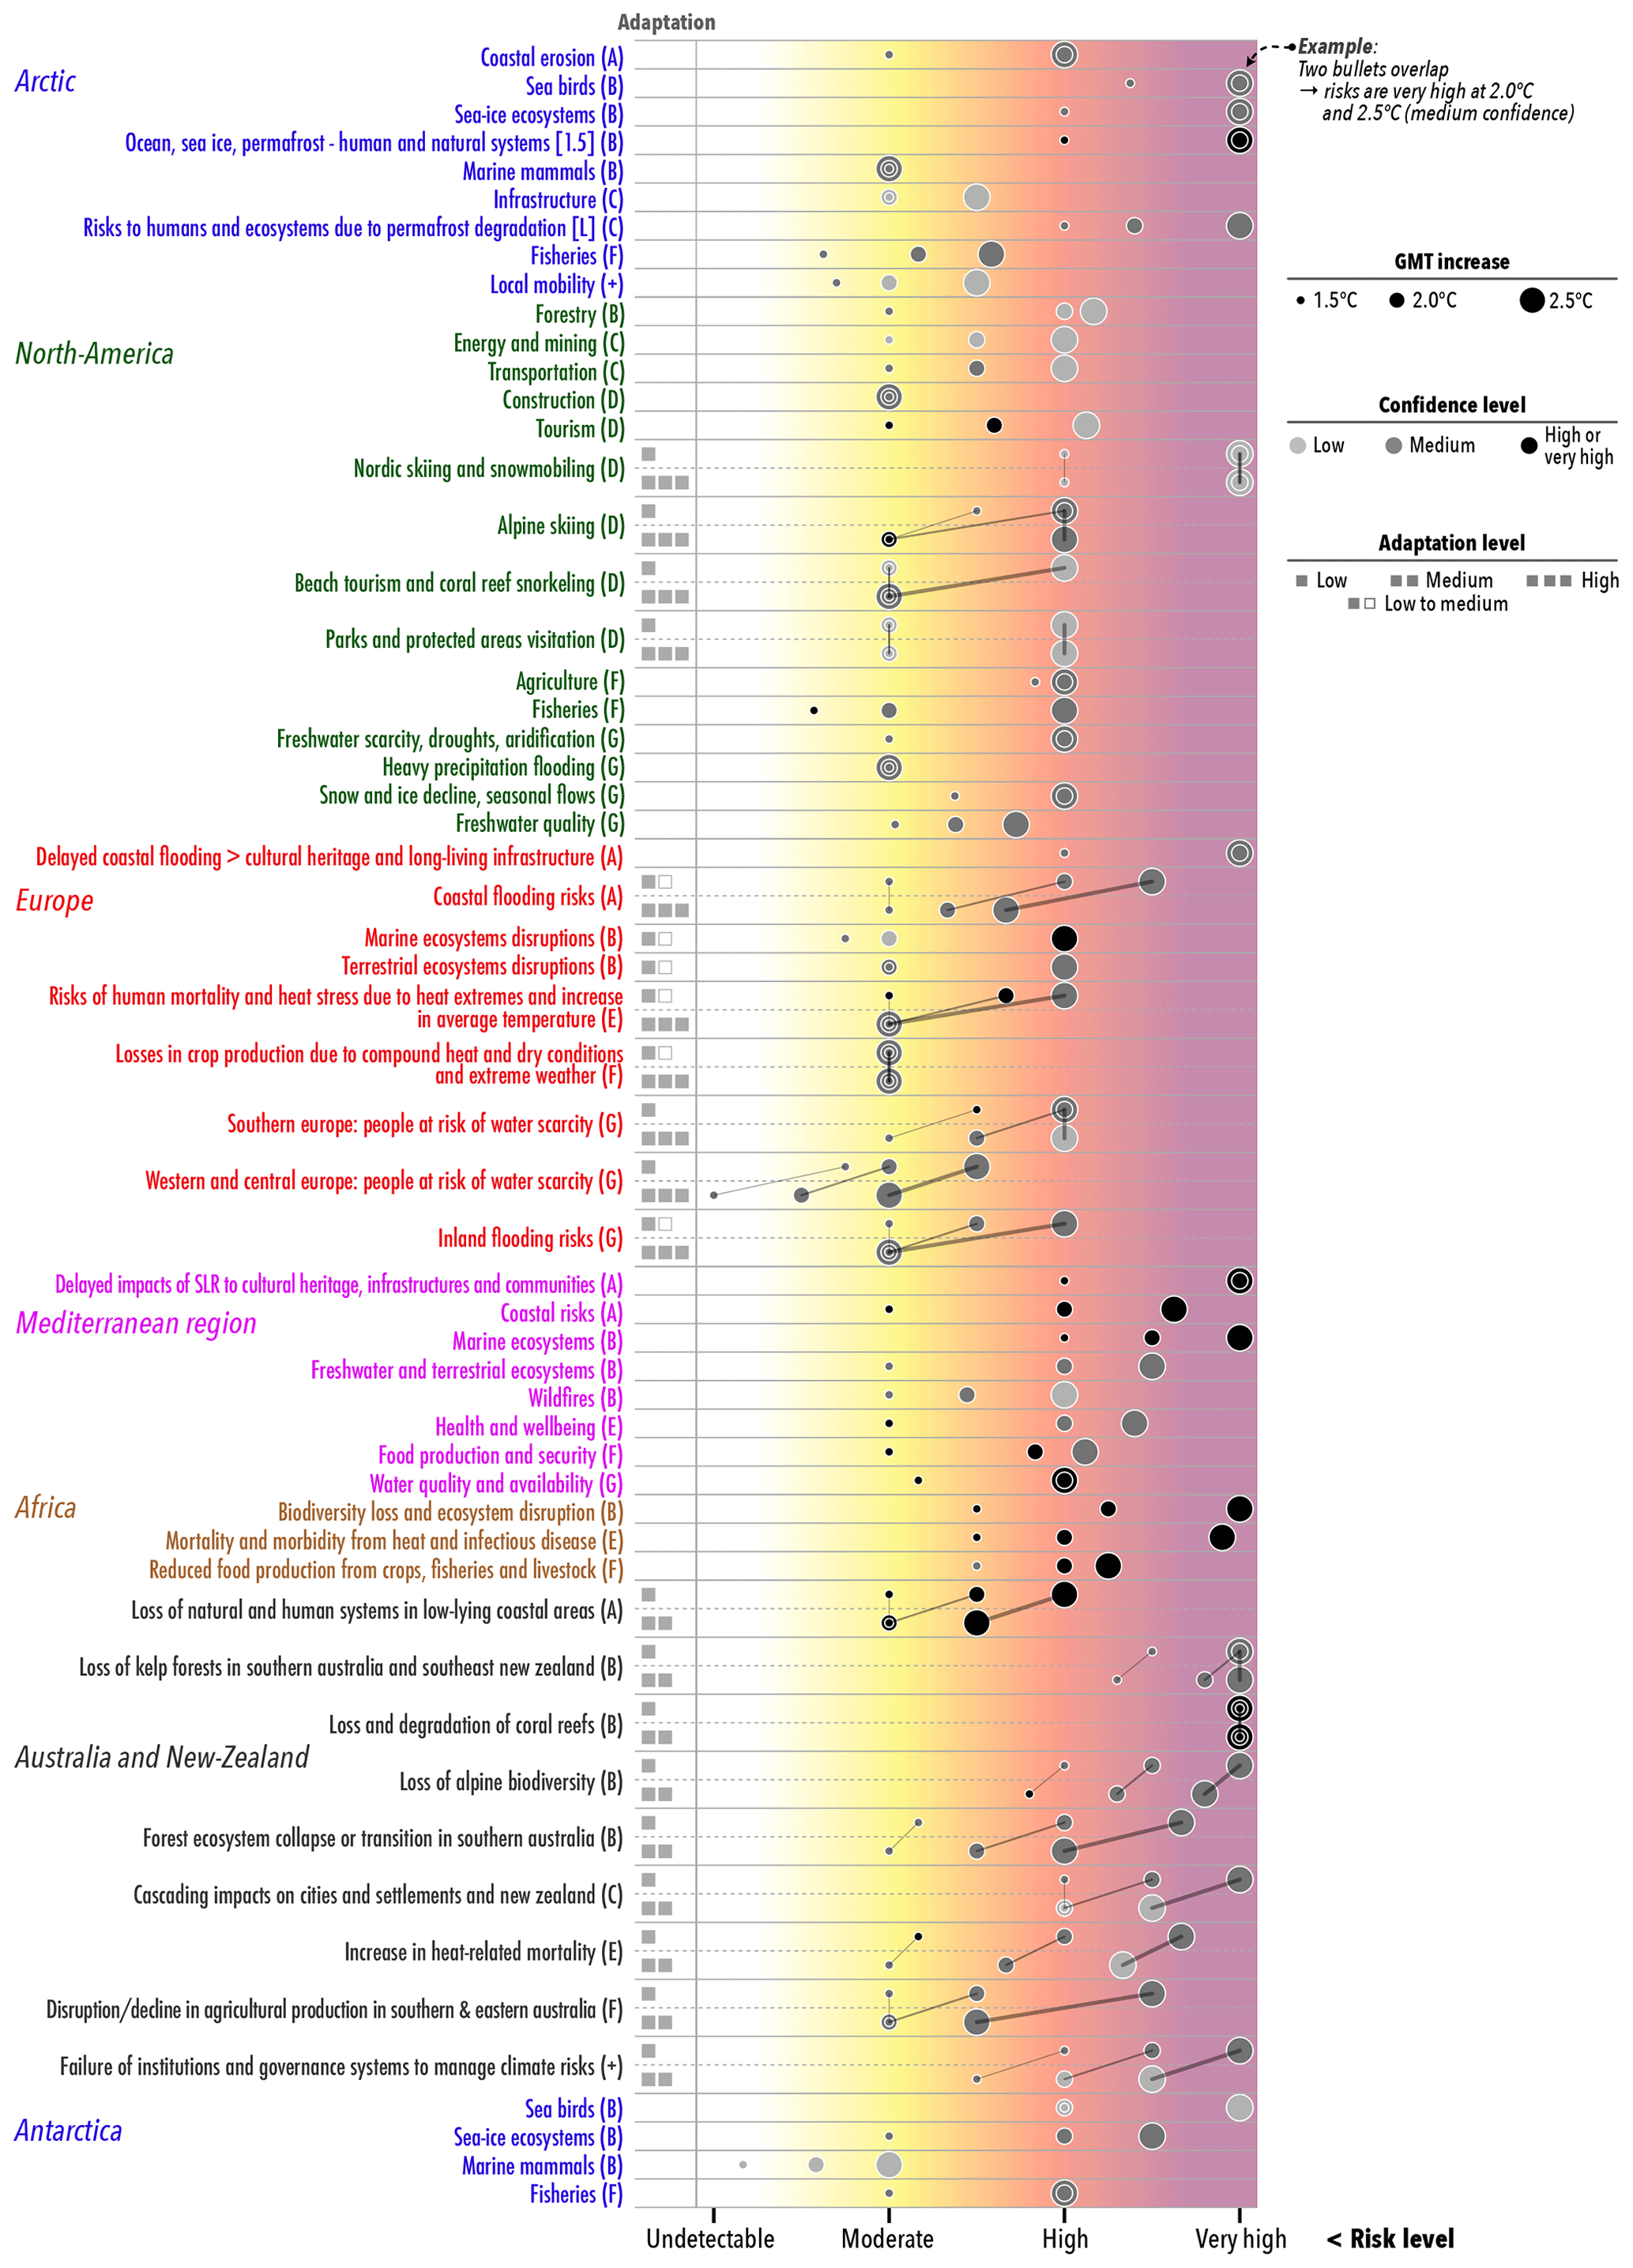
Figure 8Risks to different geographical areas as assessed in embers from the AR6 regional chapters and in two embers devoted to risks in the Arctic (as indicated by the sources SR1.5 (1.5) and SRCCL (L)). The symbols have the same meaning as in Fig. 7.
The data collected for this paper are available from Zenodo at https://doi.org/10.5281/zenodo.12626976 (Marbaix et al., 2024). The file is in JSON format, which is accessible by many software environments and is text-based. It contains a metadata section with general information such as when the data were extracted from the database, as well as a description of each data field. In recognition of the fact that these data are based on the assessment provided in IPCC reports, we ask users of the dataset to include references to the relevant IPCC reports in their publications. These references are provided in the Zenodo record (as well as in the file itself). The data are made available under the Creative Commons BY 4.0 licence.
The code used to generate the figures and tables in this paper is available from Zenodo at https://doi.org/10.5281/zenodo.14047894, (Marbaix, 2024a).
The analysis in this paper raises several issues that we suggest exploring in future work to improve the comprehensiveness and structure of burning-ember-related risk analyses. Some draw directly from the conclusions of our study (i.e. regarding the need to further bring together climate and adaptation scenarios in risk assessments, to expand the Ember Database, and to collect the necessary information more systematically; Sect. 6.1, 6.3, and 6.4, respectively). Others should be seen as complementary elements, particularly the proposed views on how adaptation scenarios could be improved (Sect. 4.2).
6.1 Towards a more comprehensive overview of climate risks
Burning embers can represent a summary of climate change risks in specific systems and regions in a consistent and usable form. Aggregating these assessments gives an overall picture of risks that is consistent with what has been concluded from other approaches: notably, half of the assessed risks have already reached a moderate level. If global average warming reaches around 2 °C, half of the risks assessed at a regional level will reach a high level, meaning that region-specific risks will be severe and widespread within a given region. If a high level of adaptation is achieved in every human system or activity, which would involve challenges and require profound changes, risks could remain moderate up to 2 °C in around half of the assessed cases – a substantial risk reduction, although one should not ignore the fraction of risks that would nonetheless become severe. This remains an early result with several limitations due to a limited scope – for example, the potential for reducing risks for ecosystems is covered little, and any such reduction may be harder to achieve than for human systems. Differences in adaptation level were considered in only about 20 % of the risks illustrated by embers to date. As this provides a more comprehensive view of how risks may evolve, future reports would benefit from a systematic consideration of the impacts of adaptation actions in a similar way and possibly from further investigation on how differences in exposure and vulnerability could be included (O'Neill et al., 2017a). Our synthesis also shows that the combination of high warming and high adaptation has only been considered for about half of the high-adaptation cases, with the other cases assessed considering only up to 2 or 3 °C of global warming. As this is due to the characteristics of the socio-economic scenarios considered in the underlying studies, the need to assess adaptation and its limits at higher levels of warming should also be taken into account in future research. Another limitation of the overview provided by the compilation of embers is that it only takes into account the interactions between drivers and/or risks, including compound and possibly cascading risks, that were considered in the original assessment: at each level of warming, impacts may be amplified by interactions within or across regions and systems presented in different embers (Berrang-Ford et al., 2021; Simpson et al., 2023). Regions and risks not considered in the underlying assessments may also significantly shift results compared to those sampled within the AR6 assessments.
Looking at individual embers gives insights into the systems that the AR6 authors assessed to be most affected: human and natural systems in coastal areas are among these. Food and water availability could be compromised, at least where a high level of adaptation will not, or cannot, be achieved. At an increase of 2 °C GMT, several types of ecosystems of great importance for biodiversity are among those at high risk on land; in coastal waters; and, particularly, in the Arctic. However, the significance of this conclusion is limited by the absence of burning embers for some systems or sectors and for about half of the regions, which does not mean that these are less affected. The information needed was often missing or incomplete, such as in the AR6 WGII cross-chapter paper on mountains, which assessed key risks and could estimate the risk levels for some of them, although it did not consider the available evidence sufficient to build embers (Adler et al., 2022). The absence of embers may have other causes, such as in the AR6 WGII chapter on Central and South America, which produced a diagram for the second-order draft (SOD) but deleted it for the final version, with responses to review comments stating that this was due to difficulties in implementing the expert elicitation methodology (Castellanos et al., 2022; Fig. 12.7, SOD chapter 12 in IPCC, 2024a).
How can future burning-ember illustrations help to further clarify the global picture of risk? First, we need to aim for the broadest possible coverage of regions and systems at risk. This should include systematically conducting a risk assessment for all regions. This would update and complement a similar summary in the AR5, which could provide a synthesis of key risks for each region and present the results graphically for two levels of warming and adaptation (Assessment Box SPM.2 in IPCC, 2014c). Further, at the regional level, it is important to separate risk assessments for those parts of a region where they differ. This was done, for example, for water scarcity in the chapter of the AR6 dedicated to Europe as water scarcity differed between southern and central European regions (Bednar-Friedl et al., 2022a).
Future assessments may wish to use embers to illustrate compound risks and risks associated with adaptation and mitigation response measures. The SRCCL provides the only example of the latter to date, with embers synthesizing the risks to food systems, terrestrial ecosystems, and water security associated with the potential increase in land area used for the deployment of bioenergy crops in 2050 to meet mitigation targets (Hurlbert et al., 2019a). Two contrasting scenarios were explored. In both, the hazard metric was the amount of land used for dedicated bioenergy crops. Going forward, it may be useful to explore ways of defining a framework or common methodology to enable a consistent assessment and synthesis of risks from response measures. Finally, embers could potentially illustrate the assessed risks associated with temperature overshoot pathways, where global warming more or less strongly exceeds a long-term limit, particularly 1.5 °C, and then declines more or less rapidly (Meyer et al., 2022; Reisinger and Geden, 2023).
To facilitate synthesis work and to make it even more instructive, one could ask experts to choose, for each ember established in the future, a list of keywords corresponding to the main risk factors. Their main role would be to help in classifying risks assessed within embers, highlighting the systems and regions most at risk and the common causes of risk increases. Potential keywords may relate to “regional specificities” such as polar amplification; the appearance of new climatic conditions that have no equivalent in the recent past in tropical regions; and the mountain cryosphere, which is rapidly declining, with substantial impacts on societies and ecosystems (Constable et al., 2022; Hock et al., 2019; Jia et al., 2019). Other keywords may highlight compound events which play an important role in impacts, such as drought and extreme heat or warming, the acidification of coastal waters, and the presence of socio-economic factors that increase the vulnerability or exposure of populations (Simpson et al., 2023). To maximize their usefulness, these keywords could be defined iteratively over the course of each project or report.
Burning embers allow an evaluation of how the assessment of a risk has changed over time when the same risk has been assessed in different IPCC cycles. So far, this has been the case only for the RFCs as these are the only embers to have been assessed several times over successive assessments (Zommers et al., 2020). The Synthesis Report of the AR6 has already shown that climate-related risks synthesized in the RFCs are assessed at a higher level (or, put another way, they eventuate at lower levels of GMT) in the AR6 than in the AR5 due to improved scientific understanding (IPCC, 2023). As many risks have now been illustrated with embers, we have a solid basis to which new knowledge can be added, highlighting risks that are reassessed at a different level and findings that are confirmed, possibly with a higher level of confidence. To realize this potential, we need to maximize the compatibility of the new results by including risks already considered previously; defining them in the same way; and using the same methodologies consistently, taking care to reinforce them but introducing changes only when necessary, in a well-documented way. The database will then make it easier to track changes over time, both in terms of risk levels and associated textual explanations, by linking the embers for the same risk.
6.2 Further capturing the role of adaptation
6.2.1 The potential for adaptation to reduce climate risks
Our first exploration of the Ember Database aligns with previous findings (Magnan et al., 2021) on the potential benefits of adaptation for risk reduction. However, these results need to be taken with caution because the information developed in the IPCC reports shows some heterogeneity, especially in terms of the scales and regions considered and the adaptation scenario framing, as well as some limitations (such as a lack of geographical information and possibly a lack of consideration of non-climate variables; Ford et al., 2024). Future assessments would benefit from a more consistent framework for accessing vulnerability and exposure within and across WGII contributions, continuing efforts to consider a variety of possible socio-economic futures, as well as a range of adaptation scenarios (Zommers et al., 2020). This would constitute a major guiding principle for the upcoming update of the IPCC technical guidelines on impacts and adaptation and a major opportunity to enhance consistency in the way adaptation is considered in burning-ember diagrams (IPCC, 2024b).
A key problem is how to define “ambitious” adaptation across systems and inherent context specificities (Ford et al., 2024), as well as levels of adaptation ranging from low to ambitious adaptation. While low adaptation could be easily defined in relation to business-as-usual practices favouring incremental responses, can ambitious adaptation be defined through transformational practices changing the fundamental attributes of a given system in view of addressing the root causes of systems' exposure and vulnerability? It is worth exploring such a hypothesis because the narratives ranging from business-as-usual scenarios to more transformational responses are gaining traction in the literature (Rawshan Ara Begum et al., 2022), as well as in the policy arena. Yet, major changes motivated by transformational adaptation raise a number of questions: what is being transformed and how (societal aspects, including values and norms; livelihoods, including, for example, resettlement; techniques, possibly including some that move from nature conservation to actively “transforming” living species and ecosystems; etc.)? What can be said about the ethical and justice aspects of transformation or the unintended effects of extensive system-level changes which may be needed to reduce risks in high-emission scenarios? And how does transformational adaptation link to wider socio-economic changes and the broader concept of climate-resilient development pathways (Schipper et al., 2022)?
Table 7Tentative description of clusters of adaptation scenarios based on a 4-fold framing distinguishing between the depth, scope, speed, and limit of adaptation-related responses. Adaptation scenarios are to be applied at the study system level, i.e. a sector or a territory, for example. Inspired by O'Neill et al. (2022a).
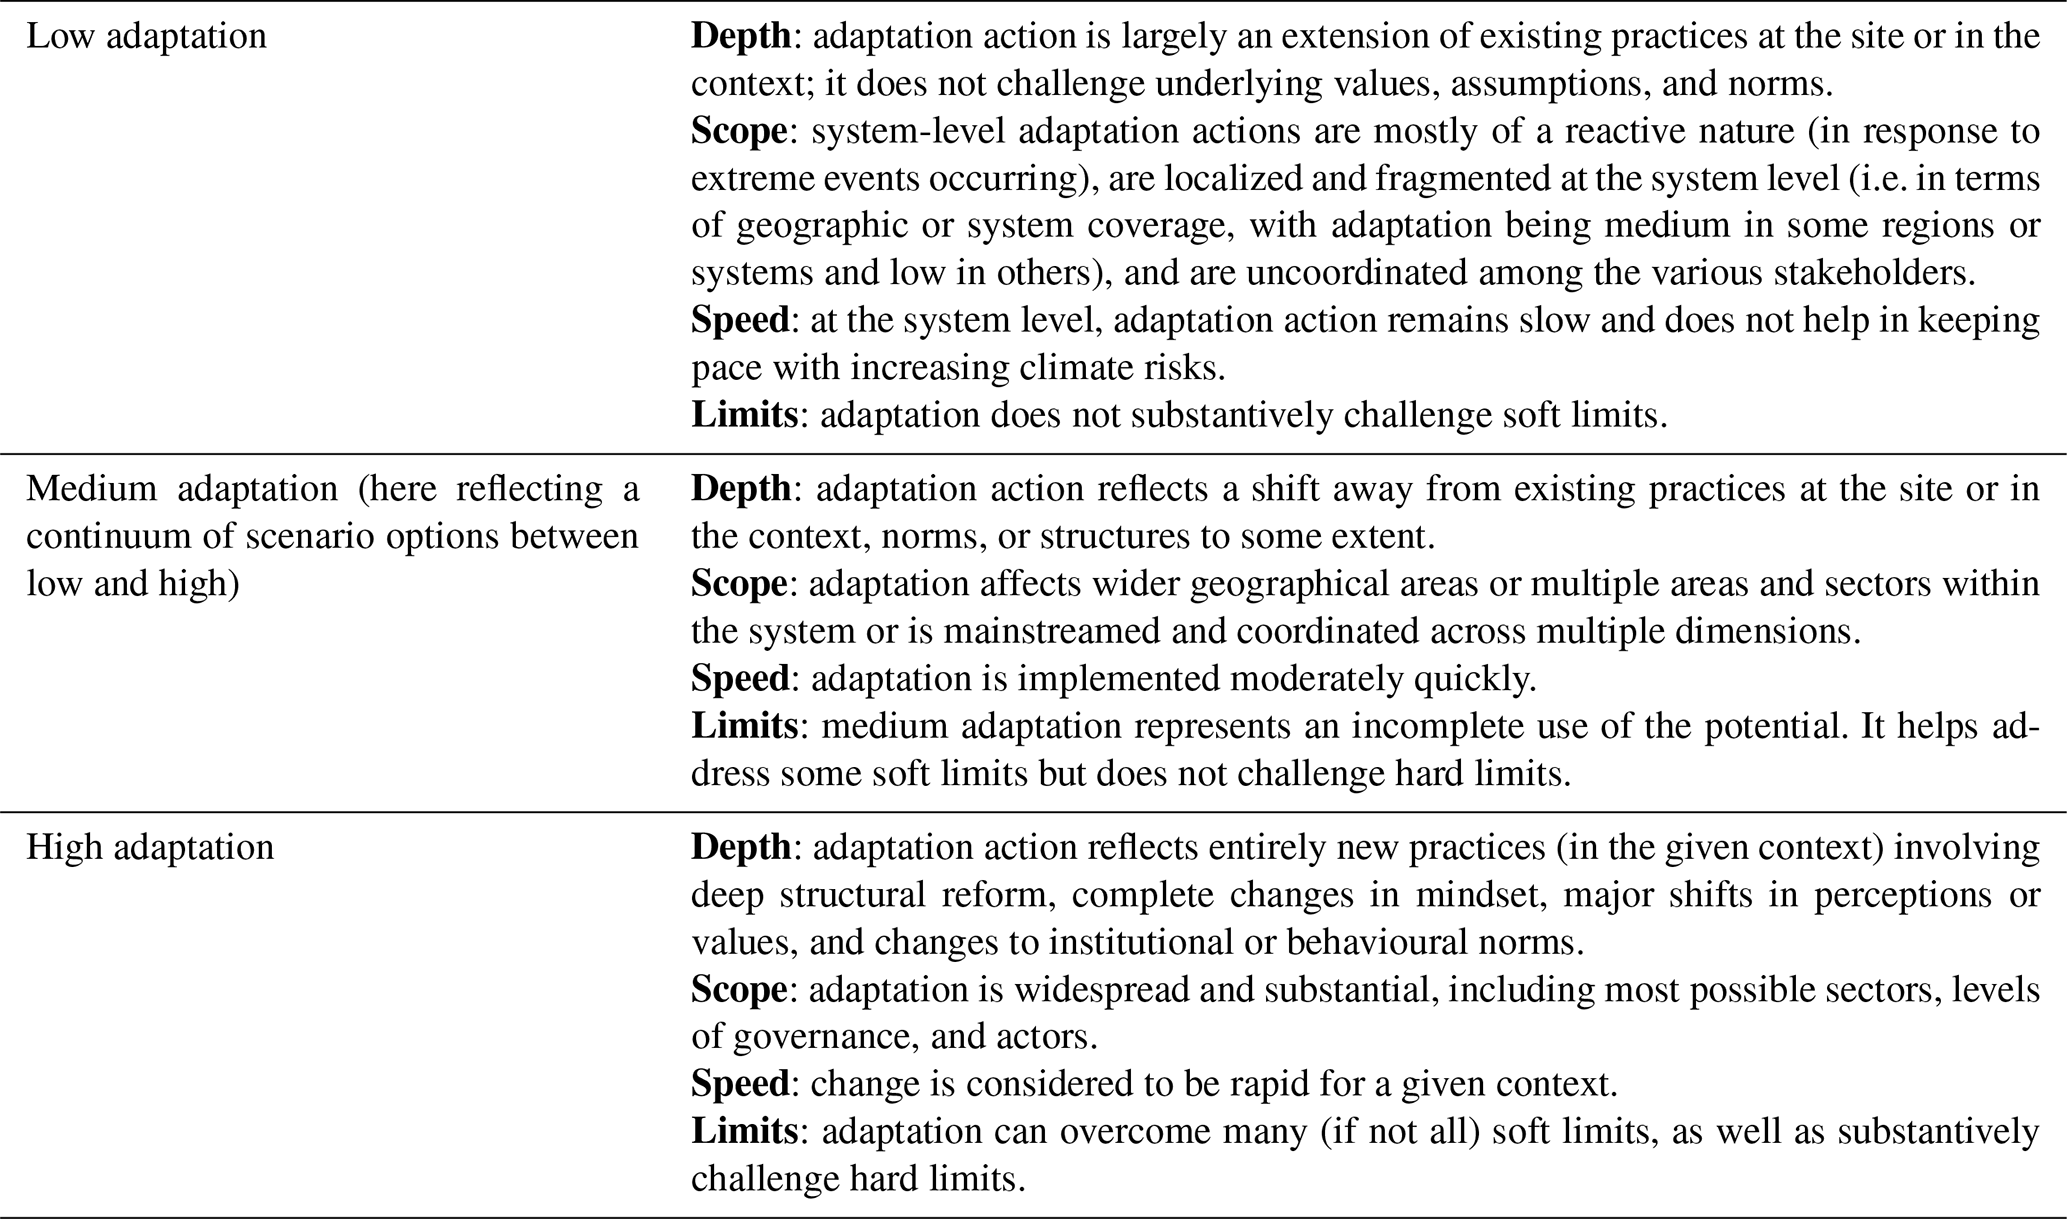
A potential starting point is illustrated in Table 7, which refers to the framing developed in one of the synthesis chapters of the AR6 WGII (O'Neill et al., 2022a). It describes adaptation levels based on four main characteristics of adaptation-related responses: depth (do the responses support major shifts from the business-as-usual situation when required?), scope (is adaptation widespread, both geographically and across systems?), speed (to what extent is adaptation fast enough to keep pace with increasing and accelerating climate risks?), and limits (do the responses overcome limits?). Whatever the final framing, it is evident that further structuring the way adaptation scenarios are shaped and linked to socio-economic pathways will help to assess adaptation benefits in a more consistent way and therefore ensure more robust aggregated analyses.
6.2.2 Adaptation limits and residual risks
Together, the findings in Sect. 3.2 and 3.3 and in the above discussion raise the question of how to capture the limits to adaptation. That is, at what level of further climate change will ambitious adaptation be hard to achieve and/or ineffective and what are the nature and level of residual risks to be expected? Limits to adaptation may depend on trade-offs with other objectives, especially at high levels of warming where more extensive planned transformation would be needed to limit intolerable risks and/or undesirable forced transformation (New et al., 2022; Rawshan Ara Begum et al., 2022; Schipper et al., 2022). To date, these questions remain under-addressed (Berkhout and Dow, 2023), and further scientific contributions on this topic could raise ground-breaking information to feed the Mechanism for Loss and Damage established under the UNFCCC (Otto and Fabian, 2023; UNFCCC, 2014).
6.3 Expanding the database
The CREE web interface allows registered experts to edit the descriptive information provided for each ember (Sect. 2.5). Contributions, be they broad or specific, will obviously help in further enhancing the usefulness of the database. As the information was not always collected at the time of expert elicitation in the past, we do not expect that complete and detailed information will ever be provided for each ember, but we have built up an already useful base and the tools to further develop this documentation.
Importantly, the database can incorporate new assessments. A pragmatic approach is to first prepare Excel spreadsheets in the format which was previously used to draw the AR6 embers and that is supported by the Ember Factory application (Marbaix, 2020b). These files can be imported in the database. The same approach could be followed for new embers assessed outside IPCC reports – as long as the data are available as open content, with a possible restriction to peer-reviewed assessments. These might be handled in a way that makes their distinction from embers produced under IPCC auspices clear. As highlighted above, future assessments would greatly benefit from the collection, as part of the expert elicitation process, of several elements beyond the risk levels: descriptive information on the risk and transitions; keywords including information about risk factors; and links to scenarios setting the vulnerability, exposure, and adaptation context. We hope that the database presented here will help in motivating and establishing a more systematic approach to the collection of information.
This, in turn, may motivate further work to improve the database and to reflect on how online tools can facilitate the expert elicitation process: such tools may reduce the burden of data manipulation during elicitation cycles, improve the feedback provided to the expert team as part of the process, and reduce the risk of error. This could build on the draft tool, which implements part of the process for aggregating views within a group of experts, described in Zommers et al. (2020), which is available at https://climrisk.org/emberelicitation/ (last access: 14 January 2025) and could be further developed and integrated within the structure and web interface of the database presented in this paper (https://climrisk.org/cree, last access: 14 January 2025). There is substantial potential to extend the support to each stage of the expert elicitation process involved in the preparation of embers and to make further use of its outcomes. This would likely have the notable benefit of increasing the homogeneity of the assessment undertaken across diverse reports and chapter teams, adding considerable rigour to the embers as an assessment and illustration tool.
6.4 Further use for analysis and communication
While the IPCC already synthesizes the information on the risks presented in the ember diagrams, for example, in the WGII Atlas and the Synthesis Report (IPCC, 2022b, 2023), a more interactive presentation, including the description of risks and transitions presented in this paper, may facilitate access and broader uptake and usage. Concrete examples are available in the CREE web interface, including for the AR6 Reasons for Concern: https://climrisk.org/cree/emberfigure?figure=14 (last access: 14 January 2025). The increased accessibility to the data, including the descriptive information, may also facilitate the creation of new visualizations.
There is more than enough knowledge to motivate urgent action to stabilize temperatures. Achieving this goal would not be sufficient to stop changes such as sea level rise, but it would make the current form of burning embers unnecessary as these were designed to illustrate how risk could increase with warming. However, this point has not yet been reached, and current signs are mixed – global greenhouse gas emissions may soon stop rising, but they need to fall to roughly net zero to stabilize global temperatures, and there is still a gap between stated global ambitions and aggregated national efforts (Friedlingstein et al., 2023; Fyson et al., 2023; UNEP et al., 2024).
The supplement related to this article is available online at: https://doi.org/10.5194/essd-17-317-2025-supplement.
PM proposed the concept, following previous discussions involving ZZ and AKM. PM and AKM designed the basis of the study. All the authors contributed to identifying missing information and links with relevant studies and to improving the consistency and relevance of the paper. PM developed the database structure and collected most of its content, with contributions from ZZ (risks related to bioenergy) and VM (risks in Europe). PWT led the developments related to temperature metrics (Sect. 2.2 and the related box). AKM led the development of Sect. 4.2, covering further exploration of the adaptation potential. VM contributed to the discussions and content on adaptation and on the challenges faced when assessing embers. PM led the development of the figures. PT largely contributed to editing, with a critical eye on all aspects of the paper. All the authors contributed to the Introduction and to the concluding discussion on potential improvements and developments in future reports.
The contact author has declared that none of the authors has any competing interests.
Publisher's note: Copernicus Publications remains neutral with regard to jurisdictional claims made in the text, published maps, institutional affiliations, or any other geographical representation in this paper. While Copernicus Publications makes every effort to include appropriate place names, the final responsibility lies with the authors.
Peter W. Thorne was supported by Co-Centre award no. 22/CC/11103. The Co-Centre award is managed by Science Foundation Ireland (SFI); Northern Ireland's Department of Agriculture, Environment and Rural Affairs (DAERA); and UK Research and Innovation (UKRI) and is supported by the UK's International Science Partnerships Fund (ISPF) and the Irish government's Shared Island Initiative.
We are grateful to Professor Jean-Pierre Gattuso (CNRS-Sorbonne Université, France) for his contributions to earlier discussions on burning embers, particularly on how sea surface temperature changes were considered for the risk assessment within the Special Report on the Ocean and Cryosphere. We thank Professor Jean-Pascal van Ypersele (UCLouvain, Belgium) for supporting the concept when this research started. We would also like to thank the two anonymous referees, particularly for suggesting the use of the RKR categories.
This paper was edited by Dalei Hao and reviewed by two anonymous referees.
Abram, N., Gattuso, J.-P., Prakash, A., Cheng, L., Chidichimo, M. P., Crate, S., Enomoto, H., Garschagen, M., Gruber, N., Harper, S., Holland, E., Kudela, R. M., Rice, J., Steffen, K., and von Shuckmann, K.: Framing and Context of the Report, edited by: Pörtner, H.-O., Roberts, D. C., Masson-Delmotte, V., Zhai, P., Tignor, M., Poloczanska, E., Mintenbeck, K., Alegría, A., Nicolai, M., Okem, A., Petzold, J., Rama, B., and Weyer, N. M., IPCC Special Report on the Ocean and Cryosphere in a Changing Climate, 73–129, https://doi.org/10.1017/9781009157964.003, 2019.
Adler, C., Wester, P., Bhatt, I., Huggel, C., Insarov, G. E., Morecroft, M. D., Muccione, V., and Prakash, A.: Mountains, in: Climate Change 2022: Impacts, Adaptation and Vulnerability. Contribution of Working Group II to the Sixth Assessment Report of the Intergovernmental Panel on Climate Change, edited by: Pörtner, H. O., Roberts, D. C., Tignor, M., Poloczanska, E. S., Mintenbeck, K., Alegría, A., Craig, M., Langsdorf, S., Löschke, S., Möller, V., Okem, A., and Rama, B., IPCC, https://doi.org/10.1017/9781009325844.022, 2022.
Ahmad, Q. K., Anisimov, O., Arnell, N., Brown, S., Burton, I., Campos, M., Canziani, O., Carter, T., Cohen, S. J., Desanker, P., Easterling, W., Fitzharris, B. B., Forbes, D., Gitay, H., Githeko, A., Gonzalez, P., Gubler, D., Gupta, S., Haines, A., Harasawa, H., Holten, J. I., Jallow, B. P., Jones, R., Kundzewicz, Z., Lal, M., Rovere, E. L. L., Leary, N., Leemans, R., Liu, C., Magadza, C., Manning, M., Mata, L. J., McCarthy, J., McLean, R., McMichael, A., Miller, K., Mills, E., Mirza, M. M. Q., Murdiyarso, D., Nurse, L., Parmesan, C., Parry, M., Patz, J., Petit, M., Pilifosova, O., Pittock, B., Price, J., Root, T., Rosenzweig, C., Sarukhan, J., Schellnhuber, J., Schneider, S., Scholes, R., Scott, M., Sem, G., Smit, B., Smith, J., Sohngen, B., Tsyban, A., Ypersele, J.-P. van, Vellinga, P., Warrick, R., Wilbanks, T., Woodward, A., and Wratt, D.: Summary for Policymakers, in: Climate Change 2001: Impacts, adaptation and vulnerability, Contribution of Working Group II to the Third Assessment Report of the Intergovernmental Panel on Climate Change, edited by: McCarthy, J. J., Canziani, O. F., Leary, N. A., Dokken, J. J., and White, K. S., IPCC, Cambridge University Press, ISBN 0521807689, 2001.
Andrijevic, M., Crespo Cuaresma, J., Muttarak, R., and Schleussner, C.-F.: Governance in socioeconomic pathways and its role for future adaptive capacity, Nat. Sustain., 3, 35–41, https://doi.org/10.1038/s41893-019-0405-0, 2019.
Anisimov, A. and Magnan, A. K. (Eds.): The global transboundary climate risk report, The institute Sustainable Development and International Relations & Adaptations without borders, https://adaptationwithoutborders.org/wp-content/uploads/2023/08/the_global_transboundary_climate_risk_report.pdf (last access: 16 January 2025), 2023.
Bednar-Friedl, B., Biesbroek, R., Schmidt, D. N., Alexander, P., Børsheim, K. Y., Carnicer, J., Georgopoulou, E., Haasnoot, M., Cozannet, G. L., Lionello, P., Lipka, O., Möllmann, C., Muccione, V., Mustonen, T., Piepenburg, D., and Whitmarsh, L.: Europe, in: Climate Change 2022: Impacts, Adaptation and Vulnerability, Contribution of Working Group II to the Sixth Assessment Report of the Intergovernmental Panel on Climate Change, edited by: Pörtner, H. O., Roberts, D. C., Tignor, M., Poloczanska, E. S., Mintenbeck, K., Alegría, A., Craig, M., Langsdorf, S., Löschke, S., Möller, V., Okem, A., and Rama, B., IPCC, https://doi.org/10.1017/9781009325844.015, 2022a.
Bednar-Friedl, B., Biesbroek, R., Schmidt, D. N., Alexander, P., Børsheim, K. Y., Carnicer, J., Georgopoulou, E., Haasnoot, M., Cozannet, G. L., Lionello, P., Lipka, O., Möllmann, C., Muccione, V., Mustonen, T., Piepenburg, D., and Whitmarsh, L.: Europe Supplementary Material, in: Climate Change 2022: Impacts, Adaptation and Vulnerability. Contribution of Working Group II to the Sixth Assessment Report of the Intergovernmental Panel on Climate Change, edited by: Pörtner, H. O., Roberts, D. C., Tignor, M., Poloczanska, E. S., Mintenbeck, K., Alegría, A., Craig, M., Langsdorf, S., Löschke, S., Möller, V., Okem, A., and Rama, B., https://www.ipcc.ch/report/ar6/wg2/downloads/report/IPCC_AR6_WGII_Chapter13_SM.pdf (last access: 16 January 2025), 2022b.
Berkhout, F. and Dow, K.: Limits to adaptation: Building an integrated research agenda, WIREs Climate Change, 14, e817, https://doi.org/10.1002/wcc.817, 2023.
Berrang-Ford, L., Siders, A. R., Lesnikowski, A., Fischer, A. P., Callaghan, M. W., Haddaway, N. R., Mach, K. J., Araos, M., Shah, M. A. R., Wannewitz, M., Doshi, D., Leiter, T., Matavel, C., Musah-Surugu, J. I., Wong-Parodi, G., Antwi-Agyei, P., Ajibade, I., Chauhan, N., Kakenmaster, W., Grady, C., Chalastani, V. I., Jagannathan, K., Galappaththi, E. K., Sitati, A., Scarpa, G., Totin, E., Davis, K., Hamilton, N. C., Kirchhoff, C. J., Kumar, P., Pentz, B., Simpson, N. P., Theokritoff, E., Deryng, D., Reckien, D., Zavaleta-Cortijo, C., Ulibarri, N., Segnon, A. C., Khavhagali, V., Shang, Y., Zvobgo, L., Zommers, Z., Xu, J., Williams, P. A., Canosa, I. V., van Maanen, N., van Bavel, B., van Aalst, M., Turek-Hankins, L. L., Trivedi, H., Trisos, C. H., Thomas, A., Thakur, S., Templeman, S., Stringer, L. C., Sotnik, G., Sjostrom, K. D., Singh, C., Siña, M. Z., Shukla, R., Sardans, J., Salubi, E. A., Safaee Chalkasra, L. S., Ruiz-Díaz, R., Richards, C., Pokharel, P., Petzold, J., Penuelas, J., Pelaez Avila, J., Murillo, J. B. P., Ouni, S., Niemann, J., Nielsen, M., New, M., Nayna Schwerdtle, P., Nagle Alverio, G., Mullin, C. A., Mullenite, J., Mosurska, A., Morecroft, M. D., Minx, J. C., Maskell, G., Nunbogu, A. M., Magnan, A. K., Lwasa, S., Lukas-Sithole, M., Lissner, T., Lilford, O., Koller, S. F., Jurjonas, M., Joe, E. T., Huynh, L. T. M., Hill, A., Hernandez, R. R., Hegde, G., Hawxwell, T., Harper, S., Harden, A., Haasnoot, M., Gilmore, E. A., Gichuki, L., Gatt, A., Garschagen, M., Ford, J. D., Forbes, A., Farrell, A. D., Enquist, C. A. F., Elliott, S., Duncan, E., Coughlan de Perez, E., Coggins, S., Chen, T., Campbell, D., Browne, K. E., Bowen, K. J., Biesbroek, R., Bhatt, I. D., Bezner Kerr, R., Barr, S. L., Baker, E., Austin, S. E., Arotoma-Rojas, I., Anderson, C., Ajaz, W., Agrawal, T., and Abu, T. Z.: A systematic global stocktake of evidence on human adaptation to climate change, Nat. Clim. Chang., 11, 989–1000, https://doi.org/10.1038/s41558-021-01170-y, 2021.
Bindoff, N. L., Cheung, W. W. L., Kairo, J. G., Arístegui, J., Guinder, V. A., Hallberg, R., Hilmi, N., Jiao, N., Karim, M. S., Levin, L., O'Donoghue, S., Purca, S. R., Rinkevich, B., Suga, T., Tagliabue, A., and Williamson, P.: Changing Ocean, Marine Ecosystems, Dependent Communities, edited by: Pörtner, H.-O., Roberts, D. C., Masson-Delmotte, V., Zhai, P., Tignor, M., Poloczanska, E., Mintenbeck, K., Alegría, A., Nicolai, M., Okem, A., Petzold, J., Rama, B., and Weyer, N. M., IPCC Special Report on the Ocean and Cryosphere in a Changing Climate, 447–587, https://doi.org/10.1017/9781009157964.007, 2019.
Boot, A. A., Von Der Heydt, A. S., and Dijkstra, H. A.: Response of atmospheric pCO2 to a strong AMOC weakening under low and high emission scenarios, Clim. Dynam., 62, 7559–7574, https://doi.org/10.1007/s00382-024-07295-y, 2024.
Byers, E., Gidden, M., Leclère, D., Balkovic, J., Burek, P., Ebi, K., Greve, P., David Grey, Havlik, P., Hillers, A., Johnson, N., Kahil, T., Krey, V., Langan, S., Nebjosa Nakicenovic, Novak, R., Obersteiner, M., Pachauri, S., Palazzo, A., Simon Parkinson, Rao, N. D., Rogelj, J., Satoh, Y., Wada, Y., Willaarts, B., and Riahi, K.: Global exposure and vulnerability to multi-sector development and climate change hotspots, Environ. Res. Lett., 13, 055012, https://doi.org/10.1088/1748-9326/aabf45, 2018.
Castellanos, E., Lemos, M. F., Astigarraga, L., Chacón, N., Cuvi, N., Huggel, C., Miranda, L., Vale, M. M., Ometto, J. P., Peri, P. L., Postigo, J. C., Ramajo, L., Roco, L., and Rusticucci, M.: Central and South America, edited by: Pörtner, H. O., Roberts, D. C., Tignor, M., Poloczanska, E. S., Mintenbeck, K., Alegría, A., Craig, M., Langsdorf, S., Löschke, S., Möller, V., Okem, A., and Rama, B., Climate Change 2022: Impacts, Adaptation and Vulnerability, Contribution of Working Group II to the Sixth Assessment Report of the Intergovernmental Panel on Climate Change, https://doi.org/10.1017/9781009325844.014, 2022.
Challinor, A. J., Adger, W. N., Benton, T. G., Conway, D., Joshi, M., and Frame, D.: Transmission of climate risks across sectors and borders, Philos. T. Roy. Soc. A., 376, 20170301, https://doi.org/10.1098/rsta.2017.0301, 2018.
Chen, D., Rojas, M., Samset, B. H., Cobb, K., Diongue Niang, A., Edwards, P., Emori, S., Faria, S. H., Hawkins, E., Hope, P., Huybrechts, P., Meinshausen, M., Mustafa, S. K., Plattner, G.-K., and Tréguier, A.-M.: Framing, Context, and Methods, edited by: Masson-Delmotte, V., Zhai, P., Pirani, A., Connors, S. L., Péan, C., Berger, S., Caud, N., Chen, Y., Goldfarb, L., Gomis, M. I., Huang, M., Leitzell, K., Lonnoy, E., Matthews, J. B. R., Maycock, T. K., Waterfield, T., Yelekçi, O., Yu, R., and Zhou, B., Climate Change 2021: The Physical Science Basis, Contribution of Working Group I to the Sixth Assessment Report of the Intergovernmental Panel on Climate Change, https://doi.org/10.1017/9781009157896.003, 2021.
Cissé, G., McLeman, R., Adams, H., Aldunce, P., Bowen, K., Campbell-Lendrum, D., Clayton, S., Ebi, K. L., Hess, J., Huang, C., Liu, Q., McGregor, G., Semenza, J., and Tirado, M. C.: Health, Wellbeing, and the Changing Structure of Communities, edited by: Pörtner, H. O., Roberts, D. C., Tignor, M., Poloczanska, E. S., Mintenbeck, K., Alegría, A., Craig, M., Langsdorf, S., Löschke, S., Möller, V., Okem, A., and Rama, B., Climate Change 2022: Impacts, Adaptation and Vulnerability. Contribution of Working Group II to the Sixth Assessment Report of the Intergovernmental Panel on Climate Change, https://doi.org/10.1017/9781009325844.009, 2022.
Constable, A. J., Harper, S., Dawson, J., Holsman, K., Mustonen, T., Piepenburg, D., and Rost, B.: Polar Regions, edited by: Pörtner, H. O., Roberts, D. C., Tignor, M., Poloczanska, E. S., Mintenbeck, K., Alegría, A., Craig, M., Langsdorf, S., Löschke, S., Möller, V., Okem, A., and Rama, B., Climate Change 2022: Impacts, Adaptation and Vulnerability. Contribution of Working Group II to the Sixth Assessment Report of the Intergovernmental Panel on Climate Change, https://doi.org/10.1017/9781009325844.023, 2022.
Cowtan, K., Hausfather, Z., Hawkins, E., Jacobs, P., Mann, M. E., Miller, S. K., Steinman, B. A., Stolpe, M. B., and Way, R. G.: Robust comparison of climate models with observations using blended land air and ocean sea surface temperatures, Geophys. Res. Lett., 42, 6526–6534, https://doi.org/10.1002/2015GL064888, 2015.
Eyring, V., Gillett, N. P., Achuta Rao, K. M., Barimalala, R., Barreiro Parrillo, M., Bellouin, N., Cassou, C., Durack, P. J., Kosaka, Y., McGregor, S., Min, S., Morgenstern, O., and Sun, Y.: Human Influence on the Climate System, edited by: Masson-Delmotte, V., Zhai, P., Pirani, A., Connors, S. L., Péan, C., Berger, S., Caud, N., Chen, Y., Goldfarb, L., Gomis, M. I., Huang, M., Leitzell, K., Lonnoy, E., Matthews, J. B. R., Maycock, T. K., Waterfield, T., Yelekçi, O., Yu, R., and Zhou, B., Climate Change 2021: The Physical Science Basis. Contribution of Working Group I to the Sixth Assessment Report of the Intergovernmental Panel on Climate Change, https://doi.org/10.1017/9781009157896.005, 2021.
Folland, C. K., Karl, T. R., Christy, J. R., Clarke, R. A., Gruza, G. V., Jouzel, J., Mann, M. E., Oerlemans, J., Salinger, M. J., and Wang, S.-W.: Observed Climate Variability and Change, in: Climate Change 2001: The Scientific Basis. Contribution of Working Group I to the Third Assessment Report of the Intergovernmental Panel on Climate Change, edited by: Houghton, J. T., Ding, Y., Griggs, D. J., Noguer, M., van der Linden, P. J., Dai, X., Maskell, K., and Johnson, C. A., Cambridge University Press, Cambridge, United Kingdom and New York, NY, USA, 881, 2001.
Ford, J. D., Clerici, S., Clark, D. G., Biesbroek, R., and Harper, S.: Re-conceptualizing the IPCC's “burning embers”, Nat. Rev. Earth Environ., 5, 667–669, https://doi.org/10.1038/s43017-024-00594-2, 2024.
Fox-Kemper, B., Hewitt, H. T., Xiao, C., Aðalgeirsdóttir, G., Drijfhout, S. S., Edwards, T. L., Golledge, N. R., Hemer, M., Kopp, R. E., Krinner, G., Mix, A., Notz, D., Nowicki, S., Nurhati, I. S., Ruiz, L., Sallée, J.-B., Slangen, A. B. A., and Yu, Y.: Ocean, Cryosphere and Sea Level Change, edited by: Masson-Delmotte, V., Zhai, P., Pirani, A., Connors, S. L., Péan, C., Berger, S., Caud, N., Chen, Y., Goldfarb, L., Gomis, M. I., Huang, M., Leitzell, K., Lonnoy, E., Matthews, J. B. R., Maycock, T. K., Waterfield, T., Yelekçi, O., Yu, R., and Zhou, B., Climate Change 2021: The Physical Science Basis. Contribution of Working Group I to the Sixth Assessment Report of the Intergovernmental Panel on Climate Change, https://doi.org/10.1017/9781009157896.011, 2021.
Friedlingstein, P., O'Sullivan, M., Jones, M. W., Andrew, R. M., Bakker, D. C. E., Hauck, J., Landschützer, P., Le Quéré, C., Luijkx, I. T., Peters, G. P., Peters, W., Pongratz, J., Schwingshackl, C., Sitch, S., Canadell, J. G., Ciais, P., Jackson, R. B., Alin, S. R., Anthoni, P., Barbero, L., Bates, N. R., Becker, M., Bellouin, N., Decharme, B., Bopp, L., Brasika, I. B. M., Cadule, P., Chamberlain, M. A., Chandra, N., Chau, T.-T.-T., Chevallier, F., Chini, L. P., Cronin, M., Dou, X., Enyo, K., Evans, W., Falk, S., Feely, R. A., Feng, L., Ford, D. J., Gasser, T., Ghattas, J., Gkritzalis, T., Grassi, G., Gregor, L., Gruber, N., Gürses, Ö., Harris, I., Hefner, M., Heinke, J., Houghton, R. A., Hurtt, G. C., Iida, Y., Ilyina, T., Jacobson, A. R., Jain, A., Jarníková, T., Jersild, A., Jiang, F., Jin, Z., Joos, F., Kato, E., Keeling, R. F., Kennedy, D., Klein Goldewijk, K., Knauer, J., Korsbakken, J. I., Körtzinger, A., Lan, X., Lefèvre, N., Li, H., Liu, J., Liu, Z., Ma, L., Marland, G., Mayot, N., McGuire, P. C., McKinley, G. A., Meyer, G., Morgan, E. J., Munro, D. R., Nakaoka, S.-I., Niwa, Y., O'Brien, K. M., Olsen, A., Omar, A. M., Ono, T., Paulsen, M., Pierrot, D., Pocock, K., Poulter, B., Powis, C. M., Rehder, G., Resplandy, L., Robertson, E., Rödenbeck, C., Rosan, T. M., Schwinger, J., Séférian, R., Smallman, T. L., Smith, S. M., Sospedra-Alfonso, R., Sun, Q., Sutton, A. J., Sweeney, C., Takao, S., Tans, P. P., Tian, H., Tilbrook, B., Tsujino, H., Tubiello, F., van der Werf, G. R., van Ooijen, E., Wanninkhof, R., Watanabe, M., Wimart-Rousseau, C., Yang, D., Yang, X., Yuan, W., Yue, X., Zaehle, S., Zeng, J., and Zheng, B.: Global Carbon Budget 2023, Earth Syst. Sci. Data, 15, 5301–5369, https://doi.org/10.5194/essd-15-5301-2023, 2023.
Fyson, C., Grant, N., Das, N., Maxwell, V., Reynolds, C., Rogelj, J., Schleußner, C.-F., and Waterton, O.: When well global greenhouse gas emission peak?, Climate analytics, https://climateanalytics.org/publications/when-will-global-greenhouse-gas-emissions-peak (last access: 16 January 2025), 2023.
Gattuso, J.-P., Magnan, A., Billé, R., Cheung, W. W. L., Howes, E. L., Joos, F., Allemand, D., Bopp, L., Cooley, S. R., Eakin, C. M., Hoegh-Guldberg, O., Kelly, R. P., Pörtner, H.-O., Rogers, A. D., Baxter, J. M., Laffoley, D., Osborn, D., Rankovic, A., Rochette, J., Sumaila, U. R., Treyer, S., and Turley, C.: Contrasting futures for ocean and society from different anthropogenic CO2 emissions scenarios, Science, 349, aac4722, https://doi.org/10.1126/science.aac4722, 2015.
Gulev, S. K., Thorne, P. W., Ahn, J., Dentener, F. J., Domingues, C. M., Gerland, S., Gong, D., Kaufman, D. S., Nnamchi, H. C., Quaas, J., Rivera, J. A., Sathyendranath, S., Smith, S. L., Trewin, B., von Schuckmann, K., and Vose, R. S.: Changing State of the Climate System, edited by: Masson-Delmotte, V., Zhai, P., Pirani, A., Connors, S. L., Péan, C., Berger, S., Caud, N., Chen, Y., Goldfarb, L., Gomis, M. I., Huang, M., Leitzell, K., Lonnoy, E., Matthews, J. B. R., Maycock, T. K., Waterfield, T., Yelekçi, O., Yu, R., and Zhou, B., Climate Change 2021: The Physical Science Basis. Contribution of Working Group I to the Sixth Assessment Report of the Intergovernmental Panel on Climate Change, https://doi.org/10.1017/9781009157896.004, 2021.
Herger, N., Sanderson, B. M., and Knutti, R.: Improved pattern scaling approaches for the use in climate impact studies, Geophys. Res. Lett., 42, 3486–3494, https://doi.org/10.1002/2015GL063569, 2015.
Hock, R., Rasul, G., Adler, C., Cáceres, B., Gruber, S., Hirabayashi, Y., Jackson, M., Kääb, A., Kang, S., Kutuzov, S., Milner, Al., Molau, U., Morin, S., Orlove, B., and Steltzer, H.: High Mountain Areas, edited by: Pörtner, H.-O., Roberts, D. C., Masson-Delmotte, V., Zhai, P., Tignor, M., Poloczanska, E., Mintenbeck, K., Alegría, A., Nicolai, M., Okem, A., Petzold, J., Rama, B., and Weyer, N. M., IPCC Special Report on the Ocean and Cryosphere in a Changing Climate, 131–202, https://doi.org/10.1017/9781009157964.004, 2019.
Hoegh-Guldberg, O., Bindi, M., Brown, S., Camilloni, I., Diedhiou, A., Djalante, R., Ebi, K. L., Engelbrecht, F., Guangsheng, Z., Guiot, J., Hijioka, Y., Mehrotra, S., Payne, A., Seneviratne, S. I., Thomas, A., and Warren, R.: Impacts of 1.5 °C of Global Warming on Natural and Human Systems: Supplementary Material, in: Global Warming of 1.5 °C: An IPCC Special Report on the impacts of global warming of 1.5 °C above pre-industrial levels and related global greenhouse gas emission pathways, in the context of strengthening the global response to the threat of climate change, sustainable development, and efforts to eradicate poverty, edited by: Masson-Delmotte, V., Zhai, P., Pörtner, H.-O., Roberts, D., Skea, J., Shukla, P. R., Pirani, A., Moufouma-Okia, W., Péan, C., Pidcock, R., Connors, S., Matthews, J. B. R., Chen, Y., Zhou, X., Gomis, M. I., Lonnoy, E., Maycock, T., Tignor, M., and Waterfield, T., World Meteorological Organization, Geneva, Switzerland, https://www.ipcc.ch/sr15 (last access: 16 January 2025), 2018.
Hurlbert, M., Krishnaswamy, J., Davin, E., Johnson, F. X., Mena, C. F., Morton, J., Myeong, S., Viner, D., Warner, K., Wreford, A., Zakieldeen, S., and Zommers, Z.: Risk Management and Decision making in Relation to Sustainable Development, edited by: Shukla, P. R., Skea, J., Calvo, E., Masson-Delmotte, V., Pörtner, H.-O., Roberts, D. C., Zhai, P., Slade, R., Connors, S., van, R., Ferrat, M., Haughey, E., Luz, S., Neogi, S., Pathak, M., Petzold, J., Portugal, J., Vyas, P., Huntley, E., Kissick, K., Belkacemi, M., and Malley, J., Climate Change and Land: an IPCC special report on climate change, desertification, land degradation, sustainable land management, food security, and greenhouse gas fluxes in terrestrial ecosystems, Cambridge University Press, Cambridge, UK and New York, NY, USA, https://doi.org/10.1017/9781009157988.009d, 2019a.
Hurlbert, M., Krishnaswamy, J., Davin, E., Johnson, F. X., Mena, C. F., Morton, J., Myeong, S., Viner, D., Warner, K., Wreford, A., Zakieldeen, S., and Zommers, Z.: Risk Management and Decision making in Relation to Sustainable Development Supplementary Material, edited by: Shukla, P. R., Skea, J., Calvo, E., Masson-Delmotte, V., Pörtner, H.-O., Roberts, D. C., Zhai, P., Slade, R., Connors, S., van, R., Ferrat, M., Haughey, E., Luz, S., Neogi, S., Pathak, M., Petzold, J., Portugal, J., Vyas, P., Huntley, E., Kissick, K., Belkacemi, M., and Malley, J., Climate Change and Land: an IPCC special report on climate change, desertification, land degradation, sustainable land management, food security, and greenhouse gas fluxes in terrestrial ecosystems, https://www.ipcc.ch/srccl/ (last access: 16 January 2025), 2019b.
Ibrahim Zaiton, Z. and Warren, R.: AR6 WGII Data for Figure SPM.3(b): Risk assessment “burning embers” for Reasons for Concern (2.0.0), MetadataWorks, https://doi.org/10.48490/V9CD-2R25, 2023.
IPCC: Report of the second session of the WMO/UNEP Intergovernmental panel on climate change (IPCC), World Climate Programme Publication Series, World Meteorological Organisation, https://archive.ipcc.ch/meetings/session02/second-session-report.pdf (last access: 16 January 2025), 1989.
IPCC: Climate Change 2014: Impacts, Adaptation, and Vulnerability. Part A: Global and Sectoral Aspects. Contribution of Working Group II to the Fifth Assessment Report of the Intergovernmental Panel on Climate Change, edited by: Field, C. B., Barros, V. R., Dokken, D. J., Mach, K. J., Mastrandrea, M. D., Bilir, T. E., Chatterjee, M., Ebi, K. L., Estrada, Y. O., Genova, R. C., Girma, B., Kissel, E. S., Levy, A. N., MacCracken, S., Mastrandrea, P. R., and White, L. L., Cambridge University Press, Cambridge and New York, NY, 1132 pp., https://doi.org/10.1017/CBO9781107415379, 2014a.
IPCC: Climate Change 2014: Synthesis Report. Contribution of Working Groups I, II and III to the Fifth Assessment Report of the Intergovernmental Panel on Climate Change, edited by: Core writing team, Pachauri, R. K., and Meyer, L. A., IPCC, 151 pp., Intergovernmental Panel on Climate Change, ISBN 978-92-9169-143-2, 2014b.
IPCC: Summary for policymakers, in: Climate Change 2014: Impacts, Adaptation, and Vulnerability. Part A: Global and Sectoral Aspects. Contribution of Working Group II to the Fifth Assessment Report of the Intergovernmental Panel on Climate Change, edited by: Field, C. B., Barros, V. R., Dokken, D. J., Mach, K. J., Mastrandrea, M. D., Bilir, T. E., Chatterjee, M., Ebi, K. L., Estrada, Y. O., Genova, R. C., Girma, B., Kissel, E. S., Levy, A. N., MacCracken, S., Mastrandrea, P. R., and White, L. L., Cambridge University Press, Cambridge and New York, NY, 32 pp., https://doi.org/10.1017/CBO9781107415379, 2014c.
IPCC: Summary for Policymakers, in: Global Warming of 1.5 °C: An IPCC Special Report on the impacts of global warming of 1.5 °C above pre-industrial levels and related global greenhouse gas emission pathways, in the context of strengthening the global response to the threat of climate change, sustainable development, and efforts to eradicate poverty, edited by: Masson-Delmotte, V., Zhai, P., Pörtner, H.-O., Roberts, D., Skea, J., Shukla, P. R., Pirani, A., Moufouma-Okia, W., Péan, C., Pidcock, R., Connors, S., Matthews, J. B. R., Chen, Y., Zhou, X., Gomis, M. I., Lonnoy, E., Maycock, T., Tignor, M., and Waterfield, T., World Meteorological Organization, Geneva, Switzerland, https://doi.org/10.1017/9781009157940.001, 2018.
IPCC: Summary for Policymakers, edited by: Pörtner, H.-O., Roberts, D. C., Masson-Delmotte, V., Zhai, P., Tignor, M., Poloczanska, E., Mintenbeck, K., Alegría, A., Nicolai, M., Okem, A., Petzold, J., Rama, B., and Weyer, N. M., IPCC Special Report on the Ocean and Cryosphere in a Changing Climate, 3–35, https://doi.org/10.1017/9781009157964.001, 2019.
IPCC: Climate Change 2022: Impacts, Adaptation and Vulnerability. Contribution of Working Group II to the Sixth Assessment Report of the Intergovernmental Panel on Climate Change, edited by: Pörtner, H. O., Roberts, D. C., Tignor, M., Poloczanska, E. S., Mintenbeck, K., Alegría, A., Craig, M., Langsdorf, S., Löschke, S., Möller, V., Okem, A., and Rama, B., IPCC, https://doi.org/10.1017/9781009325844, 2022a.
IPCC: Global to Regional Atlas, edited by: Pörtner, H. O., Roberts, D. C., Tignor, M., Poloczanska, E. S., Mintenbeck, K., Alegría, A., Craig, M., Langsdorf, S., Löschke, S., Möller, V., Okem, A., and Rama, B., Climate Change 2022: Impacts, Adaptation and Vulnerability, Contribution of Working Group II to the Sixth Assessment Report of the Intergovernmental Panel on Climate Change, https://doi.org/10.1017/9781009325844.028, 2022b.
IPCC: Glossary, edited by: Pörtner, H. O., Roberts, D. C., Tignor, M., Poloczanska, E. S., Mintenbeck, K., Alegría, A., Craig, M., Langsdorf, S., Löschke, S., Möller, V., Okem, A., and Rama, B., Climate Change 2022: Impacts, Adaptation and Vulnerability. Contribution of Working Group II to the Sixth Assessment Report of the Intergovernmental Panel on Climate Change, https://doi.org/10.1017/9781009325844.029, 2022c.
IPCC: Summary for Policymakers, edited by: Pörtner, H. O., Roberts, D. C., Tignor, M., Poloczanska, E. S., Mintenbeck, K., Alegría, A., Craig, M., Langsdorf, S., Löschke, S., Möller, V., Okem, A., and Rama, B., Climate Change 2022: Impacts, Adaptation and Vulnerability. Contribution of Working Group II to the Sixth Assessment Report of the Intergovernmental Panel on Climate Change, https://doi.org/10.1017/9781009325844.001, 2022d.
IPCC: Summary for Policymakers. In: Climate Change 2023: Synthesis Report. Contribution of Working Groups I, II and III to the Sixth Assessment Report of the Intergovernmental Panel on Climate Change, in: IPCC Synthesis Report, edited by: Team, C. W., Lee, H., and Romero, J., Geneva, Switzerland, 1–34, https://doi.org/10.59327/IPCC/AR6-9789291691647.001, 2023.
IPCC: AR6 drafts and Review Materials, https://www.ipcc.ch/report/ar6/wg2/downloads/drafts-and-reviews2/, last access: 4 June 2024a.
IPCC: Sixtieth session of the IPCC: Decisions adopted by the Panel, https://www.ipcc.ch/site/assets/uploads/2024/02/IPCC-60_decisions_adopted_by_the_Panel.pdf (last access: 17 January 2025), 2024b.
IPCC Data distribution centre: https://ipcc-browser.ipcc-data.org/, last access: 13 March 2024.
Jia, G., Shevliakova, E., Artaxo, P., de Noblet-Ducoudré, N., Houghton, R., House, J., Kitajima, K., Lennard, C., Popp, A., Sirin, A., Sukumar, R., and Verchot, L.: Land–climate interactions, edited by: Shukla, P. R., Skea, J., Calvo, E., Masson-Delmotte, V., Pörtner, H.-O., Roberts, D. C., Zhai, P., Slade, R., Connors, S., van Diemen, R., Ferrat, M., Haughey, E., Luz, S., Neogi, S., Pathak, M., Petzold, J., Portugal, J., Vyas, P., Huntley, E., Kissick, K., Belkacemi, M., and Malley, J., Climate Change and Land: an IPCC special report on climate change, desertification, land degradation, sustainable land management, food security, and greenhouse gas fluxes in terrestrial ecosystems, Cambridge University Press, https://doi.org/10.1017/9781009157988.004, 2019.
Jones, B. and O'Neill, B. C.: Spatially explicit global population scenarios consistent with the Shared Socioeconomic Pathways, Environ. Res. Lett., 11, 084003, https://doi.org/10.1088/1748-9326/11/8/084003, 2016.
Kemp, L., Xu, C., Depledge, J., Ebi, K. L., Gibbins, G., Kohler, T. A., Rockström, J., Scheffer, M., Schellnhuber, H. J., Steffen, W., and Lenton, T. M.: Climate Endgame: Exploring catastrophic climate change scenarios, P. Natl. Acad. Sci. USA, 119, e2108146119, https://doi.org/10.1073/pnas.2108146119, 2022.
Lawrence, J., Mackey, B., Chiew, F., Costello, M. J., Hennessy, K., Lansbury, N., Nidumolu, U. B., Pecl, G., Rickards, L., Tapper, N., Woodward, A., and Wreford, A.: Australasia, edited by: Pörtner, H. O., Roberts, D. C., Tignor, M., Poloczanska, E. S., Mintenbeck, K., Alegría, A., Craig, M., Langsdorf, S., Löschke, S., Möller, V., Okem, A., and Rama, B., Climate Change 2022: Impacts, Adaptation and Vulnerability. Contribution of Working Group II to the Sixth Assessment Report of the Intergovernmental Panel on Climate Change, https://doi.org/10.1017/9781009325844.013, 2022.
Lee, J.-Y., Marotzke, J., Bala, G., Cao, L., Corti, S., Dunne, J. P., Engelbrecht, F., Fischer, E., Fyfe, J. C., Jones, C., Maycock, A., Mutemi, J., Ndiaye, O., Panickal, S., and Zhou, T.: Future global climate: scenario-based projections and near-term information, in: Climate Change 2021: The Physical Science Basis. Contribution of Working Group I to the Sixth Assessment Report of the Intergovernmental Panel on Climate Change, Cambridge University Press, https://doi.org/10.1017/9781009157896.006, 2021.
Mach, K. J., Mastrandrea, M. D., Freeman, P. T., and Field, C. B.: Unleashing expert judgment in assessment, Global Environ. Change, 44, 1–14, https://doi.org/10.1016/j.gloenvcha.2017.02.005, 2017.
Magnan, A. K., Pörtner, H.-O., Duvat, V. K. E., Garschagen, M., Guinder, V. A., Zommers, Z., Hoegh-Guldberg, O., and Gattuso, J.-P.: Estimating the global risk of anthropogenic climate change, Nat. Clim. Chang., 11, 879–885, https://doi.org/10.1038/s41558-021-01156-w, 2021.
Magnan, A. K., O'Neill, B. C., and Garschagen, M.: Further understanding “severe” climate risk, Clim. Risk Manage., 42, 100538, https://doi.org/10.1016/j.crm.2023.100538, 2023.
Marbaix, P.: Dataset regarding the “Reasons for concern” about climate change from figures in IPCC and related publications (2020.01.26.r1), Zenodo [data set], https://doi.org/10.5281/ZENODO.4011179, 2020a.
Marbaix, P.: EmberFactory, https://pypi.org/project/EmberFactory/ (last access: 17 January 2025), 2020b.
Marbaix, P.: Reconstruction of data regarding the “Reasons for concern” about climate change from figures in IPCC and related publications, Zenodo [data set], https://doi.org/10.5281/ZENODO.3992856, 2020c.
Marbaix, P.: Code for analysing data and producing figures from the “burning embers” database, Zenodo [code], https://doi.org/10.5281/zenodo.14047894, 2024a.
Marbaix, P.: EmberMaker, https://www.ipcc.ch/site/assets/uploads/2024/02/IPCC-60_decisions_adopted_by_the_Panel.pdf (last access: 17 January 2025), 2024b.
Marbaix, P., Magnan, A. K., Muccione, V., Thorne, P. W., and Zommers, Z.: Climate change risks illustrated by the IPCC burning embers: dataset (1.1.0), Zenodo [data set], https://doi.org/10.5281/zenodo.12626976, 2024.
Mastrandrea, M. D., Field, C. B., Stocker, T. F., Edenhofer, O., Ebi, K. L., Frame, D. J., Held, H., Kriegler, E., Mach, K. J., Matschoss, P. R., Plattner, G.-K., Zwiers, F. W., and Matschoss, P. R.: Guidance Note for Lead Authors of the IPCC Fifth Assessment Report on Consistent Treatment of Uncertainties, IPCC, Intergovernmental Panel On Climate Change, https://www.ipcc.ch/site/assets/uploads/2018/05/uncertainty-guidance-note.pdf (last access: 17 January 2025), 2010.
Meyer, A. L. S., Bentley, J., Odoulami, R. C., Pigot, A. L., and Trisos, C. H.: Risks to biodiversity from temperature overshoot pathways, Philos. T. Roy. Soc. B, 377, 20210394, https://doi.org/10.1098/rstb.2021.0394, 2022.
Muccione, V., Haasnoot, M., Alexander, P., Bednar-Friedl, B., Biesbroek, R., Georgopoulou, E., Le Cozannet, G., and Schmidt, D. N.: Adaptation pathways for effective responses to climate change risks, WIREs Climate Change, 15, e883, https://doi.org/10.1002/wcc.883, 2024.
New, M., Reckien, D., Viner, D., Adler, C., Cheong, S.-M., Conde, C., Constable, A., Coughlan de Perez, E., Lammel, A., Mechler, R., Orlove, B., and Solecki, W.: Decision-Making Options for Managing Risk, edited by: Pörtner, H. O., Roberts, D. C., Tignor, M., Poloczanska, E. S., Mintenbeck, K., Alegría, A., Craig, M., Langsdorf, S., Löschke, S., Möller, V., Okem, A., and Rama, B., Climate Change 2022: Impacts, Adaptation and Vulnerability. Contribution of Working Group II to the Sixth Assessment Report of the Intergovernmental Panel on Climate Change, https://doi.org/10.1017/9781009325844.026, 2022.
O'Neill, B. C., Oppenheimer, M., Warren, R., Hallegatte, S., Kopp, R. E., Pörtner, H. O., Scholes, R., Birkmann, J., Foden, W., Licker, R., Mach, K. J., Marbaix, P., Mastrandrea, M. D., Price, J., Takahashi, K., van Ypersele, J.-P., and Yohe, G.: IPCC reasons for concern regarding climate change risks, Nat. Clim. Change, 7, 28–37, https://doi.org/10.1038/nclimate3179, 2017a.
O'Neill, B. C., Kriegler, E., Ebi, K. L., Kemp-Benedict, E., Riahi, K., Rothman, D. S., van Ruijven, B. J., van Vuuren, D. P., Birkmann, J., Kok, K., Levy, M., and Solecki, W.: The roads ahead: Narratives for shared socioeconomic pathways describing world futures in the 21st century, Global Environ. Change, 42, 169–180, https://doi.org/10.1016/j.gloenvcha.2015.01.004, 2017b.
O'Neill, B. C., Carter, T. R., Ebi, K., Harrison, P. A., Kemp-Benedict, E., Kok, K., Kriegler, E., Preston, B. L., Riahi, K., Sillmann, J., van Ruijven, B. J., van Vuuren, D., Carlisle, D., Conde, C., Fuglestvedt, J., Green, C., Hasegawa, T., Leininger, J., Monteith, S., and Pichs-Madruga, R.: Achievements and needs for the climate change scenario framework, Nat. Clim. Chang., 10, 1074–1084, https://doi.org/10.1038/s41558-020-00952-0, 2020.
O'Neill, B., van Aalst, M., Zaiton Ibrahim, Z., Berrang Ford, L., Bhadwal, S., Buhaug, H., Diaz, D., Frieler, K., Garschagen, M., Magnan, A., Midgley, G., Mirzabaev, A., Thomas, A., and Warren, R.: Key Risks Across Sectors and Regions, edited by: Pörtner, H. O., Roberts, D. C., Tignor, M., Poloczanska, E. S., Mintenbeck, K., Alegría, A., Craig, M., Langsdorf, S., Löschke, S., Möller, V., Okem, A., and Rama, B., Climate Change 2022: Impacts, Adaptation and Vulnerability. Contribution of Working Group II to the Sixth Assessment Report of the Intergovernmental Panel on Climate Change, https://doi.org/10.1017/9781009325844.025, 2022a.
O'Neill, B., van Aalst, M., Zaiton Ibrahim, Z., Berrang Ford, L., Bhadwal, S., Buhaug, H., Diaz, D., Frieler, K., Garschagen, M., Magnan, A., Midgley, G., Mirzabaev, A., Thomas, A., and Warren, R.: Key Risks Across Sectors and Regions Supplementary Material, edited by: Pörtner, H. O., Roberts, D. C., Tignor, M., Poloczanska, E. S., Mintenbeck, K., Alegría, A., Craig, M., Langsdorf, S., Löschke, S., Möller, V., Okem, A., and Rama, B., Climate Change 2022: Impacts, Adaptation and Vulnerability. Contribution of Working Group II to the Sixth Assessment Report of the Intergovernmental Panel on Climate Change, 2022b.
Oppenheimer, M., Campos, M., Warren, R., Birkmann, J., Luber, G., O'Neill, B., and Takahashi, K.: Emergent risks and key vulnerabilities, in: Climate Change 2014: Impacts, Adaptation, and Vulnerability. Part A: Global and Sectoral Aspects. Contribution of Working Group II to the Fifth Assessment Report of the Intergovernmental Panel on Climate Change, edited by: Field, C. B., Barros, V. R., Dokken, D. J., Mach, K. J., Mastrandrea, M. D., Bilir, T. E., Chatterjee, M., Ebi, K. L., Estrada, Y. O., Genova, R. C., Girma, B., Kissel, E. S., Levy, A. N., MacCracken, S., Mastrandrea, P. R., and White, L. L., Cambridge University Press, Cambridge, United Kingdom and New York, NY, USA, 1039–1099, https://doi.org/10.1017/CBO9781107415379.024, 2014.
Oppenheimer, M., Glavovic, B. C., Hinkel, J., van, R., Magnan, A. K., Abd-Elgawad, A., Cai, R., Cifuentes-Jara, M., DeConto, R. M., Ghosh, T., Hay, J., Isla, F., Marzeion, B., Meyssignac, B., and Sebesvari, Z.: Sea Level Rise and Implications for Low-Lying Islands, Coasts and Communities, edited by: Pörtner, H.-O., Roberts, D. C., Masson-Delmotte, V., Zhai, P., Tignor, M., Poloczanska, E., Mintenbeck, K., Alegría, A., Nicolai, M., Okem, A., Petzold, J., Rama, B., and Weyer, N. M., IPCC Special Report on the Ocean and Cryosphere in a Changing Climate, IPCC, 321–445, https://doi.org/10.1017/9781009157964.006, 2019.
Otto, F. E. L. and Fabian, F.: Equalising the evidence base for adaptation and loss and damages, Global Policy, 1758–5899, 13269, https://doi.org/10.1111/1758-5899.13269, 2023.
Parmesan, C., Morecroft, M. D., Trisurat, Y., Adrian, R., Anshari, G. Z., Arneth, A., Gao, Q., Gonzalez, P., Harris, R., Price, J., Stevens, N., and Talukdarr, G. H.: Terrestrial and Freshwater Ecosystems and Their Service Supplementary Material, edited by: Pörtner, H. O., Roberts, D. C., Tignor, M., Poloczanska, E. S., Mintenbeck, K., Alegría, A., Craig, M., Langsdorf, S., Löschke, S., Möller, V., Okem, A., and Rama, B., Climate Change 2022: Impacts, Adaptation and Vulnerability. Contribution of Working Group II to the Sixth Assessment Report of the Intergovernmental Panel on Climate Change, https://www.ipcc.ch/report/ar6/wg2/ (last access: 17 January 2025), 2022.
Rawshan Ara Begum, R., Lempert, R., E. Ali, T. A. B., Bernauer, T., Cramer, W., Cui, X., Mach, K., Nagy, G., Stenseth, N. C., Sukumar, R., and Wester, P.: Point of Departure and Key Concepts, edited by: Pörtner, H. O., Roberts, D. C., Tignor, M., Poloczanska, E. S., Mintenbeck, K., Alegría, A., Craig, M., Langsdorf, S., Löschke, S., Möller, V., Okem, A., and Rama, B., Climate Change 2022: Impacts, Adaptation and Vulnerability. Contribution of Working Group II to the Sixth Assessment Report of the Intergovernmental Panel on Climate Change, https://doi.org/10.1017/9781009325844.003, 2022.
Reisinger, A. and Geden, O.: Temporary overshoot: Origins, prospects, and a long path ahead, One Earth, 6, 1631–1637, https://doi.org/10.1016/j.oneear.2023.11.008, 2023.
Riahi, K., van Vuuren, D. P., Kriegler, E., Edmonds, J., O'Neill, B. C., Fujimori, S., Bauer, N., Calvin, K., Dellink, R., Fricko, O., Lutz, W., Popp, A., Cuaresma, J. C., Kc, S., Leimbach, M., Jiang, L., Kram, T., Rao, S., Emmerling, J., Ebi, K., Hasegawa, T., Havlik, P., Humpenöder, F., Da Silva, L. A., Smith, S., Stehfest, E., Bosetti, V., Eom, J., Gernaat, D., Masui, T., Rogelj, J., Strefler, J., Drouet, L., Krey, V., Luderer, G., Harmsen, M., Takahashi, K., Baumstark, L., Doelman, J. C., Kainuma, M., Klimont, Z., Marangoni, G., Lotze-Campen, H., Obersteiner, M., Tabeau, A., and Tavoni, M.: The Shared Socioeconomic Pathways and their energy, land use, and greenhouse gas emissions implications: An overview, Global Environmental Change, 42, 153–168, https://doi.org/10.1016/j.gloenvcha.2016.05.009, 2017.
Rosenzweig, C., Arnell, N. W., Ebi, K. L., Lotze-Campen, H., Raes, F., Rapley, C., Smith, M. S., Cramer, W., Frieler, K., Reyer, C. P. O., Schewe, J., Van Vuuren, D., and Warszawski, L.: Assessing inter-sectoral climate change risks: the role of ISIMIP, Environ. Res. Lett., 12, 010301, https://doi.org/10.1088/1748-9326/12/1/010301, 2017.
Schipper, E. L. F., Revi, A., Preston, B. L., Carr, E. R., Eriksen, S. H., Fernandez-Carril, L. R., Glavovic, B. C., Hilmi, N. J. M., Ley, D., Mukerji, R., Muylaert de Araujo, M. S., Perez, R., Rose, S. K., and Singh, P. K.: Climate Resilient Development Pathways, edited by: Pörtner, H. O., Roberts, D. C., Tignor, M., Poloczanska, E. S., Mintenbeck, K., Alegría, A., Craig, M., Langsdorf, S., Löschke, S., Möller, V., Okem, A., and Rama, B., Climate Change 2022: Impacts, Adaptation and Vulnerability. Contribution of Working Group II to the Sixth Assessment Report of the Intergovernmental Panel on Climate Change, https://doi.org/10.1017/9781009325844.027, 2022.
Schneider, S. H., Semenov, S., Patwardhan, A., Burton, I., Magadza, C. H. D., Oppenheimer, M., Pittock, A. B., Rahman, A., Smith, J. B., Suarez, A., and Yamin, F.: Assessing key vulnerabilities and the risk from climate change, in: Climate Change 2007: Impacts, Adaptation and Vulnerability. Contribution of Working Group II to the Fourth Assessment Report of the Intergovernmental Panel on Climate Change, vol. 19, edited by: Parry, M. L., Canziani, O. F., Palutikof, J. P., van der Linden, P. J., and Hanson, C. E., Cambridge University Press, Cambridge, UK, 779–810, ISBN 9780521705974, 2007.
Simpson, N. P., Williams, P. A., Mach, K. J., Berrang-Ford, L., Biesbroek, R., Haasnoot, M., Segnon, A. C., Campbell, D., Musah-Surugu, J. I., Joe, E. T., Nunbogu, A. M., Sabour, S., Meyer, A. L. S., Andrews, T. M., Singh, C., Siders, A. R., Lawrence, J., Van Aalst, M., and Trisos, C. H.: Adaptation to compound climate risks: A systematic global stocktake, iScience, 26, 105926, https://doi.org/10.1016/j.isci.2023.105926, 2023.
Smith, J. B., Schellnhuber, H.-J., Mirza, M. M. Q., Fankhauser, S., Leemans, R., Erda, L., Ogallo, L., Pittock, B., Richels, R., Rosenzweig, C., Safriel, U., Tol, R. S. J., Weyant, J., and Yohe, G.: Chapter 19: Vulnerability to Climate Change and Reasons for Concern: A Synthesis, edited by: McCarthy, J. J., Canziani, O. F., Leary, N. A., Dokken, J. J., and White, K. S., Climate Change 2001: Impacts, adaptation and vulnerability. Contribution of Working Group II to the Third Assessment Report of the Intergovernmental Panel on Climate Change, Cambridge University Press, https://archive.ipcc.ch/ipccreports/tar/wg2/pdf/wg2TARchap19.pdf (last access: 17 January 2025), 2001.
Smith, J. B., Schneider, S. H., Oppenheimer, M., Yohe, G. W., Hare, W., Mastrandrea, M. D., Patwardhan, A., Burton, I., Corfee-Morlot, J., Magadza, C. H. D., Füssel, H.-M., Pittock, A. B., Rahman, A., Suarez, A., and Van Ypersele, J.-P.: Assessing dangerous climate change through an update of the Intergovernmental Panel on Climate Change (IPCC) “reasons for concern”, P. Natl. Acad. Sci. USA, 106, 4133–4137, https://doi.org/10.1073/pnas.0812355106, 2009.
UN General Assembly: Protection of global climate for present and future generations of mankind: resolution adopted by the General Assembly, A/RES/43/53, https://digitallibrary.un.org/record/54234 (last access: 17 January 2025), 1988.
UNEP, Olhoff, A., Bataille, C., Christensen, J., Den Elzen, M., Fransen, T., Grant, N., Blok, K., Kejun, J., Soubeyran, E., Lamb, W., Levin, K., Portugal-Pereira, J., Pathak, M., Kuramochi, T., Strinati, C., Roe, S., and Rogelj, J.: Emissions Gap Report 2024: No more hot air … please! With a massive gap between rhetoric and reality, countries draft new climate commitments, United Nations Environment Programme, https://doi.org/10.59117/20.500.11822/46404, 2024.
UNFCCC: United Nations Framework Convention On Climate Change, http://digitallibrary.un.org/record/148994 (last access: 17 January 2025), 1992.
UNFCCC: Decision 2/CP.19 Warsaw international mechanism for loss and damage associated with climate change impacts, UNFCCC Secretariat, FCCC/CP/2013/10/Add.1, https://unfccc.int/documents/8106 (last access: 17 January 2025), 2014.
UNFCCC: Report on the Structured Expert Dialogue on the 2013–2015 Review, UNFCCC Secretariat, https://unfccc.int/documents/8707 (last access: 17 January 2025), 2015.
UNFCCC: Technical dialogue of the first global stocktake, Synthesis report by the co-facilitators on the technical dialogue, UNFCCC, https://unfccc.int/documents/631600 (last access: 17 January 2025), 2023.
Van Westen, R. M., Kliphuis, M., and Dijkstra, H. A.: Physics-based early warning signal shows that AMOC is on tipping course, Sci. Adv., 10, eadk1189, https://doi.org/10.1126/sciadv.adk1189, 2024.
Watson, R. T., Zinyowera, M. C., Moss, R. H., and Intergovernmental Panel on Climate Change (Eds.): Climate change, 1995: impacts, adaptations, and mitigation of climate change: scientific-technical analyses: contribution of working group II to the second assessment report of the Intergovernmental Panel on Climate Change, Cambridge University Press, Cambridge, UK, New York, NY, USA, 878 pp., 1996.
WMO: State of the Global Climate 2023, World Meteorological Organization, 53 pp., ISBN 978-92-63-11347-4, https://library.wmo.int/idurl/4/68835 (last access: 17 January 2025), 2024.
Zommers, Z., Marbaix, P., Fischlin, A., Ibrahim, Z. Z., Grant, S., Magnan, A. K., Pörtner, H.-O., Howden, M., Calvin, K., Warner, K., Thiery, W., Sebesvari, Z., Davin, E. L., Evans, J. P., Rosenzweig, C., O'Neill, B. C., Patwardhan, A., Warren, R., van Aalst, M. K., and Hulbert, M.: Burning embers: towards more transparent and robust climate-change risk assessments, Nat. Rev. Earth Environ., https://doi.org/10.1038/s43017-020-0088-0, 2020.
- Abstract
- Introduction
- A database of climate risks illustrated as burning embers
- A global picture of impacts and risks
- Data availability
- Code availability
- Discussion: contribution to future risk assessments and communication
- Author contributions
- Competing interests
- Disclaimer
- Acknowledgements
- Review statement
- References
- Supplement
Since 2001, the Intergovernmental Panel on Climate Change (IPCC) has used burning-ember diagrams to show how risks increase with global warming. We bring these data into a harmonized framework available through an online Climate Risks Embers Explorer. Without high levels of adaptation, most risks reach a high level around 2 to 2.3 °C of global warming. Improvements in future reports could include systematic collection of explanatory information and broader coverage of regions and adaptation.
Since 2001, the Intergovernmental Panel on Climate Change (IPCC) has used burning-ember diagrams...
- Abstract
- Introduction
- A database of climate risks illustrated as burning embers
- A global picture of impacts and risks
- Data availability
- Code availability
- Discussion: contribution to future risk assessments and communication
- Author contributions
- Competing interests
- Disclaimer
- Acknowledgements
- Review statement
- References
- Supplement