the Creative Commons Attribution 4.0 License.
the Creative Commons Attribution 4.0 License.
 | 25 Jun 2025
Global patterns and drivers of soil dissolved organic carbon concentrations
Tianjing Ren
Dissolved organic carbon (DOC) constitutes the most active carbon pool in soils and plays critical roles in soil carbon cycling, plant productivity, and global climate change. Accurately assessing soil DOC quantity is essential to elucidate ecosystem functions and services. However, global driving factors and the spatial distribution of soil DOC remain poorly quantified, largely due to limited large-scale data. Here, we compile a comprehensive global database of soil DOC concentrations, encompassing 12 807 observations extracted from 975 scientific publications published between 1984 and 2020. We also record detailed geographic locations, climatic variables, and soil properties as predictors. Machine learning techniques were employed, including 10-fold cross-validation and evaluating model performance by R2 and root mean square error values, to predict the relative importance of various predictors and the global distribution of soil DOC concentrations. Worldwide soil DOC concentrations ranged from 0.04 to 7859 mg kg−1, averaging 222.78 mg kg−1. The 14 selected predictors, including elevation, soil properties, and climate, explained 63 % of the variance in soil DOC concentrations. Elevation played the most important predictor for soil DOC prediction, followed by soil organic carbon, seasonal variability of temperature, and soil clay content. Soil DOC decreases initially but increases when soil clay content exceeds 20 % and seasonal variability of temperature exceeds 0.7. Using these findings, a global map of predicted soil DOC concentrations was produced at a 0.05° by 0.05° resolution. Global soil DOC concentrations generally increased from the Equator to the poles wherein the topsoil layer (0–30 cm) holds 13.47 Pg of soil DOC with substantial variations across continents. These results inform soil management practices strategies, ecosystem services evaluations, and climate change mitigation efforts. Furthermore, we envision integrating our database with other carbon pools to advance understanding of total soil carbon turnover and to refine Earth system models. The dataset is publicly available at https://doi.org/10.6084/m9.figshare.28574183 (Ren and Cai, 2025).
- Article
(2335 KB) - Full-text XML
-
Supplement
(2159 KB) - BibTeX
- EndNote


With global changes over the last few decades, terrestrial ecosystems, which serve as the fundamental safeguard for biodiversity and function as a carbon sink, have become increasingly vital in mitigating global climate warming (Lee et al., 2023). Soils anchor the largest dynamic carbon reservoir in terrestrial ecosystems, with the 0–1 m depth storing 1500–2400 Pg of carbon, which is triple the atmospheric carbon stock (880 Pg) and quadruple the biotic carbon pools (450–650 Pg) (Lal, 2004; Zhou et al., 2024a). Sub-decadal perturbations as small as ±1 % in soil carbon stocks could release 15–24 Pg C, which is equivalent to 1.5–2.4 years of anthropogenic emissions and could trigger nonlinear climate feedbacks (Schlesinger and Bernhardt, 2020). Dissolved organic carbon (DOC), a molecular continuum spanning labile metabolites (e.g., glucose, citrate) to mineral-stabilized colloids, is recognized as the most active carbon pool in soil (Ren et al., 2024a). Currently, the portion of organic carbon that is water-soluble and able to pass through a 0.45 µm microporous filter membrane is referred to as DOC (Gmach et al., 2020; Guo et al., 2020a). Despite constituting 0.1–2 % of total soil organic carbon, DOC mediates three disproportionately critical processes: fueling 65 %–80 % of heterotrophic respiration via rapid turnover, controlling mineral-organic complexation that stabilizes 40 %–60 % of persistent carbon, and exporting 0.25–0.75 Pg C yr−1 to aquatic systems – a flux comparable to land use change emissions (Drake et al., 2018; Nakhavali et al., 2021; Ren et al., 2024b). Lateral DOC fluxes create a terrestrial – aquatic carbon conveyor belt equivalent to 50 % of the Amazonian carbon sink, while also modifying water chemistry through pH buffering and metal complexation (Fichot et al., 2023). Thus, an accurate assessment of soil DOC concentrations is vital, given its unique properties, roles, and broad variability, which can span up to three orders of magnitude (Nakhavali et al., 2020; Ren et al., 2024b). Despite significant variations in soil DOC concentrations, their global distribution has not yet been systematically quantified. Bridging this knowledge gap is essential for more accurate representations of the carbon cycle in Earth system models.
Soil DOC concentration is regulated by a kinetic equilibrium between production processes (plant litter leaching, rhizodeposition, and microbial necromass release) and removal pathways (microbial mineralization, mineral adsorption, and hydrological leaching). Disruption of this equilibrium, whether caused by altered substrate inputs or shifted microbial metabolic demands, reshapes DOC pool dynamics (Sokol et al., 2022). Hierarchical controls shape DOC dynamics: climatic drivers set thermal-hydrological boundaries, vegetation types modulate organic matter stoichiometry, and soil properties dictate mineral-mediated stabilization (Fichot et al., 2023; Ren et al., 2024b; Smreczak and Ukalska-Jaruga, 2021). Climate, often characterized by annual mean temperature and precipitation, is recognized as a primary driver of soil DOC concentrations (Lønborg et al., 2020). Temperature and precipitation directly influence soil DOC through effects on microbial activity, organic matter decomposition rates, solubility, and mobility, and indirectly shape DOC dynamics by influencing vegetation growth and soil structure (Ren et al., 2023; Andersson and Nilsson, 2001). Vegetation type affects soil DOC primarily by altering the quantity and quality of organic matter inputs (Zhao et al., 2022). Together, climate and vegetation type profoundly affect soil biological, chemical, and physical properties, all of which are closely connected to the formation and decomposition of soil DOC (Camino-Serrano et al., 2014; Cotrufo and Lavallee, 2022). Some studies have reported large temporal variations in soil DOC concentrations at certain field sites (Ding et al., 2022; Zhao et al., 2022), with significantly higher DOC concentrations in summer and autumn than in winter and spring. Seasonal effects on soil DOC concentrations are closely associated with factors such as precipitation, soil moisture, and substrate availability (Ren et al., 2023). In warmer seasons, soil DOC production can increase due to active organic matter decomposition, driven by higher microbial activity, as well as greater DOC contributions from root exudation during periods of more active plant photosynthesis. Although relationships between soil DOC concentrations and environmental factors have been observed at local and regional scales, the relative importance of these factors at the global scale remains unclear. This lack of understanding hinders the development of effective strategies for soil carbon management and climate change mitigation.
Accurate mapping of soil DOC provides critical baseline data for addressing global challenges spanning climate-carbon feedbacks, agricultural sustainability, and aquatic ecosystem management (Guo et al., 2020b; Langeveld et al., 2020). Current global soil DOC inventories remain limited in both spatial resolution and mechanistic representation. Existing maps derived from conventional geostatistical approaches, such as those by Guo et al. (2020b) and Langeveld et al. (2020), exhibit three fundamental limitations that constrain their utility for process-based modeling. First, the global soil DOC maps produced by Guo et al. (2020b) and Langeveld et al. (2020) rely on relatively few observational data points (2890 and 762 pairs, respectively), with over 80 % of training data clustered in North America and Western Europe, while tropical regions and continental interiors remain under sampled. Africa, South America, Eastern Europe, and Central Asia collectively contribute less than 5 % of the global calibration datasets in these studies. Second, they employ static representations of DOC dynamics, neglecting well-documented seasonal fluctuations driven by plant phenology and hydrologic pulses. Field observations demonstrate that temperate forest soils can exhibit 2–3 fold increases in DOC concentrations during autumn litterfall periods compared to spring thaw events. Third, current models oversimplify vertical DOC gradients by treating topsoil (0–30 cm) as homogeneous layers, despite empirical evidence showing exponential decreases in DOC with depth. In reality, soil DOC concentrations are higher in surface soils (0–10 cm) and decline with depth, exhibiting a clear vertical gradient. Finally, traditional linear regression methods used in these studies capture only 30 %–40 % of observed soil DOC variability, as they fail to account for threshold responses to environmental drivers such as soil pH transitions below 5.2 that trigger dissolved organic matter flocculation. Recent advancements in machine learning has enabled researchers to apply such techniques because of their capacities to automate feature extraction, handle large datasets, and identify complex patterns, ultimately offering significant advantages in predictive accuracy and adaptive learning.
To advance our knowledge of global soil DOC patterns and drivers, we developed a global database of soil DOC concentrations, comprising 12 807 samples from 975 published studies. Using random forest algorithms, we quantified the relative importance of environmental factors and predicted soil DOC concentrations on a global scale. The specific aims of this study were: (1) to determine global patterns of soil DOC concentrations, and (2) to identify the primary factors controlling soil DOC concentrations on a global scale and to estimate total global soil DOC storage.
2.1 Data sources and processing
We searched for publications up to December 2022 using Google Scholar (https://scholar.google.com, last access: 30 December 2022), the Web of Science (http://apps.webofknowledge.com, last access: 30 December 2022), and the China Knowledge Resource Integrated Database (http://www.cnki.net/, last access: 30 December 2022) using the following search terms: (dissolved organic carbon OR dissolved organic matter OR “DOC” OR “DOM”) and soil, up to December 2022. The data flow through the selection phases is shown in Fig. S1 in the Supplement. To ensure a standardized and minimally biased dataset, we applied the following inclusion criteria: First, we included only data from terrestrial ecosystems (excluding oceans and rivers) to maintain consistency in environmental factors and ecological interactions. Second, we used only topsoil data (0–30 cm) to ensure data representativeness and quantity. Third, we recorded duplicate results from different articles only once to avoid overrepresentation of certain research groups or locations. Finally, we included agricultural soils affected by human activities such as tilling and fertilization but excluded industrial and urban soils to avoid complexity introduced by industrial and urban settings. We extracted data presented solely in figures using the digitizer function of Origin 2019. Before extracting the target data, we employed the Isolation Forest method for anomaly detection. The algorithm constructs random binary trees where anomalies are typically isolated more rapidly and normal points require more splitting steps.
Based on these criteria, we compiled a total of 12 807 DOC observations based on 1610 sites from 975 publications (Fig. 1a). We also collected data on experimental sites (longitude, latitude, and altitude), climate (mean annual temperature [MAT] and mean annual precipitation [MAP]), biomes (wetland, forest, shrubland, tundra, grassland, and cropland) and soil properties (soil organic carbon, texture, and pH) (Table 1). These environmental factors are used as predictors. When environmental factors were not reported in the original publication, the missing data were extracted from grid datasets according to the geographic coordinates of each observed site (Table S1). We extracted elevation, MAT, MAP, monthly evaporation (ETM), seasonal variability of precipitation (SVP), and seasonal variability of temperature (SVT) data from WorldClim version 2 (https://www.worldclim.com/, last access: 10 March 2025) with resolution of 1 km × 1 km, ecosystem data from NASA's Socioeconomic Data and Applications Center (https://sedac.ciesin.columbia.edu, last access: 10 March 2025) with resolution of 1 km × 1 km, soil properties from OpenLandMap version 2.0.0 (https://openlandmap.org, last access: 10 March 2025) with resolution of 0.25 km × 0.25 km, and microbial biomass carbon data from the open database of figshare (https://doi.org/10.6084/m9.figshare.19556419, Ren and Cai, 2025) with resolution of 1 km × 1 km. Despite bias, there is a significant linear relationship between the measured values and the corresponding extracted values (Fig. S2). Noteworthy, this bias could introduce some uncertainty to the results. Overall, our study sites spanned a wide range of latitudes (−64.81 to 78.85°) and longitudes (−159.66 to 175.95°) (Table 1), encompassing a large climate gradient with MAT from −11.16 to 28.00°C and MAP from 30 to 4200 mm.
Table 1Variables information of the soil dissolved organic carbon dataset in global terrestrial ecosystems. n/a refers to values that are not applicable.
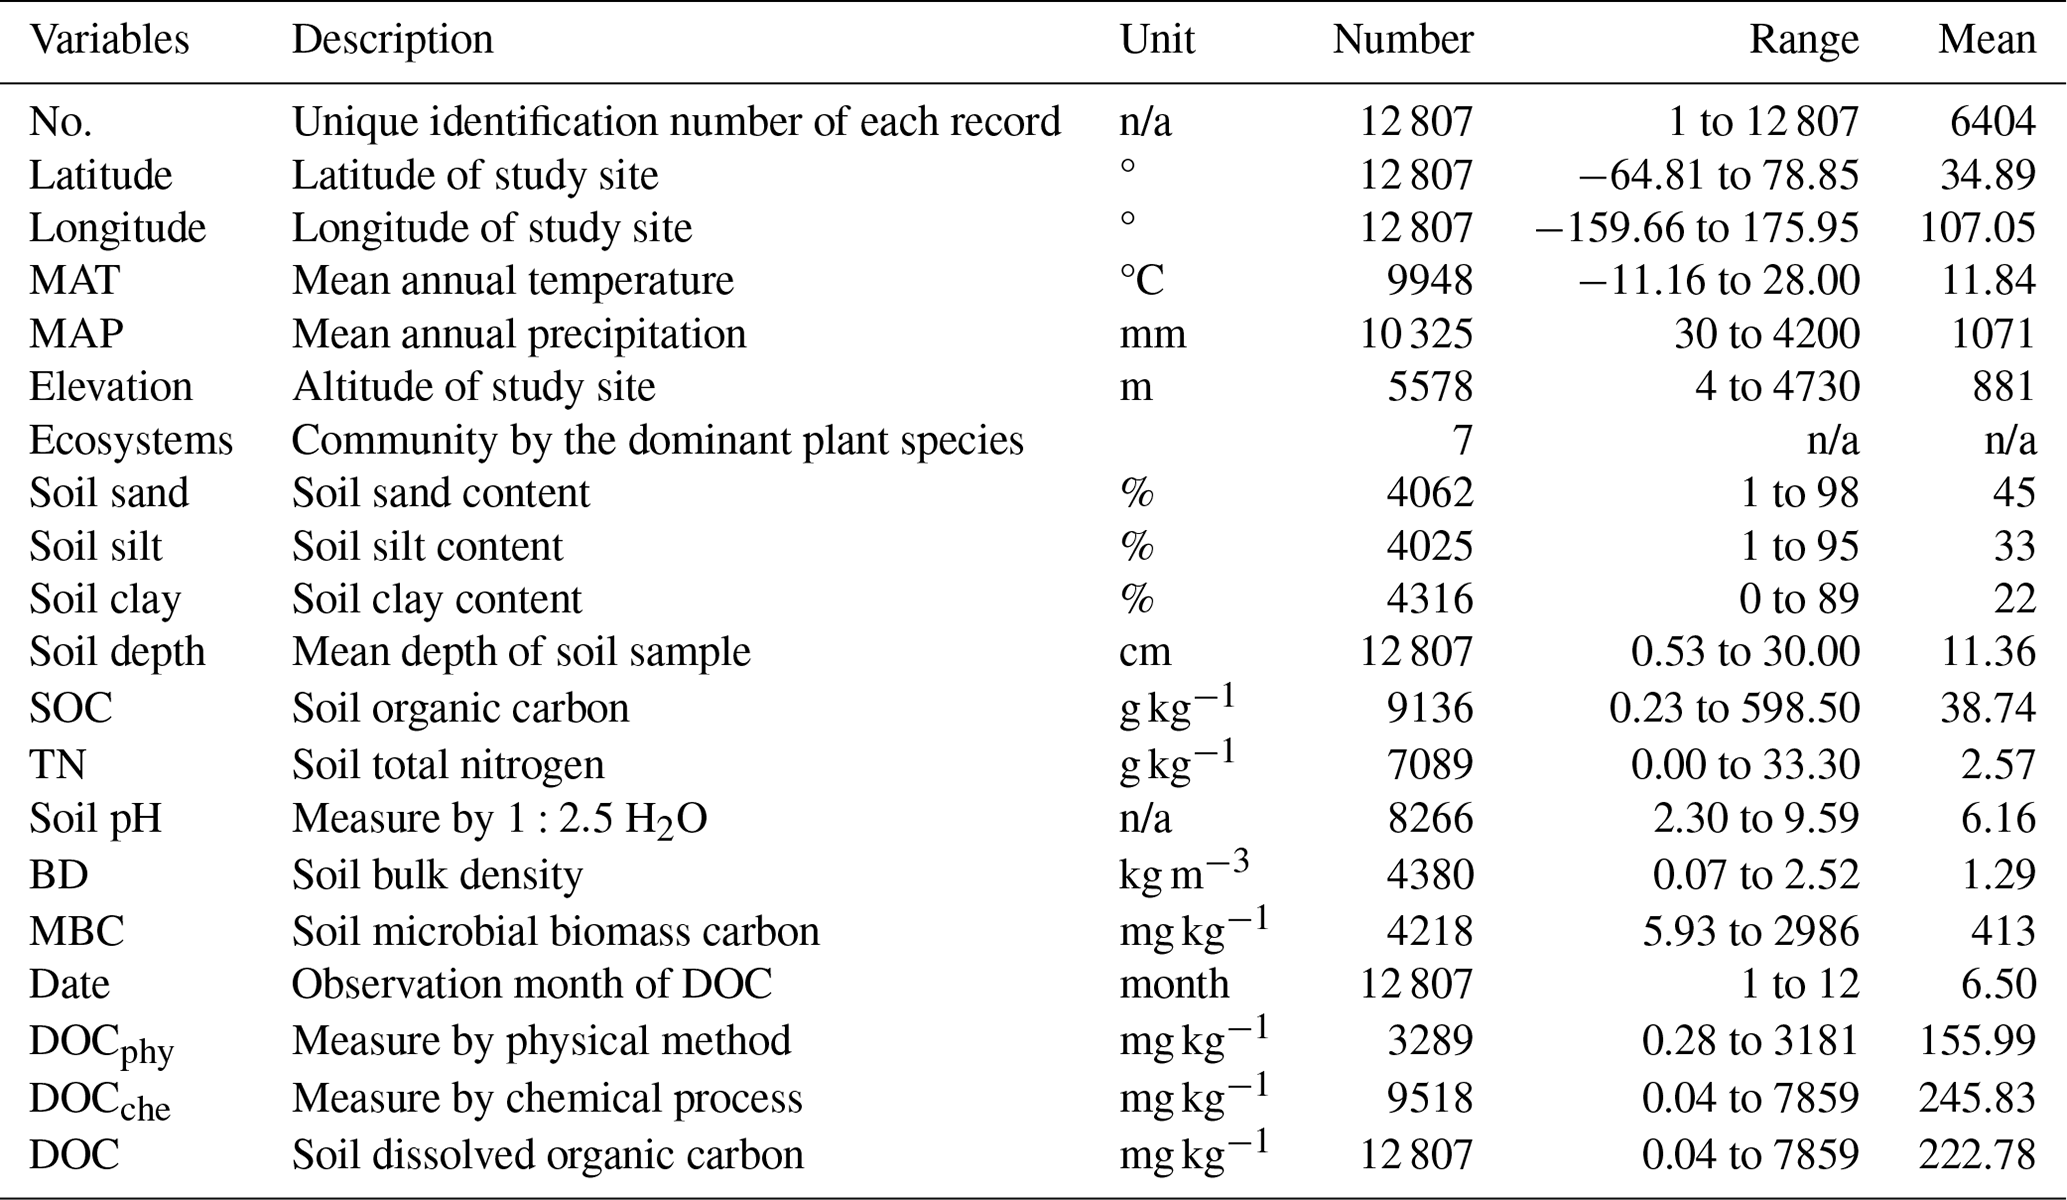
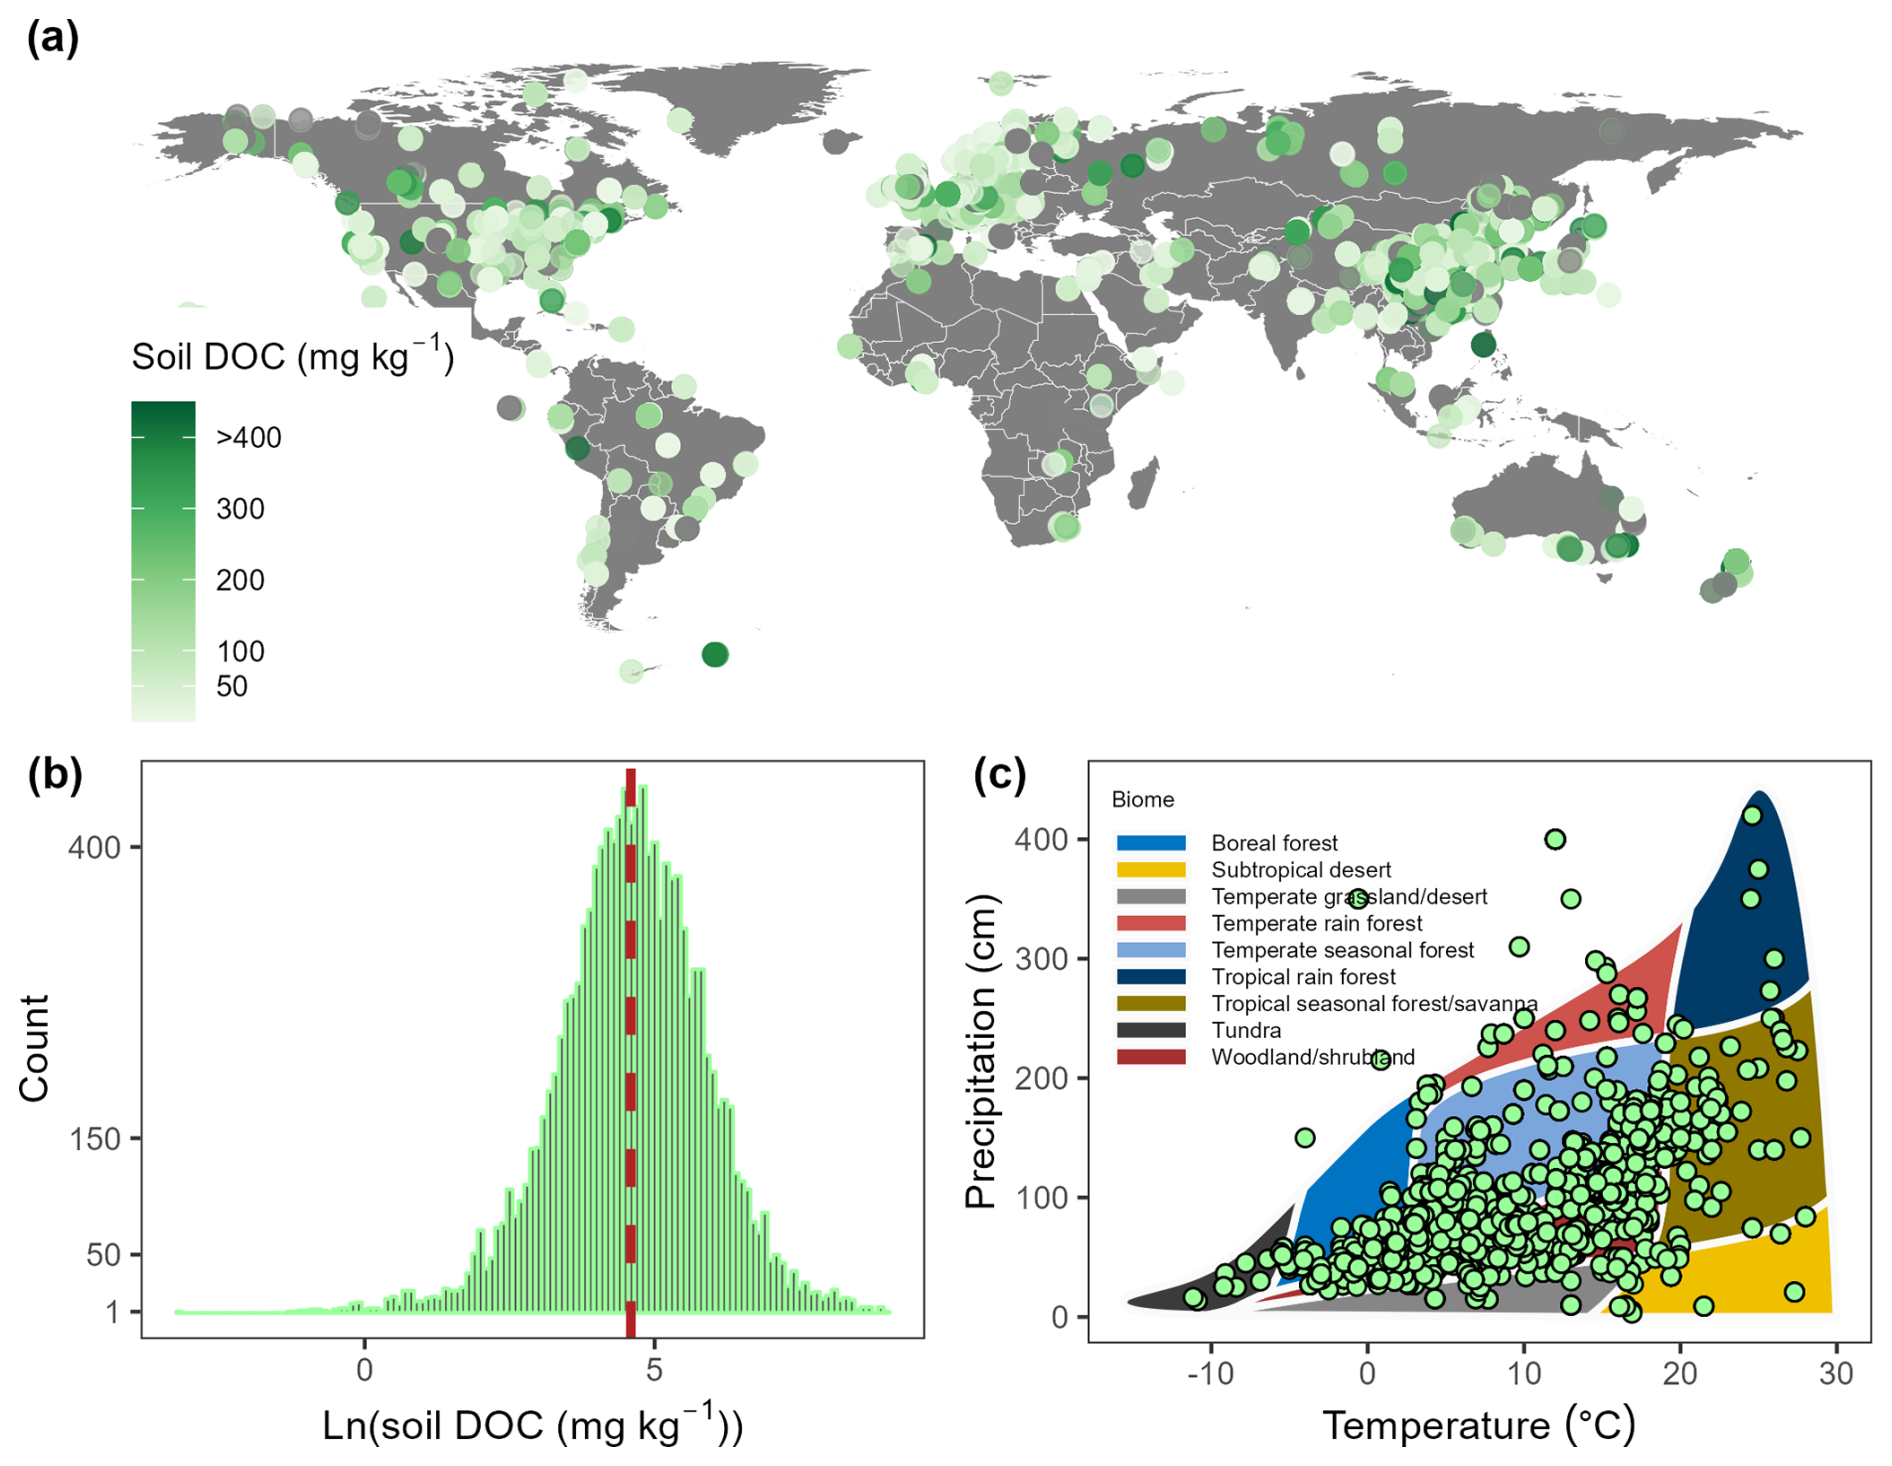
Figure 1Global distribution of soil dissolved organic carbon (DOC) concentration according to our site-level dataset. The dataset contains 12 807 sets of data (a, b), which covers major wetland (1106), forest (4867), shrubland (385), tundra (130), grassland (1192), and cropland (5125) terrestrial biomes (c). The dashed red line within the subplot (b) signifies the average soil DOC concentration, which is 223 mg kg−1.
2.2 Data standardization
For our database, the DOC concentrations were quantified using a mix of physical and chemical techniques. Physical methods included soil solution collection using lysimeters or ceramic suction. Chemical methods employed various solvents like distilled water, potassium chloride (KCl), or potassium sulfate (K2SO4) as described by Li et al. (2018). Over 74.32 % of the DOC was determined using chemical techniques, which highlighted their reliability. For consistency, the DOC values derived from physical approaches was converted to chemical method values using the following equation:
where, DOCsoil represents soil DOC concentration determined by chemical methods (mg g−1); DOCsolution is the concentration measured by physical methods (mg L−1); W denotes the volumetric soil moisture (m3 m−3); V is the volume of the soil column for solution extraction (m3); and BD is the soil bulk density (g cm−3). The factor 1000 converts m3 to L, and 1 000 000 converts m3 to cm3 following established by Guo et al. (2020b). This standardization allowed for a consistent comparison and analysis of the DOC data across various studies.
2.3 Predictive modeling
The driving factors of soil DOC concentrations were divided into four categories: elevation, climate, ecosystem, and soil properties. Soil properties included physical attributes (clay, sand, bulk density, and depth), chemical attributes (SOC, pH), and a biological attributes (microbial biomass carbon) attributes. Climate comprised MAT, MAP, ETM, SVP, and SVT. Ecosystems encompassed wetland, forest, shrubland, tundra, grassland, and cropland. In our predictive models, correlated predictors could substitute for each other, causing their importance to be shared and thus potentially underestimated. Consequently, we excluded soil silt because it was correlated with soil sand (Fig. S3). Further, we did not include some variables (e.g., soil moisture, soil porosity, ferroaluminum oxide, microbial structures, microbial diversity, and carbon cycling enzymes) because they were rarely reported in the target papers.
To develop and optimize a predictive model for soil DOC, we employed an array of regression methods which encompassed three linear and four nonlinear approaches (Table S2). The linear methods included a least absolute shrinkage and selection operator (LEAPS), elastic net (ENET), and standard linear modeling (LM) to identify the most important predictor variables while minimizing overfitting. The nonlinear methods included the random forest (RF) algorithm, boosted tree (BOOSTED), bagged tree (Bagged), and cubist (CUBIST) models. Each model had intrinsic feature selection processes that we fine-tuned to improve accuracy and control complexity. During the optimization phase, various actions were implemented. LEAPS models were educated to accommodate the largest number of variables. We applied penalties for feature condensation (diminishing the role of less impactful variables in the resultant linear formula) between 0 and 0.1, incremented by 0.01, to discipline the models. RF growth was restricted at a maximum of 1000 trees and we limited the number of predictors to one-third of the maximum possible, ensuring a balance between complexity and manageability. BOOSTED models underwent training with 10 to 100 trees, of which each had between 1 to 7 nodes. We incorporated shrinkage rates of 0.01 or 0.1, with a maximum tree size of 5. For the CUBIST model, we explored neighboring values from 1 to 9 in increments of 2 and varied community sizes from 1 to 100, refining predictive accuracy. In every instance, the models were evaluated using Monte Carlo cross-validation with 100 iterations, employing a 70/15/15 split between training, validation, and testing sets (Figs. 2b, S7 and 8). The root mean square error (RMSE) and R2 values were calculated to evaluate model accuracy and residual variance, which served as criteria for ranking model performance (Table S2). A 10-fold cross-validation method was used to evaluate model performance. A flowchart for model selection process is shown in Fig. S5. Finally, the RF model was used to predict soil DOC concentrations. The factor of ecosystems was excluded based on the IncNodePurity of RF model (Fig. S6).
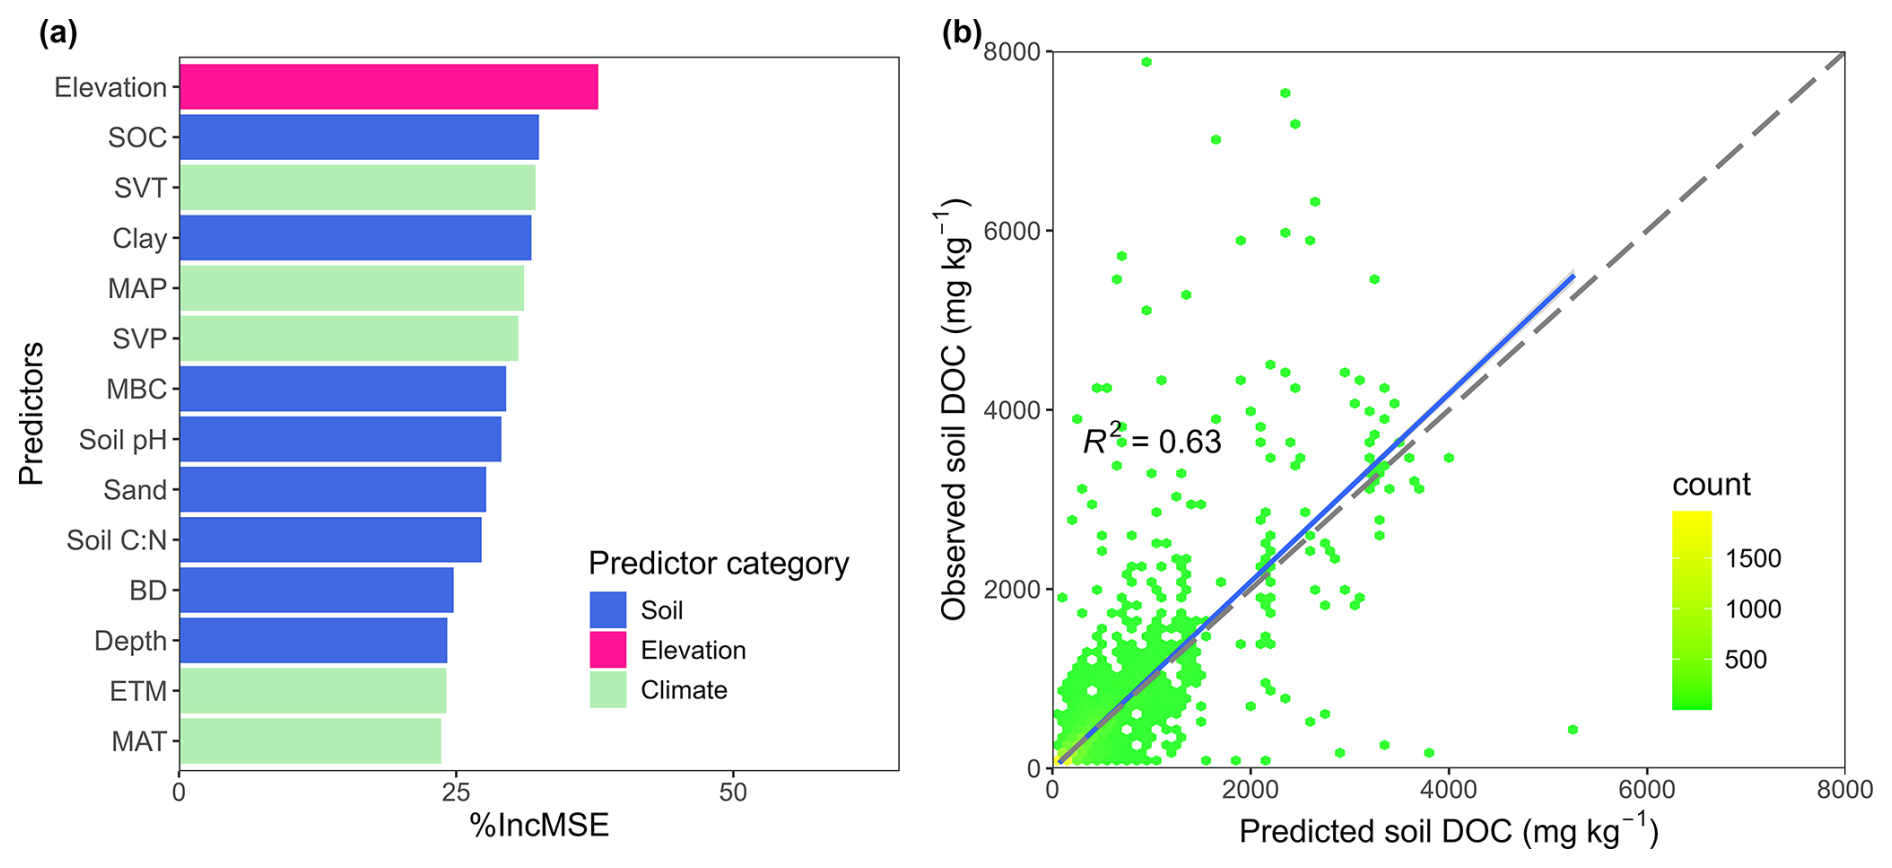
Figure 2Result of the random forest model predicting soil dissolved organic carbon (DOC) concentration. (a) The relative importance of predictors in the random forest model. (b) Predicted vs. observed soil DOC concentration. The dashed line indicates the 1:1 line and the blue line indicates the regression line between predicted and observed values. MAT, mean annual temperature; MAP, mean annual precipitation; SVP, seasonal variability of precipitation; SVT, seasonal variability of temperature; ETM, monthly evaporation; SOC, soil organic carbon; BD, bulk density; MBC, microbial biomass carbon content; and C:N, ratio of carbon to nitrogen.
To evaluate the effects of independent variables on soil DOC, a variable importance analysis was conducted using permutation variable importance measurements. This analysis was performed with the variable importance tool integrated into the R packages for the RF model that exhibited the highest predictive quality. In essence, this method assessed prediction errors within the model by calculating mean square errors for each regression tree. The models' variable importance scores assessed the influence of predictor variables on the outcomes. For enhanced comparability of all model inputs, the independent environmental variables were scaled to a 0 %–100 % range to facilitate comparisons of their proportional contribution to the model's predictions. To evaluate the sensitivity analysis of model predictions, the Sobol index, a variance of based global sensitivity analysis method, was used to assesses how model input parameters impact output results (Fig. S9). This method breaks down the system's total variance into contributions from individual inputs and their combinations.
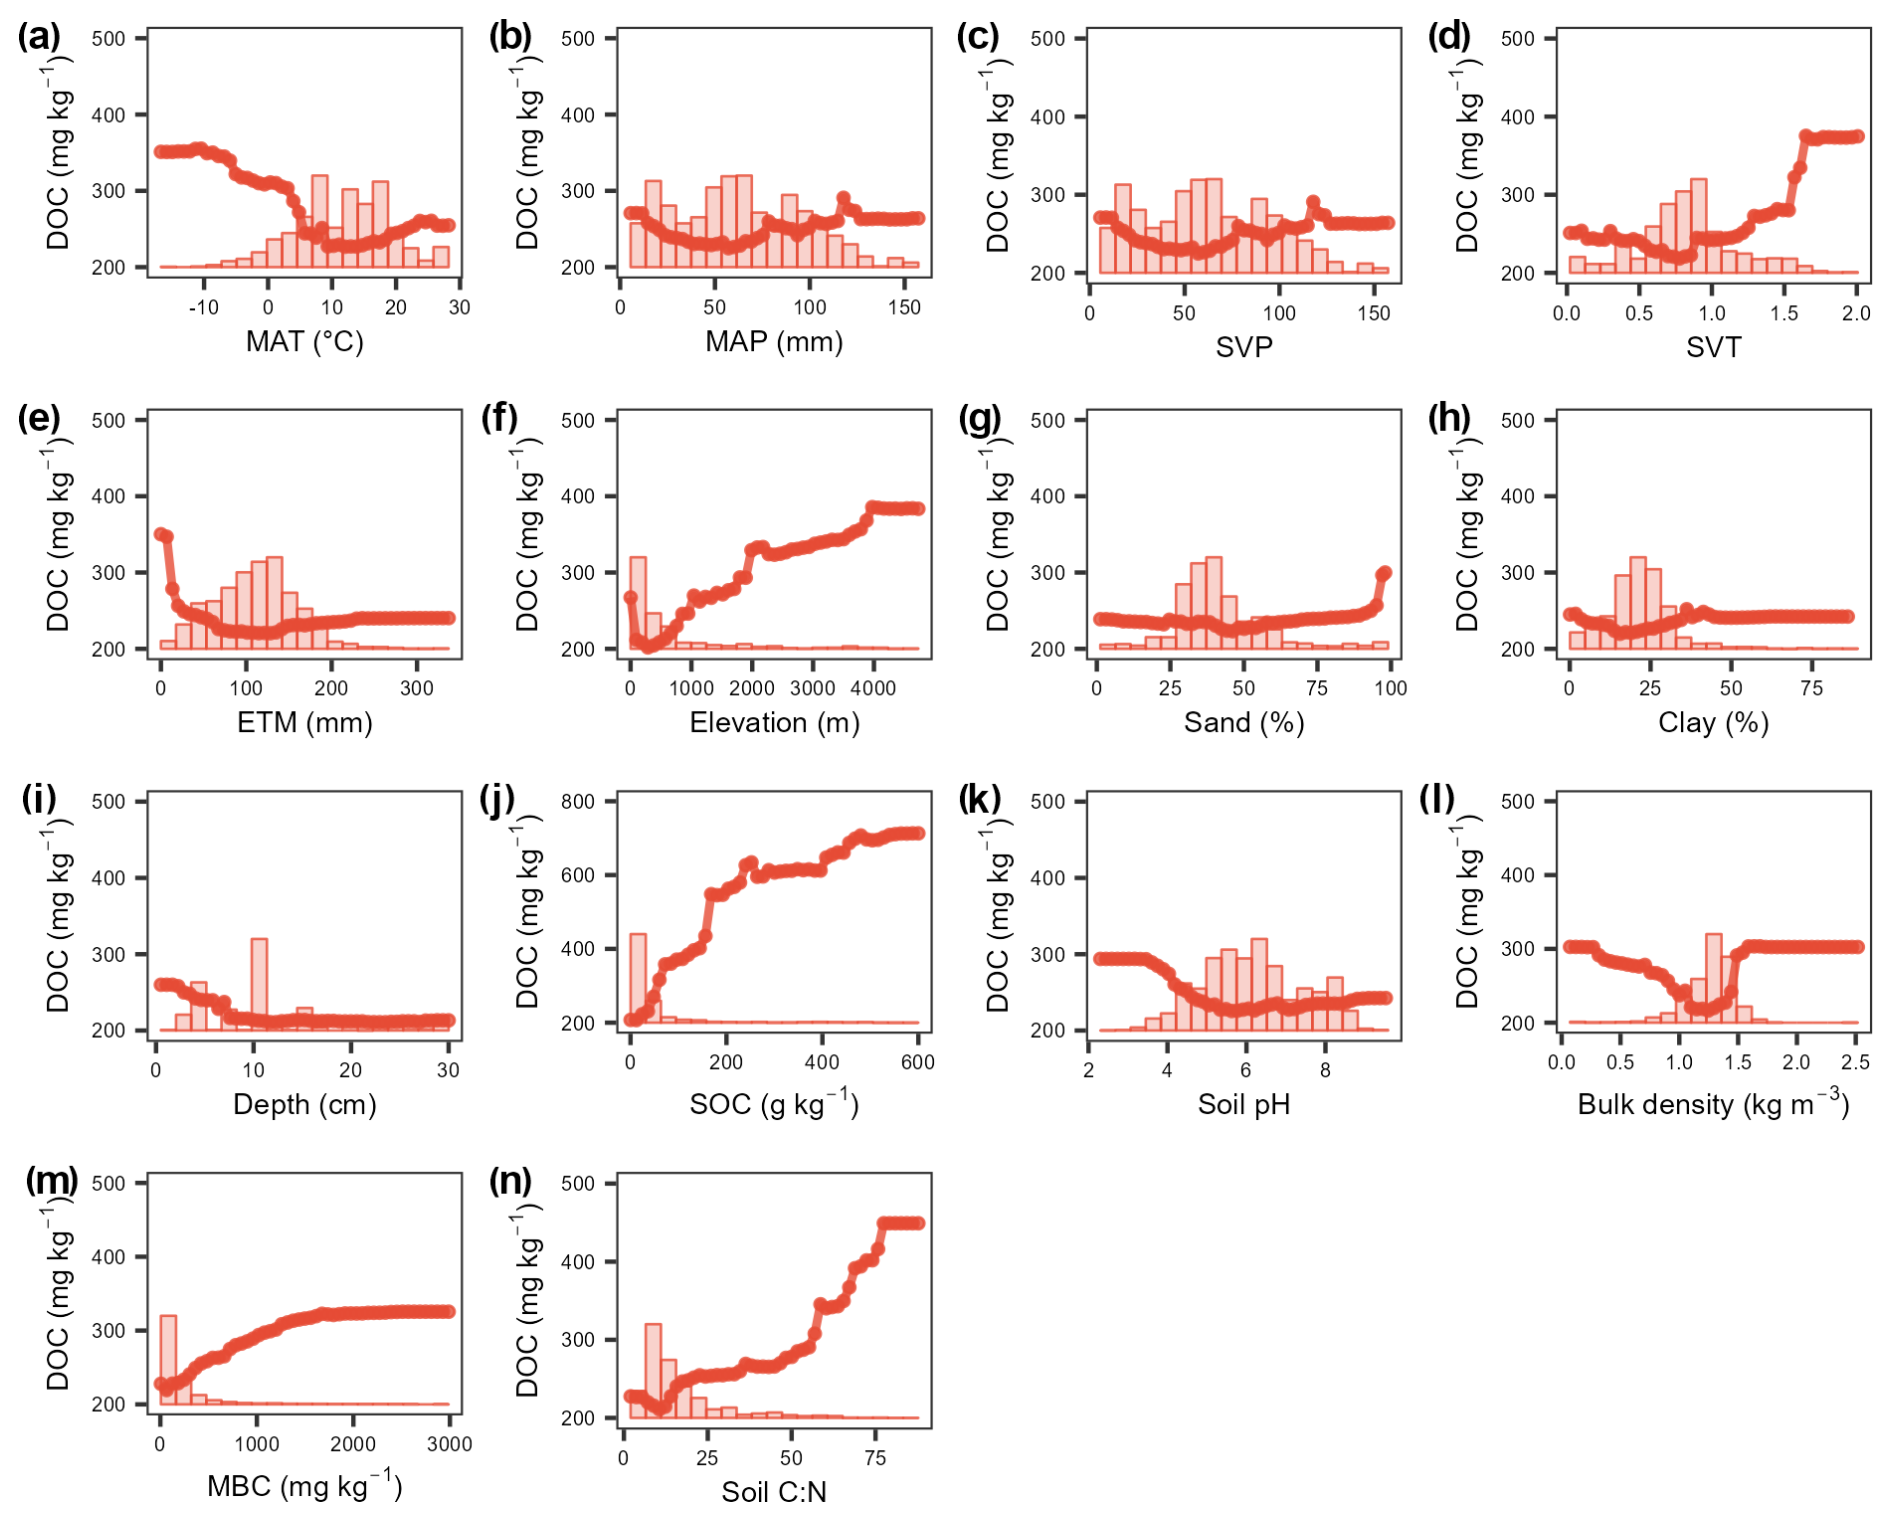
Figure 3Partial dependence of predictors from random forest algorithm. Soil dissolved organic carbon (DOC) concentration in relation to mean annual temperature (MAT), mean annual precipitation (MAP), elevation, seasonal variability of precipitation (SVP), seasonal variability of temperature (SVT), monthly evaporation (ETM), elevation, soil sand content, soil clay content, soil depth, soil organic carbon (SOC) content, soil pH, bulk density, microbial biomass carbon content (MBC), and ratio of soil carbon to nitrogen (C:N) (a, b, c, d, e, f, g, h, i, j, k, l, m, and n respectively). The histogram in each plot represents the data distribution of the x axis indicator.
Partial dependence analyses were employed to examine the relationships between predicted soil DOC and independent variables across their entire value ranges in the RF model. These analyses allowed us to isolate the effects of specific independent variables by removing the influence of the others. Partial dependence plots offered insights into the average marginal effects of one or more independent variables on model predictions. For instance, these plots could reveal whether relationships were linear, monotonic, or more complex. By examining curvature and inflection points, we could identify where variable exerted strong, immediate effects or where their influences were more subtle and possibly mediated by other variables. We reported the x axis as a standardized value, ensuring a clear progression from low to high values. When we generated partial dependence with RF, several uncertainties arose. The high model complexity sometimes slowed predictions, especially in situations with many trees. The limited interpretability of the RF models could complicate the understanding of partial dependence. Sensitivity to noise potentially led to overfitting and reduced accuracy. Variable importance measurements could also be biased by varying feature scales or categories, potentially skewing interpretations of feature-outcome relationships. To explore the interaction effects between key drivers of derived soil DOC concentration, SHapley Additive exPlanations (SHAP) was used to interpret machine learning model predictions by calculating the contribution of features to the model's predictions (Fig. 4). SHAP values can be further decomposed into main effects and interaction effects, where interaction effects reveal the interactions between features. SHAP interaction values are obtained by first defining an explainer using the TreeExplainer function (by passing the model to it), and then deriving the interaction values from this explainer. These values can be interpreted similarly to standard SHAP values, explicitly quantifying how individual features and their pairwise interactions contribute to specific predictions.
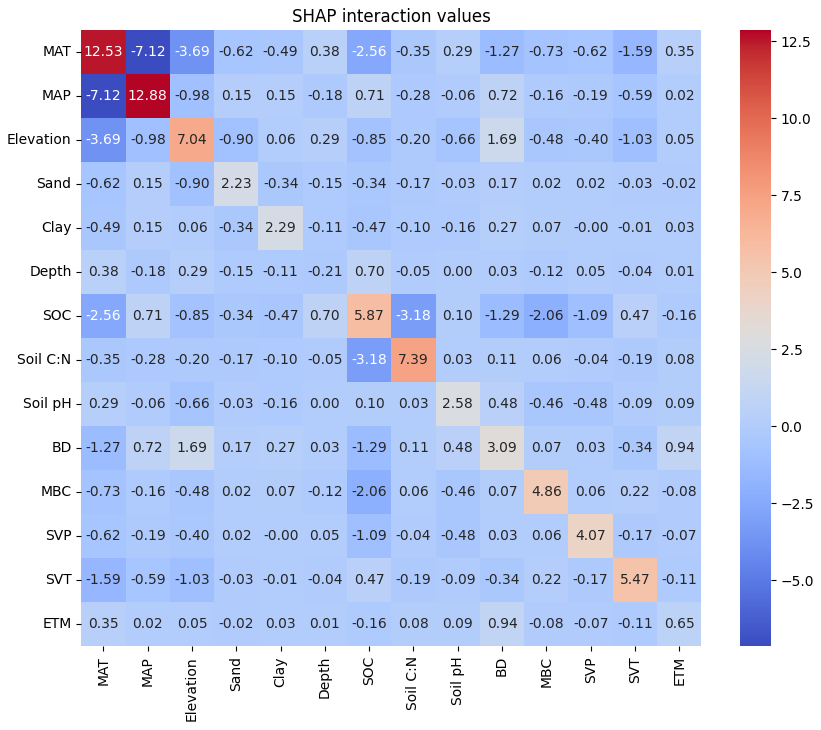
Figure 4Interaction effects between key drivers of derived soil dissolved organic carbon concentration. Key drivers included mean annual temperature (MAT), mean annual precipitation (MAP), elevation, seasonal variability of precipitation (SVP), seasonal variability of temperature (SVT), monthly evaporation (ETM), elevation, soil sand content, soil clay content, soil depth, soil organic carbon (SOC) content, soil pH, bulk density, microbial biomass carbon content (MBC), and ratio of soil carbon to nitrogen (C:N).
2.4 Global soil DOC mapping
The global distribution of soil DOC and the relative uncertainties of our predictions were generated by combining our DOC dataset with the RF model, which incorporated global climate and soil-rasterized datasets (Figs. 5, S11 and Table S1). We first produced factor maps from the key input variables, focusing on the 14 distinct variables associated with each raster cell. Subsequently, the factor maps were employed to derive a spatially detailed global map of soil DOC. To achieve global-scale mapping, we processed the driving factors at a 0.05° resolution to calculate soil DOC values. Areas that did not meet the following criteria were excluded from our prediction: (1) absence of data for any essential predictors, (2) soil order and biomes not aligning with the previously discussed aggregated land use systems, or (3) locations in climate zones outside the scope of our model's focus. Due to the different spatial resolution of input variables data, resampling techniques enabled the conversion of raster data between spatial resolutions to facilitate spatial analysis and modeling. The core principle of resampling involves estimating pixel values at new resolutions through interpolation or other mathematical methods. Specifically, down-sampling (high-to-low resolution conversion) requires aggregating values from multiple high-resolution pixels into a single low-resolution pixel. Up-sampling (low-to-high resolution conversion) necessitates generating new pixel values through interpolation algorithms. To evaluate uncertainty due to data resampling and unexplained variability not accounted for by the independent variables, we analyzed finer-resolution (5 km2) grids where driving factors were available. This analysis clarified the overall uncertainty inherent in our global soil DOC estimation. The corresponding map of relative uncertainty of prediction was built by displaying the standard deviation divided by the mean prediction, based on our final random forest RF model. The standard deviation reflected the range of possible predictions derived from the iterative build-up of decision trees after 500 model runs.
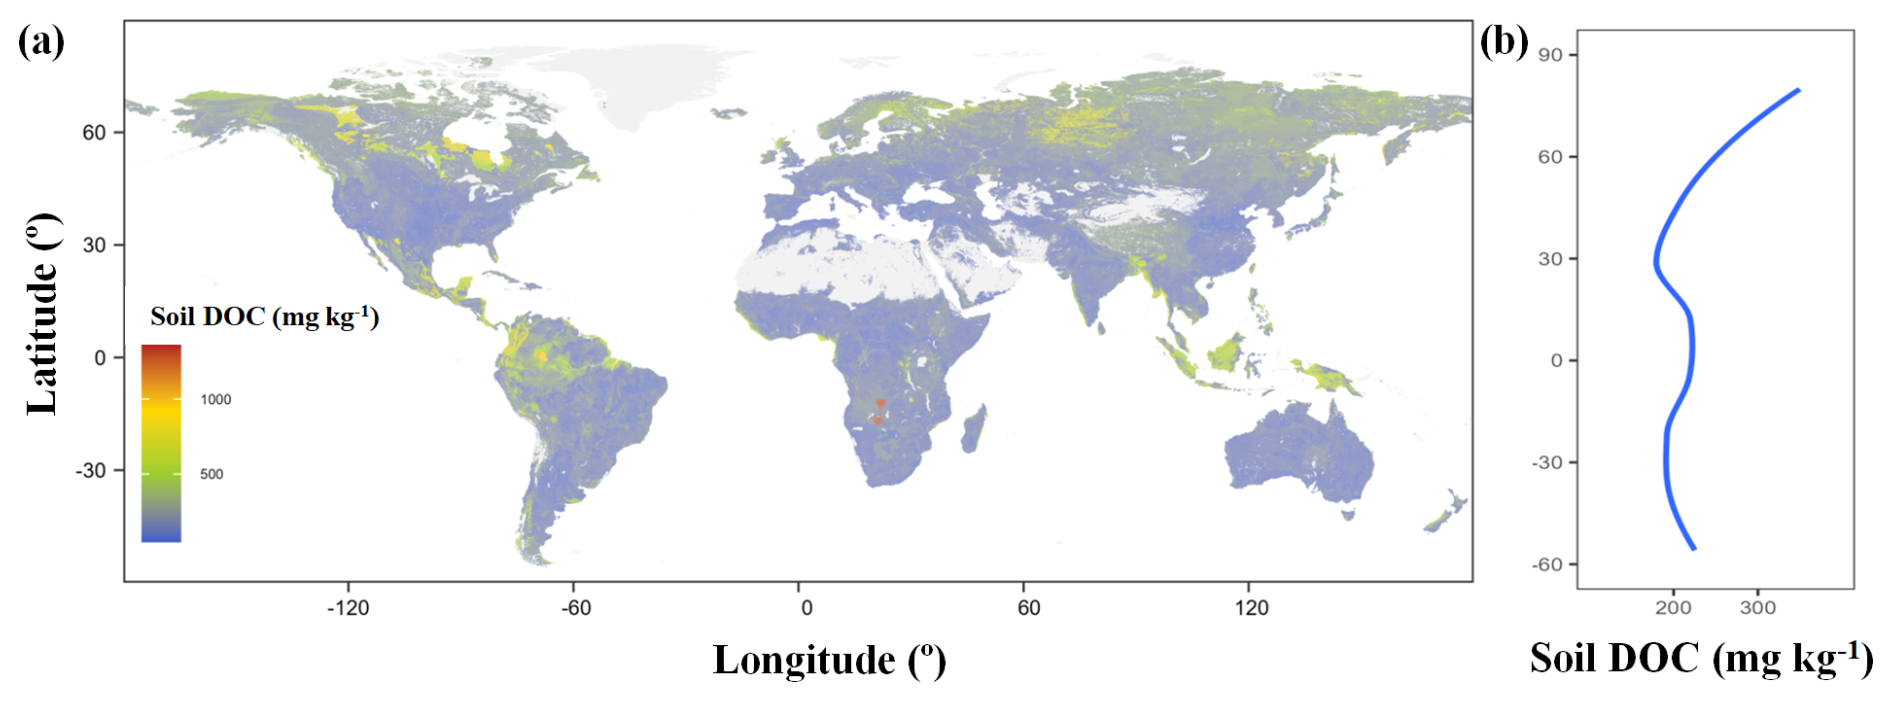
Figure 5Prediction of soil dissolved organic carbon (DOC) concentration in global ecosystems. (a) Global map of predicted soil DOC concentration. (b) Latitudinal patterns of soil DOC concentration. Blue line indicates the locally weighted regressions between latitude and soil DOC concentration in the predicted global map. Values in the predicted map reflect soil DOC concentration within a grid cell resolution of 0.05° × 0.05°. A value in the grid is the averaged result from the random forest model.
Soil DOC concentration varied significantly with ecosystems (Table 2) and soil depth (Fig. 3). Ecosystems were divided into wetland, forest, shrubland, tundra, grassland, and cropland (Fig. S10). Soil DOC concentration decreased with soil depth and reached a turning point at approximately 10 cm (Fig. 3). Therefore, when extrapolating the RF model to the entire globe, we used a month range from 1 to 12 and depths of 5 (0–10 cm) and 20 (10–30 cm). From this, we generated a total of 12 maps of global soil DOC concentration. We combined these 12 maps into a single map representing the global distribution of soil DOC concentration based on soil depth. Finally, we calculated the global soil DOC stock using the following equation applied to the combined map of global soil DOC concentration:
where SOCs is SOC stock and SOCi is SOC concentration. The subscript i is the number of global grid. BD, f, and T are soil bulk density, the volumetric percentage of coarse fraction (> 2 mm), and the depth of soil layer, respectively. M is the effective area of each grid.
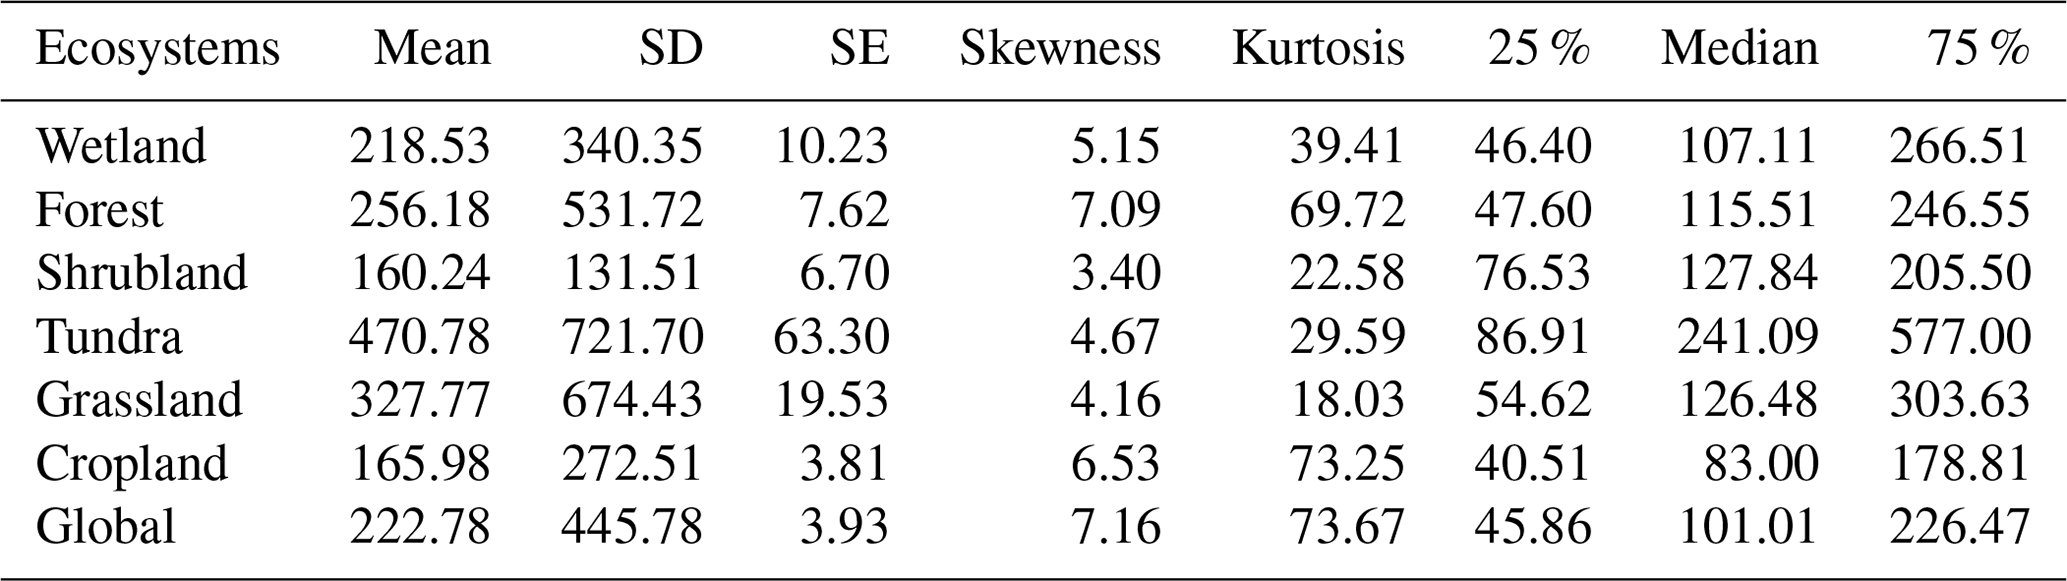
Table 2Global soil dissolved organic carbon concentration (mg kg−1) for major ecosystems. 25 % and 75 % represent the 25th and 75th percentiles of one group, respectively. SD, Standard deviation; SE, Standard error.
3.1 Soil DOC concentrations in different ecosystems globally
A total of 12 807 soil DOC observations were compiled from 975 publications that spanned six continents and all major biomes and terrestrial ecosystems (Fig. 1). We found that the natural logarithm of soil DOC concentrations conformed to a normal distribution (Fig. 1b). Global soil DOC concentrations ranged from 0.04 to 7859 mg kg−1. The global average, median, and standard deviation were 222.78, 101.01, and 445.78 mg kg−1, respectively (Table 2). We observed that soil DOC concentrations varied across ecosystems. Tundra had the highest average and median soil DOC concentrations at 470.78 and 241.90 mg kg−1, respectively. Grassland averaged 327.77 mg kg−1 with a median of 126.48 mg kg−1, while forest averaged 256.18 mg kg−1 with a median of 115.51 mg kg−1. Wetland averaged 218.53 mg kg−1 with a median of 107.11 mg kg−1, cropland averaged 165.98 mg kg−1 with a median of 83.00 mg kg−1, and shrubland averaged 160.24 mg kg−1 with a median of 127.84 mg kg−1 (Table 2).
3.2 Model performance and drivers of soil DOC concentrations
We estimated RMSE and R2 for all tuned models and used these statistics to analyze residual variance and accuracy, as well as to rank model performance (Table S2). To facilitate interpretation of uncertainty, we also calculated relative RMSE by dividing the absolute error by the global mean soil DOC concentration. The RF model resulted in the best performance within 1 standard error of the minimal RMSE and was thus used for further analyses of variable importance. The residual plots of training, validation, and test data for the RF model were randomly distributed near zero (Fig. S8). Overall, nonlinear models (R2 = 0.41–0.63; RMSE = 248–327) outperformed linear models (R2 = 0.10–0.11; RMSE = 401–411) (Table S2). The RF model yielded the lowest RMSE, within one standard deviation range, and was therefore selected for subsequent analyses of variable importance (Table S2). The relative importance of soil DOC drivers and the global map of soil DOC distribution were derived from the RF model outputs (Figs. 4 and S11).
The RF model explained 63 % of the variability in soil DOC concentrations across all sites and achieved the lowest RMSE compared with other models (Fig. 2 and Table S2). Elevation played the most important predictor for soil DOC prediction among the selected 14 variables, followed by SOC, SVT, and soil clay. The relative importance of MAP, SVP, MBC, soil pH, soil sand, and soil C:N gradually diminished. Meanwhile, elevation, SOC, SVT, soil sand, and soil clay were the more sensitive factors of the RF model than the other predictors (Fig. S9). Partial dependence analysis produced results (Fig. 3) similar to Pearson correlation analyses (Fig. S4). We found a positive correlation between soil DOC and both elevation and soil organic carbon, although there were fewer data points corresponding to higher elevations and greater soil organic carbon values (Fig. 3f). Soil DOC showed a trend of decreasing first and then increasing with the increase of MAT (0–30°), SVT (0–1.5), and soil clay (0 %–50 %) (Fig. 3a, d and h). Soil DOC showed a trend of decreasing first and then stabilizing with the increase of soil depth and soil pH (4–8.5). The inflection point of soil depth and soil pH was 10 cm and 5.8, respectively (Fig. 3i and k). Elevation, SOC, SVT, and soil clay had strong negative interactions with MAT (Fig. 4). This means as the MAT variable increased, the influence of the other variables weakened. Elevation had a positive interaction with bulk density, suggesting they work together to affect soil DOC.
3.3 Global soil DOC patterns
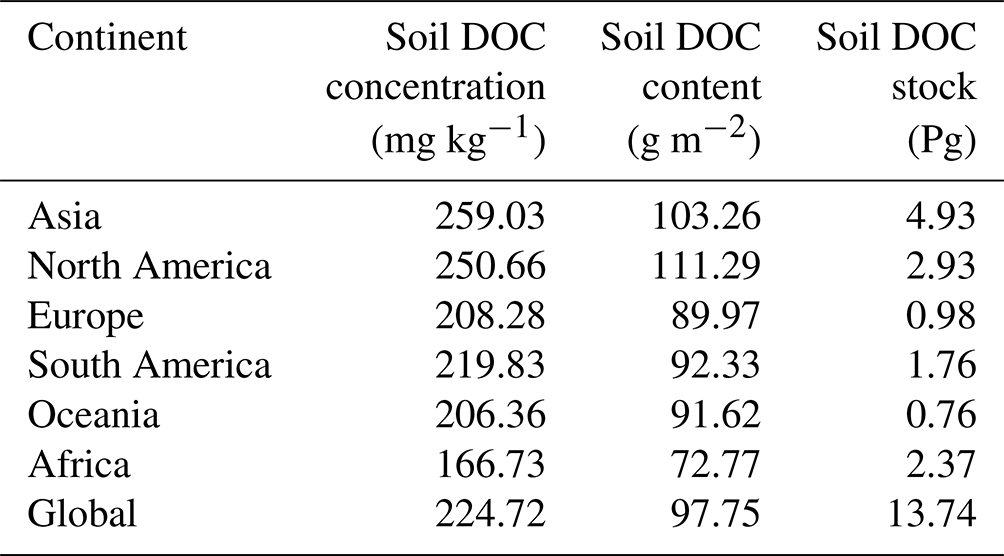
The RF model has the ability to predict soil DOC in wetland (R2= 0.87), forest (R2= 0.85), shrubland (R2= 0.85), tundra (R2= 0.77), grassland (R2= 0.96), and cropland (R2= 0.90) (Fig. S10). We observed significant spatial heterogeneity in predicted global soil DOC concentrations (Fig. 5a). Soil DOC concentrations increased from the Equator toward the poles (Fig. 5b). High soil DOC concentrations were found in high-altitude plateaus and mountain ranges at low latitudes, including the Andes, African Highlands, and West Indies (Fig. 5a). The global average soil DOC concentration was 224.72 mg kg−1 (Table 3), and the topsoil (0–30 cm) DOC stock was 13.74 Pg. Asia had the highest soil DOC concentration (259.03 mg kg−1), followed by North America (250.66 mg kg−1), South America (219.83 mg kg−1), Europe (208.28 mg kg−1), and Oceania (206.36 mg kg−1). Africa had the lowest soil DOC concentrations (166.73 mg kg−1). For predicted soil DOC stocks, Asia and North America remained ranked first and second at 4.93 and 2.93 Pg, respectively. Despite its relatively low predicted soil DOC concentrations, Africa ranked third in total DOC stock (2.37 Pg) because of its large land area. South America followed at 1.76 Pg, while Europe and Oceania had the lowest stocks at 0.98 and 0.76 Pg, respectively.
Table 3Analysis of the predicted global map of soil dissolved organic carbon. The area-weighted average soil dissolved organic carbon concentration was calculated based on our predicted map. Converting soil dissolved organic carbon concentration to soil dissolved organic carbon content and stock used the soil bulk density and land area.
4.1 Effects of elevation and soil properties on soil DOC concentrations
The most critical predictors of soil DOC concentrations among the selected 14 variables were elevation (Fig. 2), with soil DOC concentrations exhibiting a significant positive correlation with elevation after controlling for confounding variables (Fig. 3f). This finding contrasted with several previous studies that prioritized precipitation regimes (Guo et al., 2020b) or soil texture (Angst et al., 2021) as primary soil DOC drivers, suggesting that elevation effects may have been obscured in large-scale analyses lacking environmental stratification. Three interconnected mechanisms may explain this pattern of elevation effects. First, decreasing temperatures in high-altitude regions (0.6 °C 100 m−1 adiabatic lapse rate) limit the metabolic activity of microorganisms (Davidson and Janssens, 2006), slowing the decomposition of soil DOC and favoring soil DOC accumulation through reduced mineralization. Additionally, these regions typically receive more precipitation, which increases soil moisture and helps protect soil DOC from rapid breakdown. High-altitude regions often experience distinct precipitation patterns and soil moisture conditions compared with lower elevations (Li et al., 2023). Higher precipitation and lower evaporation rates may promote greater dissolution and leaching of organic matter, thereby increasing soil DOC concentrations (He et al., 2021; Lu et al., 2019). Second, the altitudinal shift in vegetation communities, particularly the transition to coniferous species and ericaceous shrubs at higher elevations, enhances labile carbon inputs through distinct litter chemistry (higher phenolic compounds and lower C:N ratios), which created a positive feedback loop for DOC production (Pesántez et al., 2018; Wei et al., 2024). Third, the orographic precipitation effect and persistent cloud immersion at higher elevations maintain soil moisture conditions that simultaneously stimulate DOC release from organic matter while limiting its lateral export through reduced drainage flux (Michalzik et al., 2001). Moreover, high-altitude areas are generally less disturbed by humans activities, which may help preserve soil DOC. Our results also indicated that soils in low-latitude plateaus and mountain ranges (e.g., Tibetan Plateau, Andes, African Highlands, and West Indies) exhibited higher DOC concentrations (Fig. 5a). These results fundamentally recalibrated our understanding of topographic controls on soil carbon cycling, which provided a mechanistic basis for predicting climate feedbacks in vertically stratified landscapes.
The effects of soil clay content on DOC concentrations are complex, involving adsorption, water retention, microbial activities, and organic matter protection mechanisms (Kaiser and Zech, 2000; Singh et al., 2017). Generally, high clay content fosters DOC accumulation through the adsorption and stabilization of organic matter (Gmach et al., 2019; Kalbitz et al., 2000). Our findings revealed a nonlinear threshold control of soil clay content on soil DOC with minimum DOC concentrations occurring at 20 % clay (Fig. 3h), which was a pedogenic tipping point where the dominant regulatory mechanisms shift from physicochemical stabilization to biogeochemical accumulation. In soils with clay content below this threshold, increasing clay promotes organo-mineral association through Fe/Al-oxide bridging and exponential growth of specific surface area (Sanders et al., 2021), which effectively sequester labile organic carbon into micro-aggregates while suppressing soil DOC release. Beyond 20 % clay, however, the emergence of impermeable microstructures reduces oxygen diffusion, establishing anaerobic microsites that inhibit phenol oxidase activity and accumulate phenolic metabolites (Awedat et al., 2021). This shift coincides with clay-organic co-precipitation dynamics: high-clay soils (> 25 %) exhibit stronger preferential dissolution of Fe–OM complexes during redox oscillations (Awedat et al., 2021). Furthermore, SOC serves as the main source of DOC, so higher SOC results in more DOC release through microbial metabolism (Kalbitz et al., 2000; Neff and Asner, 2001).
4.2 Effects of climate on soil DOC concentrations
Seasonal temperature variability (SVT) was the predominant climatic driver of soil DOC, exhibiting a nonlinear threshold response where soil DOC concentrations initially decline but shift to an increasing trend beyond an SVT threshold of 0.7 after accounting for confounding factors (Fig. 3d). This contrasts sharply with previous studies that primarily attributed soil DOC fluctuations to mean annual temperature or precipitation (Guo et al., 2020b) or emphasized moisture variability over thermal regimes (Li et al., 2018). This makes our work the first study to identify SVT-driven biphasic DOC behavior in global terrestrial ecosystem. Three interconnected mechanisms could explain this pattern. First, moderate SVT levels (< 0.7) likely enhance microbial carbon use efficiency by promoting enzymatic acclimation to predictable thermal fluctuations, which reduce soil DOC accumulation through efficient mineralization (Ren et al., 2024b). Second, surpassing the 0.7 SVT threshold destabilizes microbial communities through repeated thermal shocks, which increase cell lysis and releasing labile organic compounds into the soil matrix (Zhou et al., 2024b). Third, extreme temperature variability alters soil physical structure by disrupting aggregate stability and exposes previously protected organic matter to solubilization during thermal contraction-expansion cycles (Six et al., 2004). The observed DOC rebound at high SVT aligns with plant root exudation strategies under thermal stress, which suggested that vegetation may compensate for microbial carbon loss by releasing soluble metabolites to maintain rhizosphere functionality (Kruthika et al., 2024). Overall, the identified SVT threshold (0.7) serves as an early warning indicator for ecosystems approaching critical thermal instability, particularly in climate transition zones where seasonal temperature swings are intensifying. Practically, this threshold could guide land management strategies. For instance, prioritizing organic amendments or shade crops in regions with SVT > 0.7 may mitigate soil DOC leaching risks.
4.3 Global patterns of soil DOC
Using our soil DOC concentration dataset, we quantified the soil DOC concentrations (0–30 cm) in terrestrial ecosystems, identified their key driving factors, and produced global predictions. Global DOC stocks in the topsoil are estimated at 13.74 Pg C, accounting for 0.87 % of global soil organic carbon, which is significantly higher than previous estimates (Guo et al., 2020b). Our predictions indicated that soil DOC concentrations decreased markedly toward lower latitudes, particularly in the Northern Hemisphere. Previous global maps of soil DOC concentrations failed to capture this latitudinal trend, likely due to limited spatial coverage (Guo et al., 2020b; Langeveld et al., 2020). Our predicted map shows that soil DOC concentrations increase with latitude. In high-latitude regions, low temperatures limit microbial activity, which slows the decomposition of organic matter and leads to more organic carbon being retained in dissolved form (Patoine et al., 2022), thereby increasing soil DOC concentrations. In addition, soils in high-latitude areas are often moist or frozen due to low temperatures, limiting oxygen supply and further inhibiting microbial decomposition (Zhou et al., 2024b). These moist or frozen conditions also help protect organic matter, reducing its decomposition and contributing to DOC accumulation. Thus, low temperatures and specific moisture conditions in high-latitude regions jointly result in relatively high soil DOC concentrations. However, substantial heterogeneity exists at regional and local scales. For instance, despite their similar latitudes, soil DOC concentrations in Northern Europe were significantly lower than in Siberia, primarily due to differences in climatic conditions. Northern Europe's maritime climate, with mild temperatures and evenly distributed precipitation, promotes higher microbial activity and accelerates organic matter decomposition. In contrast, Siberia's cold subarctic climate results in lower soil temperatures that limit microbial activity and slow organic matter decomposition, leading to greater DOC retention (Jin and Ma, 2021). Furthermore, soils in Siberia are often frozen, restricting oxygen supply and further inhibiting decomposition, thereby contributing to DOC accumulation (Raudina et al., 2022). Climatic conditions thus play a key role in explaining the significant differences in soil DOC concentrations between these regions. Regional variations may also be related to topographic conditions. Higher soil DOC concentrations on the Tibetan Plateau compared with Eastern China may result from high elevation and low MAT in the plateau (Fig. 5a). In contrast, other studies reported lower DOC levels in Arctic regions, which may have been due to omitting DOC concentration measurements in dry or frozen soils (Langeveld et al., 2020). Our predictive model offered higher accuracy in estimating global soil DOC storage because our comprehensive dataset included DOC concentrations in both dry soil and soil solutions, providing a robust data foundation. In addition, we used the optimal model by comparing various linear and nonlinear models to predict global soil DOC.
4.4 Limitations and predictive uncertainties
Although we compiled a comprehensive global soil DOC concentration dataset, identified key drivers, and made a global prediction, our study has certain limitations. First, certain ecosystems remained underrepresented. For instance, tundra accounted for only 1 % of our database, while shrublands, grasslands, and wetlands collectively constituted only 21 %. This underrepresentation may reduce the accuracy of predictions for different ecosystems. Second, although we considered the subsoil at the beginning of dataset, we did not explore this further due to the limited availability of data and considerations of predictive accuracy. We intend to continue expanding the subsoil DOC database in future work. Third, there was a deficiency in some predictive variables: although we had extracted missing data through gridded datasets, this inevitably introduced uncertainty in predictions, particularly for soil variables. Fourth, although data standardization enabled consistent comparison and analysis of soil DOC across different measurement methods, there were potential issues such as the possible loss of original data characteristics, dependence on accurate parameters, overgeneralization, increasing the complexity of data interpretation, and introducing bias. Finally, despite employing advanced machine learning methods with multiple predictors to predict the global soil DOC, 35 % of soil DOC concentration variability remains unexplained. However, these limitations also highlighted areas for future soil DOC research. Future research should enhance the collection of deep soil samples to address the current data scarcity and more accurately quantify the DOC reserves across the entire soil profile. There is a particular need to increase sample collection in key regions such as Siberia and Africa.
The global soil DOC database in this study and the raw dataset of driving factors can be downloaded at https://doi.org/10.6084/m9.figshare.28574183 (Ren and Cai, 2025).
Through the development of a comprehensive soil DOC dataset, we quantified soil DOC concentrations in terrestrial ecosystems, identified their driving factors, and made global predictions. After comparing multiple predictive models, we selected the random forest model as the best performer for mapping soil DOC concentrations. The results indicated that tundra exhibited the highest DOC concentrations, while shrubland and cropland soils had relatively lower concentrations. Elevation played the most important predictor for soil DOC prediction, followed by SOC, SVT, and soil clay. There was a nonlinear threshold response of soil DOC to soil clay and SVT, which initially decline but shift to an increasing trend beyond an soil clay threshold of 20 % and SVT threshold of 0.7 after accounting for confounding factors. We predicted that the soil DOC concentration increased significantly from the Equator to the poles and estimated that the DOC stocks in the topsoil of terrestrial ecosystems were 13.74 Pg. The global soil DOC database we created serves as a critical resource for future research and enhances our understanding of the roles of soil in the global carbon cycle. This database provides valuable data support for climate change research, ecosystem management, agricultural sustainability, environmental policymaking, and the improvement of biogeochemical models. It aids in addressing soil degradation, improving food security, and tackling global environmental challenges.
The supplement related to this article is available online at https://doi.org/10.5194/essd-17-2873-2025-supplement.
AC designed this study. TR collected the data. TR and AC discussed analyzing methods. AC conducted the analysis. TR drafted the manuscript. TR and AC discussed the results and contributed to the manuscript.
The contact author has declared that neither of the authors has any competing interests.
Publisher’s note: Copernicus Publications remains neutral with regard to jurisdictional claims made in the text, published maps, institutional affiliations, or any other geographical representation in this paper. While Copernicus Publications makes every effort to include appropriate place names, the final responsibility lies with the authors.
We would like to thank Frank Boehm at NanoApps Consulting, 2341 York Ave., Vancouver, BC, Canada, for his assistance with English language and grammatical editing of an earlier draft of the manuscript.
This research has been supported by the National Key Research and Development Program of China (grant no. 2022YFD2300500).
This paper was edited by Jiafu Mao and reviewed by three anonymous referees.
Andersson, S., and Nilsson, S. I.: Influence of pH and temperature on microbial activity, substrate availability of soil-solution bacteria and leaching of dissolved organic carbon in a mor humus, Soil Biol. Biochem., 33, 1181–1191, https://doi.org/10.1016/S0038-0717(01)00022-0, 2001.
Angst, G., Pokorn, J., Mueller, C. W., Prater, I., Preusser, S., Kandeler, E., Meador, T., Straková, P., Hájek, T., and Buiten, G. V.: Soil texture affects the coupling of litter decomposition and soil organic matter formation, Soil Biol. Biochem., 159, 108302, https://doi.org/10.1016/j.soilbio.2021.108302, 2021.
Awedat, A. M., Zhu, Y., Bennett, J. M., and Raine, S. R.: The impact of clay dispersion and migration on soil hydraulic conductivity and pore networks, Geoderma, 404, 115297, https://doi.org/10.1016/j.geoderma.2021.115297, 2021.
Camino-Serrano, M., Gielen, B., Luyssaert, S., Ciais, P., Vicca, S., Guenet, B., Vos, B. D., Cools, N., Ahrens, B., Altaf Arain, M., Borken, W., Clarke, N., Clarkson, B., Cummins, T., Don, A., Pannatier, E. G., Laudon, H., Moore, T., Nieminen, T. M., and Janssens, I.: Linking variability in soil solution dissolved organic carbon to climate, soil type, and vegetation type, Global Biogeochem. Cy., 28, 497–509, https://doi.org/10.1002/2013gb004726, 2014.
Cotrufo, M. F. and Lavallee, J. M.: Soil organic matter formation, persistence, and functioning: A synthesis of current understanding to inform its conservation and regeneration, Adv. Agron., 172, 1–66, https://doi.org/10.1016/bs.agron.2021.11.002, 2022.
Davidson, E. A. and Janssens, I. A.: Temperature sensitivity of soil carbon decomposition and feedbacks to climate change, Nature, 440, 165–173, https://doi.org/10.1038/nature04514, 2006.
Ding, H., Hu, Q., Cai, M., Cao, C., and Jiang, Y.: Effect of dissolved organic matter (DOM) on greenhouse gas emissions in rice varieties, Agriculture, Ecosystems & Environment, 330, 107870, https://doi.org/10.1016/j.agee.2022.107870, 2022.
Drake, T. W., Raymond, P. A., and Spencer, R. G.: Terrestrial carbon inputs to inland waters: A current synthesis of estimates and uncertainty, Limnology and Oceanography Letters, 3, 132–142, https://doi.org/10.1002/lol2.10055, 2018.
Fichot, C. G., Tzortziou, M., and Mannino, A.: Remote sensing of dissolved organic carbon (DOC) stocks, fluxes and transformations along the land-ocean aquatic continuum: Advances, challenges, and opportunities, Earth-Sci. Rev., 242, 104446, https://doi.org/10.1016/j.earscirev.2023.104446, 2023.
Gmach, M. R., Cherubin, M. R., Kaiser, K., and Cerri, C. E. P.: 80 Processes that influence dissolved organic matter in the soil: a review, Sci. Agr., 77, e20180164, https://doi.org/10.1590/1678-992x-2018-0164, 2019.
Gmach, M. R., Cherubin, M. R., Kaiser, K., and Cerri, C. E. P.: Processes that influence dissolved organic matter in the soil: a review, Sci. Agr., 77, e20180164, https://doi.org/10.1590/1678-992x-2018-0164, 2020.
Guo, B., Zheng, X., Yu, J., Ding, H., Pan, B., Luo, S., and Zhang, Y.: Dissolved organic carbon enhances both soil N2O production and uptake, Global Ecology and Conservation, 24, e01264, https://doi.org/10.1016/j.gecco.2020.e01264, 2020a.
Guo, Z., Wang, Y., Wan, Z., Zuo, Y., He, L., Li, D., Yuan, F., Wang, N., Liu, J., Song, Y., Song, C., Xu, X., and Hickler, T.: Soil dissolved organic carbon in terrestrial ecosystems: Global budget, spatial distribution and controls, Global Ecol. Biogeogr., 29, 2159–2175, https://doi.org/10.1111/geb.13186, 2020b.
He, X., Augusto, L., Goll, D. S., Ringeval, B., Wang, Y., Helfenstein, J., Huang, Y., Yu, K., Wang, Z., Yang, Y., and Hou, E.: Global patterns and drivers of soil total phosphorus concentration, Earth Syst. Sci. Data, 13, 5831–5846, https://doi.org/10.5194/essd-13-5831-2021, 2021.
Jin, H. and Ma, Q.: Impacts of permafrost degradation on carbon stocks and emissions under a warming climate: a review, Atmosphere, 12, 1425, https://doi.org/10.3390/atmos12111425, 2021.
Kaiser, K. and Zech, W.: Dissolved organic matter sorption by mineral constituents of subsoil clay fractions, J. Plant Nutr. Soil Sc., 163, 531–535, https://doi.org/10.1002/1522-2624(200010)163:5%3C531::AID-JPLN531%3E3.0.CO;2-N, 2000.
Kalbitz, K., Solinger, S., Park, J.-H., Michalzik, B., and Matzner, E.: Controls on the dynamics of dissolved organic matter in soils: a review, Soil Sci., 165, 277–304, https://doi.org/10.1097/00010694-200004000-00001, 2000.
Kruthika, S., Ashu, A., Anand, A., Sammi Reddy, K., Vara Prasad, P. V., and Gurumurthy, S.: Unveiling the role of root exudates in plant adaptation to drought and heat stress, Journal of Crop Health, 76, 941–955, https://doi.org/10.1007/s10343-024-01013-8, 2024.
Lal, R.: Soil carbon sequestration impacts on global climate change and food security, Science, 304, 1623–1627, https://doi.org/10.1126/science.1097396, 2004.
Langeveld, J., Bouwman, A. F., van Hoek, W. J., Vilmin, L., Beusen, A. H., Mogollón, J. M., and Middelburg, J. J.: Estimating dissolved carbon concentrations in global soils: a global database and model, SN Applied Sciences, 2, 1626, https://doi.org/10.1007/s42452-020-03290-0, 2020.
Lee, H., Calvin, K., Dasgupta, D., Krinner, G., Mukherji, A., Thorne, P., Trisos, C., Romero, J., Aldunce, P., and Barret, K.: IPCC, 2023: Climate Change 2023: Synthesis report, Summary for policymakers, Contribution of working groups I, II and III to the sixth assessment report of the intergovernmental panel on climate change, edited by: Core Writing Team, Lee, H. and Romero, J., IPCC, Geneva, Switzerland, 34 pp., https://cir.nii.ac.jp/crid/1360019997669261824 (last access: 2 March 2025), 2023.
Li, J., Wu, B., Zhang, D., and Cheng, X.: Elevational variation in soil phosphorus pools and controlling factors in alpine areas of Southwest China, Geoderma, 431, 116361, https://doi.org/10.1016/j.geoderma.2023.116361, 2023.
Li, S., Zheng, X., Liu, C., Yao, Z., Zhang, W., and Han, S.: Influences of observation method, season, soil depth, land use and management practice on soil dissolvable organic carbon concentrations: A meta-analysis, Sci. Total Environ., 631–632, 105–114, https://doi.org/10.1016/j.scitotenv.2018.02.238, 2018.
Lønborg, C., Carreira, C., Jickells, T., and Álvarez-Salgado, X. A.: Impacts of global change on ocean dissolved organic carbon (DOC) cycling, Frontiers in Marine Science, 7, 466, https://doi.org/10.3389/fmars.2020.00466, 2020.
Lu, S., Xu, Y., Fu, X., Xiao, H., Ding, W., and Zhang, Y.: Patterns and drivers of soil respiration and vegetation at different altitudes in Southern China, Appl. Ecol. Env. Res., 17, 3097–3106, https://doi.org/10.15666/aeer/1702_30973106, 2019.
Michalzik, B., Kalbitz, K., Park, J. H., Solinger, S., and Matzner, E.: Fluxes and concentrations of dissolved organic carbon and nitrogen – a synthesis for temperate forests, Biogeochemistry, 52, 173–205, https://doi.org/10.1023/A:1006441620810, 2001.
Nakhavali, M., Lauerwald, R., Regnier, P., Guenet, B., Chadburn, S., and Friedlingstein, P.: Leaching of dissolved organic carbon from mineral soils plays a significant role in the terrestrial carbon balance, Glob. Change Biol., 27, 1083–1096, https://doi.org/10.1111/gcb.15460, 2021.
Neff, J. C., and Asner, G. P.: Dissolved organic carbon in terrestrial ecosystems: synthesis and a model, Ecosystems, 4, 29–48, 2001.
Patoine, G., Eisenhauer, N., Cesarz, S., Phillips, H. R. P., Xu, X., Zhang, L., and Guerra, C. A.: Drivers and trends of global soil microbial carbon over two decades, Nat. Commun., 13, 4195, https://doi.org/10.1038/s41467-022-31833-z, 2022.
Pesántez, J., Mosquera, G. M., Crespo, P., Breuer, L., and Windhorst, D.: Effect of land cover and hydro-meteorological controls on soil water DOC concentrations in a high-elevation tropical environment, Hydrol. Process., 32, 2624–2635, https://doi.org/10.1002/hyp.13224, 2018.
Raudina, T. V., Smirnov, S. V., Lushchaeva, I. V., Istigechev, G. I., Kulizhskiy, S. P., Golovatskaya, E. A., Shirokova, L. S., and Pokrovsky, O. S.: Seasonal and spatial variations of dissolved organic matter biodegradation along the aquatic continuum in the Southern Taiga bog complex, Western Siberia, Water, 14, 3969, https://doi.org/10.3390/w14233969, 2022.
Ren, C., Zhou, Z., Delgado-Baquerizo, M., Bastida, F., Zhao, F., Yang, Y., Zhang, S., Wang, J., Zhang, C., Han, X., Wang, J., Yang, G., and Wei, G.: Thermal sensitivity of soil microbial carbon use efficiency across forest biomes, Nat. Commun., 15, 6269, https://doi.org/10.1038/s41467-024-50593-6, 2024a.
Ren, T. and Cai, A.: Global patterns and drivers of soil dissolved organic carbon concentrations, figshare [data set], https://doi.org/10.6084/m9.figshare.28574183, 2025.
Ren, T., Tang, S., Han, T., Wang, B., Zhou, Z., Liang, G., Li, Y. E., and Cai, A.: Positive rhizospheric effects on soil carbon are primarily controlled by abiotic rather than biotic factors across global agroecosystems, Geoderma, 430, 116337, https://doi.org/10.1016/j.geoderma.2023.116337, 2023.
Ren, T., Ukalska-Jaruga, A., Smreczak, B., and Cai, A.: Dissolved organic carbon in cropland soils: A global meta-analysis of management effects, Agriculture, Ecosystems & Environment, 371, 109080, https://doi.org/10.1016/j.agee.2024.109080, 2024b.
Sanders, E. D., Pereira, A., and Paulino, G. H.: Optimal and continuous multilattice embedding, Science Advances, 7, eabf4838, https://doi.org/10.1126/sciadv.abf4838, 2021.
Schlesinger, W. H. and Bernhardt, E. S.: The atmosphere, Biogeochemistry, 12, 51–97, https://doi.org/10.1016/B978-0-12-814608-8.00003-7, 2020.
Singh, M., Sarkar, B., Hussain, S., Ok, Y. S., Bolan, N. S., and Churchman, G. J.: Influence of physico-chemical properties of soil clay fractions on the retention of dissolved organic carbon, Environ. Geochem. Hlth., 39, 1335–1350, https://doi.org/10.1007/s10653-017-9939-0, 2017.
Six, J., Bossuyt, H., Degryze, S., and Denef, K.: A history of research on the link between (micro)aggregates, soil biota, and soil organic matter dynamics, Soil Till. Res., 79, 7–31, https://doi.org/10.1016/j.still.2004.03.008, 2004.
Smreczak, B. and Ukalska-Jaruga, A.: Dissolved organic matter in agricultural soils, Soil Science Annual, 72, 1–10, https://doi.org/10.37501/soilsa/132234, 2021.
Sokol, N. W., Slessarev, E., Marschmann, G. L., Nicolas, A., Blazewicz, S. J., Brodie, E. L., Firestone, M. K., Foley, M. M., Hestrin, R., and Hungate, B. A.: Life and death in the soil microbiome: how ecological processes influence biogeochemistry, Nat. Rev. Microbiol., 20, 415–430, https://doi.org/10.1038/s41579-022-00695-z, 2022.
Wei, D., Tao, J., Wang, Z., Zhao, H., Zhao, W., and Wang, X.: Elevation-dependent pattern of net CO2 uptake across China, Nat. Commun., 15, 2489, https://doi.org/10.1038/s41467-024-46930-4, 2024.
Zhao, X., Tian, P., Sun, Z., Liu, S., Wang, Q., and Zeng, Z.: Rhizosphere effects on soil organic carbon processes in terrestrial ecosystems: A meta-analysis, Geoderma, 412, 115739, https://doi.org/10.1016/j.geoderma.2022.115739, 2022.
Zhou, Z., Ren, C., Wang, C., Delgado-Baquerizo, M., Luo, Y., Luo, Z., Du, Z., Zhu, B., Yang, Y., Jiao, S., Zhao, F., Cai, A., Yang, G., and Wei, G.: Global turnover of soil mineral-associated and particulate organic carbon, Nat. Commun., 15, 5329, https://doi.org/10.1038/s41467-024-49743-7, 2024a.
Zhou, Z., Wang, C., Cha, X., Zhou, T., Pang, X., Zhao, F., Han, X., Yang, G., Wei, G., and Ren, C.: The biogeography of soil microbiome potential growth rates, Nat. Commun., 15, 9472, https://doi.org/10.1038/s41467-024-53753-w, 2024b.