the Creative Commons Attribution 4.0 License.
the Creative Commons Attribution 4.0 License.
 | 17 Jun 2025
A 1985–2023 time series dataset of absolute reservoir storage in Mainland Southeast Asia (MSEA-Res)
Shanti Shwarup Mahto
Simone Fatichi
Stefano Galelli
The recent surge in reservoir construction has increased global surface water storage, with Mainland Southeast Asia (MSEA) being a significant hotspot. Such infrastructural evolution demands updates in water management strategies and hydrological models. However, information on actual reservoir storage is hard to acquire, especially for transboundary river basins. To date, no high-resolution spatiotemporal dataset on absolute storage time series is available for reservoirs in MSEA. To address this gap, we present (1) a comprehensive open-access database of absolute storage time series (sub-monthly) for 186 reservoirs (larger than 0.1 km3) in MSEA spanning the period 1985–2023 and (2) an analysis of the reservoir storage dynamics. This dataset is derived from remote sensing observations, integrating satellite-based water surface area extraction from high-resolution (30 m) images and area–elevation–storage (A–E–S) relationships to estimate reservoir level and storage dynamics. The MSEA database includes static (area–elevation–storage curves, water frequency, and reservoir extent) and dynamic (area, water level, and absolute storage time series) components for each reservoir. The 186 reservoirs collectively store around 175 km3 of water, with a minimum of 140 km3 and a maximum of 210 km3. They cover an average area of 8700 km2, ranging from a minimum of 6500 km2 to a maximum of 10 000 km2. We show that the combined average reservoir storage increased from 70 to 160 km3 (+130 %) from 2008 to 2017, primarily contributed by reservoirs in the Irrawaddy, Red, Upper Mekong, and Lower Mekong basins. Our in situ validation provides a good match between estimated storage and in situ observations, with 50 % of the validation sites (10 out of 20) showing an R2>0.7 and an average nRMSE < 14 %. The indirect validation (based on altimetry-converted storage) shows even better results, with an R2>0.7 and an average nRMSE < 12 % for 70 % (14 out of 20) of the reservoirs. Furthermore, the analysis of the 2019–2020 drought event in the MSEA region reveals that nearly 30 %–40 % of the region experienced more than 5 months of drought, with the most significant impact on reservoirs in Cambodia and Thailand. As a result, storage departures ranged by up to −40 % in some reservoirs, highlighting significant impacts on water availability. Overall, this analysis demonstrates the potential of the inferred storage time series for assessing real-life water-related problems in Mainland Southeast Asia, with the possibility of applying the method to estimate reservoir storage time series in other parts of the world. The reservoir storage database in Mainland Southeast Asia (MSEA-Res database) and the associated Python code are publicly available on Zenodo at https://doi.org/10.5281/zenodo.14844580 (Mahto et al., 2025).
- Article
(7112 KB) - Full-text XML
-
Supplement
(1498 KB) - BibTeX
- EndNote


Water reservoirs cause some of the most significant human-induced alterations of the hydrological cycle, influencing the distribution of water in space and time (Chao et al., 2008; Cooley et al., 2021; Haddeland et al., 2014; Lehner et al., 2011). The construction of reservoirs can also lead to significant environmental and socioeconomic impacts, including biodiversity loss, alterations of geochemical cycles, and changes in land use patterns (Degu et al., 2011; Kirchherr et al., 2016; Maavara et al., 2020; Vörösmarty et al., 2010; Winemiller et al., 2016). Despite these impacts, reservoirs remain pivotal in generating renewable energy and supporting water management, thus driving the demand for new reservoirs (Chao et al., 2008; Wada et al., 2017), especially in the Global South. Accurate information on reservoir operations is thus crucial for practitioners, policymakers, and scientists in order to estimate water budgets, assess hydrological and nutrient fluxes, project water availability for hydropower generation, and mitigate flood and drought risks (Bakken et al., 2014; Chao et al., 2008). Information on the temporal evolution of absolute reservoir storage, or level, is particularly useful, since it provides a direct measurement of the total volume of water stored in a reservoir at any given time – this contrasts with relative storage time series, which only track changes in storage across a given time interval.
Currently, information on long-term absolute reservoir storage is limited across most of the globe, with consolidated datasets available only for a handful of countries (Li et al., 2023; Steyaert et al., 2022; Steyaert and Condon, 2024). Such information is particularly needed in regions like Mainland Southeast Asia that are experiencing rapid hydropower development. Laos, for instance, is realizing its vision of becoming the “battery of Asia” by constructing new hydropower reservoirs and exporting electricity to neighboring countries. It is expected, moreover, that several additional reservoirs will become operational in the years to come (Ang et al., 2024). Similarly, other Southeast Asian countries, such as Vietnam and Cambodia, have also built most of their reservoirs in the past 2 decades (Ang et al., 2024; Zhang and Gu, 2023a), altering the flow of transboundary rivers and raising tensions between the countries. With this concern in mind, we focus on the reservoirs of Mainland Southeast Asia, including Myanmar, Thailand, Laos, Vietnam, Cambodia, Malaysia, Singapore, and parts of southern China – where several major rivers originate and flow through the region.
The problem of inferring reservoir storage time series can only be partially addressed with the aid of hydrological models, since some basic information on operational strategies – typically not available – is needed to set up and validate models (Dang et al., 2020, p. 2; Galelli et al., 2022; Hanasaki et al., 2006; Nazemi and Wheater, 2015a, b; Vu et al., 2022; Wada et al., 2017). Fortunately, advances in remote sensing provide a viable opportunity to estimate storage by relating information on reservoir surface area and elevation (Busker et al., 2019; Gao et al., 2012; Tortini et al., 2020; Vu et al., 2022). For this task, information on reservoir bathymetry – synthesized by area–elevation–storage (A–E–S) curves – becomes crucial. It is indeed common practice to derive A–E–S curves from remotely sensed digital elevation models (DEMs) (Zhang and Gao, 2020); their time of acquisition, however, may limit the available information. When the DEM captures the reservoir's topography before its filling begins, absolute storage estimation is possible using these remotely sensed data (Li et al., 2023). For reservoirs constructed before the DEM was made available, the problem lies in the fact that satellite-based DEMs do not provide information below the reservoir water surface, leading to a partially unknown bathymetry. However, even in such cases, the remotely sensed water surface area from sensors like Landsat, Sentinel, and MODIS or water level data from satellite altimeters such as Jason, Sentinel-6, and SARAL-Altika can still be used to estimate storage changes (Das et al., 2022; Minocha et al., 2024; Zhang et al., 2014). Therefore, while recent studies have quantified long-term surface area and storage changes in reservoirs at global (Busker et al., 2019; Hou et al., 2024; Tortini et al., 2020) and regional scales (Shen et al., 2023; Song et al., 2022), absolute storage estimations – especially for those reservoirs built before 2000 (acquisition year of the Shuttle Radar Topography Mission – SRTM – DEM) – are still uncertain in space and time because of the lack of detailed bathymetry information (Hao et al., 2024; Li et al., 2023; Zhang and Gao, 2020).
One potential approach to improving such estimates is radar altimetry, which has proven useful for measuring water levels in lakes and reservoirs (Markert et al., 2019; Schwatke et al., 2015; Vu et al., 2022). However, limited coverage is a major constraint in popular altimetry-based datasets, such as Hydroweb (Crétaux et al., 2011), G-REALM (Birkett et al., 2011), and the Database for Hydrological Time Series of Inland Waters (DAHITI) (Schwatke et al., 2015). For Mainland Southeast Asia, altimetry-based water level data are available for only a few (20–30) reservoir overpasses. On top of that, the available water level datasets are not continuous in time. Although time series datasets are available for the reservoir storage anomaly (Shen et al., 2022, 2023), none of them provides long-term time series for absolute reservoir storage. Some studies modeled total storage – only for a few reservoirs – using lidar data (Bacalhau et al., 2022; Chen et al., 2022; Li et al., 2020), surrounding topographical information (Fang et al., 2023; Liu et al., 2020; Liu and Song, 2022), or simplified modeling approaches (Khazaei et al., 2022; Yigzaw et al., 2018). However, they show inaccuracies in storage estimates for reservoirs that were built before 2000 because of the (necessary) assumptions about reservoir bathymetry (Hao et al., 2024; Li et al., 2023; Zhang and Gao, 2020). Other studies relied on field surveys to create three-dimensional (3D) bathymetry maps to estimate absolute storage, but these are limited to very few reservoirs (Busker et al., 2019; Weekley and Li, 2019).
Recently, the GloLakes database was produced by Hou et al. (2024), providing absolute water storage dynamics for lakes from 1984 to the present, i.e., 27 000 global lakes and reservoirs, using the geostatistical model described in Messager et al. (2016). Although Hou et al. (2024) covered the entire globe by providing a comprehensive dataset for large-scale assessments, this has a few limitations for the reservoirs located in Mainland Southeast Asia. First, the model parameters (used in the storage estimation) strongly depend on the mean depth (extrapolating the surrounding topographical slope towards the center of the lake to estimate the lake depth), the surface area of the lake (derived from the Landsat satellite images), and the average slope (derived from the DEM). Therefore, uncertainties in the estimates of reservoir storage may be generated by the estimation of the depth and slope and through other model coefficients. Second, GloLakes does not include some of the largest reservoirs in Mainland Southeast Asia (MSEA), including Nuozhadu (22 km3), Xiaowan (15 km3), Xe Kaman 1 (4 km3), and Lower Seasan 2 (6 km3), which play a significant role in water redistribution and hydropower generation (Ang et al., 2024; Galelli et al., 2022; Vu et al., 2022).
Here, we address these gaps by presenting a robust and comprehensive sub-monthly time series dataset of absolute reservoir storage for Mainland Southeast Asia (hereafter the “MSEA-Res database”), whose reservoir network is described in Sect. 2. Specifically, our open-access database includes sub-monthly time series data on absolute storage for 186 reservoirs (larger than 0.1 km3) in MSEA, covering the period from 1985 to 2023. The creation of this database is facilitated by two technical advances (Sect. 3), i.e., (1) the concomitant use of Landsat and Sentinel-2 images and (2) the creation of hypsometric curves based on the new database introduced by Hao et al. (2024), which provides bathymetry information for all of the reservoirs in the GRanD database. The first advance is aimed at increasing the temporal resolution of our time series, while the latter allows us to address the (aforementioned) challenges concerning the estimation of hypsometric curves for reservoirs that were not built recently. To demonstrate the usefulness of MSEA-Res, we conduct a multi-basin analysis of the dynamics and trends of reservoir (absolute) storage, offering insights into how storage patterns have evolved over the years and across different basins (Sect. 4). Finally, we analyze the impact of the 2019–2020 drought in Mainland Southeast Asia on surface water storage, highlighting the significant effects of extreme dry weather events on water resources in Mainland Southeast Asia. Through these examples, we show that MSEA-Res can be used for a variety of applications, such as hydrological modeling, drought analyses, and regional water resource planning.
2.1 Dam design attributes
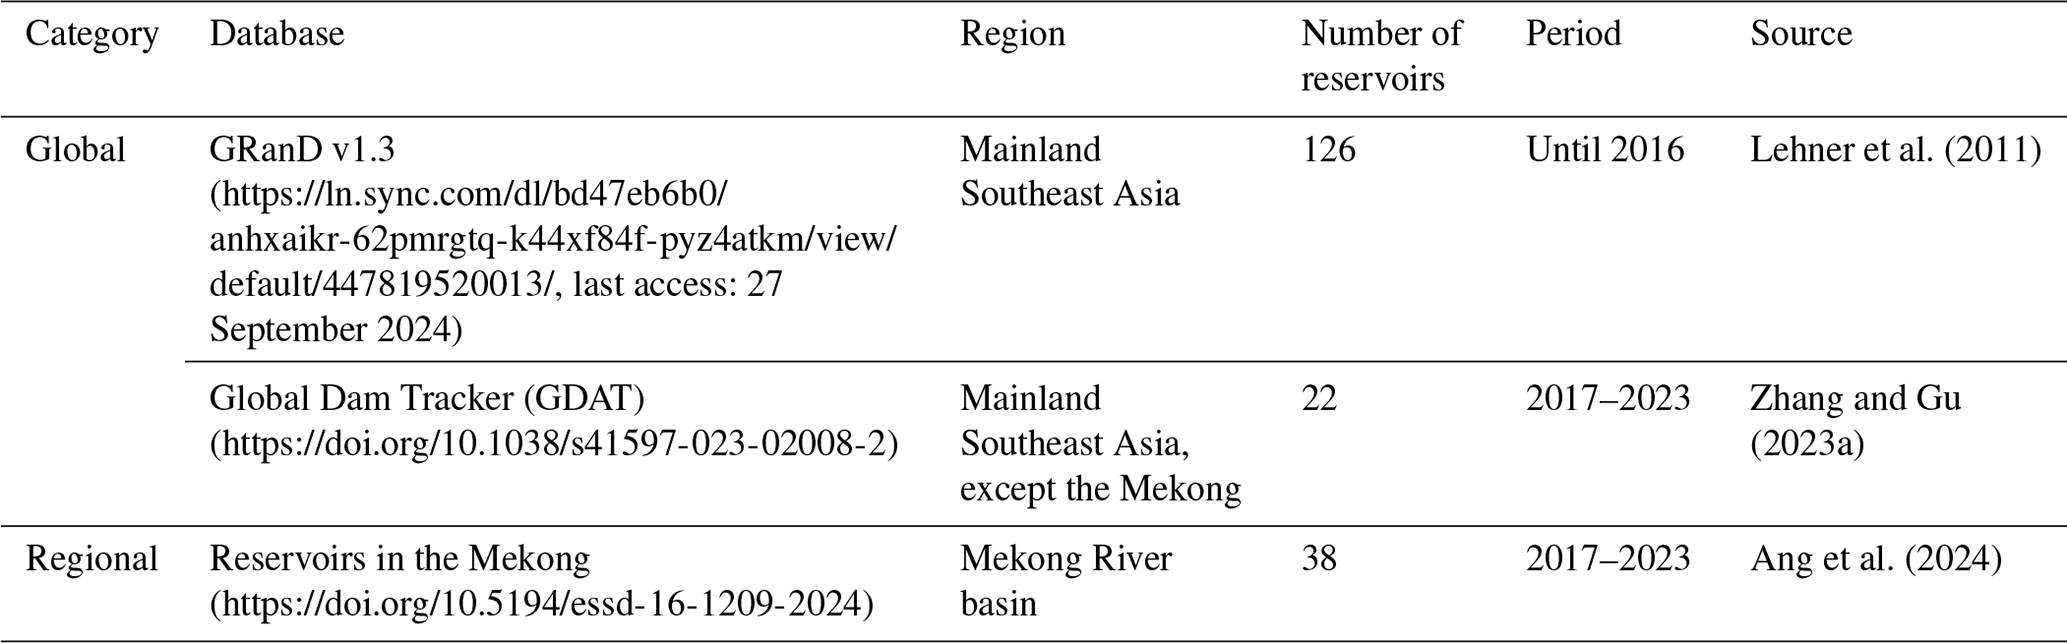
We first analyzed global and regional reservoir databases to compile a list of reservoirs (with storage larger than 0.1 km3) built in Mainland Southeast Asia until 2023. As shown in Table 1, we used two global databases (GRanD v1.3 in Lehner et al., 2011, and Global Dam Tracker (GDAT) in Zhang and Gu, 2023a) and one regional database for the Mekong River (Ang et al., 2024). The most popular global dam database – GRanD – was used to get the list of georeferenced reservoirs that were built until 2016. Unfortunately, the GRanD database has not been updated for post-2017 reservoirs in our study region. Therefore, we collected the list of georeferenced reservoirs built between 2017 and 2023 from more recent databases. For the Mekong River basin, we used the reservoir database prepared by Ang et al. (2024), whereas the GDAT database was used for the other basins (i.e., the Chao Phraya, Red, Salween, Irrawaddy, and remaining smaller river basins). Information on each reservoir in the final list of 186 elements was verified and validated against high-resolution Google Earth images. Among the reservoir attributes, we collected four main ones: name of the reservoir, spatial coordinates of the reservoir (i.e., longitude and latitude), storage capacity, and year of commission.
Table 1List of the global and regional reservoir databases used to collect the dam design attributes.
2.2 Distribution and evolution of the reservoirs
Based on the acquired information, we first present the distribution and temporal evolution of reservoirs in Mainland Southeast Asia (Fig. 1). Of the 186 large reservoirs in MSEA, 125 (∼ 68 %) were built in the 21st century. As a result, a dense network of newly constructed reservoirs has spread across all of the basins, with the exception of the Chao Phraya, western Lower Mekong, and southern coastal basins (Fig. 1a). The first big reservoirs (Srinagarind – 18 km3, Kenyi – 13.6 km3, Bhumibol – 13.5 km3, Sirikit – 9.5 km3, Khao Laem – 8.8 km3, and Nam Ngum – 7.0 km3) were built between 1964 and 1985, increasing the aggregated storage capacity from 0 to ∼ 75 km3 in about 20 years (Fig. 1c). During the following 15 years (1986–2000), mostly small reservoirs were constructed, except for Rajjaprabha (5.6 km3), which started operation in 1987. Until 2000, the cumulative storage from 60 reservoirs in Mainland Southeast Asia was thus ∼ 85 km3. The construction of 125 new reservoirs in the post-2000 period sharply increased the aggregated water storage more than 2-fold, reaching a storage capacity of ∼ 180 km3 at the end of 2023 (Fig. 1c). During this time, a few mega-reservoirs were built, such as Xiaowan (∼ 15 km3) and Nuozhadu (∼ 22 km3) in the Upper Mekong basin, contributing significantly to the aggregated storage capacity of Mainland Southeast Asia. At present, the largest number of reservoirs is in the Lower Mekong River basin (54), followed by the Irrawaddy (29), Red (21), Upper Mekong (20), Chao Phraya (7), and Salween (3) (Fig. 1b, d) river basins. Fifty-one reservoirs are located in the remaining river basins (indicated as “Others” in Fig. 1b, d). Although, based on the design specifications, we know how much water the reservoirs can hold, when full, we need a database containing time series of reservoir storage to better support hydrological studies and water resource management. Our MSEA-Res fills this gap.
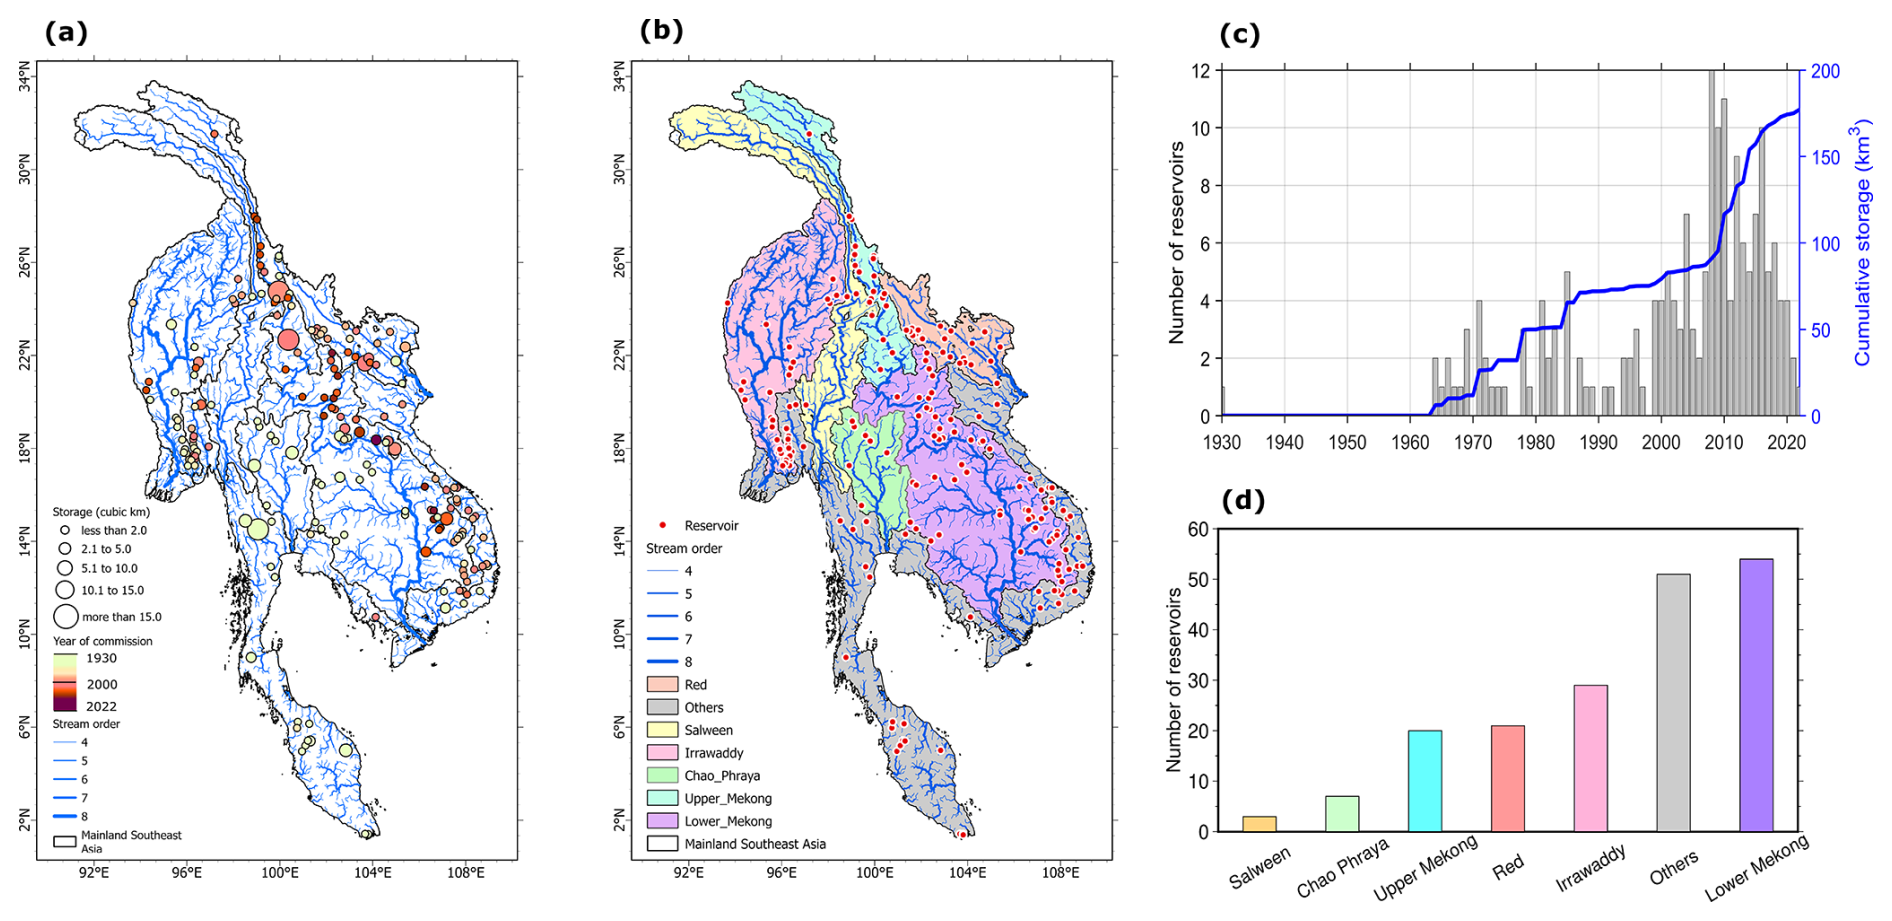
Figure 1Spatial distribution and evolution of reservoirs in Mainland Southeast Asia. (a) Map showing the reservoir storage volume (km3), where the size of the circle is proportional to the reservoir capacity and the color represents the year of commission of the reservoirs. (b) Basin-wise distribution of the reservoir locations (red dots), stream networks in the respective catchments, and stream orders. (c) Number of reservoirs built per year and their corresponding cumulative storage capacity. (d) Basin-wise total number of reservoirs built until 2023.
The procedure adopted to produce the MSEA-Res database is illustrated in Fig. 2 and can be divided into three main steps. For each reservoir, we first derive the area–elevation–storage relationship (i.e., A–E curve, E–S curve, and A–S curve). We then calculate the time series of the water surface area, and finally we derive the absolute reservoir storage by combining information on the reservoir surface area (or water level, if available) with the hypsometric curves. Although water levels from satellite altimetry observations can also be used to estimate storage volume (Zhang et al., 2014), they are only available for a few reservoirs, and they are neither consistent nor continuous in time, thus creating missing data issues (Birkett et al., 2011; Busker et al., 2019; Schwatke et al., 2015). Therefore, we worked with satellite-based water surface area, which can be produced at a higher frequency (e.g., at 10 d intervals) by Earth observation satellites, such as Landsat-5, Landsat-7, Landsat-8, Landsat-9, and Sentinel-2, to retrieve the reservoir's area time series. Despite Landsat having a 16 d revisit time, we were able to achieve 10 d interval data because more than one Landsat mission has been active in the time domain (except for the pre-1999 period). For instance, 2013 has active sensors from the Landsat-7 ETM+ and Landsat-8 series of satellites, making it possible to achieve image composites at an interval of 10 d. Please note that there could be some months without any satellite data, resulting in storage unavailability in those months, which we filled by interpolation.
In the following subsections, we discuss each step in detail, i.e., acquiring the raw satellite data, obtaining the hypsometric curves for different reservoirs, estimating the water surface area, improving the area estimates, and finally inferring the storage time series. All of the steps are implemented in a Python package called InfeRes (publicly available on GitHub at https://github.com/Critical-Infrastructure-Systems-Lab/InfeRes/, last access: 27 September 2024).
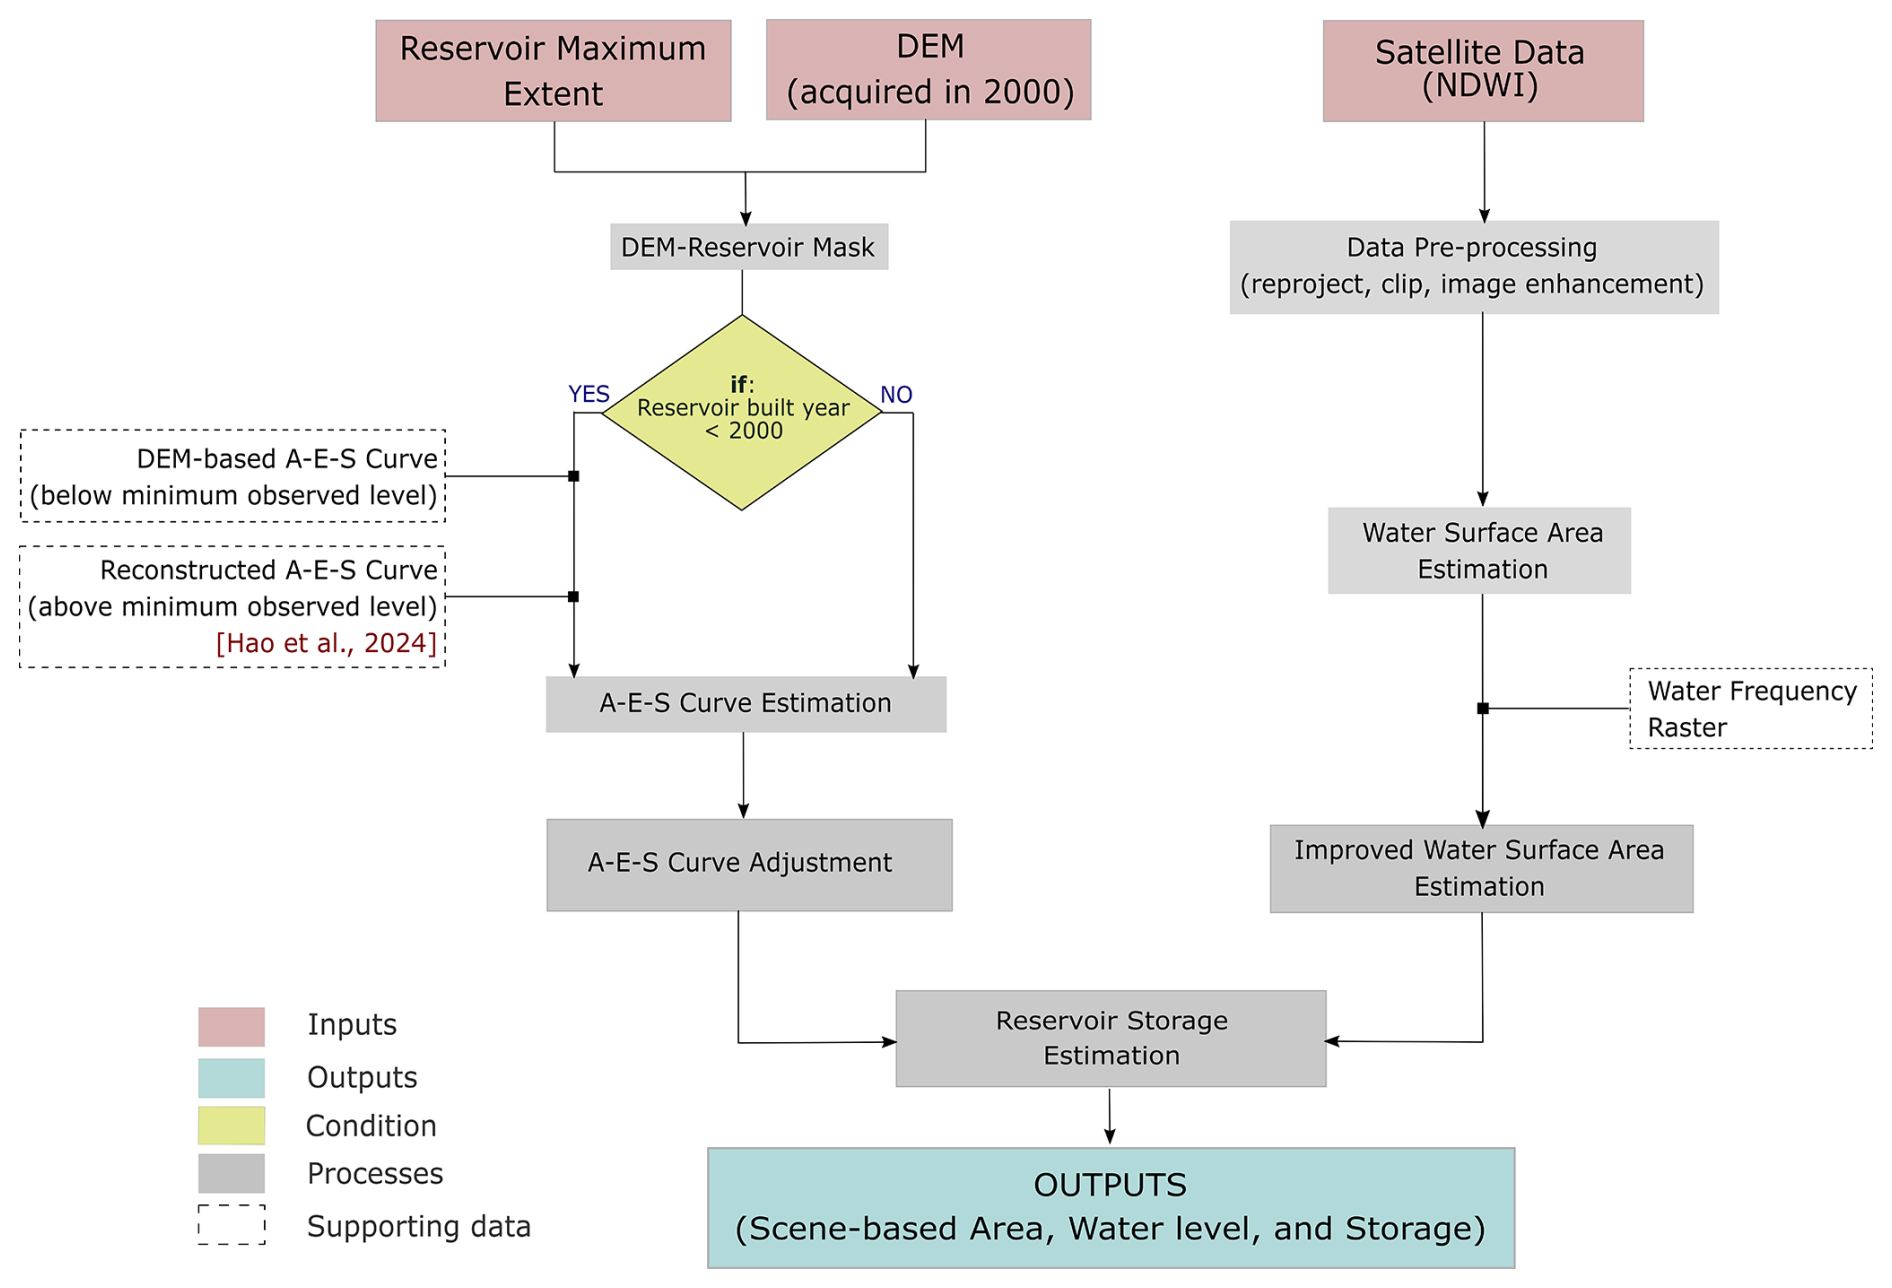
Figure 2Flowchart showing the methodological framework and steps taken to estimate reservoir storage from a series of satellite images during the 1985–2023 period. The DEM is the 30 m digital elevation model from the SRTM, acquired in February 2000. The Normalized Difference Water Index (NDWI) is the normalized ratio between reflectances in the green and NIR bands, given by (green − NIR)(green + NIR), and is generally used to classify water and non-water pixels. Please note that the maximum water extent, frequency map, and NDWI images are the derived data, whereas the DEM is acquired using the Google Earth Engine (GEE) Python API.
3.1 Acquiring input data
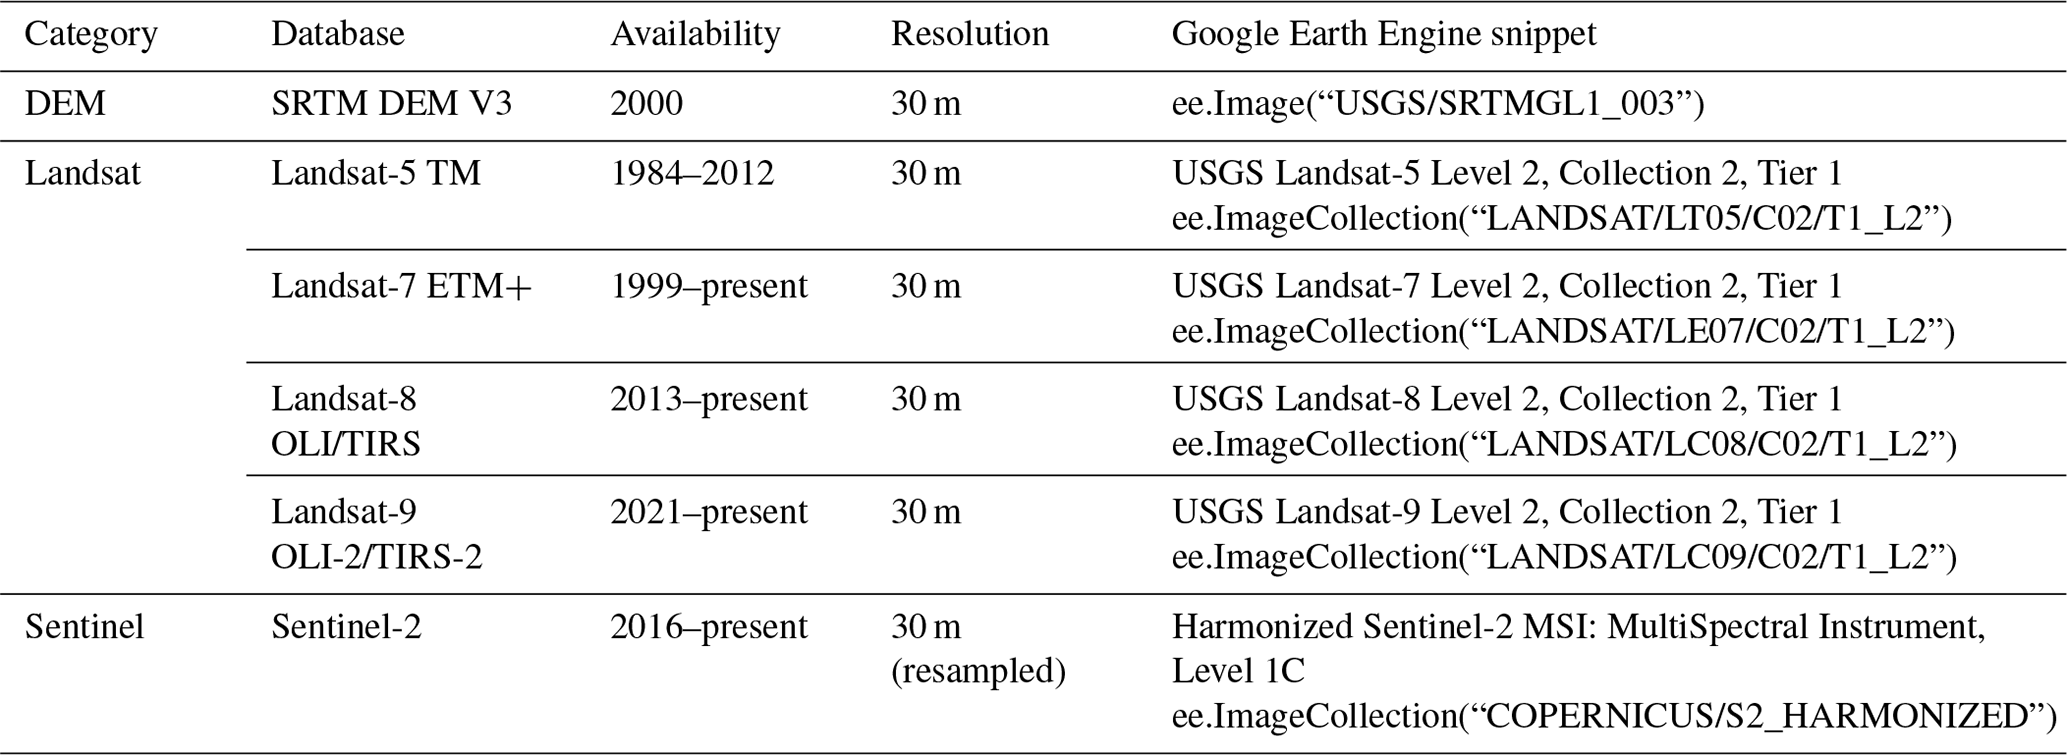
The process starts by obtaining the input datasets, mainly the DEM, Normalized Difference Water Index (NDWI) images, water frequency raster (FREQ), and maximum water extent raster (EXT). We used the Google Earth Engine (GEE) coding platform to derive the necessary input dataset. Please note that the maximum water extent, frequency map, and NDWI images are the derived data, whereas the DEM is acquired using the GEE Python application programming interface (API). For each reservoir, rectangular bounding boxes are used to fix the dimension of the dataset in GEE. As for the digital elevation model, we used the SRTM (Farr et al., 2007) DEM V3, an international research effort that obtained digital elevation models on a near-global scale. NASA JPL provides the SRTM V3 product at a resolution of 1 arcsec (∼ 30 m). Unlike the DEM, the other maps (NDWI, FREQ, and EXT) were estimated from the Landsat-5 TM, Landsat-7 ETM+, Landsat-8 OLI/TIRS, Landsat-9 OLI-2/TIRS-2, and Sentinel-2 images (see Table 2 for details).
Table 2List of the input satellite data and their specifications.
The green (G) and near-infrared (NIR) bands from the satellite sensors (Landsat and Sentinel) are used to calculate the NDWI (i.e., (G − NIR)(G + NIR)) – as proposed by McFeeters (1996) – for the available scenes, collectively covering the study period 1985–2023. Shorter wavelength bands such as G and NIR can be affected by the presence of clouds – especially on rainy days – and thus the NDWI. Therefore, getting a complete view of reservoir extent from a cloud-affected NDWI image becomes significantly challenging (Hou et al., 2024; Vu et al., 2022). To address this issue, we first filtered the Earth Engine Image Collection based on cloud threshold (band quality, BQ) and only selected those images that have less than 80 % cloud coverage. We also made NDWI composites from available Landsat (1985–2023) and Sentinel (2016–2023) images at 10 d intervals, which is the average of NDWI images in a given time interval (10 d in our case). For example, if we have three NDWI images with grid cell values of 0, 1, and 0, the NDWI value in the composite image is 0.33. Please note that there can be a maximum of three composite images in each month (i.e., only from Landsat) during the period 1985–2015. On the other hand, it can have a maximum of six images per month (three from Landsat and three from Sentinel) in 2016–2023. Making a composite of NDWI images maximizes the chances of getting more cloud-free pixels than individual NDWI images.
To obtain the FREQ and EXT raster maps, we first create the binary NDWI images available between 2013 and 2023 from the Landsat and Sentinel image collection in the GEE environment. Positive NDWI values are considered an approximation for water pixels (with a value of 1), while negative NDWI values are non-water pixels (with a value of 0). More specifically, we use a threshold that is slightly above 0 (e.g., 0.1) to classify water and non-water pixels in the NDWI image. In general, a positive value (>0) indicates a water pixel, and using a higher threshold (e.g., 0.1) increases the likelihood of identifying water pixels accurately. While some water pixels with NDWI values between 0 and 0.1 might be misclassified as non-water pixels, this effect is negligible when creating composites. The FREQ layer is created by making a composite of all binary NDWI images (more than 200 images from the Landsat and Sentinel collections) whose cloud percentage is less than 20 % (i.e., clear-sky conditions) and dividing this by the total number of selected images (cloud percentage < 20 %). We multiply the FREQ layer by 100 to get the percentage of water present in each pixel. For example, if three NDWI images make a composite image of value 0.33 in any grid, the FREQ value for that grid cell will be 33.3 %. Please note that there can only be one FREQ raster (image), which is derived by averaging all the binary NDWI images (cloud percentage < 20 %) available over the reservoir. Subsequently, the EXT layer is created by simply taking the largest extent of ones in all binary NDWI images available between 2013 and 2023. For example, if we have three NDWI images with grid cell values of 0, 1, and 0, the EXT value will be 1 for that grid.
To make the estimates more reliable and robust, we also validated our maps with that of the Global Surface Water Dataset (GSWD) (Pekel et al., 2016), which showed excellent agreement (R2=0.98) between the EXT and GSWD maximum extent maps across the 186 reservoirs (Fig. S1 in the Supplement). We also compared the EXT and FREQ maps spatially for two randomly selected reservoirs, i.e., Sirikit and Shringarind, which confirmed the reliability of the FREQ and EXT raster maps that we derived from GEE (Figs. S2 and S3). Overall, we assemble three raster layers (DEM, FREQ, and EXT) and scene-based NDWI images for each of the 186 reservoirs, which we process further to estimate the absolute reservoir storage time series.
3.2 Area–elevation–storage curves
Deriving the relationship between the area, elevation (or water level), and storage (A–E–S relationship) of a reservoir is crucial. This step relies on the bathymetry information, which further depends on the time of acquisition of the DEM. Considering that the SRTM DEM was acquired in February 2000, reservoirs built after 2000 have complete bathymetry information. Thus, the A–E–S relationship after the year 2000 can be derived easily. Since the majority of the reservoirs (∼ 70 %) in Mainland Southeast Asia were built after 2000, we obtained the A–E–S curves from the DEM. For each reservoir, the elevation range for the A–E–S curves was defined by the minimum and maximum DEM values within the reservoir's extent. The area at each elevation level was determined by contouring, while the corresponding absolute storage was estimated by cumulatively summing the areas across the elevation range. For the remaining 30 % of the reservoirs built before 2000, the DEM cannot be applied directly to estimate A–E–S curves. This is a common problem in the existing studies when estimating absolute storage for reservoirs built before 2000 (Busker et al., 2019; Gao et al., 2012; Hou et al., 2024; Khazaei et al., 2022; Yigzaw et al., 2018). Although previous studies have used various modeling approaches based on simplified geometric assumptions to overcome this limitation (Fang et al., 2023; Hou et al., 2024; Khazaei et al., 2022; Yigzaw et al., 2018), the results often do not meet the level of accuracy required for basin-scale water management modeling and decision-making. To address this problem, we banked on a recently released database of global reservoir area, storage, and depth derived through deep-learning-based bathymetry reconstruction (GRDL; Hao et al., 2024), which provides reliable bathymetry information for the 7250 GRanD reservoirs across the globe. We thus utilized the GRDL database to obtain A–E–S curves for the remaining 60 reservoirs (Fig. 2).
3.3 Water surface area estimation
We used the Landsat and Sentinel NDWI images downloaded from the Google Earth Engine platform (see Sect. 3.1 for details) to estimate the reservoir water surface area. A locally adjusted contrast-limited adaptive histogram equalization (CLAHE) was applied to enhance the NDWI images before classification. CLAHE (Reza, 2004) is a variant of adaptive histogram equalization (AHE), which takes care of over-amplification of the contrast of an image. CLAHE operates on small regions in the image (an 8 × 8-pixel window in our case) rather than on the entire image. The size of its operational window (8 × 8 pixels) is based on the literature (Asghar et al., 2023), which suggests that CLAHE enhances the contrast and textural features of water, thereby improving the visualization of satellite images. This enhancement facilitates the classification of water and non-water pixels. We then applied the k-means clustering-based algorithm to classify the water pixels. We assigned a number of clusters (k) equal to three clusters to classify each NDWI image in order to represent three different classes, i.e., water, non-water, and no data. Because of the presence of clouds and other disturbances, using the same NDWI threshold (equal to 0) in all satellite images may lead to overestimation or underestimation errors of the water surface area (Vu et al., 2022). Thus, to find NDWI thresholds for each satellite image, we resort to k-means clustering. Eventually, the preliminary water pixels were identified by selecting the cluster corresponding to the maximum centroid value of the NDWI. The water surface area estimated from the preliminary water pixels is referred to as “Before_area” for any given reservoir (Table 3).
We further improved the water surface area estimates by filling the cloud-contaminated pixels, which were assigned a “No data” value in the previous steps. For this purpose, we used the algorithm for water surface area estimation developed by Vu et al. (2022), which was initially introduced by Gao et al. (2012) and Zhang et al. (2014) to extract the water surface area. The algorithm uses a water frequency raster (FREQ) to fill the cloud-affected pixels over the reservoir area. We add the clear-water pixels (k-means clustering) and cloud-filled water pixels (Vu et al., 2022) to get a complete picture of the reservoir water surface area for each NDWI image, called “After_area” (Table 3). Finally, we adjust the boundary water pixels of the complete reservoir water surface area, called “Final_area”. Notably, if no adjustments are detected by the algorithm, “Final_area” remains equal to “After_area” (Table 3).
3.4 Absolute storage estimation and postprocessing
Once we had estimated the water surface area, we subsequently used the hypsometric curves to derive the corresponding absolute reservoir storage volume. Based on the different processing stages, we post-processed the storage time series into three levels (Level 0, Level 1, and Level 2). For each reservoir, Level 0 corresponds to the scene-based (instantaneous) raw outputs of absolute reservoir storage, which have been derived from the available satellite images. We then performed a simple boxplot analysis of Level-0 data to remove outliers, creating the so-called Level-1 data. The Level-0 data are provided to give users the flexibility to generate their own Level-1 data using alternative outlier removal algorithms, if needed. Note that, in our case, Level-1 data are created using a generalized boxplot framework for quality control that is not specifically designed for each reservoir. Therefore, on a case-by-case basis, some values in the storage time series may still be considered outliers – they can be removed manually or with the aid of other data analysis algorithms. Therefore, the improvement in Level-1 data compared to Level-0 data varies between the reservoirs. To quantify it, we calculated the coefficient of determination (R2) and the normalized (by reservoir total storage) root mean square error (nRMSE) for the Level-0 and Level-1 data of the 20 reservoirs for which we have the observed storage. The detailed analysis of the 20 selected reservoirs is presented below in Sect. 4.4 (Fig. 7 and Table S2 in the Supplement). We found that the nRMSE decreased and the R2 increased from Level 0 to Level 1, suggesting that the outlier removal process can further enhance the quality of the data (Fig. S4). Considering the demand for ready-to-use data for several applications (e.g., hydrological modeling), we further processed the Level-1 data to create continuous daily time series of absolute reservoir storage (called Level-2 data) using a nonlinear (i.e., spline) interpolation technique, followed by data smoothing (moving-mean method). It is important to note that the interpolation technique incorporates all available data points, including a few outliers, which introduces a higher level of uncertainty into the Level-2 data. Despite this, we undertook validation of the storage time series to strengthen confidence in our estimations.
3.5 Validation of reservoir storage
We adopted two validation approaches. The first approach is direct validation, where we compare and validate our estimated storage volume against the observed reservoir storage. The second approach is indirect validation, where we use altimetry-converted storage to validate our time series of reservoir storage. Acquiring observed reservoir storage is challenging in MSEA because of the institutional and organizational data-sharing policies and restrictions, leading to a poor network of public data repositories for reservoir data. The only exception is the Thailand National Hydroinformatics Data Center, which releases daily reservoir storage information to the public domain (National Water Database (NWD) – https://www.thaiwater.net/, last access: 12 May 2024). We took the opportunity to download observed storage data from the NWD portal for 20 reservoirs in Thailand and then compared these data with our storage estimates.
For indirect validation, we used reservoir water level data measured by satellite-based altimeters such as TOPEX/Poseidon; Jason-1, Jason-2, and Jason-3; ENVISAT; ERS-1 and ERS-2; and Sentinel-3 and Sentinel-6. These have proven useful in measuring water levels in lakes and reservoirs (Birkett, 1998; Frappart et al., 2006; Santos da Silva et al., 2010). Specifically, we acquired the compiled time series of radar-altimetry-derived surface water elevation from DAHITI (https://dahiti.dgfi.tum.de/, last access: 12 May 2024) (Schwatke et al., 2015) and the Global Reservoirs and Lakes Monitor (GREALM – https://ipad.fas.usda.gov/cropexplorer/global_reservoir/, last access: 12 May 2024) (Birkett et al., 2011). We took 20 reservoirs across Mainland Southeast Asia – for which altimetry observations are available – to indirectly validate our estimated storage time series. Before carrying out the comparison, the altimetry-derived surface water levels were first converted into their corresponding storage time series based on the elevation–storage relationship.
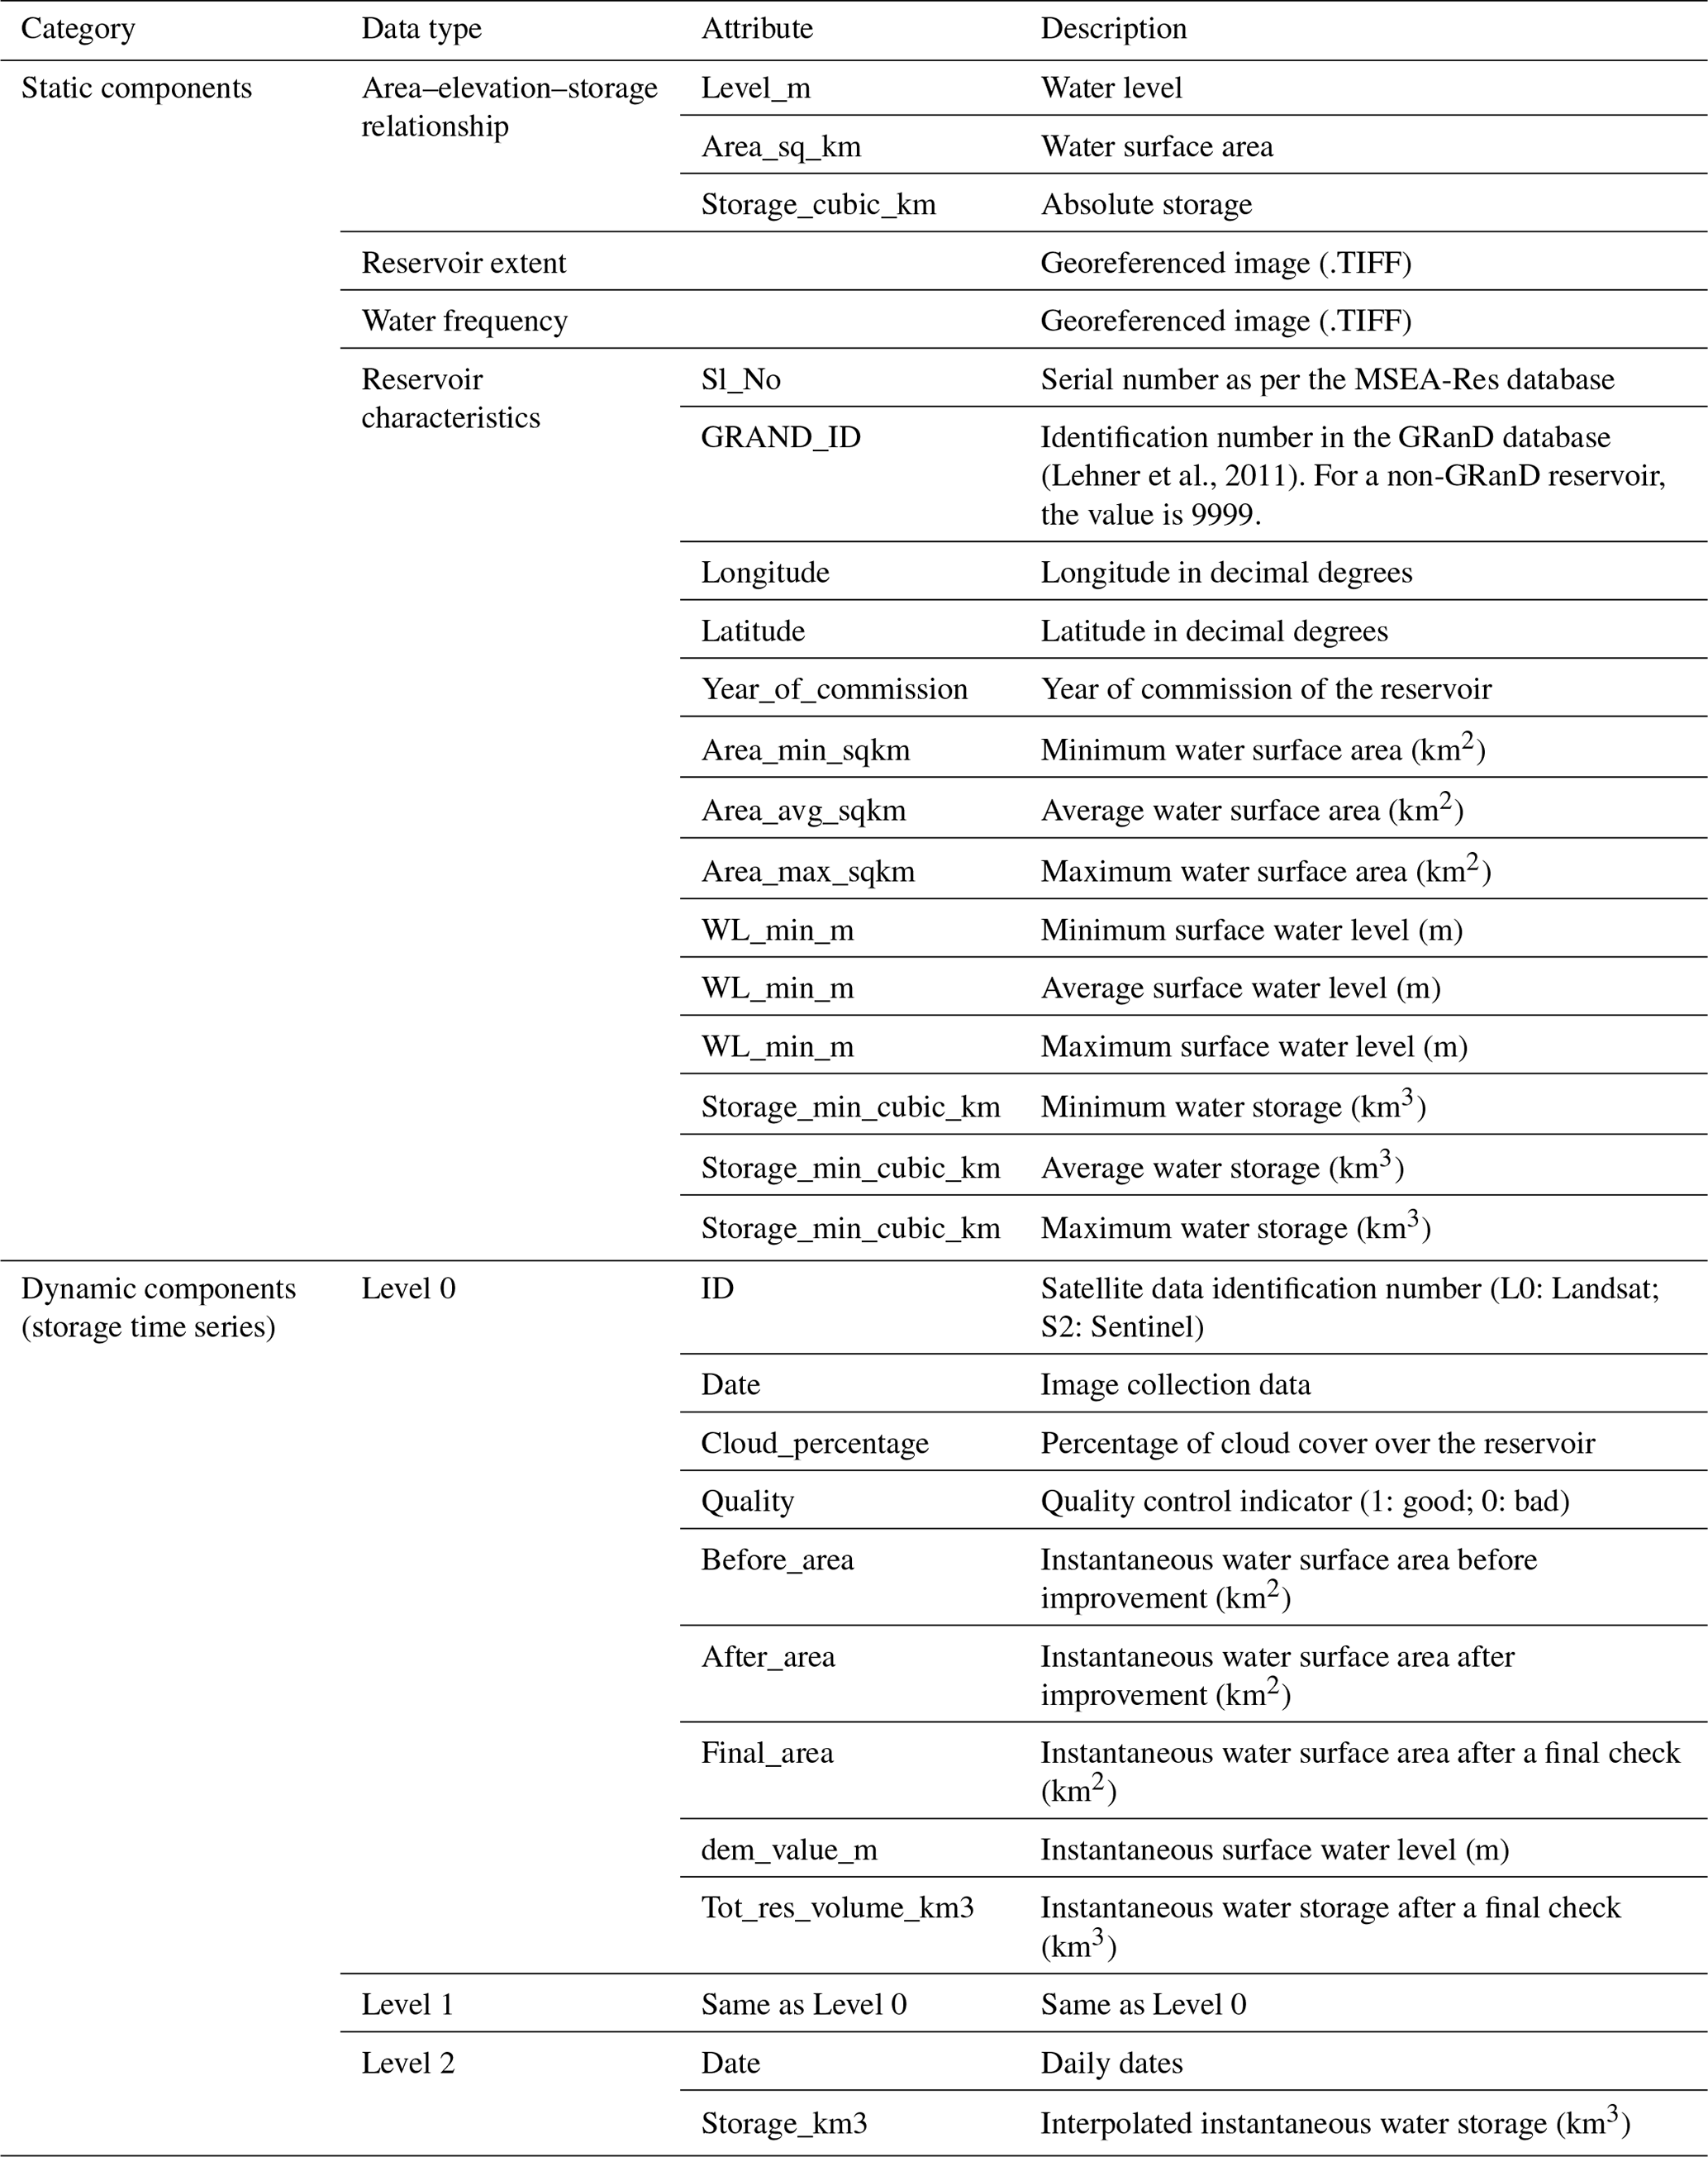
4.1 Structure of the MSEA-Res database
A reservoir's information in the database is divided into static and dynamic components (Fig. 3 and Table 3). For each reservoir, static information is further divided into four categories: (i) the area–elevation–storage relationship (hypsometric curves); (ii) reservoir extent; (iii) water frequency (the mean inundation frequency for each pixel); and (iv) reservoir characteristics such as location (longitude and latitude), year of commission, area (km2), water level (m), and storage (million cubic meters). Note that, for area, level, and storage, static information includes minimum, mean, and maximum. On the other hand, dynamic information consists primarily of the sub-monthly time series of absolute reservoir storage. We did not provide the water level and surface area time series separately, as they can be derived easily from the area–elevation–storage curve for any given storage volume. In the subsequent sections, we use Level-1 and Level-2 data to analyze and validate the storage time series. Note that, for each reservoir, the data are processed within the period 1985–2023. If the year of commission of a reservoir is 2015, the storage time series is estimated between the years 2010 and 2023, assuming a maximum of 5 years as the filling period. All of the storage time series and other related information are publicly available in the MSEA-Res database at https://doi.org/10.5281/zenodo.14844580 (Mahto et al., 2025).
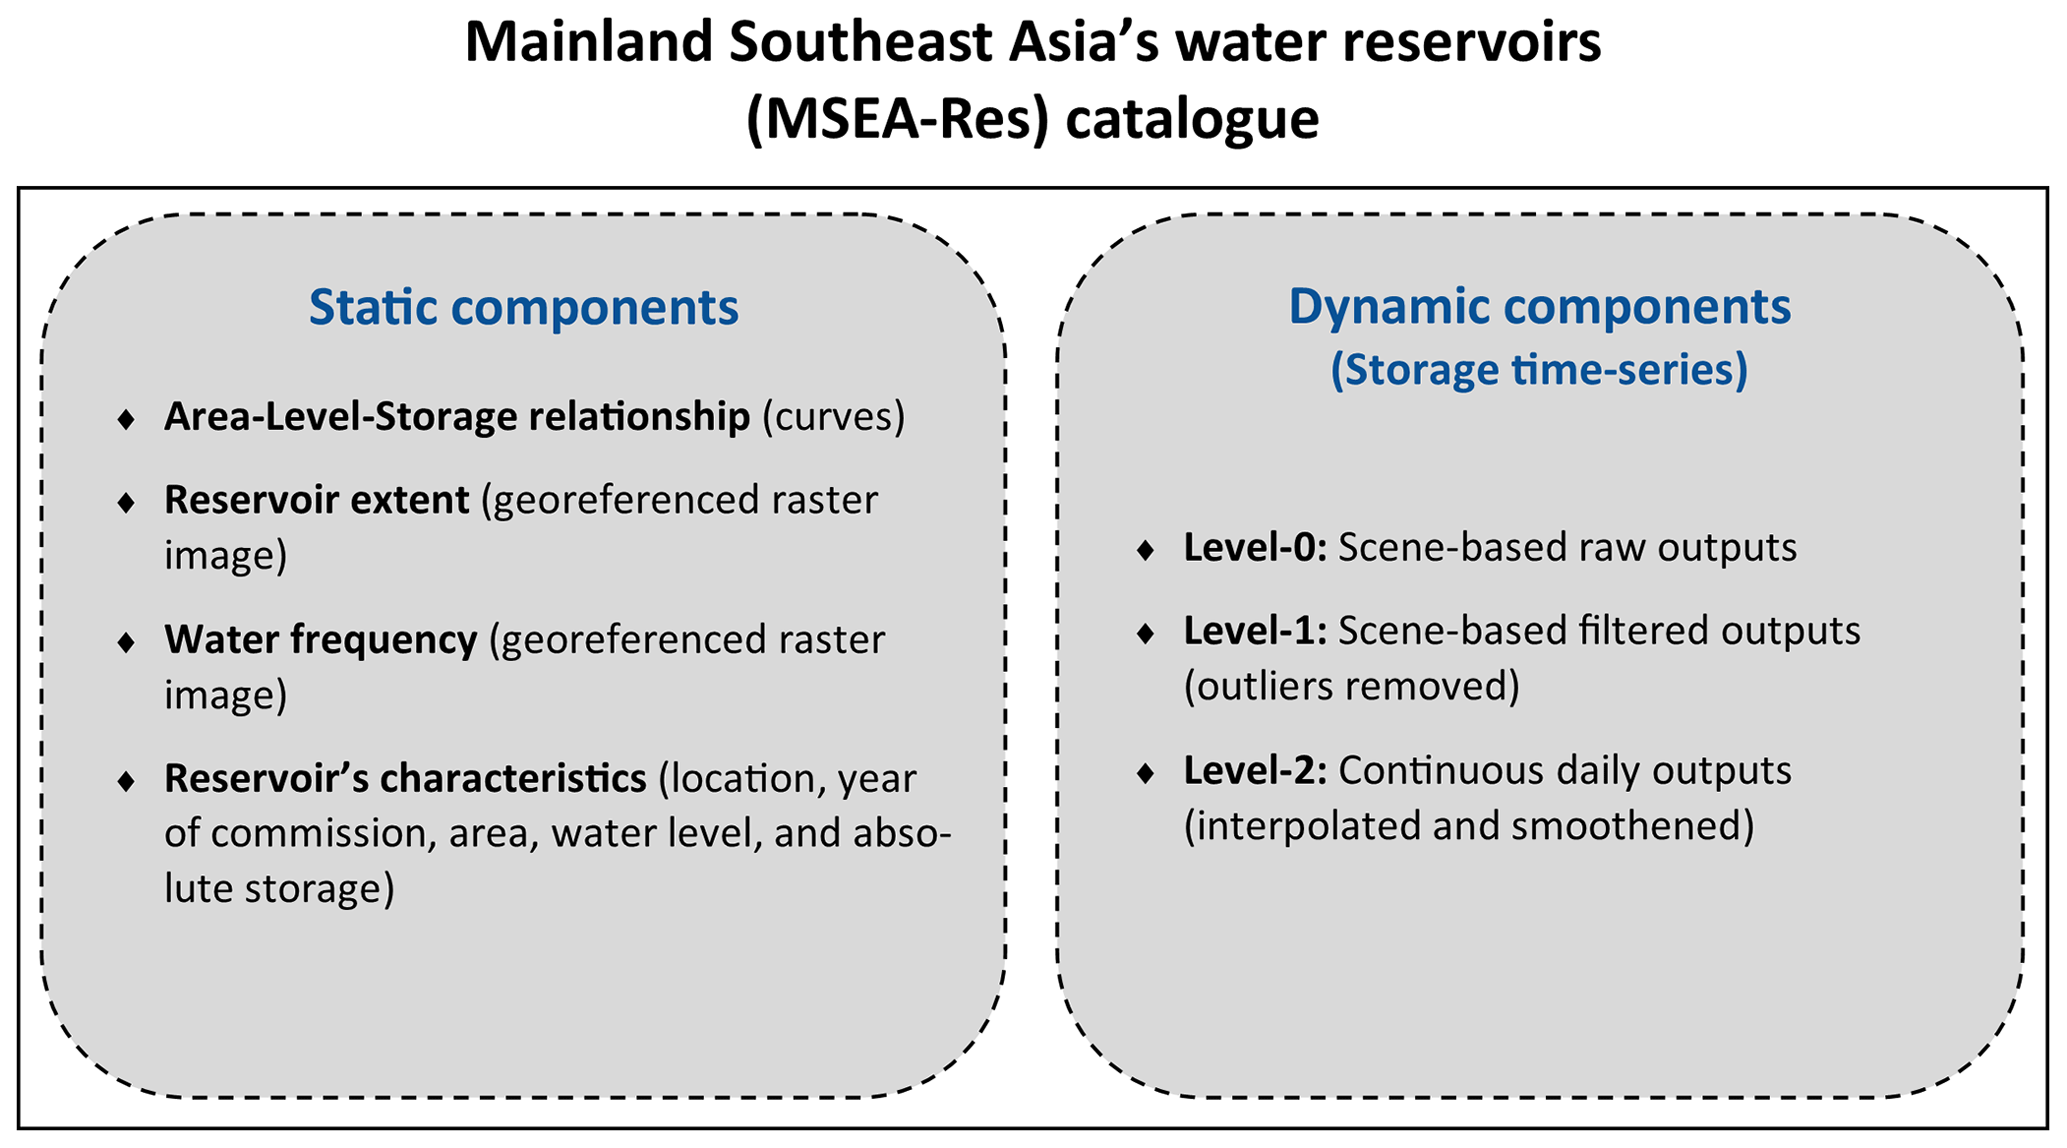
Figure 3Catalog of the MSEA-Res database. Please note that the dynamic components (storage time series) are available from the 5 years before the year of commission.
4.2 Hypsometric curves and storage time series
In this section, we illustrate one of the static components of the MSEA-Res database, i.e., the area–elevation–storage relationship (see Table 3 for details), where elevation corresponds to the reservoir's water level relative to the mean sea level in meters (m a.s.l.). In our database, we provide the hypsometric curves for each of the 186 reservoirs. Here, we further illustrate seven curves (Fig. 4), with one reservoir for each major river basin. The seven selected reservoirs (basins) are Longjiang (Irrawaddy), Nuozhadu (Upper Mekong), Son La (Red), Mobye (Salween), Sirikit (Chao Phraya), Sringarind (other basins), and Xe Kaman1 (Lower Mekong). The A–E curve and S–E curve relationships are shown (Fig. 4). These hypsometric curves represent the variability in the reservoir's storage and area, which results primarily from the diverse topography characterizing the basin and reservoir locations.
For the same seven reservoirs, we then illustrate the dynamic components of the MSEA-Res database – time series of reservoir storage at different processing levels, i.e., Level 0 (raw outputs), Level 1 (removal of outliers from Level 0), and Level 2 (smooth interpolation of Level 1) (Fig. 5). The storage time series data can be used to infer meaningful information on the storage dynamics, including filling patterns, fluctuations, and responses to wet and dry years. Looking at the filling patterns, for instance, Xe Kaman1 (2016) took almost 4 years to store more than 3 km3 of water and reach its normal operating conditions (Fig. 5g). The Longjing (2010) reservoir was filled in roughly 1 year (Fig. 5a). By combining this information with inflow data, one could easily estimate the impact of reservoir-filling strategies on downstream water availability – a rather contentious matter in transboundary river basins (Vu et al., 2022; Wheeler et al., 2016; Zaniolo et al., 2021). The time series also reveal the “typical” behavior of reservoir storage in Southeast Asia, with seasonal fluctuations between minimum and maximum operating levels driven by the drastic changes in the intra-annual water availability characterizing this region (i.e., a wet season between June and November, followed by a drier period between December and May) (Nguyen et al., 2020). Importantly, the time series also reveal interannual changes in water storage, which are largely caused by hydrological regime variability – a point discussed further in Sect. 4.5.
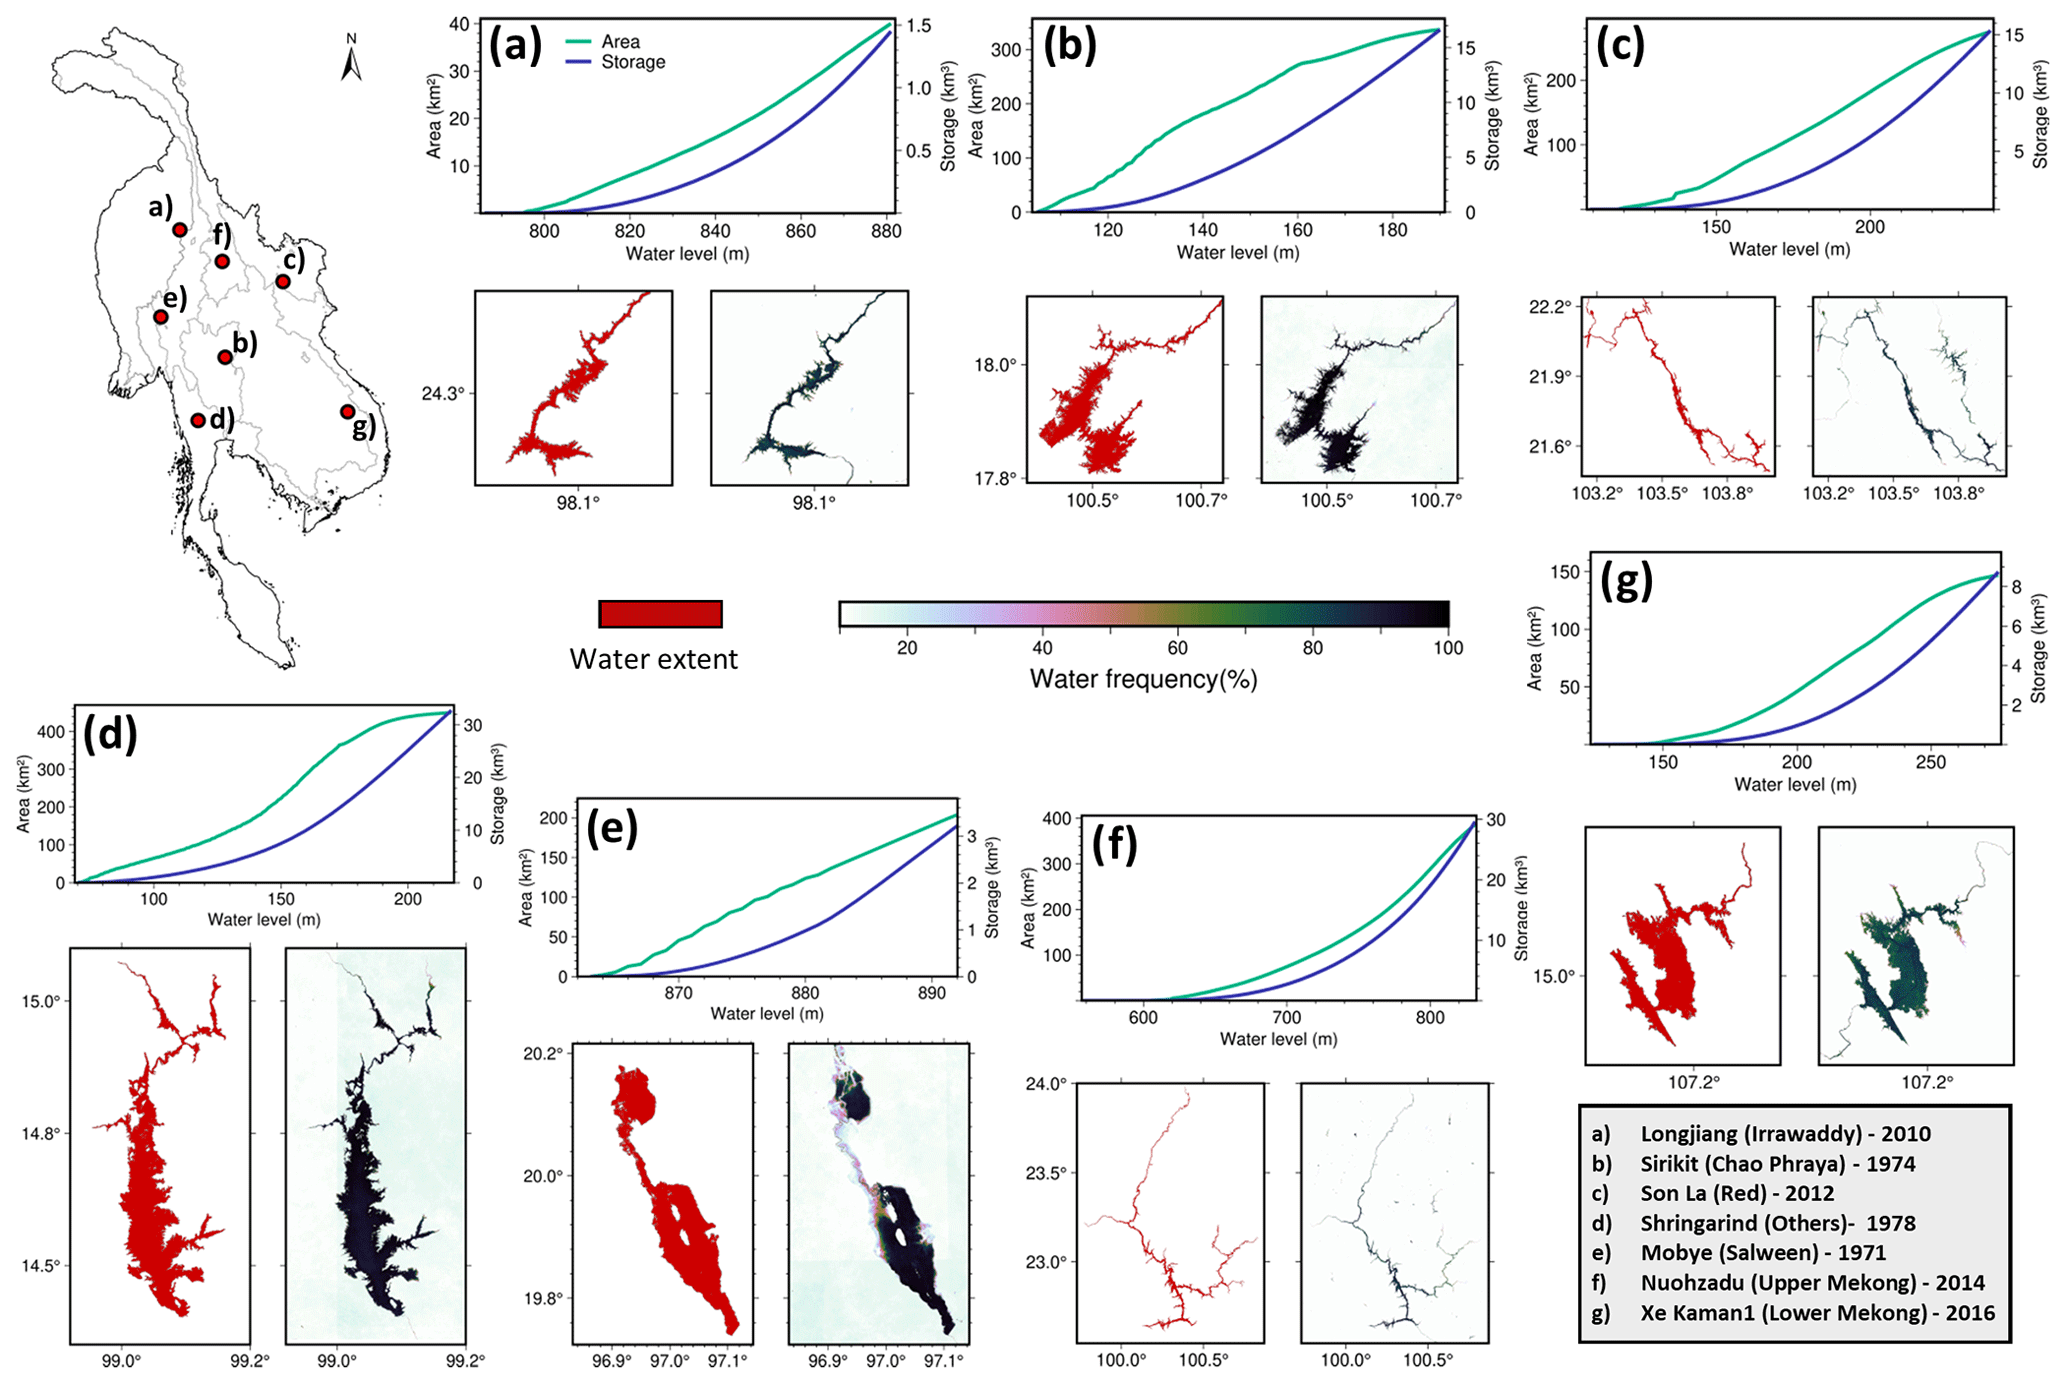
Figure 4Illustration of the static components of the MSEA-Res database (A–E–S relationship) for seven reservoirs, one in each of the major river basins. In each panel, E–A and E–S curves are shown in green and blue, respectively. The dates refer to the years of commission of the reservoirs.
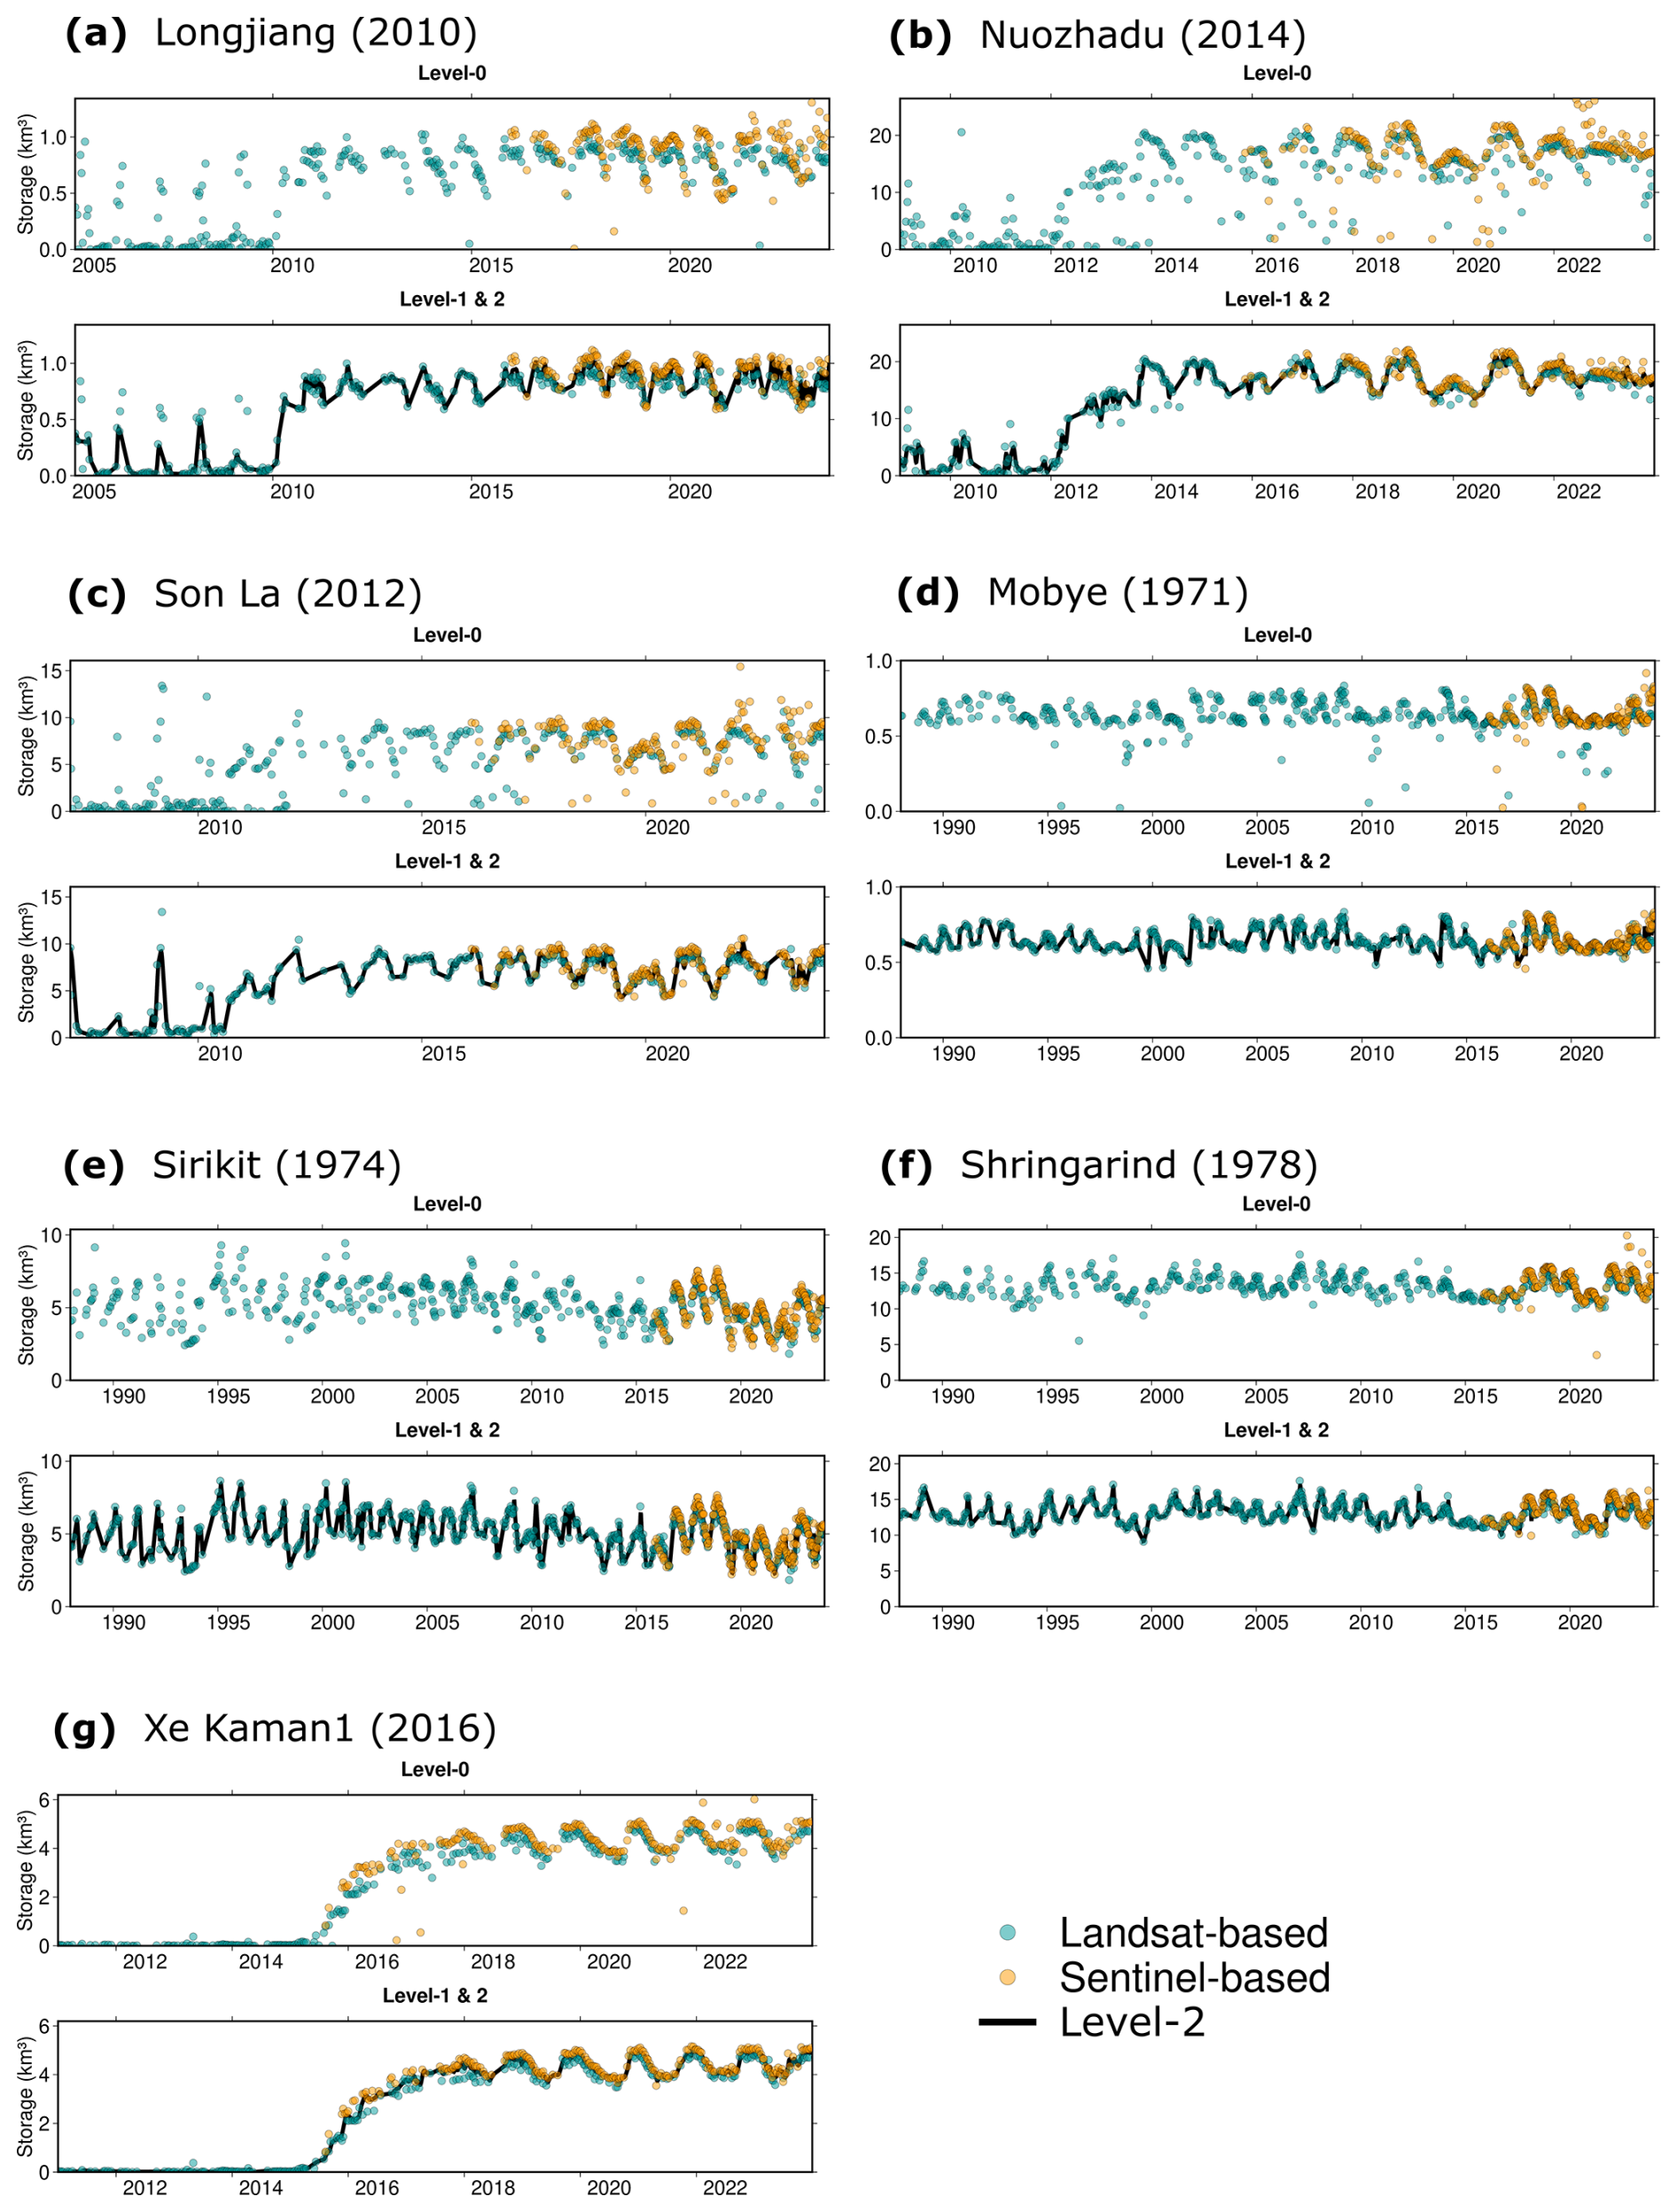
Figure 5Illustration of the reservoir storage time series, i.e., the dynamic components of the MSEA-Res database, for the seven selected reservoirs. Each panel (a–g) corresponds to a reservoir. For each panel, we report the scene-based reservoir storage (km3) time series at Level 0 and the storage time series at Level 1 (after removing the outliers) overlapped with Level 2 (after interpolation and smoothing).
4.3 Basin-wise reservoir storage analysis
We used all of the Level-1 data to analyze the basin-wise evolution and dynamics of reservoir storage in Mainland Southeast Asia. Specifically, we calculated the total volume of water (km3) stored in all reservoirs for each of the seven main river basins, i.e., the Irrawaddy, Upper Mekong, Red, Salween, Chao Phraya, Lower Mekong, and “other basins” lumped together (Fig. 6). We found that the aggregated storage of all reservoirs in the Upper Mekong basin increased by more than 8 times (a 800 % increase) in just 5 years (between 2010 and 2015) (Fig. 6b). Nuozhadu (22 km3) and Xiaowan (15 km3) are the main contributors to such an increase, as they account for approximately 95 % of the basins' total storage, whereas the remaining 18 reservoirs contribute just 5 % (Fig. 6b). Since the construction of Nuozhadu and Xiaowan, more reservoirs have been built in the Upper Mekong; however, their capacity is smaller than those of these two mega-reservoirs (e.g., Miaowei, 0.66 km3). A seasonal fluctuation of storage is common across all of the basins, as the monsoon season has a similar precipitation pattern across the MSEA region (Ha et al., 2023; Skliris et al., 2022).
Results further illustrate the spatiotemporal variability in reservoir construction across Mainland Southeast Asia. After 2017, all of the basins – except for the Lower Mekong – reached a plateau, with no significantly increasing trends in their aggregated reservoir storage (Fig. 6). For instance, 1998–2015 was the period in which a series of reservoirs was constructed in the Irrawaddy basin, increasing the aggregated storage volume from ∼ 2 to 10 km3 (a 500 % increase). Similarly, it was in 2005–2015 and 2010–2017, respectively, that the largest reservoirs were built on the Red River (a 300 % increase) and in the other coastal basins (a 35 % increase) (Fig. 6c, f). The aggregated reservoir storage in the Lower Mekong basin has increased since 2009 (Fig. 6g). Two river basins – the Salween and Chao Phraya – show no significant changes in the aggregated reservoir storage in the last 4 decades (Fig. 6d, e). In fact, the storage volume in Chao Phraya has been found to be substantially reduced by ∼ 15 % after 2010 (Fig. 6e), due to persisting drought conditions under which both the Bhumibol and Sirikit reservoirs showed a continuous decline in storage (Figs. S6b, 5e). Putting all 186 reservoirs together, we find that the aggregated average reservoir storage in Mainland Southeast Asia increased significantly, from 70 to 160 km3 (a 130 % increase), during the period 2008–2017. Presently, it is approximately 175 km3 (Fig. 6h). Additional details regarding the temporal evolution of reservoir storage in MSEA are reported in Fig. S5.
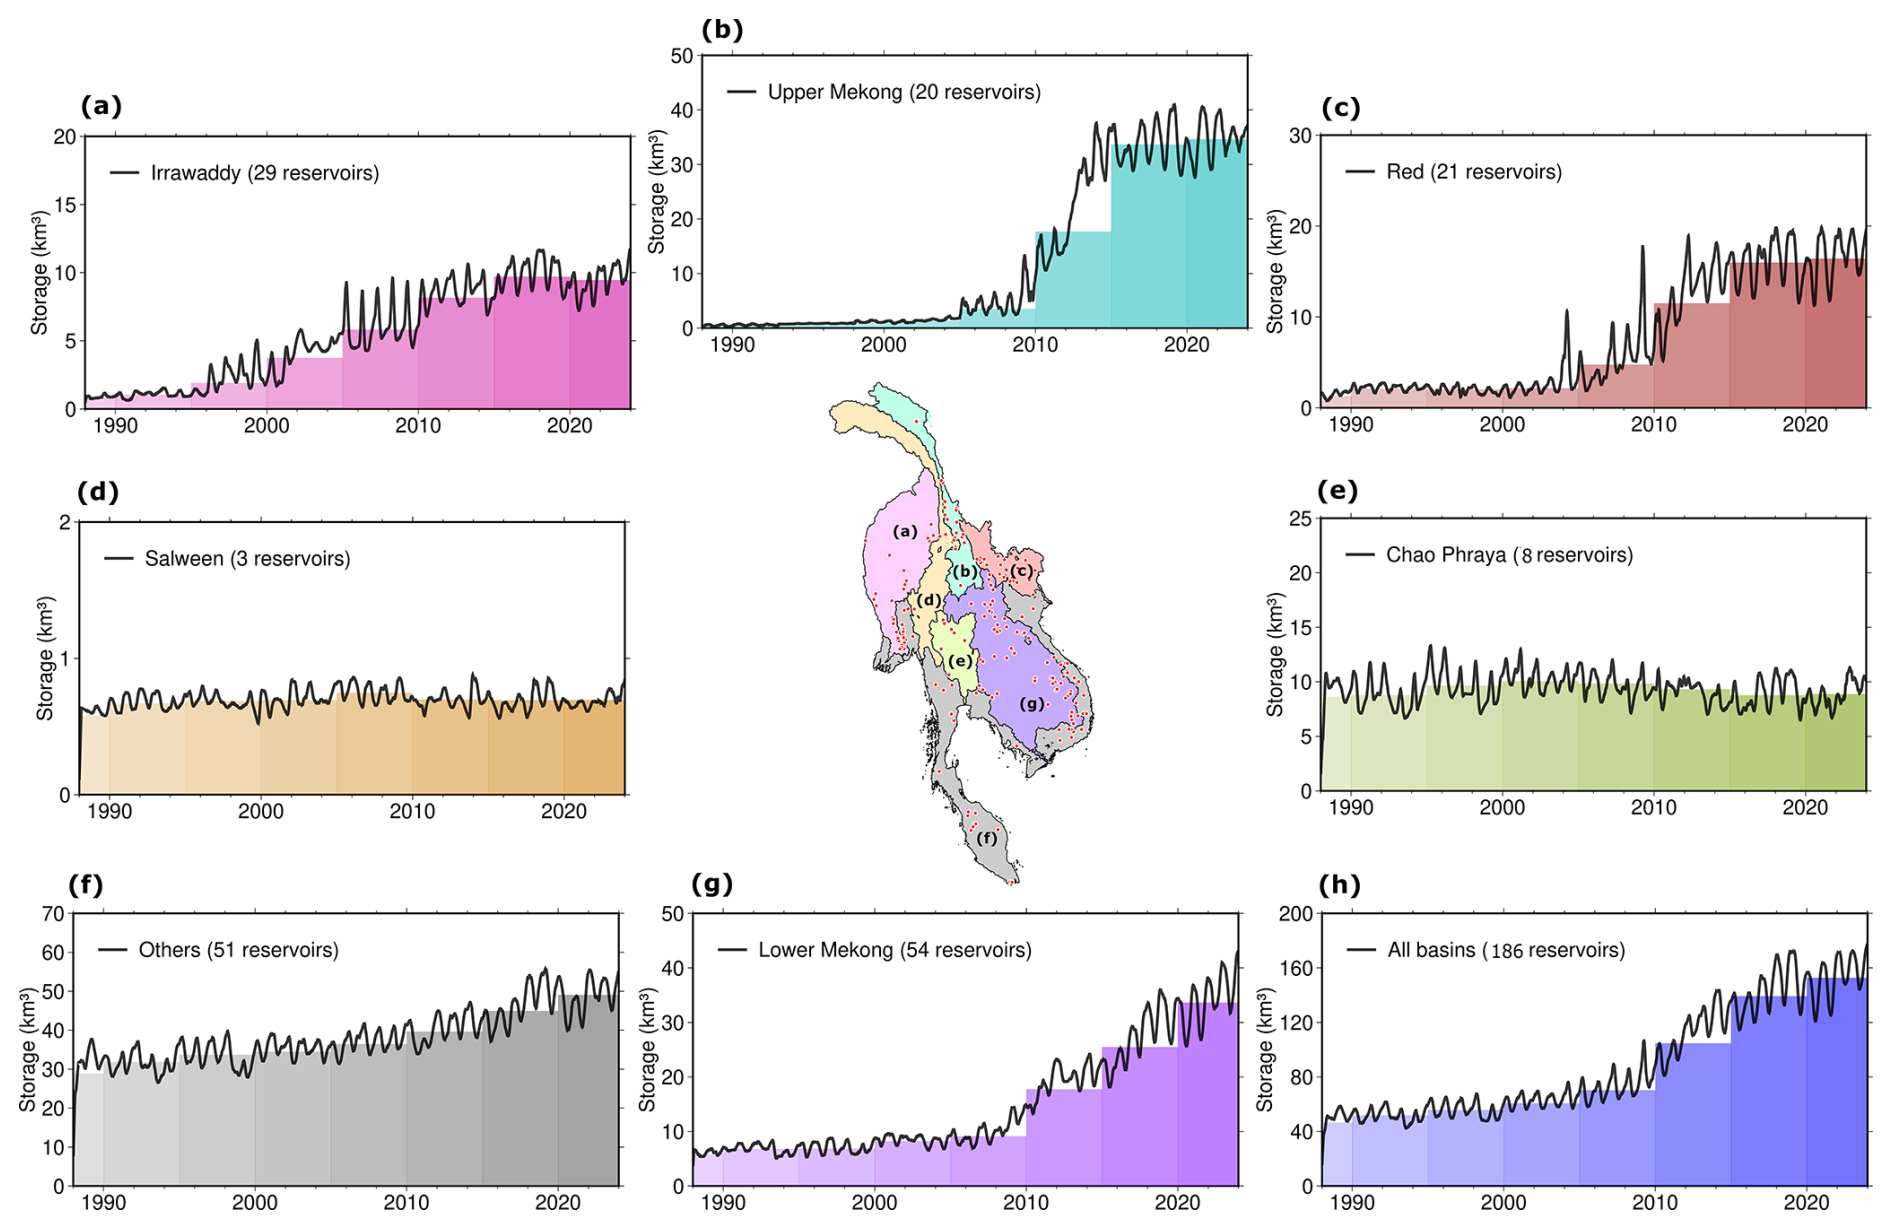
Figure 6(a–g) Aggregated storage time series in the Irrawaddy, Upper Mekong, Red, Salween, Chao Phraya, Lower Mekong, and other minor river basins during the 1985–2023 period. (h) Aggregated storage time series of all 186 reservoirs in Mainland Southeast Asia. The color gradient in each panel represents the average storage with a 5-year interval. Please note that the aggregated storage is the total volume of water (km3) stored in all of the reservoirs at a given time in each river basin.
4.4 Validation
We validated the generated storage time series – Level-1 data – with the observed reservoir storage (direct validation) and the altimetry-converted storage (indirect validation). As explained in Sect. 3.4, we first collected the observed storage for 20 reservoirs in Thailand from the National Water Database, the only publicly available storage database in the MSEA region. We then compared the estimated and observed storages based on two metrics – R2 and nRMSE.
Despite the lack of actual bathymetry for most reservoirs in Thailand (since they were built before 2000), we found good agreement between estimated and directly observed storage in most reservoirs (Fig. 7a, b). Sirikit and Shringarind showed very good agreement, with R2>0.8 and nRMSE < 9.5 % for both reservoirs (Fig. 7c, d). Notably, 10 out of the 20 reservoirs show an R2 of greater than 0.7 (average R2=0.77 and average nRMSE = 14.2 %) (Fig. 7a, b; Table S1). Excluding three reservoirs with lower performance (Bang Lang, Rajjaprabha, and Bhumibol), the average R2 and nRMSE of the remaining 17 reservoirs are 0.68 and 17 %, respectively (Table S1), suggesting that the framework works well for reservoirs characterized by varying A–E–S curves and sizes. For instance, the validation shows strong agreement for both Khao Laem (∼ 8 km3) and Lamphraphloeng (∼ 0.1 km3), with R2>0.77 and nRMSE < 18 % for both reservoirs (Fig. S6 and Table S1). As expected, the average R2 and nRMSE across all 20 reservoirs are approximately 0.6 and 18.6 %, respectively (Table S1).
To make the evaluation more robust, we indirectly validated our storage time series using altimeter observations collected from the DAHITI and G-REALM databases. The water level time series acquired from various altimeters was converted into the corresponding storage time series using the E–S curve (see Sect. 3.4). We collected water level observations for 20 reservoirs across the MSEA region for which the altimetry passes were available for at least 5 years. The comparison between the time series shows that 14 of the 20 reservoirs have an R2 larger than 0.7 (average R2=0.80 and average nRMSE = 11.7 %), suggesting a good match between the estimated and altimetry-converted storage time series (Fig. 8a, b). The average R2 and nRMSE are 0.63 and 13.3 %, respectively, when considering all 20 reservoirs together (Fig. S7 and Table S2). The storage time series comparisons for two of the largest reservoirs (Sirikit, R2 = 0.70 and nRMSE = 17 %; Nuozhadu, R2 = 0.96 and nRMSE = 6.4 %) are shown in Fig. 8c and d, respectively.
The underperformance of certain reservoirs can likely be attributed to two key factors. First, potential inaccuracies in the hypsometric curves may introduce errors when converting inferred water surface area into absolute reservoir storage. Second, the quality of the satellite-derived NDWI data, particularly cloud-free image availability and gap-filling, can significantly impact accuracy. Enhancing satellite image preprocessing through techniques such as contrast stretching and histogram equalization could improve data quality and, in turn, refine reservoir storage estimations. Addressing these challenges will be crucial in further optimizing the framework's reliability across diverse hydrological settings. Despite these challenges, the direct and indirect validation metrics suggest that the InfeRes-derived storage data can be reliably used for water-storage-related analysis on a weekly to yearly timescale.
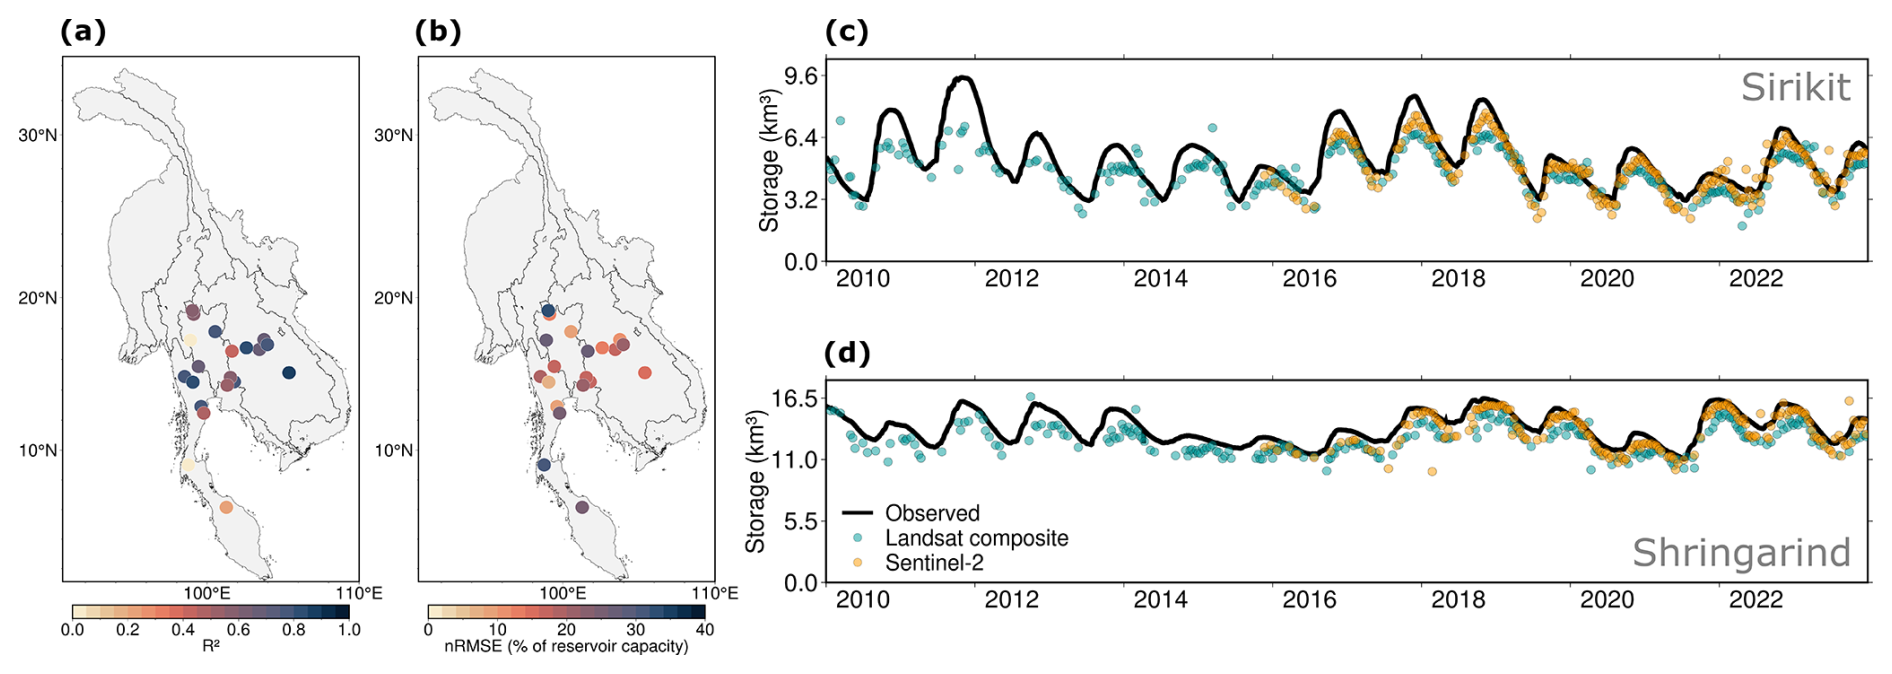
Figure 7Direct validation of the inferred storage time series against local observations. (a–b) Spatial distribution of R2 and nRMSE, respectively. (c) Comparison of the absolute storage time series for the Sirikit reservoir during the period 2010–2023. (d) Same as (c) but for the Shringarind reservoir.
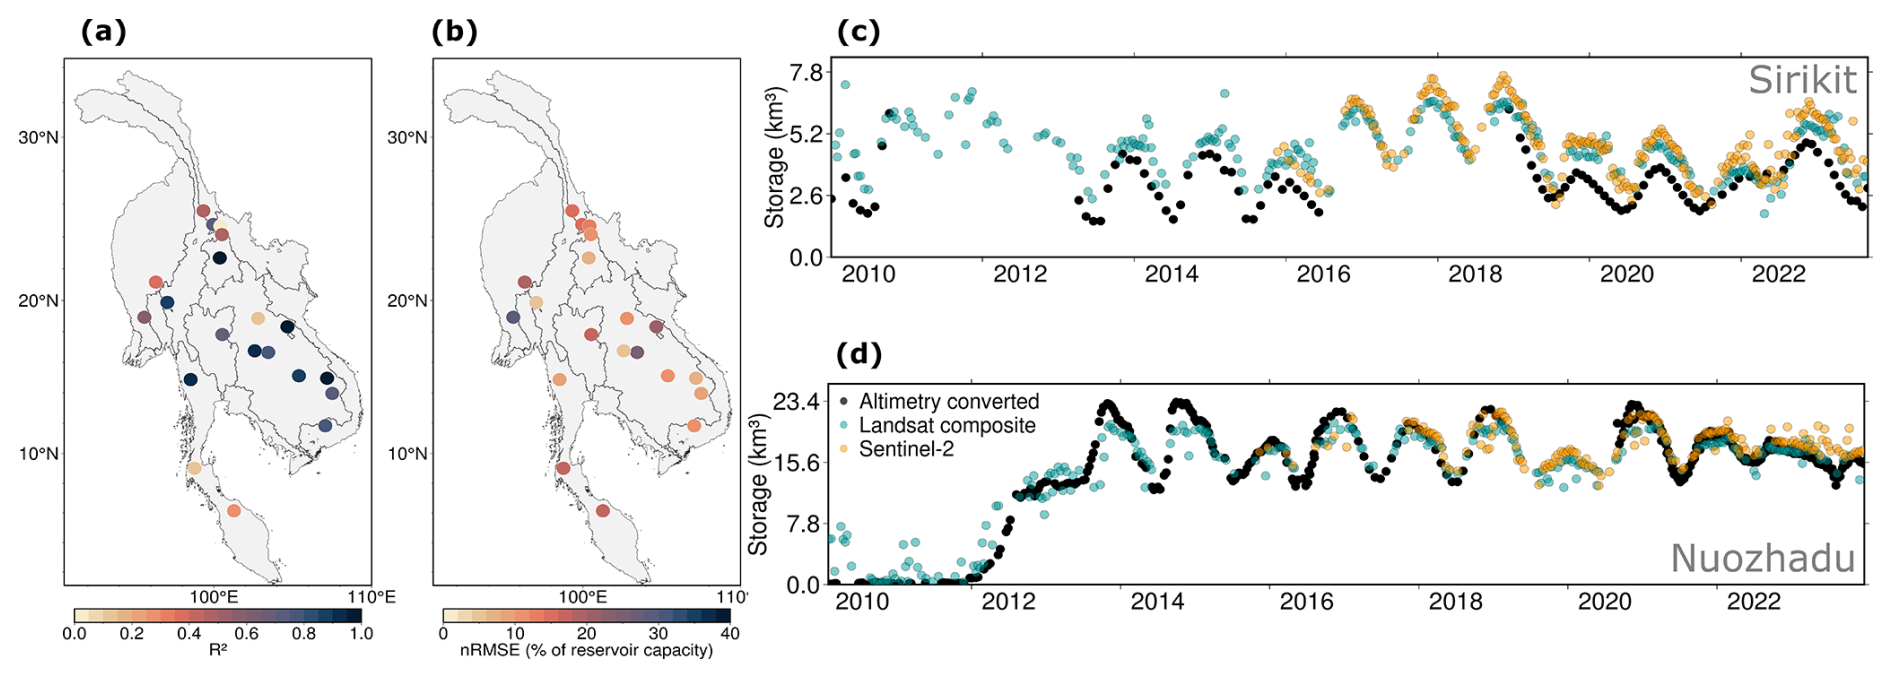
Figure 8Indirect validation of the inferred storage time series against the altimetry-converted storage (water level is converted into the corresponding storage using the elevation–storage curve). (a–b) Spatial distribution of R2 and nRMSE, respectively. (c) Comparison of the absolute storage time series for the Sirikit reservoir during the period 2010–2023. (d) Same as (c) but for the Nuozhadu reservoir.
4.5 Example application: the 2019–2020 drought's impact on water storage
We finally used the estimated storage time series (Level-1 data) to showcase an example application of the MSEA-Res database. Studies reported that the 2019–2020 drought in the MSEA region seriously impacted agriculture, water resources, and hydropower generation (Ha et al., 2022, 2023). Banking on the newly developed data, we analyzed the impact of the 2019–2020 drought on surface water storage across the region by utilizing precipitation data from the Climate Hazards group Infrared Precipitation with Stations (CHIRPS; Funk et al., 2015) and storage anomalies for all 186 reservoirs.
The precipitation anomalies (%) in 2019 and 2020 with respect to the reference period 1981–2023 are very pronounced (Fig. 9a, b). In 2019, Mainland Southeast Asia experienced widespread below-average precipitation conditions, with rainfall significantly lower than the historical average in most areas and some regions facing a decrease as high as −40 % (Fig. 9a). Nearly 30 % of the MSEA region suffered from more than 5 months of drought, impacting, in particular, Cambodia and Thailand (Fig. 9a). In contrast, 2020 showed a more mixed pattern, with several areas experiencing above-average precipitation and others continuing to have below-average levels (Fig. 9b). Overall, these severe drought conditions damaged nearly 40 % of the rainfed rice area (Ha et al., 2023) and also threatened the surface water storage in lakes and reservoirs (Ha et al., 2022).
To quantify the impact of the drought on the reservoir storage volume, we estimated the reservoir storage anomalies in 2019 and 2020 against the reference period 2017–2023. The anomalies in the storage volume of the selected reservoirs for 2019 and 2020 are mostly negative (Fig. 9c, d). In 2019, 120 of the 186 reservoirs (65 %) exhibited negative storage departures, reflecting reduced water levels consistent with the observed precipitation deficit (Fig. 9c). These storage departures ranged up to −40 %, highlighting significant impacts on water availability in the region. Many lakes in Cambodia and Thailand were indeed severely hit by the drought conditions, resulting in below-average levels. Reservoirs situated in the eastern basins (e.g., the Mekong and Red rivers) were affected most compared to the reservoirs in the western part, where some showed positive storage anomalies (Fig. 9c). Storage conditions worsened in 2020, with 144 of the 186 reservoirs (78 %) exhibiting negative storage departures, primarily due to the combined effects of precipitation deficits in both 2019 and 2020 (Fig. 9d). Interestingly, we noticed some discrepancy between the spatial distribution of the precipitation and the water storage anomalies (Fig. 9), likely due to the topology of the cascading reservoir system. In other words, some reservoirs are located in regions characterized by positive precipitation anomalies but may receive limited inflow from upstream reservoirs located in regions affected by droughts. Except for the reservoirs in the Upper Mekong basin, all the other reservoirs experienced storage anomalies ranging between −5 % and −40 % (Fig. 9d). This is in line with direct observations, as the reservoirs in nine provinces of Thailand – Chiang Mai, Uthai Thani, Chaiyaphum, Khon Kaen, Nakhon Ratchasima, Buri Ram, Suphan Buri, Lop Buri, and Chachoengsao – were reported to reach low storage values (Danial, 2021). As a result, Thailand experienced its worst water crisis in the past 40 years, with 25 provinces declaring drought disaster zones (Danial, 2021). Moreover, the 2019–2020 water shortage increased political tensions between the countries, particularly in the Upper Mekong region, thus exacerbating the impact of the drought in the lower basins. Overall, analyses like this one illustrate the importance of working with detailed information on reservoir operations when analyzing the impact of droughts: aside from the preliminary analysis reported here, one could, e.g., combine the storage data with a hydrological model to investigate the drought impact on the Mekong's level, which was reported to have reached its lowest value in almost 100 years (MRC report, 2020).
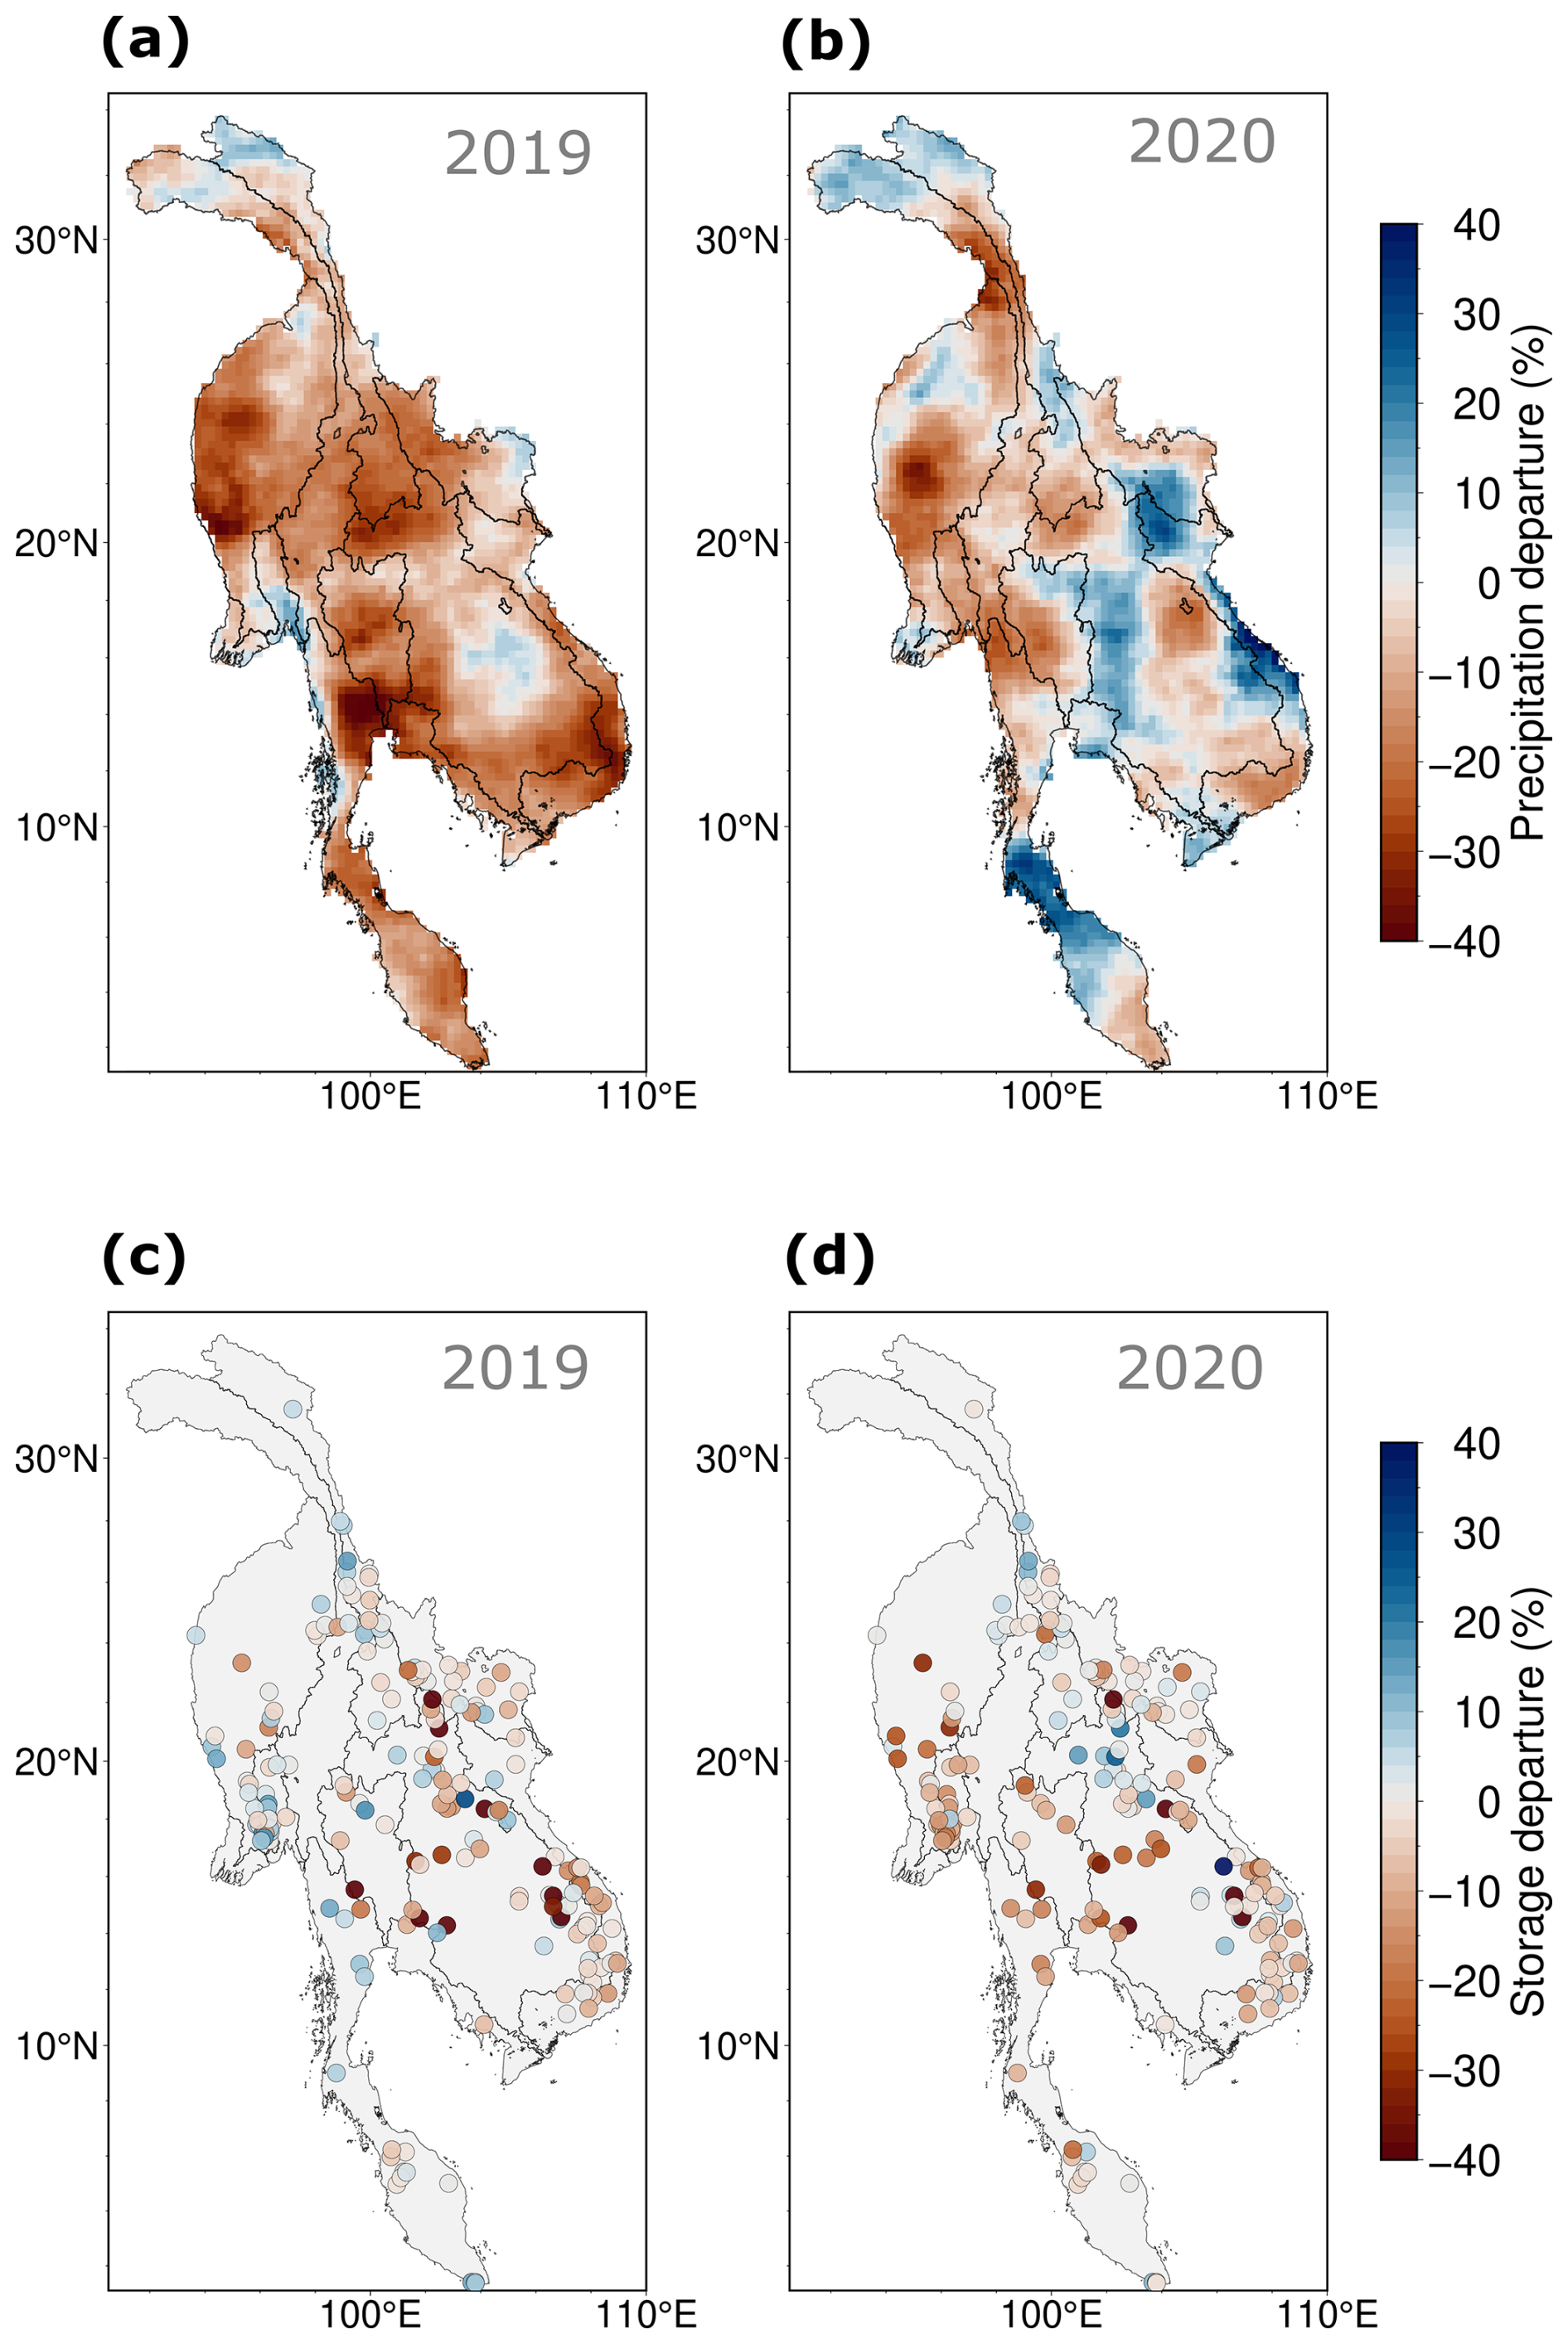
Figure 9Precipitation and water storage anomalies during the 2019–2020 drought in Mainland Southeast Asia. (a–b) Spatial variability in the precipitation anomalies (%) in 2019 and 2020. (c–d) Same as panels (a–b) but for the reservoir storage anomalies. The anomalies of precipitation were estimated against the reference period 1985–2023, whereas, for the storage anomalies, the reference period is 2017–2023.
The raw satellite data used in this study were acquired from Google Earth Engine (https://developers.google.com/earth-engine/datasets/catalog/landsat, Google Earth Engine, 2025). The reservoir location information was collected from the GRanD database (Lehner et al., 2011 – https://www.globaldamwatch.org/directory), the Mekong database (Ang et al., 2024 – https://researchdata.ntu.edu.sg/dataset.xhtml?persistentId=doi:10.21979/N9/ACZIJN), and the GDAT database (Zhang and Gu, 2023b – https://doi.org/10.5281/zenodo.7616852), which are all publicly available. The supporting data – the reconstructed reservoir bathymetry – were collected from the GRDL database (Hao et al., 2023) and are publicly available at https://doi.org/10.5281/zenodo.7726763. The MSEA-Res database containing the absolute reservoir storage time series and the Python code is available at https://doi.org/10.5281/zenodo.14844580 (Mahto et al., 2025).
We produced time series of absolute storage for 186 reservoirs (with capacities larger than 0.1 km3) in Mainland Southeast Asia for the period 1985–2023 with an aggregated storage capacity of nearly 175 km3 by the year 2023, which corresponds to about 60 mm of water storage over the entire Mainland Southeast Asia region. The reservoir time series were reconstructed using optical remote sensing data (NDWI) from Landsat composite images and Sentinel-2 images with a 10 d temporal resolution. The reservoir locations and other attributes, such as design capacity, year of commission, and maximum surface area, were retrieved by combining GRanD v1.3, the Mekong Dam database (Ang et al., 2024), and the Global Dam Tracker (GDAT) database. For each reservoir, we generated (i) a scene-based NDWI raster image, (ii) a water frequency raster, (iii) a maximum water extent raster, and (iv) an elevation raster (i.e., DEM). A Python package called InfeRes was created to automatically download and process all satellite images using the Google Earth Engine Python API. The water area from the satellite data was then translated into storage values using hypsometric curves (the area–elevation–storage relationship) derived from the Shuttle Radar Topography Mission (SRTM) digital elevation model (DEM) and bathymetry reconstructions from the GRDL database, wherever necessary.
The reconstructed database of the absolute storage time series – unlike storage change metrics – offers a detailed view of the reservoir status at any given time, thus providing a comprehensive and contextualized understanding of reservoir dynamics. This approach is particularly valuable for long-term monitoring (Gao et al., 2012) and planning of water resources in the region (Galelli et al., 2022; Minocha et al., 2024). Accurate absolute storage estimates allow for detection of subtle trends and shifts in water availability that could be masked by focusing solely on changes (Hou et al., 2024; Li et al., 2023). This is particularly crucial for transboundary rivers like the Mekong, where the availability of data on reservoir operations could help alleviate the water governance issues that have emerged in the past few years (Danial, 2021). Another important downstream application of MSEA-Res is hydrological modeling: integrating the estimated absolute reservoir storage data into hydrological models can offer significant advances in the understanding of human–water interactions and resource management in Mainland Southeast Asia. This integration allows for refinement of models that simulate water management strategies (Chang et al., 2019; Chowdhury et al., 2020; Galelli et al., 2022) and flood control (Shin et al., 2020; Wang et al., 2021).
Importantly, the developed code (available at https://doi.org/10.5281/zenodo.14844580, Mahto et al., 2025) and framework are not tailored to Southeast Asia, therefore enabling their application to individual studies or other regions as well as further enrichment of this inventory with new reservoirs. The publicly available reservoir time series dataset can be used directly to assess storage trends and variability under climate change; to infer reservoir operations, agricultural water management, and hydrological model inputs; and for comparison with previous studies. The overall outcome of our study will hopefully facilitate reservoir management and related research in hydrology, the environmental sciences, and climate studies.
Although the extraction of the water surface area using optical images from Landsat and Sentinel-2 has provided valuable insights, there remains scope for further improvements. For example, other image processing techniques can be applied to further enhance the water surface estimates. This includes band normalization, adaptive filtering, and edge enhancement filters other than AHE. Please note that AHE applied to NDWI images does not specifically correct for high turbidity, shadows, aquatic vegetation, mixed land–water pixels, or seasonal vegetation effects – this remains a limitation of our study. However, AHE (and similar techniques) aims to standardize reflectance values and reduce noise in NDWI-based water detection, thus helping address challenges like varying illumination conditions and subtle spectral differences that can lead to partial misclassification of water pixels, especially at the reservoir boundary.
Another area for improvement is the development of hypsometric curves using DEM data, which is limited by the acquisition date of the DEM – with the earliest widely available dataset being the SRTM DEM (30 m) from the year 2000. Consequently, for approximately 30 % of the reservoirs (constructed before 2000), we utilized the recently released GRDL database (Hao et al., 2024), which provides a deep-learning-based bathymetry reconstruction for 7250 GRanD reservoirs (Lehner et al., 2011), offering an alternative to traditional methods based on simplified geometric assumptions (Hou et al., 2024; Khazaei et al., 2022; Yigzaw et al., 2018). While GRDL demonstrates superior performance compared to earlier hypsometric curve methods, its accuracy depends heavily on the size and quality of the training dataset, introducing potential uncertainties in storage estimation. Furthermore, the reproducibility of GRDL's deep-learning-based results remains a challenge, limiting opportunities for further refinement and development. In contrast, geometric assumption-based methods, though less precise, offer greater flexibility and transparency for modification and advances. While reconstructing reservoir bathymetry remains a significant challenge, a hybrid approach that integrates geometric assumption-based methods, deep-learning techniques, and field observations can yield innovative results.
Opportunity for further improvement also lies in the integration of Sentinel-1 synthetic aperture radar (SAR) data. Unlike optical sensors, Sentinel-1 SAR can penetrate clouds and operate under all weather conditions, offering consistent and reliable observations. The higher spatial resolution of Sentinel data (10 m) compared to Landsat (30 m) also enables more accurate classification of water and non-water pixels. Looking ahead, storage estimates can be improved further by combining Sentinel-1's microwave SAR data with observations from the recently operational Surface Water and Ocean Topography (SWOT) mission (https://swot.jpl.nasa.gov/, last access: 20 January 2025) of NASA, which provides wide coverage of water height measurements (Altenau et al., 2021; Hausman et al., 2021; Hossain et al., 2022). This integration would not only enhance the detection and classification of water bodies but also allow for a more precise estimation of reservoir storage by linking surface area to accurate water height data.
The supplement related to this article is available online at https://doi.org/10.5194/essd-17-2693-2025-supplement.
SSM, SG, and SF conceived the idea and acquired the funds. SSM developed the methodology and software, conducted the investigation and analysis, curated the data, and drafted the initial manuscript. SG and SF reviewed and edited the manuscript.
The contact author has declared that none of the authors has any competing interests.
Publisher's note: Copernicus Publications remains neutral with regard to jurisdictional claims made in the text, published maps, institutional affiliations, or any other geographical representation in this paper. While Copernicus Publications makes every effort to include appropriate place names, the final responsibility lies with the authors.
We thank NUS Singapore for providing the technical resources and infrastructure to conduct the research. We also thank Faisal Hossain for his suggestions during the initial stages of this study.
This work is funded by the Singapore Ministry of Education (MoE) as part of its Academic Research Fund Tier 2, project no. MOE-000379-00/MOE-000379-01 and award no. MOE-T2EP50122-0004.
This paper was edited by Zihao Bian and reviewed by Edward Park and three anonymous referees.
Altenau, E. H., Pavelsky, T. M., Durand, M. T., Yang, X., Frasson, R. P. de M., and Bendezu, L.: The Surface Water and Ocean Topography (SWOT) Mission River Database (SWORD): A Global River Network for Satellite Data Products, Water Resour. Res., 57, e2021WR030054, https://doi.org/10.1029/2021WR030054, 2021.
Ang, W. J., Park, E., Pokhrel, Y., Tran, D. D., and Loc, H. H.: Dams in the Mekong: a comprehensive database, spatiotemporal distribution, and hydropower potentials, Earth Syst. Sci. Data, 16, 1209–1228, https://doi.org/10.5194/essd-16-1209-2024, 2024 (data available at: https://researchdata.ntu.edu.sg/dataset.xhtml?persistentId=doi:10.21979/N9/ACZIJN, last access: 11 June 2025).
Asghar, S., Gilanie, G., Saddique, M., Ullah, H., Mohamed, H. G., Abbasi, I. A., and Abbas, M.: Water Classification Using Convolutional Neural Network, IEEE Access, 11, 78601–78612, https://doi.org/10.1109/ACCESS.2023.3298061, 2023.
Bacalhau, J. R., Ribeiro Neto, A., Crétaux, J.-F., Bergé-Nguyen, M., and Moreira, D. M.: Bathymetry of reservoirs using altimetric data associated to optical images, Adv. Space Res., 69, 4098–4110, https://doi.org/10.1016/j.asr.2022.03.011, 2022.
Bakken, T. H., Aase, A. G., Hagen, D., Sundt, H., Barton, D. N., and Lujala, P.: Demonstrating a new framework for the comparison of environmental impacts from small- and large-scale hydropower and wind power projects, J. Environ. Manage., 140, 93–101, https://doi.org/10.1016/j.jenvman.2014.01.050, 2014.
Birkett, C., Reynolds, C., Beckley, B., and Doorn, B.: From Research to Operations: The USDA Global Reservoir and Lake Monitor, in: Coastal Altimetry, edited by: Vignudelli, S., Kostianoy, A. G., Cipollini, P., and Benveniste, J., Springer, Berlin, Heidelberg, 19–50, https://doi.org/10.1007/978-3-642-12796-0_2, 2011.
Birkett, C. M.: Contribution of the TOPEX NASA Radar Altimeter to the global monitoring of large rivers and wetlands, Water Resour. Res., 34, 1223–1239, https://doi.org/10.1029/98WR00124, 1998.
Busker, T., de Roo, A., Gelati, E., Schwatke, C., Adamovic, M., Bisselink, B., Pekel, J.-F., and Cottam, A.: A global lake and reservoir volume analysis using a surface water dataset and satellite altimetry, Hydrol. Earth Syst. Sci., 23, 669–690, https://doi.org/10.5194/hess-23-669-2019, 2019.
Chang, J., Guo, A., Wang, Y., Ha, Y., Zhang, R., Xue, L., and Tu, Z.: Reservoir Operations to Mitigate Drought Effects With a Hedging Policy Triggered by the Drought Prevention Limiting Water Level, Water Resour. Res., 55, 904–922, https://doi.org/10.1029/2017WR022090, 2019.
Chao, B. F., Wu, Y. H., and Li, Y. S.: Impact of artificial reservoir water impoundment on global sea level, Science, 320, 212–214, https://doi.org/10.1126/science.1154580, 2008.
Chen, T., Song, C., Luo, S., Ke, L., Liu, K., and Zhu, J.: Monitoring global reservoirs using ICESat-2: Assessment on spatial coverage and application potential, J. Hydrol., 604, 127257, https://doi.org/10.1016/j.jhydrol.2021.127257, 2022.
Chowdhury, A. F. M. K., Dang, T. D., Bagchi, A., and Galelli, S.: Expected Benefits of Laos' Hydropower Development Curbed by Hydroclimatic Variability and Limited Transmission Capacity: Opportunities to Reform, J. Water Res. Pl., 146, 05020019, https://doi.org/10.1061/(ASCE)WR.1943-5452.0001279, 2020.
Cooley, S. W., Ryan, J. C., and Smith, L. C.: Human alteration of global surface water storage variability, Nature, 591, 78–81, https://doi.org/10.1038/s41586-021-03262-3, 2021.
Crétaux, J.-F., Arsen, A., Calmant, S., Kouraev, A., Vuglinski, V., Bergé-Nguyen, M., Gennero, M.-C., Nino, F., Abarca Del Rio, R., Cazenave, A., and Maisongrande, P.: SOLS: A lake database to monitor in the Near Real Time water level and storage variations from remote sensing data, Adv. Space Res., 47, 1497–1507, https://doi.org/10.1016/j.asr.2011.01.004, 2011.
Danial, R.: Dams the and droughts, Mekong: data and diplomacy in the Mekong, https://www.sei.org/perspectives/dams-and-droughts-data-and-diplomacy-in-the-mekong/ (last access: 20 July 2024), 2021.
Dang, T. D., Chowdhury, A. F. M. K., and Galelli, S.: On the representation of water reservoir storage and operations in large-scale hydrological models: implications on model parameterization and climate change impact assessments, Hydrol. Earth Syst. Sci., 24, 397–416, https://doi.org/10.5194/hess-24-397-2020, 2020.
Das, P., Hossain, F., Khan, S., Biswas, N. K., Lee, H., Piman, T., Meechaiya, C., Ghimire, U., and Hosen, K.: Reservoir Assessment Tool 2.0: Stakeholder driven improvements to satellite remote sensing based reservoir monitoring, Environ. Model. Softw., 157, 105533, https://doi.org/10.1016/j.envsoft.2022.105533, 2022.
Degu, A. M., Hossain, F., Niyogi, D., Pielke Sr., R., Shepherd, J. M., Voisin, N., and Chronis, T.: The influence of large dams on surrounding climate and precipitation patterns, Geophys. Res. Lett., 38, L04405, https://doi.org/10.1029/2010GL046482, 2011.
Fang, C., Lu, S., Li, M., Wang, Y., Li, X., Tang, H., and Odion Ikhumhen, H.: Lake water storage estimation method based on similar characteristics of above-water and underwater topography, J. Hydrol., 618, 129146, https://doi.org/10.1016/j.jhydrol.2023.129146, 2023.
Farr, T. G., Rosen, P. A., Caro, E., Crippen, R., Duren, R., Hensley, S., Kobrick, M., Paller, M., Rodriguez, E., Roth, L., Seal, D., Shaffer, S., Shimada, J., Umland, J., Werner, M., Oskin, M., Burbank, D., and Alsdorf, D.: The Shuttle Radar Topography Mission, Rev. Geophys., 45, RG2004, https://doi.org/10.1029/2005RG000183, 2007.
Frappart, F., Calmant, S., Cauhopé, M., Seyler, F., and Cazenave, A.: Preliminary results of ENVISAT RA-2-derived water levels validation over the Amazon basin, Remote Sens. Environ., 100, 252–264, https://doi.org/10.1016/j.rse.2005.10.027, 2006.
Funk, C., Peterson, P., Landsfeld, M., Pedreros, D., Verdin, J., Shukla, S., Husak, G., Rowland, J., Harrison, L., Hoell, A., and Michaelsen, J.: The climate hazards infrared precipitation with stations – a new environmental record for monitoring extremes, Sci. Data, 2, 150066, https://doi.org/10.1038/sdata.2015.66, 2015.
Galelli, S., Dang, T. D., Ng, J. Y., Chowdhury, A. F. M. K., and Arias, M. E.: Opportunities to curb hydrological alterations via dam re-operation in the Mekong, Nat. Sustain., 5, 1058–1069, https://doi.org/10.1038/s41893-022-00971-z, 2022.
Gao, H., Birkett, C., and Lettenmaier, D. P.: Global monitoring of large reservoir storage from satellite remote sensing, Water Resour. Res., 48, W09504, https://doi.org/10.1029/2012WR012063, 2012.
Google Earth Engine: Raw satellite data, https://developers.google.com/earth-engine/datasets/catalog/landsat, last access: 11 June 2025.
Ha, T. V., Huth, J., Bachofer, F., and Kuenzer, C.: A Review of Earth Observation-Based Drought Studies in Southeast Asia, Remote Sens., 14, 3763, https://doi.org/10.3390/rs14153763, 2022.
Ha, T. V., Uereyen, S., and Kuenzer, C.: Agricultural drought conditions over mainland Southeast Asia: Spatiotemporal characteristics revealed from MODIS-based vegetation time-series, Int. J. Appl. Earth Obs., 121, 103378, https://doi.org/10.1016/j.jag.2023.103378, 2023.
Haddeland, I., Heinke, J., Biemans, H., Eisner, S., Flörke, M., Hanasaki, N., Konzmann, M., Ludwig, F., Masaki, Y., Schewe, J., Stacke, T., Tessler, Z. D., Wada, Y., and Wisser, D.: Global water resources affected by human interventions and climate change, P. Natl. Acad. Sci. USA, 111, 3251–3256, https://doi.org/10.1073/pnas.1222475110, 2014.
Hanasaki, N., Kanae, S., and Oki, T.: A reservoir operation scheme for global river routing models, J. Hydrol., 327, 22–41, https://doi.org/10.1016/j.jhydrol.2005.11.011, 2006.
Hao, Z., Chen, F., Jia, X., Cai, X., Yang, X., Du, Y., and Ling, F.: GRDL: Global Reservoir Area-Storage-Depth Dataset through Reconstructed Bathymetry Using Deep Learning, Zenodo [data set], https://doi.org/10.5281/zenodo.7726763, 2023.
Hao, Z., Chen, F., Jia, X., Cai, X., Yang, C., Du, Y., and Ling, F.: GRDL: A New Global Reservoir Area-Storage-Depth Data Set Derived Through Deep Learning-Based Bathymetry Reconstruction, Water Resour. Res., 60, e2023WR035781, https://doi.org/10.1029/2023WR035781, 2024.
Hausman, J., Moroni, D., Gangl, M., Zlotnicki, V., Vazquez-Cuervo, J., Armstrong, E. M., Oaida, C., Gierach, M., Finch, C., and Schroeder, C.: The evolution of the PO.DAAC: Seasat to SWOT, Adv. Space Res., 68, 1187–1193, https://doi.org/10.1016/j.asr.2019.11.030, 2021.
Hossain, F., Das, P., Srinivasan, M., Tsontos, V., Oaida, C. M., Nickles, C., McNelis, J., Bonnema, M., Picot, N., Peña-Luque, S., Doorn, B., Vinogradova-Shiffer, N., Andral, A., Gaultier, L., Jayaluxmi, I., Zhu, J., Fernando, N., Ul-Hasan, F., Fatima, B., Ahsan, M., Dhanya, C. T., Jayasinghe, S., Meechaiya, C., Barajas, M., Balakrishnan, V., Eldardiry, H., Elkholy, M., Abdelrazek, A., Fenoglio, L., Durand, M., Wei, R., and Pavelsky, T.: Building User-Readiness for Satellite Earth Observing Missions: The Case of the Surface Water and Ocean Topography (SWOT) Mission, AGU Adv., 3, e2022AV000680, https://doi.org/10.1029/2022AV000680, 2022.
Hou, J., Van Dijk, A. I. J. M., Renzullo, L. J., and Larraondo, P. R.: GloLakes: water storage dynamics for 27 000 lakes globally from 1984 to present derived from satellite altimetry and optical imaging, Earth Syst. Sci. Data, 16, 201–218, https://doi.org/10.5194/essd-16-201-2024, 2024.
Khazaei, B., Read, L. K., Casali, M., Sampson, K. M., and Yates, D. N.: GLOBathy, the global lakes bathymetry dataset, Sci. Data, 9, 36, https://doi.org/10.1038/s41597-022-01132-9, 2022.
Kirchherr, J., Pohlner, H., and Charles, K. J.: Cleaning up the big muddy: A meta-synthesis of the research on the social impact of dams, Environ. Impact Assess., 60, 115–125, https://doi.org/10.1016/j.eiar.2016.02.007, 2016.
Lehner, B., Liermann, C. R., Revenga, C., Vörösmarty, C., Fekete, B., Crouzet, P., Döll, P., Endejan, M., Frenken, K., Magome, J., Nilsson, C., Robertson, J. C., Rödel, R., Sindorf, N., and Wisser, D.: High-resolution mapping of the world's reservoirs and dams for sustainable river-flow management, Front. Ecol. Environ., 9, 494–502, https://doi.org/10.1890/100125, 2011 (data available at: https://www.globaldamwatch.org/directory, last access: 11 June 2025).
Li, Y., Gao, H., Zhao, G., and Tseng, K.-H.: A high-resolution bathymetry dataset for global reservoirs using multi-source satellite imagery and altimetry, Remote Sens. Environ., 244, 111831, https://doi.org/10.1016/j.rse.2020.111831, 2020.
Li, Y., Zhao, G., Allen, G. H., and Gao, H.: Diminishing storage returns of reservoir construction, Nat. Commun., 14, 3203, https://doi.org/10.1038/s41467-023-38843-5, 2023.
Liu, K. and Song, C.: Modeling lake bathymetry and water storage from DEM data constrained by limited underwater surveys, J. Hydrol., 604, 127260, https://doi.org/10.1016/j.jhydrol.2021.127260, 2022.
Liu, K., Song, C., Wang, J., Ke, L., Zhu, Y., Zhu, J., Ma, R., and Luo, Z.: Remote Sensing-Based Modeling of the Bathymetry and Water Storage for Channel-Type Reservoirs Worldwide, Water Resour. Res., 56, e2020WR027147, https://doi.org/10.1029/2020WR027147, 2020.
Maavara, T., Chen, Q., Van Meter, K., Brown, L. E., Zhang, J., Ni, J., and Zarfl, C.: River dam impacts on biogeochemical cycling, Nat. Rev. Earth Environ., 1, 103–116, https://doi.org/10.1038/s43017-019-0019-0, 2020.
Mahto, S. S., Galelli, S., and Fatichi, S.: A comprehensive time series dataset of absolute reservoir storage in Mainland Southeast Asia (MSEA-Res) from 1985 to 2023, Zenodo [data set], https://doi.org/10.5281/zenodo.14844580, 2025.
Markert, K. N., Pulla, S. T., Lee, H., Markert, A. M., Anderson, E. R., Okeowo, M. A., and Limaye, A. S.: AltEx: An open source web application and toolkit for accessing and exploring altimetry datasets, Environ. Modell. Softw., 117, 164–175, https://doi.org/10.1016/j.envsoft.2019.03.021, 2019.
McFeeters, S. K.: The use of the Normalized Difference Water Index (NDWI) in the delineation of open water features, Int. J. Remote Sens., 17, 1425–1432, https://doi.org/10.1080/01431169608948714, 1996.
Messager, M. L., Lehner, B., Grill, G., Nedeva, I., and Schmitt, O.: Estimating the volume and age of water stored in global lakes using a geo-statistical approach, Nat. Commun., 7, 13603, https://doi.org/10.1038/ncomms13603, 2016.
Minocha, S., Hossain, F., Das, P., Suresh, S., Khan, S., Darkwah, G., Lee, H., Galelli, S., Andreadis, K., and Oddo, P.: Reservoir Assessment Tool version 3.0: a scalable and user-friendly software platform to mobilize the global water management community, Geosci. Model Dev., 17, 3137–3156, https://doi.org/10.5194/gmd-17-3137-2024, 2024.
Nazemi, A. and Wheater, H. S.: On inclusion of water resource management in Earth system models – Part 1: Problem definition and representation of water demand, Hydrol. Earth Syst. Sci., 19, 33–61, https://doi.org/10.5194/hess-19-33-2015, 2015a.
Nazemi, A. and Wheater, H. S.: On inclusion of water resource management in Earth system models – Part 2: Representation of water supply and allocation and opportunities for improved modeling, Hydrol. Earth Syst. Sci., 19, 63–90, https://doi.org/10.5194/hess-19-63-2015, 2015b.
Nguyen, H. T. T., Turner, S. W. D., Buckley, B. M., and Galelli, S.: Coherent Streamflow Variability in Monsoon Asia Over the Past Eight Centuries – Links to Oceanic Drivers, Water Resour. Res., 56, e2020WR027883, https://doi.org/10.1029/2020WR027883, 2020.
Pekel, J. F., Cottam, A., Gorelick, N., and Belward, A. S.: High-resolution mapping of global surface water and its long-term changes, Nature 540, 418–422, https://doi.org/10.1038/nature20584, 2016.
Reza, A. M.: Realization of the Contrast Limited Adaptive Histogram Equalization (CLAHE) for Real-Time Image Enhancement, The Journal of VLSI Signal Processing-Systems for Signal, Image, and Video Technology, 38, 35–44, https://doi.org/10.1023/B:VLSI.0000028532.53893.82, 2004.
Santos da Silva, J., Calmant, S., Seyler, F., Rotunno Filho, O. C., Cochonneau, G., and Mansur, W. J.: Water levels in the Amazon basin derived from the ERS 2 and ENVISAT radar altimetry missions, Remote Sens. Environ., 114, 2160–2181, https://doi.org/10.1016/j.rse.2010.04.020, 2010.
Schwatke, C., Dettmering, D., Bosch, W., and Seitz, F.: DAHITI – an innovative approach for estimating water level time series over inland waters using multi-mission satellite altimetry, Hydrol. Earth Syst. Sci., 19, 4345–4364, https://doi.org/10.5194/hess-19-4345-2015, 2015.
Shen, Y., Liu, D., Jiang, L., Nielsen, K., Yin, J., Liu, J., and Bauer-Gottwein, P.: High-resolution water level and storage variation datasets for 338 reservoirs in China during 2010–2021, Earth Syst. Sci. Data, 14, 5671–5694, https://doi.org/10.5194/essd-14-5671-2022, 2022.
Shen, Y., Nielsen, K., Revel, M., Liu, D., and Yamazaki, D.: Res-CN (Reservoir dataset in China): hydrometeorological time series and landscape attributes across 3254 Chinese reservoirs, Earth Syst. Sci. Data, 15, 2781–2808, https://doi.org/10.5194/essd-15-2781-2023, 2023.
Shin, S., Pokhrel, Y., Yamazaki, D., Huang, X., Torbick, N., Qi, J., Pattanakiat, S., Ngo-Duc, T., and Nguyen, T. D.: High Resolution Modeling of River-Floodplain-Reservoir Inundation Dynamics in the Mekong River Basin, Water Resour. Res., 56, e2019WR026449, https://doi.org/10.1029/2019WR026449, 2020.
Skliris, N., Marsh, R., Haigh, I. D., Wood, M., Hirschi, J., Darby, S., Quynh, N. P., and Hung, N. N.: Drivers of rainfall trends in and around Mainland Southeast Asia, Front. Climate, 4, 926568, https://doi.org/10.3389/fclim.2022.926568, 2022.
Song, C., Fan, C., Zhu, J., Wang, J., Sheng, Y., Liu, K., Chen, T., Zhan, P., Luo, S., Yuan, C., and Ke, L.: A comprehensive geospatial database of nearly 100 000 reservoirs in China, Earth Syst. Sci. Data, 14, 4017–4034, https://doi.org/10.5194/essd-14-4017-2022, 2022.
Steyaert, J. C. and Condon, L. E.: Synthesis of historical reservoir operations from 1980 to 2020 for the evaluation of reservoir representation in large-scale hydrologic models, Hydrol. Earth Syst. Sci., 28, 1071–1088, https://doi.org/10.5194/hess-28-1071-2024, 2024.
Steyaert, J. C., Condon, L. E., W. D. Turner, S., and Voisin, N.: ResOpsUS, a dataset of historical reservoir operations in the contiguous United States, Sci. Data, 9, 34, https://doi.org/10.1038/s41597-022-01134-7, 2022.
Tortini, R., Noujdina, N., Yeo, S., Ricko, M., Birkett, C. M., Khandelwal, A., Kumar, V., Marlier, M. E., and Lettenmaier, D. P.: Satellite-based remote sensing data set of global surface water storage change from 1992 to 2018, Earth Syst. Sci. Data, 12, 1141–1151, https://doi.org/10.5194/essd-12-1141-2020, 2020.
Vörösmarty, C. J., McIntyre, P. B., Gessner, M. O., Dudgeon, D., Prusevich, A., Green, P., Glidden, S., Bunn, S. E., Sullivan, C. A., Liermann, C. R., and Davies, P. M.: Global threats to human water security and river biodiversity, Nature, 467, 555–561, https://doi.org/10.1038/nature09440, 2010.
Vu, D. T., Dang, T. D., Galelli, S., and Hossain, F.: Satellite observations reveal 13 years of reservoir filling strategies, operating rules, and hydrological alterations in the Upper Mekong River basin, Hydrol. Earth Syst. Sci., 26, 2345–2364, https://doi.org/10.5194/hess-26-2345-2022, 2022.
Wada, Y., Bierkens, M. F. P., de Roo, A., Dirmeyer, P. A., Famiglietti, J. S., Hanasaki, N., Konar, M., Liu, J., Müller Schmied, H., Oki, T., Pokhrel, Y., Sivapalan, M., Troy, T. J., van Dijk, A. I. J. M., van Emmerik, T., Van Huijgevoort, M. H. J., Van Lanen, H. A. J., Vörösmarty, C. J., Wanders, N., and Wheater, H.: Human–water interface in hydrological modelling: current status and future directions, Hydrol. Earth Syst. Sci., 21, 4169–4193, https://doi.org/10.5194/hess-21-4169-2017, 2017.
Wang, J., Yun, X., Pokhrel, Y., Yamazaki, D., Zhao, Q., Chen, A., and Tang, Q.: Modeling Daily Floods in the Lancang-Mekong River Basin Using an Improved Hydrological-Hydrodynamic Model, Water Resour. Res., 57, e2021WR029734, https://doi.org/10.1029/2021WR029734, 2021.
Weekley, D. and Li, X.: Tracking Multidecadal Lake Water Dynamics with Landsat Imagery and Topography/Bathymetry, Water Resour. Res., 55, 8350–8367, https://doi.org/10.1029/2019WR025500, 2019.
Wheeler, K. G., Basheer, M., Mekonnen, Z. T., Eltoum, S. O., Mersha, A., Abdo, G. M., Zagona, E. A., Hall, J. W., and Dadson, S. J.: Cooperative filling approaches for the Grand Ethiopian Renaissance Dam, Water Int., 41, 611–634, https://doi.org/10.1080/02508060.2016.1177698, 2016.
Winemiller, K. O., McIntyre, P. B., Castello, L., Fluet-Chouinard, E., Giarrizzo, T., Nam, S., Baird, I. G., Darwall, W., Lujan, N. K., Harrison, I., Stiassny, M. L. J., Silvano, R. A. M., Fitzgerald, D. B., Pelicice, F. M., Agostinho, A. A., Gomes, L. C., Albert, J. S., Baran, E., Petrere, M., Zarfl, C., Mulligan, M., Sullivan, J. P., Arantes, C. C., Sousa, L. M., Koning, A. A., Hoeinghaus, D. J., Sabaj, M., Lundberg, J. G., Armbruster, J., Thieme, M. L., Petry, P., Zuanon, J., Vilara, G. T., Snoeks, J., Ou, C., Rainboth, W., Pavanelli, C. S., Akama, A., Soesbergen, A. V., and Sáenz, L.: Balancing hydropower and biodiversity in the Amazon, Congo, and Mekong, Science, 351, 128–129, https://doi.org/10.1126/science.aac7082, 2016.
Yigzaw, W., Li, H.-Y., Demissie, Y., Hejazi, M. I., Leung, L. R., Voisin, N., and Payn, R.: A New Global Storage-Area-Depth Data Set for Modeling Reservoirs in Land Surface and Earth System Models, Water Resour. Res., 54, 10372–10386, https://doi.org/10.1029/2017WR022040, 2018.
Zaniolo, M., Giuliani, M., Sinclair, S., Burlando, P., and Castelletti, A.: When timing matters – misdesigned dam filling impacts hydropower sustainability, Nat. Commun., 12, 3056, https://doi.org/10.1038/s41467-021-23323-5, 2021.
Zhang, A. T. and Gu, V. X.: Global Dam Tracker: A database of more than 35,000 dams with location, catchment, and attribute information, Sci. Data, 10, 111, https://doi.org/10.1038/s41597-023-02008-2, 2023a.
Zhang, A. T. and Gu, V. X.: Global Dam Tracker: A database of more than 35,000 dams with location, catchment, and attribute information, In Scientific Data (Version v1, Bd. 10, Nummer 1, S. 111), Zenodo [data set], https://doi.org/10.5281/zenodo.7616852, 2023b.
Zhang, S. and Gao, H.: Using the Digital Elevation Model (DEM) to Improve the Spatial Coverage of the MODIS Based Reservoir Monitoring Network in South Asia, Remote Sens., 12, 745, https://doi.org/10.3390/rs12050745, 2020.
Zhang, S., Gao, H., and Naz, B. S.: Monitoring reservoir storage in South Asia from multisatellite remote sensing, Water Resour. Res., 50, 8927–8943, https://doi.org/10.1002/2014WR015829, 2014.