the Creative Commons Attribution 4.0 License.
the Creative Commons Attribution 4.0 License.
 | 10 Jun 2025
Fish functional groups of the North Atlantic and Arctic oceans
Murray S. A. Thompson
Izaskun Preciado
Federico Maioli
Valerio Bartolino
Andrea Belgrano
Michele Casini
Pierre Cresson
Elena Eriksen
Gema Hernandez-Milian
Ingibjörg G. Jónsdóttir
Stefan Neuenfeldt
John K. Pinnegar
Stefán Ragnarsson
Sabine Schückel
Ulrike Schückel
Brian E. Smith
María Ángeles Torres
Thomas J. Webb
Christopher P. Lynam
International efforts to assess the status of marine ecosystems have been hampered by insufficient observations of food web interactions across many species, their various life stages, and their geographic ranges. Hence, we collated data from multiple databases of fish stomach contents from samples taken across the North Atlantic and Arctic oceans containing 944 129 stomach samples from larvae to adults, with 14 196 unique interactions between 227 predator species and 2158 prey taxa. We use these data to develop a reproducible data-driven approach to classifying broad functional feeding guilds and then apply these to fish survey data from the north-east Atlantic shelf seas to reveal spatial and temporal changes in ecosystem structure and functioning. In doing so, we construct individual predator–prey body-mass scaling models to predict the biomass of prey functional groups, e.g. zooplankton, benthos, and fish, for different predator species. These predictions provide empirical estimates of species- and size-specific feeding traits of fish, such as predator–prey mass ratios, individual prey mass, and the biomass contribution of different prey to predator diets. The functional groupings and feeding traits provided here help to further resolve our understanding of interactions within marine food webs and support the use of trait-based indicators in biodiversity assessments. The data used and predictions generated in this study are published on the Cefas Data Hub at https://doi.org/10.14466/CefasDataHub.149 (Thompson et al., 2024).
- Article
(8062 KB) - Full-text XML
-
Supplement
(1858 KB) - BibTeX
- EndNote


Human pressures are affecting global patterns in marine ecosystem structure and functioning, from species distributions and their body sizes to how and where energy fluxes through food webs (Daufresne et al., 2009; Kortsch et al., 2015; du Pontavice et al., 2020). Grouping organisms into broad functional feeding guilds and assessing change in their populations has been widely advocated to assess marine ecosystem status, gauge sustainable levels of human pressure, and inform management interventions (ICES, 2018; Rombouts et al., 2013; Tam et al., 2017). Yet, international efforts to develop indicators of marine ecosystem status have been hampered by the large number of observations needed to understand food web processes involving many species, their various life stages, and their geographic ranges.
Despite the complexity of natural food webs, their structure and dynamics are largely determined by the size of the interacting organisms because predators are systematically larger than their prey, especially in aquatic ecosystems (Brose et al., 2006; Petchey et al., 2008; Woodward et al., 2005). The behaviour of organisms relating to their evolutionary history, including adaptations for specific foraging strategies and habitats, also affects predator–prey interactions (Brose et al., 2019; Link, 2004; Pecuchet et al., 2020; Pomeranz et al., 2019). Fish fulfil many different roles in an ecosystem (Katara et al., 2021), often starting life as planktivores which feed lower in the food web, with some species developing into intermediate (e.g. benthivores) and higher predator feeding guilds (e.g. piscivores) which consume larger prey as they grow. Despite differing methods being used to classify fish into feeding guilds, their biomasses have been shown to respond to human pressures including fishing and climate change (Garrison and Link, 2000a, b; Thompson et al., 2020). Analysing change in fish feeding guild biomass can, therefore, provide simultaneous information on ecosystem structure and functioning by revealing temporal changes, e.g. in the spatial distribution of planktivore biomass (structure), which is also indicative of change in the energy flux between plankton and fish (functioning). Change in the species richness of predators in feeding guilds provides a measure of functional redundancy where, for instance, relatively low and decreasing values highlight areas where a function is supported by only a few species and is at risk.
Internationally coordinated surveys with observations on fish species distributions, body sizes, and biomass provide extensive data used to assess change in fish feeding guilds (Lynam and Ribeiro, 2022). Complementing these, many fish stomach content data that contain information on food web interactions have been collected across the North Atlantic and Arctic oceans (Arroyo et al., 2017; Cachera et al., 2017; ICES, 1997; Pinnegar, 2019; Smith and Link, 2010; Torres et al., 2013). However, idiosyncrasies in how feeding information has been quantified and reported across different stomach content databases have hampered efforts to depict general feeding traits. Specifically, four feeding guilds relevant to fish are used in OSPAR (The Convention for the Protection of the Marine Environment of the North-East Atlantic) and the EU's MSFD (Marine Strategy Framework Directive) reporting processes but without an agreed upon data-driven method to categorize predators into them (i.e. planktivores, sub-apex demersal, sub-apex pelagic, and apex predators; Boschetti et al., 2021; Walmsley et al., 2016). Any macroecological assessment of feeding guilds may therefore be confounded because changes could have a methodological basis. This has constrained the contribution of food web indicators to marine ecosystem status assessment.
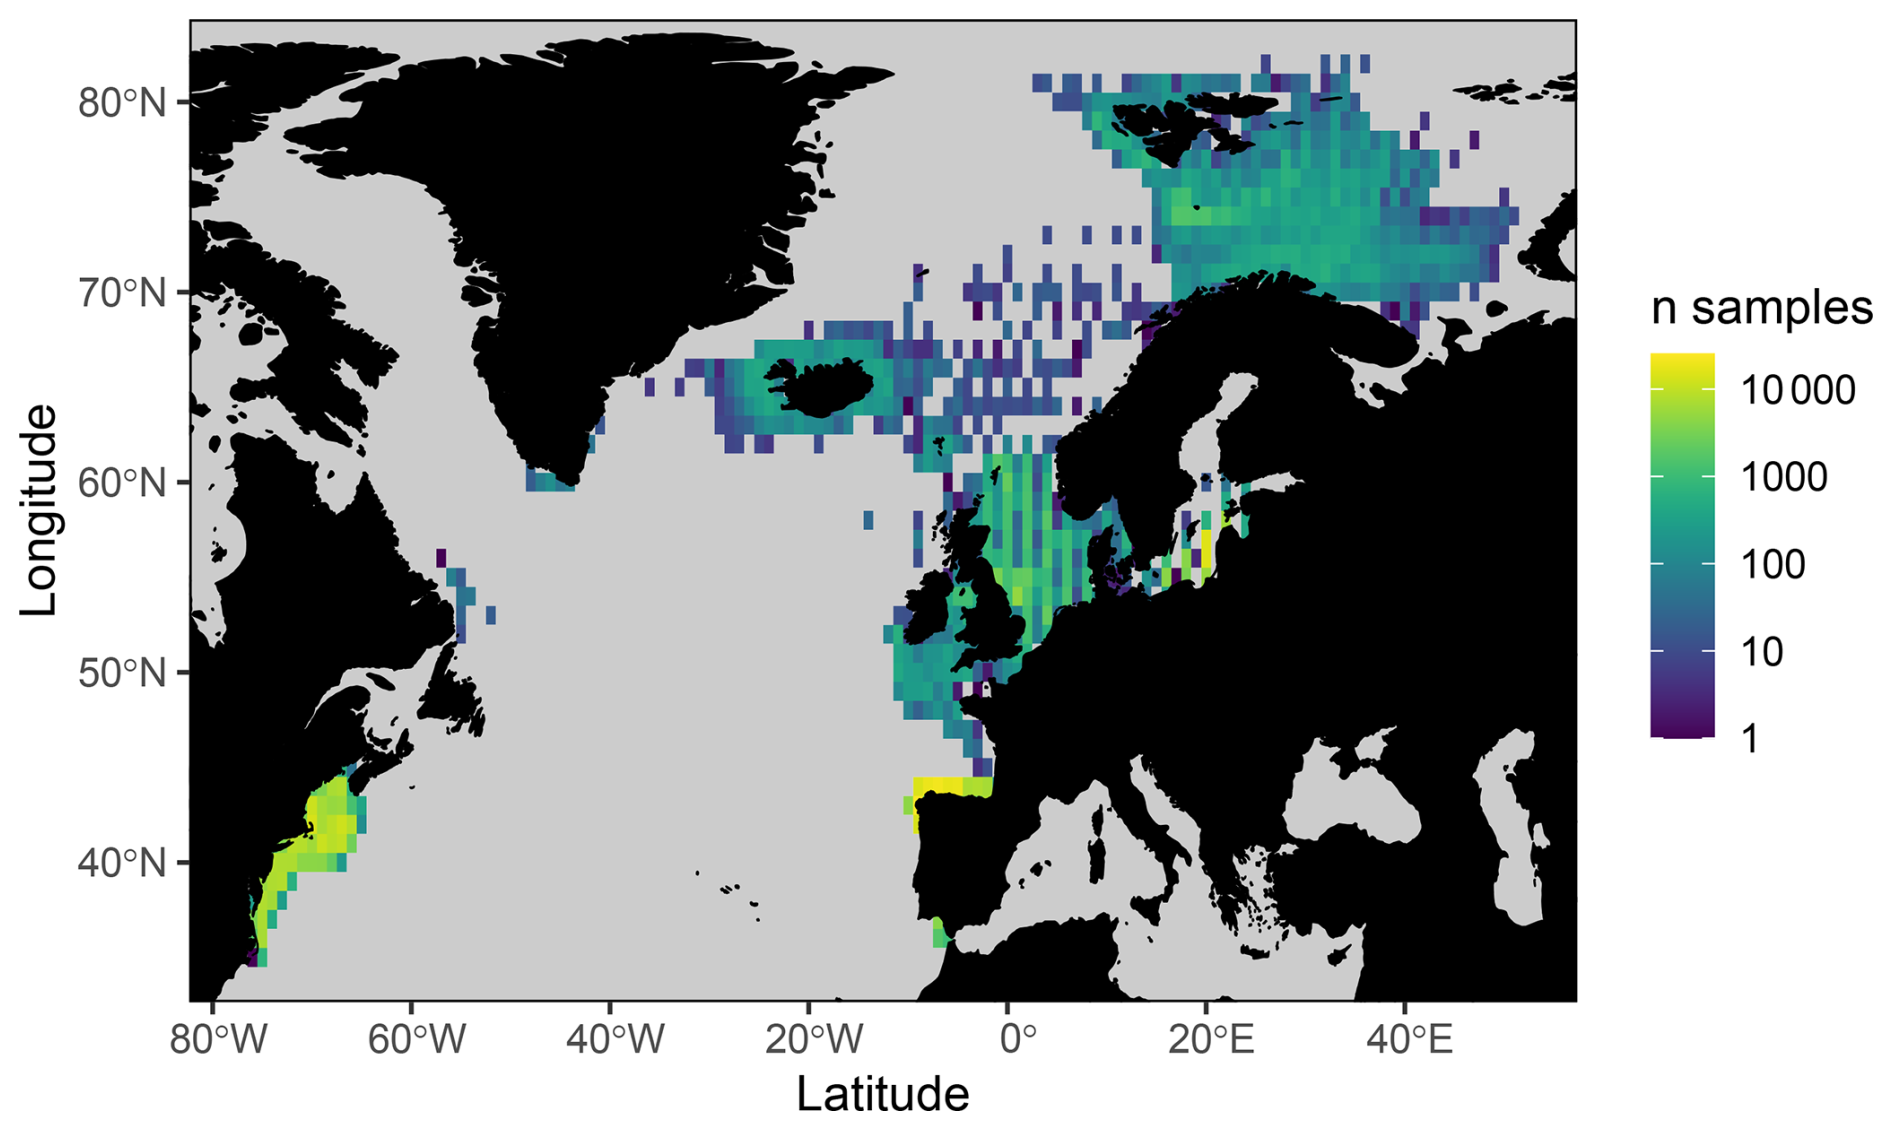
Figure 1Number of stomach samples on a 1° longitudinal by 1° latitudinal grid.
The body-mass scaling relationship between individual predators and individual prey (henceforth, predator–prey body-mass scaling) offers a means to depict general feeding traits across many species, their various life stages, and their geographic ranges that has so far been lacking. It is also important to empirically measure predator–prey body-mass scaling because it can affect the pathway and quantity of energy flux through a food web (Barnes et al., 2010; Brose et al., 2019; Nakazawa et al., 2011; Schneider et al., 2012). Predators feeding on relatively small prey yield high predator–prey mass ratios (PPMR) that can dampen strong oscillatory dynamics and thus help to maintain stability in food webs (Otto et al., 2007; Rooney et al., 2006) and ecosystem functioning (Nakazawa et al., 2011; Schneider et al., 2012; Wang and Brose, 2018). Moreover, both predator and prey taxonomy and their traits can be used to predict interactions with typically high PPMRs that may be particularly important to conserve (Brose et al., 2019; Reum et al., 2019). For instance, we anticipate that planktivorous and benthivorous fish will have some of the highest PPMRs, especially those that remain in the same feeding guild through ontogeny, while fish species which develop into piscivores could see the largest change (a decrease) in their PPMR across their individual body-mass range.
Here we make use of predator–prey body-mass scaling relationships to draw on multiple stomach content databases and derive comparable fish feeding trait information for the North Atlantic and Arctic oceans. This new data collation contains observations from 944 129 fish stomachs collected between 1836–2020. We use these feeding traits to categorize fish into feeding guilds in a way that is conducive to their application internationally and across ecosystems. Feeding guilds are then applied to survey data collected from across the north-east Atlantic shelf seas to demonstrate macroecological patterns in ecosystem structure and functioning relevant to status assessment advocated by OSPAR. We test the following hypotheses: (i) intra and interspecific body-mass scaling for predator species is dependent on prey group (e.g. plankton, benthos, and fish prey); (ii) multiple distinct feeding guilds are evident based on feeding trait data; (iii) the effectiveness to reliably and robustly classify predators into feeding guilds applicable across ecosystems varies due to whether classifications are based on the biomass of prey taxa, prey taxa occurrence, or broad feeding traits (i.e. PPMR, mean prey body mass, and the percent biomass contribution of different prey functional groups); (iv) feeding guilds capture significant spatio-temporal trends in the survey data. Our aim was 2-fold: to generate empirical estimates of fish feeding traits that could help improve understanding of changes in marine ecosystem structure and functioning and to achieve international consensus on the best approach to assessing feeding guilds across ecosystems within the OSPAR maritime area and in a way that can be readily extended to other areas (e.g. north-east US continental shelf, where applicable and routinely collected survey data exist but were outside the scope of our assessment) and organisms (e.g. invertebrates and mammals).
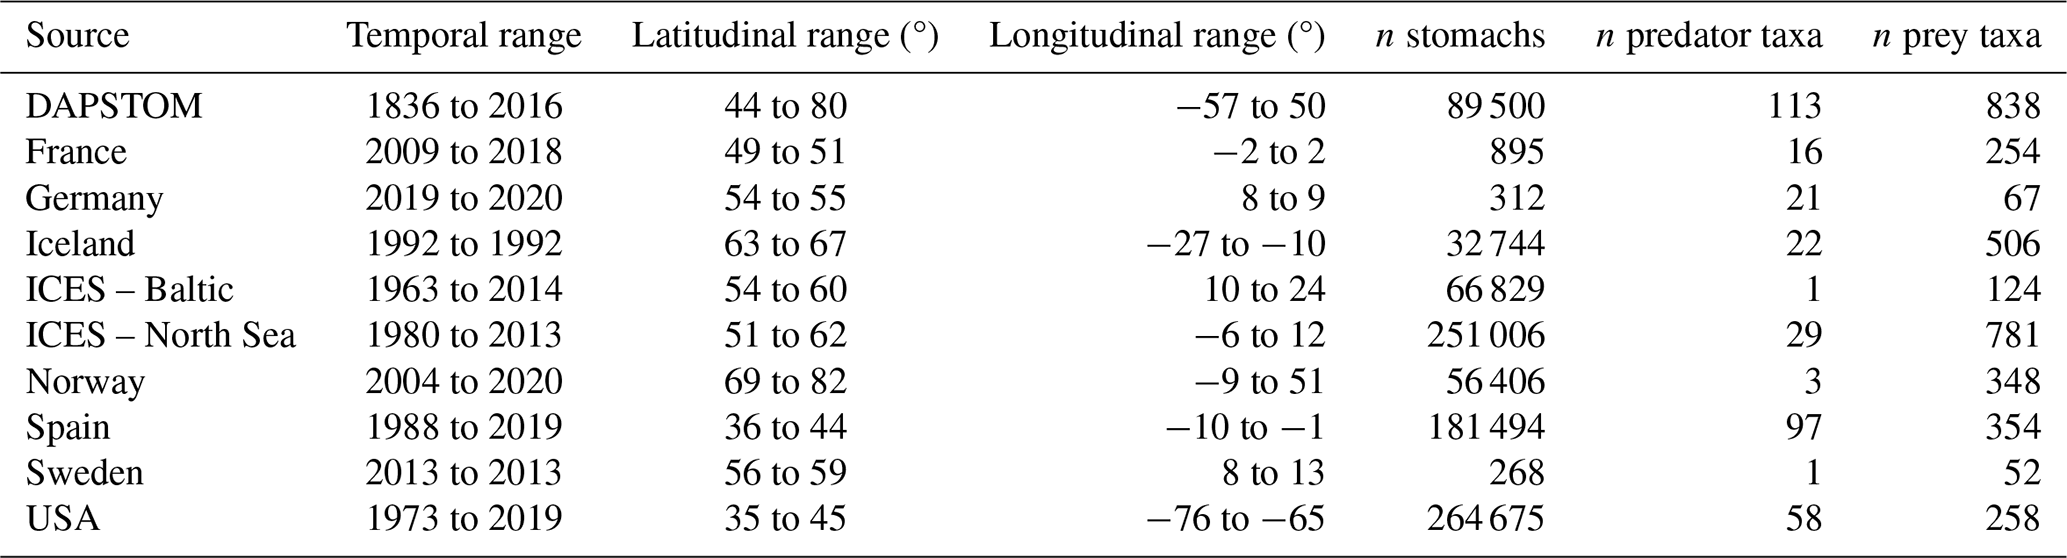
Table 1A summary of data sources, spatial and temporal ranges, and sample distributions (see also Fig. S1).
2.1 Stomach contents data
We draw together stomach contents data primarily collected from the North Atlantic shelf seas, with important contributions from the Baltic, Barents, and Norwegian seas (Figs. 1 and S1 in the Supplement). These data were sourced from a combination of previously published and unpublished data including DAPSTOM (an Integrated Database and Portal for Fish Stomach Records; Pinnegar, 2019), ICES Year of the Stomach (Daan, 1981; ICES, 1997), the north-east US continental shelf (Smith and Link, 2010), northern Spanish shelf (Arroyo et al., 2017), Gulf of Cadiz (Torres et al., 2013), and Swedish-, Icelandic-, Norwegian-, French- (Cachera et al., 2017; Timmerman et al., 2020; Travers-Trolet, 2017; Verin, 2018) and German-led surveys (e.g. FishNet, https://www.nationalpark-wattenmeer.de/wissensbeitrag/fishnet/, last access: 22 April 2021). We have included stomach contents data from outside the OSPAR area (i.e. north-east US continental shelf and Baltic Sea) to demonstrate the wider applicability of our approach to defining feeding guilds and because these data have been used to classify feeding guilds previously (Garrison and Link, 2000a). The full data collation contains observations from larval to adult predators (i.e. fish whose stomach contents have been sampled, ranging from < 1g to 351 kg), representing 14 196 unique interactions between 227 predator species and 2158 prey taxa (i.e. prey are defined as organisms found in stomach contents; https://doi.org/10.14466/CefasDataHub.149; Thompson et al., 2024). We provide a summary of data sources, spatial and temporal ranges, and sample distributions in Table 1. All data processing and subsequent analyses were conducted in R version 4.02 (R Core Team, 2020). Predator and prey taxonomy were processed using the taxize package (Chamberlain et al., 2020) and assigned to zooplankton, benthos, fish, nekton, and other functional groups after Webb and Vanhoorne (2020) using the worrms package (Chamberlain, 2019).
2.2 Quantifying intra- and interspecific body-mass scaling relationships between predators and different prey functional groups
Prey count and biomass observations (wet weight in grams) are needed to estimate predator–prey mass ratios (PPMR), but these were available for only 56 % of the stomach contents data. Therefore, to make use of all the data (Fig. 1; Table 1) when assigning fish to feeding guilds, a linear mixed effect model of predator–prey body-mass scaling was constructed to estimate prey counts or biomass where one or both were available. The model was constructed only using data where the taxonomy for both predator and prey was resolved (i.e. to species and functional group respectively) and individual predator body mass, individual prey body mass, and prey counts were all available. Major axis regression following Brose et al. (2019) was not suitable because we needed to make predictions of individual prey body mass and minimize the squared residuals in the response (Legendre, 1998). The log10-transformed individual prey mass (wet weight in grams) was modelled as the response variable, with log10-transformed predator body mass (wet weight in grams) as a fixed effect. Random intercepts and slopes were included for predator taxa and prey functional group to account for potential variation in their relationships with predator body mass. Random intercepts were fit for datasets which follow different protocols to test for systematic differences in how data were generated (i.e. Spain, USA, and ICES, which each follow their own protocols for measuring prey biomass, and all others,` which represent a mixture of methods from across studies). Random intercepts were also fit for years, sites (Fig. S1; sites based on a 3 by 3 grid across the study region), and the number of stomachs sampled (i.e. 1 is from multiple stomachs and 2 is where stomach samples were pooled). We use a Student's t distribution to account for heavy tails in the distribution of the response. We use the following model:
where Log10 transformed individual prey mass (wet weight in grams) is modelled following a Student's t distribution with mean μ, variance σ2, and degrees of freedom (Df) ν. The parameters α and β respectively represent intercepts and slopes that vary by grouping factors j to o. The Akaike information criterion (AIC) was used on nested models to assess the importance of all predictors. The full model had the lowest AIC by > 2 units, meaning all predictors were retained (Table S1 in the Supplement). Model diagnostic plots were performed using the R package DHARMa (Hartig, 2022).
The full model was then used to predict the mean individual body mass of prey functional groups for predator species of a given size. This enabled us to make use of many observations in DAPSTOM, for instance, which have recorded prey counts but no prey biomass. In such cases, we estimated the biomass of each prey taxa by multiplying the predicted mean individual body mass for their functional group by the observed prey count. Where prey counts were missing, e.g. much of the data from Smith and Link (2010; USA data in Fig. S1), we estimated these by dividing the observed biomass of each prey taxa by the predicted mean individual prey mass for their functional group. We provide R script and the data underlying our model, with an example showing how to predict mean individual prey size (i.e. generate fitted values) based on a list of predator taxa, predator body mass, and prey functional groups (https://github.com/MurraySAThompson/fish-feeding-traits-glmm, last access: 25 March 2024). Here we also demonstrate how to simulate data using the uncertainty measured by our model to help gauge its performance and because variability in individual prey masses is useful in food web research more broadly (Brose et al., 2019; Pomeranz et al., 2019; Scott et al., 2014). Our full model has temporal and spatial information as random effects because we were interested in developing general feeding traits for the study area, irrespective of spatial and temporal gradients. However, the significance of spatial and temporal random effects (Table S1) suggests future work exploring environmental change drivers of predator–prey body-mass scaling could be fruitful. All linear mixed effects models were fit using the glmmTMB R package (Brooks et al., 2017).
2.3 Classifying predator feeding guilds based on feeding trait data
Predators were categorized by species and individual body mass. We use 20 equal size bins to categorize predator mass along a log 10 transformed gradient from 0.1 micrograms to 190 tonnes, capable of capturing organisms from plankton to blue whales (Table S2). Data for each species grouped into body-mass bins (henceforth species body-mass bins) were then estimated across all available stomach samples (Fig. 1; Table 1), with means calculated for percent prey functional group biomass, biomass-weighted PPMR (after Reum et al., 2019), and mean individual prey mass (see feeding guilds.csv; https://doi.org/10.14466/CefasDataHub.149). We used directly observed data where available and predictions (i.e. the fitted values) from our predator–prey body-mass scaling models where data were missing. Feeding guilds were assigned based on cluster analysis using the “ward D2” agglomeration method on Bray–Curtis dissimilarities between predator diets available in the R stats package (R Core Team, 2020).
We compared different methods of classifying feeding guilds where the dissimilarity matrix used in the cluster analysis was generated using one of the following: (1) the biomass of prey taxa (Garrison and Link, 2000a), (2) prey taxa occurrence (Thompson et al., 2020), or (3) via a novel method where dissimilarities are based on broad feeding traits (henceforth, the biomass, occurrence, and trait methods). Feeding traits were log 10 transformed mean individual prey mass (g), log 10 transformed mean biomass-weighted PPMR, and the mean percent biomass contribution to the stomach contents of zooplankton (including fish < 0.5 g), benthos, nekton (other than fish), and fish (all fish prey ≥ 0.5 g), with all variables rescaled to values of or between 0 and 1. We tested for differences between these methods of classifying feeding guilds by comparing them after re-sampling (n = 1000) subsets of the data (n = 30 unique stomach samples per predator). Predators with fewer than 30 samples were not classified into feeding guilds. Compositional change in predators between successively reclassified feeding guilds was used to determine the ability of each method to consistently classify similar predators in the same guild. Compositional change was measured using the distance to centroid following analysis of multivariate homogeneity of groups dispersions (Anderson, 2006). The method with the lowest mean distance to centroid was determined to have the most robust feeding guild classifications as determined using analysis of variance tests. First, we tested whether compositional change across feeding guilds was non-random for each method: distance to centroid (i.e. compositional change) was the response, with “Guild” and “Data” (i.e. a factor identifying each unique re-sampling event) as predictors. We then tested for significant differences between methods: distance to centroid (i.e. compositional change) was the response, with “Method”, “Guild”, and “Data” as predictors. Significant predictors were determined using the F test on nested models. Targeted tests for differences between the mean distance to centroid across methods were carried out using Tukey's all-pairwise comparisons that correct for multiple comparisons in the multcomp package (Hothorn et al., 2008).
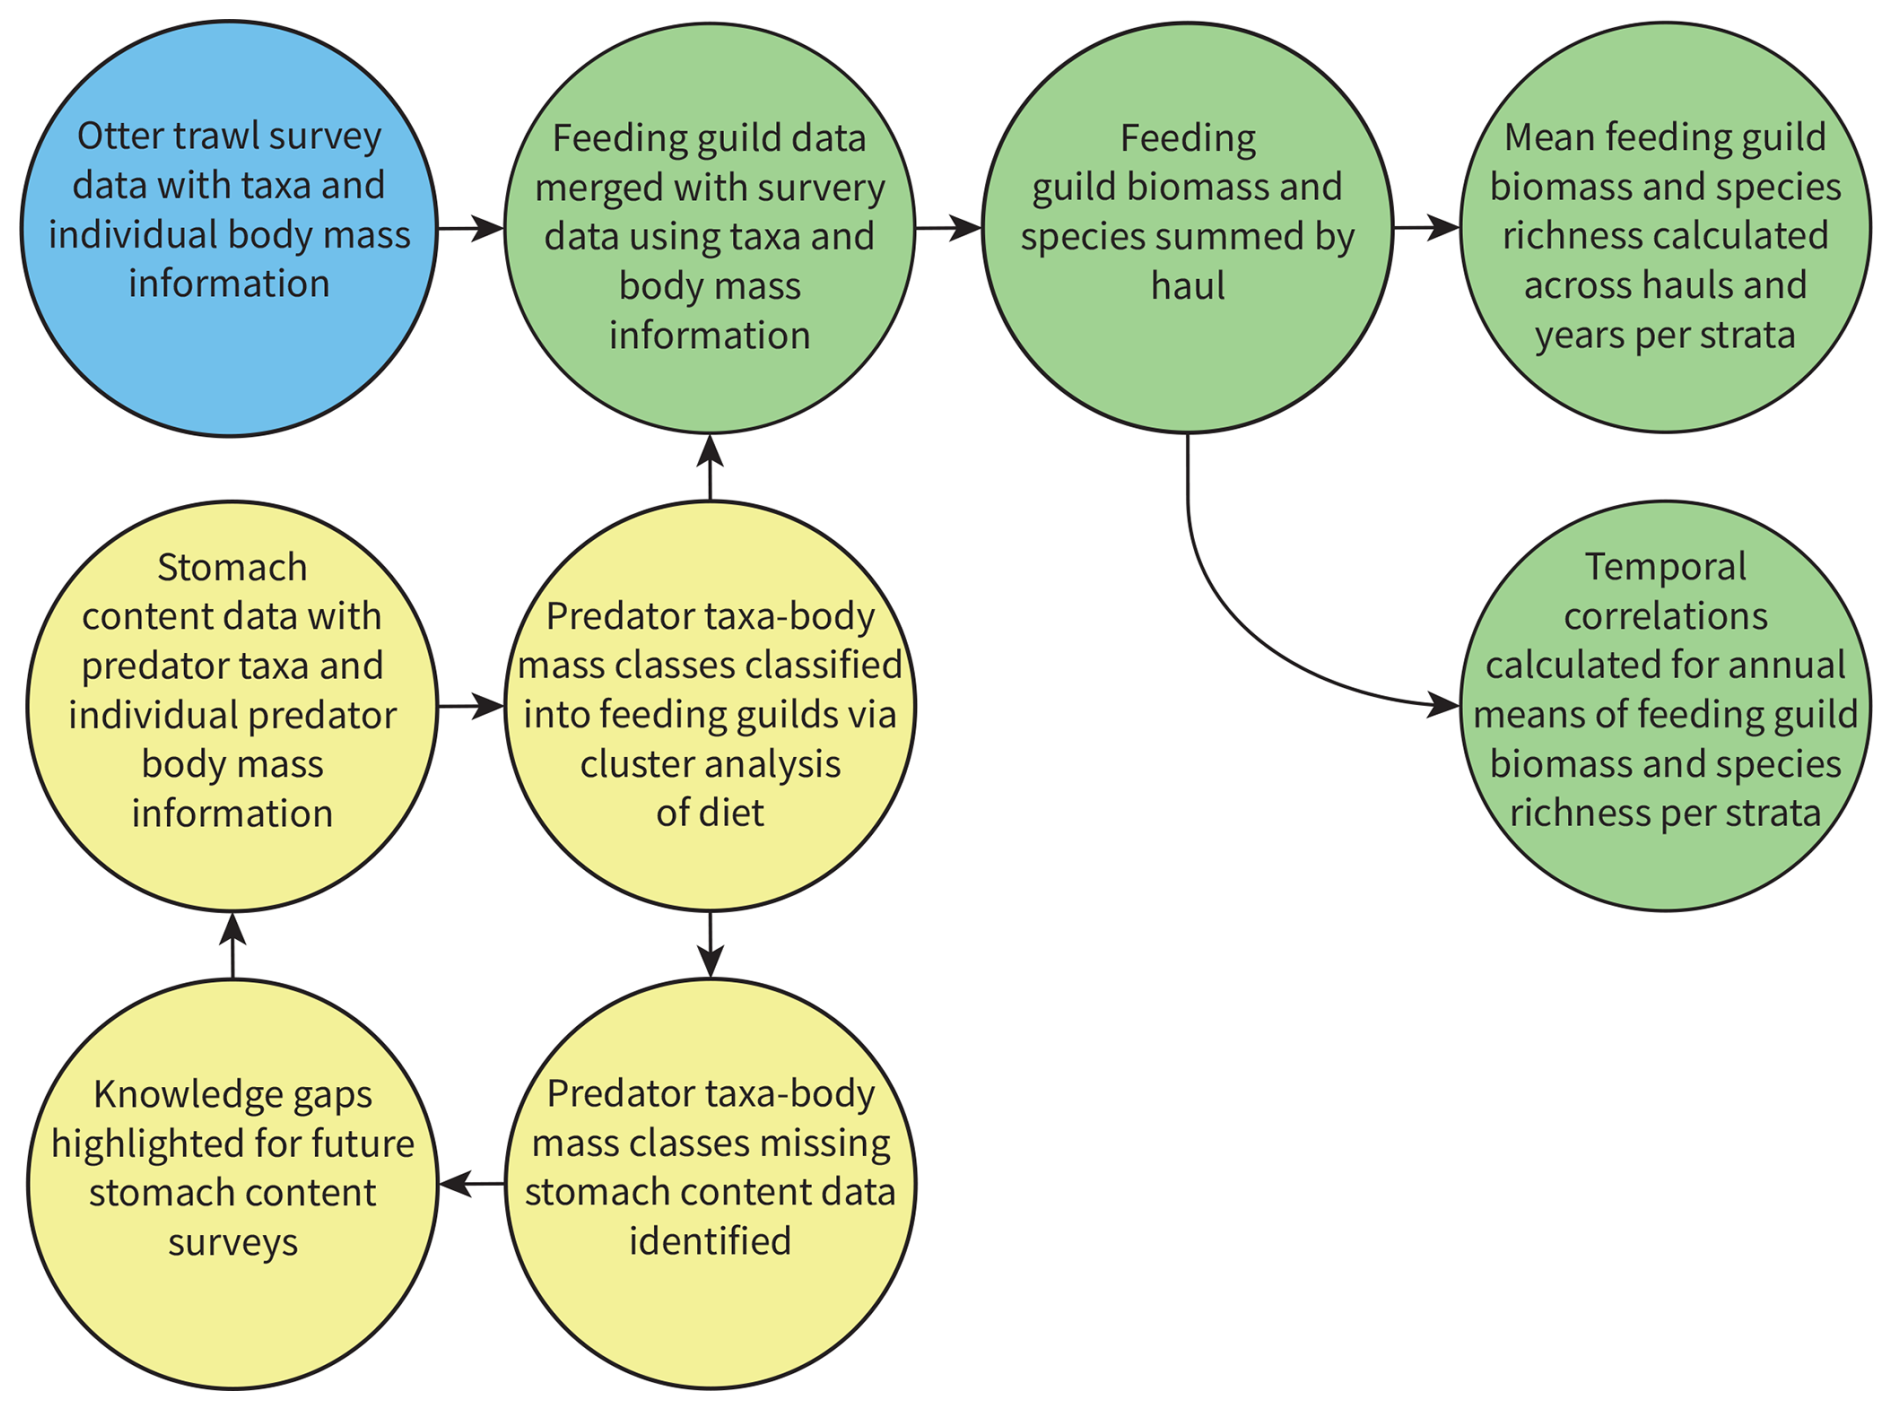
Figure 2The process used to classify feeding guilds based on predator stomach contents data, assign them to survey data, and calculate feeding guild responses across the assessment strata. Yellow circles are stomach contents data, blue circle is otter trawl survey data, green circles are survey data with feeding guild information appended, and arrows show the flow of information.
The ability to classify common feeding guilds across ecosystems (e.g. sub-apex and apex predators) rather than area-specific guilds (e.g. a feeding guild unique to the North Sea) is another important quality for a feeding guild indicator to exhibit. We assessed how important spatial gradients were in our three different approaches to classifying feeding guilds. First, we generated latitudinal and longitudinal coordinate centroids for each predator by taking a mean across their stomach samples. We then took a mean across these predator centroids to generate a centroid for all the data and also took means across these predator centroids but grouped by feeding guild and method to generate method-specific guild centroids. Next, we measured the distance between the overall data centroid to the method-specific guild centroids using the geosphere package (Hijmans et al., 2021) and summed distances for each method. A large sum of distances for a method to the overall data centroid would indicate that feeding guilds were area-specific, largely made up of predators found close together, and thus spatial gradients would be important determinants of feeding guild structure. The method with the lowest sum of distances to the overall data centroid was deemed to be least affected by spatial gradients and thus preferred.
We provide a sensitivity analysis to determine if our modelled stomach contents data affected our conclusions about which approach to feeding guild classification was optimal. Using only observed data for prey weight and counts from DAPSTOM and ICES Year of the Stomach and data from the north-east US continental shelf (i.e. those that have published prey taxa information), we compare the ability of the different approaches to consistently classify similar predators in the same guild and classify common feeding guilds across ecosystems, as described above. Results are provided in the Supplement.
Four feeding guilds have been called for in OSPAR and MSFD guidance, i.e. planktivores, sub-apex demersal, sub-apex pelagic, and apex predators (Boschetti et al., 2021; Walmsley et al., 2016; see also https://oap.ospar.org/en/resource-catalogue/enumeration-tables/cemp-enumeration-tables/, last access: 25 March 2024), without consensus on how to categorize predators into these guilds. We use four feeding guilds here to help bridge this gap and so that we can elegantly capture a broad set of ecosystem components while exploring guild responses in biomass and species richness in the survey data. Changing the number of feeding guilds could be justified, depending on the question, and is straightforward to implement by taking a higher or lower split in the classification tree. We see this as a strength of our approach because feeding guilds are hierarchically structured much like how taxonomic or other trait information has been organized. We provide a table which details the branches for up to five feeding guilds so future assessments can choose which level of complexity suits their need. We also present axis scores from a non-metric multidimensional scaling analysis of the dissimilarities used in our cluster analysis, which provide a more nuanced understanding (i.e. bounded data as opposed to categorical) of different predator feeding traits in relation to others. Moreover, because it is a reproducible data-driven approach, new information can be systematically integrated to further resolve differences in (1) feeding traits and (2) feeding guild composition and (3) to test if changes in predator feeding traits provides evidence for spatially or temporally flexible classifications.
2.4 Using feeding guilds to capture spatio-temporal trends in survey data
The new feeding guild classifications have been applied to processed otter trawl survey data for the north-east Atlantic shelf seas collected between 1997–2020 (Lynam and Ribeiro, 2022) to reveal spatial and temporal patterns in feeding guild responses (Fig. 2). These survey data have been processed specifically to support state indicators, with observations for the biomass of species body-mass bins standardized to the area swept for each haul. Survey data corresponding with all our stomach content data, from the north of Norway, Icelandic waters, the Baltic Sea, and the eastern shelf seas of the USA, have not yet been standardized and processed in the same way, and hence we have not included them here. Extending this work to assess change in ecosystem structure and function across the study region covered by the stomach contents data (Fig. 1) represents a key area for future development. We also provide the necessary R code (https://github.com/MurraySAThompson/fish-feeding-guild-classifcation, last access: 31 January 2025) so that our feeding guilds can be readily appended to new survey data when available and processed as required.
Compared with quarter 2 and 3 (April–September), data from quarters 1 and 4 (January–March and October–December respectively) typically have longer time series available over much of the study region and so were preferentially selected. Where data from quarters 1 or 4 were not available, otter trawl data from other quarters were used. Table S3 provides information on the surveys used and their spatial and temporal ranges and Fig. S2 depicts survey locations within OSPAR regions (e.g. Celtic Seas, North Sea). The temporal assessment covers 1997–2020 because the majority of the surveys considered have at least a near-complete time series covering that period. Longer time series do exist for some surveys but including these data would mean we are looking at long-term change for some areas but shorter-term change for others which could confound interpretation. Spatial and temporal change in feeding guild responses were determined for the Greater North Sea, Celtic Seas, Bay of Biscay and Iberian Coast, and the wider Atlantic. The assessment strata used here replicate those used for the OSPAR food web indicators: mean-maximum length and size-composition in fish communities (Lynam et al., 2022; Lynam and Piet, 2022).
Kendall's τ trend analysis was used to identify areas of significant temporal change in feeding guild responses based on the relationship between mean haul-level values of feeding biomass and species richness for each assessment strata and year. Kendall's τ scores of −1 to +1 represent a 100 % probability of a decreasing or increasing trend respectively. By using Kendall's τ, which is rank-based and non-parametric, we can detect correlations which may be non-linear. Stomach contents data, prey size predictions, and haul-level estimates of feeding guild biomass and their species richness, along with Kendall's τ correlation coefficients and p, have all been made available (https://doi.org/10.14466/CefasDataHub.149; Thompson et al., 2024).
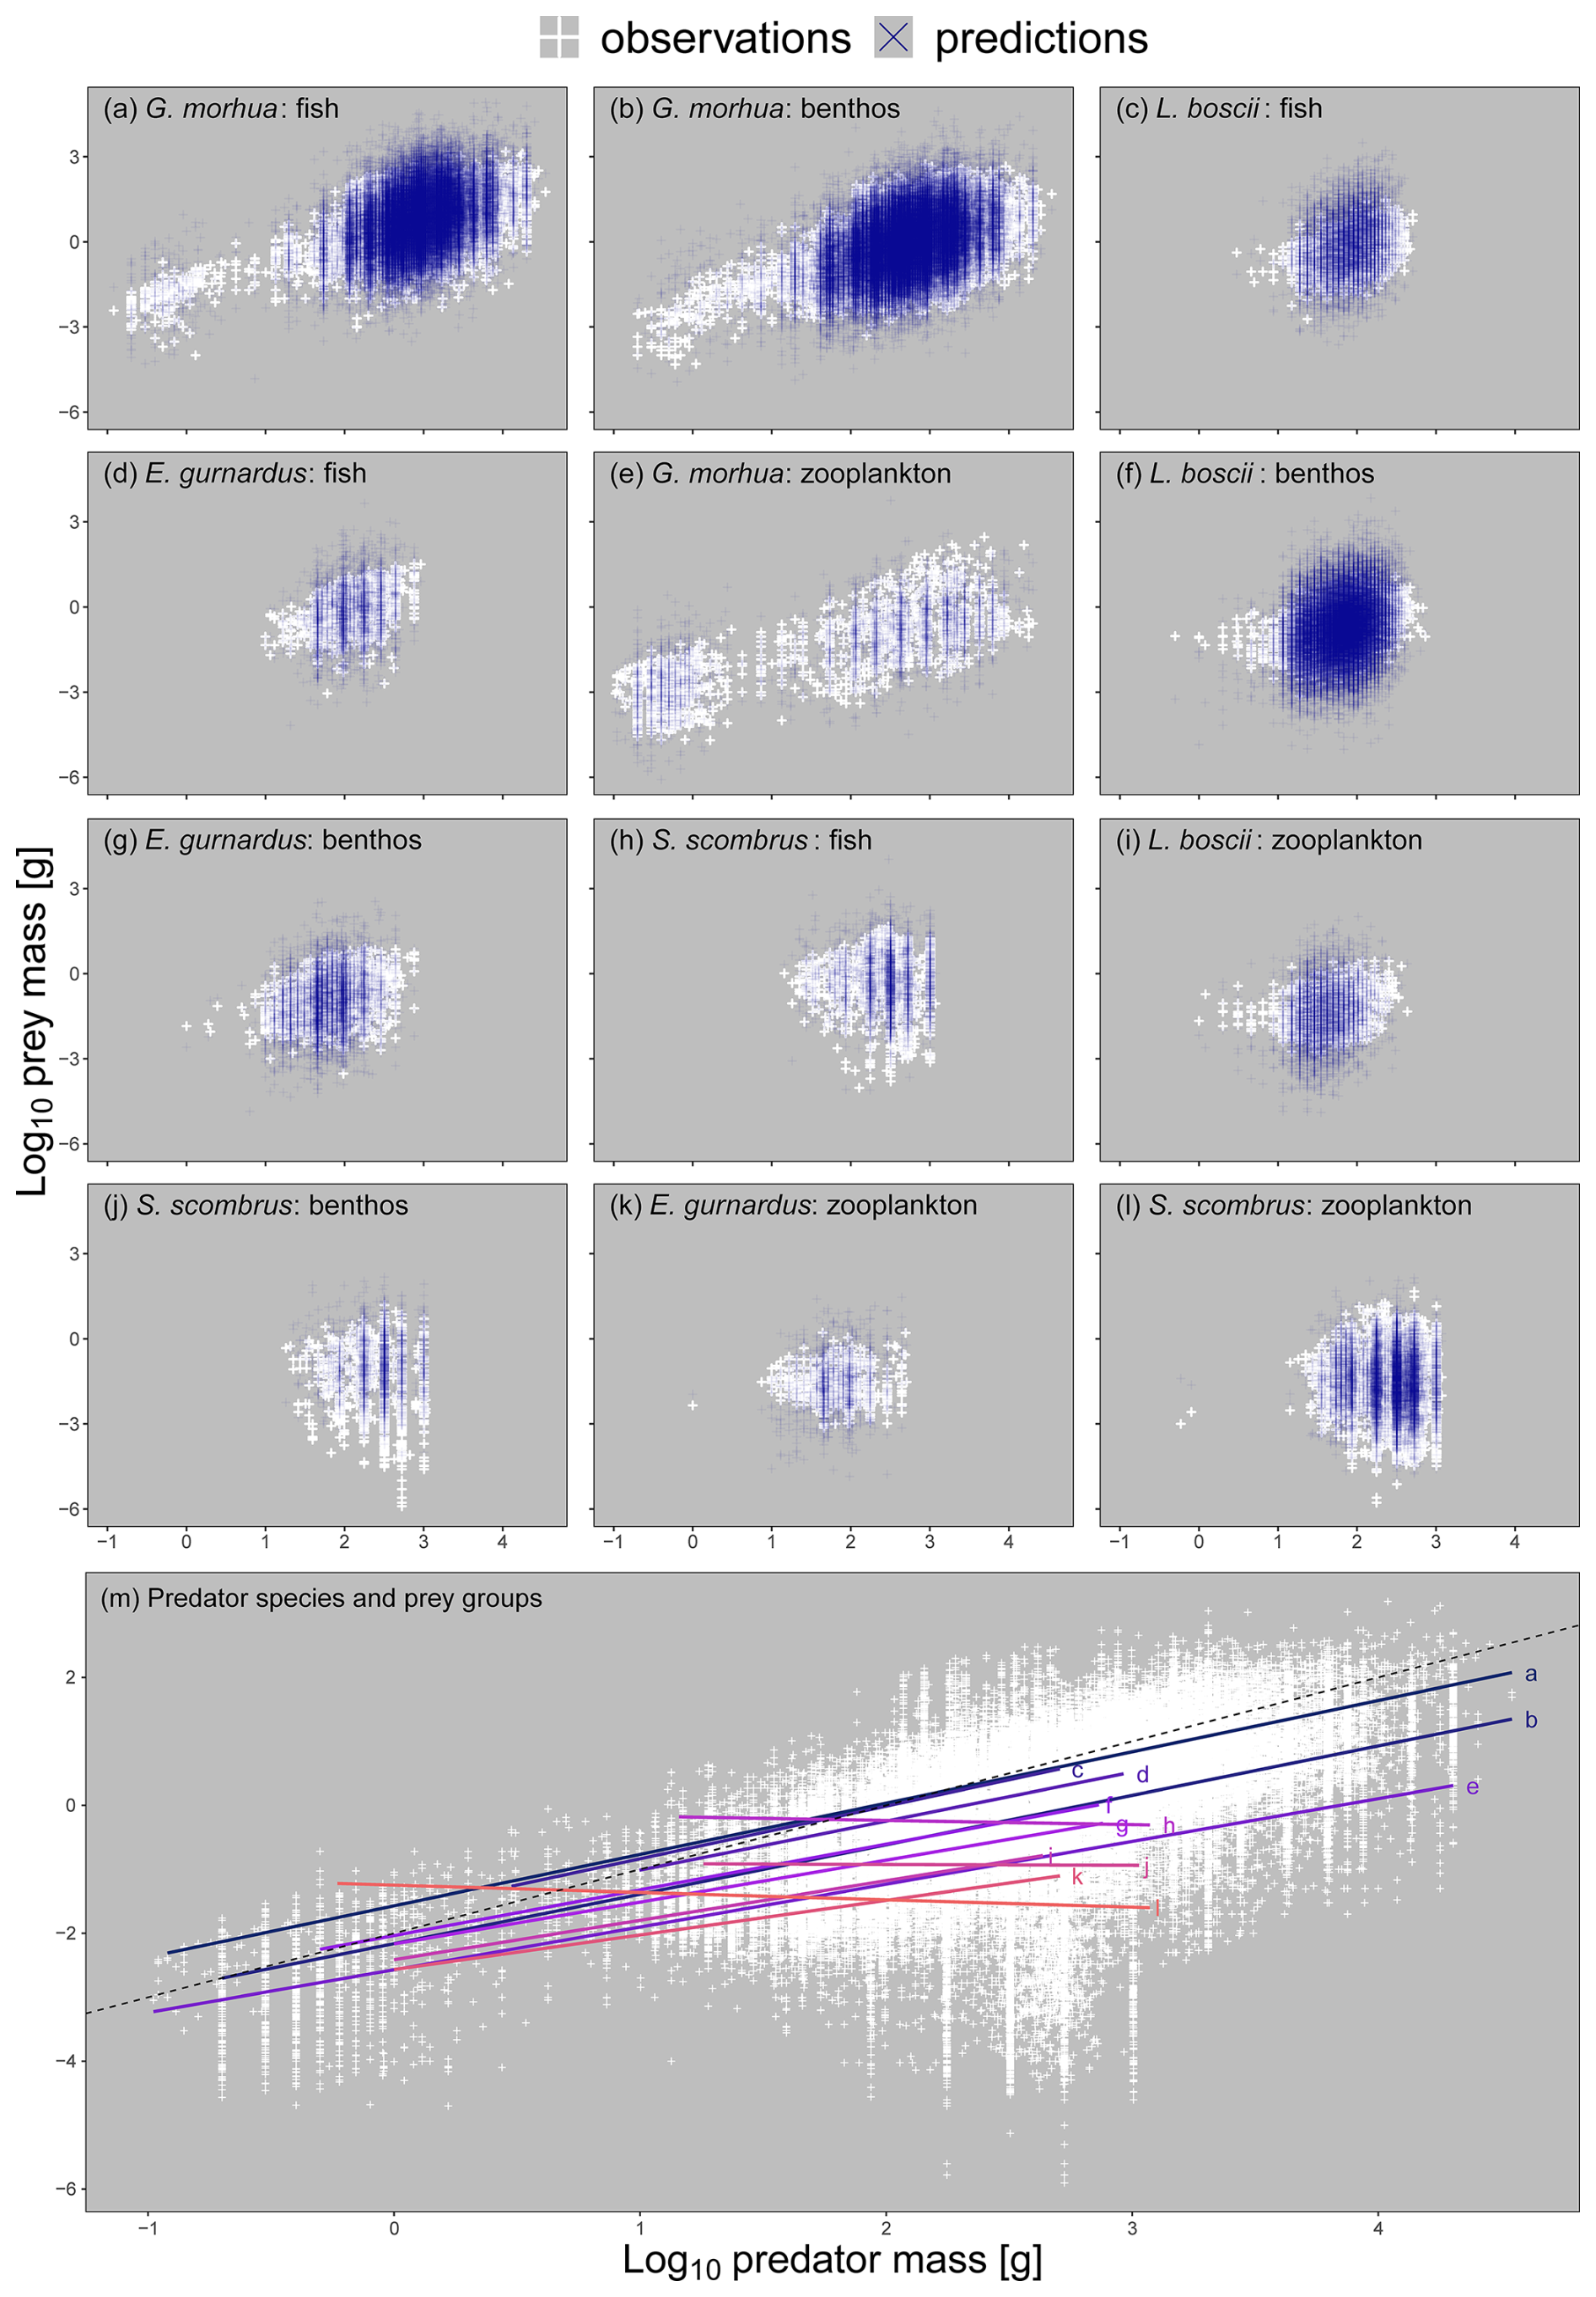
Figure 3Panels (a–l): a subset of the 498 unique combinations of predator species and prey functional group body-mass scaling relationships on log 10 transformed axes ordered from largest to smallest by prey mass at maximum predator mass. Predator individual body mass was fit as the predictor of prey individual body mass in our model, hence appearing on the x and y axes respectively. We selected this subset because they represent important predators of fish, benthos, and zooplankton across ecosystems (see https://github.com/MurraySAThompson/fish-feeding-traits-glmm, last access: 25 March 2024, for R script to reproduce all unique predator species and prey functional group combinations). White points are observed values for specific relationships, blue points are model predictions for specific relationships. Panel (m): the different scaling relationships across the preceding plots with all observations (white points) and a dashed 1:1 line to show scaling relationships were generally sublinear (i.e. prey increased less than their predators per unit increase in individual body mass).
2.5 Results
2.6 Unique intra- and interspecific individual body-mass scaling relationships between predators and prey functional groups
There were significant differences in the predator–prey body-mass scaling relationships between the different combinations of predators and prey functional groups (Fig. 3). These results support our first hypothesis that predator species can have unique intra- and interspecific body-mass scaling relationships with different prey functional groups. Fish prey tended to be the biggest, meaning fish–fish interactions tended to have higher intercepts and slopes (Fig. 3m, lines a, c, d, and h) and thus the lowest mean PPMR, with predator species of the same size consuming relatively small benthic and zooplankton prey (Fig. 3m, lines b, e, f, g, I, j, k, and l). These models enabled us to estimate prey biomass and counts as well as predator–prey mass ratios across the different stomach contents datasets and species body-mass bins useful for feeding guild classifications.
Table 2Analysis of variance results across nested models for each cluster-based method and across methods. Data for biomass, occurrence, and trait methods were used to test whether guild (i.e. cluster-based groups) and data (i.e. a factor identifying each unique re-sampling event) captured significant variation in the composition of predators. Data for all were used to test for differences between the different methods (see also Table S4; Fig. S3). The term dropped column indicates which term was dropped from each model (blanks indicate no predictors were dropped), AIC reveals change in model fit, and p values from F tests highlight significant change in model fit.
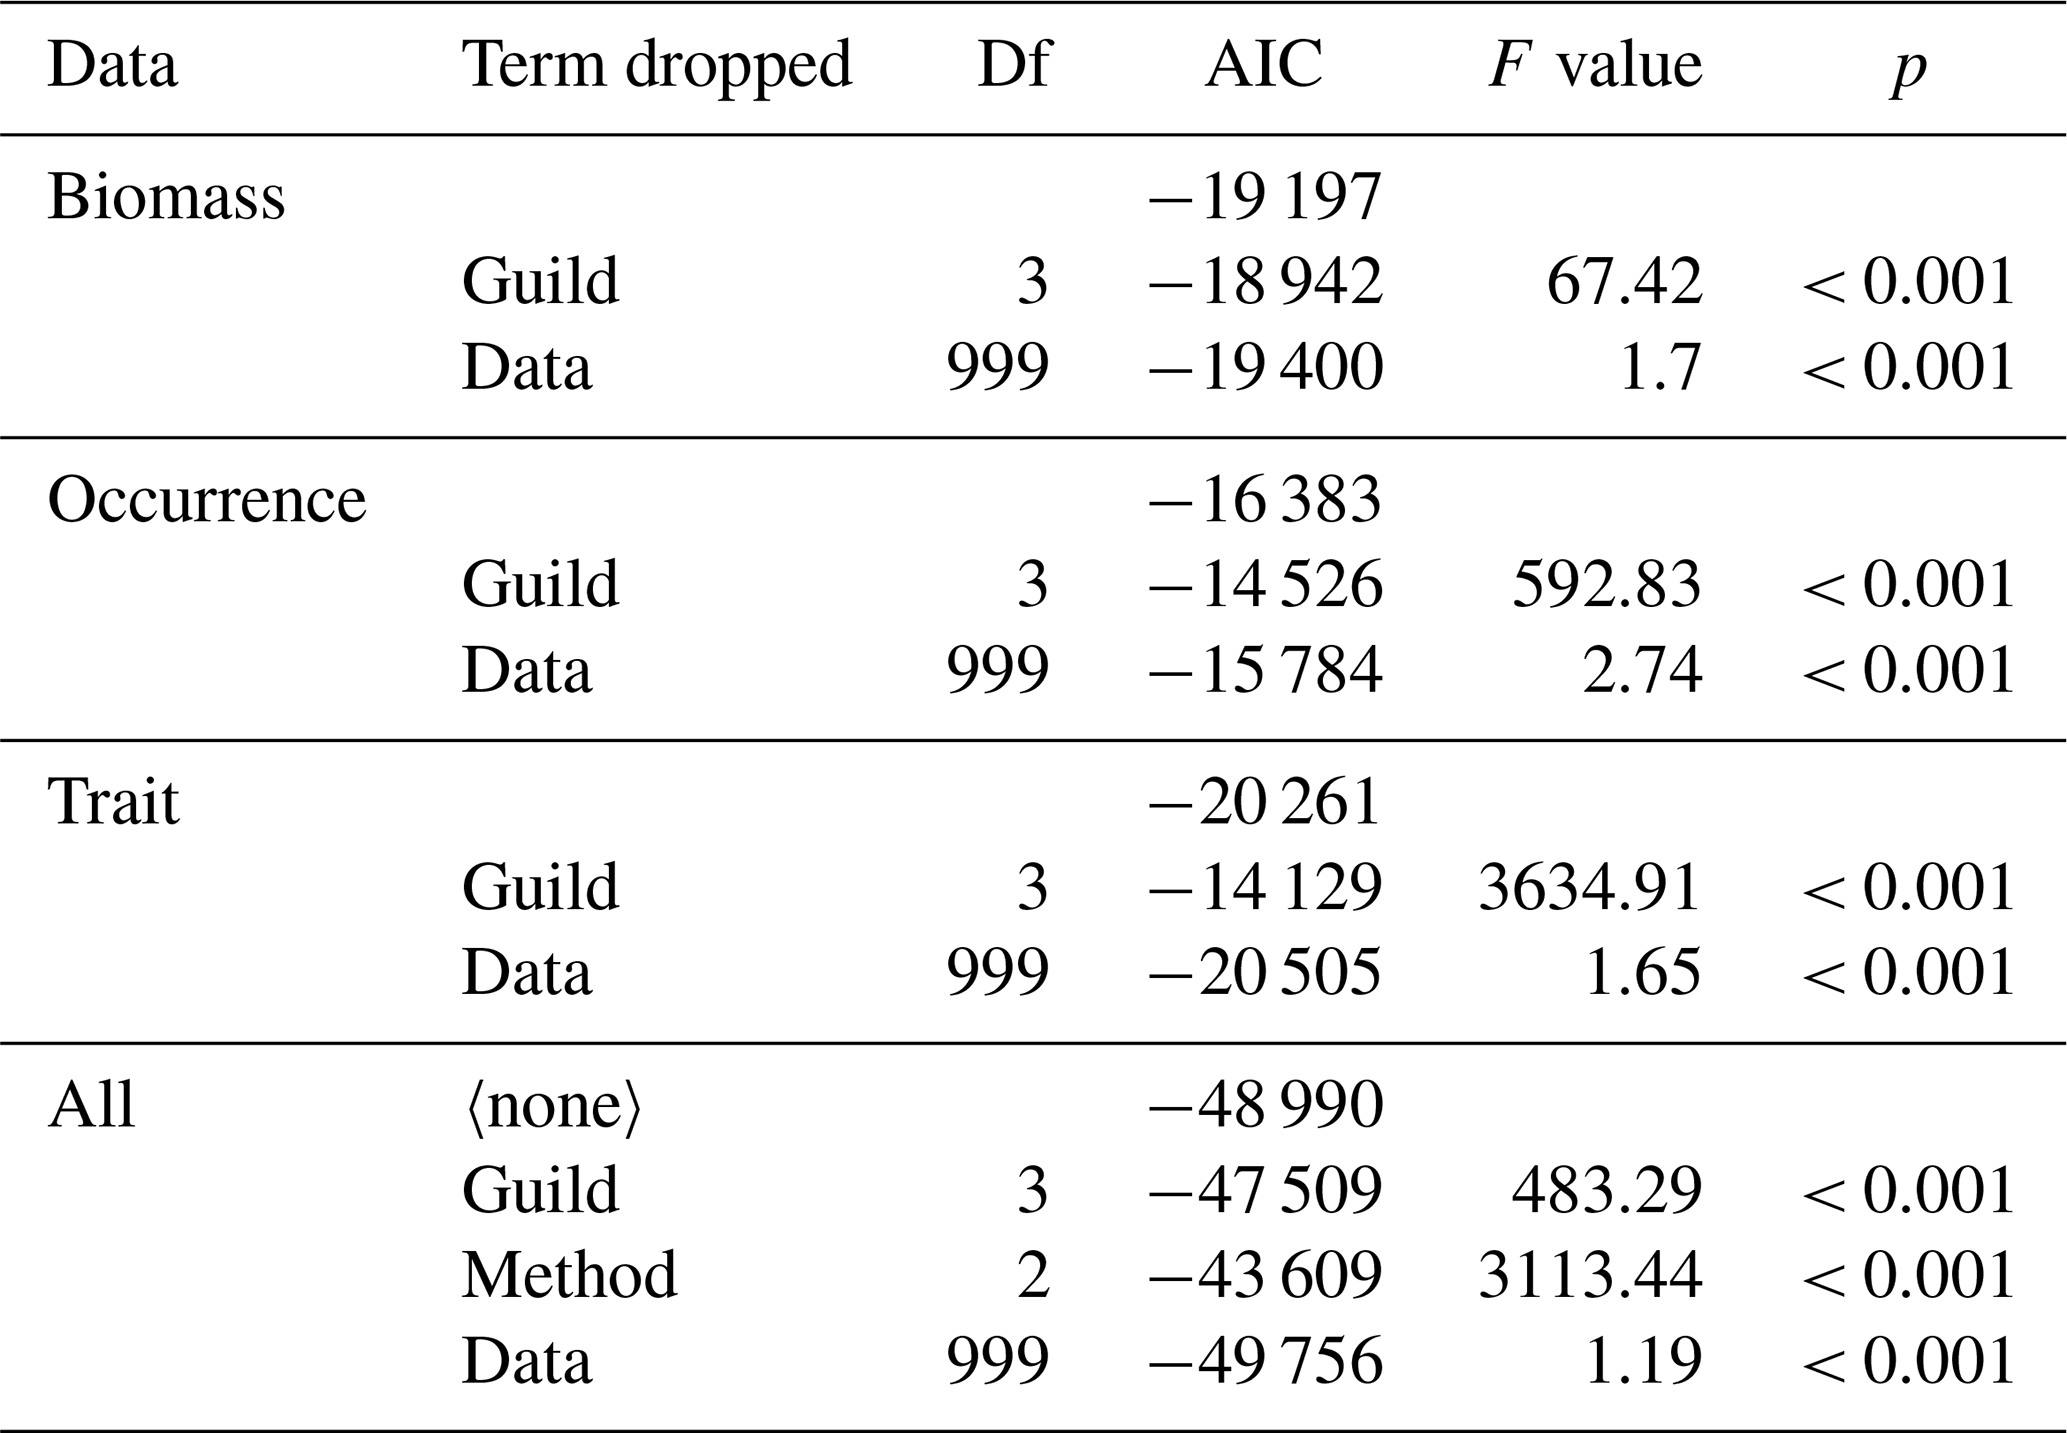
2.7 Feeding trait data reveal multiple distinct feeding guilds
Feeding guilds captured significant variation in the composition of predators for each cluster-based method (Table 2), confirming our second hypothesis that multiple feeding guilds can be delineated from the analysis of feeding traits. The occurrence method had the most robust feeding guilds with the lowest compositional change in predators following re-sampling (mean distance to centroid: 0.13), followed by the trait (mean distance to centroid: 0.22) and then the biomass methods (mean distance to centroid: 0.34; randomly generated feeding guild mean distance to centroid ranged between 0.6–0.61; Fig. S3; Table S4). The trait method had the lowest sum of distances to the data centroid (2655 km), followed by the biomass (7034 km) and occurrence methods (8757 km; Fig. S4). The trait method was therefore preferred because it could identify multiple distinct feeding guilds even where we consider small subsets of predator stomach contents (n = 30 stomach samples) while being the least affected by spatial gradients in prey taxa composition. These results also confirm our third hypothesis that the effectiveness of reliably and robustly classifying predators into feeding guilds applicable across ecosystems varies due to whether classifications are based on the biomass of prey taxa, prey taxa occurrence, or broad feeding traits. Results from our sensitivity analysis using only directly observed prey count and weight information reveal that the trait approach had both the most robust feeding guilds and lowest sum of distances to the data centroid, providing further support for our decision to use it to assess changes in the survey data (Table S4; Fig. S3).
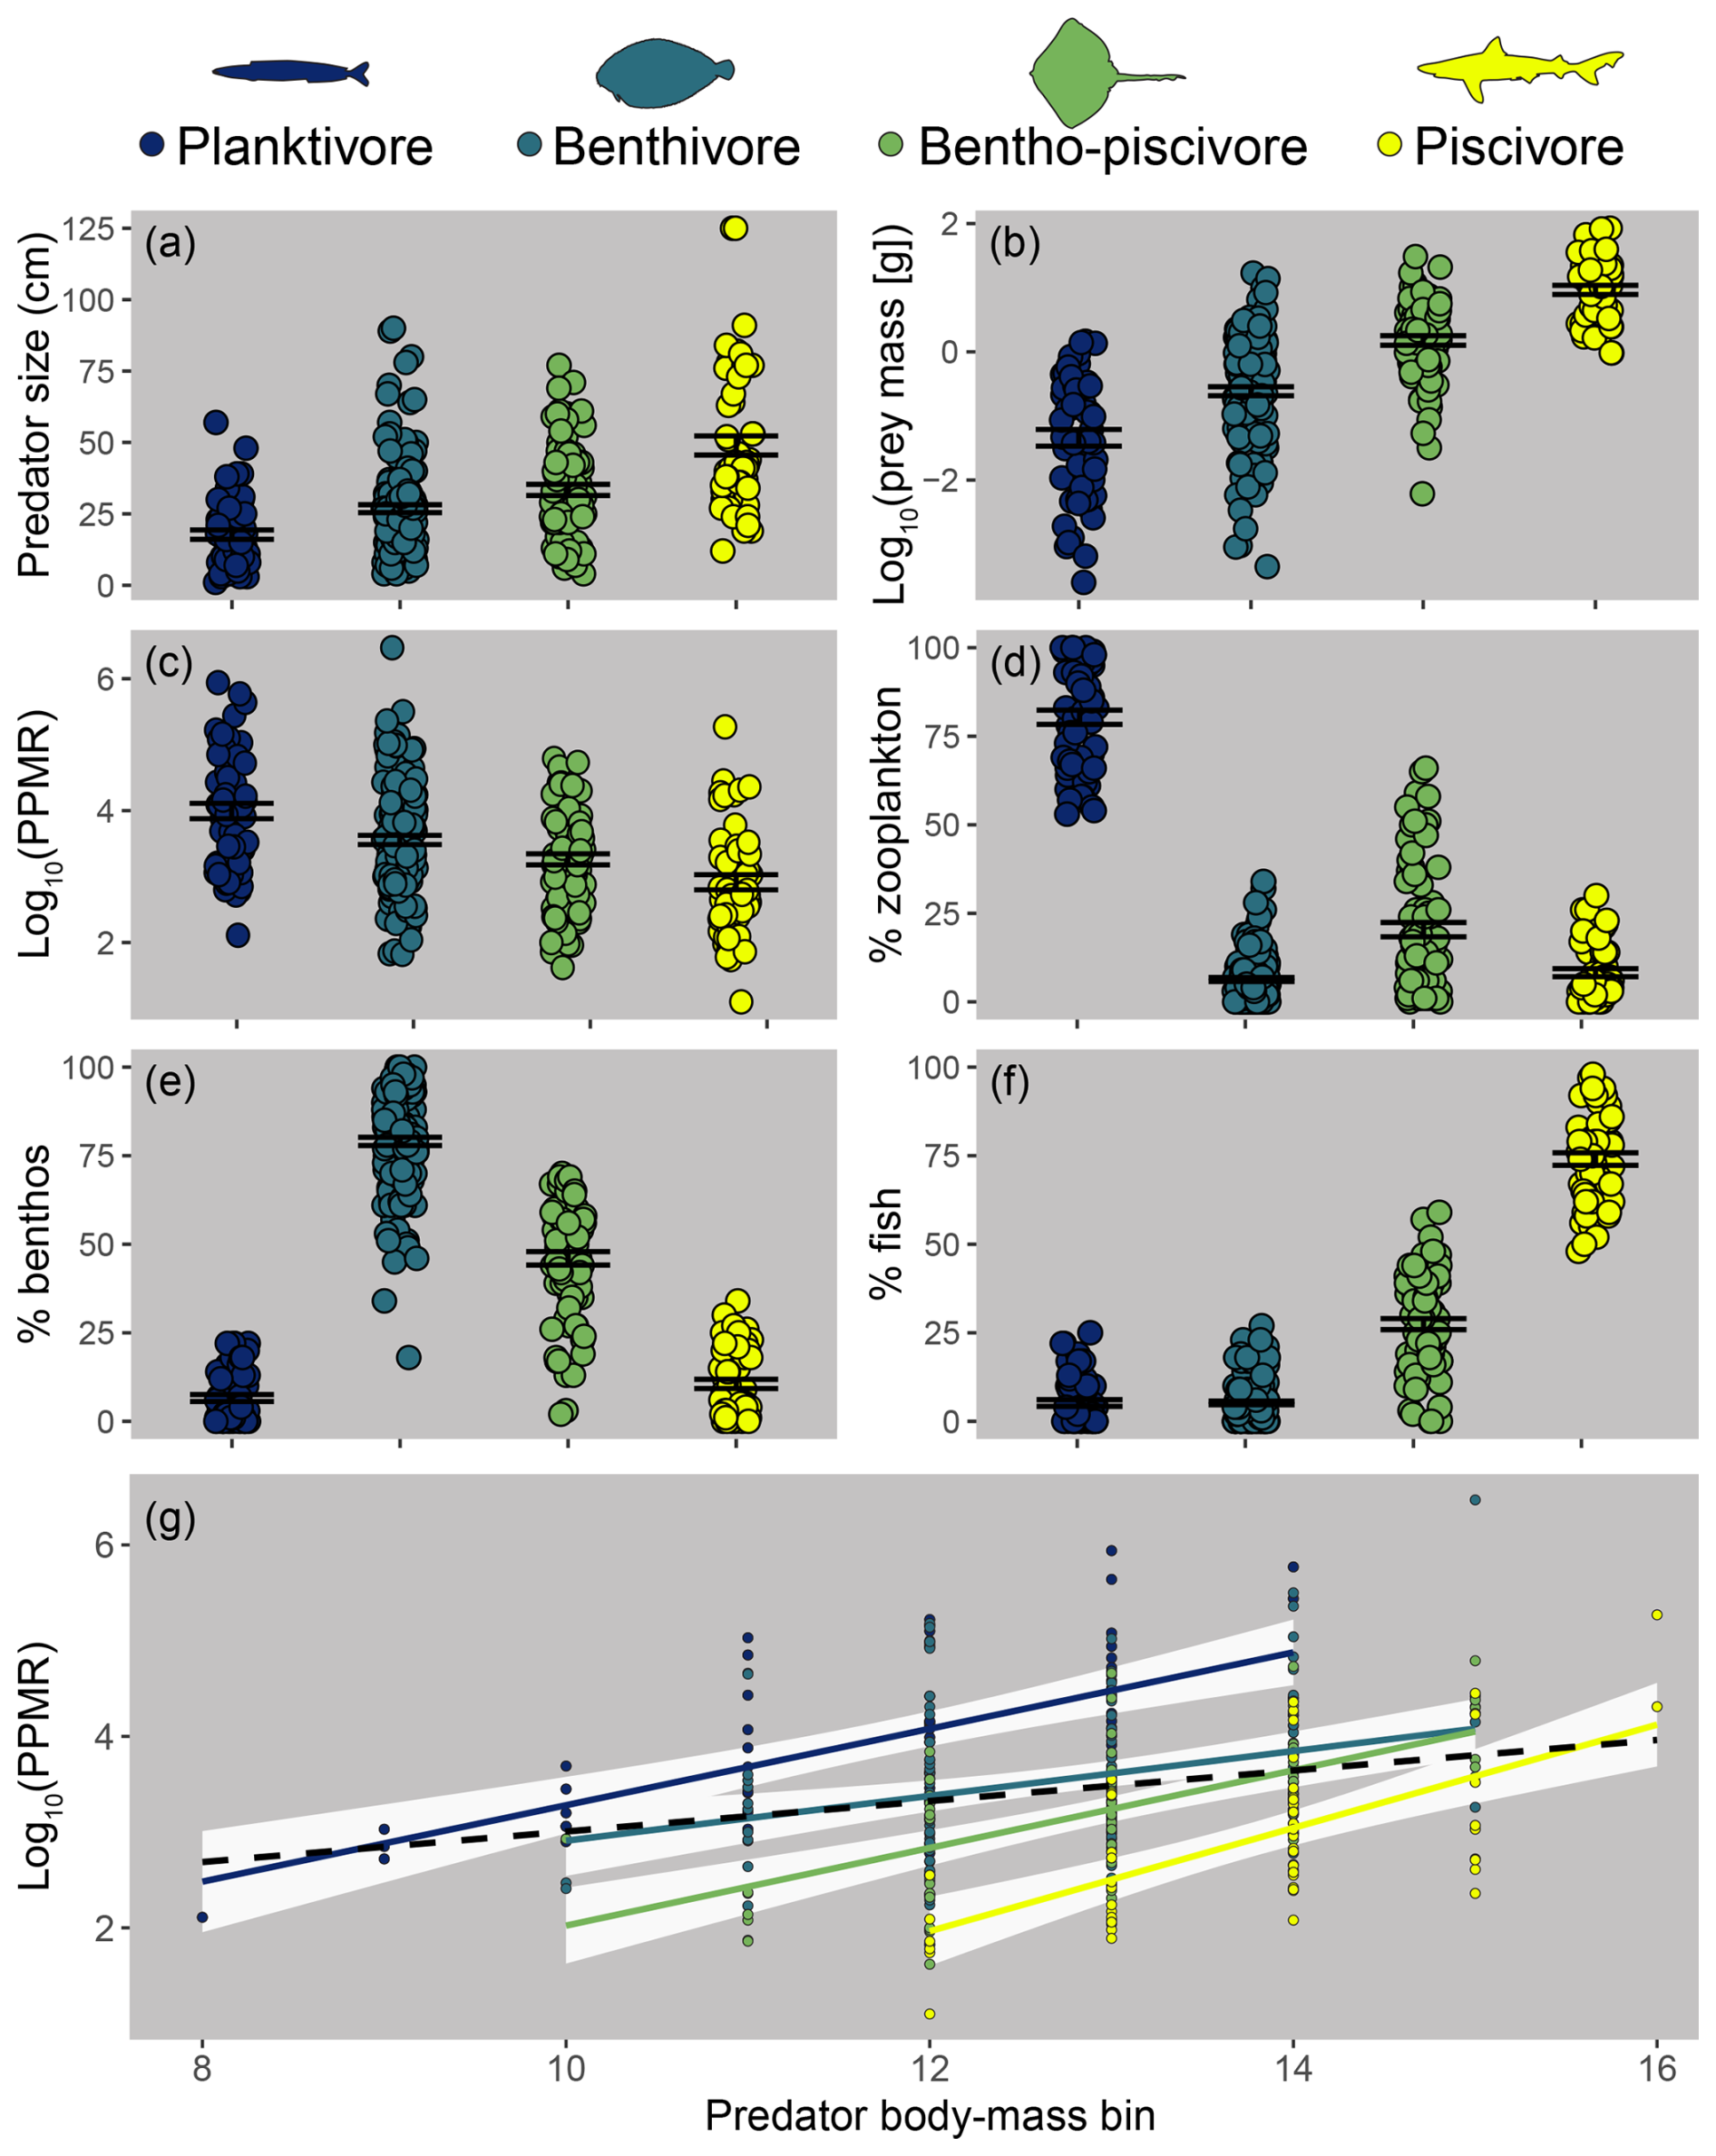
Figure 4Differences between feeding guilds in predator size (a), individual prey mass (b), predator–prey mass ratio (PPMR; c), and the percent biomass contribution of zooplankton (d), benthos (e), and fish (f) to predator stomach contents. Points represent means for predator species body-mass bins; error bars represent standard error. Panel (g): PPMR increases with predator individual body mass within (solid, coloured) and across (black, dashed line) feeding guilds.
The four feeding guilds identified using the trait method have been named based on the percent biomass of prey functional groups as follows: planktivores, benthivores, bentho-piscivores, and piscivores (Fig. 4). Differences between feeding guilds were related to predator size, which correlated positively with piscivory and negatively with planktivory (Fig. S5). Small body-mass classes of species often occur in the planktivore guild, moving to another guild as they increase in size, with multiple medium to larger body-mass classes of a species often in the same guild (see feeding guilds.csv; https://doi.org/10.14466/CefasDataHub.149). Typically, the biggest fish within and across feeding guilds had the highest PPMR (hence the sublinear relationship in Fig. 3m, where prey increased less than their predators per unit increase in individual body mass), yet piscivores were typically the biggest and had the lowest PPMR on average. This apparent contradiction is largely because small piscivores had some of the lowest PPMR values, whereas big planktivores and benthivores had some of the highest values (Fig. 4).
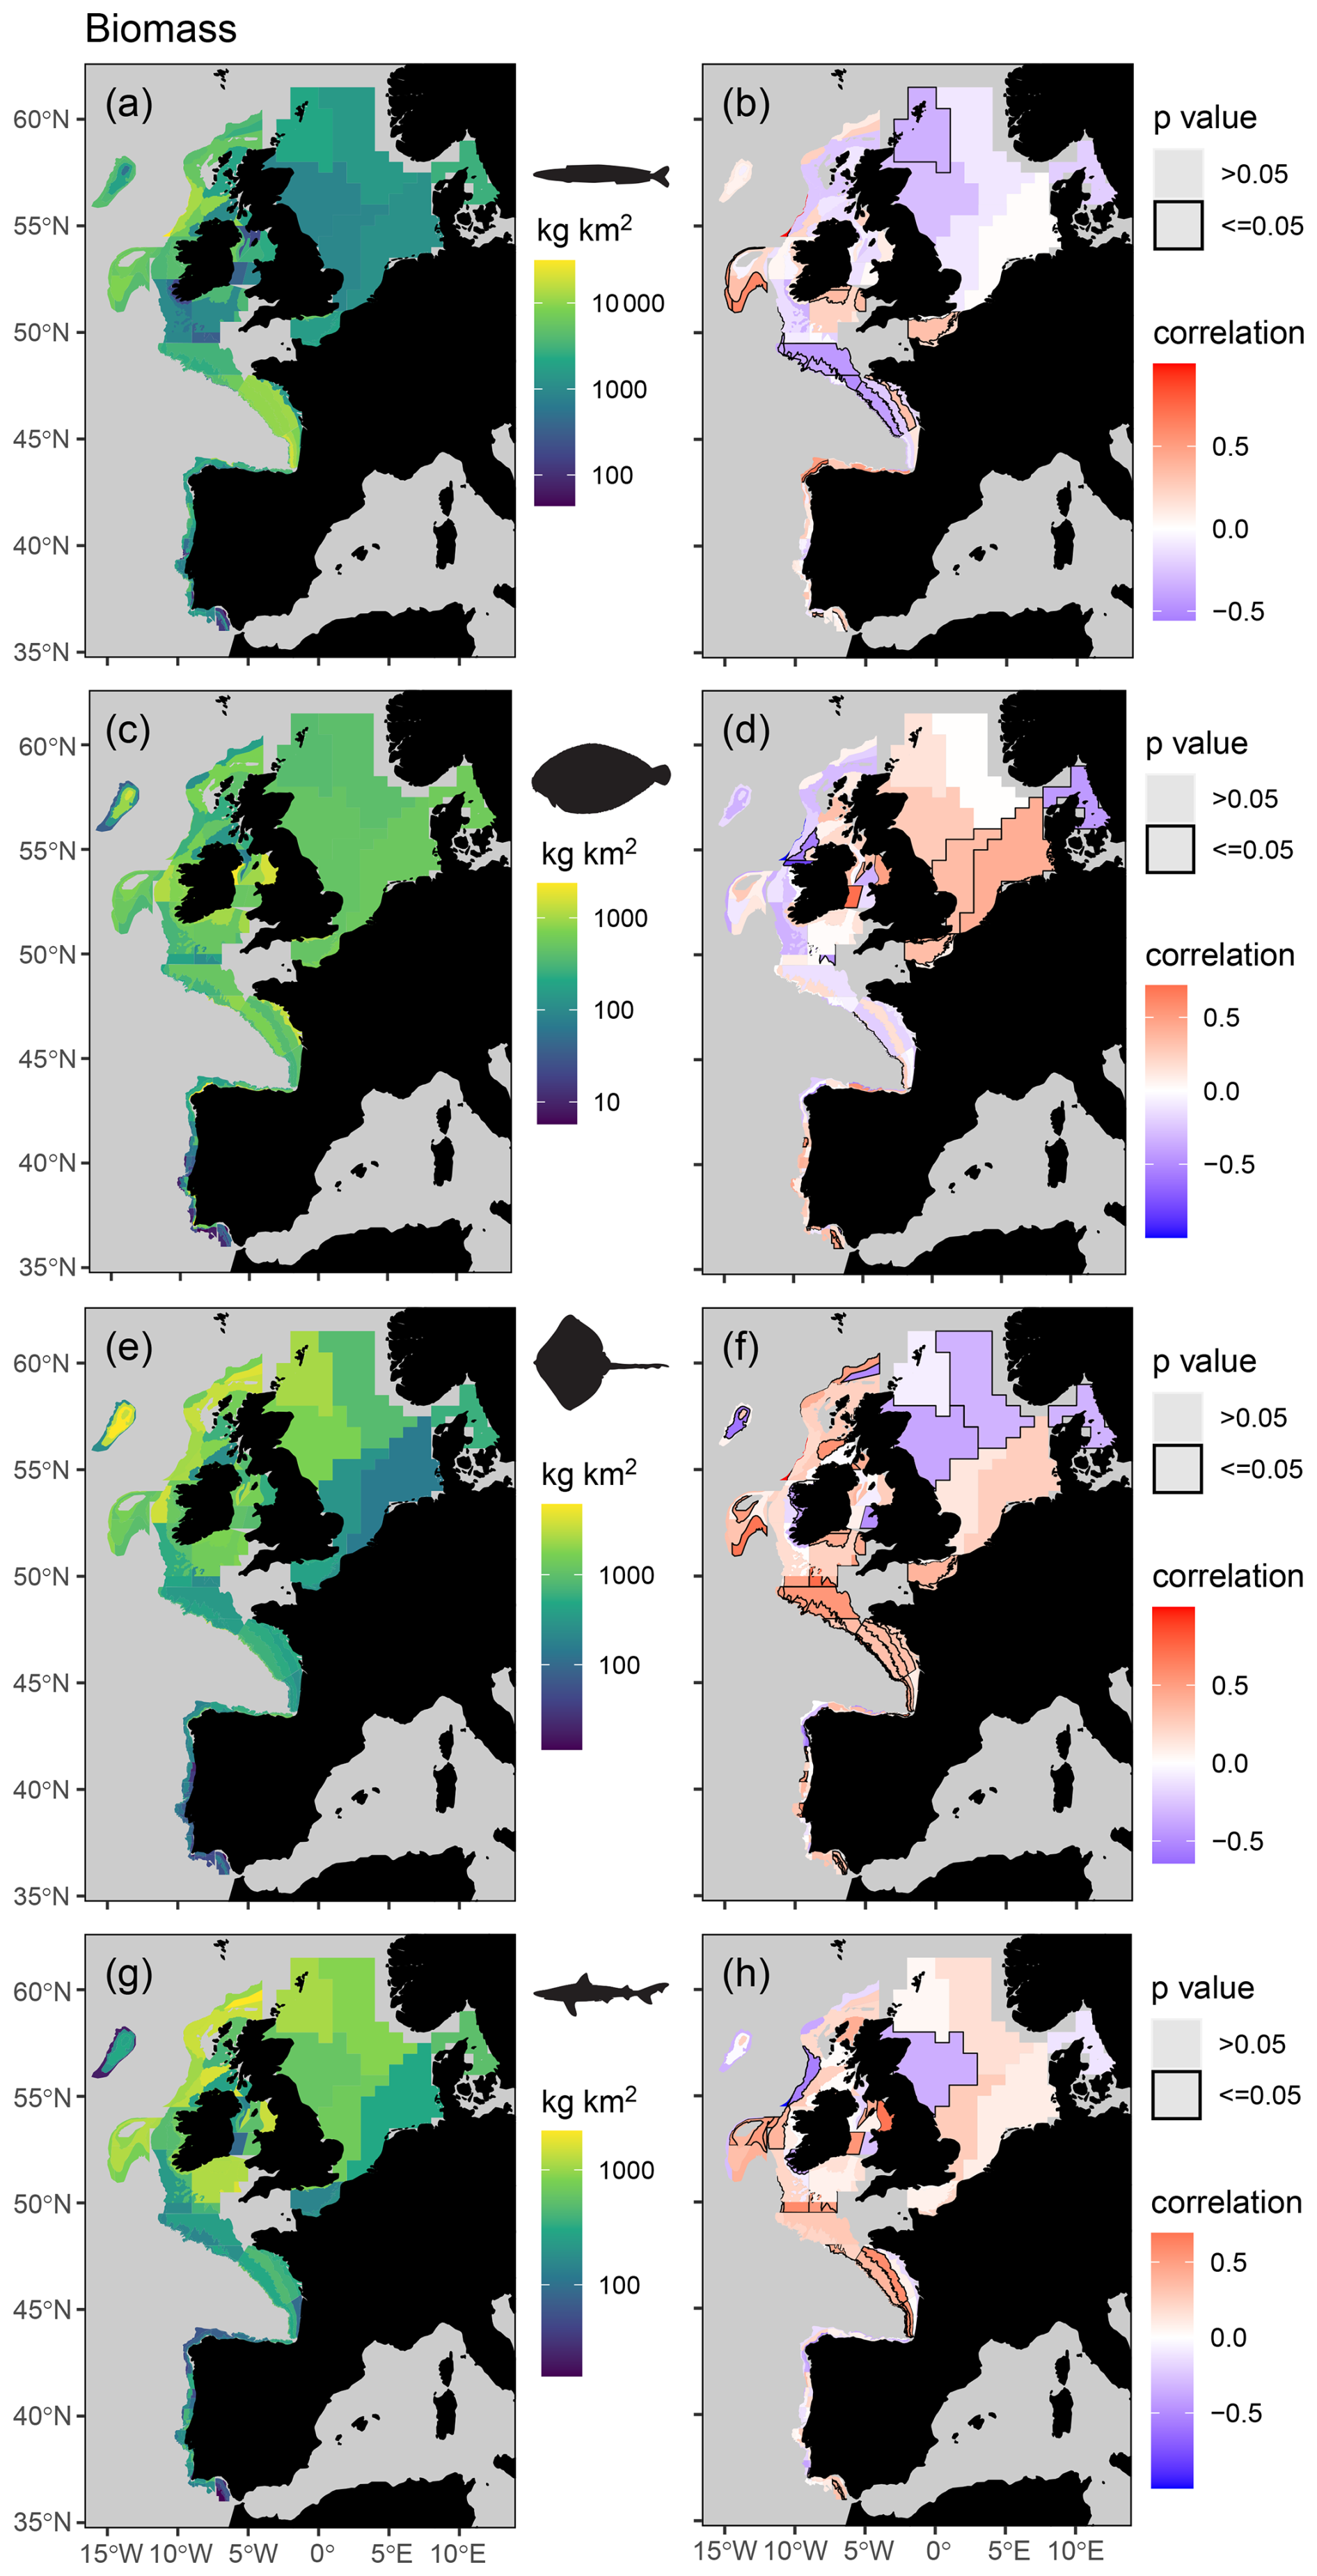
Figure 5Mean spatial distribution (a, c, e, and g) and temporal change (b, d, f, and h) in feeding guild biomass by assessment strata based on otter trawl data for planktivores (a, b), benthivores (c, d), bentho-piscivores (e, f), and piscivores (g, h). Significant temporal trends are highlighted with a black border and coloured blue or red to depict a decreasing or increasing trend respectively (Kendall's τ scores of −1 to +1 represent a 100 % probability of a decreasing or increasing trend).
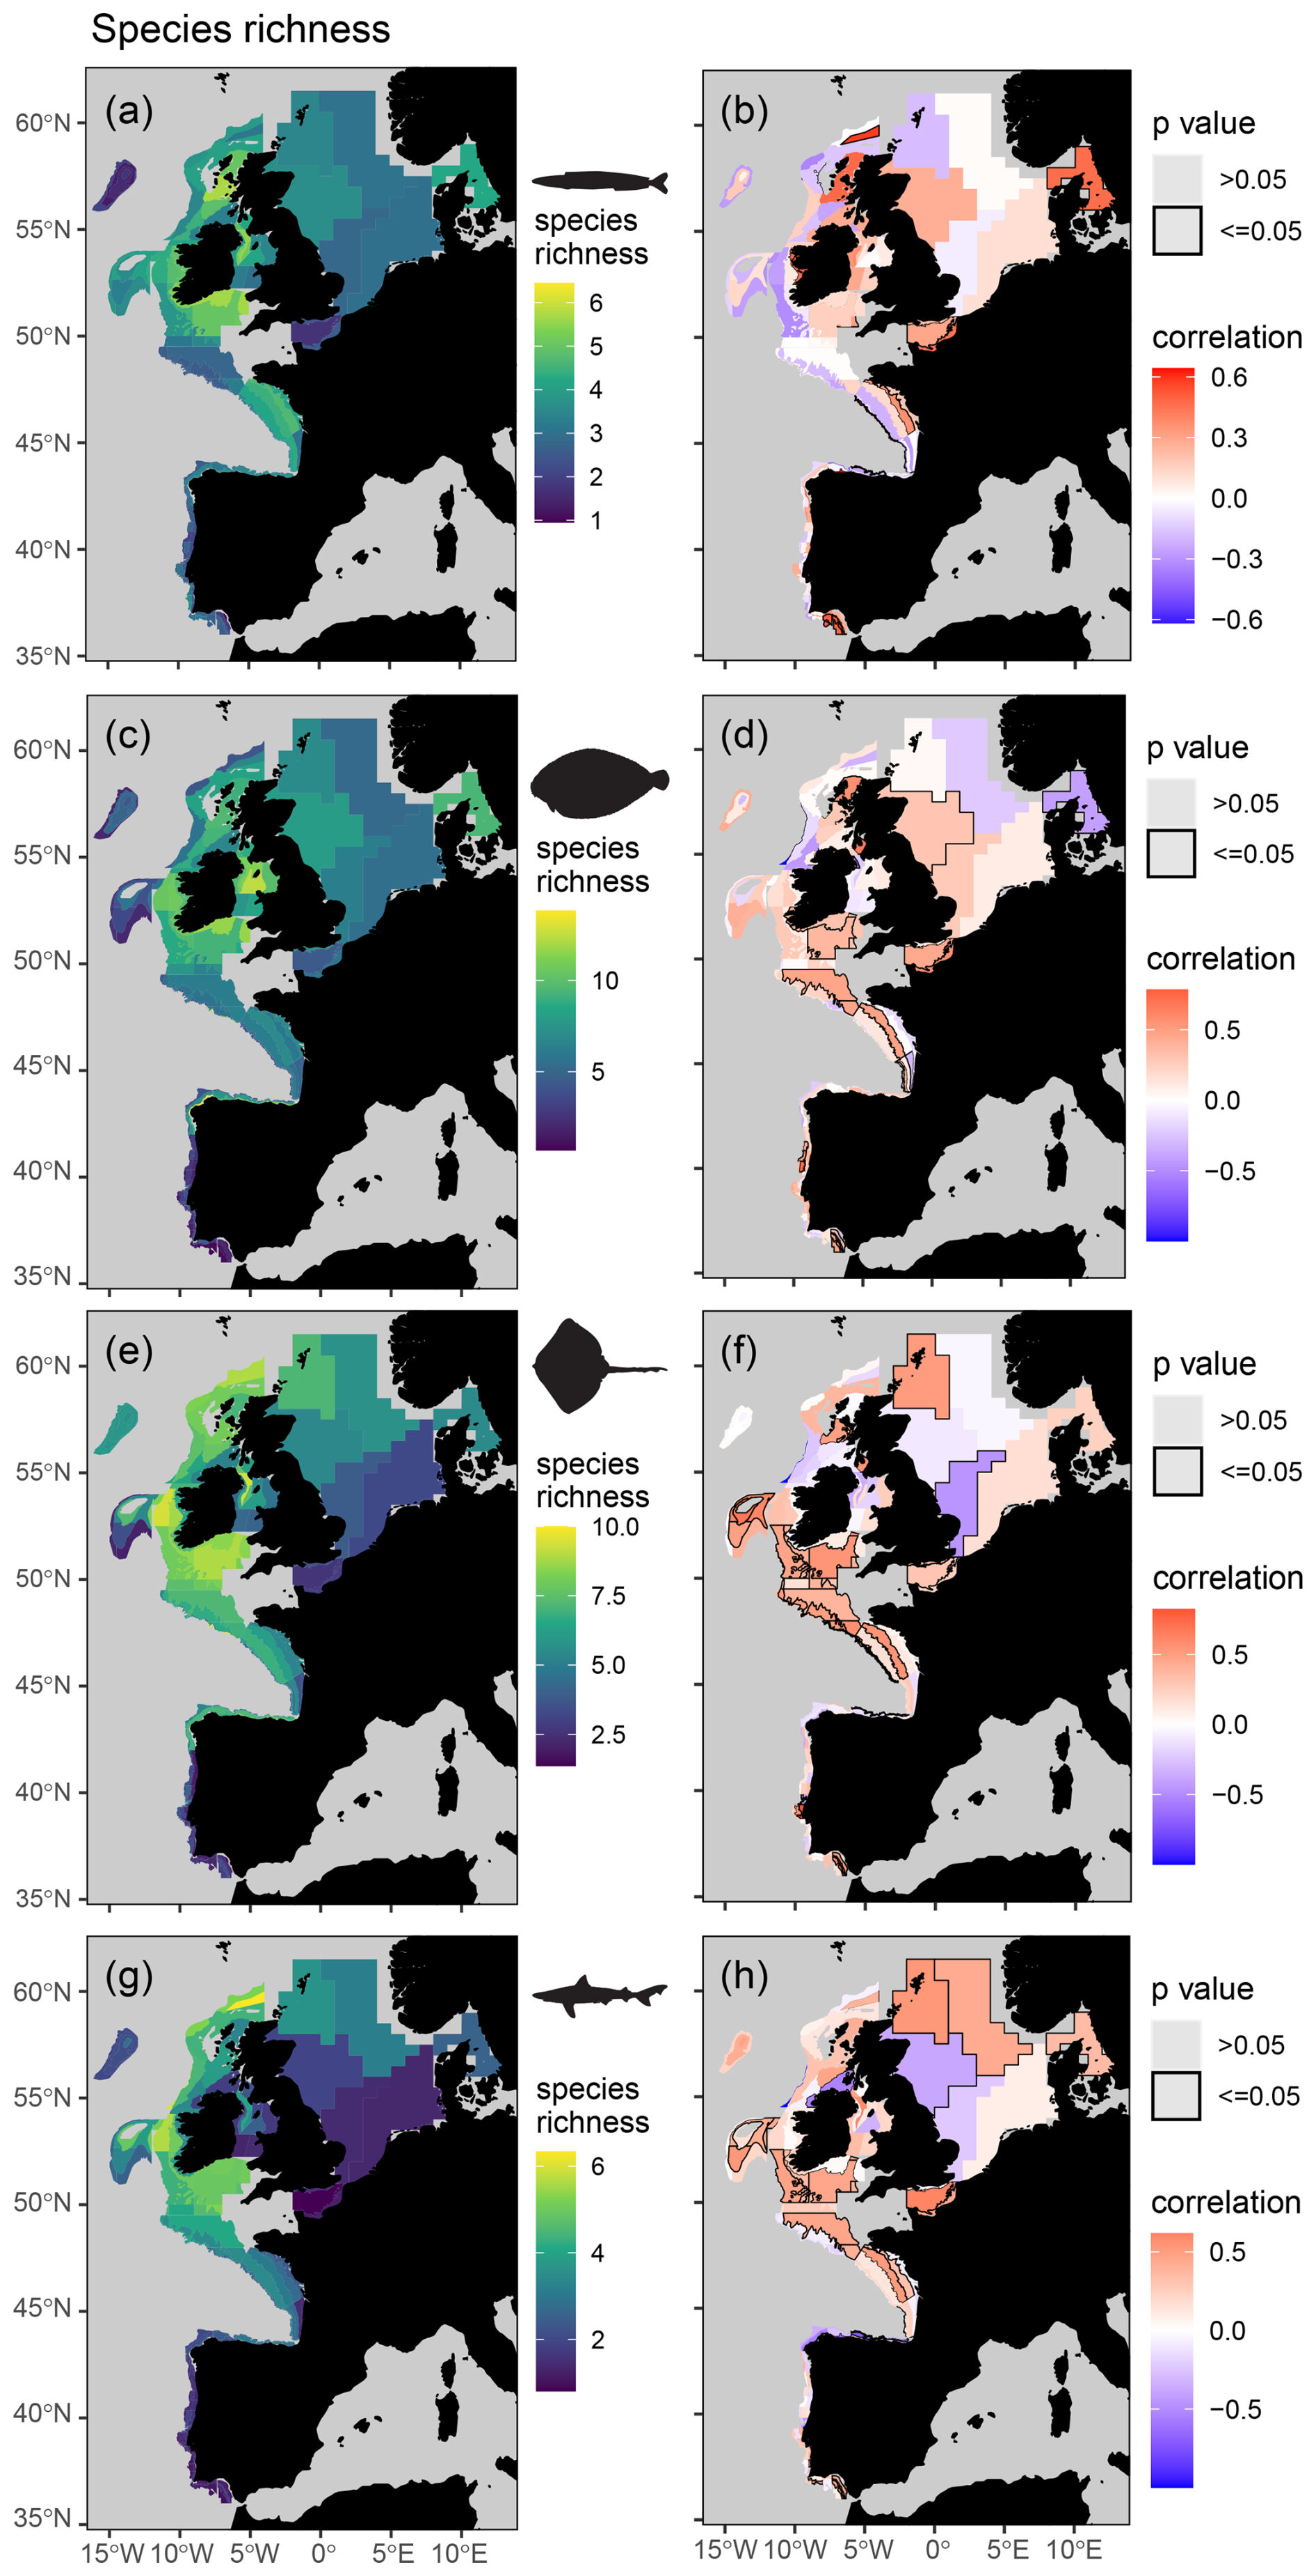
Figure 6Mean spatial distribution (a, c, e, and g) and temporal change (b, d, f, and h) in feeding guild species richness by assessment strata based on otter trawl data for planktivores (a, b), benthivores (c, d), bentho-piscivores (e, f), and piscivores (g, h). Significant temporal trends are highlighted with a black border and coloured blue or red to depict a decreasing or increasing trend respectively (Kendall's τ scores of −1 to +1 represent a 100 % probability of a decreasing or increasing trend).
2.8 Feeding guilds capture significant spatio-temporal trends in survey data
When assigning feeding guilds in the survey data, we were able to classify 92 % of the biomass, which included 122 species body-mass bins. Many rare predators observed in the survey data (n = 366, representing 8 % of the surveyed biomass) remain unclassified due to insufficient stomach contents data (Table S5). The perspective of change in the survey data is therefore weighted towards predators contributing most to community biomass and ecosystem functioning. We found clear spatial structure and regions of contrasting temporal change in feeding guild biomasses and their species richness (Figs. 5 and 6), confirming our fourth hypothesis. For instance, significant and spatially extensive temporal decreases in planktivore feeding guild biomass (i.e. lower in the food web) were evident in the Celtic Seas and Bay of Biscay, where the biomass of the bentho-piscivore and piscivore feeding guilds (i.e. higher in the food web) has increased (Fig. 5). Benthivore biomass has increased in the southern North Sea, where there has been little change in other feeding guilds. Planktivore, bentho-piscivore and piscivore biomass all decreased in at least one assessment strata in the northern North Sea. Regions of temporal change in species richness were also different across feeding guilds (Fig. 6). For instance, over large areas in the Celtic Seas, Bay of Biscay, and northern North Sea, where there was relatively limited change in planktivore species richness, the species richness of benthivores, bentho-piscivores, and piscivores all increased (see Fig. S6 for changes in unclassified biomass).
Our predator–prey body-mass scaling models enabled predictions of mean individual prey mass for different predator species and prey functional groups across the shelf seas of the North Atlantic and Arctic oceans. With these predictions we could estimate key fish feeding traits across species and sizes, such as predator–prey mass ratios and the relative biomass contribution of zooplankton, benthos, and fish prey to predator diets. Our feeding trait-based approach to categorizing feeding guilds was also less susceptible to large spatial gradients in the composition of prey than previously used methods (Garrison and Link, 2000a; Thompson et al., 2020). By using feeding guilds to assess routinely collected survey data, we revealed contrasting patterns of change in the biomass and species richness of fish feeding at different levels within the food web across the north-east Atlantic shelf seas. For example, extensive decreases in the biomass of consumers lower in the food web (planktivores) were evident in the Celtic Seas and Bay of Biscay, and this contrasted with biomass increases higher up (bentho-piscivores and piscivores; Fig. 5). These contrasting patterns of change in how biomass and species are distributed across the food web indicate regions of temporal change in marine ecosystem structure and functioning as the relative importance of different energy pathways changes across the fish assemblage. This is because changes in species richness and the distribution of biomass across the food web can influence nutrient uptake and the efficiency of communities in converting nutritional resources into biomass (Cardinale et al., 2012; Wang and Brose, 2018; Worm et al., 2006).
A wide range of prey sizes could be consumed by a given predator species and size and this variability was generally captured well by our models (Fig. 3). Omnivory was also ubiquitous with all prey groups occurring in the diet of all feeding guilds, albeit to markedly different levels (Fig. 4). This, along with the variability in our re-sampled feeding guild classifications (Fig. S2), highlights the plasticity of fish feeding behaviour, e.g. with some individuals of a typically planktivorous species having consumed mostly fish prey. Feeding guilds provide a necessary simplification of this complexity as a means to indicate change in marine food webs across ecosystems by taking the typical behaviour of a species size class. We have also provided more nuanced information, including empirical estimates of predator–prey mass ratios, relative contributions of different prey groups, and from multivariate analysis on the dissimilarity of species size class feeding traits (Fig. S5) which could help further unpick what such change means. This information is also widely applicable for quantifying and predicting the effects of different fishing and climate regimes where changes in the distribution of species and body sizes are anticipated (Kleisner et al., 2016; Lotze et al., 2019; Spence et al., 2021; Thompson et al., 2023a).
Previous studies which identified feeding guilds used differing approaches, relied on a subset of the stomach contents data we use here, and assessed different survey data than one another (Garrison and Link, 2000a, b; Thompson et al., 2020). It was therefore not clear which method would be optimal as an indicator across ecosystems. Moreover, differences in how feeding trait information has been quantified and reported has hampered the synthesis of stomach contents data. Here, we brought those different stomach contents data together by developing models to predict prey biomass and counts where information was missing. We were then able to compare different approaches to classifying feeding guilds across the datasets and apply the optimal approach to the same survey data. This approach has helped achieve international consensus on how to assess feeding guilds across ecosystems within the OSPAR area (Thompson et al., 2023b). The work we present here represents a development of that pilot indicator, with improvements in how we estimated prey weights (i.e. improved modelling framework that made use of more stomach contents data) which affected feeding guild classifications, in addition to the use of Kendall's τ trend analysis on the classified survey data (as opposed to Pearson's correlation coefficients) in order to detect correlations which may be non-linear. Many of the temporal patterns we present here are similar to those in the pilot indicator. The most notable differences appear for feeding guild species richness where values were relatively low (i.e. where relatively little change could have a large influence) in the central and northern North Sea.
We use a trend-based assessment rather than one based on reference limits. Setting thresholds for feeding guilds was outside the remit of this study and will require reference limits for “Good Environmental Status” to be established. This could be done through synthesizing empirical evidence on feeding guild response to environmental change and human pressure (e.g. following Garrison and Link, 2000b; Thompson et al., 2020) with dynamical modelling capable of predicting ecosystem state under varying levels of human pressure (Link et al., 2010; Rossberg et al., 2017; Samhouri et al., 2010), for instance. Such work would benefit from data products capable of integrating information from different surveys, e.g. including acoustic and various different trawl gears (e.g. beam and otter trawls), that catch a broad range of species and sizes including smaller pelagic species which are likely under-sampled by demersal trawls (Kotwicki et al., 2018; Nnanatu et al., 2020). Developing understanding of the drivers in spatial and temporal change in fish feeding behaviour (Table S1) could also be fruitful, potentially leading to the quantification of energy fluxes from different habitats (e.g. benthos and pelagic), regions, species, and seasons, for instance. Such work could help develop understanding of the connections between the wider suite of indicators which draw on different assemblages and often rely on data collected at different times and at different spatial scales (e.g. Preciado et al., 2023). The inventory of feeding interactions could also continue to develop, e.g. via surveys targeting areas and predators with limited information (e.g. Fig. S6; Table S5), DNA metabarcoding of stomach contents (Jakubavičiute et al., 2017), inference from similar predators (Gray et al., 2015; Hicks et al., 2019), biotracers (Pethybridge et al., 2018), and predictive modelling (Hernvann et al., 2022; Link, 2004; Petchey et al., 2008). Variability in digestion rates driven by environmental gradients such as temperature and differences in prey sizes and tissue composition could also be modelled to help improve estimates of biomass flux across the food web (Temming and Herrmann, 2003).
Using change in functionally distinct feeding guilds to assess environmental status has been widely advocated to fulfil OSPAR and the Marine Strategy Framework Directive requirements (Boschetti et al., 2021; ICES, 2018; Rombouts et al., 2013; Tam et al., 2017; Walmsley et al., 2016), but international consensus on how to do this has been lacking. We drew together data and expertise from across the North Atlantic and Arctic oceans to help achieve this. In doing so, we have made empirical estimates of a range of key fish feeding traits that are widely applicable in marine ecosystem science, identified robust feeding guilds, and revealed how and where ecosystem structure and function was changing across the OSPAR area. Such information will be critical to help better quantify and predict the effect of human pressures, such as fishing and climate change, on global patterns in marine ecosystem structure and functioning.
The data we make use of are largely publicly available, cited, and displayed alongside URLs, where applicable. We also provide all observed fish stomach contents data used in our modelling, predictions of fish feeding traits from our linear mixed effects models, haul-level estimates of feeding guild species richness, numbers of fish and their biomass based on scientific trawl surveys from the north-east Atlantic, and the temporal trend values useful for indicator reporting processes (https://doi.org/10.14466/CefasDataHub.149; Thompson et al., 2024).
We made use of multiple stomach contents databases to predict species- and size-specific feeding traits for fish across the North Atlantic and Arctic oceans. We then developed a reproducible data-driven workflow that categorized fish based on these feeding traits and showed how they can be applied to robustly define the feeding guilds required in OSPAR and the Marine Strategy Framework Directive guidance. This has provided an indicator capable of revealing change in ecosystem structure and function across the OSPAR area based on routinely collected survey data. For instance, we revealed significant and spatially extensive temporal changes across the food web, with decreases in the biomass of smaller planktivorous fish which contrast with increases in the biomass of larger more piscivorous fish. The information we have generated can be tailored to fulfil other specific evidence needs, such as improving the parametrization of ecosystem models and quantifying sustainable levels of human pressure. Our study provides evidence supporting a candidate food web indicator for the OSPAR area that can be readily extended to other areas and organisms.
The supplement related to this article is available online at https://doi.org/10.5194/essd-17-2447-2025-supplement.
MSAT, CL, IP, and AB conceived the project; MSAT, IP, VB, AB, MC, PC, EE, GH-M, IJ, FM, SR, SS, US, BES, MAT, and CL were involved in designing the methodology and collating the data; MSAT analysed the data and led the writing of the article. All authors contributed critically to the drafts and gave final approval for publication.
The contact author has declared that none of the authors has any competing interests.
Publisher's note: Copernicus Publications remains neutral with regard to jurisdictional claims made in the text, published maps, institutional affiliations, or any other geographical representation in this paper. While Copernicus Publications makes every effort to include appropriate place names, the final responsibility lies with the authors.
We thank Andrew Edwards and an anonymous reviewer for their detailed and constructive comments.
Euromarine funded the foresight workshop EFIMBA; Murray S. A. Thompson and Christopher P. Lynam were supported via the European Union's Horizon 2020 research and innovation programme under grant agreement no. 869300, “FutureMARES”; the Natural Environment Research Council grant no. NE/V017039/1; and Cefas Seedcorn “Next generation Cefas biodiversity science: from individuals to ecosystems” (DP433). Izaskun Preciado and María Ángeles Torres were supported by the Spanish Ministry for Ecological Transition and Demographic Challenge through the ESMARES project; Sabine Schückel and Ulrike Schückel were supported via the FishNet project financed by the European Maritime and Fisheries Fund (EMFF), the Federal Government of Germany, and the State of Schleswig-Holstein; Andrea Belgrano was supported by the Swedish Agency for Marine and Water Management (SwAM). Ifremer's samples were collected during two projects: (1) the CHARM III project within the scope of the INTERREG IVA France-(Channel)-England cross-border European Cooperation Programme, co-financed by the European Regional Development Fund (ERDF) and managed by the region Haute Normandie, and (2) the VARITROPH project, funded by European Marine Fisheries Fund and France Filière Pêche.
This paper was edited by François G. Schmitt and reviewed by Andrew Edwards and one anonymous referee.
Anderson, M. J.: Distance-Based Tests for Homogeneity of Multivariate Dispersions, Biometrics, 62, 245–253, https://doi.org/10.1111/j.1541-0420.2005.00440.x, 2006.
Arroyo, N. L., Preciado, I., López-López, L., Muñoz, I., and Punzón, A.: Trophic mechanisms underlying bentho-demersal community recovery in the north-east Atlantic, J. Appl. Ecol., 54, 1957–1967, https://doi.org/10.1111/1365-2664.12879, 2017.
Barnes, C., Maxwell, D., Reuman, D. C., and Jennings, S.: Global patterns in predator-prey size relationships reveal size dependency of trophic transfer efficiency, Ecology, 91, 222–232, https://doi.org/10.1890/08-2061.1, 2010.
Boschetti, S., Piroddi, C., Druon, J., and Palialexis, A.: Marine Strategy Framework Directive – Review and analysis of Member States' 2018 reports – Descriptor 4: Food webs, European Union, https://doi.org/10.2760/32522, 2021.
Brooks, M. E., Kristensen, K., Van Benthem, K. J., Magnusson, A., Berg, C. W., Nielsen, A., Skaug, H. J., Machler, M., and Bolker, B. M.: glmmTMB balances speed and flexibility among packages for zero-inflated generalized linear mixed modeling, R J., 9, 378–400, 2017.
Brose, U., Jonsson, T., Berlow, E. L., Warren, P., Banasek-Richter, C., Bersier, L.-F., Blanchard, J. L., Brey, T., Carpenter, S. R., Blandenier, M.-F. C., Cushing, L., Dawah, H. A., Dell, T., Edwards, F., Harper-Smith, S., Jacob, U., Ledger, M. E., Martinez, N. D., Memmott, J., Mintenbeck, K., Pinnegar, J. K., Rall, B. C., Rayner, T. S., Reuman, D. C., Ruess, L., Ulrich, W., Williams, R. J., Woodward, G., and Cohen, J. E.: CONSUMER–RESOURCE BODY-SIZE RELATIONSHIPS IN NATURAL FOOD WEBS, Ecology, 87, 2411–2417, https://doi.org/10.1890/0012-9658(2006)87[2411:CBRINF]2.0.CO;2, 2006.
Brose, U., Archambault, P., Barnes, A. D., Bersier, L. F., Boy, T., Canning-Clode, J., Conti, E., Dias, M., Digel, C., Dissanayake, A., Flores, A. A. V., Fussmann, K., Gauzens, B., Gray, C., Häussler, J., Hirt, M. R., Jacob, U., Jochum, M., Kéfi, S., McLaughlin, O., MacPherson, M. M., Latz, E., Layer-Dobra, K., Legagneux, P., Li, Y., Madeira, C., Martinez, N. D., Mendonça, V., Mulder, C., Navarrete, S. A., O'Gorman, E. J., Ott, D., Paula, J., Perkins, D., Piechnik, D., Pokrovsky, I., Raffaelli, D., Rall, B. C., Rosenbaum, B., Ryser, R., Silva, A., Sohlström, E. H., Sokolova, N., Thompson, M. S. A., Thompson, R. M., Vermandele, F., Vinagre, C., Wang, S., Wefer, J. M., Williams, R. J., Wieters, E., Woodward, G., and Iles, A. C.: Predator traits determine food-web architecture across ecosystems, Nat. Ecol. Evol., 3, 919–927, https://doi.org/10.1038/s41559-019-0899-x, 2019.
Cachera, M., Ernande, B., Villanueva, M. C., and Lefebvre, S.: Individual diet variation in a marine fish assemblage: Optimal Foraging Theory, Niche Variation Hypothesis and functional identity, J. Sea Res., 120, 60–71, https://doi.org/10.1016/j.seares.2016.08.004, 2017.
Cardinale, B. J., Duffy, J. E., Gonzalez, A., Hooper, D. U., Perrings, C., Venail, P., Narwani, A., MacE, G. M., Tilman, D., Wardle, D. A., Kinzig, A. P., Daily, G. C., Loreau, M., Grace, J. B., Larigauderie, A., Srivastava, D. S., and Naeem, S.: Biodiversity loss and its impact on humanity, Nature, 486, 59–67, https://doi.org/10.1038/nature11148, 2012.
Chamberlain, S.: worrms: World Register of Marine Species (WoRMS) Client, https://CRAN.R-project.org/package=worrms (last access: 12 July 2022), 2019.
Chamberlain, S., Szoecs, E., Foster, Z., Arendsee, Z., Boettiger, C., Ram, K., Bartomeus, I., Baumgartner, J., O'Donnell, J., and Oksanen, J.: taxize: Taxonomic information from around the web, GitHub [data set], https://github.com/ropensci/taxize (last access: 12 July 2022), 2020.
Daan, N.: Data base report of the stomach sampling project 1981, ICES Cooperative Research Report, Vol. 164, ICES, 150 pp., https://doi.org/10.17895/ices.pub.4533, 1981.
Daufresne, M., Lengfellner, K., and Sommer, U.: Global warming benefits the small in aquatic ecosystems, P. Natl. Acad. Sci. USA, 106, 12788–12793, https://doi.org/10.1073/pnas.0902080106, 2009.
du Pontavice, H., Gascuel, D., Reygondeau, G., Maureaud, A., and Cheung, W. W. L.: Climate change undermines the global functioning of marine food webs, Glob. Change Biol., 26, 1306–1318, https://doi.org/10.1111/gcb.14944, 2020.
Garrison, L. P. and Link, J. S.: Dietary guild structure of the fish community in the Northeast United States continental shelf ecosystem, Mar. Ecol. Prog. Ser., 202, 231–240, https://doi.org/10.3354/meps202231, 2000a.
Garrison, L. P. and Link, J. S.: Fishing effects on spatial distribution and trophic guild structure of the fish community in the Georges Bank region, ICES J. Mar. Sci., 57, 723–730, https://doi.org/10.1006/jmsc.2000.0713, 2000b.
Gray, C., Figueroa, D. H., Hudson, L. N., Ma, A., Perkins, D., and Woodward, G.: Joining the dots: An automated method for constructing food webs from compendia of published interactions, Food Webs, 5, 11–20, https://doi.org/10.1016/j.fooweb.2015.09.001, 2015.
Hartig, F.: DHARMa: Residual Diagnostics for Hierarchical (Multi-Level/Mixed) Regression Models, https://CRAN.R-project.org/package=DHARMa, (last access: 25 March 2024), 2022.
Hernvann, P.-Y., Gascuel, D., Kopp, D., Robert, M., and Rivot, E.: EcoDiet: A hierarchical Bayesian model to combine stomach, biotracer, and literature data into diet matrix estimation, Ecol. Appl., 32, e2521, https://doi.org/10.1002/eap.2521, 2022.
Hicks, C. C., Cohen, P. J., Graham, N. A. J., Nash, K. L., Allison, E. H., D'Lima, C., Mills, D. J., Roscher, M., Thilsted, S. H., Thorne-Lyman, A. L., and MacNeil, M. A.: Harnessing global fisheries to tackle micronutrient deficiencies, Nature, 574, 95–98, https://doi.org/10.1038/s41586-019-1592-6, 2019.
Hijmans, R. J., Williams, E., and Vennes, C.: geosphere: spherical trigonometry, R package geosphere version 1.5-10.2019, https://CRAN.R-project.org/package=geosphere (last access: 2 February 2025), 2021.
Hothorn, T., Bretz, F., and Westfall, P.: Simultaneous Inference in General Parametric Models, Biometr. J., 50, 346–363, https://doi.org/10.1002/bimj.200810425, 2008.
ICES: Database report of the stomach sampling project, 1991, ICES Cooperative Research Report, Vol. 219, 1426 pp., https://doi.org/10.17895/ices.pub.4626, 1997.
ICES: Report of the Working Group on Ecosystem Effects of Fishing Activities (WGECO), 12–19 April 2018, San Pedro del Pinatar, Spain, ICES CM 2018/ACOM:27, 69 pp., 2018.
Jakubavičiute, E., Bergström, U., Eklöf, J. S., Haenel, Q., and Bourlat, S. J.: DNA metabarcoding reveals diverse diet of the three-spined stickleback in a coastal ecosystem, PLOS ONE, 12, e0186929, https://doi.org/10.1371/journal.pone.0186929, 2017.
Katara, I., Peden, W. J., Bannister, H., Ribeiro, J., Fronkova, L., Scougal, C., Martinez, R., Downie, A. L., and Sweeting, C. J.: Conservation hotspots for fish habitats: A case study from English and Welsh waters, Reg. Stud. Mar. Sci., 44, 101745, https://doi.org/10.1016/j.rsma.2021.101745, 2021.
Kleisner, K. M., Fogarty, M. J., McGee, S., Barnett, A., Fratantoni, P., Greene, J., Hare, J. A., Lucey, S. M., McGuire, C., Odell, J., Saba, V. S., Smith, L., Weaver, K. J., and Pinsky, M. L.: The Effects of Sub-Regional Climate Velocity on the Distribution and Spatial Extent of Marine Species Assemblages, PLOS ONE, 11, e0149220, https://doi.org/10.1371/journal.pone.0149220, 2016.
Kortsch, S., Primicerio, R., Fossheim, M., Dolgov, A. V., and Aschan, M.: Climate change alters the structure of arctic marine food webs due to poleward shifts of boreal generalists, P. Roy. Soc. B-Biol. Sci., 282, 20151546, https://doi.org/10.1098/rspb.2015.1546, 2015.
Kotwicki, S., Ressler, P. H., Ianelli, J. N., Punt, A. E., and Horne, J. K.: Combining data from bottom-trawl and acoustic-trawl surveys to estimate an index of abundance for semipelagic species, Can. J. Fish. Aquat. Sci., 75, 60–71, https://doi.org/10.1139/cjfas-2016-0362, 2018.
Legendre, P.: Model II regression user's guide, R edition, R Vignette, 14 pp., CRAN, https://cran.r-project.org/web/packages/lmodel2/vignettes/mod2user.pdf (last access: 2 June 2023), 1998.
Link, J. S.: A General Model of Selectivity for Fish Feeding: A Rank Proportion Algorithm, T. Am. Fish. Soc., 133, 655–673, https://doi.org/10.1577/t02-142.1, 2004.
Link, J. S., Fulton, E. A., and Gamble, R. J.: The northeast US application of ATLANTIS: A full system model exploring marine ecosystem dynamics in a living marine resource management context, Prog. Oceanogr., 87, 214–234, https://doi.org/10.1016/j.pocean.2010.09.020, 2010.
Lotze, H. K., Tittensor, D. P., Bryndum-Buchholz, A., Eddy, T. D., Cheung, W. W. L., Galbraith, E. D., Barange, M., Barrier, N., Bianchi, D., Blanchard, J. L., Bopp, L., Büchner, M., Bulman, C. M., Carozza, D. A., Christensen, V., Coll, M., Dunne, J. P., Fulton, E. A., Jennings, S., Jones, M. C., Mackinson, S., Maury, O., Niiranen, S., Oliveros-Ramos, R., Roy, T., Fernandes, J. A., Schewe, J., Shin, Y.-J., Silva, T. A. M., Steenbeek, J., Stock, C. A., Verley, P., Volkholz, J., Walker, N. D., and Worm, B.: Global ensemble projections reveal trophic amplification of ocean biomass declines with climate change, P. Natl. Acad. Sci. USA, 116, 12907–12912, https://doi.org/10.1073/pnas.1900194116, 2019.
Lynam, C. P. and Piet, G.: Pilot Assessment of Mean Maximum Length of Fish, in: OSPAR, 2023: The 2023 Quality Status Report for the North-East Atlantic, OSPAR Commission, London, https://oap.ospar.org/en/ospar-assessments/quality-status-reports/qsr-2023/indicator-assessments/mean-max-fish-pilot/ (last access: 27 May 2025), 2022.
Lynam, C. P. and Ribeiro, J.: A data product derived from Northeast Atlantic groundfish data from scientific trawl surveys 1983–2020, Lowestoft, UK, https://doi.org/10.14466/CefasDataHub.126, 2022.
Lynam, C. P., Piet, G., and Volwater, J.: Size Composition in Fish Communities, in: OSPAR, 2023: The 2023 Quality Status Report for the Northeast Atlantic, OSPAR Commission, London, https://oap.ospar.org/en/ospar-assessments/quality-status-reports/qsr-2023/indicator-assessments/size-composition-fish-communities (last access: 27 May 2025), 2022.
Nakazawa, T., Ushio, M., and Kondoh, M.: Scale Dependence of Predator-Prey Mass Ratio. Determinants and Applications, 1st edn., Elsevier Ltd., https://doi.org/10.1016/B978-0-12-386475-8.00007-1, 269–302 pp., 2011.
Nnanatu, C. C., Thompson, M. S. A., Spence, M. A., Couce, E., van der Kooij, J., and Lynam, C. P.: Bayesian hierarchical space-time models to improve multispecies assessment by combining observations from disparate fish surveys, arXiv [preprint], https://doi.org/10.48550/arXiv.2012.02196, 2020.
Otto, S. B., Rall, B. C., and Brose, U.: Allometric degree distributions facilitate food-web stability, Nature, 450, 1226–1229, https://doi.org/10.1038/nature06359, 2007.
Pecuchet, L., Blanchet, M. A., Frainer, A., Husson, B., Jørgensen, L. L., Kortsch, S., and Primicerio, R.: Novel feeding interactions amplify the impact of species redistribution on an Arctic food web, Glob. Change Biol., 26, 4894–4906, https://doi.org/10.1111/gcb.15196, 2020.
Petchey, O. L., Beckerman, A. P., Riede, J. O., and Warren, P. H.: Size, foraging, and food web structure, P. Natl. Acad. Sci. USA, 105, 4191–4196, https://doi.org/10.1073/pnas.0710672105, 2008.
Pethybridge, H. R., Choy, C. A., Polovina, J. J., and Fulton, E. A.: Improving Marine Ecosystem Models with Biochemical Tracers, Annu. Rev. Mar. Sci., 10, 199–228, https://doi.org/10.1146/annurev-marine-121916-063256, 2018.
Pinnegar, J. K.: DAPSTOM – An Integrated Database & Portal for Fish Stomach Records, Version 5.5, Centre for Environment, Fisheries & Aquaculture Science, Lowestoft, UK, 34 pp., 2019.
Pomeranz, J. P. F., Thompson, R. M., Poisot, T., and Harding, J. S.: Inferring predator–prey interactions in food webs, Methods Ecol. Evol., 10, 356–367, https://doi.org/10.1111/2041-210X.13125, 2019.
Preciado, I., López-López, L., Rabanal, I., Ortiz, J. J., Torres, M. Á., Muñoz, I., Iglesias, D., García Rebollo, J. M., Mendes, H., Le Loc'h, F., Garrido, S., Metaireau, H., and Serre, S.: Changes in average trophic level of marine consumers, in: OSPAR, 2023: The 2023 Quality Status Report for the North-East Atlantic, OSPAR Commission, London, 2023.
R Core Team: R: A language and environment for statistical computing, R Foundation for Statistical Computing, Vienna, Austria, https://www.R-project.org (last access: 28 May 2025), 2020.
Reum, J. C. P., Holsman, K. K., Aydin, K. Y., Blanchard, J. L., and Jennings, S.: Energetically relevant predator–prey body mass ratios and their relationship with predator body size, Ecol. Evol., 9, 201–211, https://doi.org/10.1002/ece3.4715, 2019.
Rombouts, I., Beaugrand, G., Fizzala, X., Gaill, F., Greenstreet, S. P. R., Lamare, S., Le Loc'H, F., McQuatters-Gollop, A., Mialet, B., Niquil, N., Percelay, J., Renaud, F., Rossberg, A. G., and Féral, J. P.: Food web indicators under the Marine Strategy Framework Directive: From complexity to simplicity?, Ecol. Indic., 29, 246–254, https://doi.org/10.1016/j.ecolind.2012.12.021, 2013.
Rooney, N., McCann, K., Gellner, G., and Moore, J. C.: Structural asymmetry and the stability of diverse food webs, Nature, 442, 265–269, https://doi.org/10.1038/nature04887, 2006.
Rossberg, A. G., Uusitalo, L., Berg, T., Zaiko, A., Chenuil, A., Uyarra, M. C., Borja, A., and Lynam, C. P.: Quantitative criteria for choosing targets and indicators for sustainable use of ecosystems, Ecol. Indic., 72, 215–224, https://doi.org/10.1016/j.ecolind.2016.08.005, 2017.
Samhouri, J. F., Levin, P. S., and Ainsworth, C. H.: Identifying Thresholds for Ecosystem-Based Management, PLoS One, 5, e8907, https://doi.org/10.1371/journal.pone.0008907, 2010.
Schneider, F. D., Scheu, S., and Brose, U.: Body mass constraints on feeding rates determine the consequences of predator loss, Ecol. Lett., 15, 436–443, https://doi.org/10.1111/j.1461-0248.2012.01750.x, 2012.
Scott, F., Blanchard, J. L., and Andersen, K. H.: mizer: an R package for multispecies, trait-based and community size spectrum ecological modelling, Methods Ecol. Evol., 5, 1121–1125, https://doi.org/10.1111/2041-210X.12256, 2014.
Smith, B. E. and Link, J. S. J.: The Trophic Dynamics of 50 Finfish and 2 Squid Species on the Northeast US Continental Shelf, U. S. Dep. Commer. NOAA Technical Memorandum, NMFS-NE-21, NOAA, 1–29, https://repository.library.noaa.gov/view/noaa/3755 (last access: 27 May 2025), 2010.
Spence, M. A., Griffiths, C. A., Waggitt, J. J., Bannister, H. J., Thorpe, R. B., Rossberg, A. G., and Lynam, C. P.: Sustainable fishing can lead to improvements in marine ecosystem status: an ensemble-model forecast of the North Sea ecosystem, Mar. Ecol. Prog. Ser., 680, 207–221, 2021.
Tam, J. C., Link, J. S., Rossberg, A. G., Rogers, S. I., Levin, P. S., Rochet, M. J., Bundy, A., Belgrano, A., Libralato, S., Tomczak, M., Van De Wolfshaar, K., Pranovi, F., Gorokhova, E., Large, S. I., Niquil, N., Greenstreet, S. P. R., Druon, J. N., Lesutiene, J., Johansen, M., Preciado, I., Patricio, J., Palialexis, A., Tett, P., Johansen, G. O., Houle, J., and Rindorf, A.: Towards ecosystem-based management: Identifying operational food-web indicators for marine ecosystems, ICES J. Mar. Sci., 74, 2040–2052, https://doi.org/10.1093/icesjms/fsw230, 2017.
Temming, A. and Herrmann, J. P.: Gastric evacuation in cod. Prey-specific evacuation rates for use in North Sea, Baltic Sea and Barents Sea multi-species models, Fish. Res., 63, 21–41, https://doi.org/10.1016/s0165-7836(03)00041-9, 2003.
Thompson, M. S. A., Pontalier, H., Spence, M. A., Pinnegar, J. K., Greenstreet, S. P. R., Moriarty, M., Hélaouët, P., and Lynam, C. P.: A feeding guild indicator to assess environmental change impacts on marine ecosystem structure and functioning, J. Appl. Ecol., 57, 1769–1781, https://doi.org/10.1111/1365-2664.13662, 2020.
Thompson, M. S. A., Couce, E., Schratzberger, M., and Lynam, C. P.: Climate change affects the distribution of diversity across marine food webs, Glob. Change Biol., 29, 6606–6619, https://doi.org/10.1111/gcb.16881, 2023a.
Thompson, M. S. A., Lynam, C. P., and Preciado, I.: Pilot Assessment of Feeding Guilds, in: OSPAR, 2023: The 2023 Quality Status Report for the Northeast Atlantic, OAP, London, https://oap.ospar.org/en/ospar-assessments/quality-status-reports/qsr-2023/indicator-assessments/feeding-guild-pilot-assessment (last access: 27 May 2025), 2023b.
Thompson, M. S. A., Preciado, I., Maioli, F., Bartolino, V., Belgrano, A., Casini, M., Cresson, P., Eriksen, E., Hernandez-Milian, G., Jónsdóttir, I. G., Neuenfeldt, S., Pinnegar, J. K., Ragnarsson, S., Schückel, S., Schückel, U., Smith, B. E., Torres, M. Á., Webb, T. J., and Lynam, C. P.: Modelled and observed fish feeding traits for the North Atlantic and Arctic Oceans (1836-2020) and population estimates of fish with different feeding traits from Northeast Atlantic scientific trawl surveys (1997–2020), Cefas, UK, https://doi.org/10.14466/CefasDataHub.149, 2024.
Timmerman, C.-A., Marchal, P., Denamiel, M., Couvreur, C., and Cresson, P.: Seasonal and ontogenetic variation of whiting diet in the Eastern English Channel and the Southern North Sea, PLOS ONE, 15, e0239436, https://doi.org/10.1371/journal.pone.0239436, 2020.
Torres, M. Á., Coll, M., Heymans, J. J., Christensen, V., and Sobrino, I.: Food-web structure of and fishing impacts on the Gulf of Cadiz ecosystem (South-western Spain), Ecol Model., 265, 26–44, https://doi.org/10.1016/j.ecolmodel.2013.05.019, 2013.
Travers-Trolet, M.: CGFS2017 cruise, RV Thalassa, Boulogne-sur-Mer, Ifremer, France, https://doi.org/10.17600/17002200, 2017.
Verin, Y.: IBTS 2018 cruise, RV Thalassa, Boulogne-sur-Mer, Ifremer, France, https://doi.org/10.17600/18000003, 2018.
Walmsley, S., Weiss, A., Claussen, U., and Connor, D.: Guidance for Assessments Under Article 8 of the Marine Strategy Framework Directive, Integration of assessment results. A report produced for the European Commission, DG Environment, https://circabc.europa.eu/sd/a/c04fa5be-804c-481f-a04e-036ffd6d85dc/GES_16-2016-02_Guidance_MSFDArt8.docx (last access: 27 May 2025), 2016.
Wang, S. and Brose, U.: Biodiversity and ecosystem functioning in food webs: the vertical diversity hypothesis, Ecol. Lett., 21, 9–20, https://doi.org/10.1111/ele.12865, 2018.
Webb, T. J. and Vanhoorne, B.: Linking dimensions of data on global marine animal diversity: Dimensions of global marine diversity, Philos. T. R. Soc. B, 375, 20190445, https://doi.org/10.1098/rstb.2019.0445, 2020.
Woodward, G., Ebenman, B., Emmerson, M., Montoya, J. M., Olesen, J. M., Valido, A., and Warren, P. H.: Body size in ecological networks, Trends Ecol. Evol., 20, 402–409, https://doi.org/10.1016/j.tree.2005.04.005, 2005.
Worm, B., Barbier, E. B., Beaumont, N., Duffy, J. E., Folke, C., Halpern, B. S., Jackson, J. B. C., Lotze, H. K., Micheli, F., Palumbi, S. R., Sala, E., Selkoe, K. A., Stachowicz, J. J., and Watson, R.: Impacts of biodiversity loss on ocean ecosystem services, Science (1979), 314, 787–790, https://doi.org/10.1126/science.1132294, 2006.