the Creative Commons Attribution 4.0 License.
the Creative Commons Attribution 4.0 License.
 | 06 Jun 2025
Estimation of long-term gridded cloud radiative kernel and radiative effects based on cloud fraction
Xinyan Liu
Qingxin Wang
Xiongxin Xiao
Yichuan Ma
Yanyan Wang
Shanjun Luo
Lei Du
Zhaocong Wu
The surface shortwave cloud radiative effect (CRE) plays a critical role in modulating the Earth's energy balance and climate change. However, accurately quantifying the CRE remains challenging due to significant uncertainties in downwelling surface shortwave radiation (DSSR) and cloud parameter estimates, especially in the Arctic. This paper introduces a novel approach that enhances the accuracy of CRE estimation by constructing computationally efficient, long-term gridded surface cloud fraction radiative kernels (GCF-CRKs) and integrating refined DSSR estimates and a high-precision cloud fraction (CF). By leveraging the correlation between the top-of-atmosphere (TOA) shortwave radiative parameters and surface radiation, combined with high-precision fused CF datasets from multiple satellite sources, we construct a CF-dependent model to refine DSSR estimates. Based on this model, we construct GCF-CRKs using the CF as the sole perturbation parameter to isolate the CF CRE. Our results indicate that this method significantly improves the accuracy of DSSR estimation under partially cloudy conditions (0 % < CF < 100 %), aligning more closely with ground-based observations. In Arctic-wide validation experiments, the root mean square error (RMSE) was decreased by approximately 2.5 W m−2, and the bias was reduced by 1.23 W m−2, which was an improvement of 8.7 % (reduction in RMSE) against the CERES EBAF (Clouds and the Earth's Radiant Energy System Energy Balanced and Filled). Even greater improvements were achieved at stations in Greenland (RMSE was reduced by 4.53 W m−2, and bias was reduced by ∼ 6.89 W m−2, with an accuracy improvement of about 11.1 %). The GCF-CRKs exhibit similar signs and patterns and enhanced stability compared to existing kernels. The sensitivity analysis results reveal that seasonal and interannual variations introduce GCF-CRK uncertainties of approximately 1 and 0.1 W m−2 %−1, respectively, while spatial variations within the same latitude range can cause CRK uncertainties of 0.2–1.2 W m−2 %−1. These uncertainties can result in CRE biases ranging from 5 to 50 W m−2, which demonstrates the limitations of existing methods that utilize short-term, small-area parameter data to produce global CRKs. Using these GCF-CRKs, we estimated the spatiotemporal properties of the surface shortwave CRE in the Arctic over a 21-year period (2000–2020), and the trend result indicates that, despite the increasing influence of the CF on the Arctic DSSR, the smaller magnitude and interannual trend of the annual average surface shortwave CRE suggest that previous studies may have overestimated the magnitude and rate of the cooling effect of clouds on the Arctic DSSR by up to 4 and 0.5 W m−2 per decade, particularly in Greenland. This study provides a more accurate and efficient assessment of the CRE, and the results underscore the need for more effective measures to mitigate the impact of Arctic amplification on the surface radiative energy balance, which is crucial for understanding and addressing regional and global climate change. The GCF-CRKs are freely available to the public at https://doi.org/10.5281/zenodo.13907217 (Liu, 2024).
- Article
(19676 KB) - Full-text XML
- BibTeX
- EndNote


-
A novel method was developed to quantify Arctic surface shortwave cloud radiative effects (SWCREs) using long-term gridded surface cloud fraction radiative kernels (GCF-CRKs).
-
GCF-CRKs were directly estimated from observational data and with the incorporation of spatiotemporal information.
-
The consideration of cloud fraction (CF) improved downwelling shortwave radiation (DSSR) estimate accuracy by 8.7 %–11.1 % under partially cloudy conditions.
-
A stronger cloud-induced cooling effect over Greenland was revealed, with a bias of about 4 W m−2.
-
There was a slower cloud-cooling impact rate (1.131 W m−2 per decade) on Arctic surface shortwave (SW) radiation than expected (1.64 W m−2 per decade).
Clouds cover approximately two-thirds of the Earth's surface and play a critical role in the Earth's energy balance and climate system. They can either reflect incoming solar radiation back to space, cooling the Earth, or trap outgoing longwave radiation, warming the Earth. The net effect of clouds on the climate system is a complex interplay of these two processes. As human activities intensify, the emission of anthropogenic radiatively active substances has increased disturbances of radiative processes, thereby affecting the radiative balance of the climate system and leading to changes in the global average surface temperature. Among these complex interactions, clouds contribute the most to the uncertainty of climate change, accounting for approximately 70 % (Vial et al., 2013). This impact primarily depends on changes in various cloud parameters, such as cloud amount, cloud height, cloud water content, and cloud optical thickness (Boucher et al., 2013; Wang et al., 2025). Therefore, the cloud radiative effect and its feedback processes on global and regional climates have always been a focus in the field of climate research. The importance and complexity of clouds also make them the largest source of uncertainty in current climate modeling and prediction studies (Stephens, 2005; Boucher et al., 2013)
The influence of clouds on the climate system is generally represented by cloud radiative forcing (CRF), also known as cloud radiative effect (CRE). CRE is defined as the difference in terms of radiation flux at the top of the atmosphere (TOA), within the atmosphere, or at the surface under cloudy and clear-sky conditions. It can be divided into longwave cloud radiative effect (LWCRE) and shortwave cloud radiative effect (SWCRE) based on the wavelength band (Ramanathan et al., 1989). Changes in the CRE directly affect the radiation balance of the Earth–atmosphere system and the closely related temperature changes, which are of great scientific significance for correctly understanding and accurately predicting the trend of global warming. Previous studies have quantitatively estimated the CRE and the radiative effect caused by a doubling of the CO2 concentration, finding that the radiative effect caused by changes in clouds is a crucial component of the overall cloud feedback mechanism. For example, Randall et al. (1984) pointed out that a 4 % increase in global low clouds is sufficient to offset the 2–3 °C global warming caused by a doubling of the CO2 concentration. Slingo (1990) confirmed, using a three-dimensional atmospheric circulation model, that an increase of about 15 %–20 % in low cloud cover can offset the change in TOA radiative forcing caused by a doubling of the CO2 concentration. Liu et al. (2007) found, using a one-dimensional radiative–convective model, that a change of even a few percent in cloud cover can produce a radiative forcing comparable to that caused by a doubling of the CO2 concentration. Chen et al. (2000) demonstrated that changes in cloud amount have an impact on the radiation field of the Earth–atmosphere system that is comparable to the effects of cloud type and optical thickness. Tang and Leng (2013) showed that total cloud amount is an important factor affecting the summer daily maximum near-surface temperature changes over northern Eurasia and North America; in North America, a 10 % increase in total cloud amount can lead to a decrease of 0.3–0.9 °C in summer daily maximum near-surface temperature.
The Arctic, characterized by a high albedo surface, cold temperatures, and a strong temperature inversion, is one of the regions where cloud amount changes are most pronounced. In recent decades, the Arctic region has experienced some of the most rapid and severe impacts of climate change, a phenomenon often referred to as Arctic amplification (Baek et al., 2020). Studies have shown that changes in cloud amount in the Arctic significantly influence the energy balance and temperature distribution by regulating the surface energy fluxes, sea ice dynamics, and overall climate feedback mechanisms in the Arctic (Yeo et al., 2022), making substantial contributions to the Arctic amplification phenomenon (Kay and L'Ecuyer, 2013). For instance, a decrease in cloud amount has been linked to an increase in downwelling surface shortwave radiation (DSSR) in the Arctic, which can lead to more rapid ice melt and further warming (Sledd and L'Ecuyer, 2019). Therefore, understanding and accurately quantifying the CRE in the Arctic is crucial for reducing uncertainties in climate feedback and for understanding global and regional climate change.
Despite its critical importance, accurate estimation of the CRE in the Arctic remains a significant challenge. DSSR, which is the primary source of surface energy, is strongly influenced by cloud amount changes compared to radiative parameters at the top of the atmosphere (TOA) because it occurs beneath the atmosphere (Pinker et al., 2005; Letu et al., 2020). Since the release of the Fifth Assessment Report of the Intergovernmental Panel on Climate Change (IPCC) (AR5), the accuracy of DSSR flux datasets has improved continuously, but the uncertainty introduced by cloud parameters remains one of the most significant challenges in climate model predictions (IPCC, 2022), thereby contributing to the uncertainty in CRE (Hahn et al., 2001; Liu et al., 2011). Cloud amount is typically represented by cloud fraction (CF), that is, the horizontal area of the Earth's surface covered by clouds. Compared to cloud-free conditions, clouds reduce incoming solar radiation by 49 W m−2, approximately 14 % of the total incident solar radiation, and deviations in the CF can lead to DSSR differences ranging from 10 to 90 W m−2 (Wild et al., 2019). In high-latitude regions, such as the Arctic, differences in terms of the DSSR caused by significant CF deviations are even more pronounced (Liu et al., 2022). Kay and L'Ecuyer (2013), using reanalysis data, found that a decrease in CF has led to a significant increase in DSSR in the Arctic. Sledd and L'Ecuyer (2019, 2021) studied the interannual variability in the CF's impact on Arctic surface shortwave absorption trends and found that substantial differences in terms of the CF between datasets can introduce uncertainty into the lag effects of the response of the DSSR trend. By comparing the relationship between the CF and shortwave (SW) radiation in four reanalysis datasets, Walsh et al. (2009) discovered that deviations in the coverage of low-level clouds during the Arctic summer could cause seasonal discrepancies of approximately 160 W m−2 (Walsh et al., 2009). Other studies have used similar correlation methods to analyze parameters from satellite observations, model simulations, and reanalysis data and have reached similar conclusions, although the estimated values differ by approximately 10–40 W m−2 (Hakuba et al., 2017; Huang et al., 2017b; Kato et al., 2018). These values greatly exceed those of the impact of cloud parameter differences on the annual global DSSR (Kato et al., 2011).
However, the challenges in accurately estimating the DSSR directly impact the accuracy of the CRE estimation, complicating the understanding of Arctic radiative processes. Currently, DSSR estimation methods often rely on mixed-model algorithms that primarily address two extreme conditions: overcast skies (CF = 100 %) and clear skies (CF = 0 %). For partially cloudy conditions (0 % < CF < 100 %), these methods typically combine clear-sky parameterization schemes with existing cloud products and use empirical formulas to derive indirect estimates (Chen et al., 2020). They do not delve deeply into the radiative transfer mechanisms between cloud properties and DSSR, leading to error accumulation and significant biases in DSSR estimates. Consequently, these biases directly impact the accuracy of CRE estimation, further complicating the understanding of Arctic radiative processes.
In addition to the inherent accuracy of the parameters, answering the question of how to extract the corresponding radiative contributions from complex perturbation factors is also crucial for enhancing the precision of CRE estimation. This need is more strongly driven by the necessity to assess feedback processes in global climate models that may amplify or diminish the response to radiative forcing (Thorsen et al., 2018). Currently, there are three main methods for isolating the radiative contributions of individual influencing factors. The first is the data simulation method, such as using radiative transfer models to simulate the transmission of radiative parameters in the atmosphere and on the surface and quantifying the radiative effect due to cloud properties by inputting additional atmospheric information (Kato et al., 2012; Kim and Ramanathan, 2008). Alternatively, cloud properties simulated using satellite simulators can be converted into synthetic observations obtained from satellite observation systems to isolate the impact of cloud deviations on surface radiative parameters in models. However, low-accuracy CF information introduces significant estimation errors. The second commonly used method is the partial-perturbation algorithm, initially proposed by Wetherald and Manabe (1988). This method separates TOA radiative flux changes caused by specific variables by considering the difference between global climate model variation experiments and perturbation experiments. While this method can directly calculate various climate feedbacks, it requires rerunning the global climate model for each slight parameter change, demanding high computational resources and resulting in a low operational efficiency (Loeb et al., 2018b).
The current radiative kernel method, widely used in evaluating climate feedbacks, constructs a radiative kernel by constraining the change in a single variable due to a small perturbation. This kernel is used as a constant factor to calculate the perturbation effects of the variable on the radiative flux over different time periods and regions (Soden et al., 2008; Zhou et al., 2022). This method requires significantly less overall computation than the partial-perturbation algorithm and can effectively reduce correlation errors between different influencing factors. However, due to the vertical nonlinearity effect of cloud parameters, directly estimating the cloud radiative kernel is challenging. Therefore, non-cloud radiative kernels, such as those for temperature, water vapor, and surface albedo, are often used to indirectly estimate the CRE (Vial et al., 2013). This approach can confuse radiative uncertainties caused by non-cloud parameters with the CRE, thereby increasing the estimated radiative contribution of clouds.
To directly isolate the radiative contribution of the CF, Thorsen et al. (2018) applied a partial-radiative-perturbation-like calculation to observational datasets and proposed an observation-based partial-perturbation method, namely, the Clouds and the Earth's Radiant Energy System–partial radiative perturbation (CERES-PRP) (Thorsen et al., 2018). This method calculates radiative kernels by flexibly combining perturbation variables to achieve flux perturbation calculations. It has been successfully applied to CERES Energy Balanced and Filled (EBAF) surface radiative parameters (Kato et al., 2018) and to long-term studies of Earth's energy budget changes (Loeb et al., 2018a). However, this method calculates kernels using control operations from a single year and neglects the spatiotemporal variability of the parameters, which can lead to significant temporal and regional errors (Kramer et al., 2019). Additionally, similarly to most current radiative kernels, this method focuses on TOA radiative budgets and pays insufficient attention to surface radiative budgets and the associated radiative forcing contributions.
To achieve a higher CRE estimation accuracy, in this study, we used improved DSSR and higher-precision CF data to construct long-term, gridded surface cloud fraction radiative kernels (GCF-CRKs). These new CRKs were then used to accurately quantify the contribution of the CF to the DSSR and to enable detailed estimation and analysis of the spatiotemporal characteristics and long-term trends of the surface shortwave CRE in the Arctic. This method significantly enhances the accuracy of DSSR estimation, especially under partly cloudy conditions, with higher consistency with ground-based observations, and directly estimates GCF-CRKs from observational data and incorporates spatiotemporal variability information. Compared to traditional radiative kernel methods, the approach used in this study directly calculates the radiative kernels for the entire cloud layer, avoiding biases from nonlinear effects in stratified algorithms and improving computational efficiency and accuracy. However, it should be noted that, although the optical thickness (expressed using the uppercase English name of τ, namely TAU), altitude, thickness, and phase of clouds all have complex effects on the scattering and absorption of shortwave radiation and although the uncertainties of these factors directly impact the accuracy of radiative forcing estimates and climate change predictions (Boucher et al., 2013), this study focuses solely on extracting the radiative effects of CF. This limitation may introduce uncertainties due to differences in terms of cloud type and location, which should be carefully considered in practical applications.
The structure of this paper is as follows: Sect. 2 introduces the observational data. Section 3 provides details of the method for constructing CRKs. In Sect. 4, the corrected DSSR and the CRE are estimated using the CF-CRKs, and the accuracies are validated. Section 5 presents a discussion and conclusions.
2.1 Satellite observational datasets: CERES SYN1deg and CERES EBAF
The CERES synoptic 1° (SYN1deg) dataset is recognized as one of the most accurate global radiative energy balance products, particularly for mid-latitude regions. However, its accuracy in high-latitude areas remains highly uncertain (Jia et al., 2016, 2018). Studies have shown that, in high-latitude regions, the RMSE of the CERES SYN1deg exceeds 33.56 W m−2, and the bias is greater than 3.43 W m−2. This reduced accuracy is likely to be caused by the significant errors in regions covered by ice and snow (Inamdar and Guillevic, 2015). Moreover, several studies have demonstrated that using more accurate cloud parameters can significantly improve its accuracy, indicating that the inaccuracies in the cloud parameters contribute to the observed errors (Kato et al., 2011; Thorsen et al., 2018).
The CERES EBAF datasets, including the CERES EBAF-TOA and the CERES EBAF surface radiative fluxes, are also highly accurate global monthly gridded (1° × 1°) datasets. In the EBAF products, the CERES shortwave and longwave radiative fluxes are adjusted within their measurement uncertainties to ensure that the CERES's long-term global annual average net flux is consistent with long-term ocean heat storage data (Loeb et al., 2019). The EBAF surface flux calculation utilizes the National Aeronautics Space Administration (NASA) Langley-adjusted Fu–Liou radiative transfer model, which incorporates cloud properties retrieved from the CERES–Moderate Resolution Imaging Spectroradiometer (MODIS), meteorological data from reanalysis systems, and aerosol data from the aerosol assimilation system, and the calculation of the surface irradiance is constrained by the CERES observed TOA irradiance. Christensen et al. (2016) compared various radiative parameter products for the Arctic and found that the CERES EBAF represents the average level of these products, suggesting that this dataset should be considered to be a key benchmark for evaluating Arctic surface radiative budgets (Christensen et al., 2016).
2.2 Ground-based observation datasets
Over the past few decades, globally distributed ground-based radiative flux networks have provided extensive observation validation datasets for satellite observations. Compared to other global regions, the Arctic has a sparse distribution of surface radiative flux stations, and most are located in terrestrial areas (Fig. 1). Nevertheless, these ground stations offer reliable reference data for Arctic radiative fluxes.
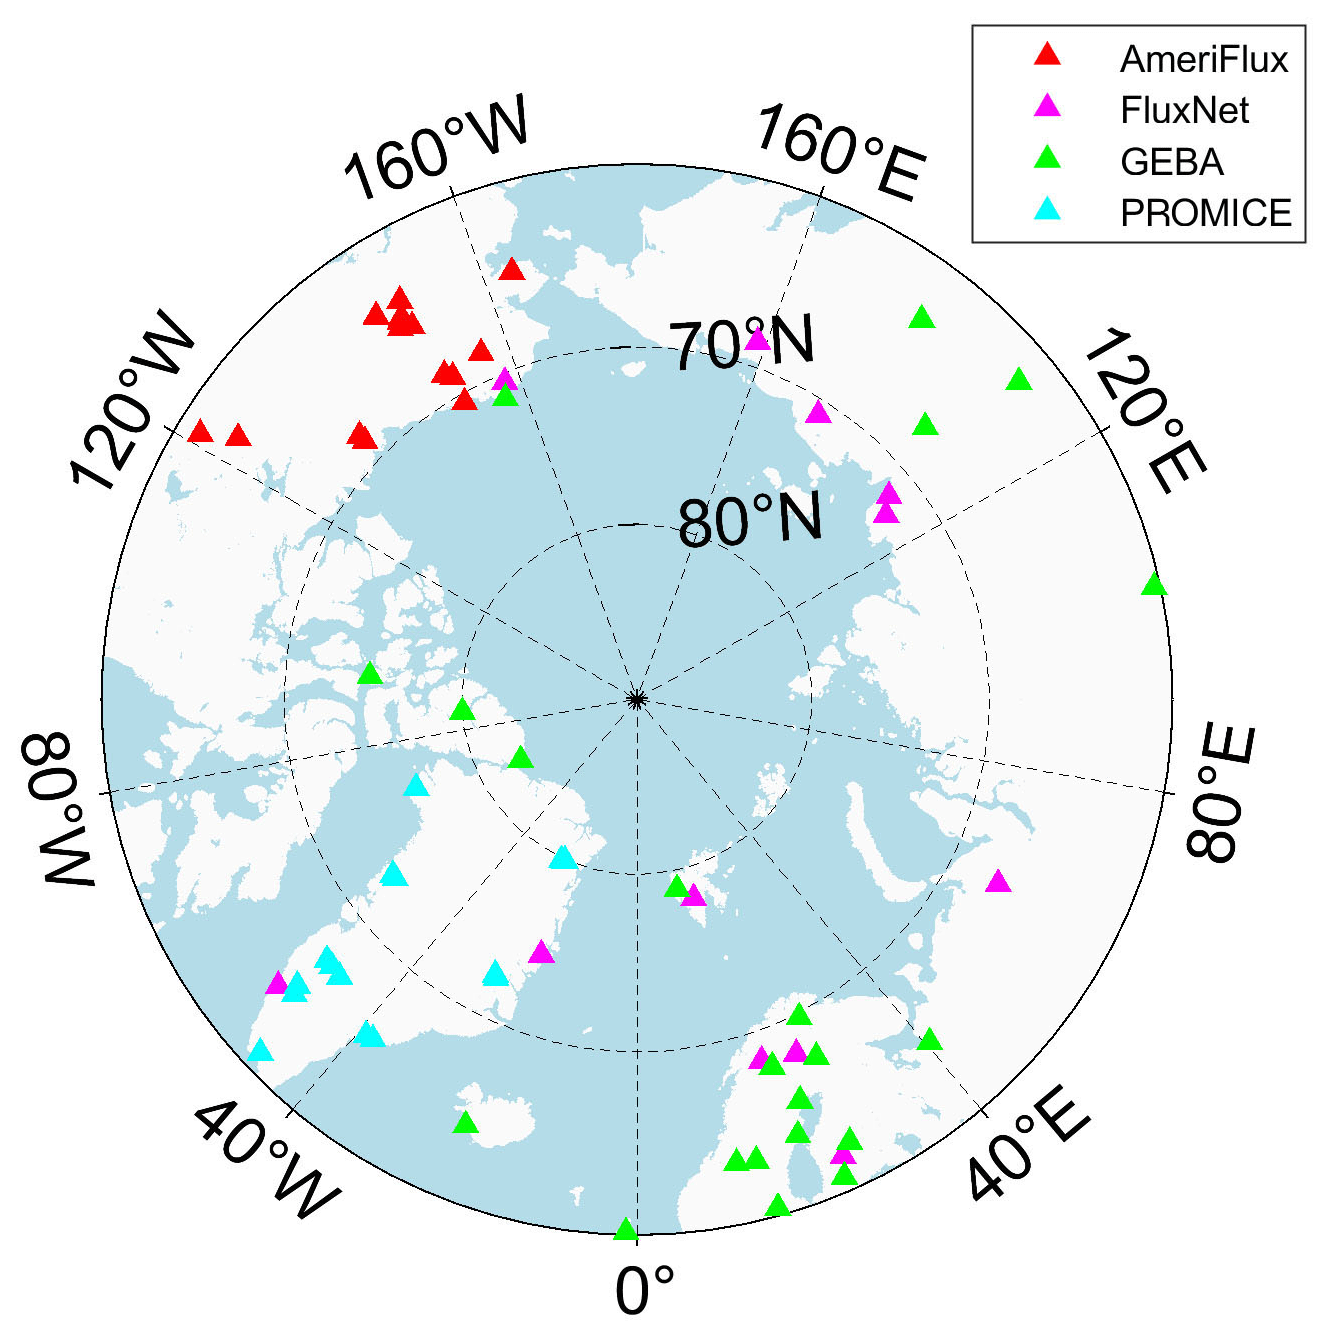
Figure 1Spatial distribution of 66 ground stations in four radiation flux networks.
2.2.1 AmeriFlux
AmeriFlux is part of the US flux station network, which is jointly managed by the US Department of Energy's National Energy Technology Laboratory (NETL) and the US Department of Agriculture (USDA). It is an atmospheric-flux observation network that primarily monitors and quantifies carbon, water, and energy fluxes in terrestrial ecosystems. This network spans various geographical locations and ecosystems in the US, including forests, grassland, wetlands, and cropland. AmeriFlux station data have been widely used to evaluate surface radiative fluxes (Chen et al., 2020). In this study, we used data from 18 stations located above 60° N, primarily in northern and western Alaska, covering diverse ecosystem types such as tundra, wetlands, and forests.
2.2.2 FluxNet
FluxNet is one of the world's largest networks for monitoring and quantifying carbon, water, and energy fluxes in terrestrial ecosystems. FluxNet includes several stations located above 60° N and shows some overlap with AmeriFlux. In this study, DSSR data from 13 stations were selected.
2.2.3 GEBA
The Global Energy Balance Archive (GEBA) is a centralized database that contains measurements of surface energy fluxes worldwide. GEBA compiles monthly average data for various radiative energy balance fluxes observed at the Earth's surface, including global radiation (total DSSR), diffuse and direct shortwave radiation, surface albedo, reflected shortwave radiation, downwelling and upwelling longwave radiation, net radiation, sensible and latent heat fluxes, ground heat flux, and latent heat of melting. In the Arctic region, GEBA includes numerous stations, including both ocean buoys and land-based observation stations, providing ground-truth data for surface radiation observations in this region (Wild et al., 2017). In this study, data from 22 stations collected during 2000–2020 were selected.
2.2.4 PROMICE
The Programme for Monitoring of the Greenland Ice Sheet (PROMICE) is a project designed to monitor changes in the Greenland Ice Sheet (GrIS). This network covers the western, central, and eastern parts of Greenland, and variables such as surface height changes, snow depth, temperature, humidity, and the impact of global climate change on the ice sheet are monitored (Ahlstrom and PROMICE project team, 2011). The PROMICE stations are in a variety of ecosystems, including alpine, glacier, and coastal areas, and use automated instruments and sensors to measure atmospheric and surface variables at a high frequency (typically hourly), such as the temperature, humidity, air pressure, wind speed, snow depth, and surface height. In this study, data from 14 stations collected during 2000–2020 were selected as the validation data.
2.2.5 Data processing and quality control
FluxNet and GEBA directly provide monthly mean flux data, while AmeriFlux provides observations every 30 min, and PROMICE provides hourly data. To better validate the monthly mean satellite data, a consistent resampling process is required. The 30 min and hourly data are first averaged to daily values, and then monthly averages are obtained, minimizing the impact of missing values (Roesch et al., 2011). Before aggregating the data into monthly averages, rigorous quality controlling must be performed (Jiang et al., 2015). In this study, the data quality was first assessed, and the original data with poor-quality marks were removed. The data continuity was then checked, and the monthly shortwave radiation values were calculated only when the daily valid data exceeded 3 h and the monthly valid data exceeded 15 d.
2.3 Fusion CF Dataset
High-precision CF information is crucial for obtaining accurate GCF-CRKs. However, existing CF datasets are mostly based on single-satellite data, leading to a low accuracy, discontinuous spatiotemporal coverage, and significant spatiotemporal differences between datasets. To address this, we developed a spatiotemporal fusion framework for multiple-satellite CF products, leveraging their complementary strengths of spatiotemporal completeness and accuracy. We produced a high-precision, spatiotemporally complete, 1° × 1° monthly average CF dataset for the Arctic region from 2000 to 2020 (Liu et al., 2023). This method enhances the accuracy of passive sensor data using a cumulative distribution function matching algorithm with a spatiotemporal extension, and then it employs a Bayesian maximum entropy fusion algorithm to integrate multiple observation datasets with uncertainties. The final fused dataset yields a 10 %–20 % overall reduction in the inconsistencies between active sensor data and ground observations and yields more significant improvements in snow- and/or ice-covered regions. The fused product has a better consistency with reanalysis and model data and maintains high spatiotemporal completeness within the study period and region. The specific data can be downloaded from https://doi.org/10.5281/zenodo.7478918 (Liu and He, 2022).
3.1 Cloud radiative effect and cloud radiative kernel
Clouds can regulate the radiation energy balance and water cycle of the Earth–atmosphere system through the albedo effect and greenhouse effect, thereby exerting significant impacts on the climate system. These impacts primarily depend on the variations in various cloud parameters, such as CF, cloud height, and TAU, and are generally represented by the CRE. In this study, we focus solely on the SWCRE, which is defined as the difference in terms of surface radiative flux between all-sky and clear-sky conditions.
In the above, Fcld is the radiative flux for overcast cloudy sky, Fall_sky is the all-sky radiative flux, Fclr is the clear-sky radiative flux, and f is the CF. When the CF is 100 %,
The sensitivity of the radiative flux is indicated by the cloud radiative kernel (CRK), which is also an effective means for quantitatively calculating climate feedback (Soden et al., 2008). It is typically calculated as the perturbation of CRE for a unit change in CF for each cloud type. Thus, the CRK can be expressed as follows:
Here, CRKSFC represents the surface CRK, and CREcld denotes the radiative forcing effect under completely overcast conditions. Therefore, the unit of the CRK is expressed in W m−2 %−1, indicating a differential change in the overcast CRE (Zhou et al., 2022; Zhang et al., 2021). CF is a key variable affecting surface radiative forcing as it directly determines the extent of cloud coverage and thus influences the reflection, scattering, and absorption processes of DSSR. Compared to other cloud parameters, CF has higher accuracy and spatiotemporal consistency in its acquisition. Some satellite-based CF datasets have long time spans, covering decades of global observational data, which provides robust long-term data support for studies on CRE and helps analyze trends in climate change and regional radiative forcing. Therefore, in this study, we utilized a high-precision CF dataset obtained from previous research (Liu et al., 2023) to calculate the CRKs for each grid cell. In each grid unit, there are significant differences in terms of cloud vertical structure and microphysical or optical thickness parameters. Thus, we treated different cloud parameters within each grid as distinct cloud types and included them as non-perturbation variables in the radiative transfer calculations, resulting in long-term, grid-specific radiative kernels for each cloud type.
3.2 Single-layer cloud radiative transfer model
In remote sensing observations, satellites can directly measure the TOA radiative flux, but the DSSR must be retrieved through inversion. Traditionally, to obtain surface radiative parameters, TOA parameters are used to constrain the surface parameter inversion (Kato et al., 2018; Loeb et al., 2018b).
For the shortwave radiative flux, the TOA albedo αA and atmospheric absorption a are defined as follows:
Based on the principle of energy conservation,
where αA is the ratio of the reflected energy at the TOA to the total incident energy, and as is the surface absorption rate, i.e., the ratio of the energy absorbed at the surface to the total incident energy at the TOA. In this context, αA can be expressed as a function of as, linking the TOA shortwave flux to the surface shortwave flux. Assuming that the surface albedo does not vary significantly with the seasons within a 1° × 1° grid, a strong linear relationship exists between αA and as. The slope of this linear relationship depends on the variation in the atmospheric absorption a relative to the surface absorption as.
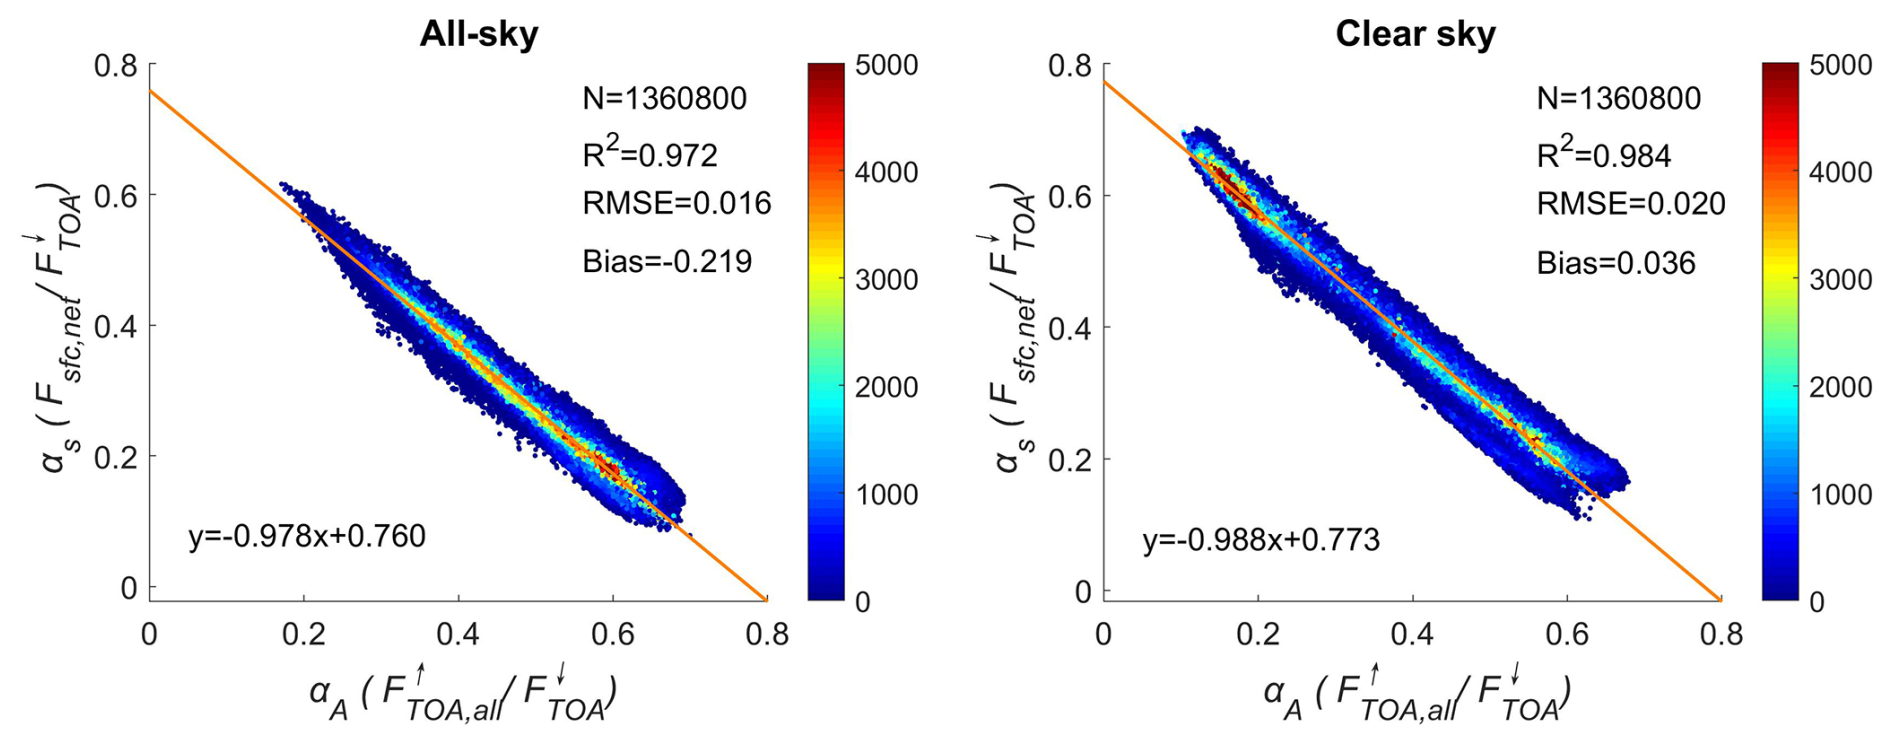
Figure 2Relationship between the albedo at the top of the atmosphere and the absorption ratio at the surface.
Analysis of the CERES SYN1deg 1° × 1° monthly average data for the Arctic region revealed that there is a strong linear correlation between αA and as, with a correlation coefficient (R2) of 0.97 and a root mean square error (RMSE) of 0.016 (Fig. 2). This linear relationship indicates that TOA SW radiation parameters can effectively constrain DSSR estimation. If the TOA SW radiation and surface radiative parameters and cloud properties are known, the DSSR can be estimated for a given region. For clear-sky conditions, R2 improves to 0.984, and the bias is 0.04, whereas, for cloudy conditions, R2 decreases slightly, and the bias increases to 0.22 (Fig. 2). This discrepancy is primarily due to the greater uncertainty introduced by cloud parameter errors in estimating the surface radiative parameters (Liu et al., 2022). Therefore, we propose a method to estimate the DSSR using TOA observations and clear-sky radiative flux while incorporating CF information into the radiative transfer calculations to isolate the sensitivity of the DSSR to the CF among various cloud parameters.
Assuming that the surface is a Lambertian reflector, the DSSR can be calculated as follows:
where F0(μi) is the DSSR in the absence of the surface contribution, and the second term accounts for the multiple reflection effects between the atmosphere and the bright surface. μi is the cosine of the solar zenith angle. When considering the impact of CF, F0(μi) is weighted by f:
where is the surface downward radiative flux under cloudy conditions and zero surface albedo, and is the surface downward radiative flux under clear-sky conditions. According to Liu et al. (2011) and Xie et al. (2014), can be expressed as a function of (Liu et al., 2011; Xie et al., 2014):
where αcld,0 is the cloud albedo, and acld,0 is the cloud absorption rate. The subscript 0 indicates the case with zero surface albedo. Typically, the cloud absorption rate is much smaller than the cloud albedo (Gautier and Landsfeld, 1997; Xie et al., 2014), and, thus, it can be neglected for simplification. Consequently, F0(μi) can be expressed as
To the first order, the cloud albedo is the primary factor that maintains the close relationship between the CF and planetary albedo (or the reflected SW radiation at the TOA), which has been demonstrated in various observation records (Norris and Evan, 2015). To further calculate the cloud albedo, we introduce the concept of the effective cloud albedo (Betts and Viterbo, 2005; Liu et al., 2010).
The effective cloud albedo αSRF,cld is mathematically similar to the surface albedo but is a dimensionless value. Liu et al. (2011) have shown that, when accounting for multiple reflection effects between clouds and the surface, αSRF,cld can be approximated as the product of the cloud albedo, surface albedo, and CF (Liu et al., 2011). Thus,
For conditions with rs=0,
To compute the effective cloud albedo, both the numerator and denominator of Eq. (12) are multiplied by a function of the surface albedo:
Thus,
which represents the net SW radiation at the surface. Based on previous analyses, the surface absorption rate as can similarly be expressed as a function of the surface net SW radiation. Therefore, the effective cloud albedo can be expressed as a function of the incident shortwave radiation at the TOA and the surface absorption rate:
Considering the fact that as can be modeled as a linear function of the TOA albedo, the corresponding cloud albedo can be computed using TOA observations, the clear-sky surface SW radiation, and the CF.
For a Lambertian surface, the influence of the cloud parameters on diffuse radiation is more pronounced under cloudy conditions. When considering multiple reflection effects, the net SW radiation at a surface with a surface albedo rs is
where T is the transmissivity of the atmosphere to diffuse radiation under cloudy conditions, which is dependent on various atmospheric factors such as aerosols, ozone, and water vapor (Huang et al., 2018). For simplification, in this study, we used empirical parameters combined with observational data.
Ultimately, the all-sky DSSR can be expressed as a function of the satellite-observed TOA shortwave radiation, clear-sky DSSR, and CF. In this study, we focused only on the CRE related to CF perturbations. Therefore, based on the partial-perturbation approach, CF is the sole user-defined variable in Eq. (17), and the other unknown parameters are consistent with the original CERES SYN1deg data.
3.3 Separation method for CF radiation contribution based on observational data
To isolate the sensitivity of radiative flux changes to the CF from observational data, we developed GCF-CRKs. In traditional CRK algorithms, it is assumed that the perturbation in the flux is linearly related to the perturbation itself, and, thus, it is necessary to calculate the CRKs for each atmospheric layer individually, and these are then summed. In this study, based on the plane-parallel approximation principle, we utilized the full-layer CF. Within the finite-difference framework and in conjunction with the CERES SYN1deg observational data, it is possible to compute the full-layer CF-CRKs.
According to Thorsen et al. (2018), the essence of the partial-radiative-perturbation methods lies in different forms of finite-difference approximations. In this study, the factor influencing the radiative parameters is the CF (f). When it changes by Δf, according to the finite-difference principle, the effect on the radiative flux δF is
where F is the all-sky DSSR, and Δf is the perturbation of the variable relative to its initial climate mean , i.e., . The climate mean value refers to the average of all of the data for a specific calendar month (April–September in this study) within the time series. All of the other variables related to the radiative transfer are represented as . is the truncation error of the forward finite difference. The subscript C indicates that the flux perturbation is related to the climate monthly mean initial state. To minimize the impacts of the temporal and spatial variabilities of the CF on the results, we prefer to calculate the flux perturbations related to the monthly mean values:
where f is the monthly mean CF, and the subscript M indicates that the flux perturbation is related to the monthly mean baseline state. In this equation, the truncation error is of the same order of magnitude as the perturbation variable itself, meaning that the computed perturbation flux is influenced not only by the perturbation variable but also by the potential decorrelation between the perturbation and non-perturbation variables. To minimize this, a central-finite-difference approach can be used to improve the magnitude of the order of the accuracy. Thus, backward finite differences are introduced.
Averaging the perturbation values obtained from the two finite-difference calculations yields
While central differences can reduce the impact of the decorrelation between the related variables, the perturbation states f+Δf and f−Δf may exceed the physical limits of the parameters, making them impractical for radiative transfer calculations. Therefore, a two-step alternative is proposed: when the CF perturbation state is invalid, initially, the monthly climate mean value is used in place of the corresponding monthly average. If the substituted value is still non-physical, it is replaced with the nearest valid CF value within the effective range. Finally, the central difference is applied to compute the radiative perturbation.
To further simplify the quantification process of the CRE due to CF perturbations, in this study, we used Thorsen et al. (2018)'s method in the CERES model by replacing the fixed perturbations with the observed variable anomalies. This means normalizing the perturbation effects of the variable on the radiative perturbation to calculate the CRKs. In this concept, the resulting CF-CRKs are a byproduct of the central-difference calculations, representing the contribution of a 1 % CF change to the DSSR.
Using the high-precision fused CF dataset and the CERES observational data, GCF-CRKs can be obtained. The computed full-layer CRK, in combination with the fused CF dataset, allows for correction of the biases in the CERES DSSR data.
4.1 DSSR estimated using the single-layer cloud radiative transfer model
In this study, we used the single-layer cloud radiative transfer model constructed in Sect. 3.1 to estimate the DSSR received at the surface under partly cloudy conditions. To verify the accuracy and applicability of this model, we compared the estimated results with the DSSR provided by the CERES SYN1deg dataset.
Figure 3 displays a scatterplot comparing the grid-point DSSR estimates with the CERES SYN1deg data for the Arctic region. It is evident from the plot that the estimates obtained using our single-layer cloud radiative transfer model have a high degree of consistency with the CERES SYN1deg DSSR data. Specifically, the R2 value between the estimates and observations is 0.985, indicating a very strong positive correlation. Moreover, the RMSE is approximately 9.69 W m−2, which is considered to be a small error in the field of radiative estimation, further confirming the model's accuracy. Additionally, the bias is approximately 5 W m−2, indicating that the average deviation between the estimated and CERES SYN1deg DSSR values is relatively small, which suggests that the model generally provides accurate DSSR estimates. This result demonstrates that using TOA observations, clear-sky surface shortwave radiation, and CF information to estimate the DSSR under all-sky conditions is highly feasible.
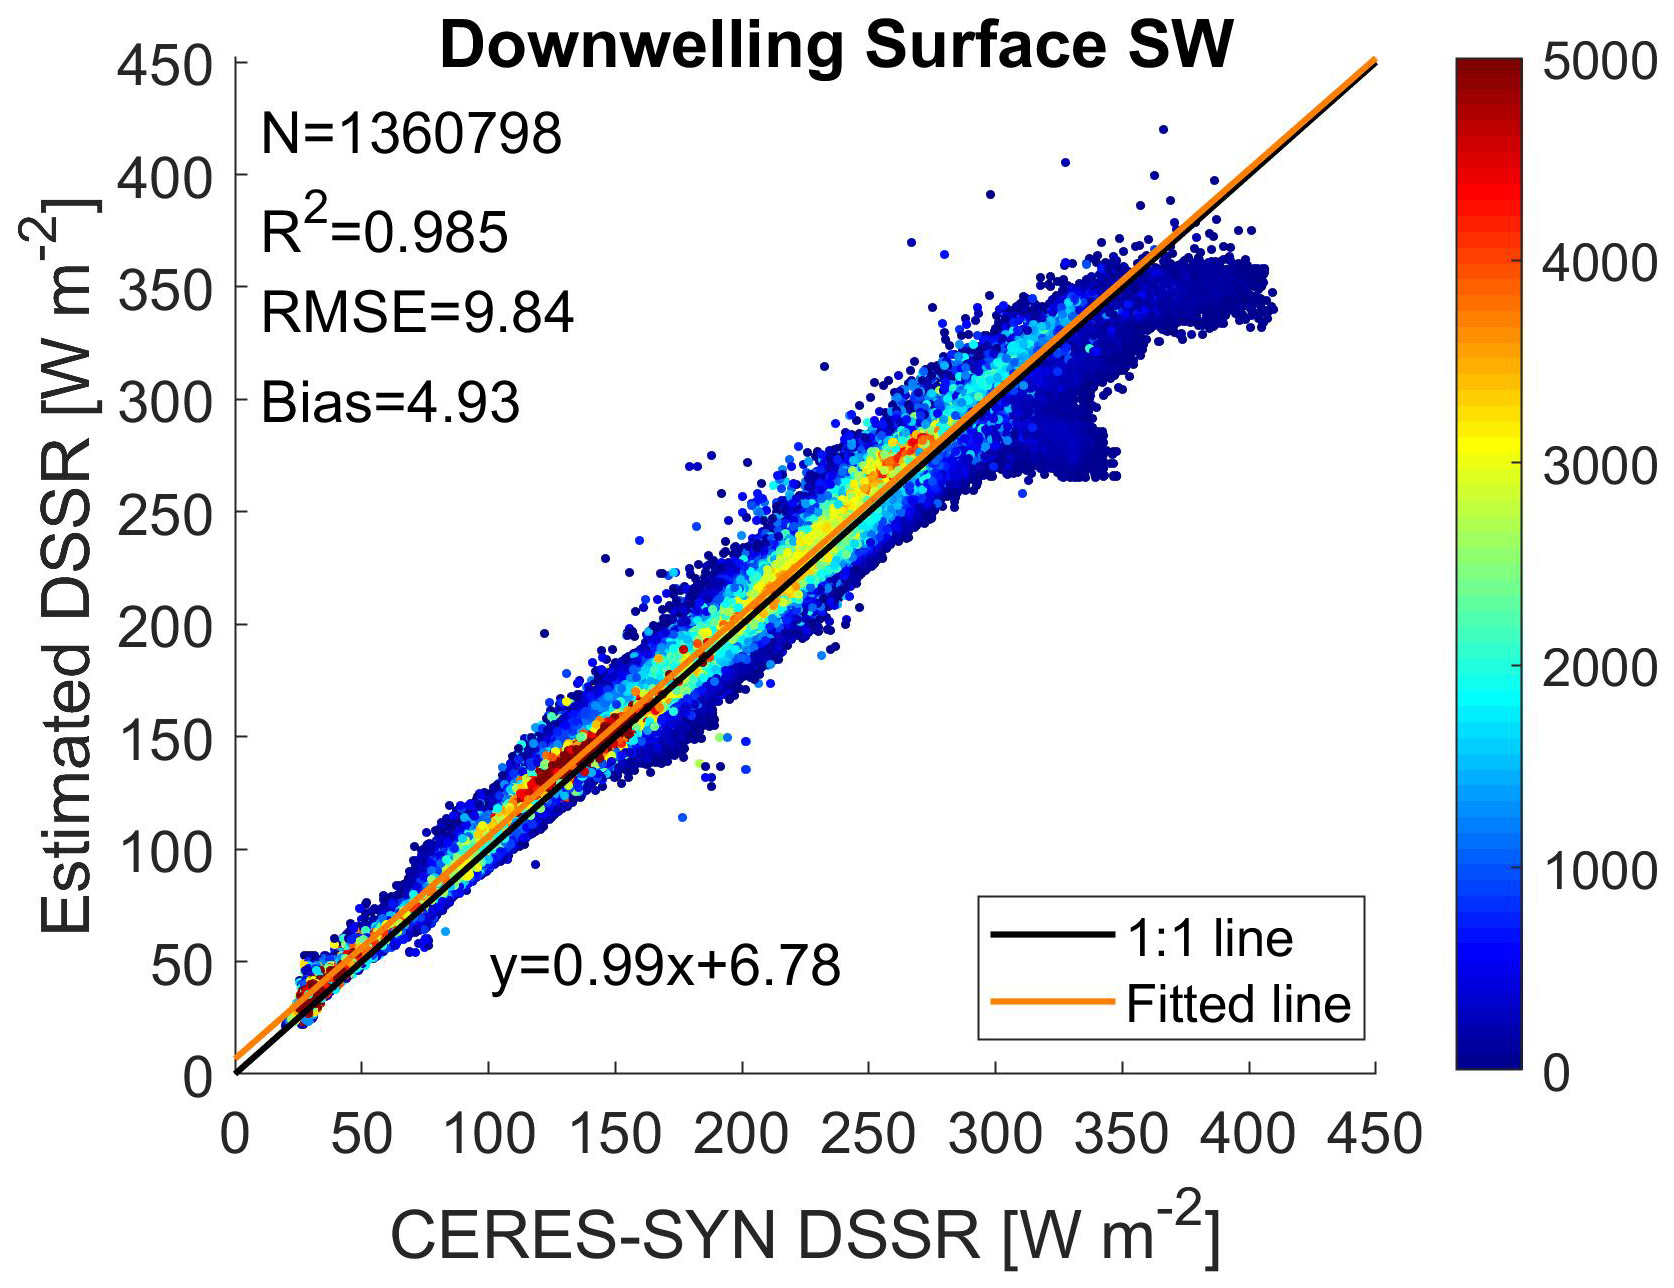
Figure 3Scatterplot comparing the DSSR estimated using the single-layer cloud radiative transfer model with the CERES SYN1deg DSSR dataset.
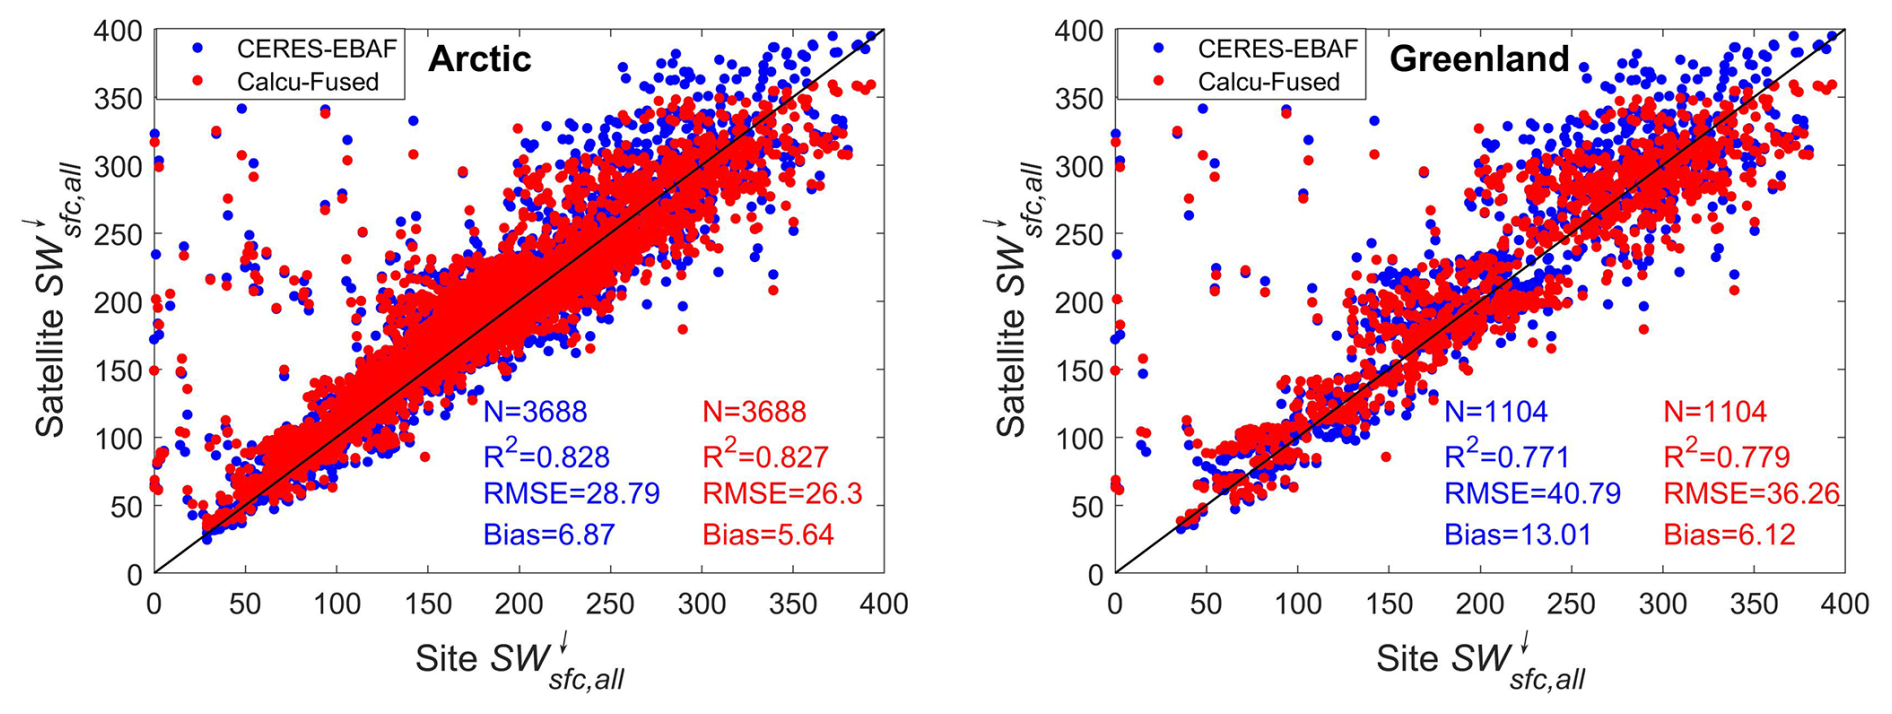
Figure 4Scatterplot comparing the estimated DSSR, the CERES EBAF DSSR, and ground observations.
Using more accurate CF information, we corrected the bias in the CERES DSSR data. Ground station observations are often considered to be effective data for validating the accuracy of satellite radiative parameter retrievals (Chen et al., 2020). We compared the estimated DSSR with the CERES EBAF DSSR and conducted a quantitative evaluation using monthly mean DSSR observations from 66 Arctic ground stations. The R2, RMSE, and bias were used as evaluation metrics. Figure 4 shows scatterplots comparing the estimated DSSR with the CERES EBAF DSSR and ground observations. In Fig. 4, each point represents a monthly mean DSSR in a 1° × 1° grid bin. The plot shows that our estimated DSSR is more consistent with the ground observations compared to the CERES EBAF data. Specifically, for the entire Arctic region, the data of the scatterplot of the estimated DSSR versus ground observations (red) have an R2 value similar to that of the CERES EBAF versus ground observations (blue). However, the RMSE of the estimated DSSR is 26.3 W m−2, which is approximately 2.5 W m−2 lower than the value of 28.79 W m−2 for the CERES EBAF data, which is an improvement of 8.7 %. The bias between the estimated DSSR and ground observations is also reduced by 1.23 W m−2 compared to that of the CERES EBAF data. This indicates that, when using ground observations as a reference, our estimated DSSR generally has smaller deviations and a better stability. When focusing on GrIS, the R2 value of our estimated DSSR is slightly higher than that of the CERES EBAF data, i.e., by 0.008, but the reductions in the RMSE and bias are more significant, i.e., 4.53 and 6.89 W m−2, respectively. This means the estimate accuracy improved by about 11.1 %. English et al. (2015) and Christensen et al. (2016) found that the CERES EBAF DSSR dataset overestimates the DSSR by approximately 8.86 to 13 W m−2 in the Arctic. The corrected DSSR values obtained in this study significantly improve this overestimation, with more notable improvements in the GrIS.
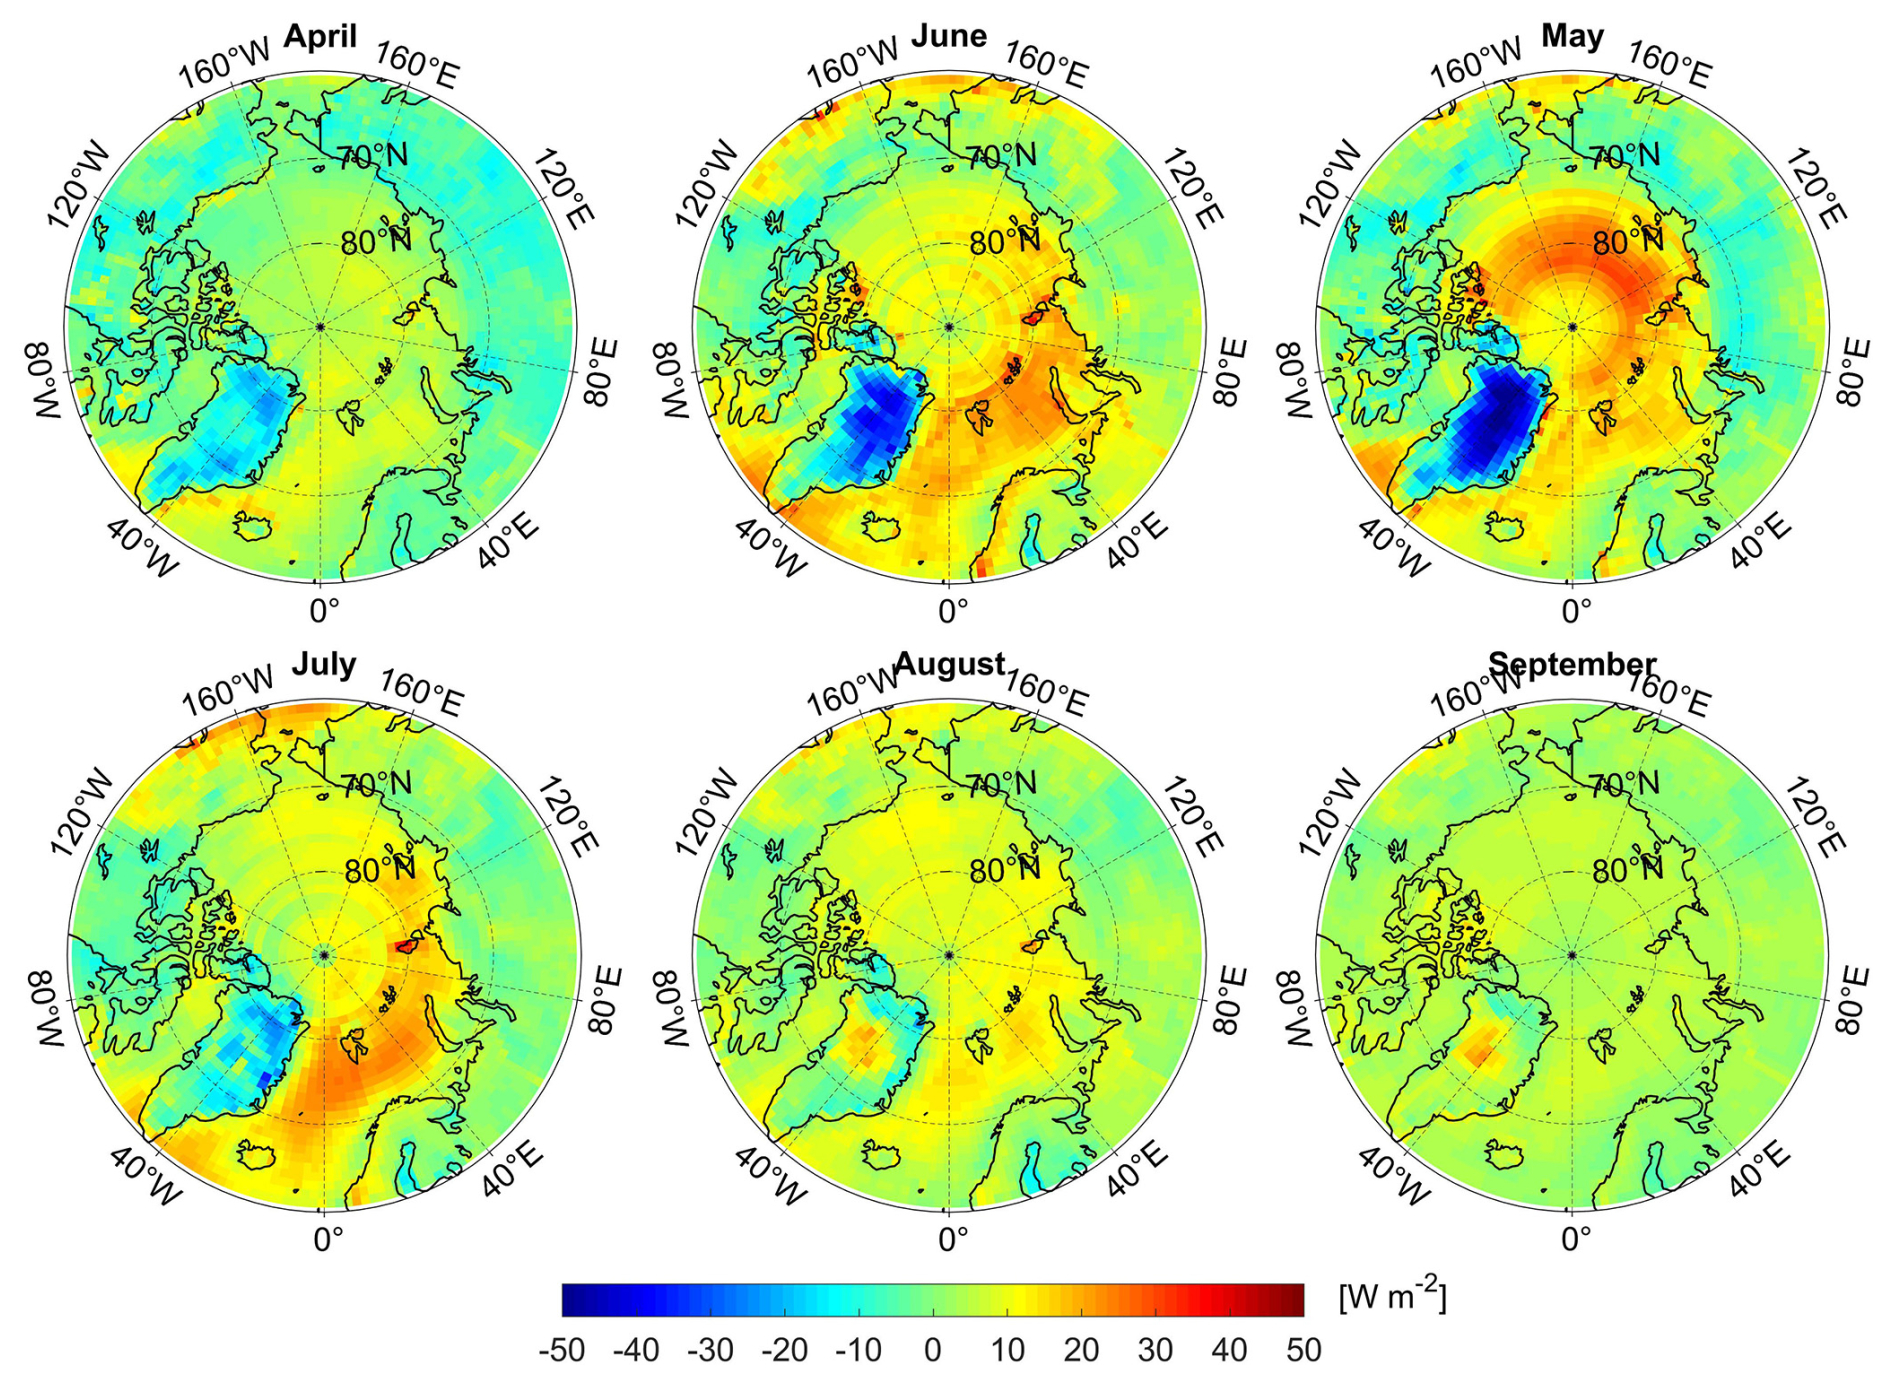
Figure 5Spatiotemporal distribution of the difference between the estimated DSSR and the CERES EBAF DSSR.
To further analyze the differences between the estimated DSSR and the CERES EBAF DSSR, we conducted spatiotemporal difference analysis of the two datasets (Fig. 5). Temporally, we observed that the estimated DSSR and the CERES EBAF DSSR exhibit a high degree of consistency in terms of their trends and magnitudes. Specifically, the maximum area-weighted average DSSR in the Arctic region occurred in June, with a value of approximately 250 W m−2, while the minimum occurred in September, with a value of approximately 78 W m−2. Further analysis revealed that, during the spring (April–June), our estimated DSSR values are generally lower than the CERES EBAF observations, and the largest underestimation occurred in April, i.e., approximately 13 W m−2. However, from late summer to autumn (July–September), the estimated DSSR was slightly higher than the EBAF DSSR, and the maximum overestimation occurred in August, with a value of approximately 5 W m−2. Spatially, the bias between the estimated DSSR and the CERES EBAF DSSR exhibits significant variation across the different geographic locations. In land areas, particularly along the land–sea boundaries and in certain regions of Greenland, our estimated DSSR exhibits notable underestimation, with biases exceeding 10 W m−2 from April to July. Conversely, in the oceanic regions, especially the open sea, our estimated DSSR is slightly higher than the CERES EBAF DSSR.
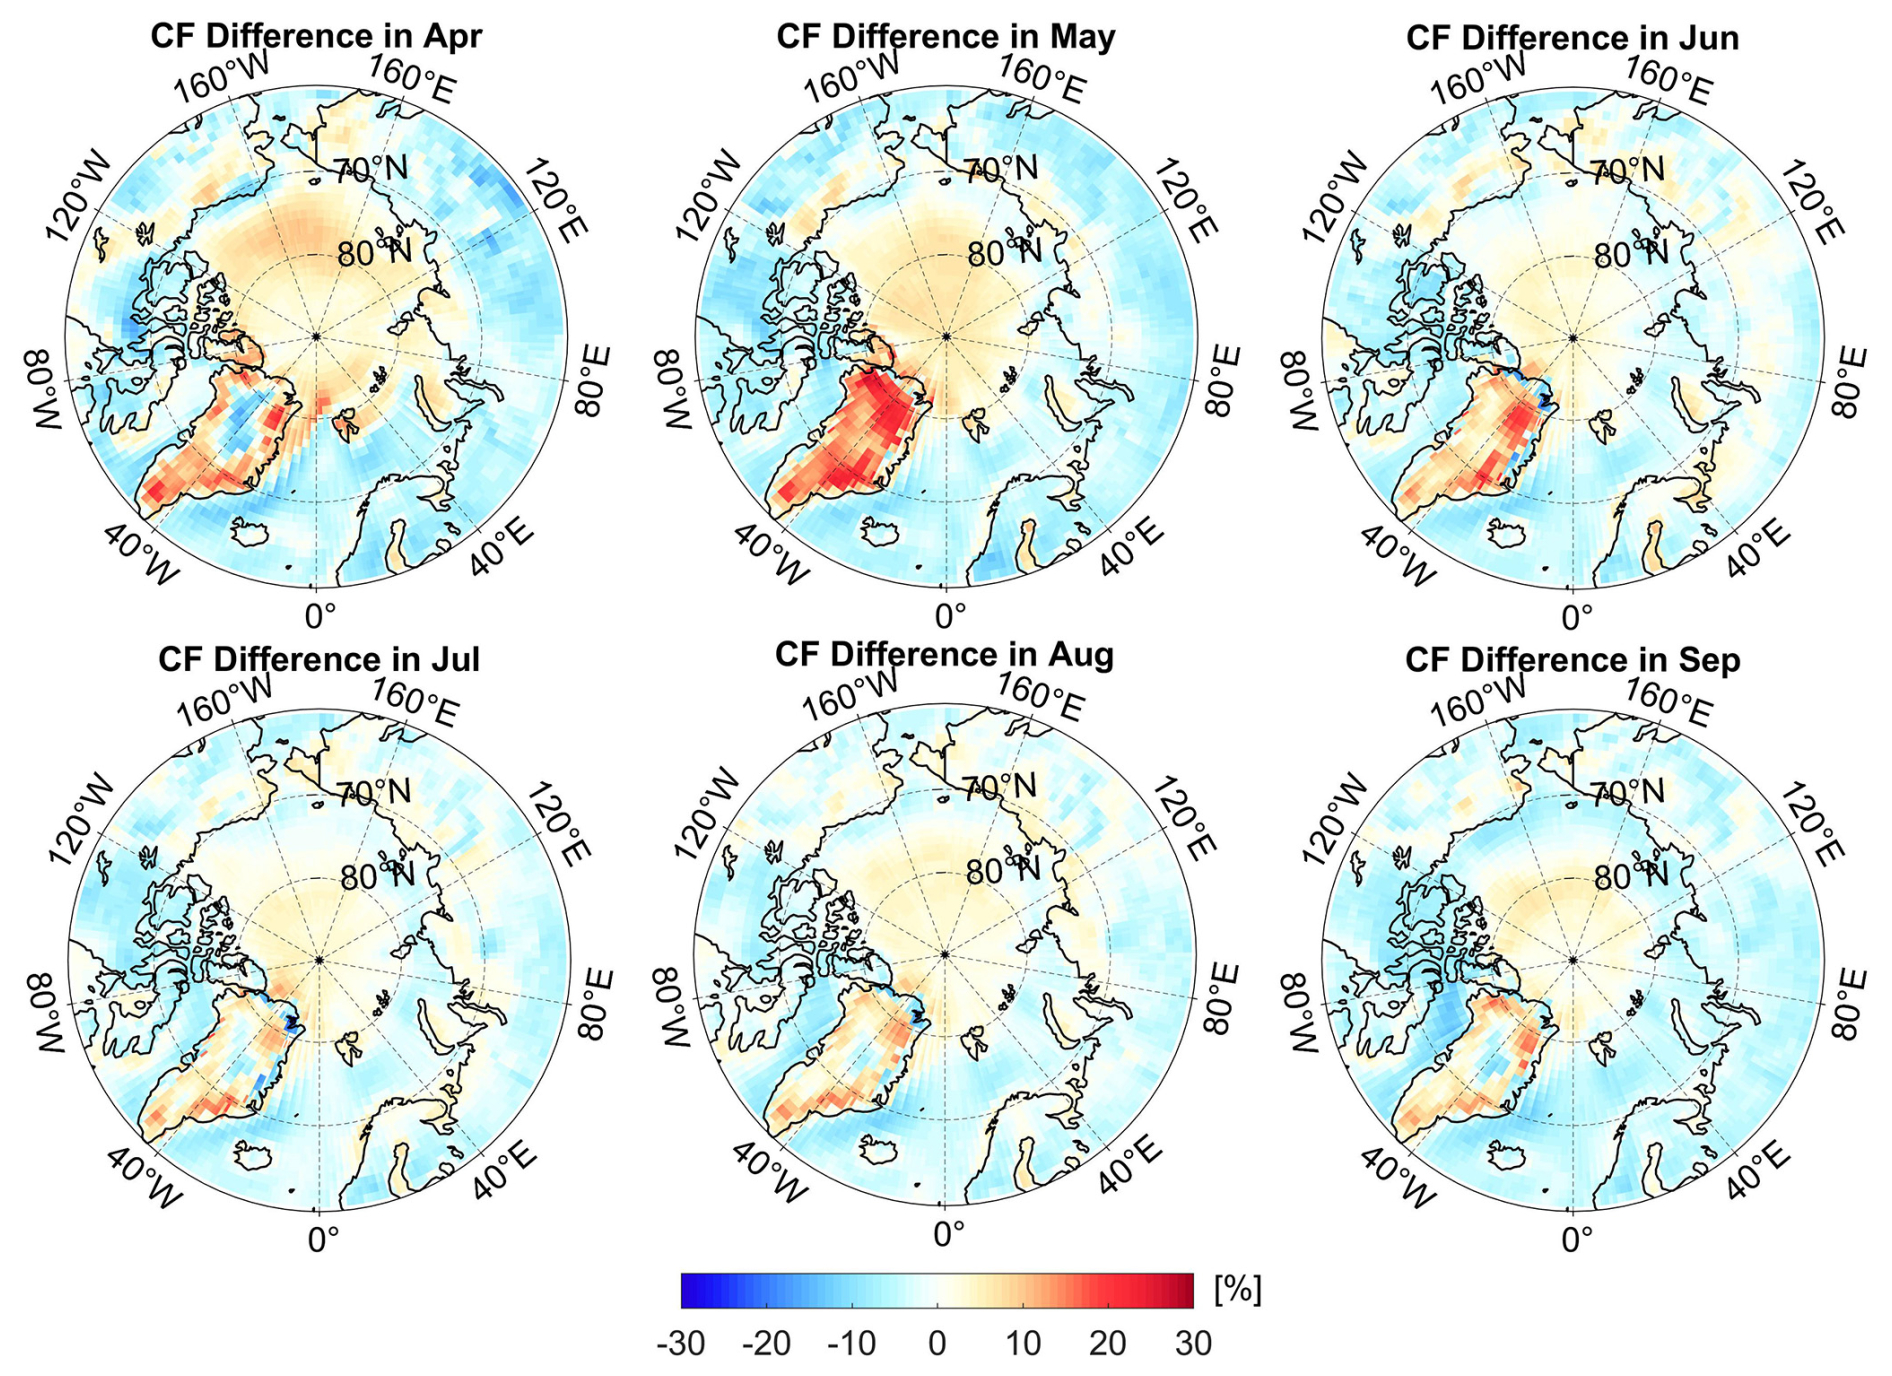
Figure 6Spatiotemporal distribution of the difference between the fused CF and the CERES SSF CF.
We performed bias attribution analysis using CF data and calculated the spatiotemporal differences between the fused CF dataset and the CERES Single Scanner Footprint (SSF) CF data (Fig. 6). From the CF difference map, we observed that there is a high degree of consistency between the regions of underestimation of our estimated DSSR and the areas where the SSF CF is lower than the fused CF, particularly along land edges and in the GrIS. This suggests that the CERES series data underestimate the CF in these areas, leading to overestimation of the DSSR. However, in the ocean areas that are not perennially covered by sea ice (perennially open waters), the SSF CF is significantly higher than the fused CF (indicated by negative values of the fused CF minus the SSF CF in Fig. 6), suggesting that the CERES DSSR values in these regions are likely to be underestimated. In contrast, in the central Arctic Ocean, the fused CF is notably higher than the SSF CF. Given the negative correlation between the CF and DSSR, the estimated DSSR should be lower in this area, which is contrary to our previous findings. Therefore, when using the estimated DSSR, careful consideration should be given to the results for the central Arctic Ocean.
4.2 Temporal and spatial characteristics of GCF-CRKs
Figure 7 presents the monthly mean GCF-CRK for the surface SW radiation in different months. A positive value, shown in red, corresponds to radiative heating within the system, while a negative value, shown in blue, represents radiative cooling. Notably, all of the grids of the GCF-CRKs in the Arctic are uniformly negative from April to September, but their magnitudes vary spatially and temporally. Temporally, the surface GCF-CRKs exhibit smaller negative values in April, August, and September, with monthly averages of less than −1 W m−2 %−1. Conversely, in May, June, and July, the overall mean values exceed −1.5 W m−2 %−1, indicating that, during these summer months, a 1 % change in the CF contributes more significantly to the cooling effect on the surface shortwave radiation. Spatially, the GCF-CRK values over the oceanic regions are generally lower than those over the land, suggesting that changes in the CF have a greater radiative impact over the land. The most substantial negative values are located over Greenland, particularly in the northern region during May, where the kernel exceeds −2.5 W m−2 %−1. This is associated with intense cyclonic activity in the area.
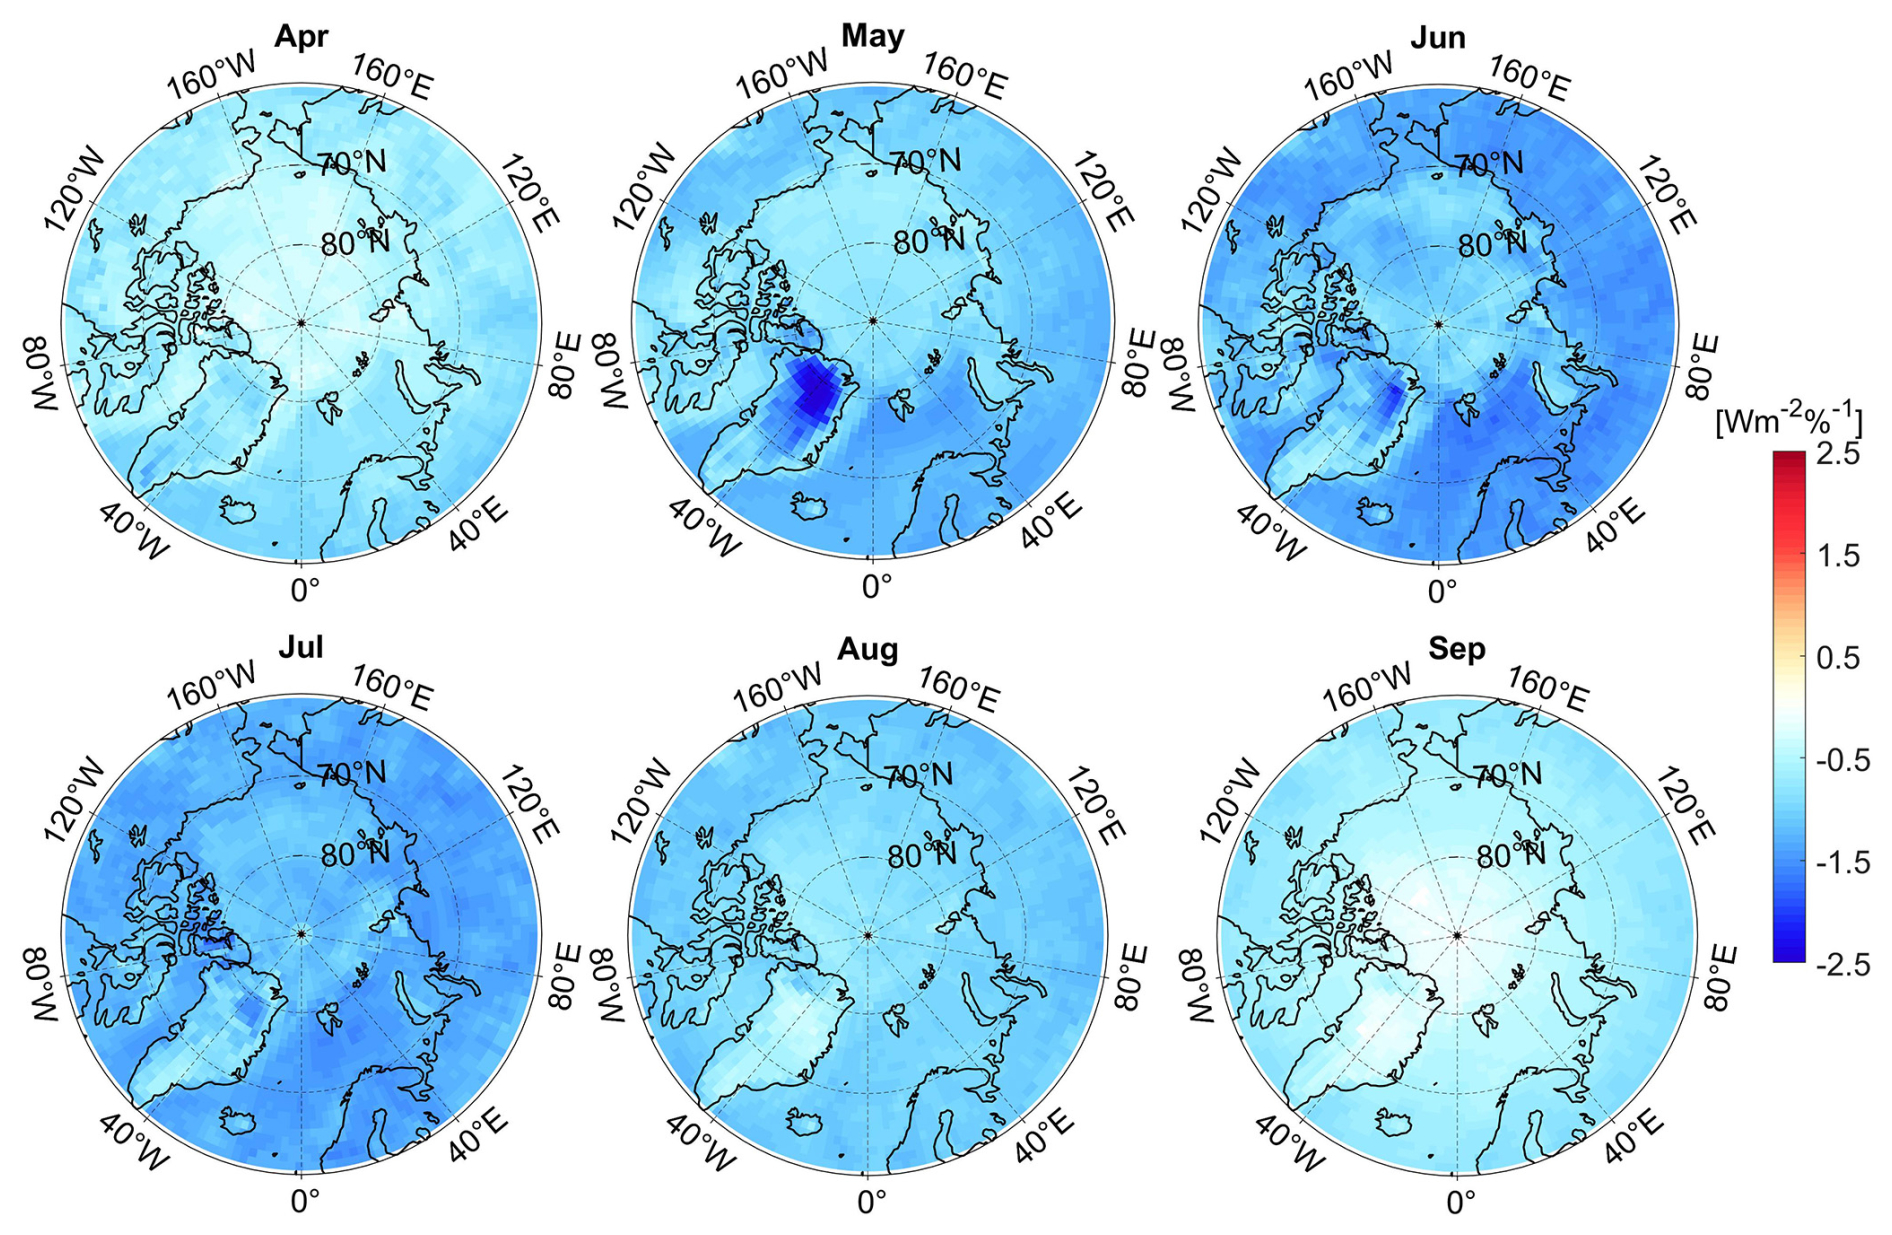
Figure 7Monthly mean GCF-CRKs from April to September.
Over the time series, the GCF-CRK displays a clear temporal pattern, with its absolute value increasing from April to June, peaking in June at −1.3 W m−2 %−1, followed by a decline toward September (Fig. 8). However, the uncertainty is also highest during this season, mainly due to the increased solar radiation at lower latitudes of the Arctic during summer, while higher latitudes still receive relatively low incoming radiation. Additionally, parameters such as CF, TAU, and cloud top pressure (CTP) exhibit significant spatial heterogeneity, leading to considerable spatial variability in the radiative kernel.
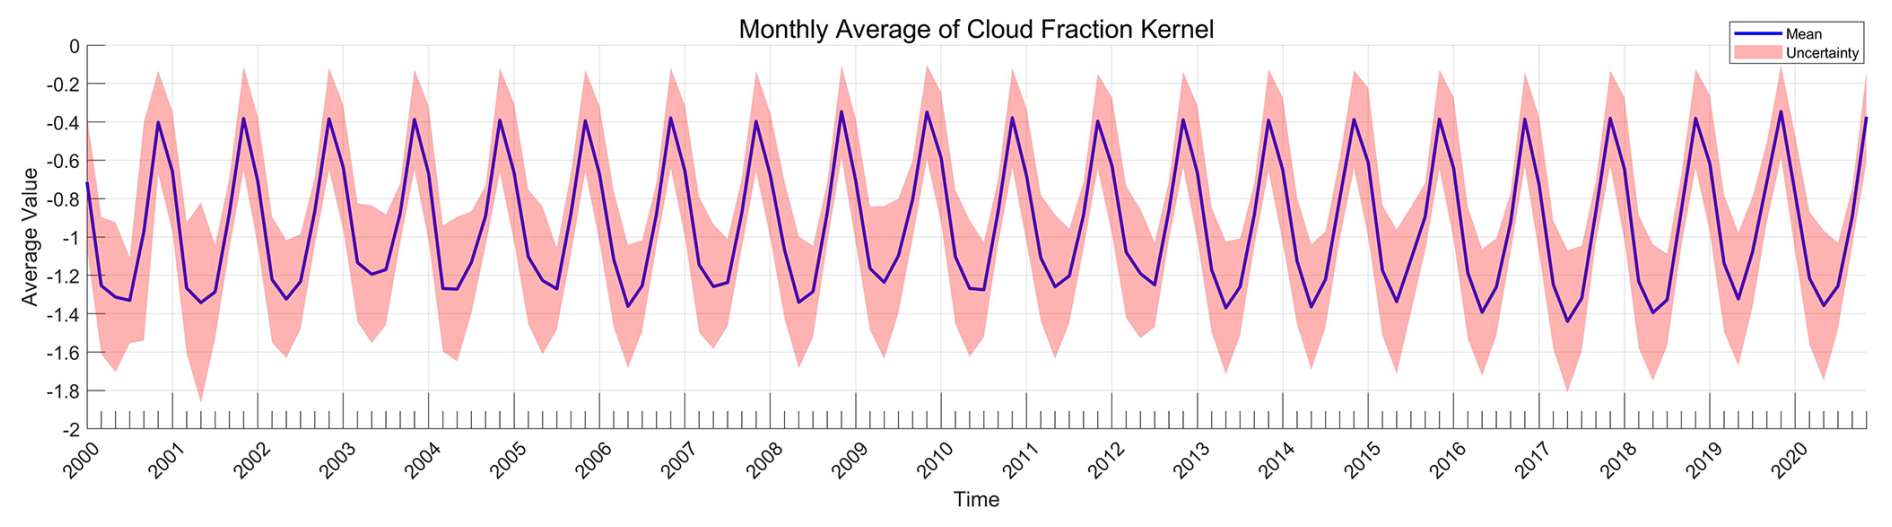
Figure 8The monthly average of grid-based surface cloud radiative kernels (GCF-CRKs).
By September, the cloud radiative kernel diminishes to approximately −0.4 W m−2 %−1. This reduction is due to the substantial decrease in the incoming solar radiation, which in turn, lessens the absolute impact of the changes in the cloud parameters. Nevertheless, throughout the time series, there is a noticeable trend of increasing absolute GCF-CRK, particularly during the summer months, with a growth rate of approximately 0.03 W m−2 %−1 per decade. This indicates that the influence of the CF on the surface shortwave radiation is gradually increasing.
Table 1Temporal and spatial correlation coefficients between the cloud parameters and the surface GCF-CRKs (the absolute values are used for clarity).
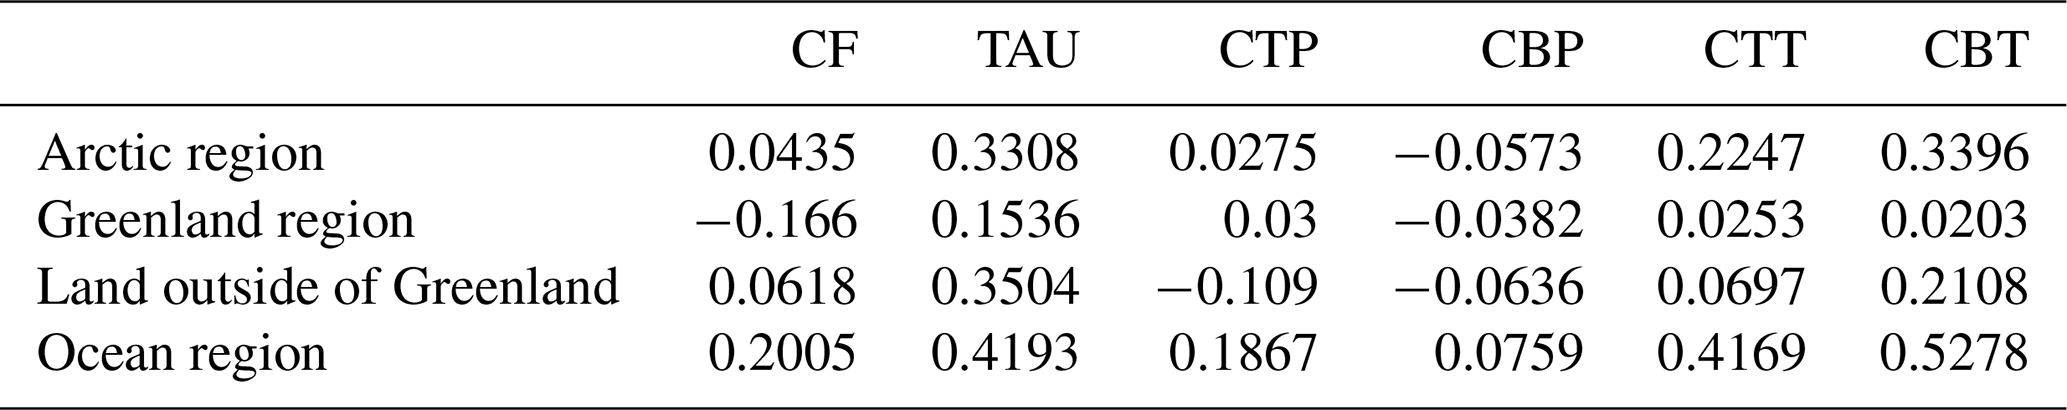
The magnitude of the GCF-CRKs primarily depends on the intensity of the incoming SW radiation at the TOA that is reflected, absorbed, and/or scattered by clouds. To further understand the factors influencing the changes in the surface SW radiation GCF-CRKs, we analyzed the temporal and spatial correlation coefficients between the GCF-CRKs and cloud parameters, such as the CF, TAU, cloud top and cloud bottom pressure (CTP and CBP), and cloud top and cloud bottom temperature (CTT and CBT). These coefficients measure the strength and direction of the linear relationship between the cloud parameters and the kernels (Table 1).
Table 1 reveals the occurrence of significant temporal and spatial variabilities in terms of how the different cloud parameters impact the surface GCF-CRKs. Across the entire Arctic region, the CBT plays a dominant role in influencing the kernels. From April to September, the CBT initially increases and then decreases, mirroring the trend of the absolute value of the surface GCF-CRKs. This correlation is particularly strong in the oceanic regions, with a coefficient of 0.5278, which is significantly higher than the correlations with the other cloud parameters (Fig. A6 in the Appendix). This suggests that the magnitude of the surface GCF-CRKs decreases slightly with increasing height. The positive correlation between the kernels and CTP further supports this conclusion, indicating that, as the height increases and the CTP decreases, the magnitude of the surface GCF-CRKs also decreases. This is because less of the SW radiation flux reaches the surface due to minimal atmospheric absorption in the cloud-free layers below the clouds.
The next most influential cloud parameter for the surface GCF-CRKs is the TAU as thicker clouds scatter more solar radiation back into space. Over the land, the TAU's influence is predominant among all of the cloud parameters, with a correlation of 0.35, which is particularly noticeable in parts of North America and Asia, while there is a slight negative correlation in northern Europe (Fig. A2). In the oceanic regions, this positive correlation is also evident as the range and timing of the changes in the surface GCF-CRK absolute value closely match those of the TAU.
In Greenland, the surface GCF-CRKs are influenced by both the CF and TAU. Specifically, in the northern region of the GrIS during May, June, and July, when the TAU is higher, the surface GCF-CRK absolute value is larger in areas with lower CFs, exceeding −2 W m−2 %−1. In months with lower TAUs, the CF increases slightly , and the corresponding surface GCF-CRK absolute value decreases. This indicates the occurrence of positive correlations between the TAU and CTP and the surface GCF-CRKs and a significant negative correlation between the CF and the surface GCF-CRKs. Additionally, the changes in the CBT exhibit a significant correlation with the surface GCF-CRKs in the oceanic regions.
4.3 Comparison with other surface SW radiative kernels
As discussed previously, most published CRK datasets are focused on the TOA. To meaningfully evaluate our proposed surface CRKs, we need a surface CRK dataset that covers the Arctic region from April to September for direct comparison. There is only a very limited number of such datasets that satisfy the requirement, and we have found only two other qualified surface CRK datasets: the International Satellite Cloud Climatology Project H dataset CRK (ISCCP-FH CRK) (Zhang et al., 2021) and the surface CTP and CBP CRK provided by Zhou et al. (2022) (Zhou-CTP/CBP CRK).
In their CRK calculation, the ISCCP-H data are used to produce radiative profile fluxes in 49 individual types of clouds for SW radiation, longwave (LW) radiation, their sum, and their net value at both the TOA and the surface (SFC). The product only utilizes daytime observations, and the cloud types are demarcated by seven cloud optical depths and seven cloud effective pressure layer bins. The difference between the overcast and clear-sky fluxes is the overcast cloud radiative effect, and when it is divided by 100, it becomes the CRK (in W m−2 %−1). Both the TOA and SFC CRKs are directly calculated at a 3 h resolution on a 110 km equal-area map for 2007, as shown by the 49-bin histogram with the specified TAU, CTP, and cloud amount. For the majority of uses relating to general circulation models (GCMs), the SFC kernel data are averaged to the monthly (and annual) mean values and regridded to a 2.0° latitude × 2.5° longitude equal-angle map. This ISCCP-FH cloud radiative kernel dataset can be downloaded from https://doi.org/10.5281/zenodo.4677580 (Zhang, 2021).
The surface Zhou-CBP CRKs were constructed using the rapid radiative transfer model (RRTM). The standard version of the surface CRKs is a function of the latitude, longitude, month, TAU, and CBP, and the TOA CRKs depend on the latitude, longitude, month, TAU, and CTP. Considering the fact that, at present, the cloud property histograms created using the climate models are functions of the CTP rather than the CBP, the surface CRKs in the CBP–TAU histograms were converted to CTP–TAU fields using the statistical relationship between the CTP, CBP, and TAU derived from collocated CloudSat and MODIS observations. These CRKs also contain seven TAU bin and seven CTP bin cloud fraction histograms, which are divided according to Zelinka et al. (2012)'s cloud layer classification. Additionally, they considered the ice and liquid clouds separately so that there are a total of 7 × 7 × 2 types of clouds for each latitude, longitude, and month of the year. Furthermore, the Zhou-CTP/CBP CRKs have been evaluated using independent data sources, and they have a unique advantage in reproducing the climatology and anomalies of cloud radiative effects. These CRKs are available online from Zenodo (DOI: https://doi.org/10.5281/zenodo.5176193, Zhou, 2021).
Since our calculated kernels are based on grid-level data for all of the cloud layers, to compare our GCF-CRKs with the ISCCP-FH CRKs and Zhou-CTP/CBP CRKs on a common basis, the two comparison CRKs were mapped on 2-D global maps using the total TAU and CTP in the Arctic. Our calculated CRKs were then resampled to match the spatial resolution of the 2-D ISCCP-FH and Zhou-CTP/CBP CRKs. The resulting analysis involved a total of 12 960 grid cells on a 2.0° latitude × 2.5° longitude equal-angle map from April to September. To minimize the uncertainties introduced by the other cloud parameters in the CF kernel, the TAU and CTP values used were consistent with those from the CERES SYN1deg dataset used in this study.
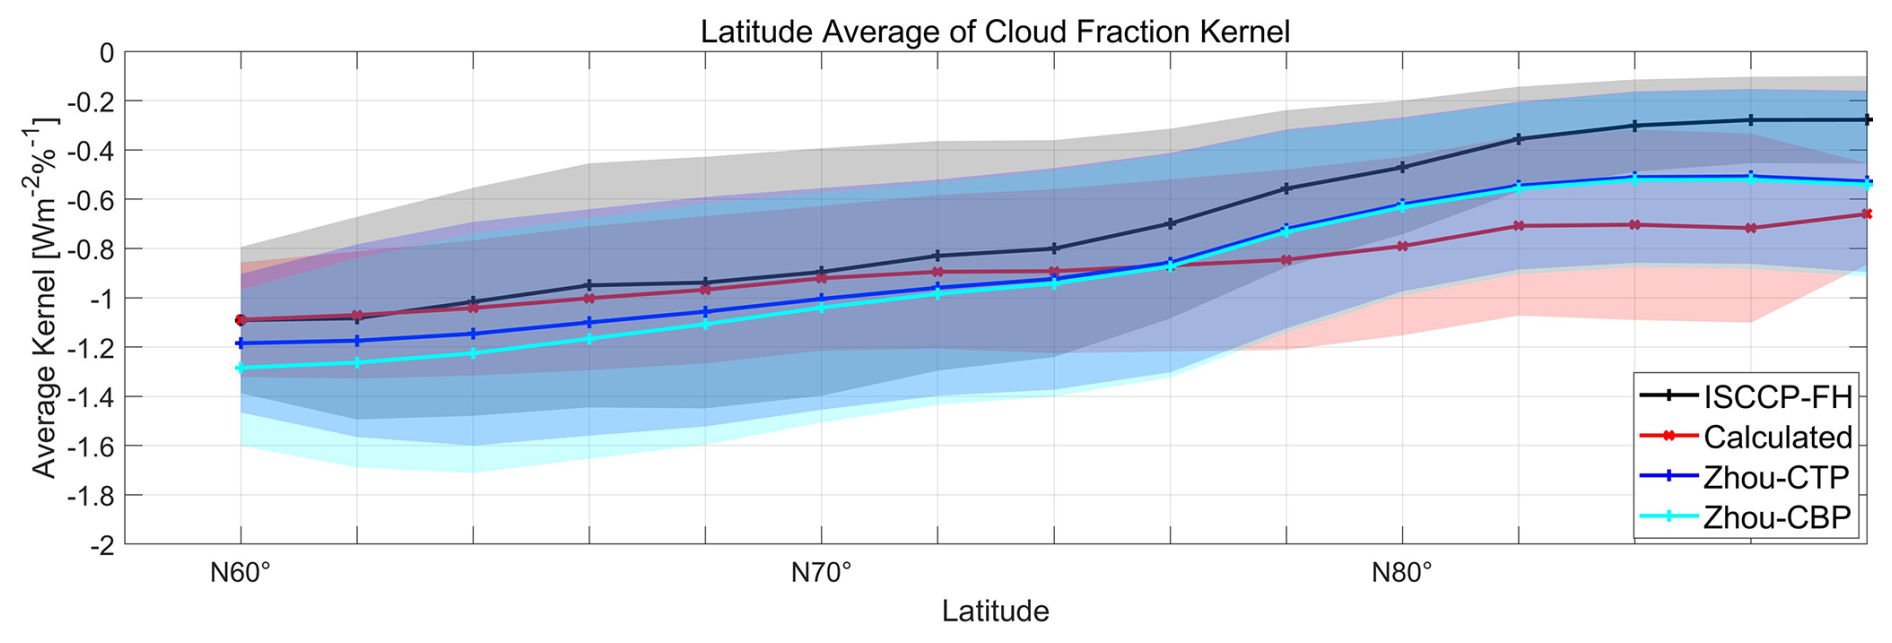
Figure 9Comparison of latitudinal weighted means for the ISCCP-FH CRKs, the Zhou-CTP/CBP CRKs, and our GCF-CRKs.
Figure 9 shows the latitudinally weighted means of the ISCCP-FH CRKs, the Zhou-CTP/CBP CRKs, and the GCF-CRKs we calculated in this study. As can be seen from Fig. 9, the latitudinal means of all three CRKs are negative, they exhibit similar trends, and the magnitude of the kernels becomes less negative from low to high latitudes. This indicates that the contribution of the clouds to the surface shortwave radiation decreases with increasing latitude. This trend is primarily due to the reduction in the solar shortwave radiation at higher latitudes and the presence of high-altitude ice clouds, which tend to trap energy, causing a warming effect that reduces the cooling impact of clouds on the surface (IPCC, 2021).
In terms of the kernel's magnitude, the SFC GCF-CRKs range from −1.09 to −0.66 W m−2 %−1, i.e., a decrease of 0.43 W m−2 %−1. The ISCCP-FH SFC CRKs vary from −1.09 to −0.29 W m−2 %−1, i.e., a change in magnitude of approximately 0.81 W m−2 %−1. The Zhou-CTP CRKs range from −1.18 to −0.53 W m−2 %−1, i.e., a decrease of 0.65 W m−2 %−1. The Zhou-CBP CRKs exhibit a larger change of 0.74 W m−2 %−1, particularly in the low-latitude regions where the Zhou-CBP CRKs have more negative values.
However, when considering the latitude-weighted mean across the Arctic, our calculated kernels closely match the ISCCP-FH SFC CRKs at lower latitudes (< 72° N), with a nearly zero difference. This region is predominantly land, characterized by low CFs and minimal seasonal variations in the cloud parameters. At higher latitudes (> 72° N), our calculated kernel resembles the Zhou-CTP CRKs, and the difference between them increases with increasing latitude, reaching a maximum of 0.21 W m−2 %−1. At high latitudes, the ISCCP-FH SFC CRKs have a smaller negative magnitude than the Zhou-CTP/CBP CRKs and our GCF-CRKs, and the difference between them and the other two types of kernels increases with increasing latitude, ranging from approximately 0.1 to 0.44 W m−2 %−1. This difference is particularly notable in regions such as the sea ice melt zones, perennial open waters, and the GrIS, where the spatial and temporal variations in the terrain and climate lead to significant CRK discrepancies. We also analyzed the temporal uncertainties of the different CRKs. In lower-latitude regions, our estimated kernels exhibit the least temporal uncertainty, while, in the high-latitude sea ice regions, the temporal uncertainty of our kernels is similar to those of the other types of CRKs. This is largely due to the significant seasonal variations in the kernels.
The vertical structure of clouds plays a crucial role in radiative processes. Both the ISCCP-FH SFC CRKs and the Zhou-CTP/CBP CRKs consider the radiative properties of the different cloud layers in their construction. To better compare the vertical performances of the various SFC CRKs, we stratified the gridded cloud properties into four pressure layers (surface to 700, 700–500, 500–300, and 300–50 hPa, representing low, middle–low, middle–high, and high clouds, respectively) based on the CERES SYN1deg stratification standard.
Figure 7 shows that, for the different cloud layers, all three SFC CRKs display similar trends with latitude, and the magnitude of the latitude-weighted mean decreases with increasing latitude (negative values). The GCF-CRKs exhibit little sensitivity to changes in the cloud layer height as we used the monthly climatological averages for each cloud layer in our calculations, which are relatively stable over time. However, the ISCCP-FH SFC CRKs and the Zhou-CTP/CBP CRKs exhibit some fluctuations with the cloud layer height. The ISCCP-FH SFC CRKs change by approximately 0.25 W m−2 %−1, while the Zhou-CTP/CBP CRKs change by 0.51 W m−2 %−1. This variation is not monotonic. For example, when the cloud level rises from the low layer to the middle–low layer, the negative magnitude of the Zhou-CTP/CBP CRKs increases, while it decreases when the cloud height increases continually from the middle–low layer to the middle–high layer, returning to a magnitude similar to that of the low clouds. Therefore, compared to the latitudinal changes, the cloud layer variations have a small impact on the radiative kernel estimation.
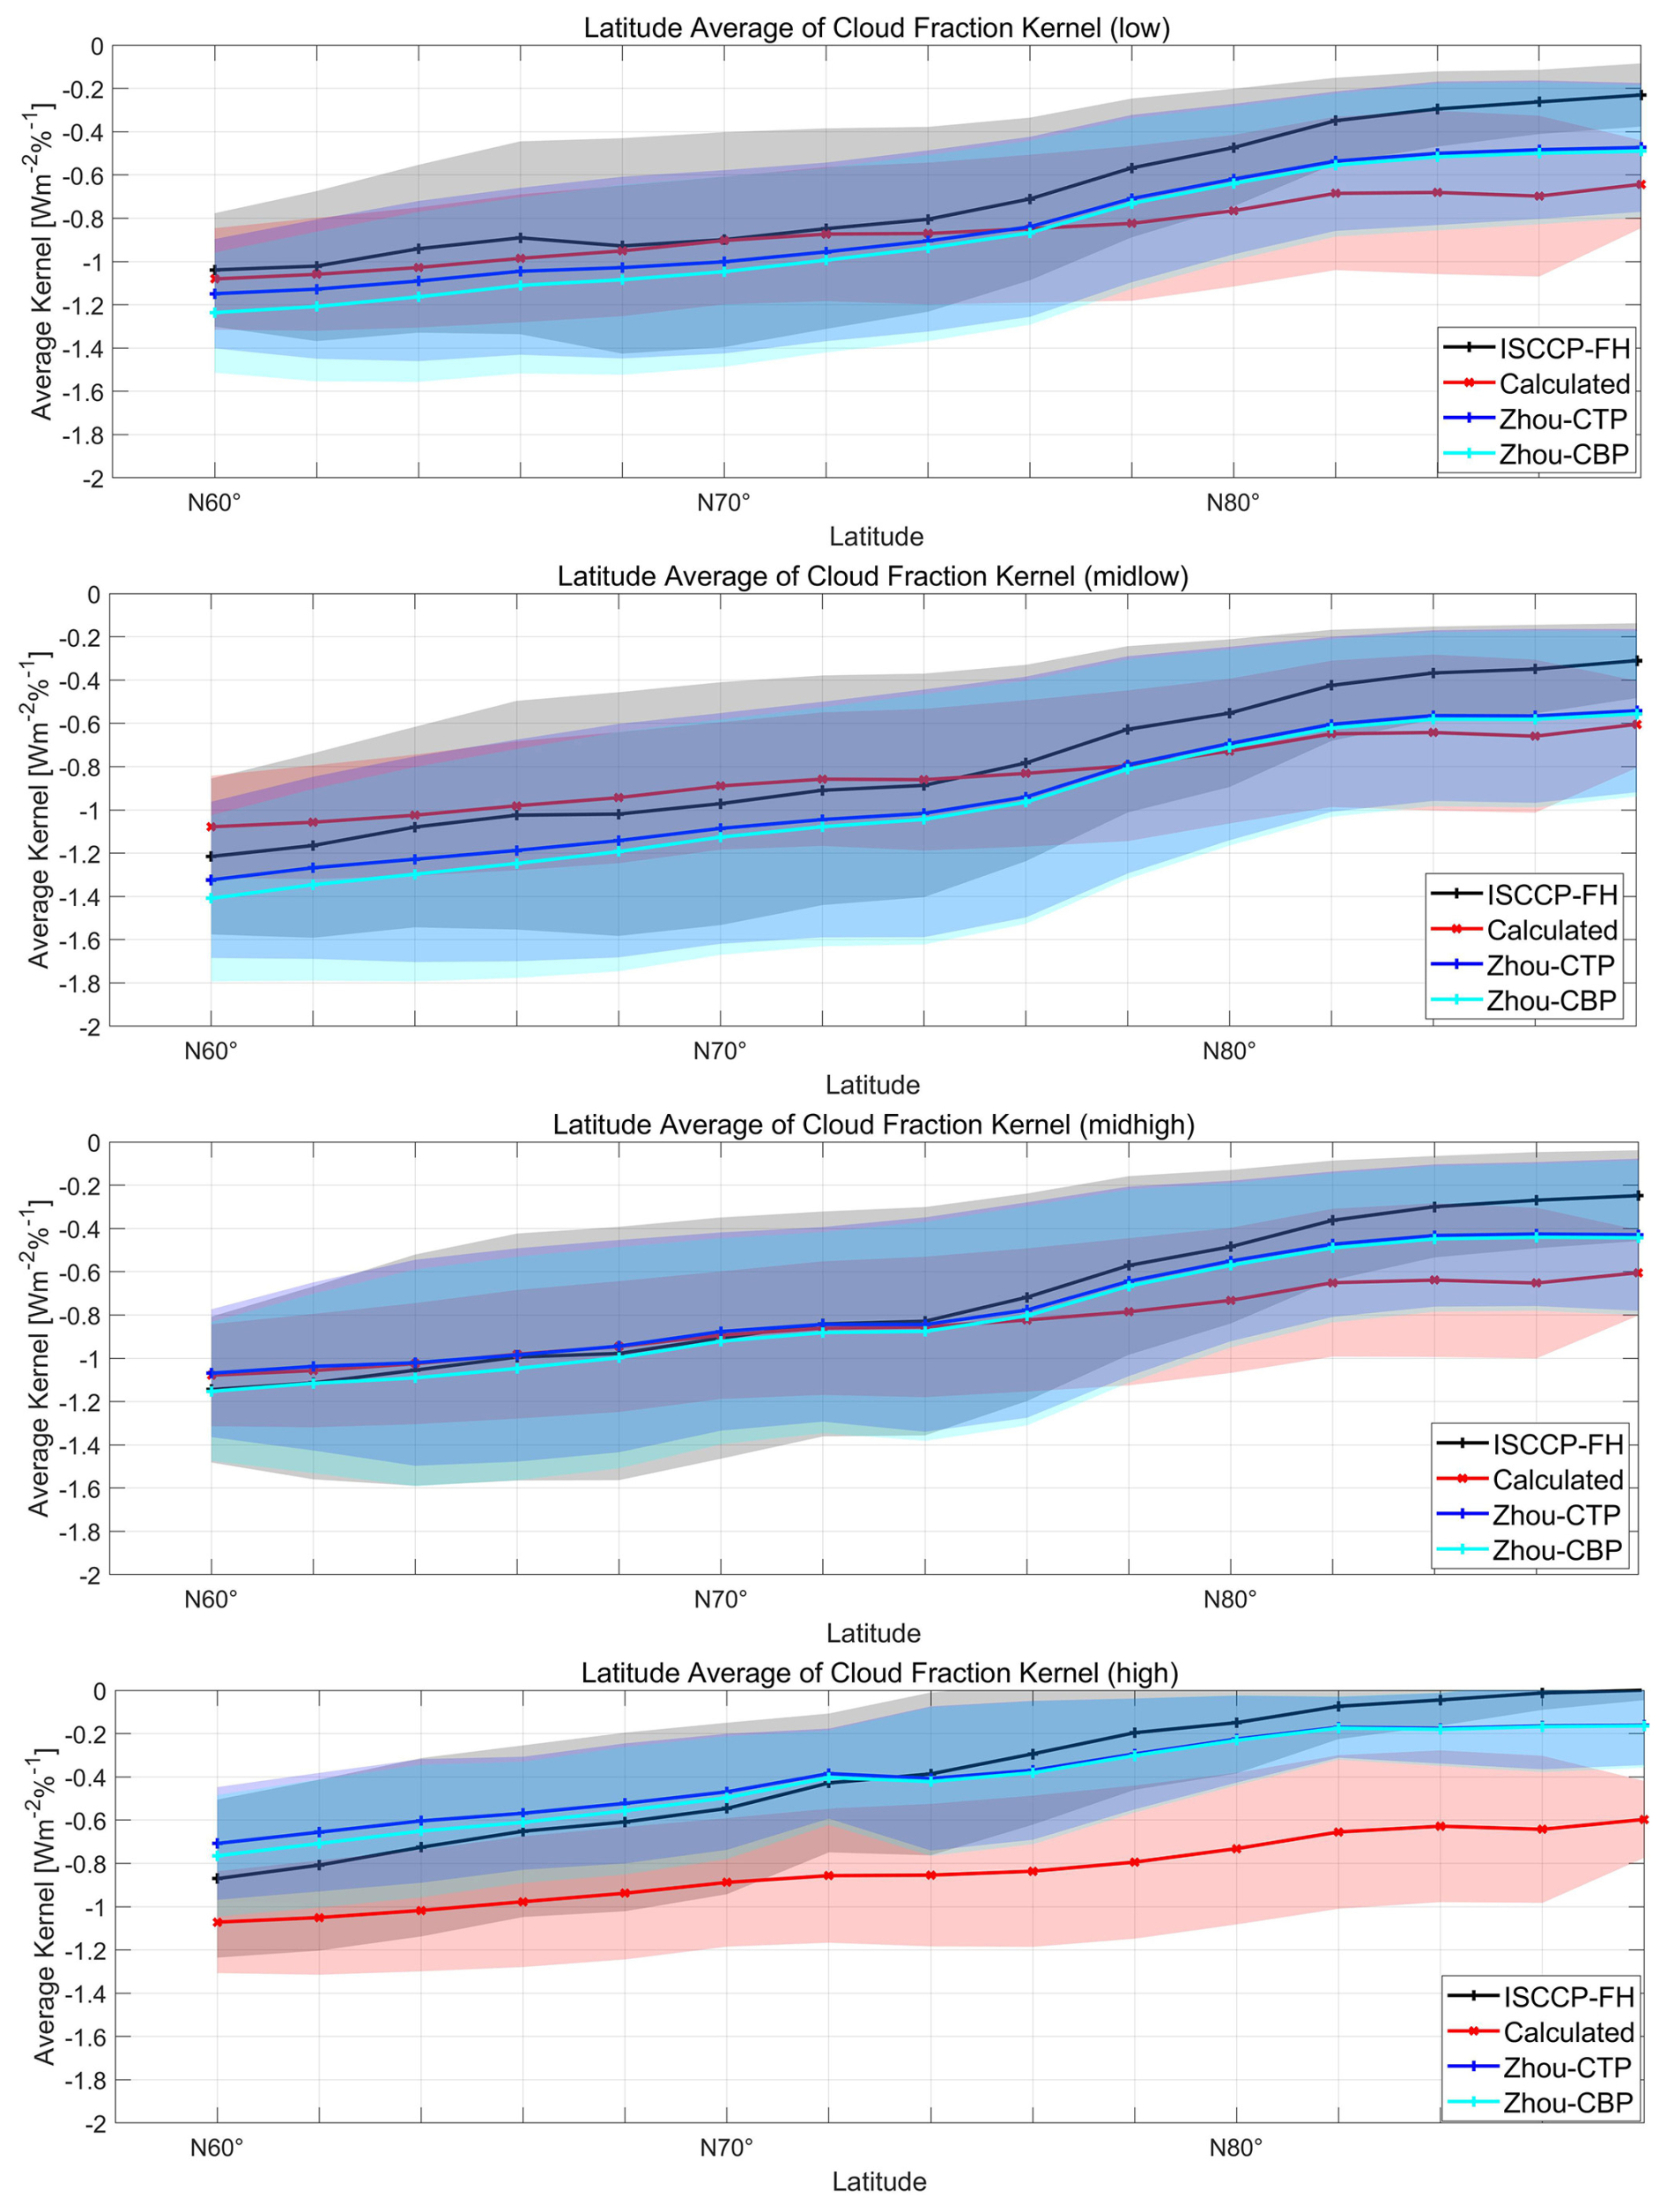
Figure 10Comparison of latitudinally weighted means for the ISCCP-FH CRKs, the Zhou-CTP/CBP CRKs, and the GCF-CRKs in the different cloud layers.
We observed an intriguing phenomenon: the similarity between the ISCCP-FH SFC CRKs, the Zhou-CTP/CBP CRKs, and our GCF-CRKs varies across the different cloud layers (Fig. 10). For example, in the low-level clouds, when the latitude is below 75° N, the ISCCP-FH SFC CRKs align closely with our GCF-CRKs, while the Zhou-CTP/CBP CRKs deviate by approximately 0.05–0.12 W m−2 %−1. For the middle–low-level clouds, the ISCCP-FH SFC CRKs are only slightly different from our GCF-CRKs in the low-latitude regions, whereas the discrepancies between our kernels and the Zhou-estimated kernels are 0.1–0.2 W m−2 %−1. However, at higher latitudes (> 78° N), the difference between our calculated kernels and the Zhou-CTP/CBP CRKs becomes less than 0.01 W m−2 %−1, indicating that, even with a 100 % CF discrepancy, the resulting radiative deviation is approximately 1 W m−2. As the cloud layer continues to rise to the middle–high level, our calculated kernels again closely match the Zhou-CTP CRKs at latitudes below 76° N. These findings suggest that there is significant uncertainty in both the Zhou-CTP/CBP CRKs and the ISCCP-FH SFC CRKs across the different cloud layers.
When examining high-level clouds, the differences between the GCF-CRKs and the other cloud radiative kernels become most pronounced. In the Arctic, the high clouds are predominantly thin cirrus clouds, and the extremely low temperatures and frequent surface inversions increase the error in identifying high cirrus clouds across the different sensors (Liu et al., 2022). The vertical cloud structure in the ISCCP-FH SFC CRKs is based on a combination of rawinsonde climatology and the CloudSat Cloud-Aerosol Lidar and Infrared Pathfinder Satellite Observation (CALIPSO) climatology, while the statistical relationships between the CTP, CBP, and TAU in the Zhou-CTP/CBP CRKs are derived from a collocated MODIS–CloudSat climatology. The CRKs in our study primarily consider the cloud properties from the CERES SYN1deg, which are mainly observed using the MODIS sensor. The observational characteristics of these sensors contribute to the estimation errors of radiative kernels. However, it is important to note that the Arctic is dominated by low clouds, which account for 50 %–60 % of the total cloud cover, while high clouds account for only approximately 3 %. Therefore, the impact of high clouds on the overall cloud radiative kernels is relatively small.
The differences between the ISCCP-FH SFC CRKs, the Zhou-CTP/CBP CRKs, and our GCF-CRKs exhibit significant spatiotemporal heterogeneity. In the sea ice regions, the GCF-CRKs have a larger magnitude than the other kernels (with negative differences), whereas the opposite is true for the land and perennial open-water regions. However, Greenland is an exception where our results indicate that the CF has a more pronounced cooling effect on the surface shortwave radiation. This can be attributed to Greenland's year-round ice and snow cover, high altitudes, extreme dryness and cold, strong near-surface static stability, and persistent low-level inversion layers, which prolong the cloud duration and thus have a greater impact on the DSSR. Temporally, during the months of April and September, when the solar insolation is relatively low, the differences between these radiative kernels are smaller. However, during the months with higher solar insolation, the ISCCP-FH SFC CRKs and the Zhou-CTP/CBP CRKs have larger magnitudes than our calculated CRKs, with differences ranging from 0.3 to 0.5 W m−2 %−1 (positive values).
In summary, the overall trend shows that the ISCCP-FH SFC CRKs and the Zhou-CTP/CBP CRKs have latitudinal variation patterns similar to those of our calculated CRKs in the Arctic region, and the differences between the various radiative kernels are much smaller than the latitudinal differences within each CRK dataset. This demonstrates that latitude is a key factor influencing the surface cloud radiative kernels. From a spatiotemporal distribution perspective, our calculated CRKs are generally less negative than the ISCCP-FH SFC CRKs and the Zhou-CTP/CBP CRKs in the land regions and more negative in the ocean regions. However, in Greenland, GCF-CRKs consistently have the largest magnitude (in negative terms), indicating that the cloud cover has a stronger cooling effect in this region. For the different cloud layers, the various radiative kernels compared here have a high consistency with our calculated kernels in specific cloud layers, demonstrating the stability of our proposed kernels. As we cannot definitively determine which of the four datasets represents the absolute truth, we treat them as ensemble realizations of the actual climate, and their differences serve as an estimate of the uncertainty in their measurements or datasets (Zhang et al., 2006). A more accurate validation would require more precise experiments, which are beyond the scope of this study.
4.4 Cloud shortwave radiative effects in the Arctic
The interaction between the clouds and surface radiative parameters, known as the CRE, directly impacts the radiation budget of the atmosphere–surface system and the associated temperature changes. This interaction plays a critical role in regulating the annual onset of snowmelt and the yearly melting and formation of sea ice in the Arctic. The surface CRE is defined as the difference in terms of the surface radiative flux under cloudy and clear-sky conditions (Cess and Potter, 1987). Accurately quantifying the variations in the surface CRE in the Arctic is of paramount scientific importance for correctly understanding and predicting global warming trends.
The role of clouds in the Arctic SW radiation budget varies throughout the year due to the highly seasonal variability of the surface albedo and atmospheric conditions. To more accurately quantify the cloud radiative influences, we utilized the GCF-CRKs, combined with CF products derived from multi-source satellite data, to estimate the daytime CRE in the Arctic. Additionally, we quantified the surface radiative flux anomalies caused by changes in the CF. The surface CRE can be calculated using the following equation:
where is the climatological monthly mean GCF-CRKs for the ith grid cell, and fi is the corresponding CF within that grid cell.
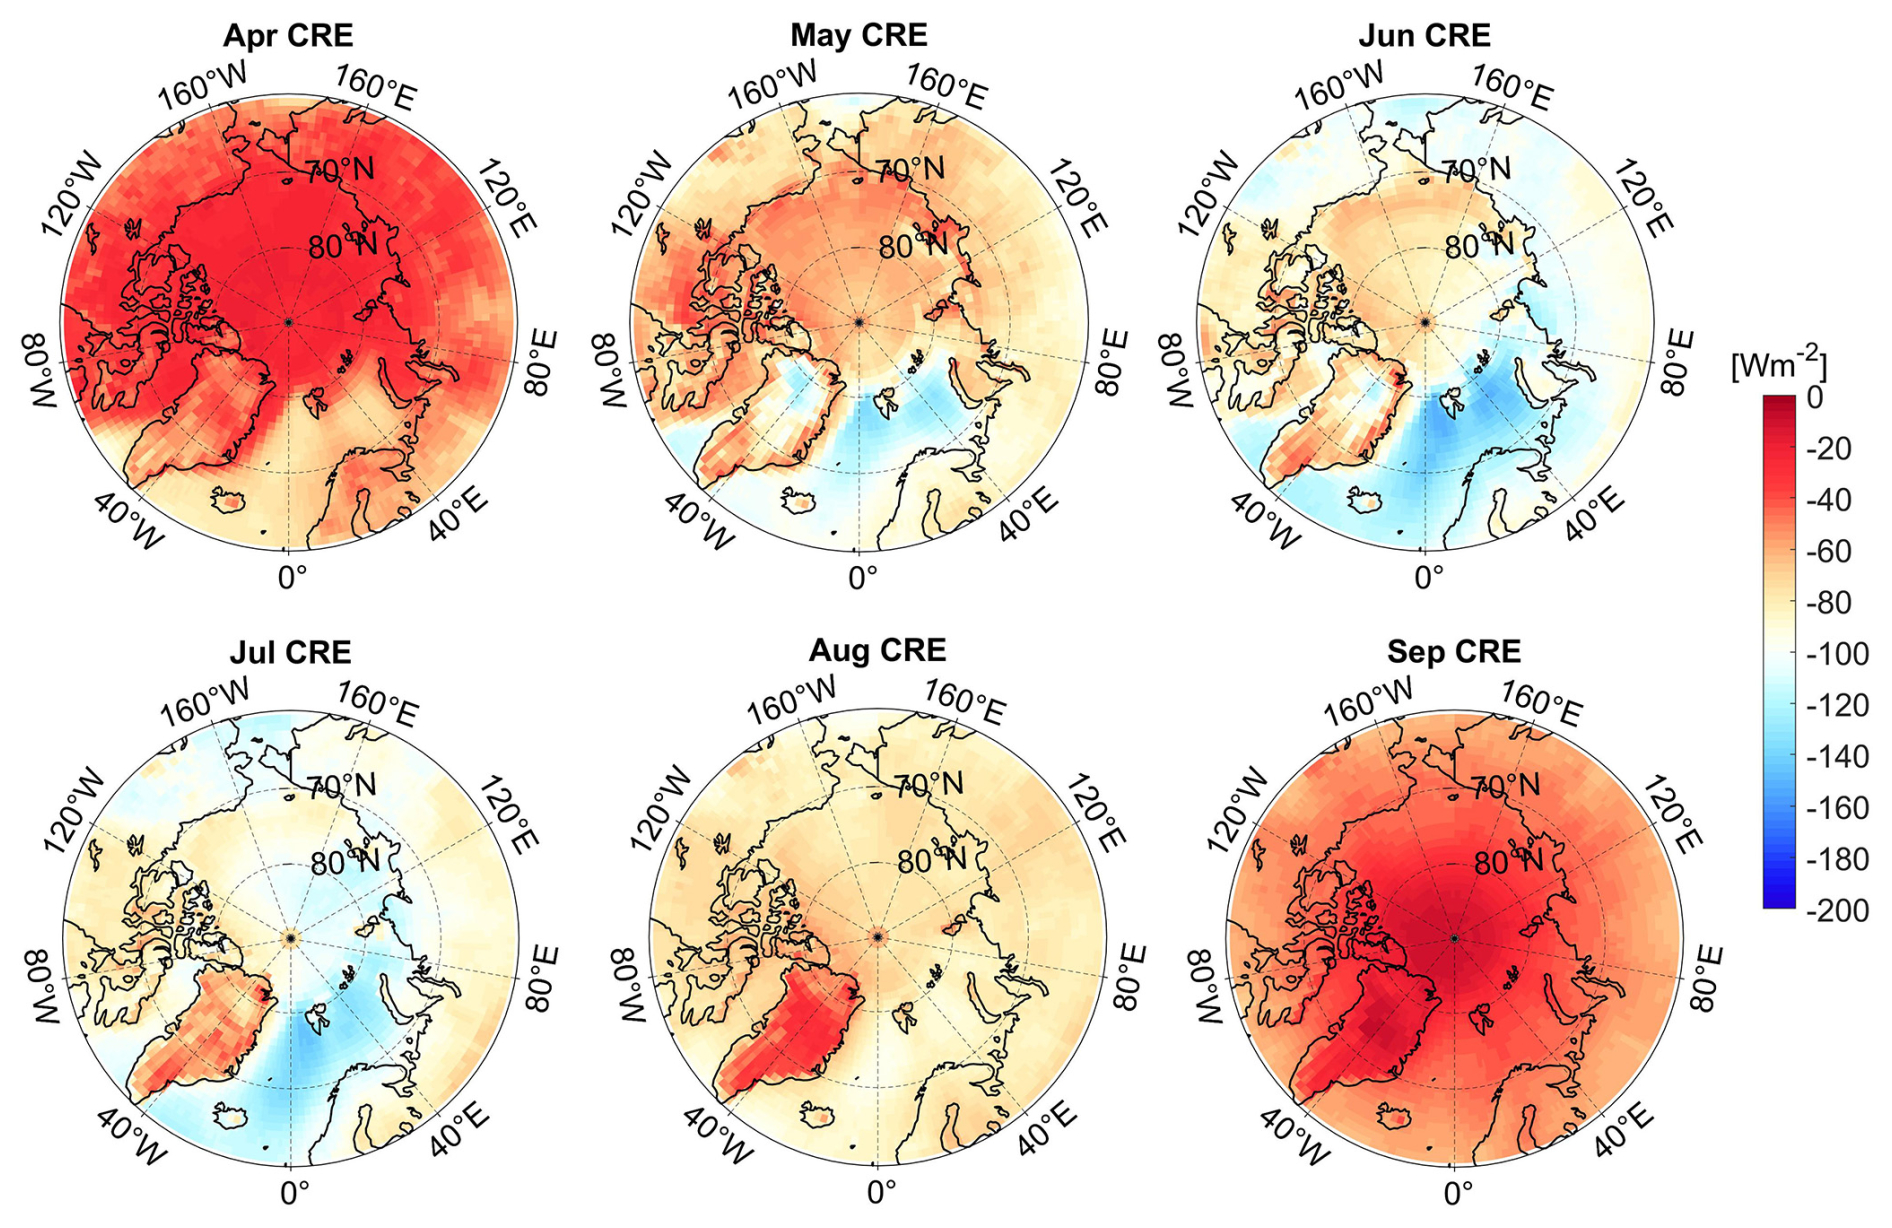
Figure 11Climatological monthly mean Arctic CRE.
Figure 11 illustrates the estimated CRE averaged from April to September. As shown in Fig. 11, the CRE is consistently negative across the Arctic during the entire study period, confirming the cooling effect of the clouds in this region. This finding is consistent with the conclusions of Sledd and L'Ecuyer (2021), who demonstrated through satellite observations that, compared to clear-sky conditions, clouds reduce the average solar absorption over the land and ocean, thereby delaying the increasing trend of the surface solar absorption under all-sky conditions by 20 %–40 %. Due to the high latitudes of the Arctic region, the seasonal variation in the solar elevation angle is significant, leading to considerable differences in terms of the intensity of the surface shortwave radiation across the seasons. Consequently, the CRE exhibits pronounced seasonal variability (Sedlar et al., 2010). In months with lower solar insolation, such as April and September, the CRE values are relatively low, with monthly averages of 42.12 and 43.87 W m−2 (both negative), respectively (latitudinally weighted averages). However, during the months of June and July, when the solar insolation is stronger, the monthly average CRE increases to approximately 95 W m−2 (negative), indicating that the clouds have a stronger cooling effect on the Arctic surface during summer.
In terms of the spatial distribution, it was found that, in addition to the solar zenith angle, the surface albedo is a crucial factor influencing the surface shortwave cloud radiative effect (SWCRE). In perennial open-water regions, in which the surface albedo is lower than that of sea-ice-covered and land areas at the same latitude, the surface SWCRE remains most strongly negative throughout the entire study period. This effect is particularly pronounced in summer, in which the CRE exceeds 144 W m−2 (negative). Conversely, the surface albedo over the Greenland Ice Sheet remains high year-round, resulting in smaller shortwave cloud radiative effect values, a feature that becomes even more prominent in August and September, in which the value decreases to approximately −20 W m−2.
The surface SWCRE is influenced by several cloud parameters, such as the CF, TAU, CTP, and CTT. In perennial open-water areas, the CF remains high throughout the year (> 80 %), with an annual variation of approximately 5 %. However, during the summer months (June–August), the TAU, CTP, and CBP increase, and both the CTT and CBT are strongly correlated with the intensification of the negative CRE trend.
In the central Arctic Ocean, the CF exhibits interannual variability of greater than 30 %, and the CRE initially increases and then decreases over the course of the year. This trend is regulated not only by the solar elevation angle and surface albedo but also by the TAU, CTP, and CTT. As the duration and angle of the solar insolation increase, the Arctic sea ice melts more extensively. Studies have reported that, for every 106 km2 reduction in the sea ice area, the annual average absorbed solar radiation in the region above 75–90° N increases by 2.5 to 6 W m−2 (Hartmann and Ceppi, 2016). This is primarily due to the positive surface albedo feedback induced by the substantial sea ice changes, which further amplifies the absorption of solar radiation. However, the melting sea ice, along with the intensified atmospheric and oceanic circulation, brings more warm and moist air into the Arctic, enhancing cyclonic activity. This results in increased cloudiness, thicker cloud layers, and lower cloud heights (Figs. A1–A6). The presence of clouds can introduce a negative cloud optical thickness feedback, thereby reducing the absorption of solar radiation (Goosse et al., 2018).
4.5 Validation and comparison of CRE based on GCF-CRKs
This study also compared the CRE estimated using the CRKs with the actual surface CRE calculated from the CERES EBAF; the latter is derived from the differences between the all-sky DSSR and clear-sky DSSR. The two CRE values had high consistency, with a spatial correlation of 0.84, an RMSE of 12.22 W m−2, and a bias of 1.93 W m−2, suggesting that the surface CRKs can effectively explain the spatial distribution of the surface SWCRE observed in the Arctic. The difference distribution map (Fig. 12) reveals that, across most of the regions of the Arctic, the error between the CRE estimated using the GCF-CRKs and that estimated using the CERES EBAF data is within 5 W m−2, particularly over land areas, excluding Greenland. However, in Greenland, the CRE intensity estimated using the GCF-CRKs is significantly higher (more negative) than the CRE derived from the CERES EBAF data. This discrepancy is primarily due to the higher CF in this region, in which our single-layer cloud radiative transfer model yields a higher DSSR value, resulting in more negative GCF-CRKs. This effect is especially pronounced during months with stronger solar insolation (May to July). Based on the accuracy validation conducted earlier using ground station data, we have reason to believe that the original CERES EBAF data underestimate the sensitivity of the DSSR to the CF in Greenland.
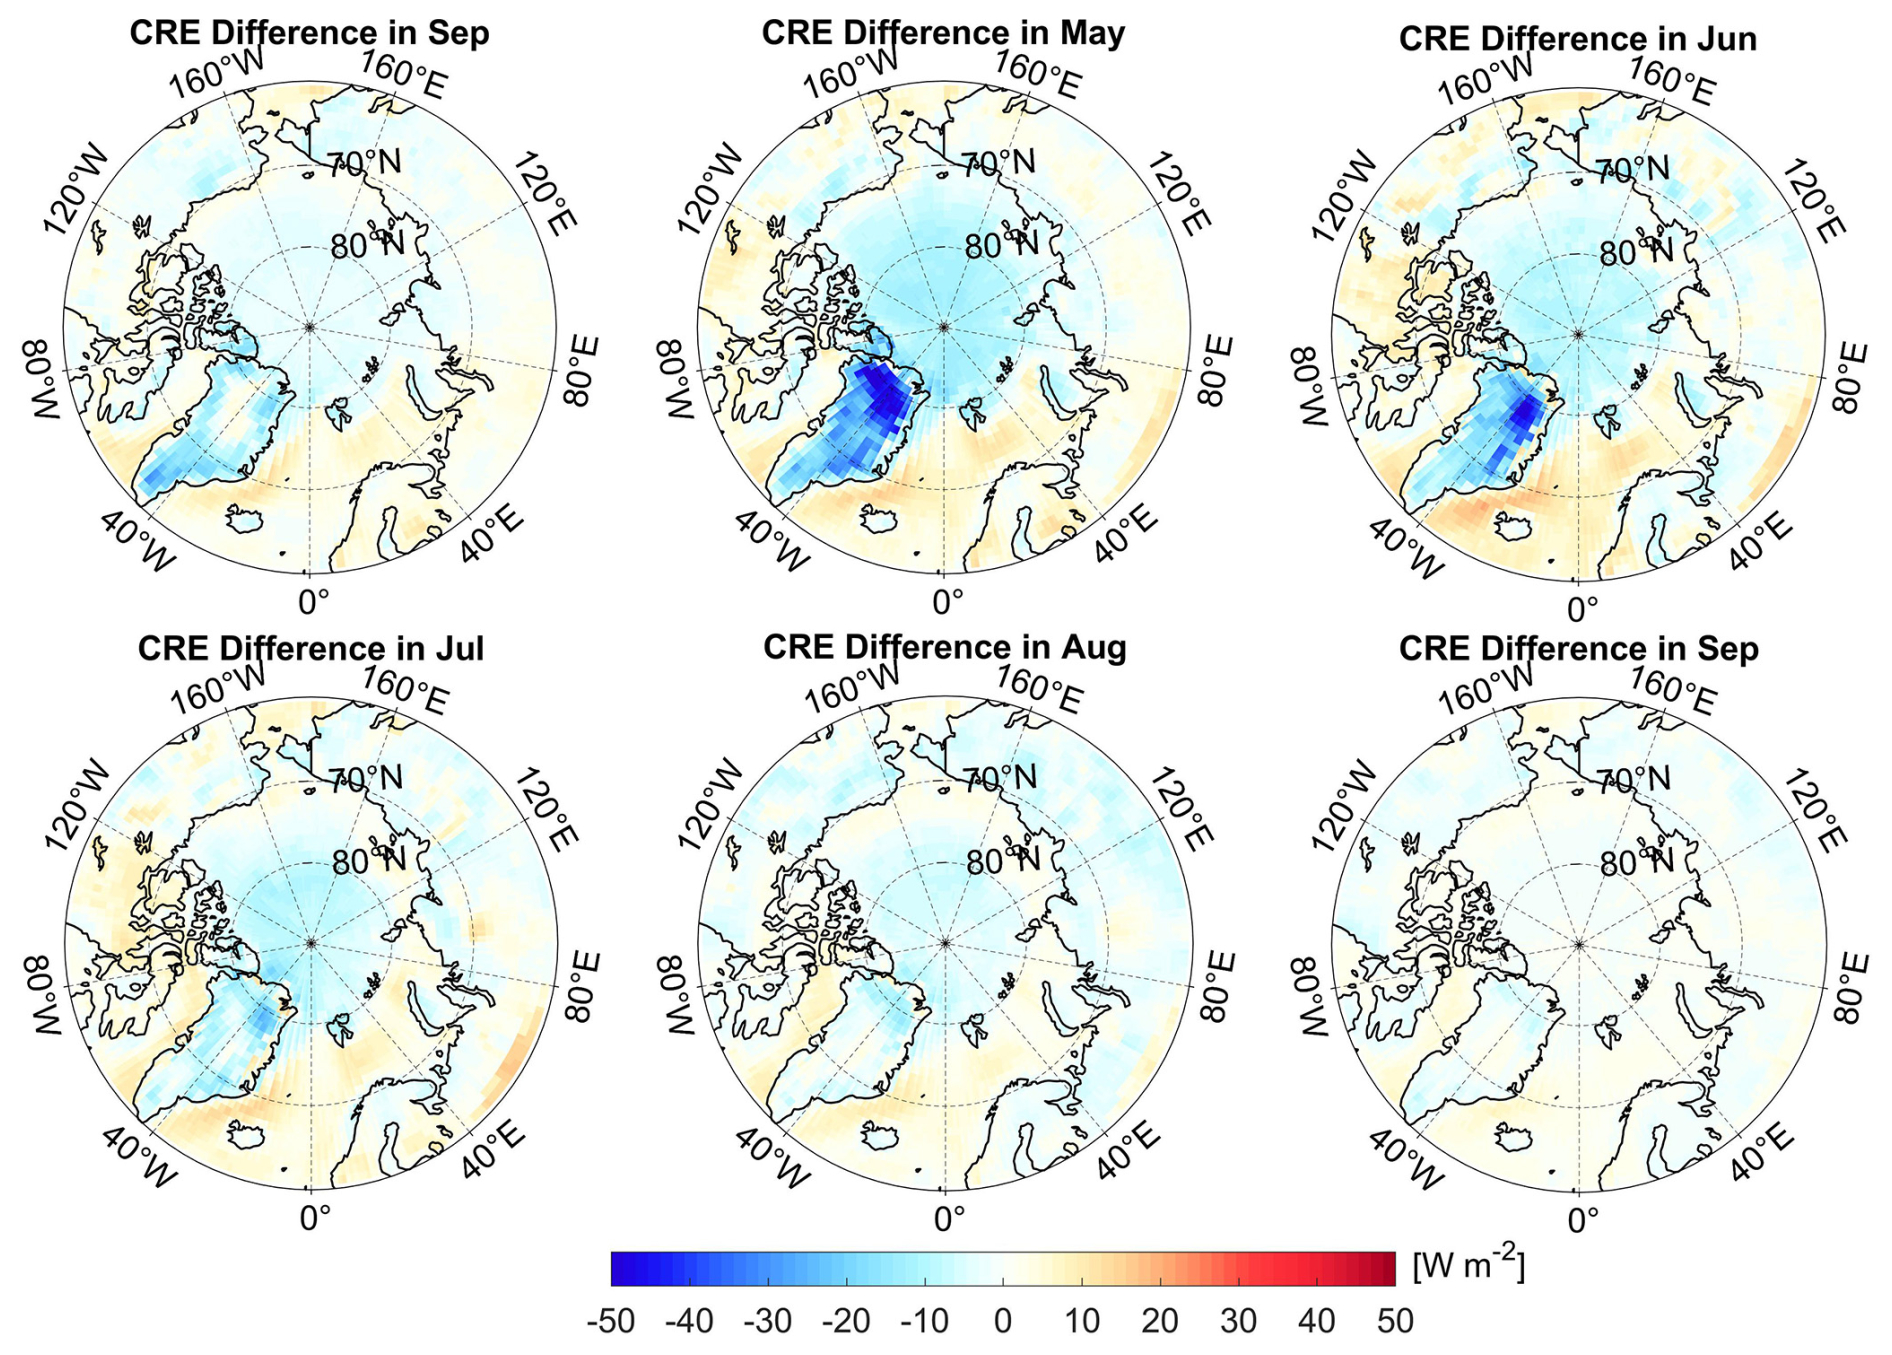
Figure 12Spatiotemporal distribution for the surface SWCRE differences. The CRE calculated from the GCF-CRKs minus the CRE derived from the CERES EBAF DSSR data.
Additionally, we observed that, in the open-ocean regions, the CRE estimated using the GCF-CRKs is slightly lower than the CRE derived from the CERES EBAF data. This is mainly associated with the middle- and low-level clouds. When large numbers of optically thick middle- and low-level clouds are present, they can reflect more incoming solar radiation, thereby reducing the DSSR that reaches the surface. However, due to the limited observational data available for the oceanic regions, further validation work in these areas needs to be conducted in future studies.
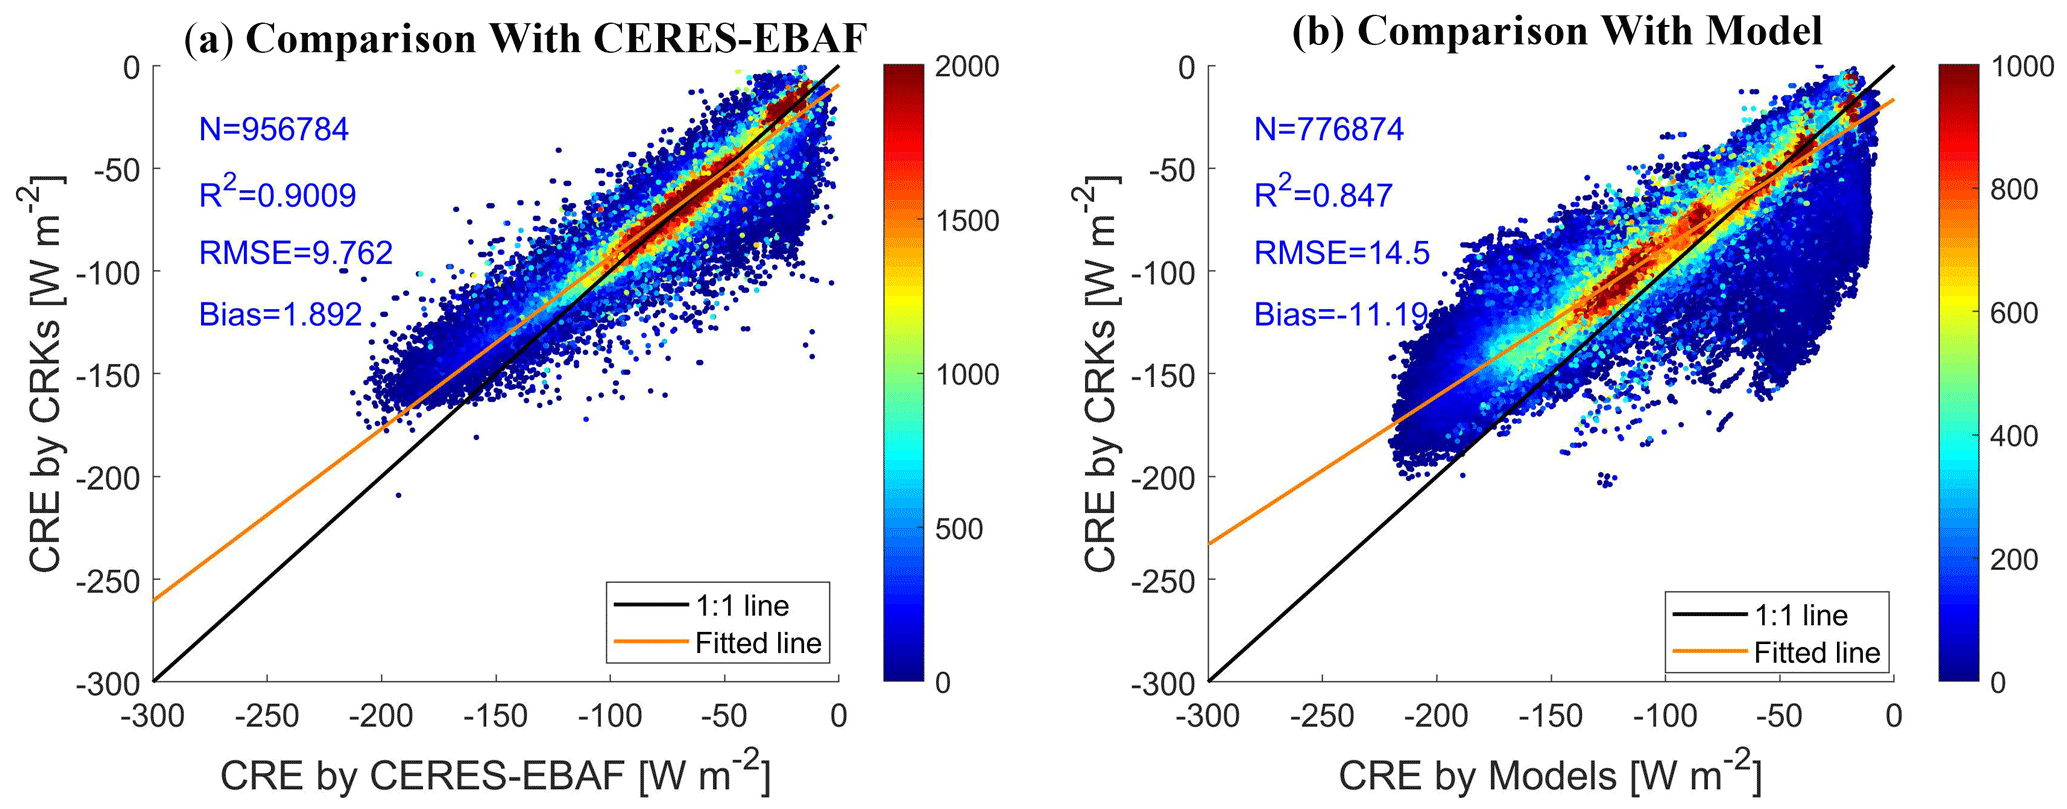
Figure 13Comparison of cloud radiative effect (CRE) estimated by GCF-CRKs with observed and model-estimated CRE.
To further verify the accuracy and applicability of the radiative kernel method based on CF proposed in this study for estimating surface shortwave cloud radiative effect (CRE), we added a validation using independent datasets. Specifically, we calculated the surface CRE from the Atmospheric Model Intercomparison Project (AMIP) within the Coupled Model Intercomparison Project phase 6 (CMIP6) for the period of 2000–2014. We selected the Community Earth System Model Version 2 (CESM2), which is extensively applied in climate research, to conduct the simulations (Zhou et al., 2022). The comparison revealed a strong consistency between the two datasets. Specifically, the CRE estimated using our radiative kernel method exhibited a high linear correlation with the CESM2-simulated CRE, with a coefficient of determination (R2) of approximately 0.847. The root mean square error (RMSE) between the two datasets was about 14.5 W m−2, indicating a reasonable level of error. Additionally, the bias was approximately 11.19 W m−2, suggesting that our method slightly overestimated the CRE compared to CESM2. These results demonstrate the effectiveness of our radiative kernel method in estimating the radiative forcing effect caused by cloud fraction changes. Moreover, the validation results are highly consistent with those obtained using the CERES data directly (R2 = 0.9009, RMSE = 9.762 W m−2, bias = 1.8916 W m−2; Fig. 13a), further confirming the reliability of our approach.
Through this additional validation, the radiative kernel method employed in this study not only demonstrated high accuracy in the Arctic region but also exhibited good applicability in broader climate model simulations. This indicates that the method can effectively isolate the contribution of changes in cloud cover to surface shortwave radiation. It thus provides a more reliable tool for understanding the role of cloud radiative effects in the global climate system.
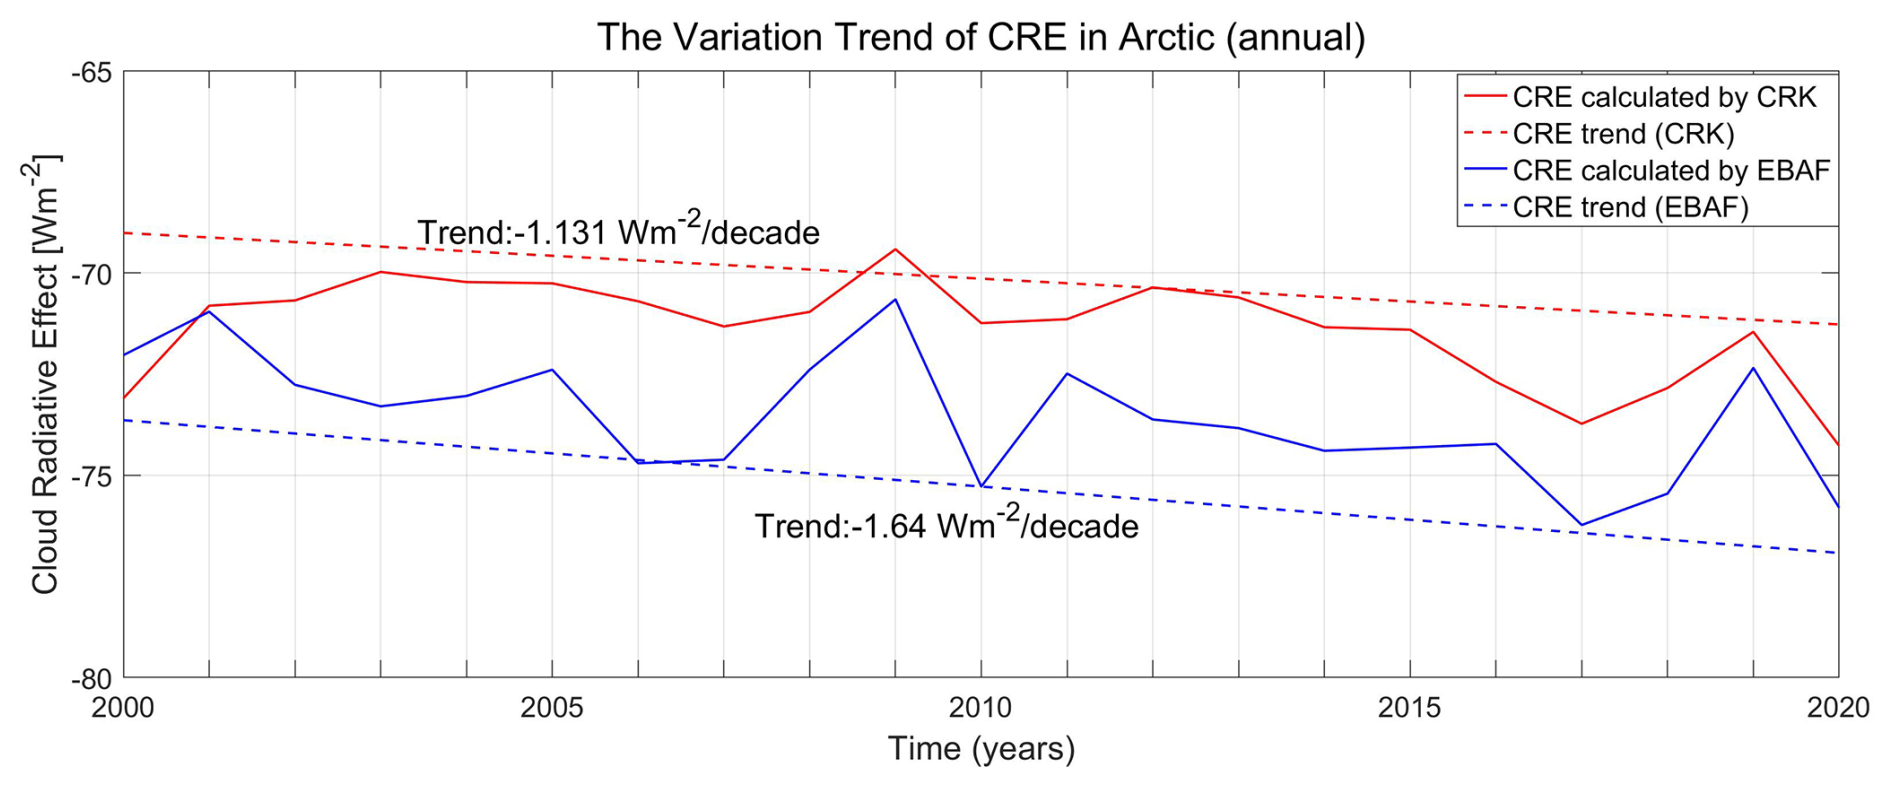
Figure 14Interannual variation trend of the cloud radiative effect (CRE) in the Arctic region (focusing only on daytime, April to September, at the 95 % confidence level).
To obtain detailed information about the temporal variation in the surface CRE in the Arctic, we employed the Sen–Mann–Kendall trend analysis method to calculate the long-term trends. This method has been widely used in climatology for evaluating changes in climate parameters as it is more robust against individual noise than the least-squares method, making it more suitable for analyzing long-term trends (Cai and Yu, 2009; Karlsson and Devasthale, 2018). We calculated the annual latitude-weighted average CRE for both the CRE calculated using the GCF-CRK (red in Fig. 14) and the CRE calculated using the CERES EBAF data (blue in Fig. 14) from April to September and assessed the 21-year trend at the 95 % significance level. The trend analysis clearly shows that the interannual variations in the CRE obtained using both methods exhibit a decreasing trend (negative), indicating that the cloud-induced surface radiative flux anomalies in the Arctic are increasing year by year. However, the magnitude of this influence differs slightly between the two methods. The CRE calculated using the CERES EBAF data exhibits a trend of −1.64 W m−2 per decade, while the trend of the CRE calculated using the GCF-CRKs is gentler at −1.131 W m−2 per decade. This suggests that the rate of change in the clouds' influence on the surface radiative fluxes over time may not be as large as previously thought.
We also observed that the CRE calculated using the GCF-CRKs generally exhibits smaller negative values than the CRE calculated using the CERES EBAF data. This discrepancy is primarily due to the detection of a lower CF in the perennial open-water areas and many land areas, resulting in higher DSSR values and a greater surface SWCRE. The largest difference between the two (approximately 4 W m−2) occurred in 2010, and the smallest difference (0.15 W m−2) occurred in 2000.
In terms of the spatial distribution trends (Fig. A7), the overall trend patterns of the CRE calculated using the GCF-CRKs and the CERES EBAF data are consistent. Significant decreasing trends occur in the oceanic regions, while significant increasing trends occur over Baffin Island and parts of the Asian continent. The remaining regions do not exhibit significant trends at the 95 % confidence level. We also noticed that, in areas with significant trend changes, the CRE calculated using the GCF-CRKs exhibits a much more gradual change than that calculated using the CERES EBAF data, suggesting that the cooling effect of the clouds on the Arctic DSSR may be overestimated. To achieve the goal of limiting the temperature rise to be within 1.5 °C above pre-industrial levels, more robust emission reduction measures are necessary to mitigate the impact of the Arctic amplification effect on the surface radiative energy balance.
During the estimation process, there are some uncertainties that can impact the results. These uncertainties arise from the establishment of the radiative transfer model and the spatiotemporal sensitivity of the radiative kernels. In addition, the role of CRE in modulating the Arctic surface energy balance and its influence on Arctic amplification and global climate feedback mechanisms also warrant further investigation.
5.1 Uncertainty due to surface albedo
The surface albedo, defined as the ratio of the solar radiation reflected from the Earth's surface to the solar radiation incident upon it, is a crucial parameter influencing the accuracy of DSSR estimation from TOA observations. The land surface albedo is highly variable both spatially and temporally, making accurate surface albedo data essential for better characterizing the DSSR. In this study, we used the ratio of the outgoing shortwave radiation to the incident shortwave radiation under clear-sky conditions as the surface albedo for the Arctic region. To assess the reliability of this albedo information, we compared it with albedo data from the CERES EBAF dataset.
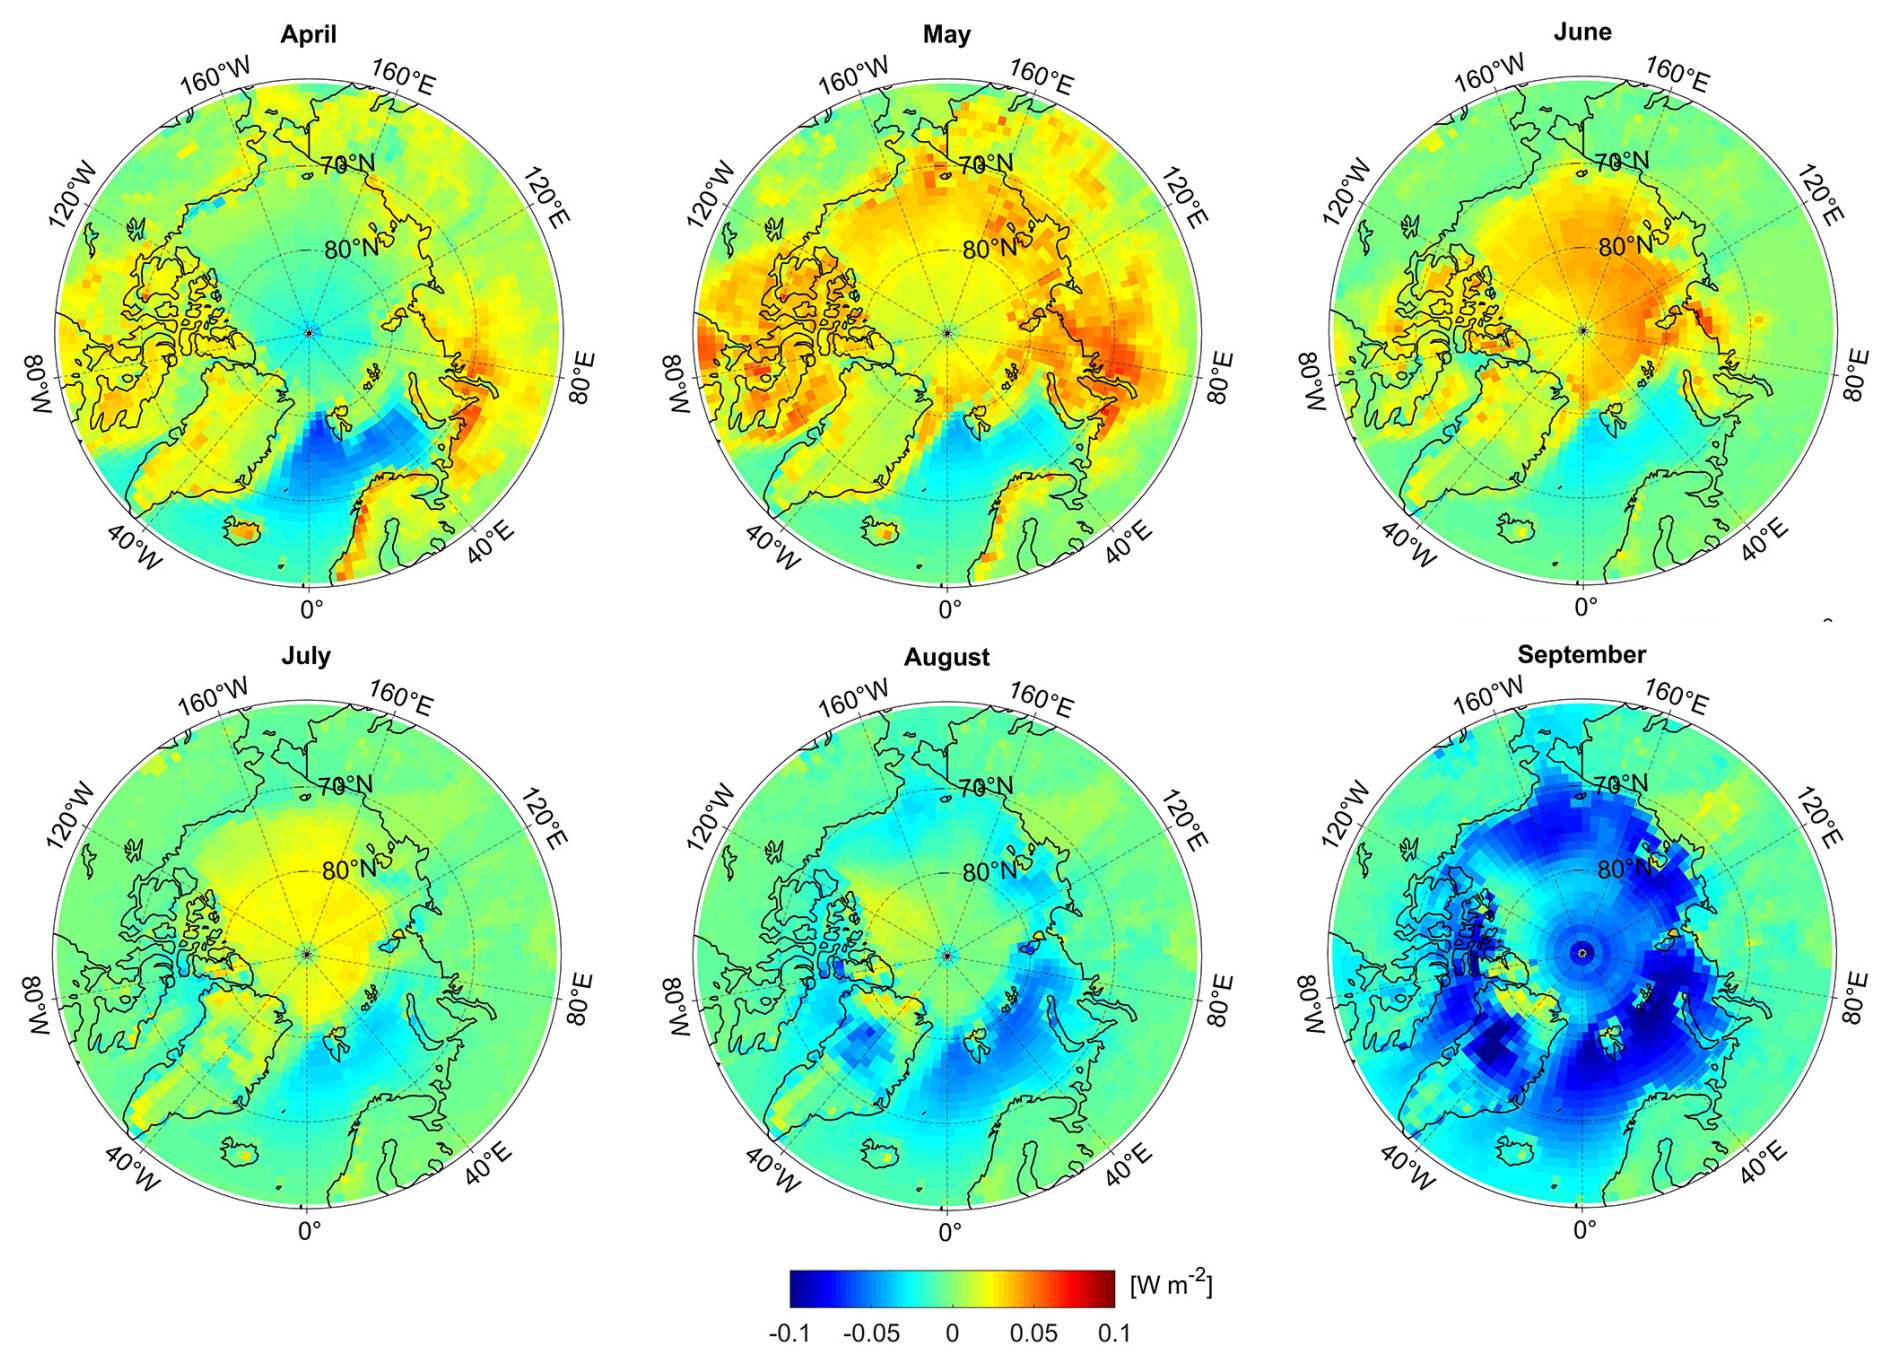
Figure 15Difference between the surface albedo estimated using clear-sky radiation parameters and the CERES EBAF surface albedo.
Figure 15 presents a comparison of the spatiotemporal distributions of the albedo derived using the clear-sky radiation parameters and the CERES EBAF albedo data for the Arctic region. The difference between these two albedo estimates is generally less than 0.1. However, this difference can vary significantly with time and region. In areas with low DSSR values (e.g., open ocean in April and Arctic marine regions in September, where the CERES EBAF DSSR is less than 100 W m−2), the albedo estimated using the clear-sky radiation parameters exhibits slight overestimation (approximately 3–6 W m−2). This overestimation is due to the higher albedo values calculated during months with lower solar elevation angles, particularly in the oceanic regions. Conversely, in the regions with high DSSR values (where the CERES EBAF DSSR is greater than 250 W m−2), the estimated albedo exhibits slight underestimation. This discrepancy arises because the surface albedo computed under clear-sky conditions is lower than the all-sky albedo during high-radiation periods, such as in May to July.
In the Arctic region, extensive snow and sea ice cover result in high surface albedo values. Research conducted by Laine (2004) and subsequent studies have demonstrated that a high surface albedo increases the DSSR flux under cloudy conditions (Colman, 2015; Huang et al., 2018; Li et al., 2022). This increase in the DSSR is attributed to multiple reflections between the atmosphere (especially clouds) and the highly reflective snow or ice surface. In this study, the DSSR was divided into two components: one representing the DSSR without surface contributions and another accounting for multiple reflections between the surface and the atmosphere. In many studies, the first component is often used as an approximation of the all-sky downward radiation flux (Liu et al., 2011; Boeke and Taylor, 2016; He et al., 2019). Our results indicate that significant underestimation of the DSSR occurs when multiple reflection effects are not considered (Fig. 16). Compared to the CERES SYN1deg data, the R2 value is 0.966, a decrease of approximately 0.2; the RMSE is 4.14 W m−2 higher, and the bias decreases from 4.93 to −4.2 W m−2, i.e., a change of nearly 10 W m−2. This underestimation is more pronounced in regions with high DSSR values, such as Greenland and sea ice areas where the surface albedo is higher. Therefore, it is crucial to account for multiple reflection effects between clouds and the surface when estimating surface radiation parameters in the Arctic region.
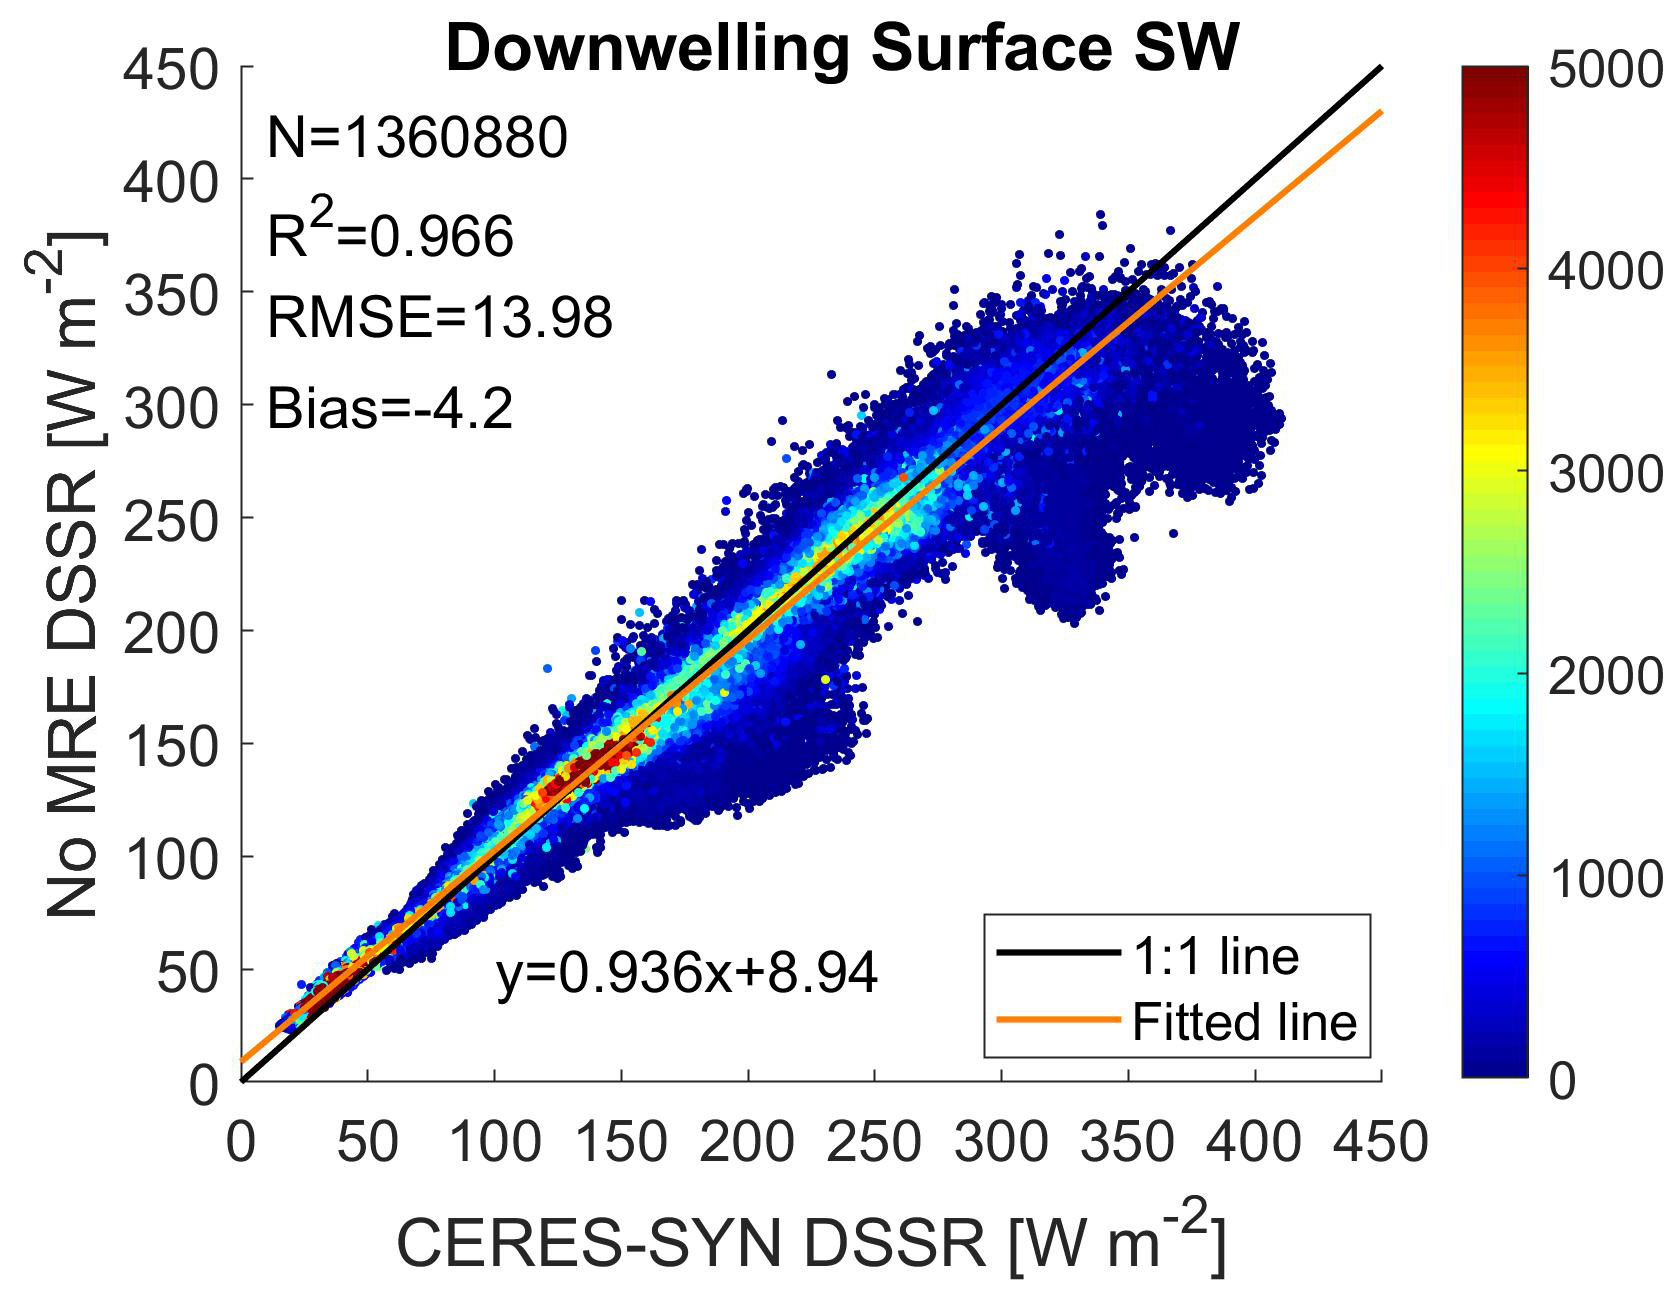
Figure 16Scatterplot comparing the DSSR estimated without considering multiple reflection effects (MREs) and the CERES SYN1deg DSSR.
5.2 Temporal and spatial sensitivity of the surface SW CF radiative kernels
In contrast to existing cloud radiative kernels that use radiation parameters from 1-year or shorter periods, our study developed a long-term monthly GCF-CRK using the established radiative transfer function. To better understand the temporal and spatial variability of the SFC GCF-CRK, we conducted a detailed sensitivity analysis.
From the latitude-weighted average values of the GCF-CRKs (Figs. 9 and 10) and the climate monthly average distribution maps (Fig. 7), it is evident that the SFC GCF-CRKs become less negative with increasing latitude (a change of approximately 0.43 W m−2 %−1). Additionally, there are significant differences in terms of the SWCRE calculated using the SFC GCF-CRKs across various spatial locations. For example, in the sea ice areas and perennial open-water regions at the same latitude, the difference in terms of the SFC GCF-CRKs ranges from approximately 0.2 to 1.2 W m−2 %−1, leading to CRE deviations of greater than 50 W m−2. This highlights the significant impact of the spatial distribution on the radiative kernels, suggesting that using CRKs and data for only specific regions to represent global values can introduce substantial errors.
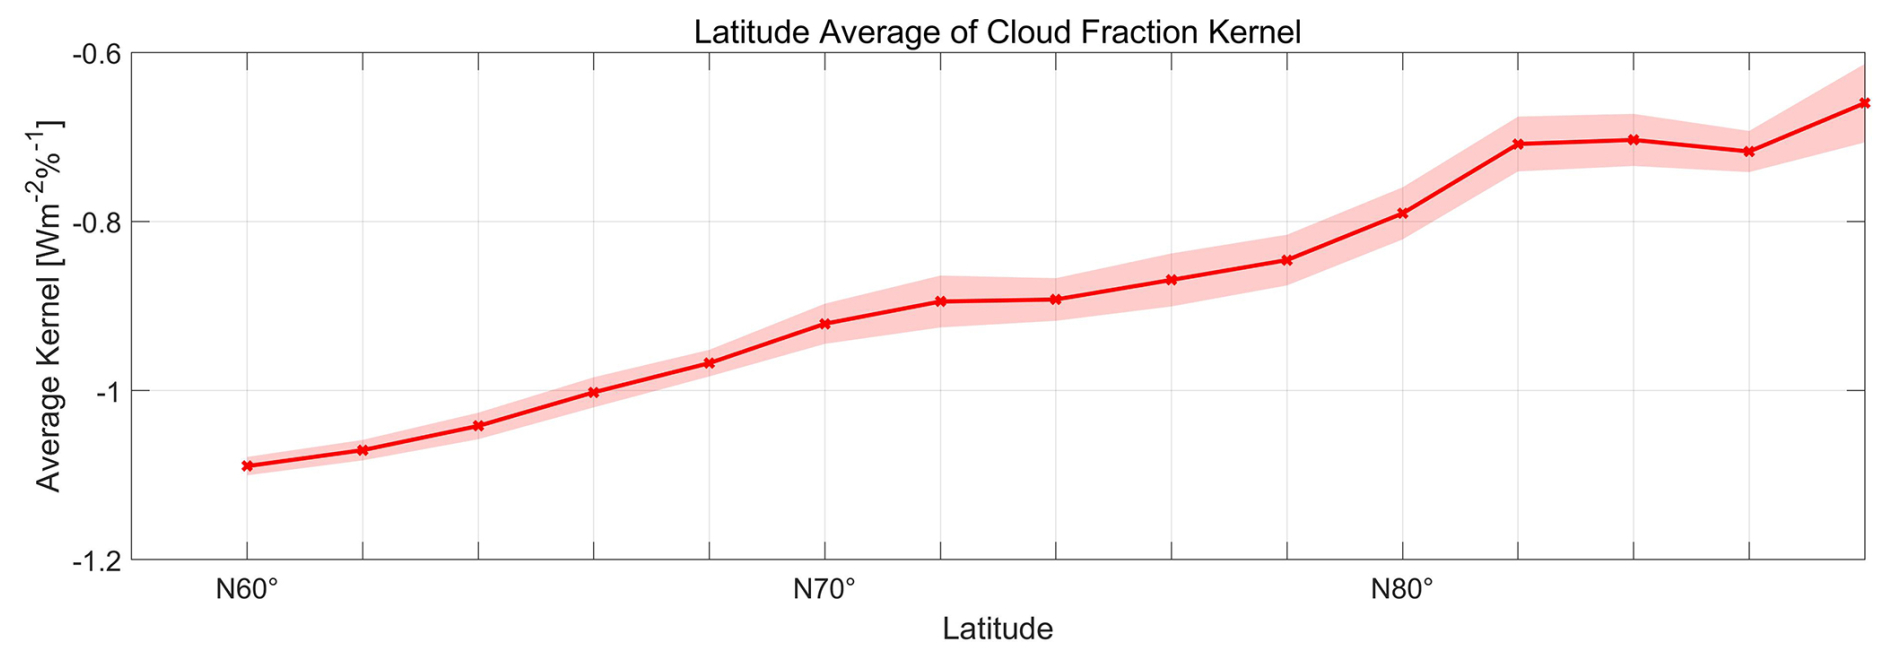
Figure 17Latitude-weighted mean of the deseasonalized grid-based surface cloud fraction cloud radiative kernels (SFC GCF-CRKs).
Furthermore, regarding the uncertainty level, the time series uncertainty within the same latitude band can reach up to 1 W m−2 %−1 . The regional distribution maps for different months reveal the occurrence of considerable seasonal variability in the GCF-CRKs, which is closely related to the seasonal changes in the solar altitude and cloud parameters. To mitigate the impact of seasonal variations, we calculated the deseasonalized time series standard deviation (Fig. 17). The standard deviation decreases significantly across different latitude bands, although it still exhibits an increasing trend with latitude. Overall, the values remain below 0.1 W m−2 %−1, indicating that seasonality is a crucial factor affecting the CRKs.
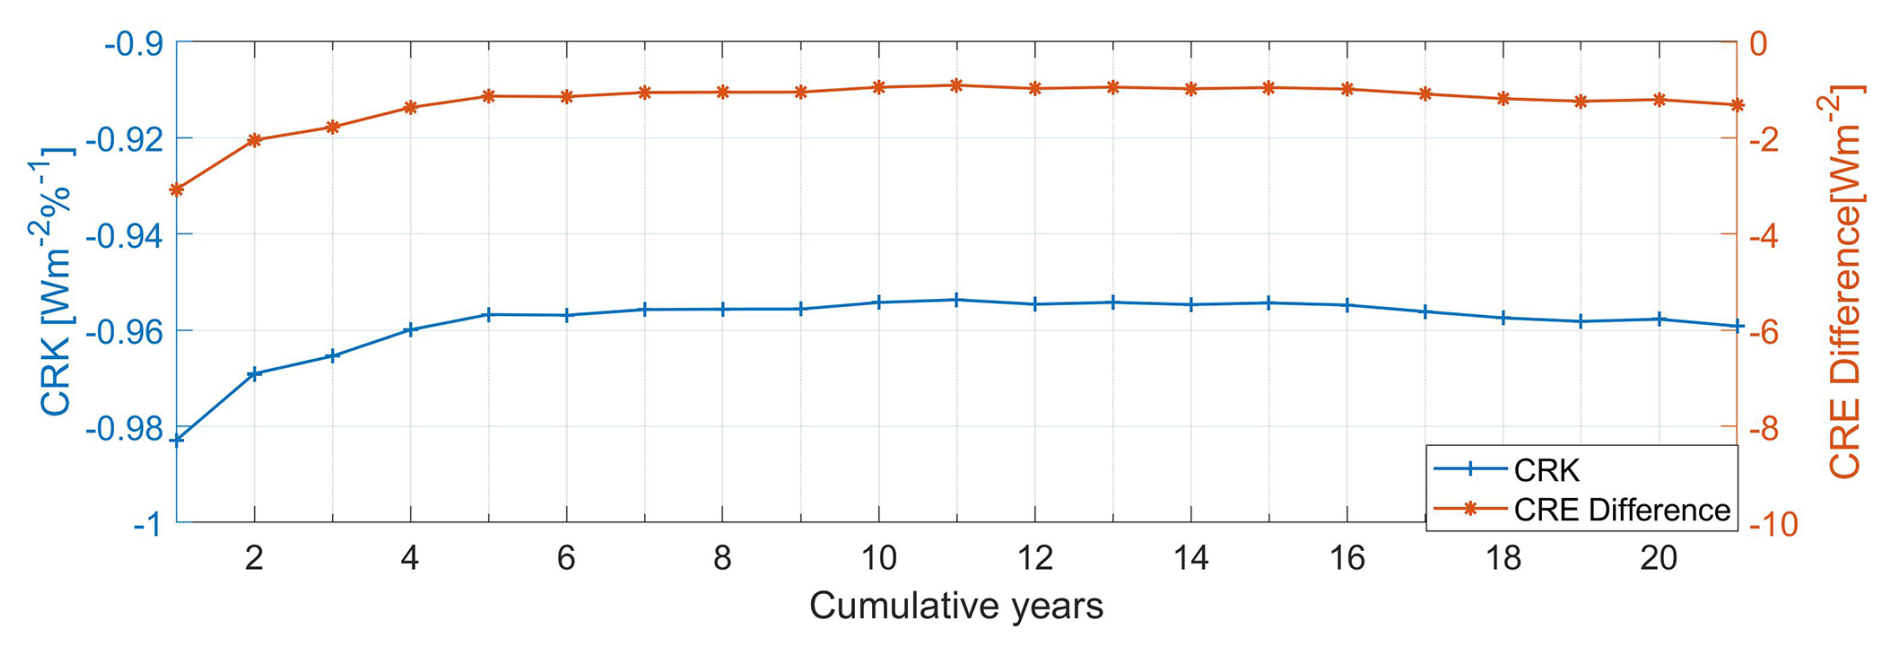
Figure 18Differences in the grid-based surface cloud fraction radiative kernels (SFC GCF-CRKs and in the CRE) estimated using data with varying time lengths.
To further investigate the temporal sensitivity of the SFC GCF-CRKs, we calculated the SWCRE using CRKs estimated over varying time periods (Fig. 18). In this experiment, we calculated the average SFC GCF-CRKs for 1-year to 21-year cumulative periods with 1-year intervals and used these kernels to compute the corresponding CRE. We then compared these results with the CRE obtained from the difference between the all-sky DSSR and clear-sky DSSR.
The analysis revealed that, when using only 1 year of data to estimate the SFC GCF-CRKs, the resulting CRKs are less negative than the average CRKs calculated using data for multiple years, leading to a larger CRE discrepancy (approximately 2.5 W m−2). As the accumulation period increased, particularly beyond 5 years, the annual average CRKs gradually stabilized, and the difference in terms of the CRE decreased (close to zero). This temporal convergence indicates that GCF-CRKs constructed based on sufficiently long observational records (≥ 5 years) can robustly represent the climatological mean state and minimize uncertainties introduced by interannual variability. Thus, we recommend using data spanning at least 5 years to calculate the radiative kernels in order to minimize errors caused by interannual variability.
Although our study has demonstrated the stability of GCF-CRKs under current climate conditions, cloud properties may change with global warming, which could render the GCF-CRKs derived from the current climate less accurate for future climate scenarios. For instance, as temperatures rise, the transition of the cloud phase from ice-dominated to liquid-water-dominated can lead to an increase in cloud particle radius, resulting in a gradual increase in the optical thickness of low clouds, while the optical thickness of high clouds may decrease (Hartmann and Ceppi, 2016). Influenced by multiple factors such as sea ice changes, atmospheric circulation, and ocean temperature variations, this trend is more complex in the Arctic region (Storelvmo et al., 2015). Changes in cloud parameters may alter the relationship between CF and DSSR, thereby reducing the representativeness of GCF-CRKs derived from historical data in future cloud–radiation interactions. Moreover, the rapidly changing surface conditions in the Arctic – such as the reduction in sea ice extent and snow cover – may amplify the feedbacks between surface albedo, cloud properties, and radiative fluxes. For example, open-ocean areas can enhance the formation of low clouds, while the persistently high albedo surface of Greenland can strengthen the cloud–surface reflection effect (Huang et al., 2017a), thereby altering the sensitivity of surface shortwave radiation to cloud fraction perturbations and affecting the accuracy of GCF-CRKs.
To enhance the applicability of GCF-CRKs in future climate scenarios, we plan to use multiple climate models (such as CMIP6 models) to simulate future changes in cloud properties, including CF, TAU, cloud phase, and cloud water content. By comparing these simulated results with current climate data, we aim to quantify the potential impacts of climate change on GCF-CRKs.
5.3 Potential contributions of GCF-CRKs to understanding climate feedback mechanisms
This study reveals the critical role of CRE in the Arctic surface energy balance, which is of great significance for understanding the Arctic amplification effect and global climate feedback mechanisms. The Arctic amplification effect is characterized by a warming rate that is 2 to 4 times the global average, primarily driven by the complex interplay between sea ice loss, surface albedo feedback, and cloud radiative dynamics (Cao and Liang, 2018). Our findings indicate that the cooling effect of clouds on Arctic surface shortwave radiation is stronger than previously estimated, especially in Greenland, where the radiative cooling deviation caused by clouds reaches approximately 4 W m−2. This suggests that cloud plays a more important role in regulating the surface energy balance, potentially offsetting some of the warming effects caused by sea ice loss (Sledd and L'Ecuyer, 2021).
In terms of interannual variation, the CRE calculated using GCF-CRKs exhibits a weaker interannual trend (−1.131 W m−2 per decade compared to −1.64 W m−2 from the CERES EBAF), indicating that the cooling rate of clouds on Arctic surface shortwave radiation may have been overestimated in the past. This implies that the actual rate of Arctic warming could be faster than previously predicted. During the summer months, when solar radiation is strongest and sea ice melting is most active, the enhanced sensitivity of DSSR to perturbations in CF (with GCF-CRKs exceeding −2.5 W m−2 %−1 in northern Greenland) indicates that even minor changes in cloud cover can significantly alter surface energy absorption. Notably, the stronger cooling effect over the Greenland Ice Sheet (GrIS) is consistent with its persistently high surface albedo, where cloud–snow multiple reflection enhances shortwave scattering. These findings emphasize that cloud feedback is not just a passive responder but an active regulator of Arctic amplification, potentially slowing the rate of ice–albedo feedback during critical melting seasons.
Current climate models face difficulties in accurately replicating observed Arctic cloud properties, leading to significant uncertainties in predicting future warming scenarios. The high-precision GCF-CRKs developed in this study address the key limitations of traditional kernels that rely on uniform cloud layers or short-term datasets, thereby improving the parameterization of cloud feedback processes in climate models and enhancing the accuracy of future Arctic climate change predictions. By demonstrating that cloud base temperature (CBT) and TAU dominate the variability of GCF-CRKs over ocean and land, respectively (Table 1), this study provides a framework for refining cloud parameterization in models. For instance, the underestimation of CF by the CERES SSF in Greenland (Fig. 6) and its cascading impact on CRE bias (Fig. 12) reveal systematic errors in representing cloud–surface interactions over the ice sheet. Improving model representation of these processes can enhance predictions of the Greenland Ice Sheet meltwater contribution to global sea level rise.
However, several limitations of this study are noteworthy. First, considering CF to be the sole perturbation variable neglects the synergistic effects of cloud phase, vertical structure, and microphysical properties, which are crucial for ice cloud feedback. Second, sparse validation data over the Arctic Ocean – particularly in autumn, when sea ice forms – introduce uncertainties into marine cloud radiative impacts. Future work should integrate multi-sensor lidar and/or radar observations (e.g., CloudSat or CALIPSO) to distinguish between contributions from cloud height and those from optical thickness. Additionally, extending GCF-CRKs to longwave radiation and coupling them with dynamic sea ice models could elucidate cloud feedbacks throughout the annual cycle. On the other hand, radiative kernels can help isolate the individual contributions from each component of the atmosphere and surface, which is essential for evaluating feedbacks, improving models, and understanding global climate change (Thorsen et al., 2018). The GCF-CRK method developed in this study treats cloud fraction (CF) as the sole perturbation variable, while other cloud parameters and non-cloud data are treated as non-perturbation variables. This approach directly links radiative fluxes to cloud parameters. However, cloud radiative effects are a multidimensional and complex process involving multiple parameters, such as cloud optical thickness (TAU), cloud droplet effective radius, and cloud top height. Notably, this method is highly scalable and can be used to separately analyze the independent effects of each parameter (Thorsen et al., 2018). For example, the sensitivity of surface shortwave radiation to changes in TAU can be calculated by varying TAU while holding CF and other parameters constant. However, the analysis of the impacts of multiple cloud parameters on GCF-CRKs in the preceding sections also indicates that different cloud parameters have significant spatial and temporal differences in terms of their effects on cloud radiative effects and even opposing signs. How to couple the radiative effects of multiple cloud parameters to resolve their combined effects is an important direction for future research.
The gridded surface cloud fraction radiative kernels (GCF-CRKs) are available on the Zenodo repository at https://doi.org/10.5281/zenodo.13907217 (Liu, 2024). The data are provided in NetCDF format with five individual files (54.5 MB) at 1° spatial resolution and monthly temporal resolution for only sunlit months from April to September during 2000–2020. The latitude ranges from 60 to 90° N, and the longitude ranges from 180° W to 180° E.
The fusion cloud fraction dataset can be downloaded from https://doi.org/10.5281/zenodo.7478918 (Liu and He, 2022). The International Satellite Cloud Climatology Project H dataset CRK (ISCCP-FH CRK) can be downloaded from https://doi.org/10.5281/zenodo.4677580 (Zhang, 2021) and the Zhou-CTP/CBP CRKs are available online from https://doi.org/10.5281/zenodo.5176193 (Zhou, 2021).
This paper presents a novel and more computationally efficient method for estimating the surface shortwave cloud radiative effect (CRE) in the Arctic region by developing grid-based surface cloud fraction cloud radiative kernels (GCF-CRKs) that incorporate spatiotemporal variability and integrate refined downwelling surface shortwave radiation (DSSR) estimates and high-precision cloud fraction (CF) data. The key contributions of this work are described below.
7.1 Enhanced DSSR accuracy
By leveraging the correlation between the top-of-atmosphere (TOA) radiative parameters and incorporating the effect of cloud fraction (CF) on surface shortwave radiation under various CF conditions, we derived the DSSR under all-sky conditions as a function model related to the satellite-observed TOA shortwave radiation, clear-sky DSSR, and CF. By incorporating CF information into the estimation process, this method addresses the limitations of traditional approaches which often rely on the radiative transfer calculated under clear (CF = 0) or overcast (CF = 100 %) conditions, thus enhancing the accuracy of the DSSR estimation under partially cloudy conditions (0 % < CF < 100 %). For our Arctic-wide validation experiments using data from stations, the root mean square error (RMSE) of our estimated DSSR compared to ground observations decreased by approximately 1.5 W m−2, and the bias decreased by 1.23 W m−2 compared to the CERES EBAF data, showing an 8.7 % improvement in the accuracy of the estimate. This accuracy improvement is even more pronounced at the Greenland stations, with an RMSE reduction of approximately 4.53 W m−2, representing an improvement of about 11.1 %, and a bias reduction of approximately 6.89 W m−2.
7.2 Development of spatiotemporal grid-based CRKs
To quantify cloud-induced surface radiative anomalies more accurately, we developed long-term gridded surface CF radiative kernels (GCF-CRKs) based on the function model related to the CF. By embedding spatiotemporal characteristics directly into the CRKs and using the observation parameters, this method significantly enhances the accuracy and computational efficiency of CRE estimation in the Arctic. Additionally, compared to existing methods, which decompose cloud layers and potentially overlook nonlinear effects, our approach directly calculates the radiative kernels for the entire cloud layer. This avoids the bias associated with the nonlinear effects in the layer-by-layer algorithm. Comparisons with other CRKs, including ISCCP-FH SFC CRKs and Zhou-CTP/CBP CRKs, reveal that all of the kernels have negative values with consistent spatiotemporal trends, and the magnitude can be regulated by the cloud optical depth (TAU) and cloud base pressure (CBP). The results confirm that our estimated kernels have better stability and increase the cooling effect of the CF in Greenland by approximately 0.5 W m−2 %−1.
7.3 Improved CRE estimation
By applying the developed GCF-CRKs and integrating high-precision CF data, this study provides a more accurate estimation of the CRE on the Arctic DSSR. We compared these estimates with the surface SWCRE calculated directly from the difference between the all-sky DSSR and clear-sky DSSR in the CERES EBAF data. The results indicate that the CRE is generally negative in the Arctic, and its intensity is strongly regulated by the solar radiation intensity, surface albedo, and cloud parameters (e.g., the CF, TAU, CTP, and CTT). The spatial distribution of the CRE calculated using the GCF-CRKs is consistent with that of the CRE obtained using the CERES EBAF data, but there are important distinctions. The original CERES EBAF data tend to underestimate the sensitivity of the CF in Greenland and overestimate it in perennial open waters and some land areas due to overestimation of the CF. Furthermore, Sen–Mann–Kendall trend analysis of the long-term data revealed that the surface SWCRE exhibits an increasing trend in the Arctic, suggesting that previous studies may have overestimated the cooling effect of clouds on Arctic surface shortwave radiation by 0.15–4 W m−2 and may have overestimated the cooling rate by 0.5 W m−2 per decade.
In summary, this study successfully demonstrates the development of a more computationally efficient and accurate method for estimating surface shortwave CRE in the Arctic by integrating high-precision CF data and improved DSSR estimates into spatiotemporal grid-based CRKs. The proposed approach provides significant advancements in our understanding of cloud radiative effects in the Arctic. This method has the potential to be extended to other regions with complex cloud systems, such as the tropics and mid-latitudes, where similar biases may exist in radiative kernel calculations. Moreover, the smaller interannual variation trend of the cloud radiative effect in this study suggests that the cooling effect of clouds in modulating Arctic warming has been overestimated in previous observations, implying that the actual rate of warming in the Arctic may be faster than previously thought. This has important implications for understanding polar amplification and its effects on global climate patterns, such as changes in sea ice extent, ocean circulation, and extreme weather events.
Despite these advancements, the study also identifies several limitations, including the coarse spatial and temporal resolution of the data and limited validation in marine areas. Moreover, the current method considers CF to be the sole perturbation variable, neglecting the synergistic effects of other cloud parameters such as cloud phase, vertical structure, and microphysical properties, which are essential for a comprehensive understanding of cloud radiative feedback mechanisms. Investigating the independent effects of individual cloud parameters, as well as the combined effects of multiple cloud parameters, will be a crucial direction for future research. Additionally, while this study has demonstrated the temporal stability of the proposed GCF-CRKs under current climate conditions, significant uncertainties remain regarding their stability in future climate scenarios. Utilizing climate models, such as those from the CMIP6, to simulate future changes in cloud properties under various climate scenarios and to assess their impacts on GCF-CRKs will be a key issue to address in future work.
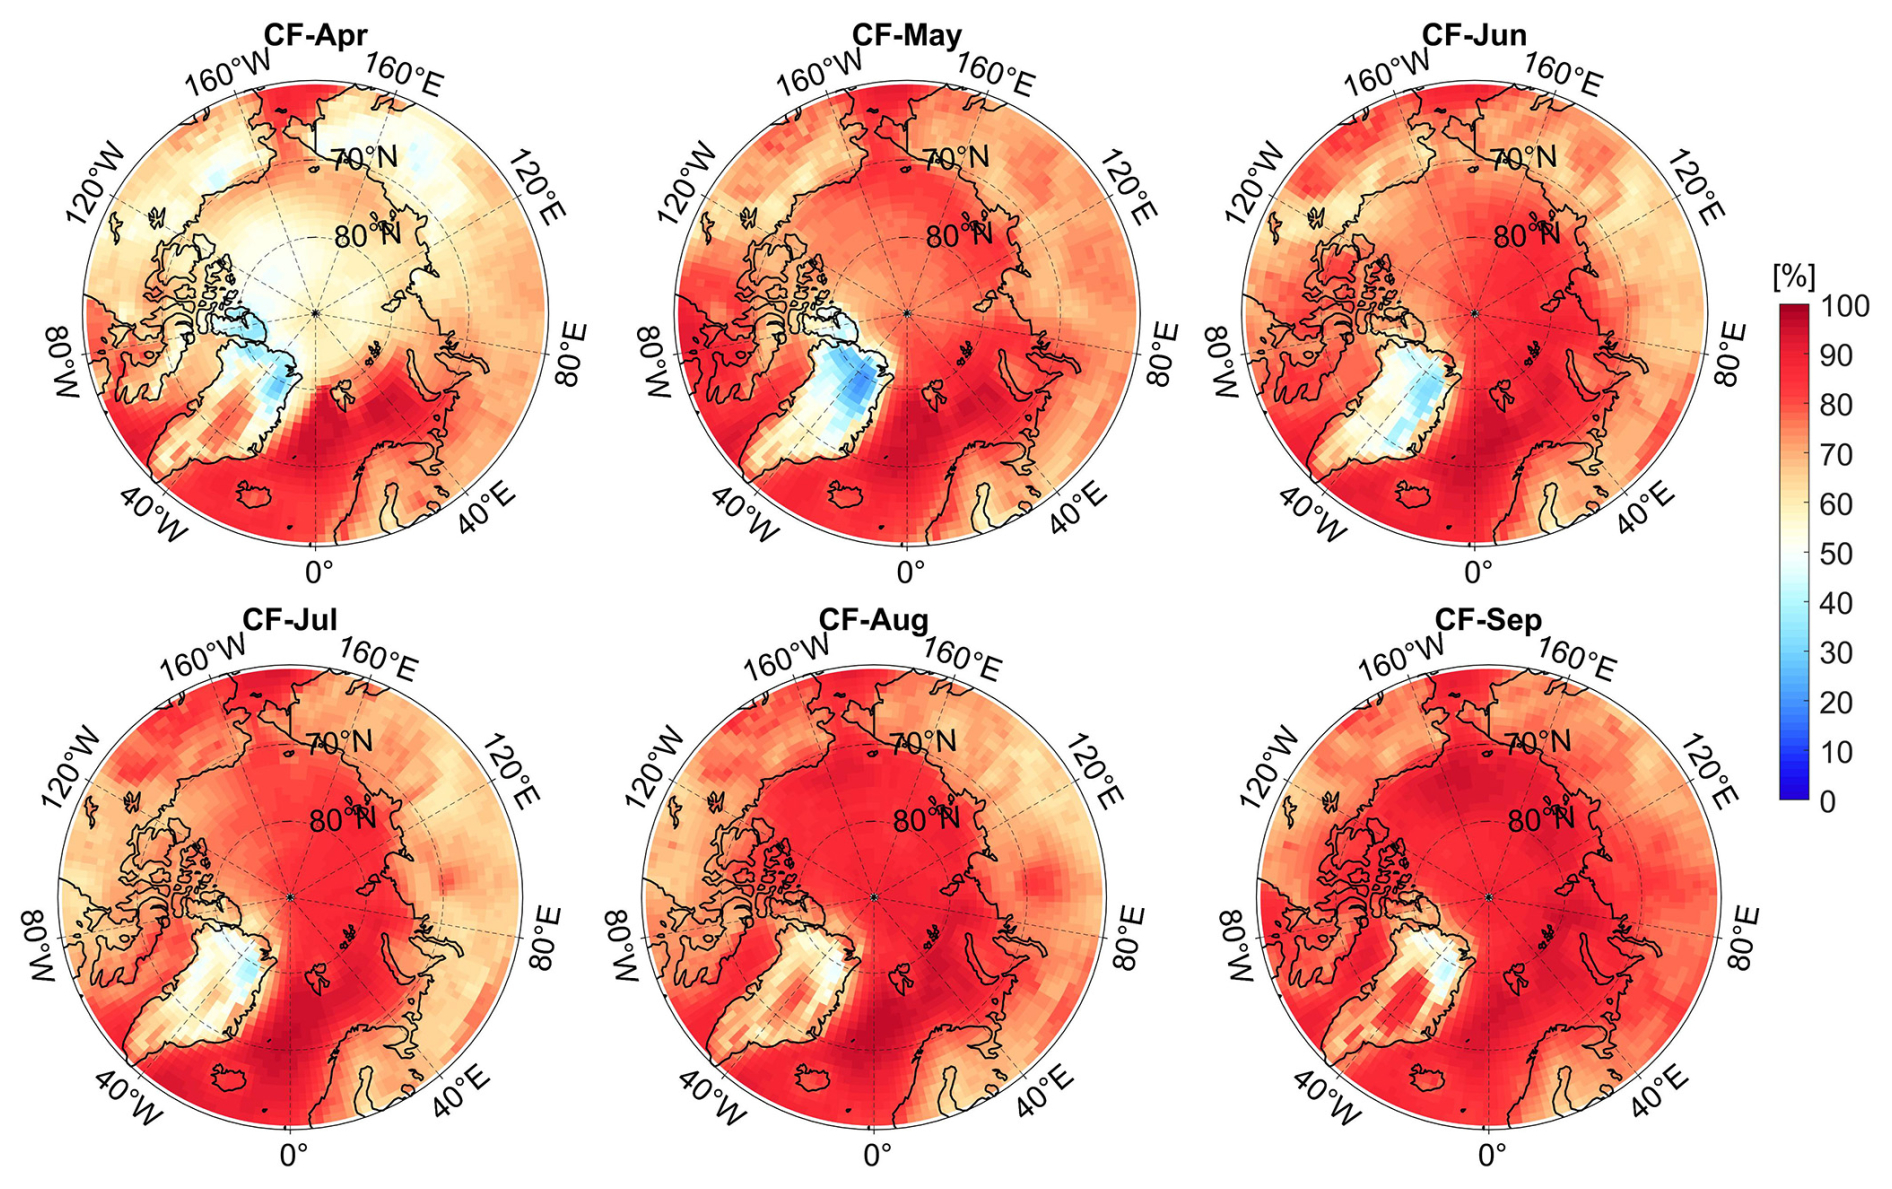
Figure A1The average monthly cloud fraction (CF) in the Arctic from April to September, 2000–2020.
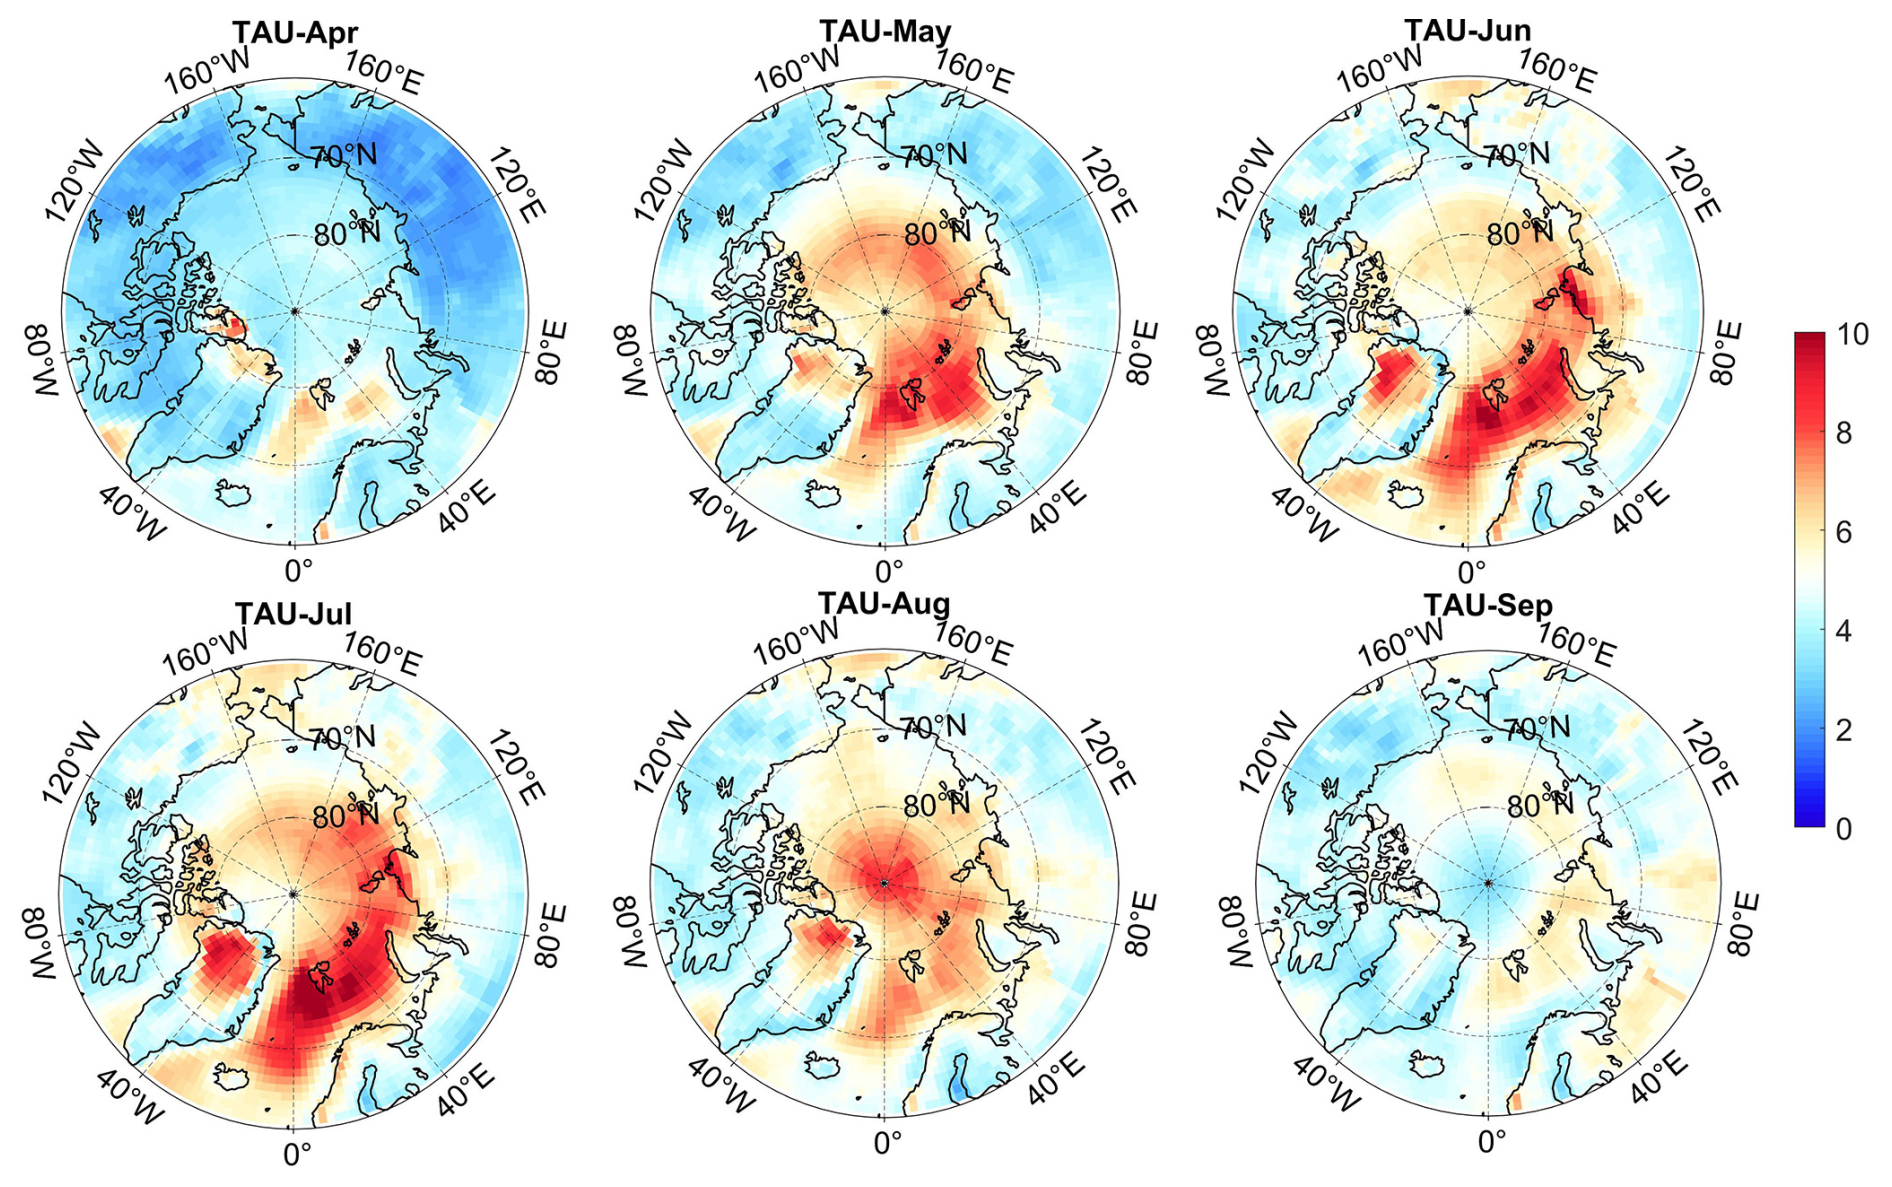
Figure A2The average monthly cloud optical depth (TAU) in the Arctic from April to September, 2000–2020.
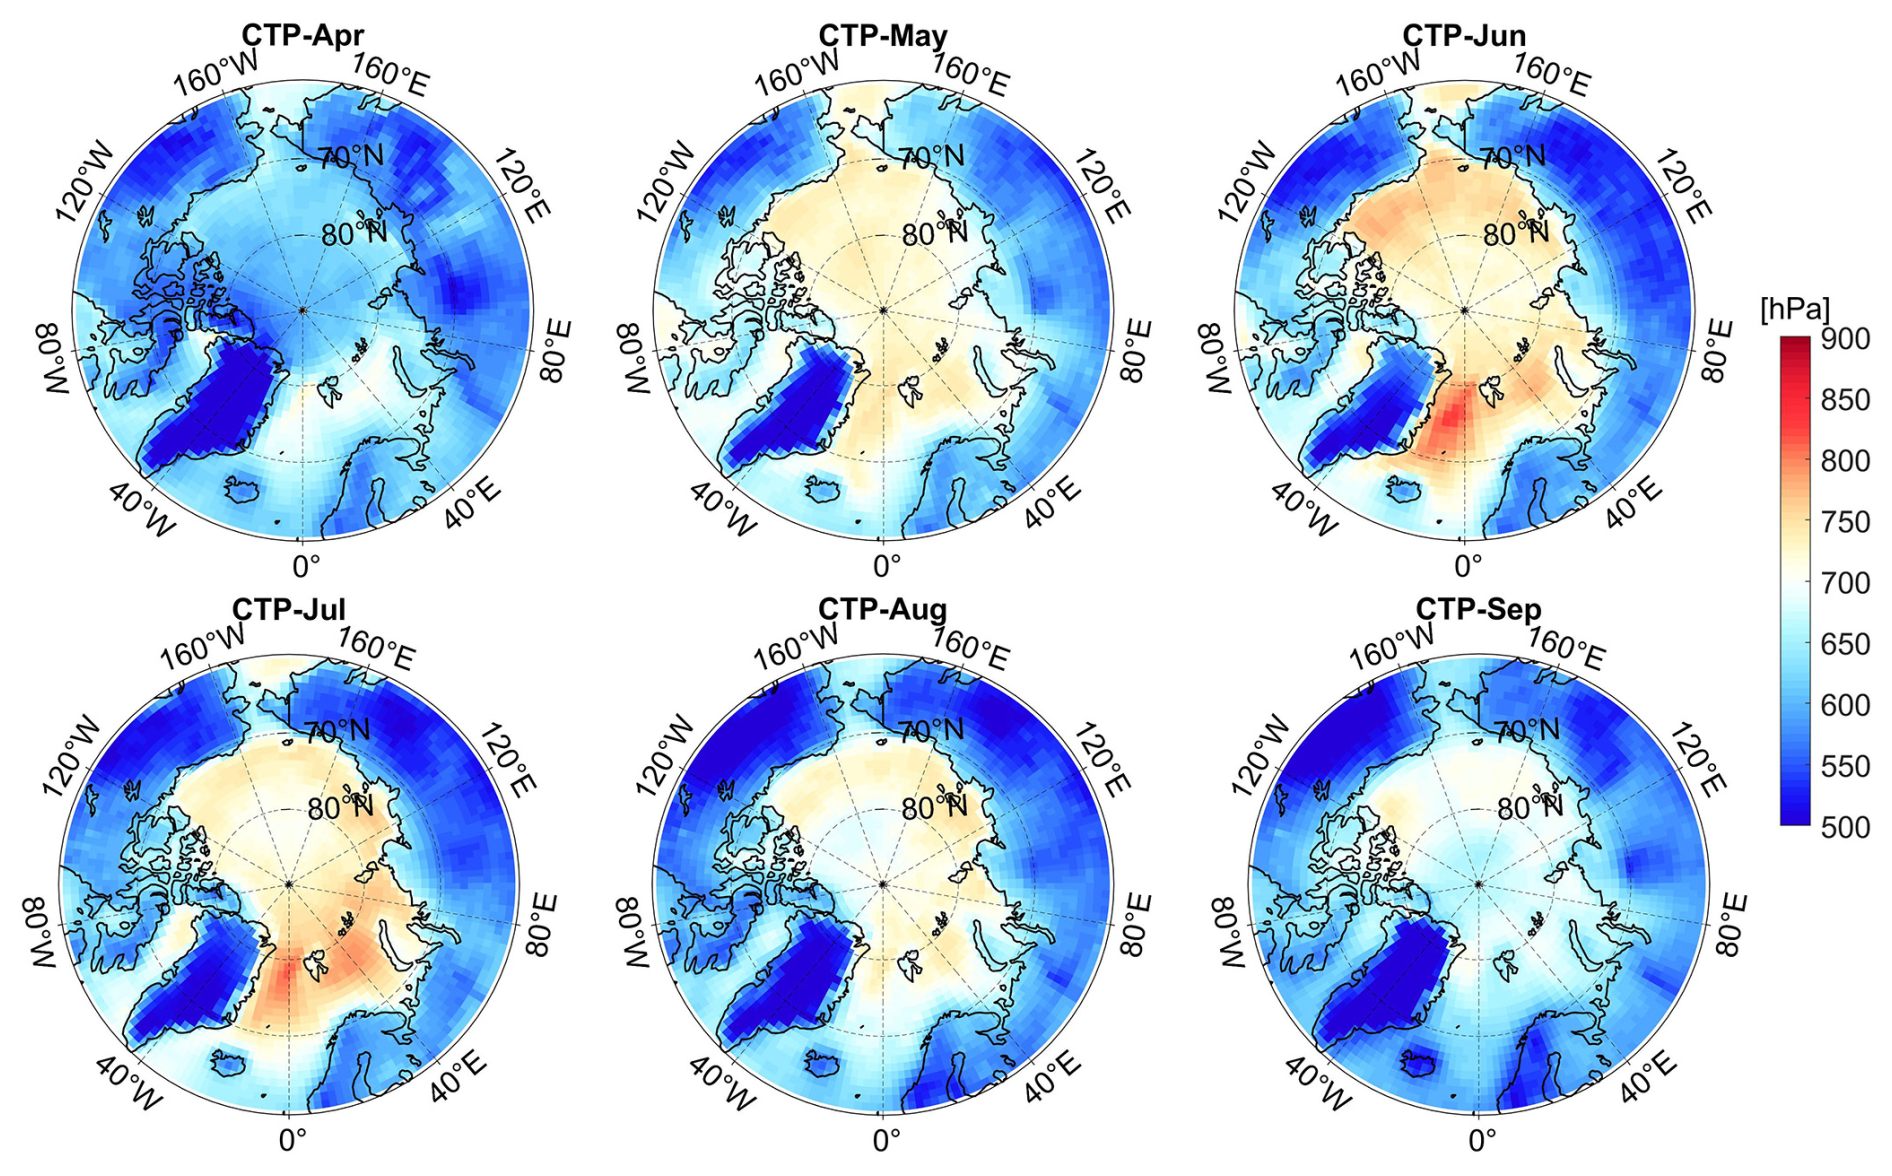
Figure A3The average monthly cloud top pressure (CTP) in the Arctic from April to September, 2000–2020.
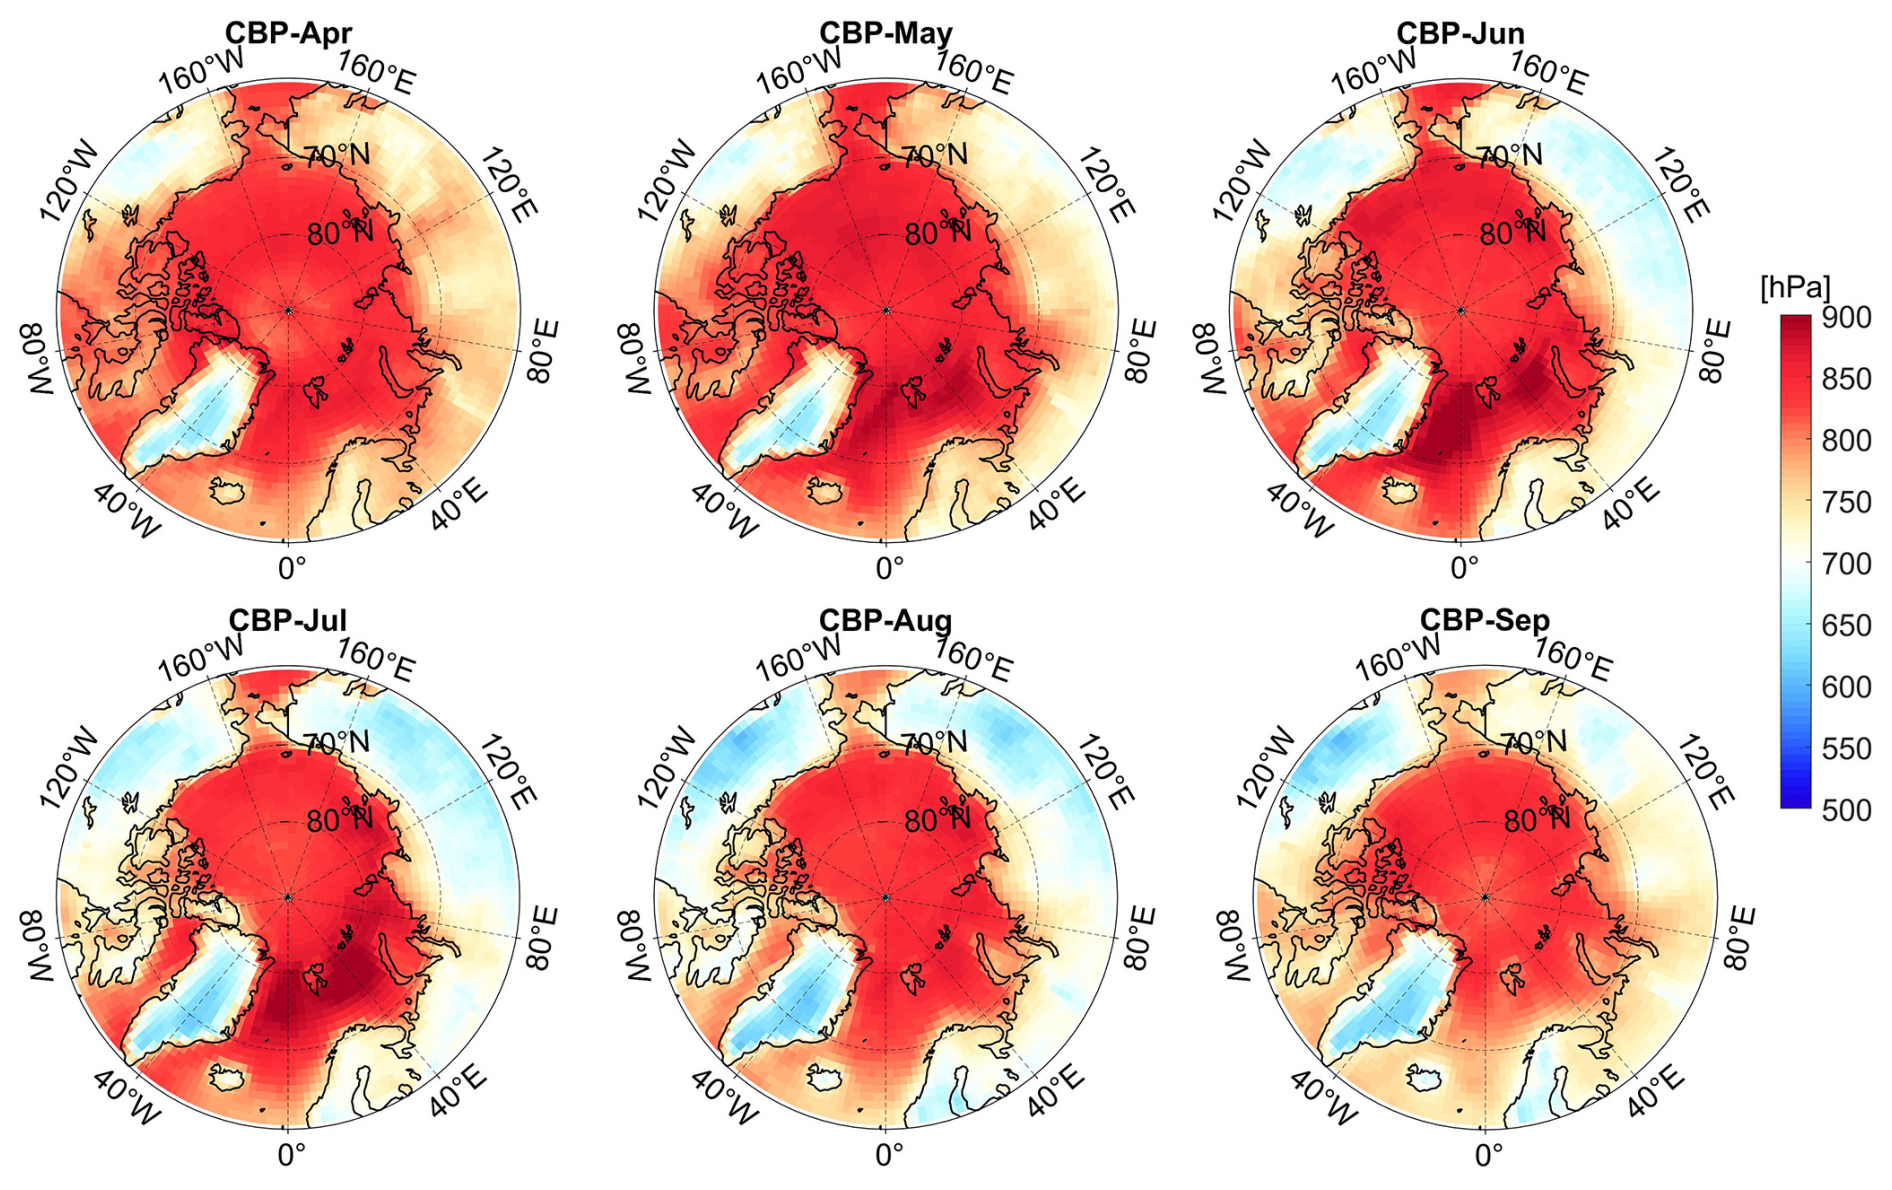
Figure A4The average monthly cloud base pressure (CBP) in the Arctic from April to September, 2000–2020.
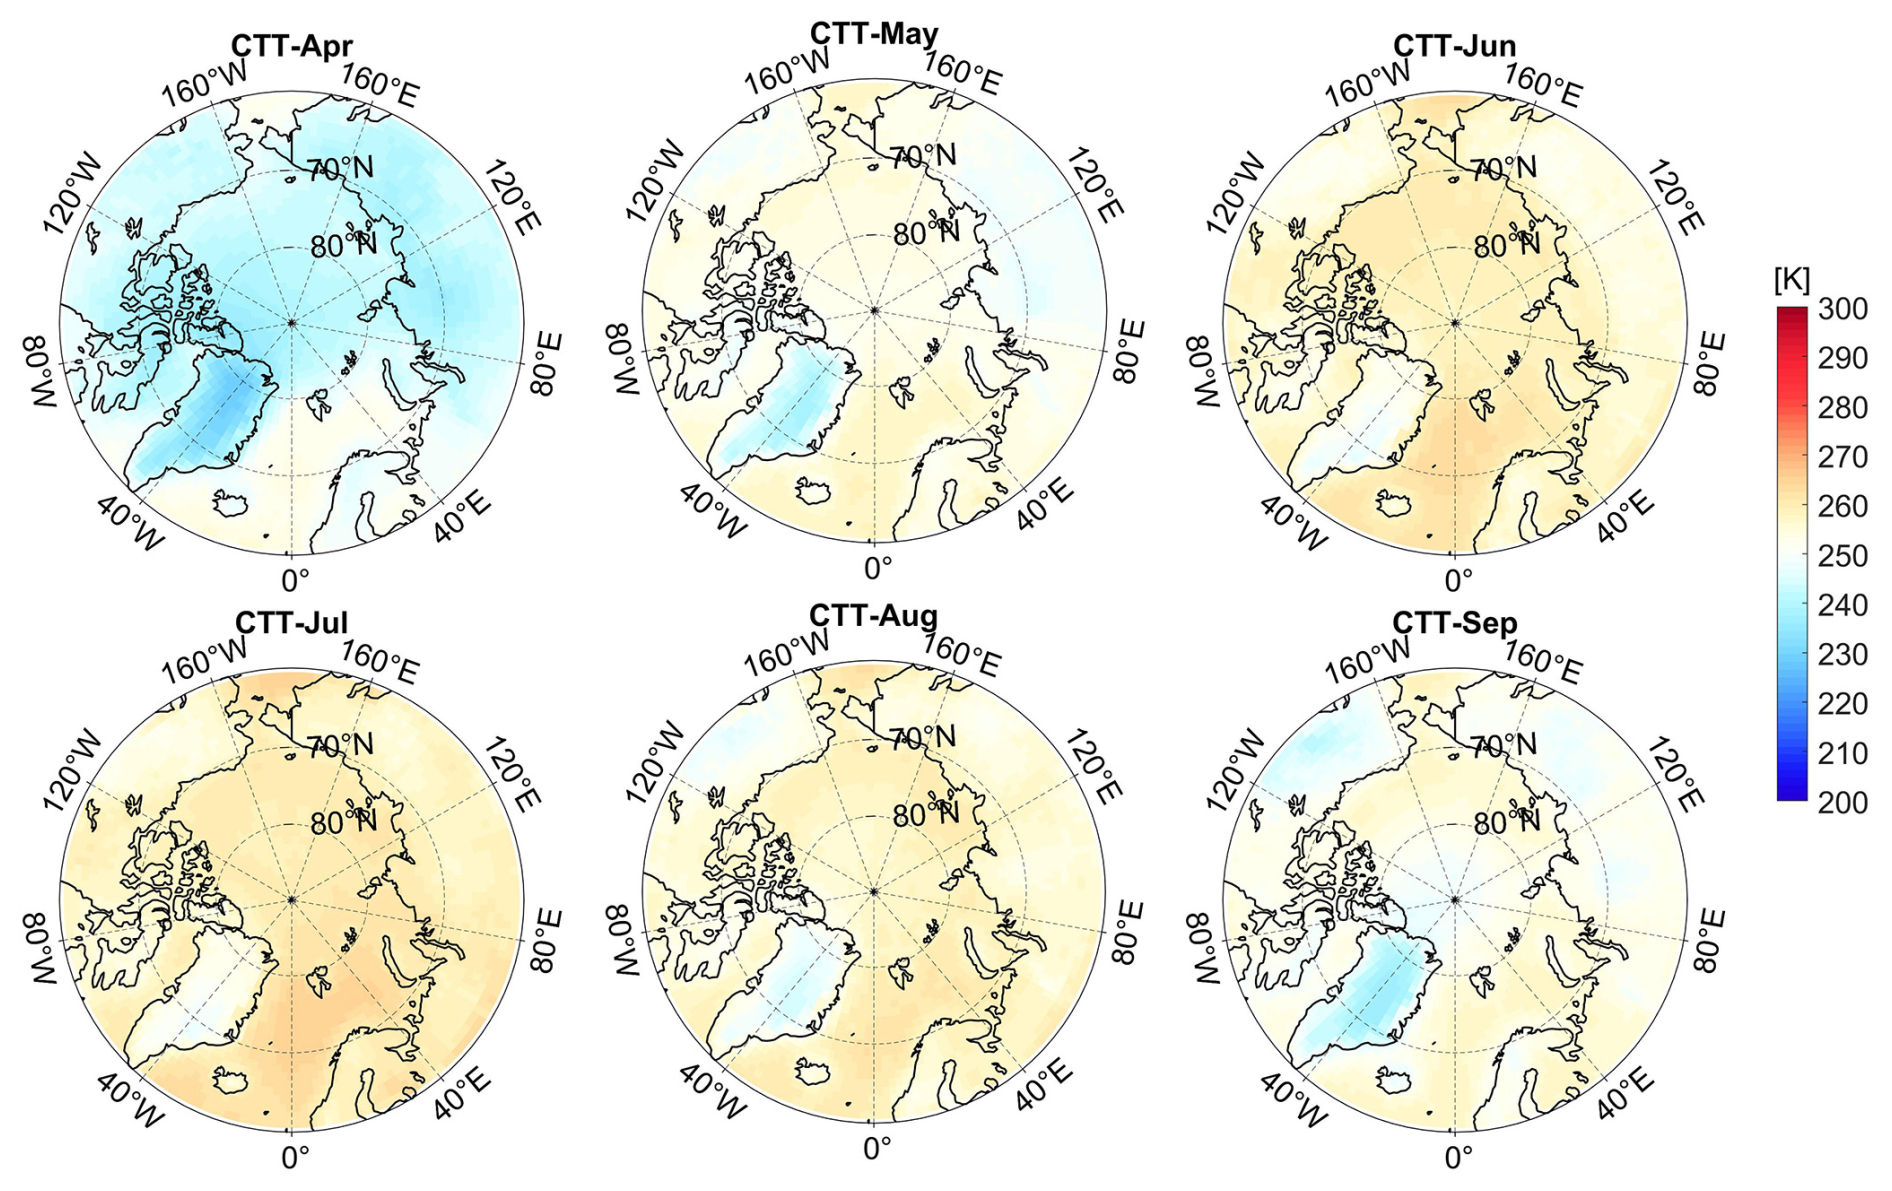
Figure A5The average monthly cloud top temperature (CTT) in the Arctic from April to September, 2000–2020.
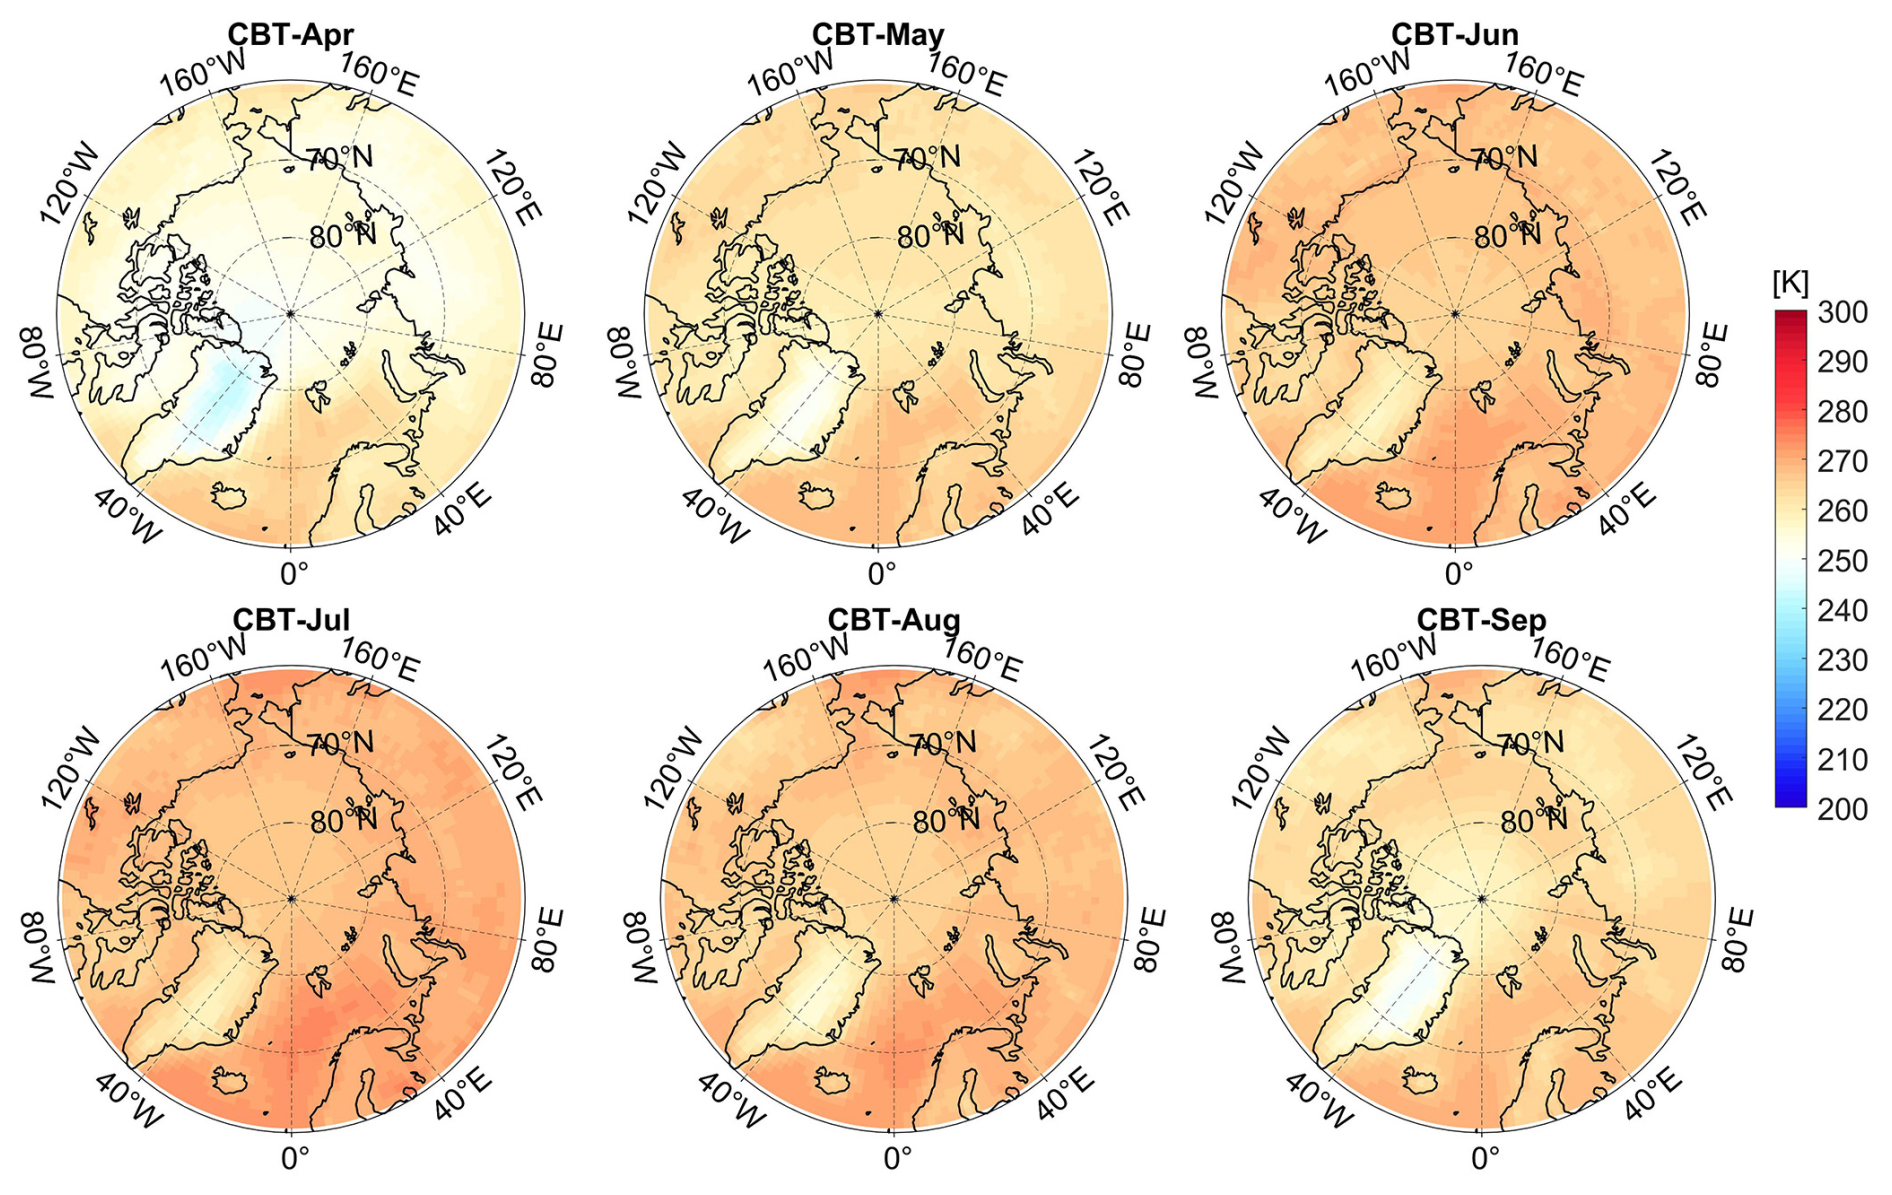
Figure A6The average monthly cloud base temperature (CBT) in the Arctic from April to September, 2000–2020.
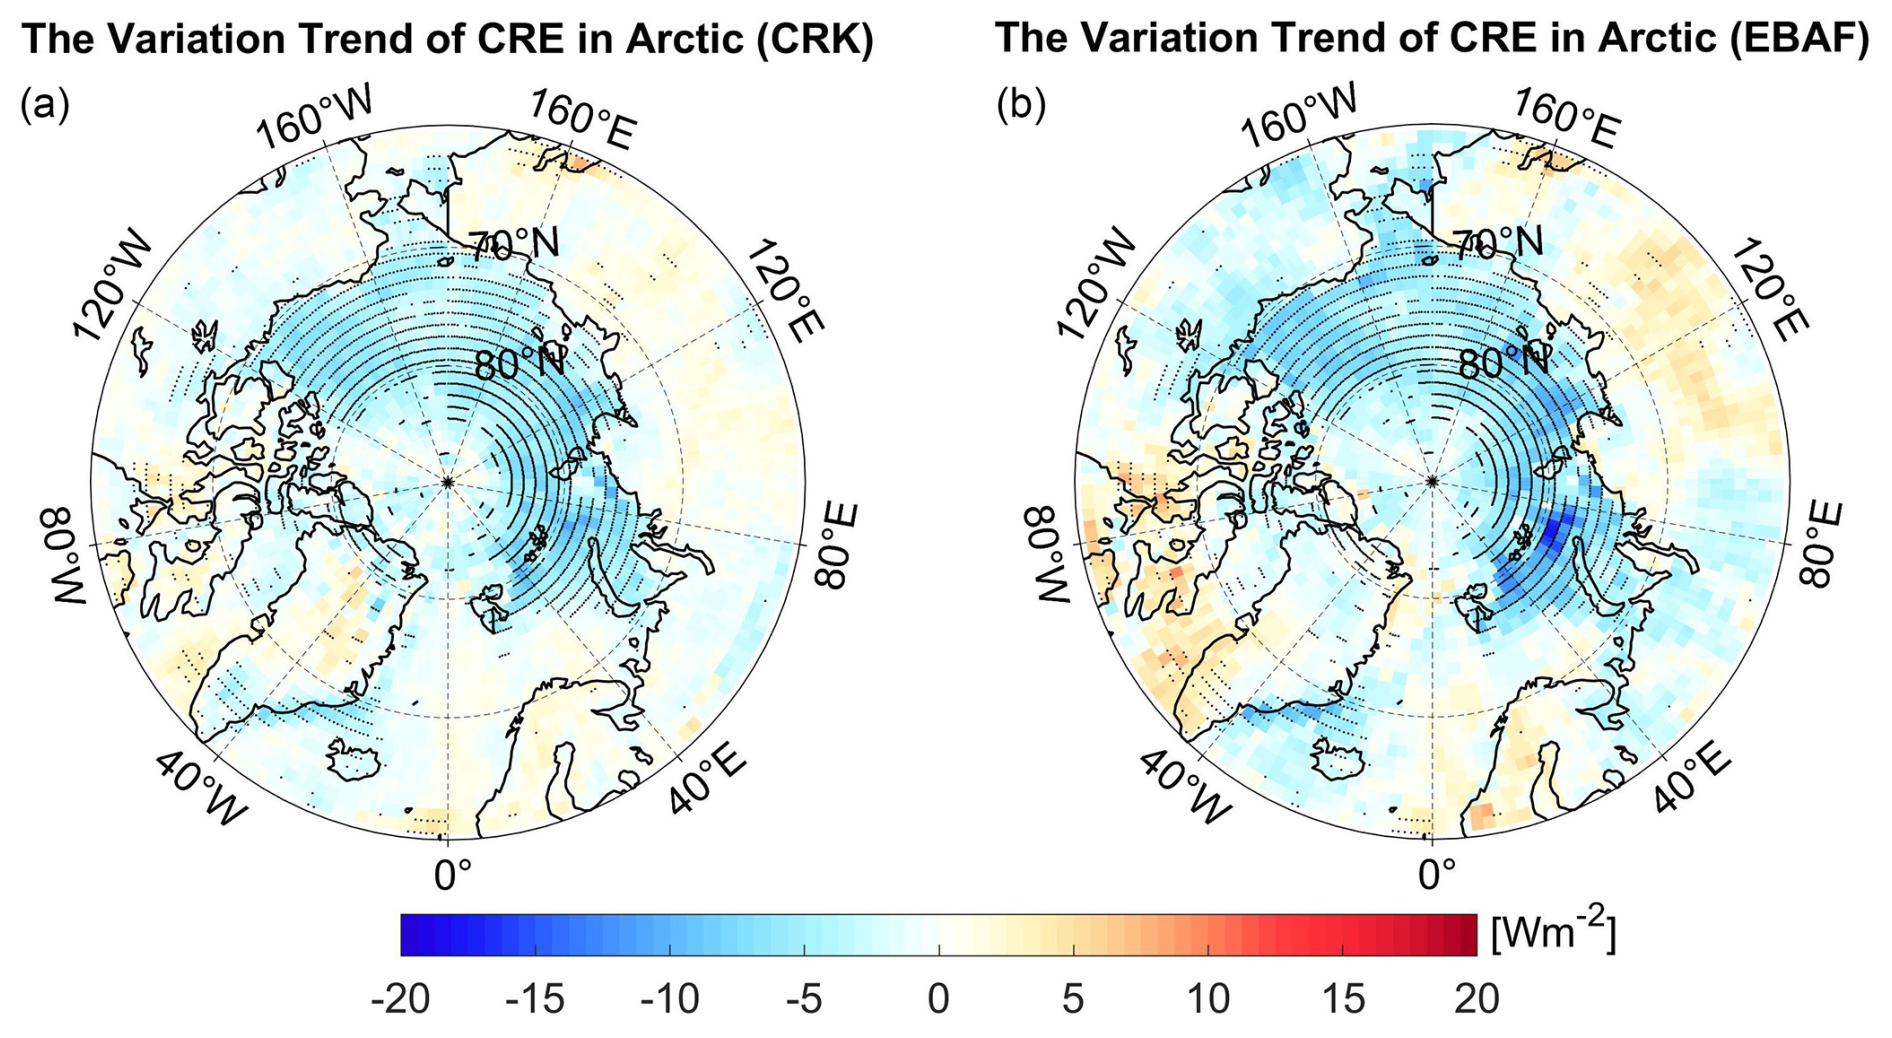
Figure B1The trend distribution of the shortwave cloud radiative effect (CRE) in the Arctic. Panel (a) is the CRE estimated by grid-specific surface cloud fraction (CF) radiative kernels and CF, and panel (b) represents the CRE estimated by the CERES EBAF downwelling surface shortwave radiation differences under all-sky and clear-sky conditions. The black area shows significance at the 95 % confidence level.
XL: conceptualization, data curation, methodology, writing (original draft), investigation, visualization, funding acquisition. TH: conceptualization, methodology, writing (review and editing), supervision, funding acquisition. QW and XX: methodology, writing (review and editing). YW and SL: data curation. YM, LD, and ZW: writing (review and editing).
The contact author has declared that none of the authors has any competing interests.
Publisher's note: Copernicus Publications remains neutral with regard to jurisdictional claims made in the text, published maps, institutional affiliations, or any other geographical representation in this paper. While Copernicus Publications makes every effort to include appropriate place names, the final responsibility lies with the authors.
We thank the relevant teams and organizations for providing the datasets used in this study. The data used for this paper have been provided by the NASA Langley Research Center Atmospheric Science Data Center (ASDC). The ground data were provided by AmeriFlux, FluxNet, the Global Energy Balance Archive (GEBA), and the Programme for Monitoring of the Greenland Ice Sheet (PROMICE). We greatly appreciate the constructive comments from the anonymous reviewers and the editorial team that helped us improve our paper.
We also acknowledge the use of LetPub (http://www.letpub.com.cn, last access: 30 August 2024) for linguistic assistance during the preparation of this paper.
This research has been supported by the Youth Program of Henan Provincial Natural Science Foundation (grant no. 252300420853), the Basic Foundation for Scientific Research of the Henan Academy of Sciences (grant no. 240625003), the National Natural Science Foundation of China (grant no. 42090012), the Scientific Research Foundation of the Henan Academy of Sciences (grant no. 241825014), the Natural Science Foundation of Hubei Province (grant no. 2025AFD419), the Henan Provincial Joint Fund for Science and Technology Development (grant no. 235200810069), and the Scientific Research Foundation for High-End Talents of the Henan Academy of Sciences (grant no. 242025005).
This paper was edited by Jing Wei and reviewed by three anonymous referees.
Ahlstrom, A. and PROMICE project team: Programme for Monitoring of the Greenland Ice Sheet (PROMICE), Geol. Surv. Den. Greenl., 15, 61–64, 2011.
Baek, E.-H., Kim, J.-H., Park, S., Kim, B.-M., and Jeong, J.-H.: Impact of poleward heat and moisture transports on Arctic clouds and climate simulation, Atmos. Chem. Phys., 20, 2953–2966, https://doi.org/10.5194/acp-20-2953-2020, 2020.
Betts, A. K. and Viterbo, P.: Land‐surface, boundary layer, and cloud‐field coupling over the southwestern Amazon in ERA‐40, J. Geophys. Res.-Atmos., 110, D14108, https://doi.org/10.1029/2004jd005702, 2005.
Boeke, R. C. and Taylor, P. C.: Evaluation of the Arctic surface radiation budget in CMIP5 models, J. Geophys. Res.-Atmos., 121, 8525–8548, https://doi.org/10.1002/2016jd025099, 2016.
Boucher, O., Randall, D. D., Artaxo, P., Bretherton, C., Feingold, G., Forster, P., Kerminen, V.-M., Kondo, Y., Liao, H., Lohmann, U., Rasch, P., Satheesh, S. K., Sherwood, S., Stevens, B., and Zhang, X. Y.: Clouds and Aerosols, in: Climate Change 2013: The Physical Science Basis. Contribution of Working Group I to the Fifth Assessment Report of the Intergovernmental Panel on Climate Change, edited by: Stocker, T. F., Qin, D., Plattner, G.-K., Tignor, M., Allen, S. K., Boschung, J., Nauels, A., Xia, Y., Bex, V., and Midgley, P. M., Cambridge University Press, Cambridge, United Kingdom and New York, NY, USA, 571–658, https://doi.org/10.1017/CBO9781107415324.016, 2013.
Cai, B. F. and Yu, R.: Advance and evaluation in the long time series vegetation trends research based on remote sensing, J. Remote Sens., 13, 1170–1186, 2009.
Cao, Y. and Liang, S.: Recent advances in driving mechanisms of the Arctic amplification: A review, Chinese Sci. Bull., 63, 2757–2771, https://doi.org/10.1360/n972018-00462, 2018.
Cess, R. D. and Potter, G. L.: Exploratory studies of cloud radiative forcing with a general circulation model, Tellus A, 39, 460–473, 1987.
Chen, J., He, T., Jiang, B., and Liang, S.: Estimation of all-sky all-wave daily net radiation at high latitudes from MODIS data, Remote Sens. Environ., 245, 111842, https://doi.org/10.1016/j.rse.2020.111842, 2020.
Chen, T., Rossow, W. B., and Zhang, Y.: Radiative Effects of Cloud-Type Variations, J. Climate, 13, 264–286, https://doi.org/10.1175/1520-0442(2000)013<0264:REOCTV>2.0.CO;2, 2000.
Christensen, M. W., Behrangi, A., L'Ecuyer, T. S., Wood, N. B., Lebsock, M. D., and Stephens, G. L.: Arctic Observation and Reanalysis Integrated System: A New Data Product for Validation and Climate Study, B. Am. Meteorol. Soc., 97, 907–916, https://doi.org/10.1175/bams-d-14-00273.1, 2016.
Colman, R. A.: Climate radiative feedbacks and adjustments at the Earth's surface, J. Geophys. Res.-Atmos., 120, 3173–3182, 2015.
English, J. M., Gettelman, A., and Henderson, G. R.: Arctic Radiative Fluxes: Present-Day Biases and Future Projections in CMIP5 Models, J. Climate, 28, 6019–6038, https://doi.org/10.1175/jcli-d-14-00801.1, 2015.
Gautier, C. and Landsfeld, M.: Surface solar radiation flux and cloud radiative forcing for the atmospheric radiation measurement (ARM) southern great plains (SGP): A satellite, surface observations, and radiative transfer model study, J. Atmos. Sci., 54, 1289–1307, https://doi.org/10.1175/1520-0469(1997)054<1289:Ssrfac>2.0.Co;2, 1997.
Goosse, H., Kay, J. E., Armour, K. C., Bodas-Salcedo, A., Chepfer, H., Docquier, D., Jonko, A., Kushner, P. J., Lecomte, O., Massonnet, F., Park, H.-S., Pithan, F., Svensson, G., and Vancoppenolle, M.: Quantifying climate feedbacks in polar regions, Nat. Commun., 9, 1919, https://doi.org/10.1038/s41467-018-04173-0, 2018.
Hahn, C. J., Rossow, W. B., and Warren, S. G.: ISCCP cloud properties associated with standard cloud types identified in individual surface observations, J. Climate, 14, 11–28, https://doi.org/10.1175/1520-0442(2001)014<0011:Icpaws>2.0.Co;2, 2001.
Hakuba, M. Z., Folini, D., Wild, M., Long, C. N., Schaepman-Strub, G., and Stephens, G. L.: Cloud effects on atmospheric solar absorption in light of most recent surface and satellite measurements, AIP Conf. Proc., 1810, 090003, https://doi.org/10.1063/1.4975543, 2017.
Hartmann, D. L. and Ceppi, P.: Clouds and the Atmospheric Circulation Response to Warming, J. Climate, 29, 783–799, https://doi.org/10.1175/jcli-d-15-0394.1, 2016.
He, M., Hu, Y., Chen, N., Wang, D., Huang, J., and Stamnes, K.: High cloud coverage over melted areas dominates the impact of clouds on the albedo feedback in the Arctic, Sci. Rep., 9, 9529, https://doi.org/10.1038/s41598-019-44155-w, 2019.
Huang, G., Liang, S., Lu, N., Ma, M., and Wang, D.: Toward a Broadband Parameterization Scheme for Estimating Surface Solar Irradiance: Development and Preliminary Results on MODIS Products, J. Geophys. Res.-Atmos., 123, 12180–12193, https://doi.org/10.1029/2018jd028905, 2018.
Huang, Y., Dong, X., Xi, B., Dolinar, E. K., and Stanfield, R. E.: The footprints of 16 year trends of Arctic springtime cloud and radiation properties on September sea ice retreat, J. Geophys. Res.-Atmos., 122, 2179–2193, https://doi.org/10.1002/2016JD026020, 2017a.
Huang, Y. Y., Dong, X. Q., Xi, B. K., Dolinar, E. K., Stanfield, R. E., and Qiu, S. Y.: Quantifying the Uncertainties of Reanalyzed Arctic Cloud and Radiation Properties Using Satellite Surface Observations, J. Climate, 30, 8007–8029, https://doi.org/10.1175/Jcli-D-16-0722.1, 2017b.
Inamdar, A. K. and Guillevic, P. C.: Net Surface Shortwave Radiation from GOES Imagery-Product Evaluation Using Ground-Based Measurements from SURFRAD, Remote Sens., 7, 10788–10814, https://doi.org/10.3390/rs70810788, 2015.
IPCC: Climate Change 2021: The Physical Science Basis, Contribution of Working Group I to the Sixth Assessment Report of the Intergovernmental Panel on Climate Change, edited by: Masson-Delmotte, V., Zhai, P., Pirani, A., Connors, S. L., Péan, C., Berger, S., Caud, N., Chen, Y., Goldfarb, L., Gomis, M. I., Huang, M., Leitzell, K., Lonnoy, E., Matthews, J. B. R., Maycock, T. K., Waterfield, T., Yelekçi, O., Yu, R., and Zhou, B., Cambridge University Press, Cambridge, United Kingdom and New York, NY, USA, https://doi.org/10.1017/9781009157896, 2021.
IPCC: Climate Change 2022: Impacts, Adaptation, and Vulnerability. Contribution of Working Group II to the Sixth Assessment Report of the Intergovernmental Panel on Climate Change, edited by: Pörtner, H.-O., Roberts, D. C., Tignor, M., Poloczanska, E. S., Mintenbeck, K., Alegría, A., Craig, M., Langsdorf, S., Löschke, S., Möller, V., Okem, A., and Rama, B., Cambridge University Press, Cambridge University Press, Cambridge, UK and New York, NY, USA, 3056 pp., https://doi.org/10.1017/9781009325844, 2022.
Jia, A., Jiang, B., Liang, S., Zhang, X., and Ma, H.: Validation and Spatiotemporal Analysis of CERES Surface Net Radiation Product, Remote Sens., 8, 90, https://doi.org/10.3390/rs8020090, 2016.
Jia, A., Liang, S., Jiang, B., Zhang, X., and Wang, G.: Comprehensive Assessment of Global Surface Net Radiation Products and Uncertainty Analysis, J. Geophys. Res.-Atmos., 123, 1970–1989, https://doi.org/10.1002/2017jd027903, 2018.
Jiang, B., Zhang, Y., Liang, S., Wohlfahrt, G., Arain, A., Cescatti, A., Georgiadis, T., Jia, K., Kiely, G., Lund, M., Montagnani, L., Magliulo, V., Serrano Ortiz, P., Oechel, W., Vaccari, F. P., Yao, Y., and Zhang, X.: Empirical estimation of daytime net radiation from shortwave radiation and ancillary information, Agr, Forest Meteorol,, 211, 23–36, https://doi.org/10.1016/j.agrformet.2015.05.003, 2015.
Karlsson, K.-G. and Devasthale, A.: Inter-Comparison and Evaluation of the Four Longest Satellite-Derived Cloud Climate Data Records: CLARA-A2, ESA Cloud CCI V3, ISCCP-HGM, and PATMOS-x, Remote Sens., 10, 1567, https://doi.org/10.3390/rs10101567, 2018.
Kato, S., Rose, F. G., Sun-Mack, S., Miller, W. F., Chen, Y., Rutan, D. A., Stephens, G. L., Loeb, N. G., Minnis, P., Wielicki, B. A., Winker, D. M., Charlock, T. P., Stackhouse, P. W., Xu, K.-M., and Collins, W. D.: Improvements of top-of-atmosphere and surface irradiance computations with CALIPSO-, CloudSat-, and MODIS-derived cloud and aerosol properties, J. Geophys. Res., 116, D19209, https://doi.org/10.1029/2011jd016050, 2011.
Kato, S., Loeb, N. G., Rutan, D. A., Rose, F. G., Sun-Mack, S., Miller, W. F., and Chen, Y.: Uncertainty Estimate of Surface Irradiances Computed with MODIS-, CALIPSO-, and CloudSat-Derived Cloud and Aerosol Properties, Surv. Geophys., 33, 395–412, https://doi.org/10.1007/s10712-012-9179-x, 2012.
Kato, S., Rose, F. G., Rutan, D. A., Thorsen, T. J., Loeb, N. G., Doelling, D. R., Huang, X. L., Smith, W. L., Su, W. Y., and Ham, S. H.: Surface Irradiances of Edition 4.0 Clouds and the Earth's Radiant Energy System (CERES) Energy Balanced and Filled (EBAF) Data Product, J. Climate, 31, 4501–4527, https://doi.org/10.1175/Jcli-D-17-0523.1, 2018.
Kay, J. E. and L'Ecuyer, T.: Observational constraints on Arctic Ocean clouds and radiative fluxes during the early 21st century, J. Geophys. Res.-Atmos., 118, 7219–7236, https://doi.org/10.1002/jgrd.50489, 2013.
Kim, D. and Ramanathan, V.: Solar radiation budget and radiative forcing due to aerosols and clouds, J. Geophys. Res., 113, D02203, https://doi.org/10.1029/2007jd008434, 2008.
Kramer, R. J., Matus, A. V., Soden, B. J., and L'Ecuyer, T. S.: Observation-Based Radiative Kernels From CloudSat CALIPSO, J. Geophys. Res.-Atmos., 124, 5431–5444, https://doi.org/10.1029/2018JD029021, 2019.
Laine, V.: Arctic sea ice regional albedo variability and trends, 1982–1998, J. Geophys. Res.-Oceans, 109, C06027, https://doi.org/10.1029/2003JC001818, 2004.
Letu, H., Yang, K., Nakajima, T. Y., Ishimoto, H., Nagao, T. M., Riedi, J., Baran, A. J., Ma, R., Wang, T., Shang, H., Khatri, P., Chen, L., Shi, C., and Shi, J.: High-resolution retrieval of cloud microphysical properties and surface solar radiation using Himawari-8/AHI next-generation geostationary satellite, Remote Sens. Environ., 239, 111583, https://doi.org/10.1016/j.rse.2019.111583, 2020.
Li, Y., Chang, L., and Zhang, C.: Spatial distribution of cloud attributes in spring and its influence on Arctic sea ice decline, Chinese Journal of Polar Research, 34, 177–188, https://doi.org/10.13679/j.jdyj.20210006, 2022.
Liu, X.: Arctic Gridded surface cloud fraction radiative kernels (GCF-CRKs) (1.0), Zenodo [data set], https://doi.org/10.5281/zenodo.13907217, 2024.
Liu, X. and He, T.: A long-term monthly dataset of cloud fraction over the Arctic based on multiple satellite products using cumulative distribution function matching and Bayesian maximum entropy, Zenodo [data set], https://doi.org/10.5281/zenodo.7478918, 2022.
Liu, X., He, T., Sun, L., Xiao, X., Liang, S., and Li, S.: Analysis of Daytime Cloud Fraction Spatiotemporal Variation over the Arctic from 2000 to 2019 from Multiple Satellite Products, J. Climate, 35, 3995–4023, https://doi.org/10.1175/jcli-d-22-0007.1, 2022.
Liu, X., He, T., Liang, S., Li, R., Xiao, X., Ma, R., and Ma, Y.: A monthly 1° resolution dataset of daytime cloud fraction over the Arctic during 2000–2020 based on multiple satellite products, Earth Syst. Sci. Data, 15, 3641–3671, https://doi.org/10.5194/essd-15-3641-2023, 2023.
Liu, Y., Shi, G., and Zhao, J.: A Study of the Radiative Forcing of Clouds by Using a One-Dimensional Radiative-Convective Model, Chinese Journal of Atmospheric Sciences, 31, 486–494, http://www.iapjournals.ac.cn/dqkx/en/article/doi/10.3878/j.issn.1006-9895.2007.03.12 (last access: 28 May 2025), 2007.
Liu, Y., Ackerman, S. A., Maddux, B. C., Key, J. R., and Frey, R. A.: Errors in Cloud Detection over the Arctic Using a Satellite Imager and Implications for Observing Feedback Mechanisms, J. Climate, 23, 1894–1907, https://doi.org/10.1175/2009jcli3386.1, 2010.
Liu, Y., Wu, W., Jensen, M. P., and Toto, T.: Relationship between cloud radiative forcing, cloud fraction and cloud albedo, and new surface-based approach for determining cloud albedo, Atmos. Chem. Phys., 11, 7155–7170, https://doi.org/10.5194/acp-11-7155-2011, 2011.
Loeb, N., Thorsen, T., Norris, J., Wang, H., and Su, W.: Changes in Earth's Energy Budget during and after the “Pause” in Global Warming: An Observational Perspective, Climate, 6, 62, https://doi.org/10.3390/cli6030062, 2018a.
Loeb, N. G., Doelling, D. R., Wang, H., Su, W., Nguyen, C., Corbett, J. G., Liang, L., Mitrescu, C., Rose, F. G., and Kato, S.: Clouds and the Earth's Radiant Energy System (CERES) Energy Balanced and Filled (EBAF) Top-of-Atmosphere (TOA) Edition-4.0 Data Product, J. Climate, 31, 895–918, https://doi.org/10.1175/jcli-d-17-0208.1, 2018b.
Loeb, N. G., Wang, H., Rose, F. G., Kato, S., Smith Jr., W. L., and Sun-Mack, S.: Decomposing Shortwave Top-of-Atmosphere and Surface Radiative Flux Variations in Terms of Surface and Atmospheric Contributions, J. Climate, 32, 5003–5019, https://doi.org/10.1175/jcli-d-18-0826.1, 2019.
Norris, J. R. and Evan, A. T.: Empirical Removal of Artifacts from the ISCCP and PATMOS-x Satellite Cloud Records, J. Atmos. Ocean. Tech., 32, 691–702, https://doi.org/10.1175/Jtech-D-14-00058.1, 2015.
Pinker, R. T., Zhang, B., and Dutton, E. G.: Do satellites detect trends in surface solar radiation?, Science, 308, 850–854, https://doi.org/10.1126/science.1103159, 2005.
Ramanathan, V., Cess, R. D., Harrison, E. F., Minnis, P., Barkstrom, B. R., Ahmad, E., and Hartmann, D.: Cloud-radiative forcing and climate: results from the Earth radiation budget experiment, Science, 243, 57–63, https://doi.org/10.1126/science.243.4887.57, 1989.
Randall, D. A., Coakley, J. A., Fairall, C. W., Kropfli, R. A., and Lenschow, D. H.: Outlook For Research On Sub-Tropical Marine Stratiform Clouds, B. Am. Meteorol. Soc., 65, 1290–1301, https://doi.org/10.1175/1520-0477(1984)065<1290:Ofrosm>2.0.Co;2, 1984.
Roesch, A., Wild, M., Ohmura, A., Dutton, E. G., Long, C. N., and Zhang, T.: Assessment of BSRN radiation records for the computation of monthly means, Atmos. Meas. Tech., 4, 339–354, https://doi.org/10.5194/amt-4-339-2011, 2011.
Sedlar, J., Tjernström, M., Mauritsen, T., Shupe, M. D., Brooks, I. M., Persson, P. O. G., Birch, C. E., Leck, C., Sirevaag, A., and Nicolaus, M.: A transitioning Arctic surface energy budget: the impacts of solar zenith angle, surface albedo and cloud radiative forcing, Clim. Dynam., 37, 1643–1660, https://doi.org/10.1007/s00382-010-0937-5, 2010.
Sledd, A. and L'Ecuyer, T.: How Much Do Clouds Mask the Impacts of Arctic Sea Ice and Snow Cover Variations? Different Perspectives from Observations and Reanalyses, Atmosphere, 10, 12, https://doi.org/10.3390/atmos10010012, 2019.
Sledd, A. and L'Ecuyer, T. S.: Emerging Trends in Arctic Solar Absorption, Geophys. Res. Lett., 48, e2021GL095813, https://doi.org/10.1029/2021GL095813, 2021.
Slingo, A.: Sensitivity of the Earth's radiation budget to changes in low clouds, Nature, 343, 49–51, https://doi.org/10.1038/343049a0, 1990.
Soden, B. J., Held, I. M., Colman, R., Shell, K. M., Kiehl, J. T., and Shields, C. A.: Quantifying Climate Feedbacks Using Radiative Kernels, J. Climate, 21, 3504–3520, https://doi.org/10.1175/2007jcli2110.1, 2008.
Stephens, G. L.: Cloud feedbacks in the climate system: A critical review, J. Climate, 18, 237–273, https://doi.org/10.1175/Jcli-3243.1, 2005.
Storelvmo, T., Tan, I., and Korolev, A. V.: Cloud Phase Changes Induced by CO2 Warming – a Powerful yet Poorly Constrained Cloud-Climate Feedback, Current Climate Change Reports, 1, 288–296, https://doi.org/10.1007/s40641-015-0026-2, 2015.
Tang, Q. and Leng, G.: Changes in Cloud Cover, Precipitation, and Summer Temperature in North America from 1982 to 2009, J. Climate, 26, 1733–1744, https://doi.org/10.1175/JCLI-D-12-00225.1, 2013.
Thorsen, T. J., Kato, S., Loeb, N. G., and Rose, F. G.: Observation-Based Decomposition of Radiative Perturbations and Radiative Kernels, J. Climate, 31, 10039–10058, https://doi.org/10.1175/jcli-d-18-0045.1, 2018.
Vial, J., Dufresne, J.-L., and Bony, S. J. C. D.: On the interpretation of inter-model spread in CMIP5 climate sensitivity estimates, Clim. Dynam., 41, 3339–3362, https://doi.org/10.1007/s00382-013-1725-9, 2013.
Walsh, J. E., Chapman, W. L., and Portis, D. H.: Arctic Cloud Fraction and Radiative Fluxes in Atmospheric Reanalyses, J. Climate, 22, 2316–2334, https://doi.org/10.1175/2008jcli2213.1, 2009.
Wang, Q., Li, S., Zhang, Z., Lin, X., Shuai, Y., Liu, X., and Lin, H.: Retrieving aerosol single scattering albedo from FY-3D observations combining machine learning with radiative transfer model, Atmos. Res., 315, 107884, https://doi.org/10.1016/j.atmosres.2024.107884, 2025.
Wetherald, R. T. and Manabe, S.: Cloud Feedback Processes In A General-Circulation Model, J. Atmos. Sci., 45, 1397–1415, https://doi.org/10.1175/1520-0469(1988)045<1397:Cfpiag>2.0.Co;2, 1988.
Wild, M., Ohmura, A., Schär, C., Müller, G., Folini, D., Schwarz, M., Hakuba, M. Z., and Sanchez-Lorenzo, A.: The Global Energy Balance Archive (GEBA) version 2017: a database for worldwide measured surface energy fluxes, Earth Syst. Sci. Data, 9, 601–613, https://doi.org/10.5194/essd-9-601-2017, 2017.
Wild, M., Hakuba, M. Z., Folini, D., Dorig-Ott, P., Schar, C., Kato, S., and Long, C. N.: The cloud-free global energy balance and inferred cloud radiative effects: an assessment based on direct observations and climate models, Clim. Dynam., 52, 4787–4812, https://doi.org/10.1007/s00382-018-4413-y, 2019.
Xie, Y., Liu, Y., Long, C. N., and Min, Q.: Retrievals of cloud fraction and cloud albedo from surface-based shortwave radiation measurements: A comparison of 16 year measurements, J. Geophys. Res.-Atmos., 119, 8925–8940, https://doi.org/10.1002/2014jd021705, 2014.
Yeo, H., Kim, M.-H., Son, S.-W., Jeong, J.-H., Yoon, J.-H., Kim, B.-M., and Kim, S.-W.: Arctic cloud properties and associated radiative effects in the three newer reanalysis datasets (ERA5, MERRA-2, JRA-55): Discrepancies and possible causes, Atmos. Res., 270, 106080, https://doi.org/10.1016/j.atmosres.2022.106080, 2022.
Zelinka, M. D., Klein, S. A., and Hartmann, D. L.: Computing and Partitioning Cloud Feedbacks Using Cloud Property Histograms. Part I: Cloud Radiative Kernels, J. Climate, 25, 3715–3735, https://doi.org/10.1175/jcli-d-11-00248.1, 2012.
Zhang, Y.: ISCCP-FH Cloud radiative kernel for TOA and surface from the ISCCP-FH Flux Production code based on ISCCP-H data, Zenodo [data set], https://doi.org/10.5281/zenodo.4677580, 2021.
Zhang, Y., Rossow, W. B., and Stackhouse Jr., P. W.: Comparison of different global information sources used in surface radiative flux calculation: Radiative properties of the near-surface atmosphere, J. Geophys. Res.-Atmos, 111, D13106, https://doi.org/10.1029/2005JD006873, 2006.
Zhang, Y., Jin, Z., and Sikand, M.: The TopH., Yoon, J.-H., Kim, B.-M., and Kim, S.-W.: Arctic cle Kernels Based on ISCCP-H Datasets: Method and Evaluation, J. Geophys. Res.-Atmos., 126, D035053, https://doi.org/10.1029/2021jd035053, 2021.
Zhou, C.: TOA and surface cloud radiative kernels calculated with RRTM (Version v3), Zenodo [data set], https://doi.org/10.5281/zenodo.5176193, 2021.
Zhou, C., Liu, Y., and Wang, Q.: Calculating the Climatology and Anomalies of Surface Cloud Radiative Effect Using Cloud Property Histograms and Cloud Radiative Kernels, Adv. Atmos. Sci., 39, 2124–2136, https://doi.org/10.1007/s00376-021-1166-z, 2022.
- Abstract
- Highlights
- Introduction
- Data
- Principles and methods
- Results and validation
- Discussion
- Data availability
- Conclusions
- Appendix A: The spatiotemporal distribution of cloud parameters
- Appendix B: The trend distribution of the shortwave cloud radiative effect
- Author contributions
- Competing interests
- Disclaimer
- Acknowledgements
- Financial support
- Review statement
- References