the Creative Commons Attribution 4.0 License.
the Creative Commons Attribution 4.0 License.
 | 05 Jun 2025
The European Forest Disturbance Atlas: a forest disturbance monitoring system using the Landsat archive
Cornelius Senf
Forests in Europe are undergoing complex changes that require a comprehensive monitoring of disturbance occurrence. Here, we present the European Forest Disturbance Atlas (EFDA), a Landsat-based approach for mapping annual forest disturbances across continental Europe from 1985 onwards. We built a consistent Landsat data cube of summer composites and compiled reference data on forest land use and forest disturbances. A classification-based approach was developed to detect forest disturbances annually, therefore accounting for multiple disturbance events per time series. The EFDA contains annual layers on disturbance occurrence, severity, and agent, as well as aggregated layers on the number of disturbances and the latest and greatest disturbance year. Based on the annual disturbance estimates (1985–2023), we quantified a total forest disturbed area of 439 000 km2, which increases to 610 000 km2 when accounting for multiple overlapping disturbance events. Map accuracies of the disturbance classification showed an overall F1 score of 0.89, with very low errors (<1 %) for the undisturbed class and with commission and omission errors for the disturbed class of 17.3 % and 22.5 %, respectively. Further, temporal validation revealed that errors decreased over time, with commission errors decreasing substantially to 10.6 % after the year 2000. We designed and implemented our workflow to create annual forest disturbance maps for easy updating when new data arrive and in an open-access framework to facilitate reproducibility, thus paving the road for an operational forest disturbance system in Europe. EFDA products are available at https://doi.org/10.5281/zenodo.13333034 (Viana-Soto and Senf, 2024).
- Article
(17740 KB) - Full-text XML
- BibTeX
- EndNote


Europe's forests cover more than one-third of the continent, and they provide essential ecosystem services to society (FOREST EUROPE, 2020), spanning from timber production and carbon storage (Lindner et al., 2010) and water purification and regulation (Orsi et al., 2020) to recreational and spiritual value (Saarikoski et al., 2015). Europe's forests are shaped by a long history of forest management, with past management decisions driving their current structure and composition (Ciais et al., 2008; Sabatini et al., 2018; Seidl and Senf, 2024). Past forest management has also focussed on increasing forest resistance to natural disturbances (Seidl, 2014), sustaining a continuous provision of timber and other ecosystem services (Thom and Seidl, 2016). In recent years, however, evidence for changing natural disturbance regimes has been reported globally (McDowell et al., 2020); additionally, in Europe, climate change and climate extremes have led to increased natural disturbances (Patacca et al., 2023; Senf et al., 2018; Senf and Seidl, 2021b). The trend of increasing natural disturbances coincides with an increasing demand for wood globally, with reported increases in timber harvest rates across most of Europe (Breidenbach et al., 2022; Ceccherini et al., 2020; Palahí et al., 2021; Seidl and Senf, 2024). Forests in Europe are thus undergoing complex changes that require a fundamental monitoring of where and when disturbances occur, providing a basis for decision making and forest planning.
Remote sensing data can provide detailed and consistent information on forests (Hirschmugl et al., 2017; Senf, 2022), and the Landsat archive (Wulder et al., 2022) – covering more than 4 decades – plays a key role in characterising disturbances (Banskota et al., 2014). In particular, Landsat has contributed to a better understanding of the causes and consequences of changing disturbance regimes in Europe (Grünig et al., 2022; Lecina-Diaz et al., 2024; Senf and Seidl, 2018; Sommerfeld et al., 2018; Stritih et al., 2021) and of disturbance interactions (Buma, 2015; Hermosilla et al., 2019; Turner and Seidl, 2023). Since the opening of the Landsat archive, different methodologies and algorithms have emerged for monitoring forest cover change across large areas (Zhu, 2017), with a regional focus on the forests of the United States and Canada (Kennedy et al., 2010; Verbesselt et al., 2010; Zhao et al., 2019; Zhu and Woodcock, 2014b). Such forest change detection algorithms can broadly be grouped into four types: (1) trajectory segmentation approaches (Hughes et al., 2017; Kennedy et al., 2010; Moisen et al., 2016), (2) time series decomposition approaches (Verbesselt et al., 2010; Zhao et al., 2019), (3) threshold-based methods (Huang et al., 2010), and (4) classification approaches (Hansen et al., 2013; Hermosilla et al., 2015). Time series segmentation or decomposition methods rely on the detection of statistical breakpoints in a spectral time series to detect forest change. While easy to implement and requiring little to no reference data, such approaches make use of only a limited set of spectral characteristics (usually one spectral index), and they require re-calibration when new observations are incorporated (Hermosilla et al., 2017). Threshold-based methods, in turn, can be easily updated with new data, but they rely on simple thresholds that might be difficult to apply across different ecosystems because thresholds will vary depending on forest composition and site conditions (Cardille et al., 2022). Classification-based methods, particularly machine-learning-based approaches (Belgiu and Drãguþ, 2016), can capture complex patterns and adapt to different types of disturbances and varying environmental conditions (Cardille et al., 2022). This makes them more flexible in relation to map changes across large areas (Hansen et al., 2013). Classification-based approaches also apply a strict definition of disturbances (i.e. according to a well-defined classification label), and they can reliably reduce commission errors resulting from noise in the time series (Cohen et al., 2017; Hermosilla et al., 2015). Finally, annual classification approaches can also facilitate the detection of more than one disturbance per pixel time series, which can be challenging with trajectory-based approaches (Hermosilla et al., 2015).
Due to the rapid development of new remote sensing approaches, there is growing interest in also developing operational forest monitoring systems at the level of the European Union (Fassnacht et al., 2024; Ferretti, 2024; Ferretti et al., 2024; Nabuurs et al., 2022) and, in particular, systems for the monitoring of tree cover change and disturbance (Dutrieux et al., 2023; European Commission et al., 2023). As global tree cover change products contain high uncertainty when analysed regionally (Ceccherini et al., 2020; Breidenbach et al., 2022; Palahí et al., 2021), efforts have been made to develop forest disturbance monitoring approaches specifically for Europe (Francini et al., 2021; Senf and Seidl, 2021a; Turubanova et al., 2023). Francini et al. (2021) proposed an automated algorithm (3I3D) for mapping forest disturbances based on spectral change in three indices within 3 consecutive years. The approach has shown good results for harvest disturbance detection in Italy but has yet to be applied at a continental scale. Shortly after, Senf and Seidl (2021a) created the first pan-European characterisation of forest disturbance by combining a trajectory segmentation algorithm (LandTrendr; Kennedy et al., 2010) with a random forest classification approach to filter out false positives from the LandTrendr segmentation (Cohen et al., 2018). While delivering spatially consistent data across Europe, this approach was constrained to the greatest change event per pixel and thus cannot include multiple disturbances per pixel. Turubanova et al. (2023) modelled changes in tree crown height across Europe from 2001 to 2021 by integrating Landsat imagery and lidar data (airborne laser scanning (ALS) and Global Ecosystem Dynamics Investigation (GEDI)). This constitutes the first attempt to analyse the evolution of tree canopy height at the European scale, but it only includes data from 2001 onwards and thus lacks a baseline for understanding more recently observed changes and for quantifying trends over time. As such, while there are a multitude of different approaches and products mapping forest disturbance across Europe, none of the existing approaches fulfil all of the requirements for an operational monitoring of forest change in Europe.
Here, we present the European Forest Disturbance Atlas (EFDA), which is a Landsat-based approach for mapping annual forest disturbances across continental Europe from 1985 onwards. The EFDA contains annual layers on disturbance occurrence, severity, and agent, as well as aggregated layers on the latest and greatest disturbance year and on the number of disturbances. The aim of this paper is to (i) explain and document the data and processing routines used for Landsat-based disturbance mapping, (ii) quantify uncertainties and errors in the disturbance maps, (iii) describe the individual map products derived from the disturbance maps, and (iv) discuss the use (and misuse) of the EFDA for forest monitoring.
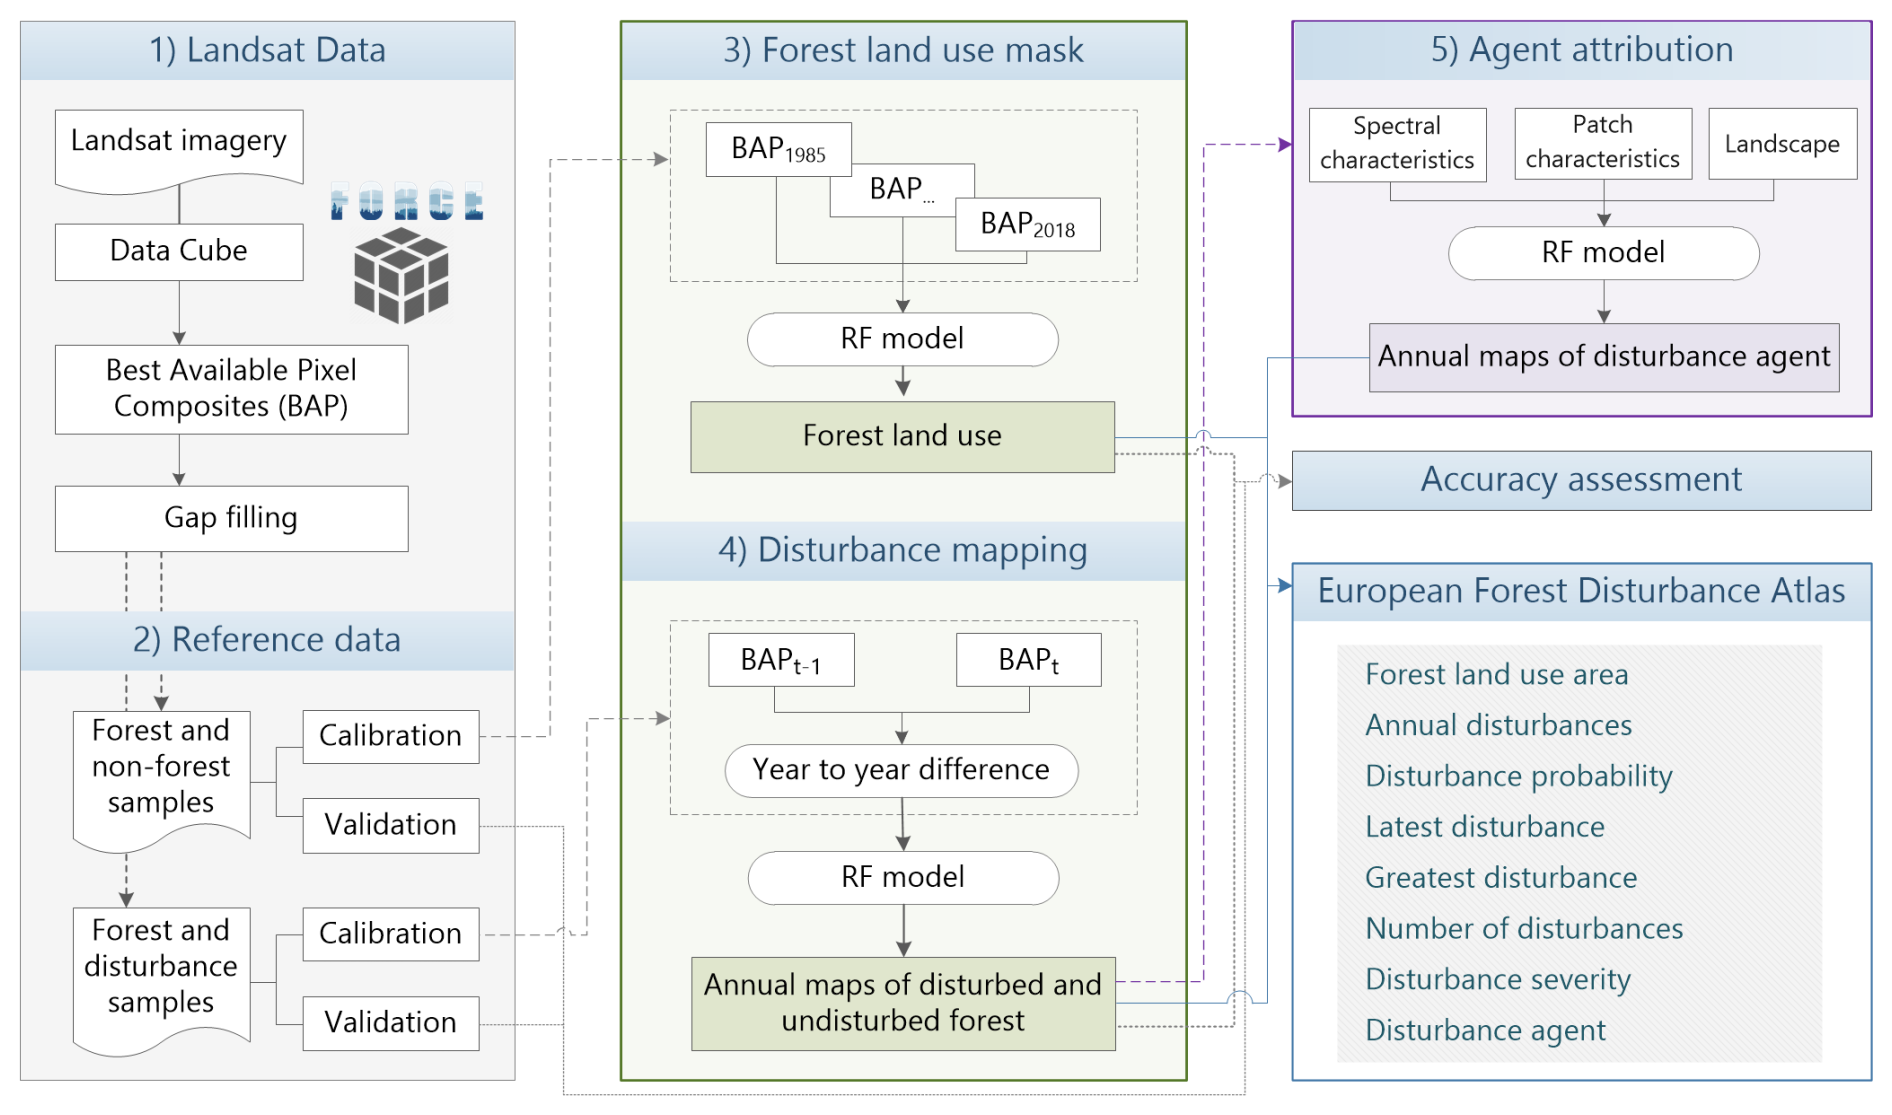
The overall workflow behind the EFDA contains six processing steps summarised in Fig. 1 and described in full detail in the following sub-sections. First, we build a consistent Landsat data cube for Europe. Second, we compile a reference dataset on forest land use and forest disturbances. Third, we create a consistent forest land use mask. Fourth, we develop a classification-based approach to detect disturbances annually at the pixel level. Following this, we validate the forest land use mask and disturbance maps based on an independent reference sample. Fifth, we identify disturbance patches and the likeliest agent of disturbance at the patch level. Lastly, we create a set of summary layers on forest disturbances and forest disturbance agents.
2.1 Landsat data cube
Our analysis area covers continental Europe, which was defined as all European countries except for Russia, Malta, Cyprus, and overseas territories and which covers a total of 5 749 424 km2 of land area. For the analysis area, we identified all level-1 images collected from Landsat 4 to Landsat 9 since 1984 with a cloud cover below 60 %. We only searched for images within the growing season (1 June and 30 September) to prevent differences in reflectance caused by phenological variations and sun angle changes. This resulted in a total of 115 663 images until 2023, which we downloaded from the United States Geological Survey (Fig. 2a). The level-1 Landsat images were further processed to surface reflectance (level 2) and were organised in a data cube structure of non-overlapping tiles of 150 × 150 km (Fig. 2b) using the Framework for Operational Radiometric Correction for Environmental monitoring (FORCE version 3.7.9, Frantz, 2019). Processing steps included atmospheric corrections using a pre-compiled water vapour database (Frantz et al., 2016), topographic correction using the ASTER Global Digital Elevation Model Version 3 (Abrams et al., 2020), bidirectional reflectance distribution function corrections, and cloud and cloud shadow masking (Frantz et al., 2016; Roy et al., 2016; Zhu and Woodcock, 2012). We performed topographic normalisation by applying a modified C correction (Kobayashi and Sanga-Ngoie, 2008), which is a physically based correction of topography, amended by an empirically derived extra parameter C (Hantson and Chuvieco, 2011). We applied cloud masking using a modified version of Fmask, with additional steps that enhance cloud and shadow detection (Frantz et al., 2016). After detecting clouds and cloud shadows in every Landsat image independently by using the Fmask algorithm, we applied a time series algorithm to detect outliers and remove additional clouds and shadows on a per-pixel basis (Frantz et al., 2015; Zhu and Woodcock, 2014a).
From the level-2 data cube, we created annual, cloud-free best-available-pixel composites across the whole analysis area. Best-available-pixel compositing has been demonstrated to yield temporally and radiometrically consistent data for large-area mapping (Hermosilla et al., 2022), and recent research has shown its superiority in detecting disturbances compared to other temporal aggregation methods (Francini et al., 2023). For creating the best-available-pixel composites, we selected for each pixel the best observations based on a parametric weighting scheme established in previous research (Griffiths et al., 2013). Observations were ranked per pixel according to distance to clouds and cloud shadows, haze opacity, and proximity to a predefined target date (1 August; Fig. A1 in Appendix A). The scoring algorithm assigns each of these factors a specific weight and considers only high-quality pixels, discarding observations with very low cloud or haze scores. The observation with the highest cumulative score is then selected as the best pixel for each location, ensuring both spectral and temporal consistency in the composites. As there were still remaining gaps in the composites (i.e. areas where no high-quality observation was found during the summer season, equating to 10.1 % of the total area on average; see Fig. A2 for annual details), we applied a linear gap-filling algorithm, extrapolating the previous year's spectral values to fill the remaining gaps (Fig. 2c), reducing data gaps to 4.9 % per year on average.
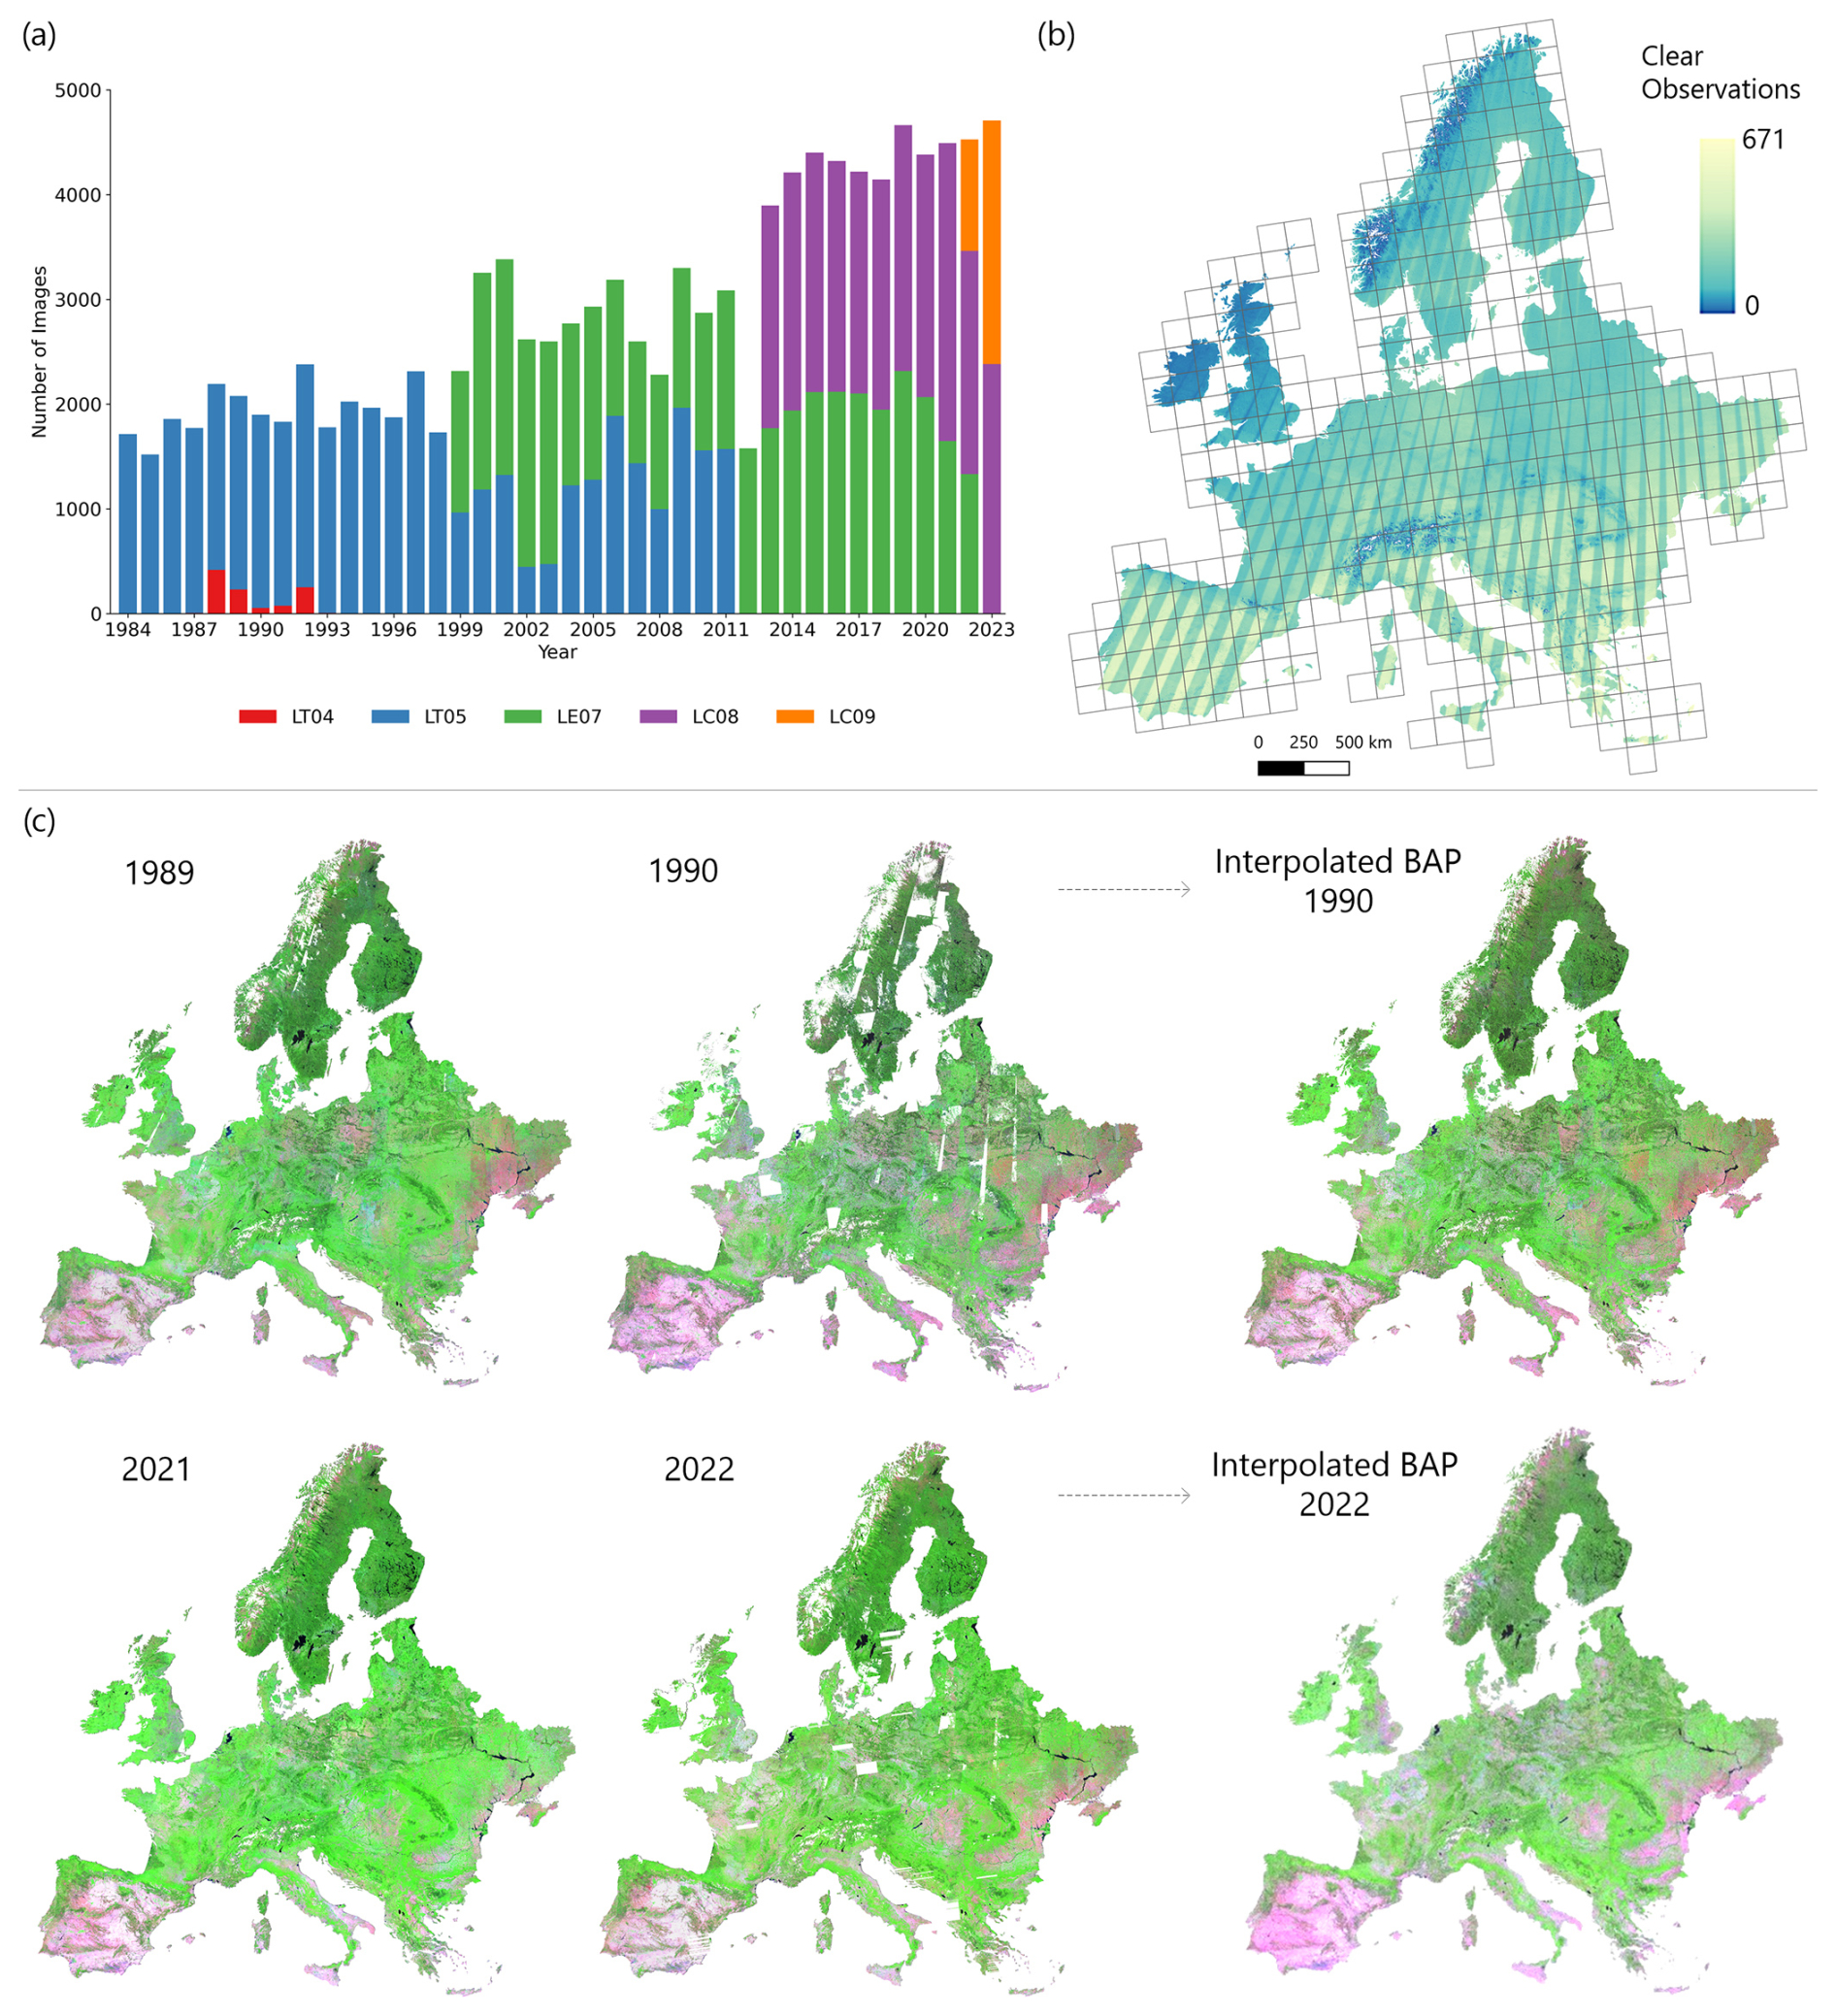
Figure 2(a) Number of images processed per year and per sensor (1984–2023). (b) Clear-sky observations across Europe for the entire time series and tile system of the data cube. (c) Examples of best-available-pixel (BAP) composites (RGB: SWIR2, NIR, red) for Europe and resulting composites after gap-filling.
2.2 Reference data for disturbance mapping
We compiled reference data for both forest and non-forest land use pixels, used to train a classifier that discriminates between forest and other land uses, as well as for disturbance and undisturbed pixels, used to train a classifier that detects tree cover change within forest land use annually. For the latter, we used a previously established dataset of 20 084 manually interpreted Landsat pixels for 35 countries, available at https://doi.org/10.5281/zenodo.3561925 (Senf, 2019). The dataset was built from two samples: the first one contains 24 000 randomly selected Landsat pixels for six countries for all land uses, covering the period of 1985 to 2017 (central Europe; Senf et al., 2018), and the second one contains 500 randomly selected Landsat pixels for 29 countries (excluding central Europe) for forest land use, covering the period of 1985 to 2018 (Senf et al., 2021). After removing non-forest land use pixels from both samples, we were left with a total of 20 084 reference pixels for forest land use across Europe (Fig. A3). For each pixel, trained interpreters segmented the spectral time series into linear segments of stable, disturbance, and recovery (Fig. 3) using an established interpretation tool (Cohen et al., 2010). Using Landsat images and high-resolution imagery available from Google Earth, the interpreters can determine whether spectral changes correspond to forest canopy changes or whether spectral changes were caused by other artefacts, such as clouds, illumination conditions, or phenological variations. The interpreters additionally recorded the land cover for each node of each segment (treed (> = 50 % tree cover) or non-treed (< 50 % tree cover)), which allowed us to disentangle stand-replacing disturbances (land cover changes from treed to non-treed) from non-stand-replacing disturbances (land cover stays treed despite disturbance). For full details on the interpretation, we direct the reader to the original publications (Senf et al., 2018, 2021). We converted the linear segments into annual binary information on disturbance occurrence (Fig. 3), which yielded 662 772 data points (pixel–year combinations) to train an annual classification model.
For masking out all non-forest land use, we complemented the above sample of forest land use with non-forest land use reference points from the LUCAS database (Land Use and Coverage Area frame Survey, Eurostat: https://ec.europa.eu/eurostat/web/lucas, last access: 1 February 2025). The LUCAS database is a spatially explicit database using a stratified random sampling design and trained field surveyors to assess land use and land cover (among other parameters) at 651 676 locations across Europe over the years 2006 to 2018 (d'Andrimont et al., 2020). LUCAS has been successfully used for land cover mapping (Pflugmacher et al., 2019) and thus is an ideal database for generating reference information for large-scale remote sensing analyses. From LUCAS, we extracted samples for the following categories: artificial land, croplands, grassland, bare land, water, and wetlands. We used only direct observations made at the plot in the field or via photointerpretation for land cover areas of >1 ha, land cover proportions of >80 %, and plots with a field-observed GPS location <15 m away from the LUCAS point. We collected a total of 46 651 non-forest reference pixels in this way, matching the forest to non-forest land use ratio per country following statistics available in the FAOSTAT database (FOREST EUROPE, 2020). Doing so yields a random sample per country; i.e. the share of samples within and outside forest land use corresponds to the share of forest to non-forest land use of the country.
From each sample, we retained a validation subsample of 2500 pixels for independent validation of the forest land use and forest disturbance classification. The land use validation sample was drawn proportionally to each country's land area and stratified by forest share within each country (see Table 1), which emulates a random sample across Europe's land area. That said, due to the absence of LUCAS information for 10 countries, the non-forest sample was slightly smaller (2066 samples) than the planned 2500 samples (see Table 1). The forest disturbance validation sample was drawn proportionally to each country's forest area, which emulates a random sample across Europe's forest area. Both samples are thus independent, random draws from the full population and allow for estimating unbiased map accuracies of the final map products.
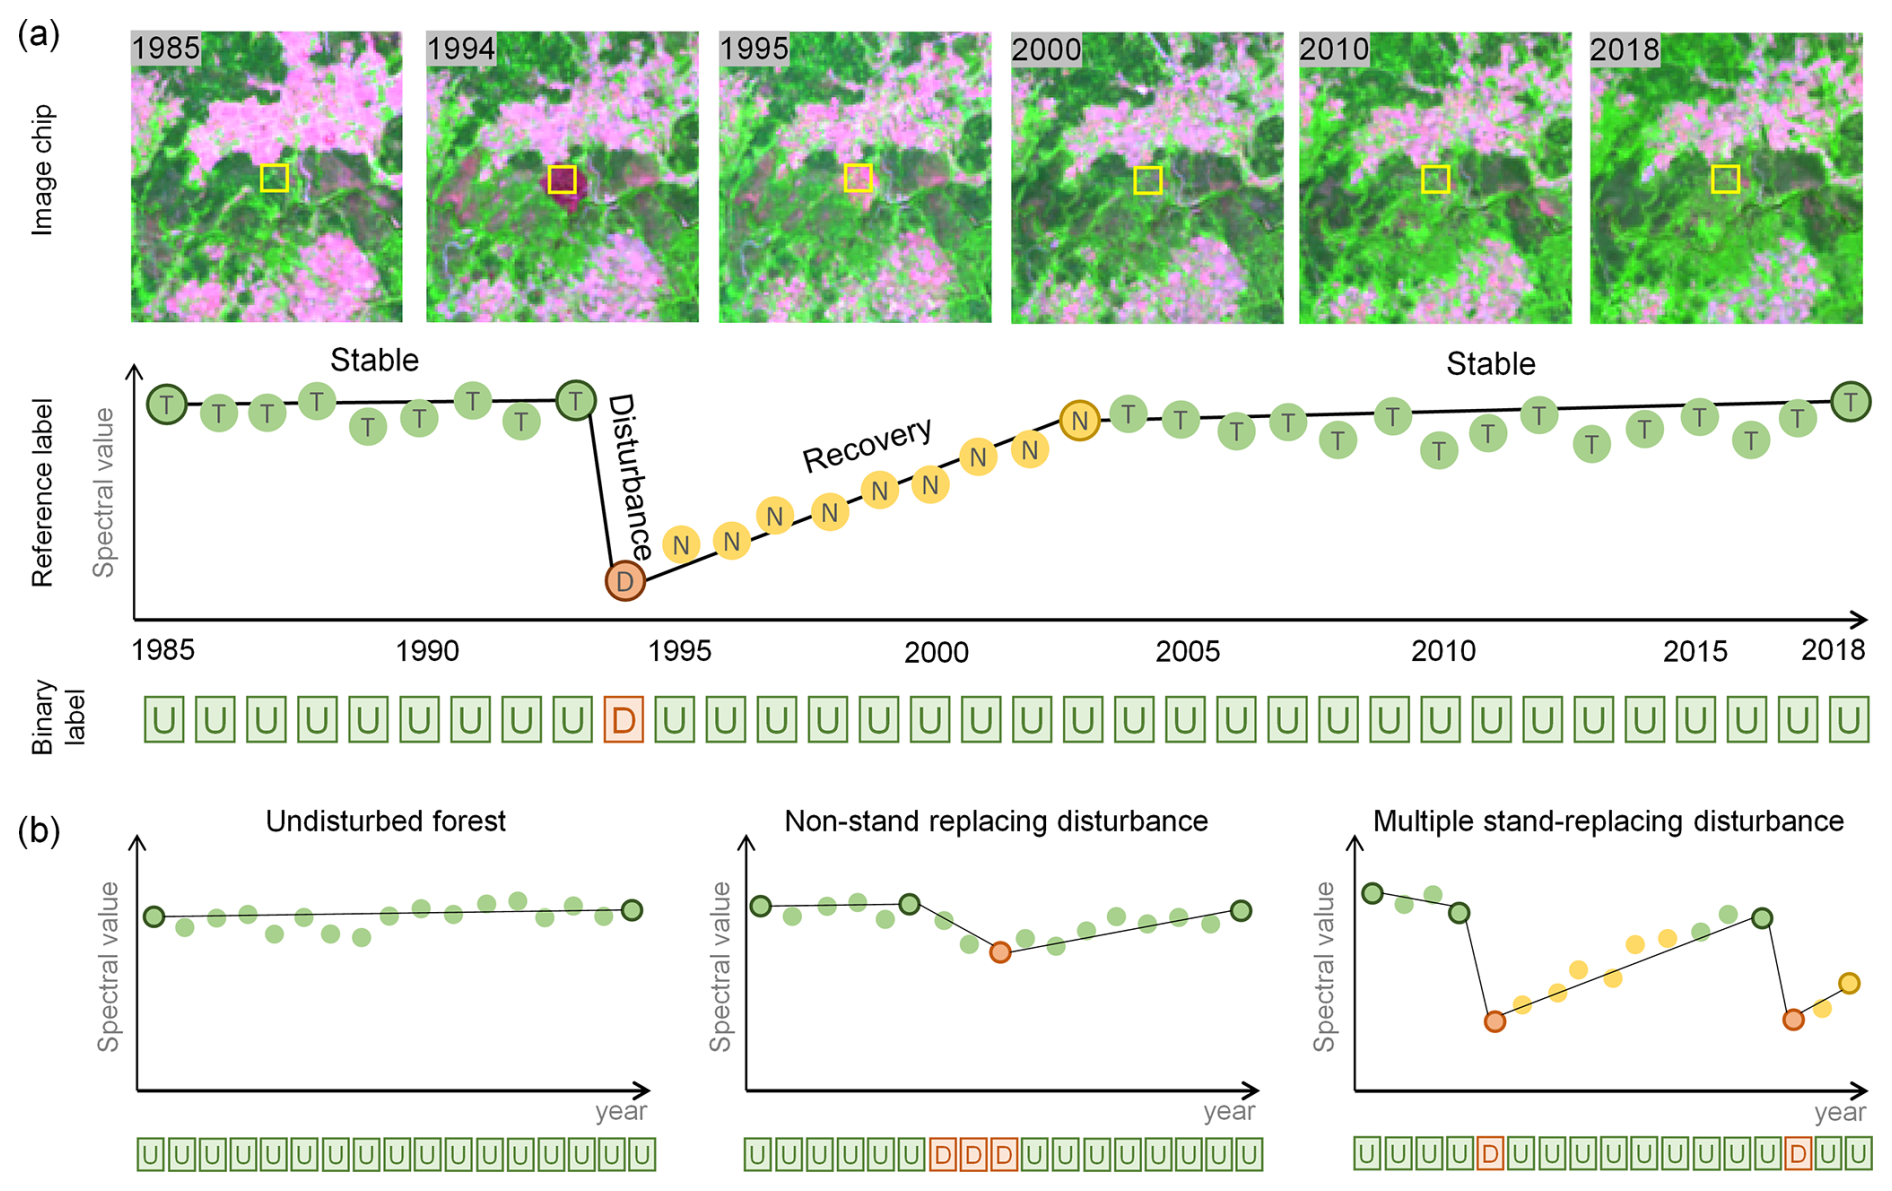
Figure 3Schematic representation of the original reference data from Senf et al. (2018, 2021): (a) image chips and corresponding segmentation labels of stable forest, disturbance, and recovery segments and corresponding treed (T) and non-treed (N) land cover, ultimately labelled according to annual binary classes of undisturbed (U) and disturbed (D); (b) examples of undisturbed forest, a gradual non-stand-replacing disturbance, multiple stand-replacing disturbances, and their corresponding binary labels.
Table 1Sizes of the validation samples for the land use and disturbance classifications and the corresponding weights used for calculating the sample size (missing samples in the LUCAS database indicated by “–”).

2.3 Forest land use mask
A forest land use mask was required to mask out any non-forest land use areas, which often exhibit strong spectral changes that could be confused with disturbances. Since there is no consistent forest land use mask available across all of continental Europe, we created our own forest land use mask using a multi-temporal classification approach. We broadly followed the FAO definition of forest land use, which is any area that has or will reach tree cover greater than 10 % in the near future, is larger than 0.5 ha and 20 m in width, and is primarily not used for urban or agricultural land use (FAO, 2020). This definition thus includes young forests of lower tree cover, areas of reforestation, and temporally unstocked areas (e.g. forestry roads). To match this definition, we classified each reference pixel (see Sect. 2.2) that has been treed (even temporally) since 1985 as forest land use. All reference pixels of other land uses (i.e. artificial, croplands, waterbodies) were classified as non-forest land use. We use such a broad land use definition, instead of a recent tree cover map, to avoid masking recently disturbed areas that are temporally unstocked but still considered to be forest land use. Using the reference categories assigned to each pixel, we trained a random forest model with a stack of all annual best-available-pixel composites as input, comprising 34 years with six spectral layers and six spectral indices (Table 1), resulting in 408 features (see Fig. A4 for visualisation of the feature space and Fig. A6 for further details on variable importance). We then applied the model to the raster stack to yield one classification of forest and/or non-forest land use for our entire study period. In accordance with the FAO definition, we also defined a minimum mapping unit (MMU) consisting of six Landsat pixels for the forest mask (0.54 ha), converting smaller patches into non-forest. All non-forest land use pixels were excluded from subsequent analyses.
2.4 Annual disturbance mapping
For each forest land use pixel, we classify forest disturbances on an annual basis from 1985 onwards. Disturbed and undisturbed forests have a distinctive spectral signal across a 2-year period as spectral characteristics change significantly during disturbance, while they remain constant for undisturbed forests (Kennedy et al., 2007). Hence, we calibrated a random forest model to identify disturbed and undisturbed pixels using the spectral information from a given year (target year t0) and the previous year (reference year, t−1) to disentangle inter-annual stability and change. As the classification input, we used a set of spectral indices (normalised difference vegetation index (NDVI), Tucker, 1979, and normalised burn ratio (NBR), García and Caselles, 1991), the tasseled-cap components (Baig et al., 2014; Crist, 1985), and the Disturbance Index (Healey et al., 2005) (Table A1 and Fig. A5; see Fig. A6 for further details on variable importance). As the reference, we used undisturbed and stand-replacing disturbances (i.e. disturbances that lead to a change in land cover; see Sect. 2.2), which indicate a clear opening of the top canopy and thus allow the model to learn the distinct spectral differences between undisturbed and disturbed pixels. The trained model was then applied annually, which facilitates updating the map product as soon as images are available for the next year.
Due to the imbalanced nature of the sample (disturbances representing only 3 %), we applied the SMOTE method (Chawla et al., 2002), which helps by lowering the overall learning cost, assigning higher costs to misclassifying the minority class, and balancing the data through under-sampling the majority and over-sampling the minority class. We further used the module RandomizedSearchCV (Pedregosa et al., 2011) to efficiently find the best set of hyperparameters using cross-validation, selecting the combination that resulted in the highest area under the receiver-operating characteristic curve score. To classify the probability of disturbance into the binary categories of disturbed and undisturbed, we optimised the probability cutoff using the F1 score derived from cross-validation. The optimal threshold was 0.5, with an overall F1 score of 91 %.
Finally, we applied several post-processing steps: first, annual maps were masked according to the forest land use mask (MMU = 0.54 ha), and a minimum mapping unit of three Landsat pixels was assigned (0.27 ha), reducing the number of single false-positive pixels (so-called salt-and-pepper effect, typical for pixel-based classification). Second, we applied a collapsing step in which multiple disturbances detected in a time window of <4 years since the last disturbance were reduced to the first year the disturbance sequence was detected (Fig. 4). This was done to avoid illogical changes (i.e. disturbance, no disturbance, disturbance) and double counting of disturbances in consecutive years that arise from the same disturbance event. That is, if a disturbance event extends over multiple, consecutive years, we will map only the first year of the disturbance segment as disturbed.
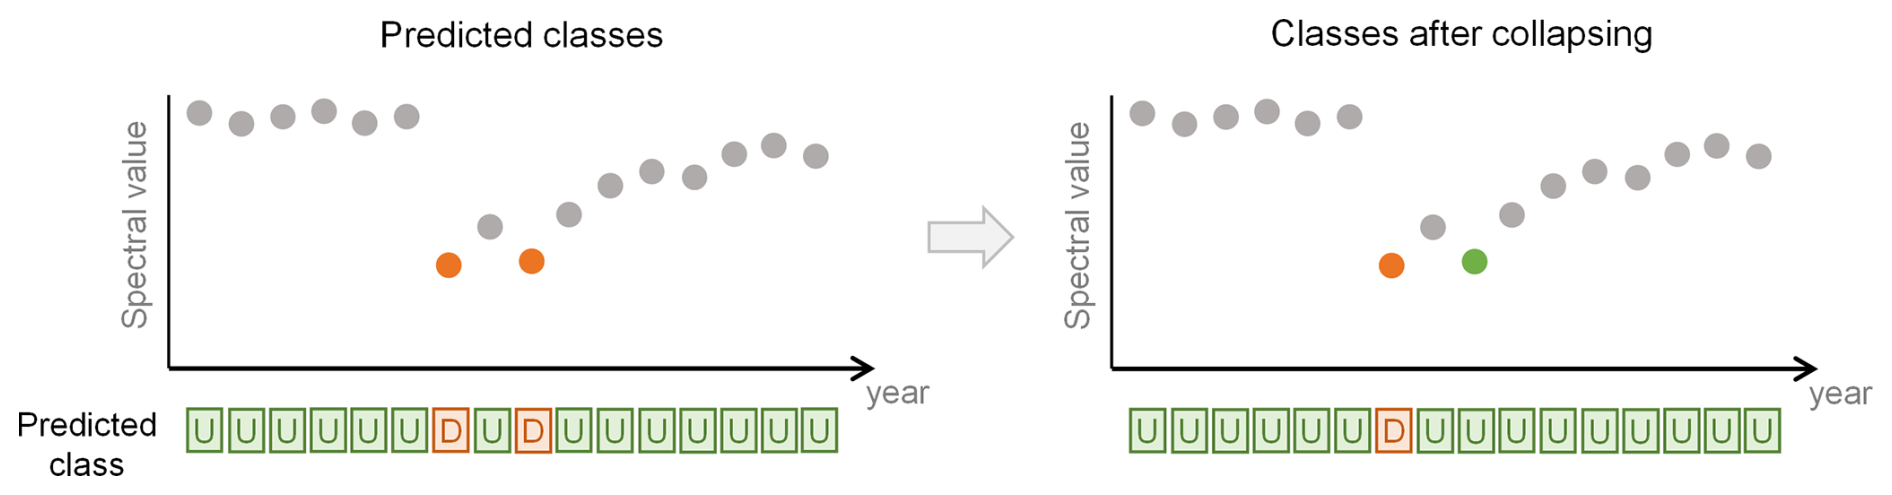
Figure 4Schematic view of collapsing step to relabel illogical and consecutive disturbance events.
2.5 Accuracy assessment
Robust estimation of map accuracies is important for map uptake and subsequent analyses (Olofsson et al., 2014). We quantified map accuracies of both the forest land use and forest disturbance maps using the independent samples described in Sect. 2.2 and standard confusion matrices, from which we estimated omission errors or producer's accuracies (or recall), commission errors or user's accuracies (or precision), and overall errors or accuracies and F1 scores (Forman and Scholz, 2010). Uncertainties in each accuracy estimate were quantified using bootstrapping with 1000 repetitions, which simulates sampling variability due to hypothetical repeated sampling for each estimate. We further assessed how accuracies of the disturbance map varied spatially and temporally. For assessing spatial variability, we computed confusion matrices per region (north – 7 countries, central – 20 countries, and south – 11 countries) according to FOREST EUROPE (2020) definitions. For assessing temporal variability, we computed confusion matrices and corresponding accuracy estimates per year and for different periods. We also calculated confusion matrices using only stand-replacing disturbances (i.e. pixels where the interpreter assigned a change in land cover) and both stand-replacing and non-stand-replacing disturbances (i.e. pixels where the interpreter assigned no change in land cover). We did so to test the sensitivity of our maps and map accuracies to low-severity disturbances. Further, we compared the forest land use area estimated from our map to national-level statistics on forest land use area obtained from the FAOSTAT database (FOREST EUROPE, 2020). We finally compared our disturbance estimates to existing datasets for Europe (Hansen et al., 2013; Senf and Seidl, 2021a; Turubanova et al., 2023).
2.6 Agent attribution
To identify the most likely agent of disturbances, we adapted an existing attribution algorithm (Sebald et al., 2021; Seidl and Senf, 2024; Senf and Seidl, 2021b) for the annual disturbance maps. The algorithm first detects disturbance patches by grouping pixels disturbed in the same year that are connected by an edge or corner using queen contiguity. That is, the analysis is performed at the patch level and not at the pixel level anymore, allowing us to derive patch-level predictors that are important for disturbance agent attribution (Oeser et al., 2017; Sebald et al., 2021; Stahl et al., 2023). To correct for timing errors in the disturbance map (e.g. a fire mapped over 2 years might appear as two separate fires), patches from consecutive years that share an edge are merged, with the disturbance year being assigned based on a majority vote (see Senf and Seidl, 2021b, for details). For each patch, we generated a set of 18 predictors, including size, shape, spectral characteristics, and surrounding landscape (see Table 2 for details and Fig. A6 for further details on variable importance, as well as Seidl and Senf, 2024; Senf and Seidl, 2021b).

As reference data, we used an extended reference database of 12 571 points for fires, windthrows, and bark beetle disturbances. This database builds upon an existing reference database of 11 364 points of fires and windthrows developed in Senf and Seidl (2021b) and which was extended to 12 571 points to also include bark beetle disturbances (Seidl and Senf, 2024). This dataset was created by combining visual interpretation of an existing disturbance map (Senf and Seidl, 2021a), Landsat data, and high-resolution imagery with different databases on storms (FORWIND, Forzieri et al., 2020), insect outbreaks (DEFID2, Forzieri et al., 2023), and fire-related disturbances (EFFIS, https://forest-fire.emergency.copernicus.eu/, last access: 2 February 2025). Additionally, papers documenting bark beetle outbreaks in Europe were used to support the interpretation of bark beetle patches (Hlásny et al., 2021). Each point in the reference database was linked to a disturbance patch in our disturbance map by means of a unique patch ID. In some cases, two or more occurrence points fell within the same disturbance patch (especially for large fires or windthrows), which reduced the number of patches with an agent label to 12 314 (10 114 for windthrow, 1085 for bark beetles, and 1115 for fire). The database thus covers the three most important natural disturbance agents in Europe (Patacca et al., 2023). We note, however, that the focus of the attribution is on the root cause of disturbance. That is, an area affected by natural disturbances (e.g. wind) that is salvage logged afterwards is considered to be a wind disturbance. We did not have dedicated information on harvest in the reference database because there is no reliable spatially explicit information on harvest activities, and interpreting harvest is difficult because harvest can happen in reaction to natural disturbances (i.e. salvage logging). We thus used an approach developed in Senf and Seidl (2021b) and selected a random background sample from all disturbance patches to indicate the absence of fire, windthrow, or bark beetle outbreaks in the model. As harvest is assumed to be the major disturbance agent in Europe (Patacca et al., 2023; Seidl and Senf, 2024), this background sample will represent harvest conditions in contrast to the agent information available in the existing databases. In essence, this approach is similar to presence-only species distribution models, where absence data are also rare (Valavi et al., 2022). We drew a total of 12 314 random patches to represent harvest, equating to the sum of wind, fire, and bark beetle disturbances and resulting in a final reference database of 24 628 patches. We subsequently trained a random forest model using the agent labels in the reference database and the predictors described above. We initially trained a model that classifies each patch into one of the four agent categories (wind, fire, bark beetle, and harvest) but found high confusion between wind and bark beetle disturbances. This was mostly due to bark beetle reference data being available mostly for very recent, large-scale bark beetle outbreaks in central Europe that resemble past windthrows in their form and shape. Since less historic information was available on bark beetle disturbances, which could have improved the model skill, we decided to group wind and bark beetle disturbances into one category. Ecologically, both disturbance agents form a disturbance complex, with wind disturbances often triggering bark beetle disturbances and vice versa (Seidl and Rammer, 2017). That said, as bark beetle was a less important natural disturbance agent compared to wind and fire disturbances prior to the recent central European drought event (Patacca et al., 2023), disturbances in the wind–bark beetle category prior to 2017 can be considered to be mostly wind dominated, while disturbances in the same class can be considered to be bark beetle dominated after 2017. Finally, as there was no independent sample of reference data available at the agent level, we were unable to provide map accuracies on the resulting agent maps. We provide model accuracies derived from a 5-fold spatial block cross-validation (Valavi et al., 2019), with class errors for each class. Those model accuracies should be taken with caution because they do not represent true map accuracies.
2.7 Summary layers
Using the annual maps of disturbances and the underlying spectral information, we computed a series of layers that compose the European Forest Disturbance Atlas (EFDA) (Viana-Soto and Senf, 2024; see Table 3 for a detailed summary). The resolution of all layers is 30 m, containing information from 1985 to 2023 (in the current version, 2.11). The data are distributed at the country level using the ETRS89 coordinate reference system and the Lambert azimuthal equal-area projection (ETRS89-extended/LAEA Europe; EPSG:3035) and can be downloaded from https://doi.org/10.5281/zenodo.13333034 (Viana-Soto and Senf, 2024).
Table 3Summary layers of the European Forest Disturbance Atlas.

3.1 Map products in the EFDA
Our newly created Forest Disturbance Atlas for Europe provides a set of variables at 30 m describing forest disturbances annually from 1985 onwards (Fig. 5). By mapping disturbances annually, we capture multiple disturbance events to obtain direct information on the number of disturbances, the latest disturbance (most recent disturbance event), and the greatest disturbance (event with the greatest spectral change). The annual disturbance maps are coupled with the estimated annual disturbance probabilities from random forest modelling as a proxy of uncertainty in disturbance detection (Fig. B1 in Appendix B). Maps are constrained to our forest land use mask, which includes areas that have been forest at some point within the time series and thus avoids masking recently disturbed areas.
The area affected by disturbances across Europe over the last 4 decades is shown in Fig. 5. The individual layers show the ability of our atlas to precisely retrieve disturbance characteristics across different disturbance regimes, such as a recent bark beetle outbreak interspersed with harvest activities in the Thuringian Forest in Germany (Fig. 5a); interactions between different agents in an intensively managed forest plantation in the Gascony region in France (Fig. 5b), where a windstorm was captured in 1990 and a recent fire occurred in 2023; and recurrent fires in planted forests in central Portugal (Fig. 5c).
Based on the annual disturbance estimates (Fig. 6), we quantified a total forest disturbed area of 439 000 km2 (22 % of the total forest area) that increases to 610 000 km2 when accounting for multiple disturbance events (i.e. considering areas disturbed in multiple years, such as through reburns or multiple harvests). From those disturbed areas, 72 % correspond to areas with one disturbance event, while 18.9 % (115 000 km2) have experienced two disturbance events, and 9.1 % (55 000 km2) experienced three or more disturbance events. That is, a total of 28 % of all pixels disturbed in Europe in the past 4 decades experienced multiple disturbance events. These multiple disturbances mostly occur in southern Europe (e.g. Portugal, Spain), where multiple fires are interspersed with harvesting activities, as well as in regions characterised by short-rotation plantation systems, e.g. the south of France, Hungary, Poland, or Sweden, with harvest return periods of 15–20 years. Planned disturbances caused by human land use (harvest) caused 79.2 % of the total disturbed area, and natural agents were responsible for 20.8 % of the disturbances found (12 % from wind and bark beetle outbreaks and 8.8 % from wildfires).
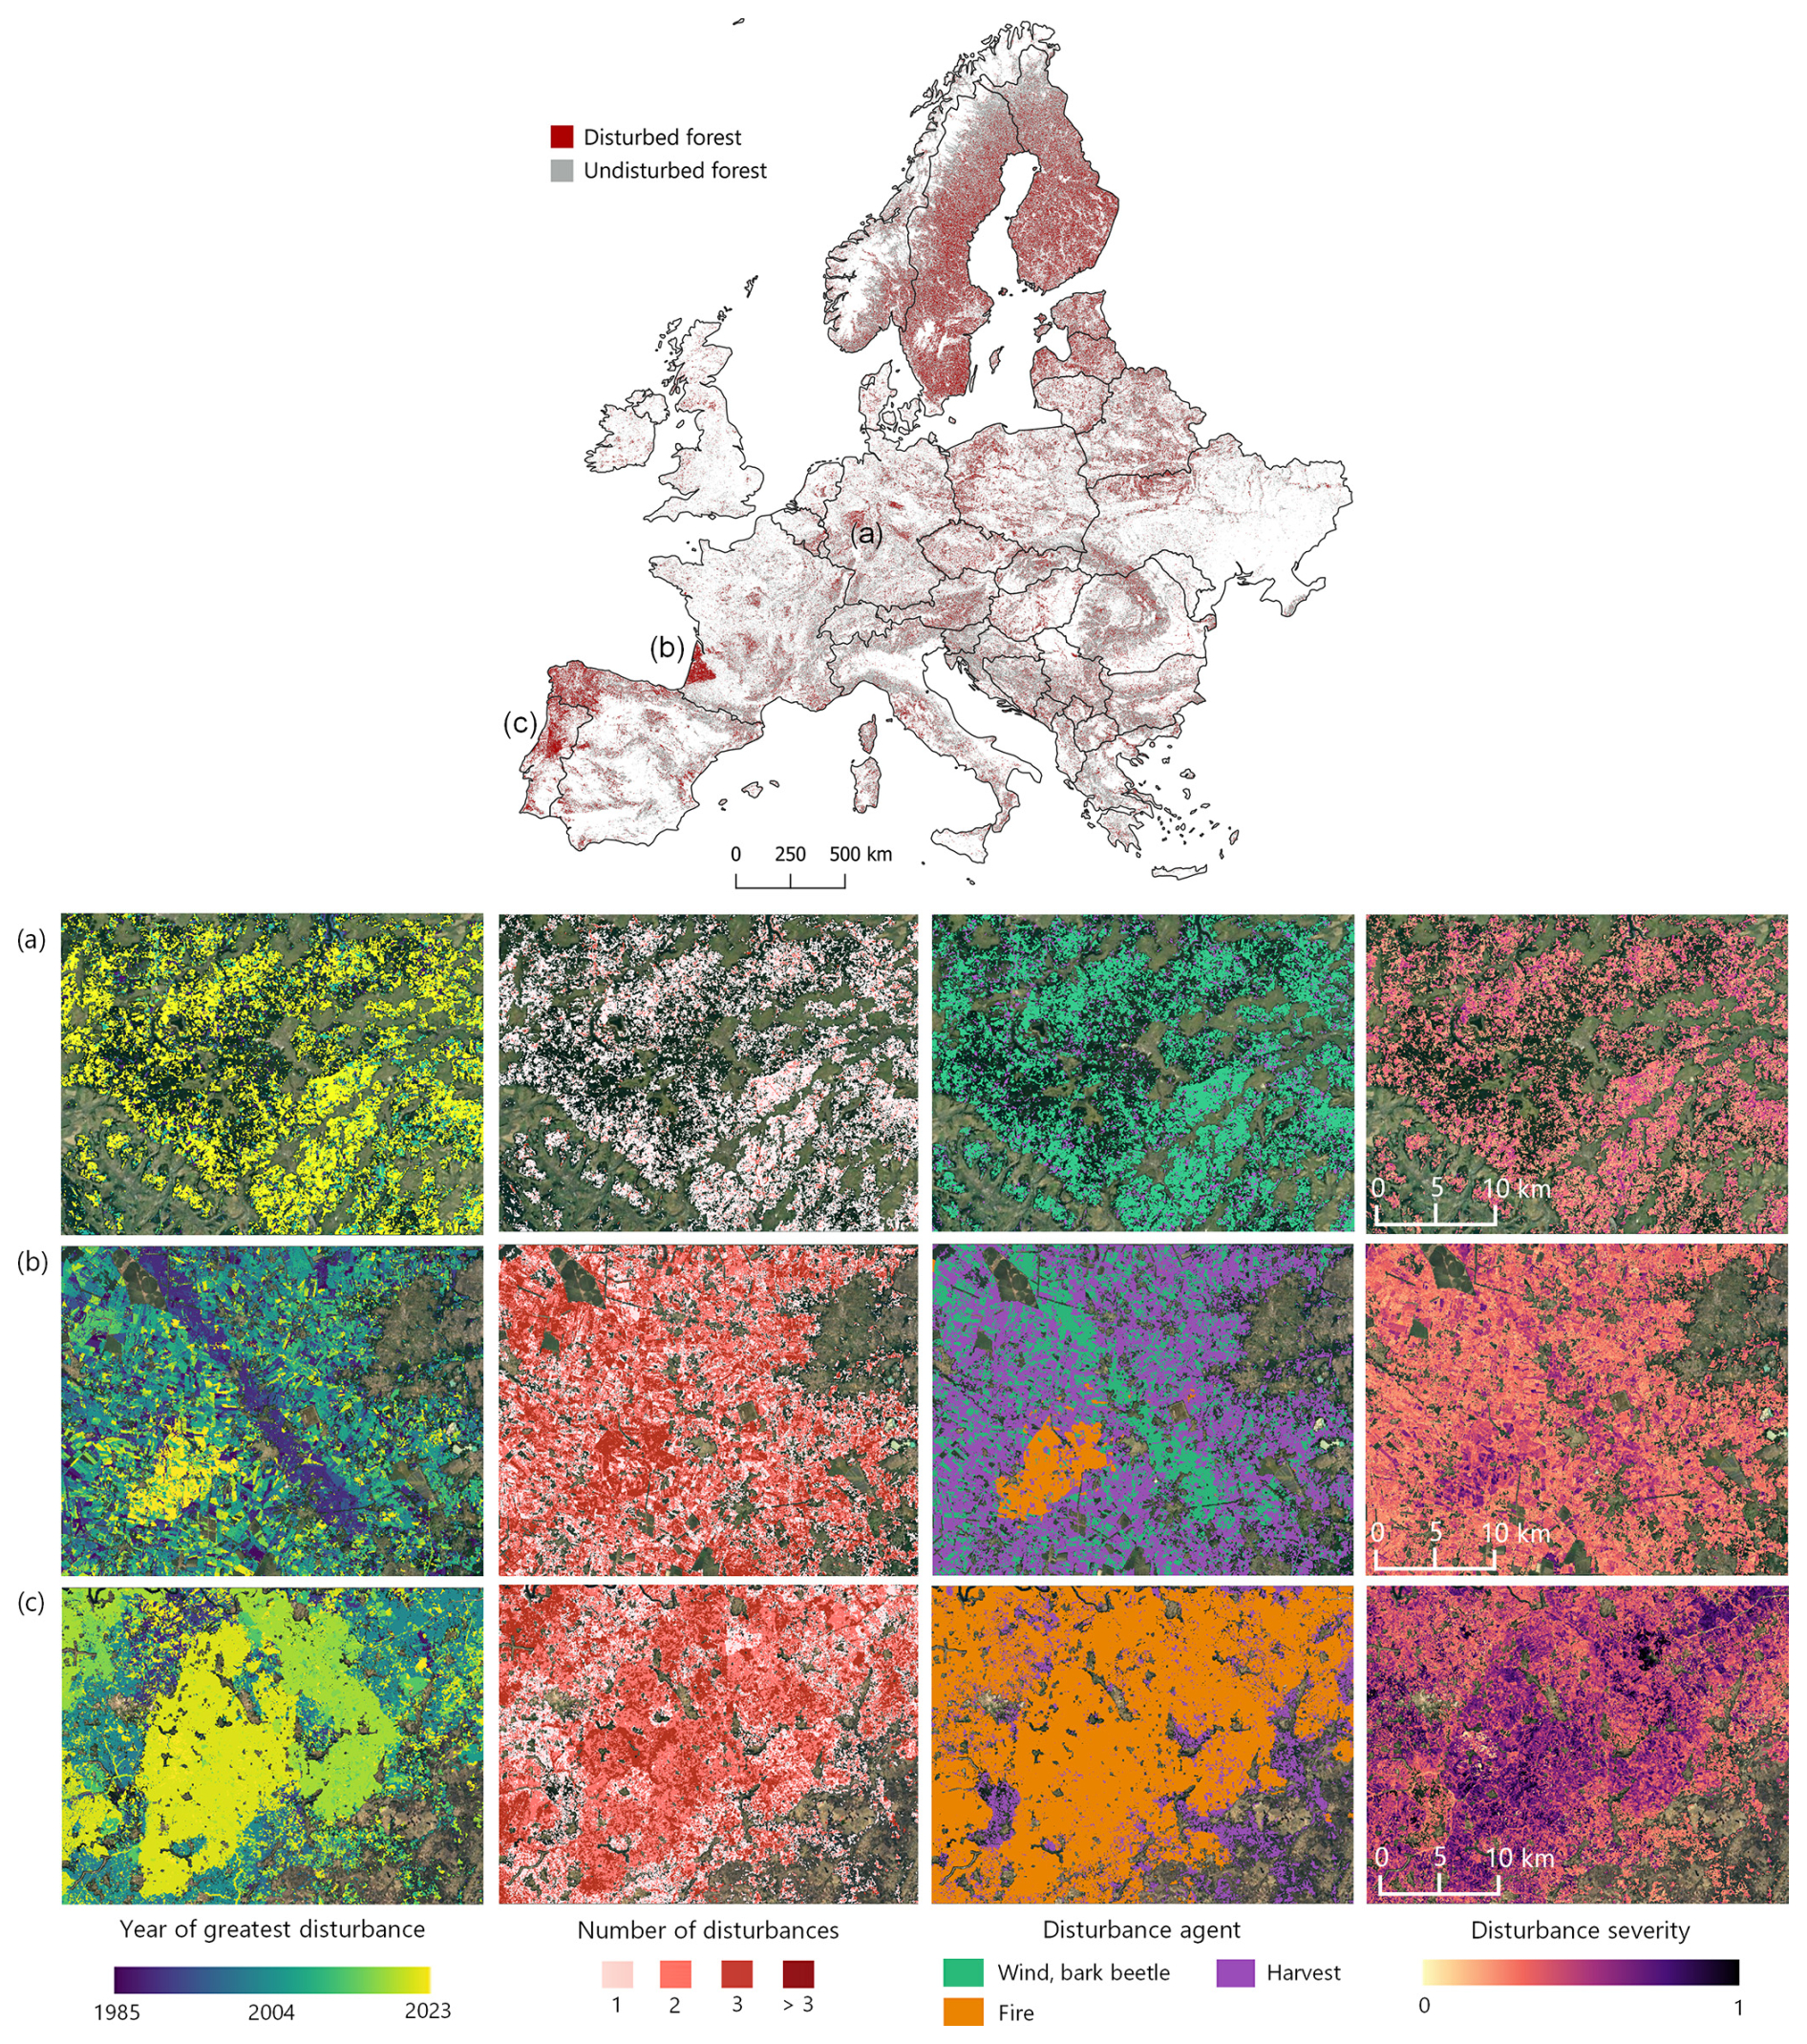
Figure 5Forest disturbances in Europe (1985–2023). Details show (a) bark beetle outbreaks in central Germany, (b) a combination of a windstorm event and a recent fire in a managed forest plantation in Gascony (France), and (c) recurrent fire disturbances in central Portugal.
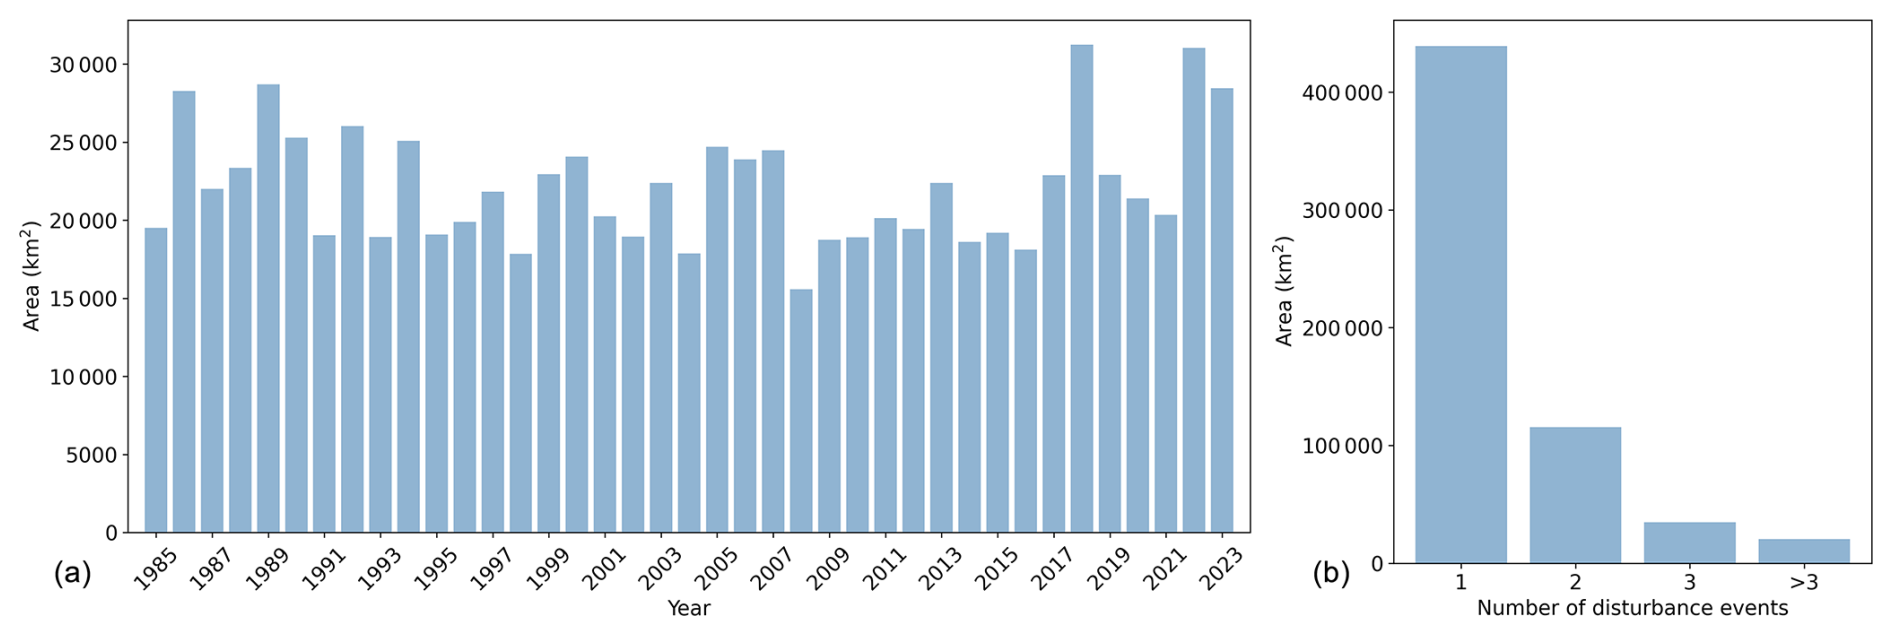
Figure 6Number of hectares disturbed per year (a) and area disturbed per number of events (b).
3.2 Validation
The assessment of the land use mask, discriminating between non-forest and forest land use, yielded high accuracies, with an overall F1 score of 0.92 and with F1 scores of 0.93 for non-forest land use and 0.91 for forest land use (Table 4). Commission and omission errors were thus low overall (<10 %) and were well balanced, indicating that, on average, 7.5 % of the pixels in the land use mask will be wrongly classified. Further, comparison of the estimated forest area at the national level with forest land use area from FAOSTAT showed a high agreement (R2=0.98; MAE = 6019 km2, 16.9 %; Fig. 7), with a slight tendency towards overestimating forest area.

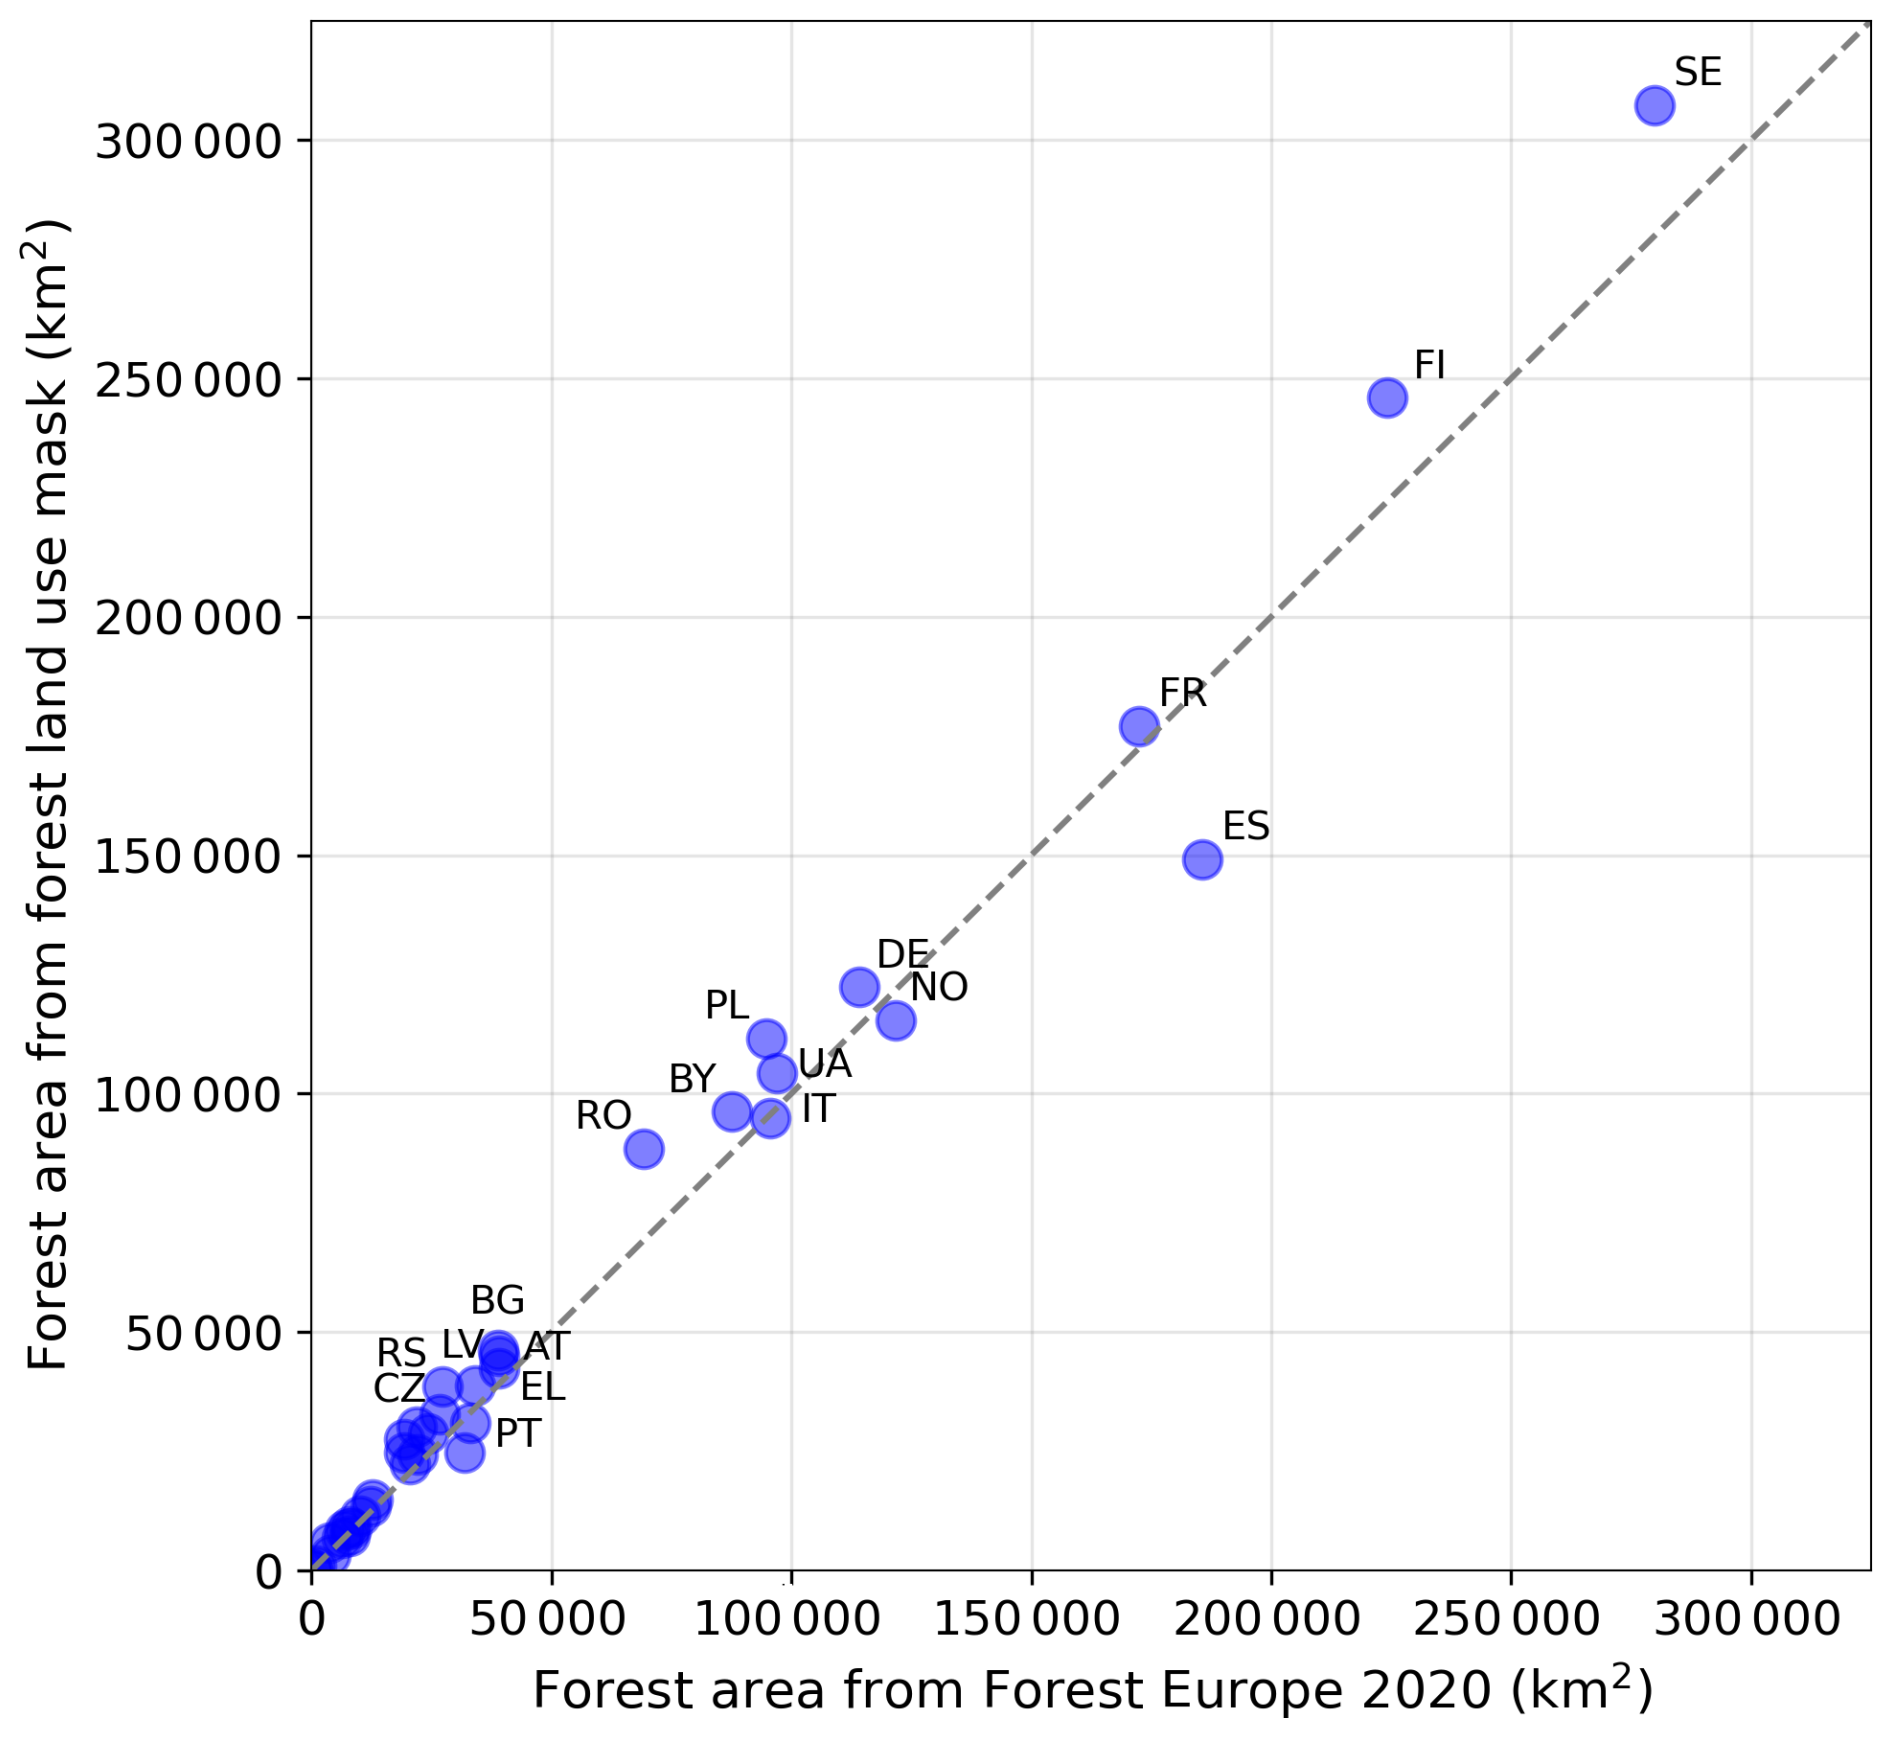
Figure 7Forest area according to FAOSTAT 2020 versus forest land use estimated for the series for 1985–2023.
Map accuracies of the disturbance classification showed an overall F1 score of 0.89, with F1 scores of 0.99 for undisturbed pixels and 0.80 for disturbed pixels (Table 5). Accuracies were thus less balanced between both classes, with very low commission and omission errors (<1 %) for the undisturbed class (i.e. the map rarely misses disturbances or falsely classifies something as undisturbed) but higher commission and omission errors for the disturbed class (17.3 % and 22.5 %, respectively). That is, for 17 % of all pixels classified as disturbance, the classification will be wrong, whereas 23 % of true disturbances will be missed in our map. Those numbers changed significantly when only considering reference points interpreted as stand-replacing disturbances in the reference data (Table B1 in Appendix B), with a substantially reduced omission error (14.2 % vs. 22.5 %) and a slightly increased commission error (22.7 % vs. 17.3 %). The omission error of our map is thus driven by low-intensity disturbances that only partially remove the tree canopy. We found significant variation in accuracies among regions, with higher commission errors in northern Europe compared to in central and southern Europe, whereas omission errors were lower in northern Europe compared to in central and southern Europe (Table 6). In northern Europe, it is thus more likely that a pixel falsely detected as a disturbance will be randomly selected, but it is less likely that a true disturbance will be missed, while, in central and southern Europe, it is more likely to miss a true disturbance than to falsely identify a pixel as disturbed. In the temporal domain, overall, we found high fluctuation between years but an overall decreasing trend in commission error and no clear trend in omission error (Fig. 8). That is, disturbances mapped before the year 2000 will have a 19.5 % chance of being falsely classified as disturbance, whereas commission errors decrease substantially to 10.6 % after the year 2000 (Table B2). The high commission error prior to 2000 was driven significantly by the very early years of our time series (<1990), where the commission error was, on average, 22.5 % (compared to 16.4 % between 1990 and 1999), likely due to higher noise in the underlying data. Omission errors showed a less clear pattern, also with higher omission rates in the 1980s (23.3 %), likely due to lower image availability, but less pronounced differences before and after the year 2000 (22.5 % and 20.5 %, respectively). Finally, we found high agreement between estimated and manually interpreted disturbance years (R2=0.73; Fig. 9), with a mean absolute error of 1.91 years.
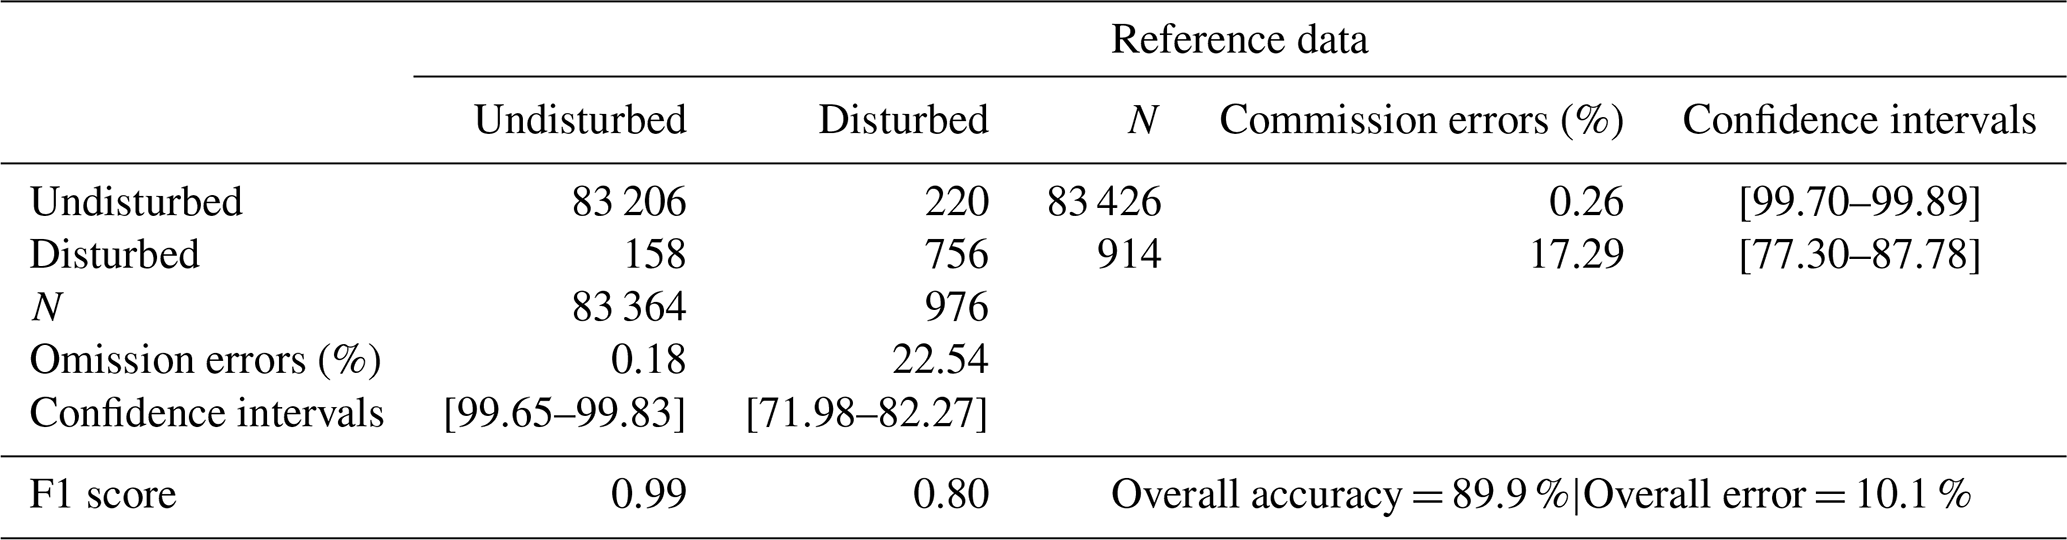

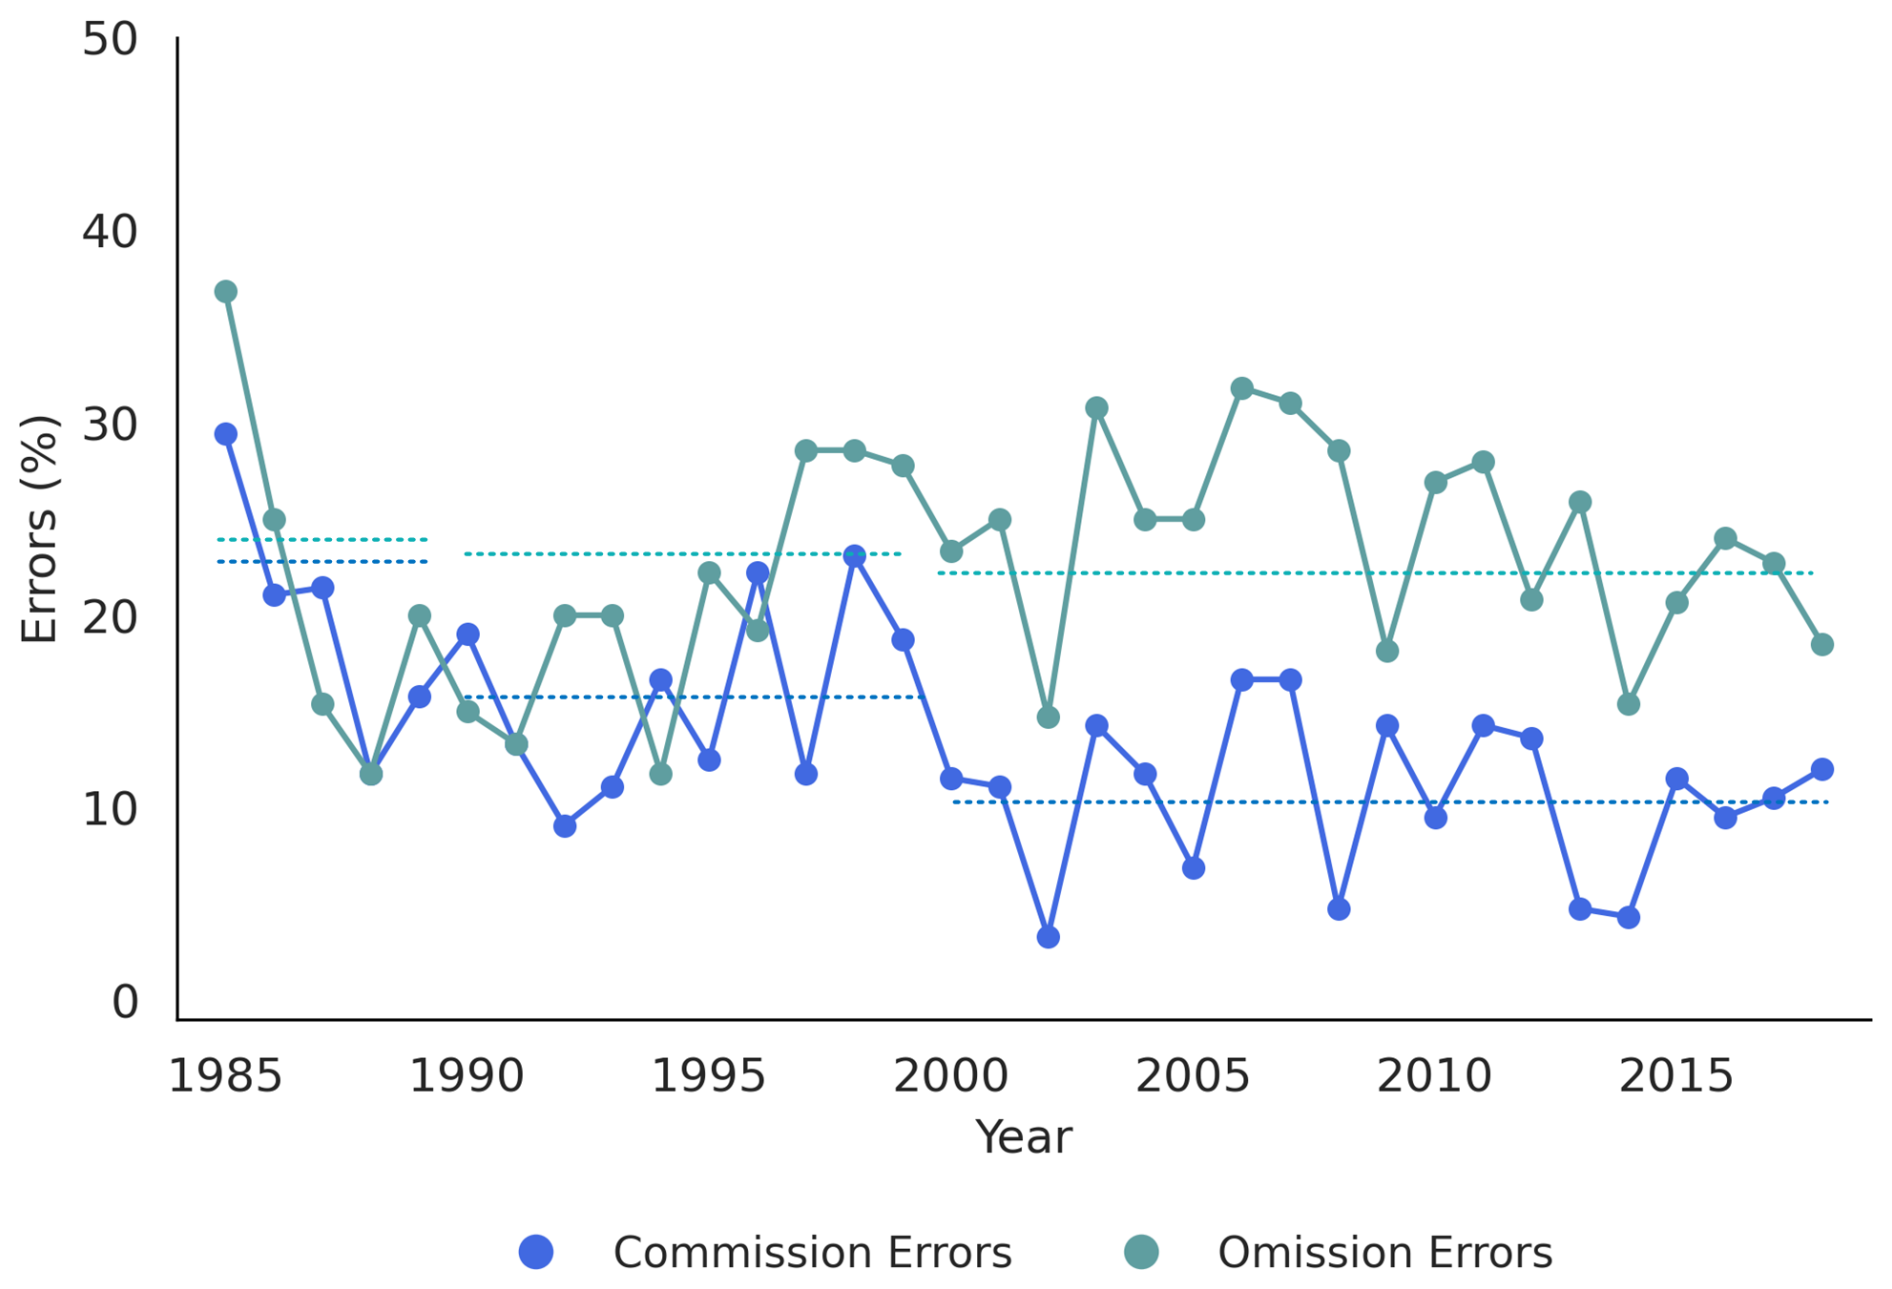
Figure 8Omission and commission errors per year. Dashed horizontal lines indicate the averages per period: 1985–1989, 1990–1999, 2000–2018.
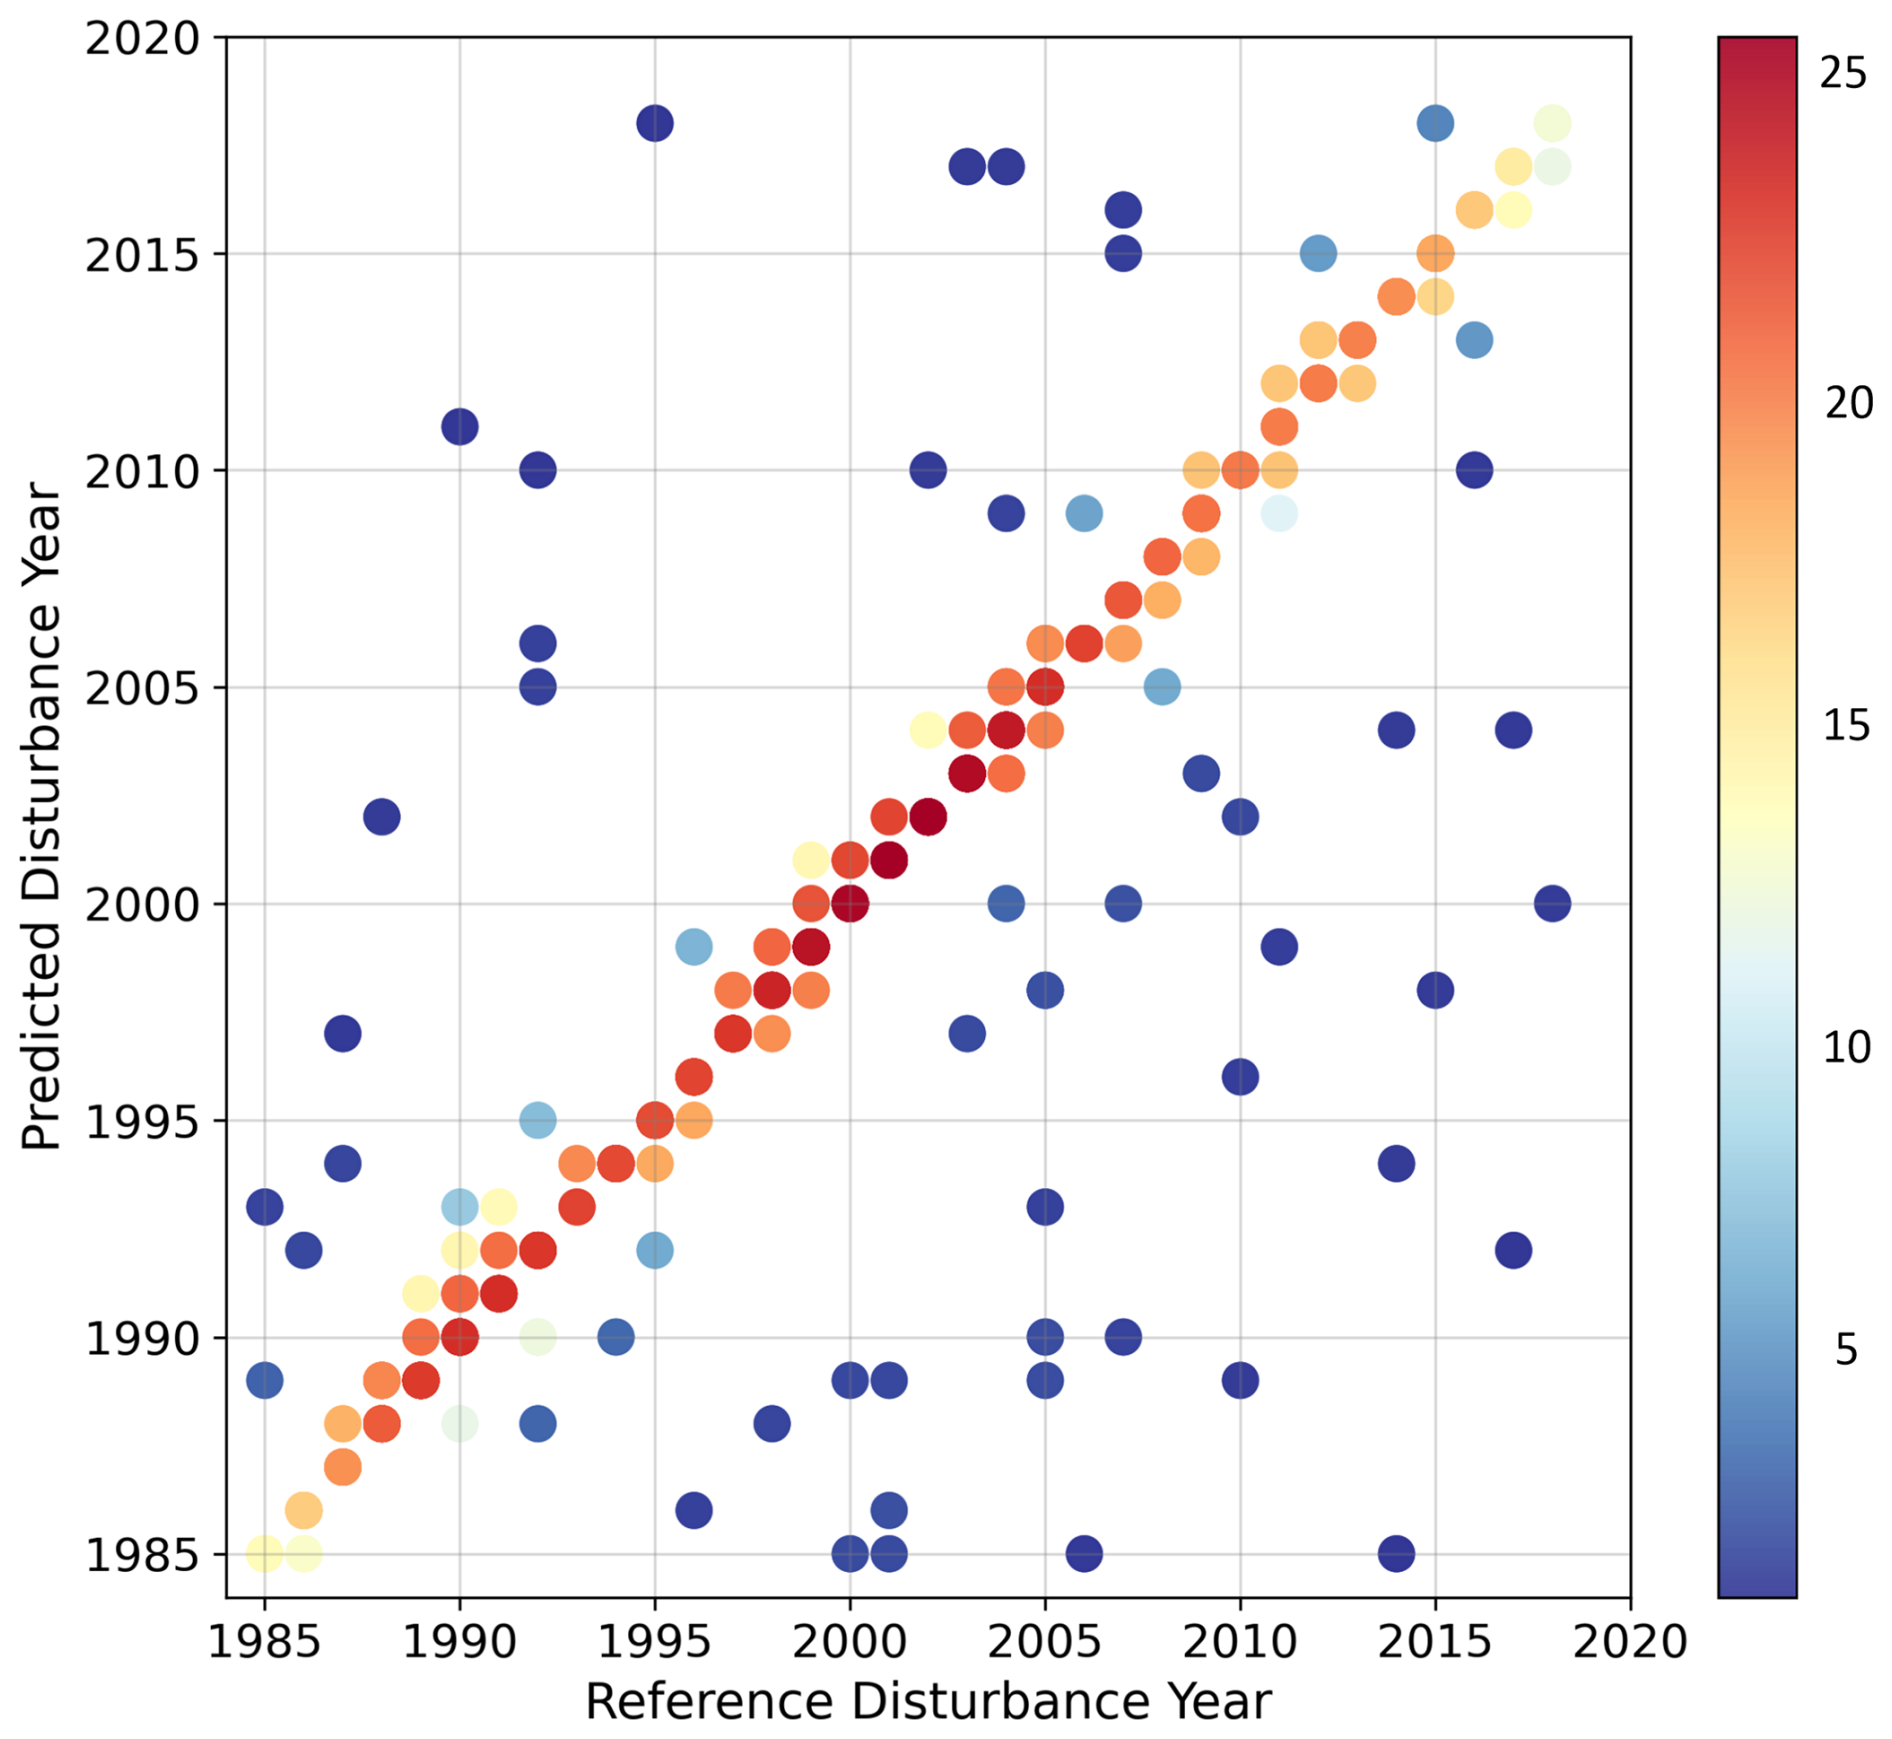
Figure 9Validation of the disturbance year. Estimated disturbance year versus manually interpreted year of disturbance for independent reference pixels (colour bar indicates the number of points).
The model predicting the disturbance agent performed well, having an overall error rate of 14.1 %, with commission error rates (false occurrences) of 10.5 % for bark beetle–windstorm disturbances, 5.7 % for fire disturbances, and 17.4 % for harvest (Table 7). The omission error rates (i.e. model missed a true occurrence) were 19.1 % for bark beetle–windstorm disturbances, 25.5 % for fire-related disturbances, and 8.7 % for harvest. We note again that the accuracies reported here are model accuracies and not map accuracies derived from an independent sample.
Table 7Confusion matrix of disturbance agent model assessment.

3.3 Comparison to other datasets
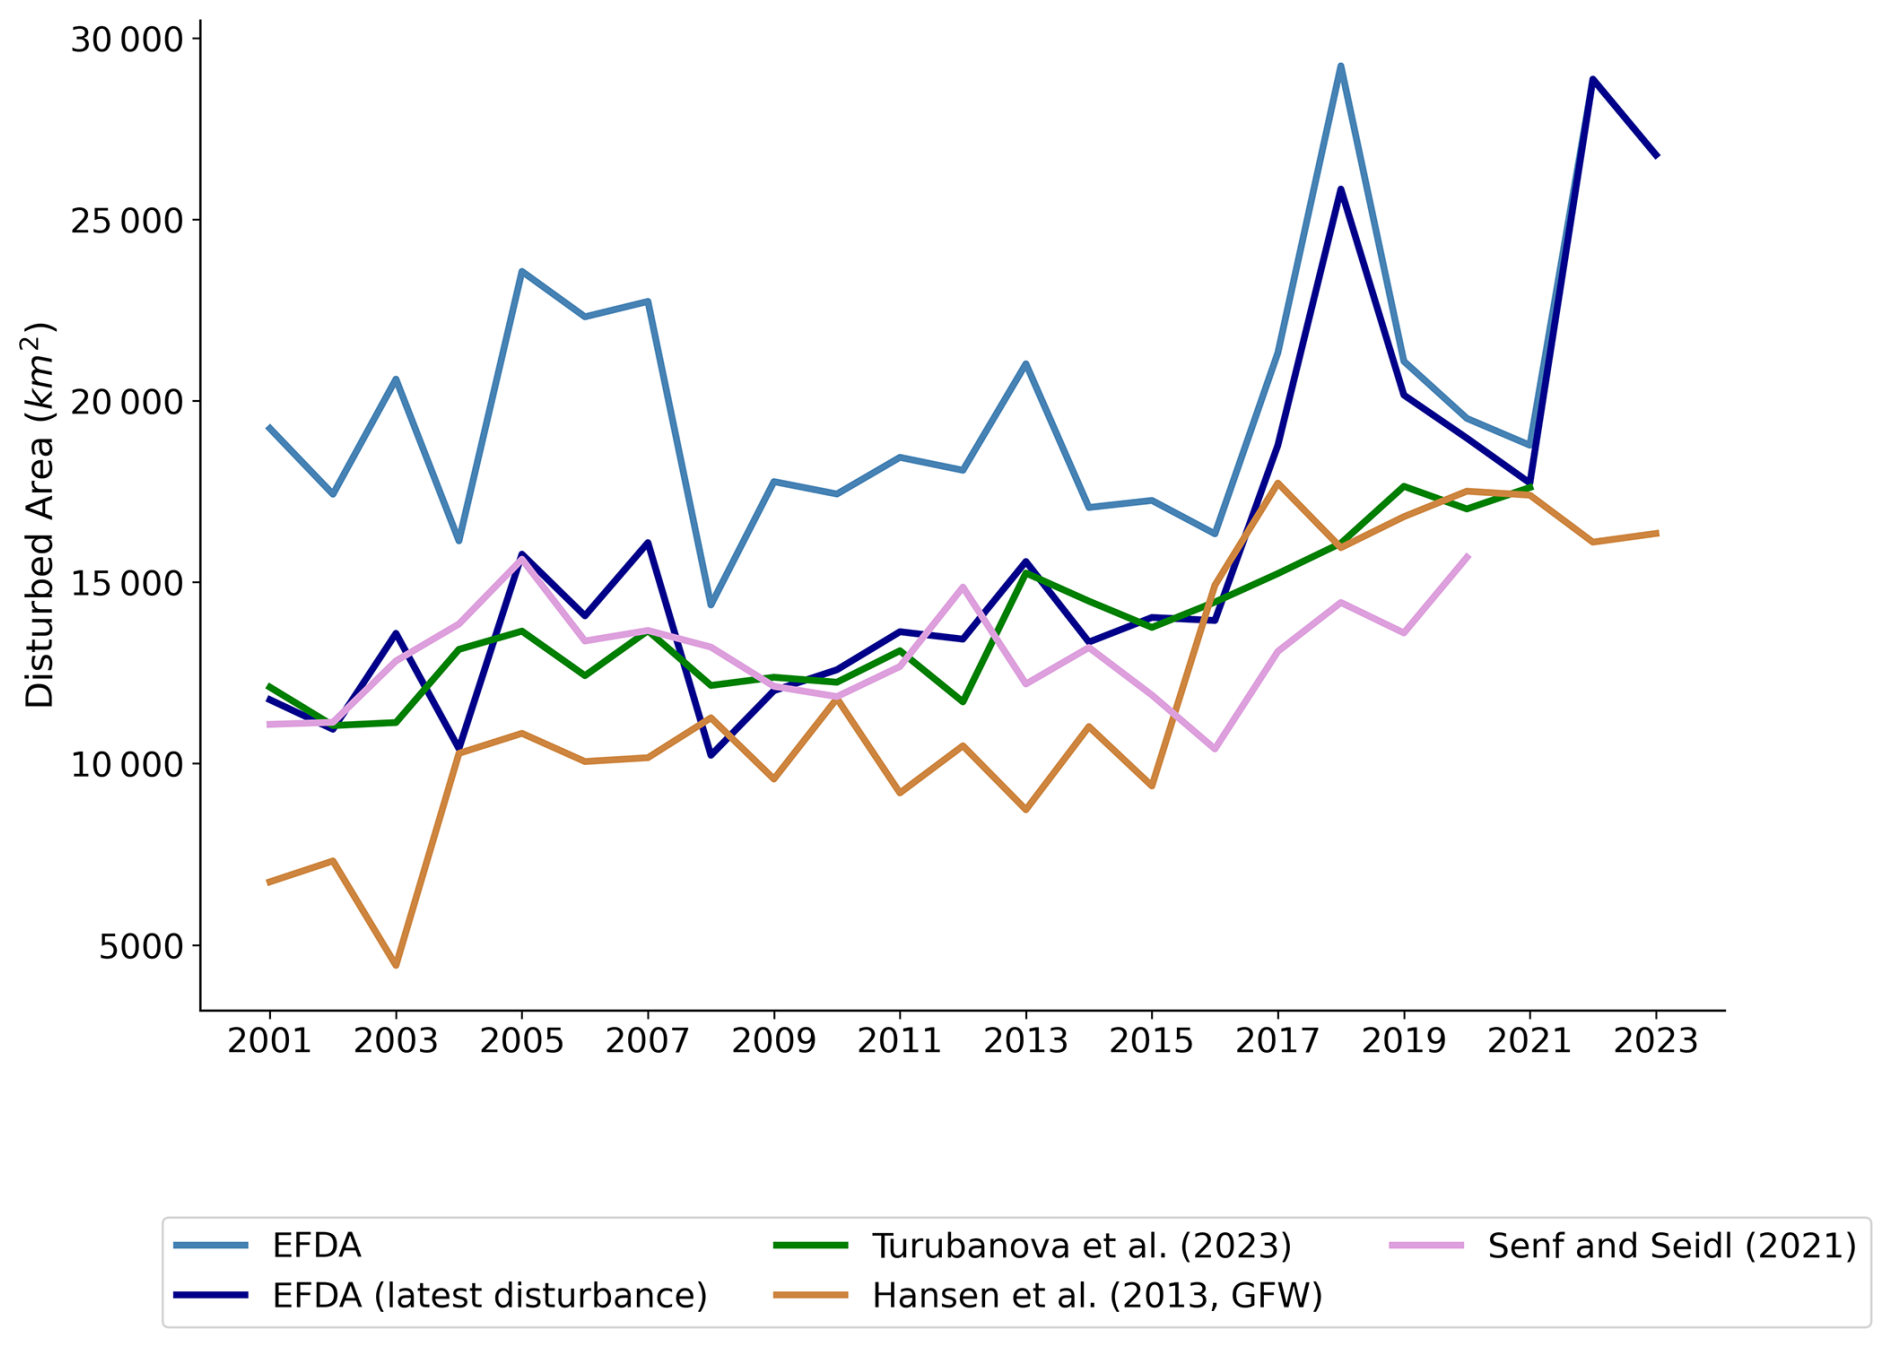
Comparison of EFDA disturbance maps with available datasets for Europe (Hansen et al., 2013; Senf and Seidl, 2021a; Turubanova et al., 2023) revealed differences in terms of annual estimates but also showed similarities in terms of increasing disturbance area since 2001 (Fig. 10). Overall, the EFDA's average annual disturbance area (19 544 km2 yr−1) was 30.2 % higher than the estimates in Turubanova et al. (2023) (13 631 km2 yr−1), 33.2 % higher than the estimates in Senf and Seidl (2021a) (13 038 km2 yr−1), and 42.6 % higher than the estimates in Hansen et al. (2013) (11 207 km2 yr−1). Using the EFDA's latest disturbance map (average annual disturbance area of 14 756 km2) instead of the annual disturbance maps, however, improved agreement with the other maps significantly, specifically by 7.6 % for Turubanova et al. (2023), by 11.6 % for Senf and Seidl (2021a), and by 24 % for Hansen et al. (2013), indicating that multiple disturbances can increase disturbance estimates substantially.
Here, we presented the European Forest Disturbance Atlas (EFDA), providing spatially explicit information on disturbances from 1985 onwards and demonstrating the importance of long time series for understanding disturbance change, disturbance regimes, and disturbance interactions. While there are already several disturbance products for Europe (Senf and Seidl, 2021a; Turubanova et al., 2023), our new dataset moves beyond existing products in at least three important ways: first, annual disturbance mapping enables the capturing of multiple disturbance events, providing direct information on disturbance frequencies and temporal interactions. Information on multiple overlapping disturbances is often not assessed or simplified to the greatest or latest disturbance of the analysis period. Without capturing disturbances on an annual basis, however, we lose valuable information on forest dynamics (Buma, 2015; Hermosilla et al., 2019), such as disturbance return times (Pugh et al., 2019), and this might lead to underestimation of total disturbance area (see Fig. 10). We found, for example, return times of 15–20 years for recurrent fires in the Mediterranean or in short-rotation plantations across Europe (e.g. Hungary, Sweden, the Netherlands) and further temporal interactions between harvest and wind disturbances in the Gascony area in France (i.e. wind disturbance following a harvest event). Including multiple disturbances was thus an important improvement over past map products available for Europe. Second, the long time frame of our map products offers a baseline for understanding more recently observed changes and for quantifying trends over time. Furthermore, we designed the workflow to be operationally updated when new data arrive and therefore enabled the creation of up-to-date maps annually after the summer season. Third, our approach is consistently applicable over all European forests with variable forest types and forest disturbances. It is thus likely to be adoptable and replicable in other regions. To facilitate user uptake and reproducibility, we provide a full open-access framework that can be implemented on any computer system, independently of commercial cloud environments, data providers, or software tools. The European Forest Disturbance Atlas thus contributes to a future operational forest monitoring envisioned for Europe.
One of the aims of this paper was to provide a full characterisation of map accuracies. Compared to the first pan-European disturbance product developed by Senf and Seidl (2021a), which reported a commission error of 17.1 % and an omission error of 36.9 % for detecting disturbances, we reduced omission errors considerably (22.5 %) while maintaining low commission errors (17 %). That is, the EFDA detects more true disturbances compared to past state-of-the-art products while making similar errors in falsely detecting disturbances. Disturbance areas derived from Senf and Seidl (2021a) are thus likely to be conservative estimates that underestimate true disturbance area (Fig. 10). A similar improvement was found in the timing of disturbances, with a mean absolute error of 3 years for Senf and Seidl (2021a) compared to 1.9 years for our map, indicating that fewer disturbances are attributed to a wrong year compared to manually interpreted data. The disturbance detection accuracies found here are, furthermore, consistent with more local approaches implemented in Europe, such as that of Francini et al. (2021), who reported omission and commission errors of 27 % and 30 % for clear-cut mapping in Italy with the 3I3D algorithm, or recently developed disturbance maps for the European Alps (Morresi et al., 2024), with omission and commission errors of 16.9 % and 16.5 %, and for continental Spain (Miguel et al., 2024), with omission and commission errors of 12.4 % and 18 %, respectively. Our map was of slightly lower accuracy than a very recent pan-European forest disturbance map developed by Turubanova et al. (2023), with omission and commission errors of ∼ 19 % and ∼ 7 %, but their map only covers disturbances from 2001 onwards. Comparing our map accuracies to Turubanova et al. (2023) for the same period yields approximately similar accuracies between both map products (see Fig. 8). Finally, our forest land use mask yielded high accuracies, and the forest area estimated per country aligned well with estimates provided by FOREST EUROPE (2020). Remaining differences can be explained by the different temporal reporting periods as FOREST EUROPE reports the forest area in 2020, but we provide a multi-temporal land use definition, comprising all areas that have been classified as forest land use at some point since 1985. Our forest land use map is also distinctly different from recent tree cover products (Liu et al., 2023; Turubanova et al., 2023) as it includes recently disturbed areas that might be temporally unstocked but will return to closed-canopy forests in the near future (Mandl et al., 2024) and thus meets our forest land use definition. Using static tree cover maps would mask out those areas based on the (arbitrary) year they were created for. We thus move away from a static forest cover map to a forest land use map that reflects the spatial and temporal dynamics of forests (Chazdon et al., 2016).
Beyond accuracies reported from different datasets, we found dissimilarities in terms of annual disturbed-area estimates from different maps, with the EFDA leading to +7.6 % to up to +42 % higher estimates in terms of average annual disturbance area. Several factors are likely to be responsible for those stark differences, including different map accuracies, disturbance detection logics (i.e. definition of disturbance and model calibration), and forest mask definitions. First, the EFDA has a lower omission error than previous products (see previous paragraph), which must lead to a higher disturbance area because fewer disturbances are missed in our map than in previous maps. This becomes especially evident when comparing maps tailored for Europe (Senf and Seidl, 2021a; Turubanova et al., 2023) to global products (Hansen et al., 2013), which substantially underestimate disturbed area. Second, the EFDA allows for multiple disturbances, which can increase disturbance area in comparison to summary products that only allow for one disturbance per time series (i.e. Senf and Seidl, 2021a). We show this impressively in Fig. 10, where our annual disturbance estimate is substantially higher than the annual values summarised in the latest disturbance product. Accounting for multiple disturbances (which we estimate for 28 % of all pixels) thus makes a difference in terms of the total disturbance area estimates because more recent or higher-severity disturbances can mask out older or less severe disturbances. We found this to be especially prominent in systems dominated by fire, where areas that burned in the mid-1990s or mid-2000s burned again in the most recent years (e.g. Portugal) or where plantation forests that had multiple harvests in the past had now burned in more recent years (e.g. France). Third, forest area definitions vary widely between map products and thus are likely to be a main factor explaining differences between disturbance estimates, especially when comparing our product to Turubanova et al. (2023) and Hansen et al. (2013). Both apply a very strict tree cover definition that will mask out any pixels that have not met the criteria. This can lead to disturbance patches being fragmented into several smaller disturbances. That is, while all map products detect the disturbance event, the actual area disturbed can vary quite significantly. Strict tree cover definitions, especially in terms of tree height, can also lead to missing multiple disturbances (i.e. re-burning fires), which might also explain some of the differences compared to our annual disturbance maps (see Fig. 11a). Further, image availability and observation gaps (e.g. ETM+ SCL-off problems) can also contribute to missing disturbed areas in large disturbance patches. One stark difference between the EFDA and the other datasets could be detected in 2018 and 2022 (Fig. 10), driven by commission errors in northern regions (see Table 6 and Fig. 11c). Both years were particularly dry in Fennoscandia and central Europe (Knutzen et al., 2025), leading to strong spectral differences, especially in wetland areas (Fig. 11c). Yet, the disturbance peak in 2018 detected in the EFDA coincides with the peak in natural disturbance activity reported earlier (Patacca et al., 2023), attributed to large-scale bark beetle outbreaks in central Europe (see Fig. 11b). Discrepancies between disturbance maps have also been reported for other regions (Cohen et al., 2017), with even stronger disagreement. It is therefore necessary to cautiously analyse and understand the methodological nuances of the different approaches to consider how errors might influence use in a variety of contexts.
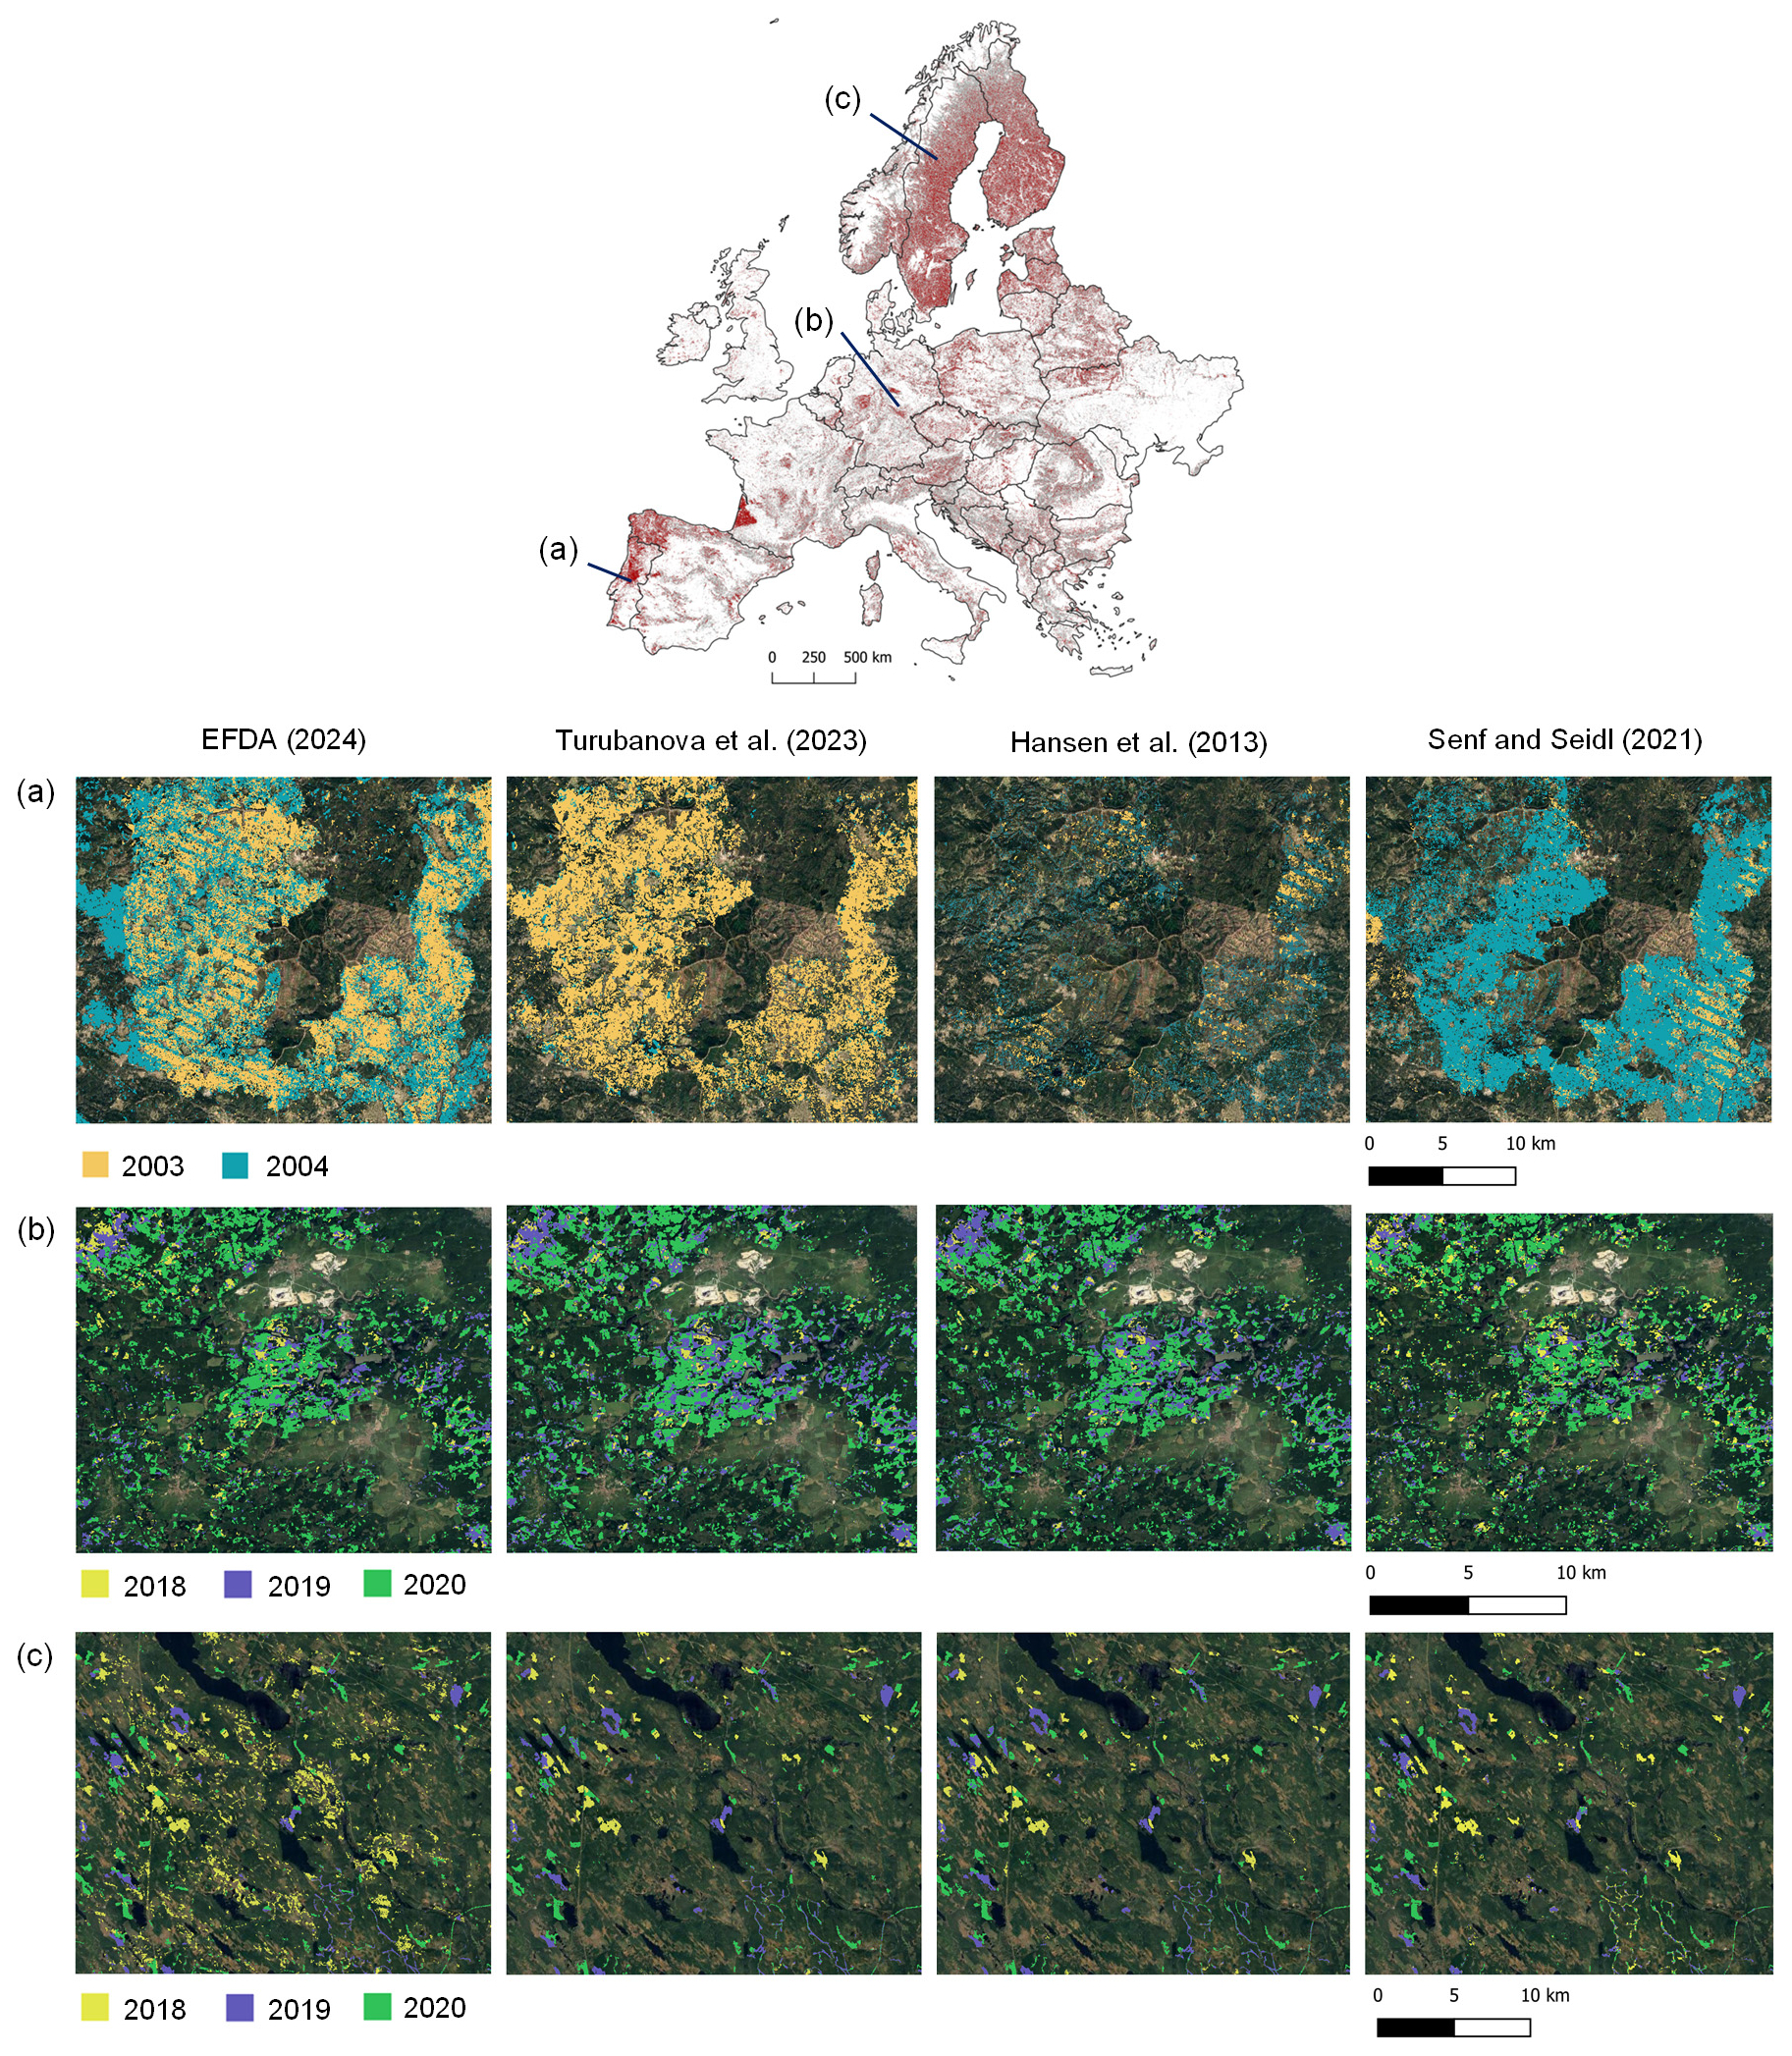
Figure 11Examples of disturbance maps from different datasets for (a) fires in central Portugal, (b) bark beetle outbreaks in central Germany, and (c) harvests in northern Sweden.
Despite the good accuracies compared to past and other map products, there are several limitations and possible sources of uncertainties that should be considered when using the EFDA. The higher omission error for the disturbed class and the wider confidence intervals indicate a possible limitation of our approach when mapping low-severity disturbances that do not produce a clear opening of the canopy (e.g. canopy thinning). The effect of such non-stand-replacing disturbances is clearly seen when redoing the accuracy assessment without them, which nearly halved the omission error (Table B1 in Appendix B). Non-stand-replacing disturbances are quite widespread in central and southern Europe, leading to higher omission errors in those regions compared to in northern Europe, mostly characterised by clear-cut harvesting. In northern Europe, however, a higher frequency of missing data and noise (i.e. remaining clouds, difficult illumination conditions, short summer season) led to higher commission errors in comparison to central and southern Europe, where data availability was higher overall (see Fig. 2b). We further found that omission errors were caused by a delayed detection of disturbances (i.e. disturbances detected 1 year after the reference). The detection of disturbances with a delay of 1 year is a common problem when working with annual summer composites, where disturbances can occur in the same year but after the compositing date (i.e. a pixel is selected from August, but the disturbance occurs in November and will thus only be detected the next summer). Finally, the use of a minimum mapping unit may contribute to the omission of small-scale disturbances <0.27 ha but reduces false positives from individual isolated pixels (Reinosch et al., 2024). We thus argue that the loss of information imposed by the minimum mapping unit outweighs the potential error introduced by including many small-scale disturbances with high errors. The application of a minimum mapping unit is also a common practice to facilitate the integration with different data sources such as national forest inventories (Wulder et al., 2024) or national land use products (Gómez et al., 2019). The temporal validation revealed variability in the accuracy over the time series, with the 1980s and 1990s having considerably lower accuracies (especially in terms of commission error) than disturbances detected after the 2000s (Fig. 8, Table B2). This result highlights challenges with reliably estimating disturbance trends from remote sensing data (see Olofsson et al., 2014, for an in-depth discussion) as trends derived from disturbance maps with variable accuracy will be biased (Palahí et al., 2021). Quantification of disturbances and trends should thus be based on a manually interpreted sample or should based on models that take into account the variable accuracies over time (Francini et al., 2022; Olofsson et al., 2014). Finally, despite careful processing and checking, there will be errors remaining in the underlying remote sensing data, and specific regions and years will have large errors resulting from noise. For example, some peaks in terms of the higher omission errors displayed in Fig. 8 coincide with years with higher percentages of no-data pixels, as, for example, in the 1980s, 1998, 2008, or 2012 (Fig. A2). This limitation is intrinsic to the data used for producing the EFDA, but, so far, there is no other consistent alternative to provide spatially explicit and consistent information for monitoring Europe's forests over time.
We provide an agent attribution layer based on a previous established model (Seidl and Senf, 2024), complementing the disturbance layers of the EFDA described in this study. Although comparison of estimates with existing databases for fire and storms in Senf and Seidl (2021b) and for salvage logging in Seidl and Senf (2024) showed high agreement of the attribution model with external datasets, an independent validation sample based on the actual occurrence of disturbance agents is still missing for robust reporting of uncertainties. According to the random forest variable importance (see Fig. A6), landscape pulse dynamics and patch size were most important for disentangling disturbance agents, likely because they typically occur in clusters and are characterised by larger, more complex patch shapes. In contrast, harvests tend to be more regular in space and time (Senf and Seidl, 2021b). However, the fact that management superimposes most natural disturbances through salvage logging makes it difficult to disentangle the root cause of disturbance. This is especially true when natural disturbances are salvage logged because the annual resolution of the EFDA does not allow us to disentangle the initial natural disturbance and the subsequent salvage logging. That is, most of the natural disturbances mapped in the EFDA will be a combination of an inciting natural factor (bark beetle or wind disturbance) and subsequent salvage logging (Seidl and Senf, 2024). We also miss less prevalent natural disturbance agents in our attribution map (Stahl et al., 2023), such as drought and more gradual non-stand-replacing disturbances that can also impact forests globally (Coops et al., 2020; Hammond et al., 2022). The agent attribution provided in the EFDA should thus be taken with caution as reliable estimates of map accuracies are absent, and making causal claims regarding the importance of natural disturbances remains challenging (despite our estimate of 20.8 % of natural disturbances matching well with the findings of Patacca et al. (2023)). Novel data collected across Europe might help with overcoming challenges with agent attribution (Forzieri et al., 2020, 2023; Patacca et al., 2023), but most data do not cover the 1980s and 1990s, which are especially important for improving map accuracy and quality. Further research should thus increasingly focus on generating reference data that can be used for remote sensing applications (e.g. Franquesa et al., 2020; Senf, 2019), and we urge authors to make their reference data openly available, ultimately leading to a better understanding of forest change across Europe.
The European Forest Disturbance Atlas data are freely accessible from https://doi.org/10.5281/zenodo.13333034 (Viana-Soto and Senf, 2024) code https://doi.org/10.5281/zenodo.15579709 (Viana Soto, 2025), and summary layers are accessible through Google Earth Engine in ee.Assets.latest_disturbance_v211, ee.Assets.number_disturbances_v211, and ee.Assets.disturbance_agent_v211. The maps can be also explored online: https://albaviana.users.earthengine.app/view/european-forest-disturbance-map (Viana-Soto and Senf, 2025). The code used for processing the Landsat data using FORCE is available at https://github.com/davidfrantz/force (Frantz, 2025). The code used for the subsequent processing steps is available at Viana Soto (2025).
There is a pressing need for an operational forest monitoring system at the European scale, and our newly developed disturbance atlas (EFDA) constitutes a first step in this direction by producing disturbance information in a standardised way, with consistent quality across all of Europe's forest. Our approach further relies on open-source data and tools and is implemented in an open-access framework, which allows full reproducibility and easy updating into the future and thus paves the road for operationalisation. Our data already cover 40 years of forest disturbance dynamics, constituting the longest remote-sensing-based disturbance product available at the continental scale today. Covering such long time series allows for a better characterisation of disturbance regimes, requiring several decades of data to reliably quantify underlying distributions (Maroschek et al., 2024), and can help to improve disturbance modelling by providing empirical data on disturbance occurrence (e.g. Grünig et al., 2022). Hence, the EFDA will improve our understanding of European forest disturbance dynamics beyond simple monitoring of forest disturbances.
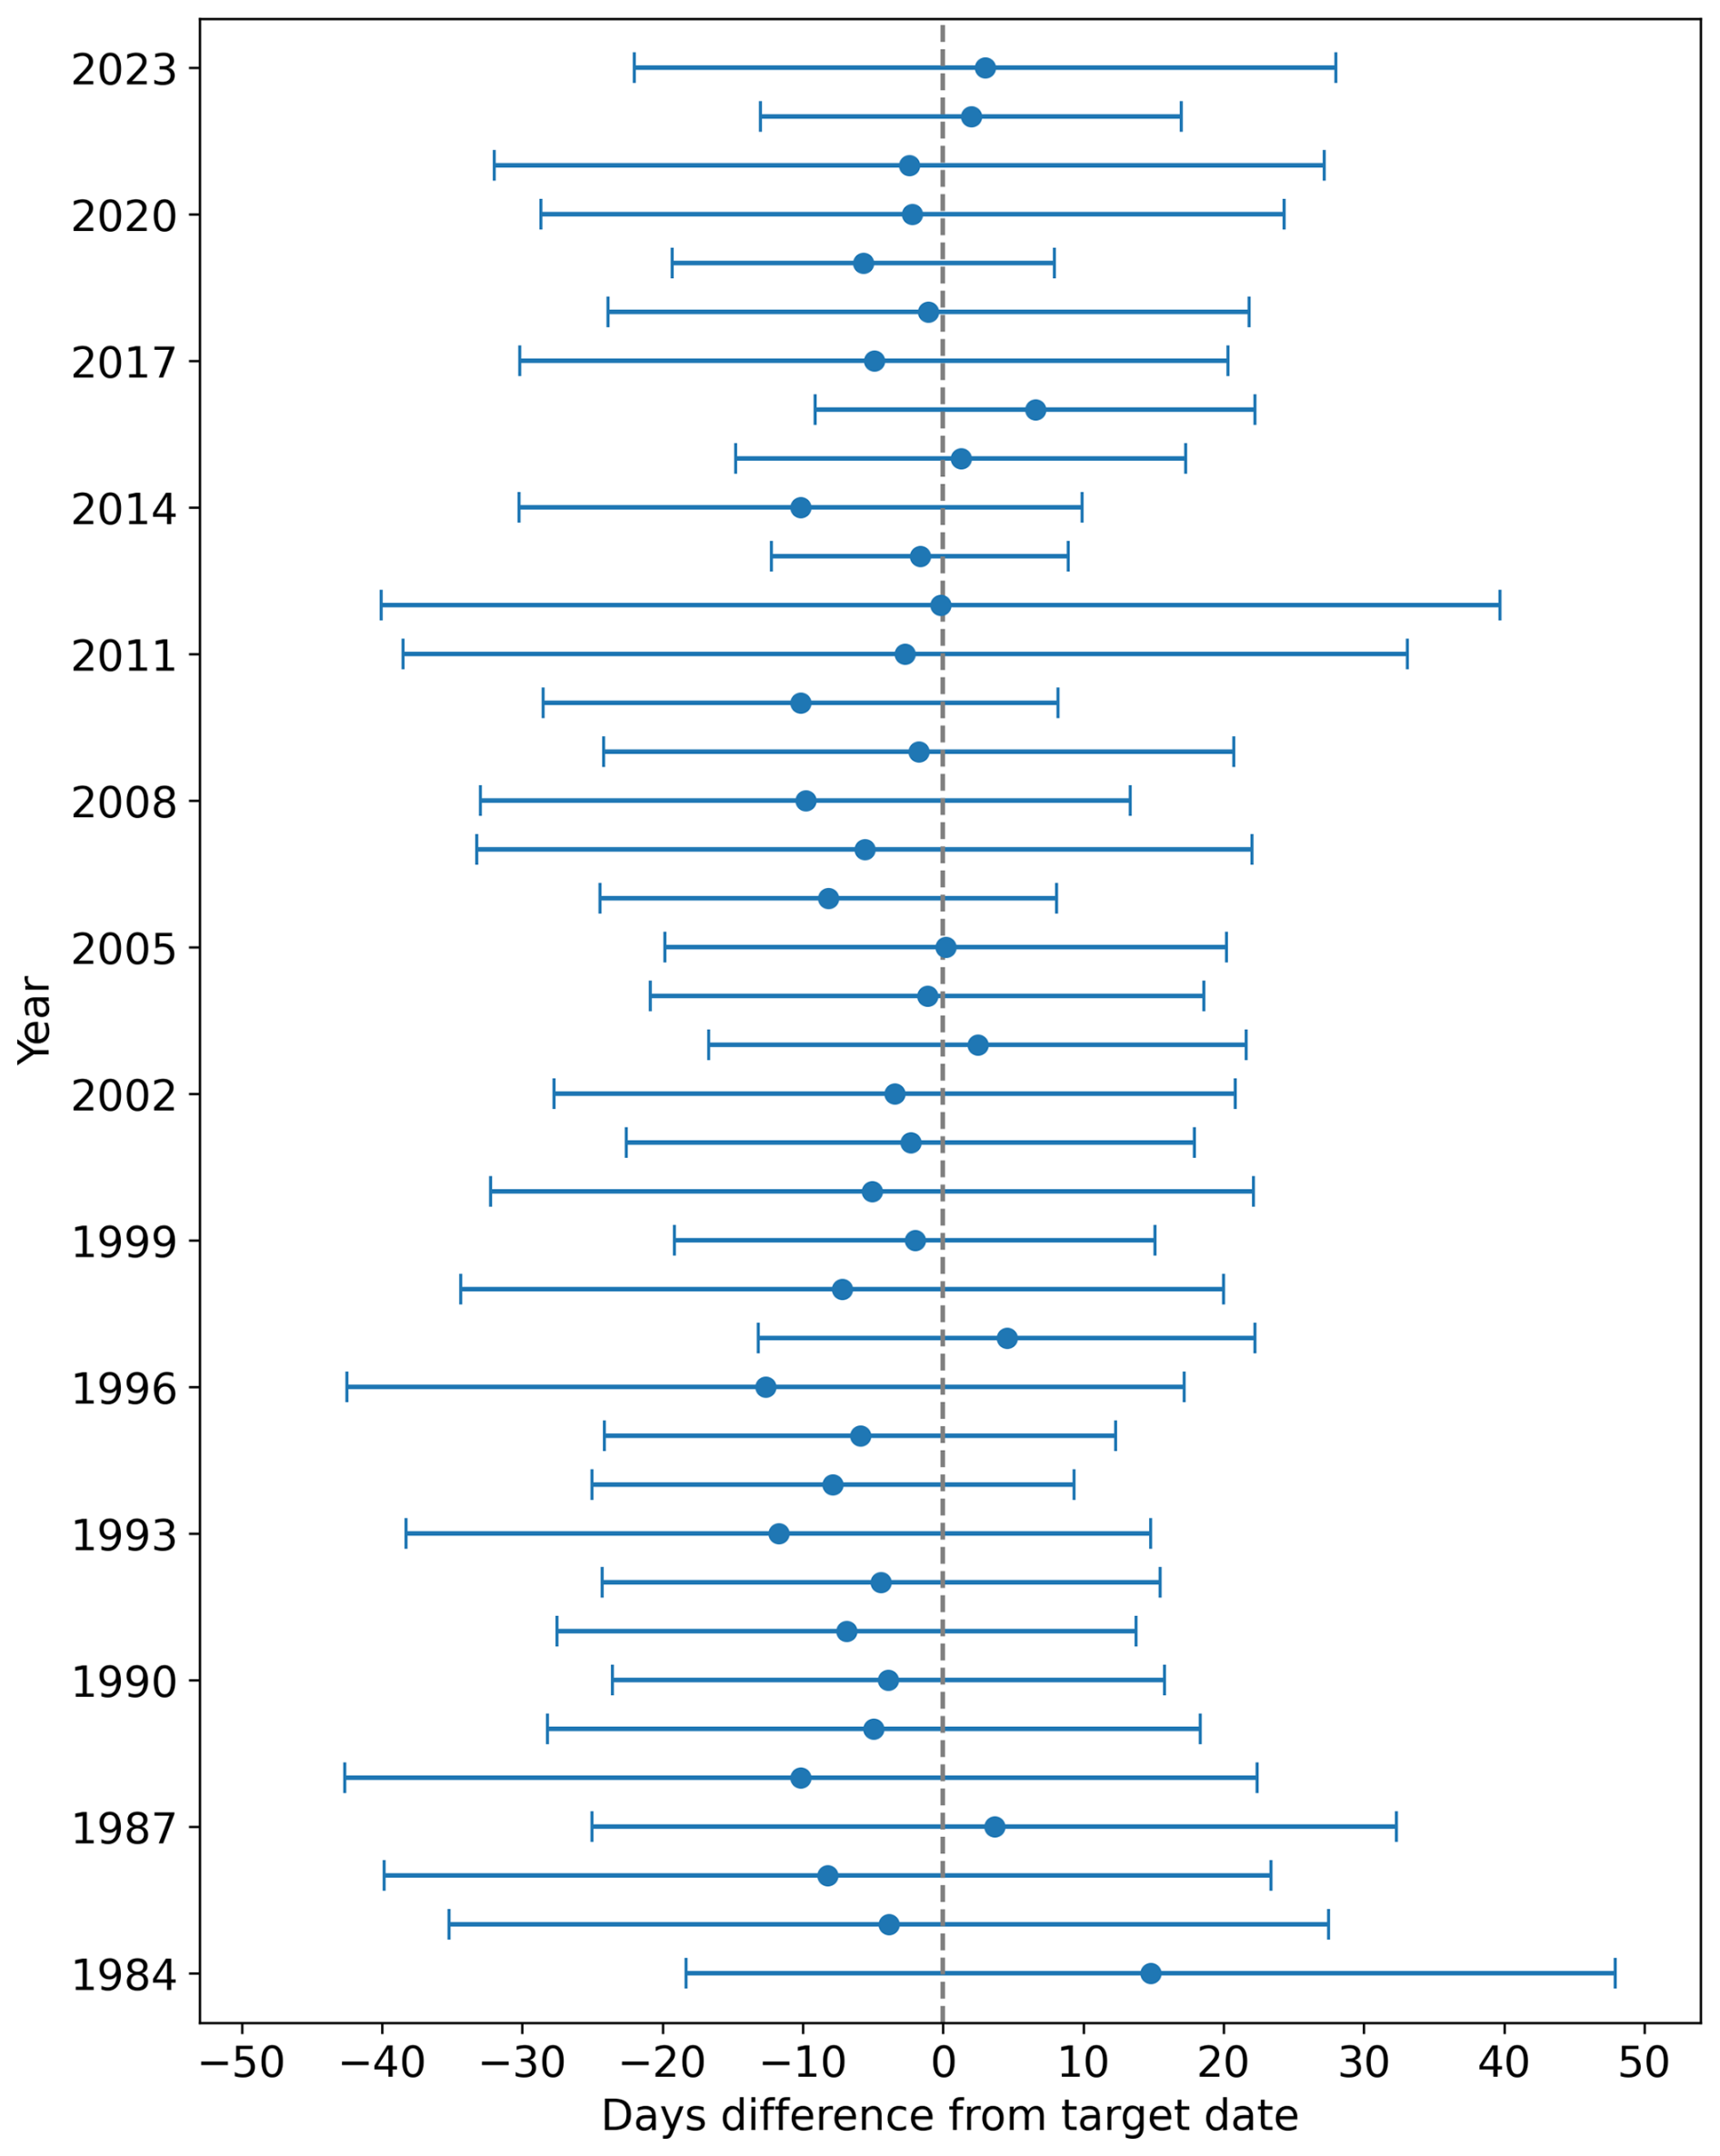
Figure A1Difference in days relative to the target date (1 August) per year (mean ± standard deviation).
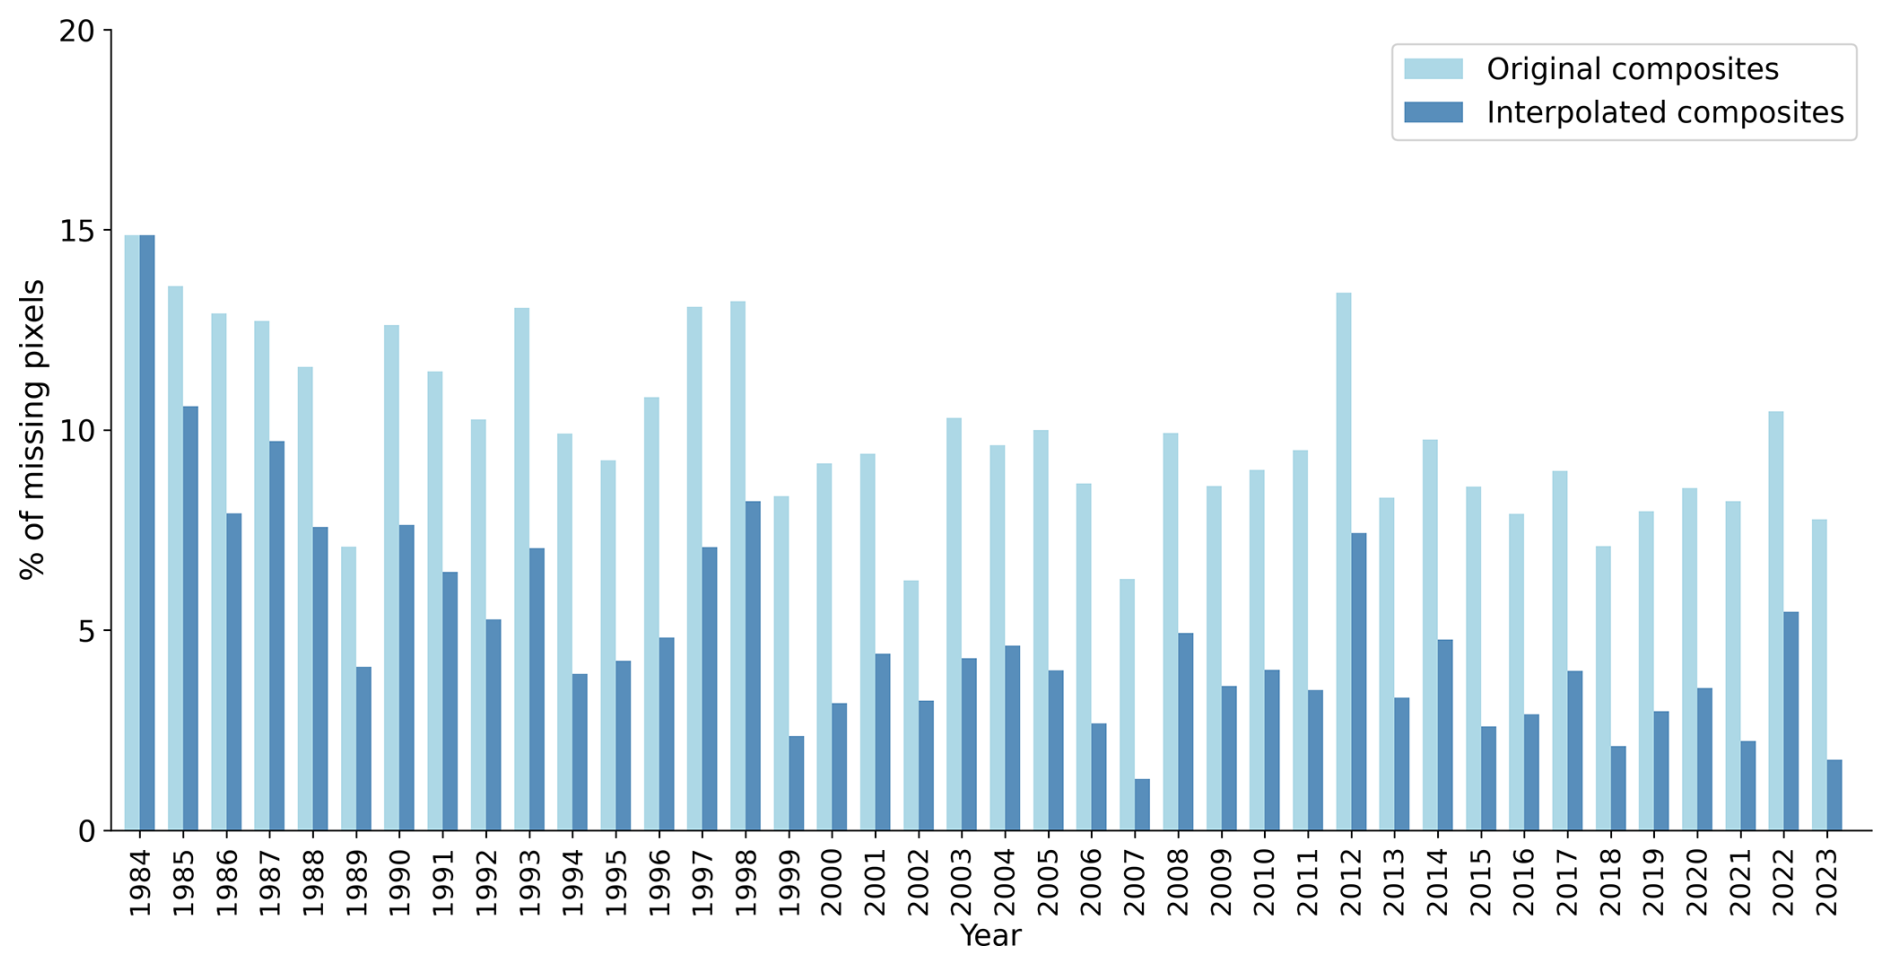
Figure A2Annual percentage of no-data pixels for best-available-pixel composites and after linear gap-filling interpolation.
Table A1Spectral indices and tasseled-cap-component equations for Landsat.

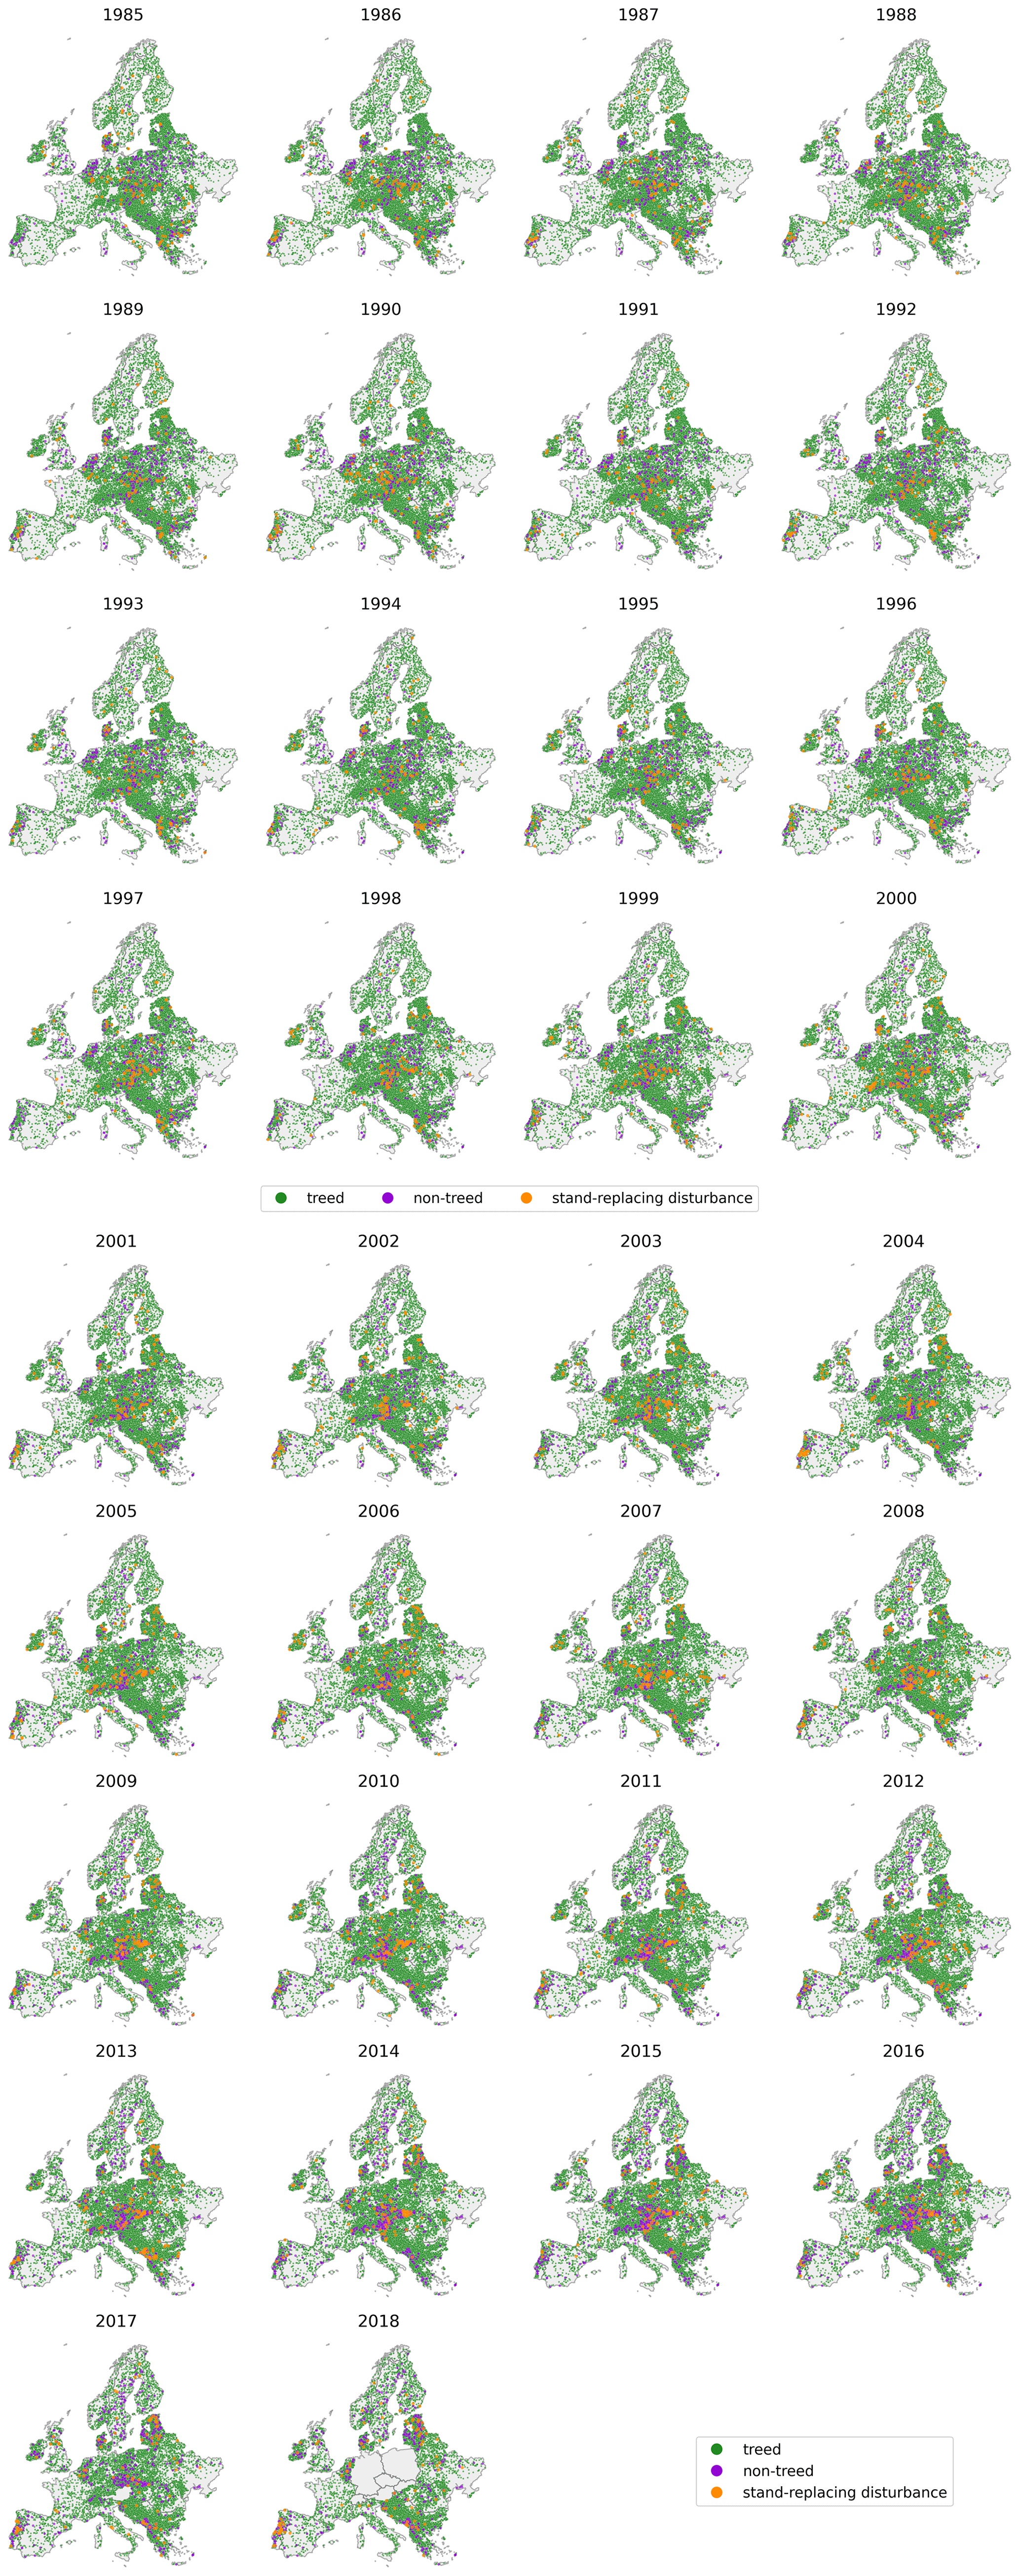
Figure A3Maps of annual reference data within forests for disturbance and undisturbed (treed and non-treed).
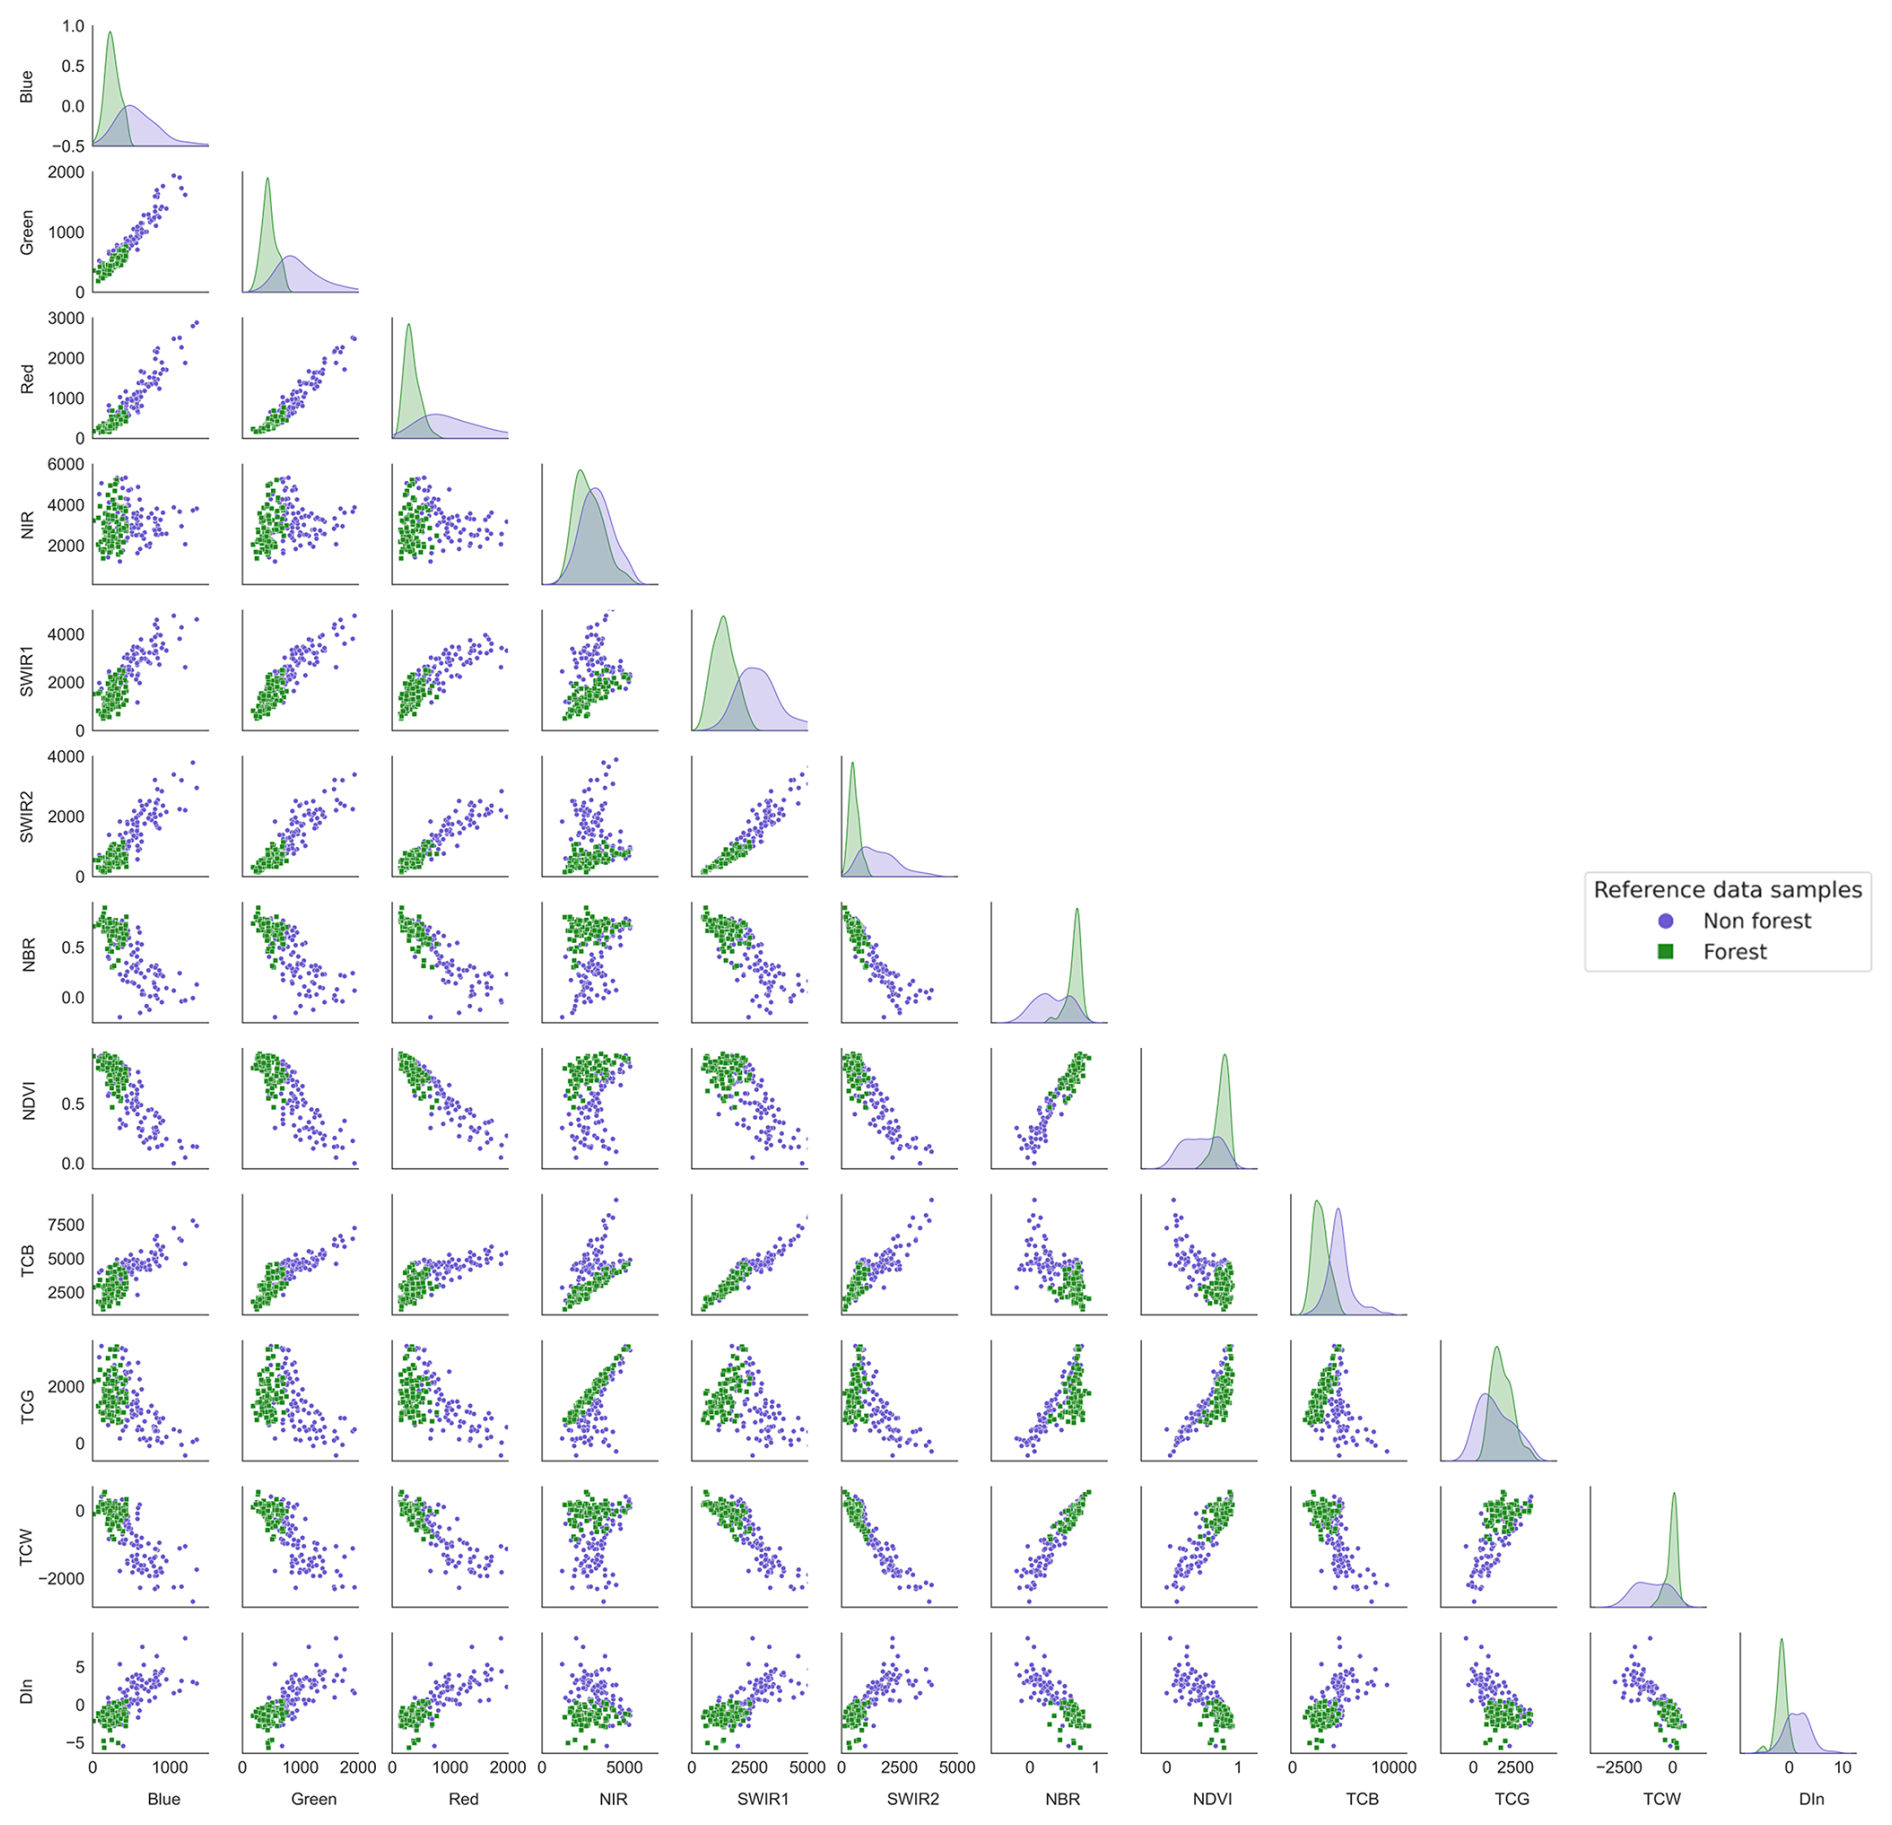
Figure A4Feature space of spectral bands and indices for forest and non-forest reference samples.
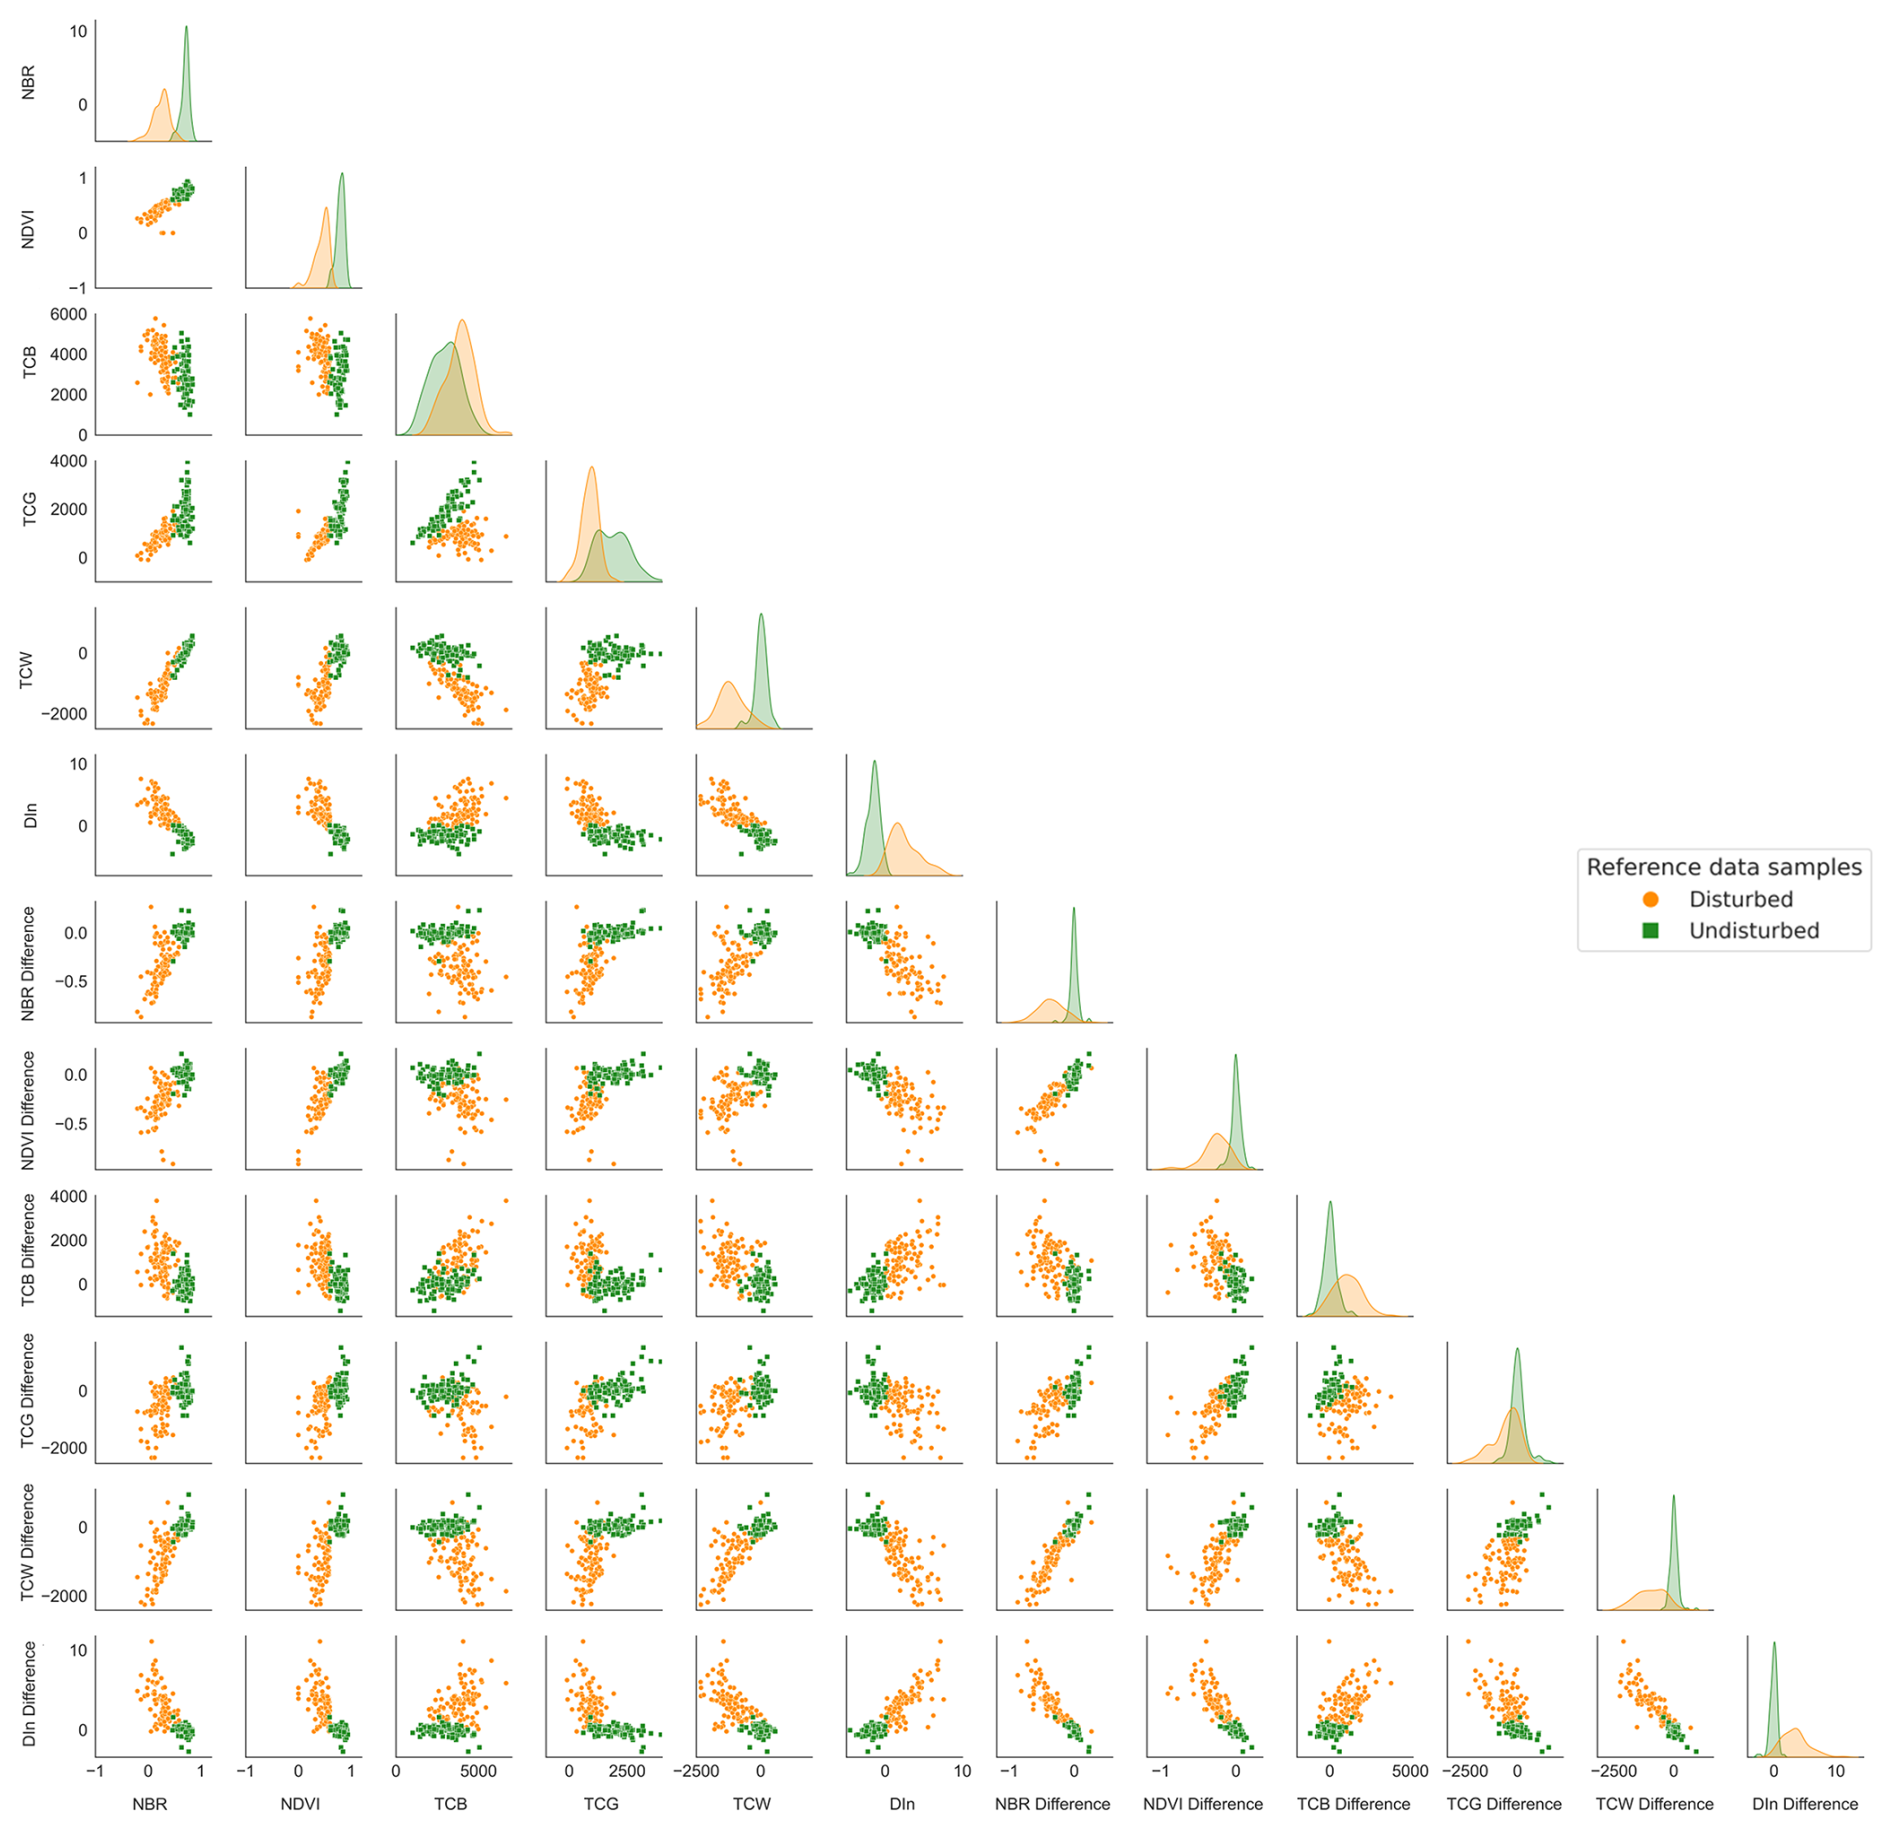
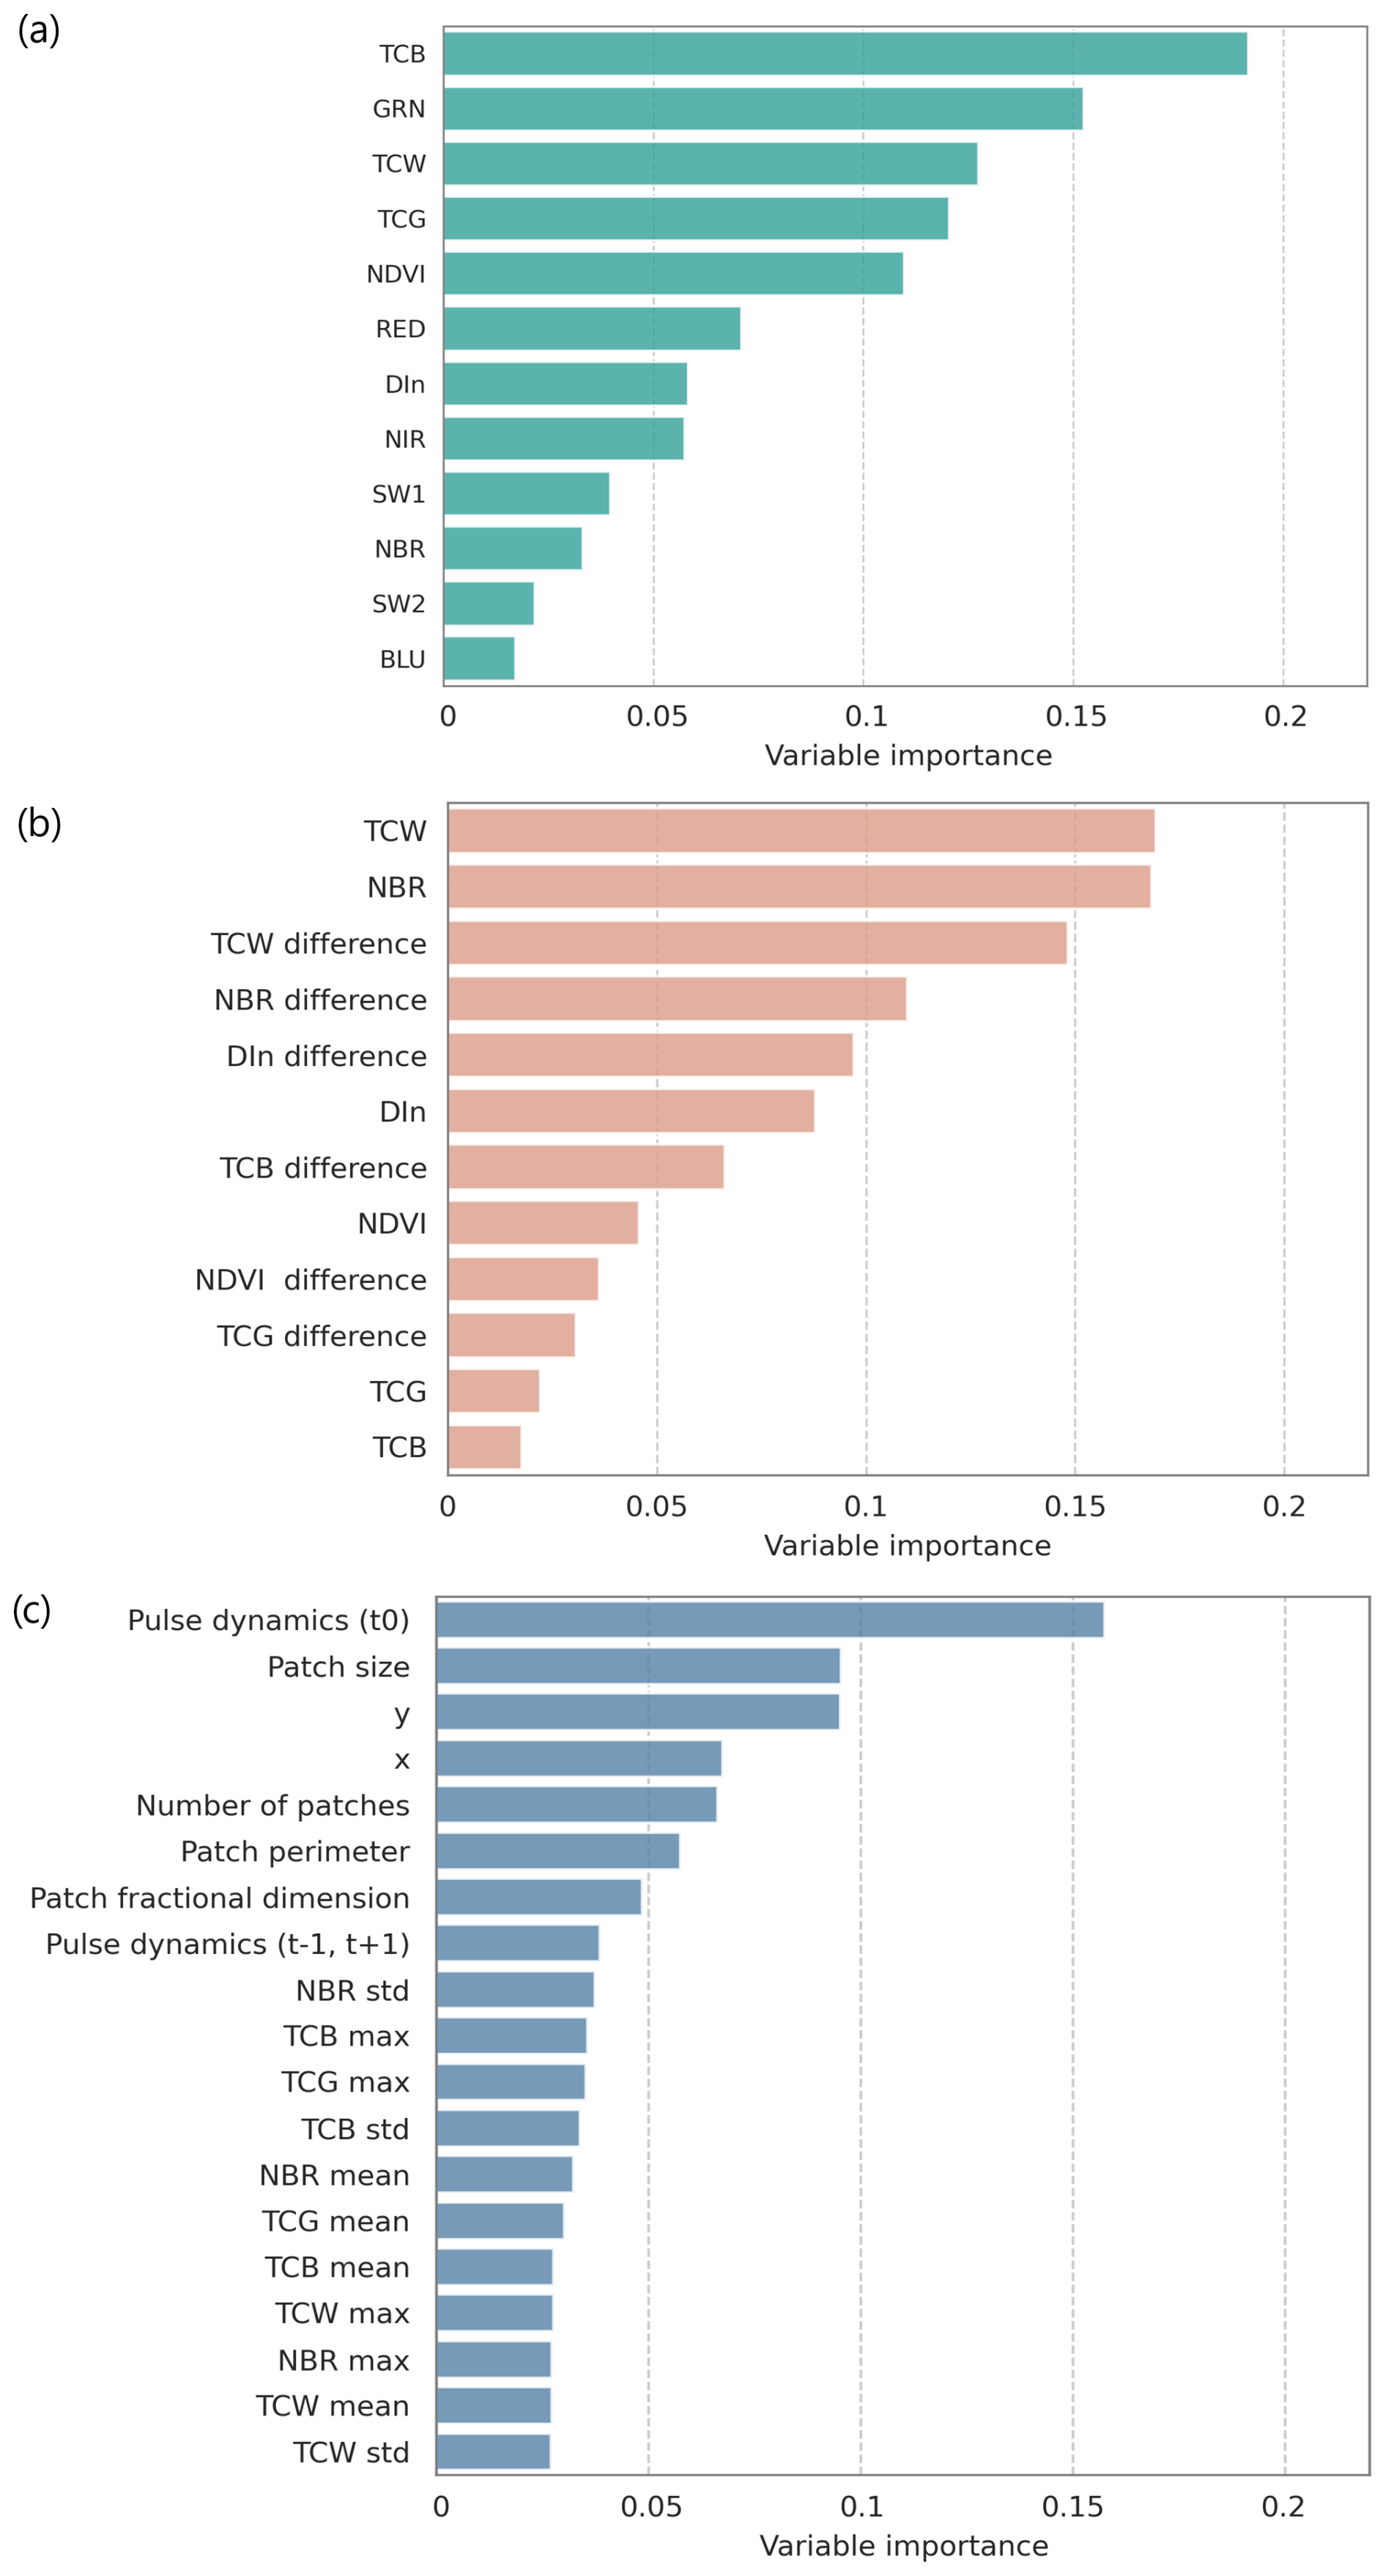
Figure A6Variable importance (as returned by the random forest algorithm) for (a) forest land use classification, (b) disturbance–no disturbance classification, and (c) disturbance agent attribution model. Higher values indicate higher importance for discrimination.
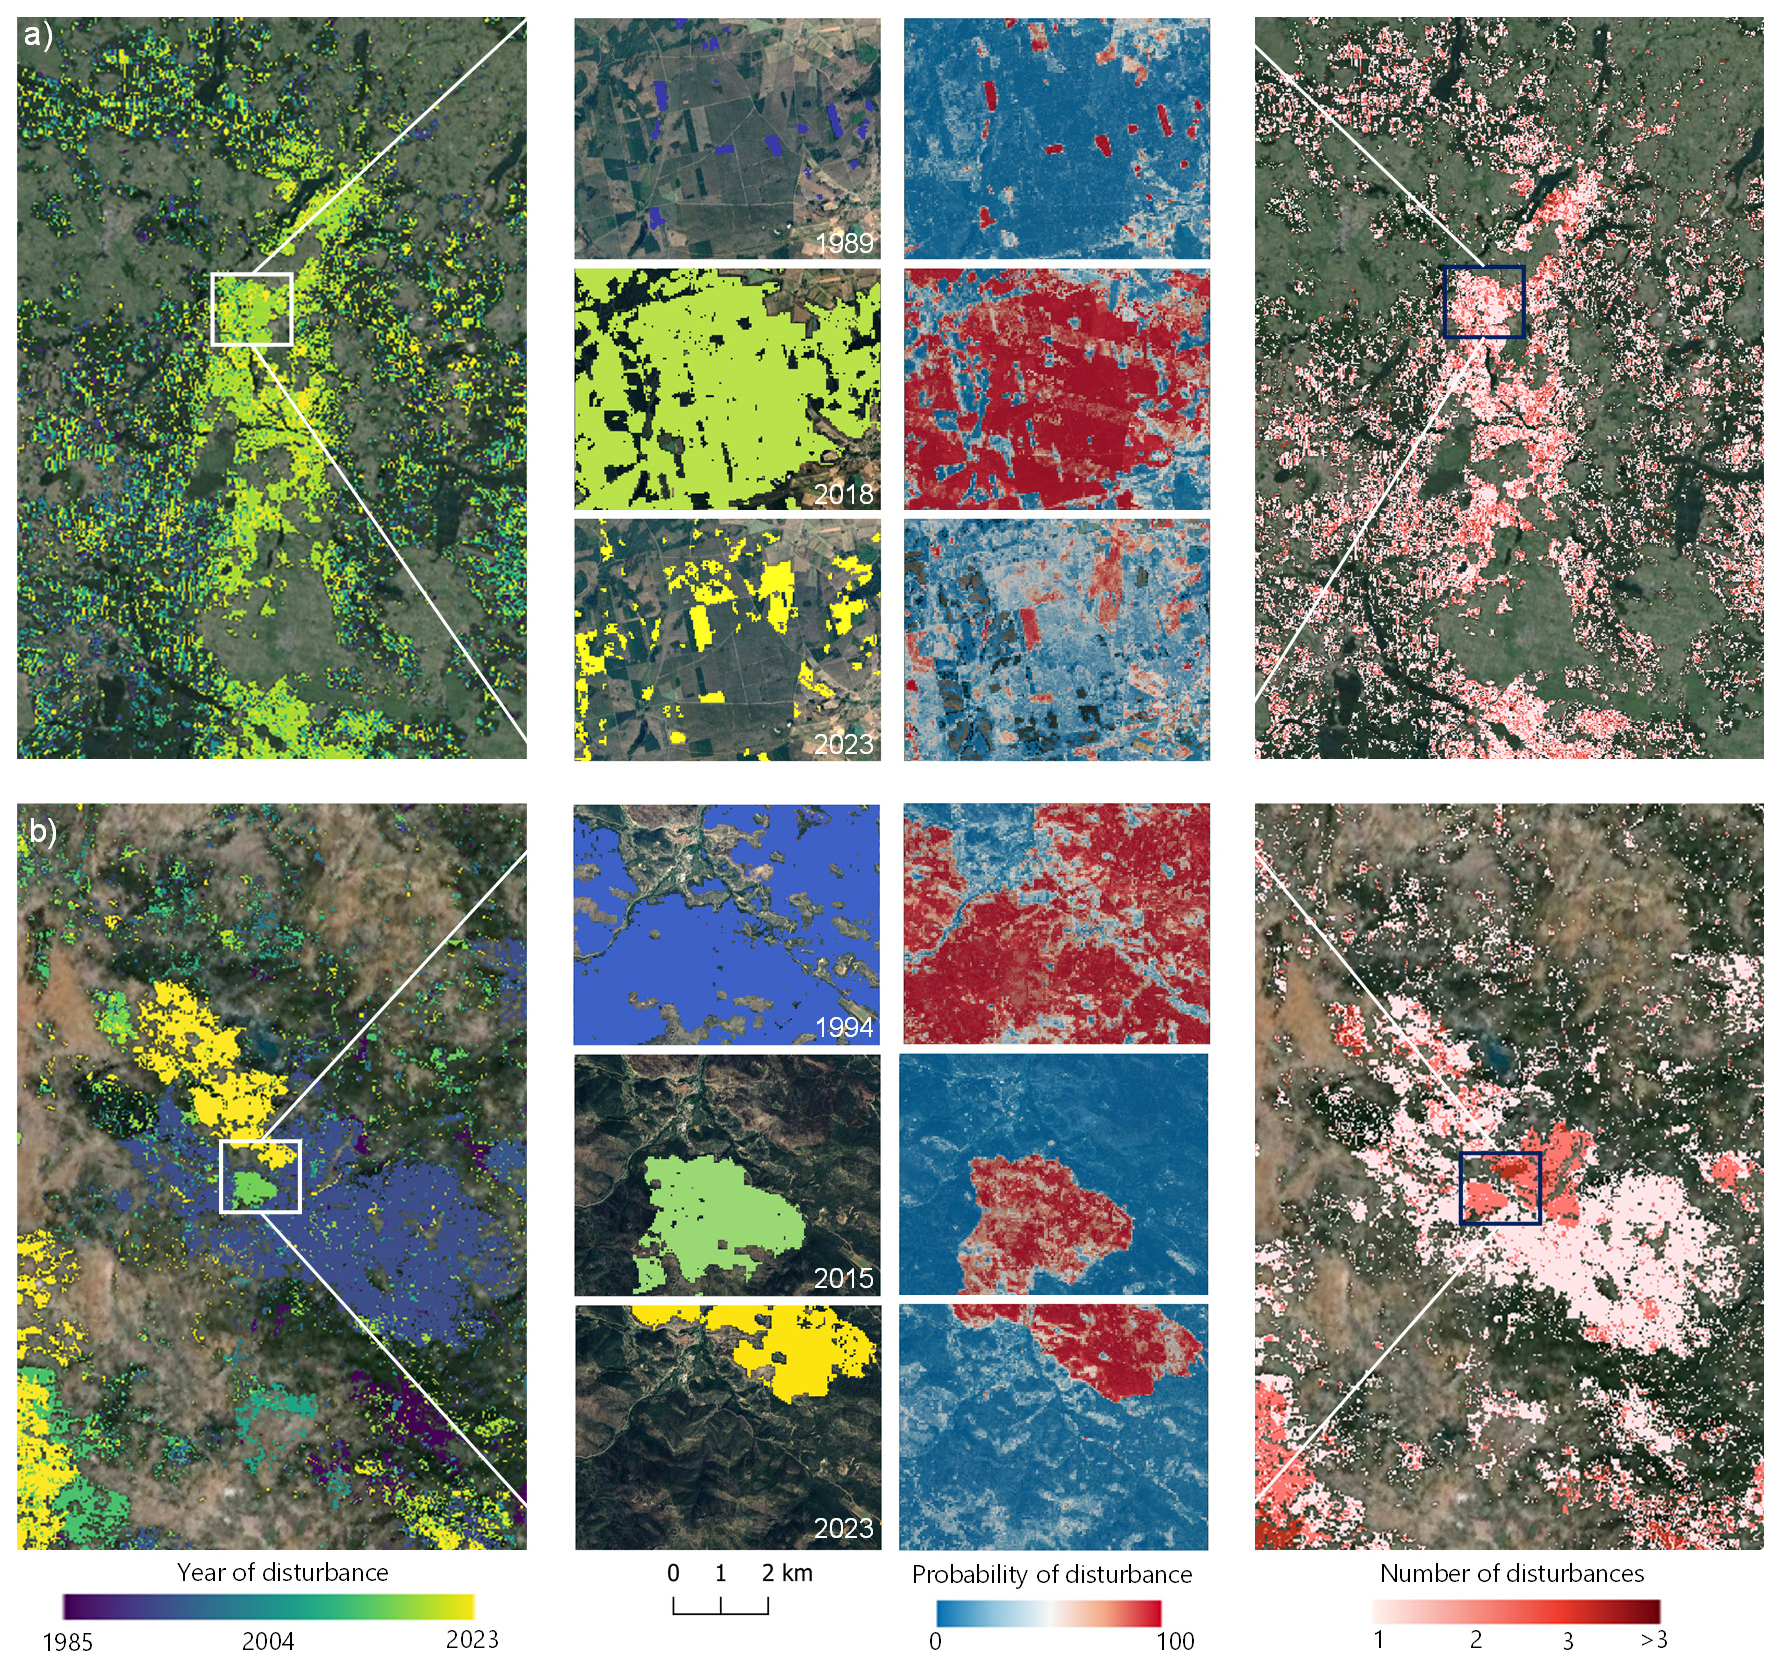
Figure B1Examples of annual disturbances with correspondent probability of disturbance and summary of number of disturbance events (underlying imagery © Google Earth). (a) Area affected by recent windstorm in northern Poland that overlaps with past and current harvest activities. (b) Multiple fire events in eastern Spain.
Table B1Confusion matrix of disturbance detection assessment, leaving out non-stand-replacing disturbances.

Table B2Confusion matrix of disturbance detection assessment per period.

AVS and CS designed the research. CS compiled the reference data. AVS performed all of the computations and analyses. AVS and CS wrote the paper.
The contact author has declared that neither of the authors has any competing interests.
Publisher's note: Copernicus Publications remains neutral with regard to jurisdictional claims made in the text, published maps, institutional affiliations, or any other geographical representation in this paper. While Copernicus Publications makes every effort to include appropriate place names, the final responsibility lies with the authors.
We thank the editor and two reviewers for their helpful suggestions, which improved this paper. We thank David Franzt (Trier University) for developing, maintaining, and making the code of FORCE open source. We thank Michael Reuss for facilitating the gap-filling process.
This research has been supported by the European Union's Horizon Europe Research and Innovation Programme through the ForestPaths project (Co-designing holistic forest-based policy pathways for climate change mitigation; grant no. 101056755) and by the Bundesministerium für Bildung und Forschung (BMBF) through the AI4Forest project (grant no. 01IS23025A).
This paper was edited by Christopher Neigh and reviewed by Emilio Chuvieco and one anonymous referee.
Abrams, M., Crippen, R., and Fujisada, H.: ASTER Global Digital Elevation Model (GDEM) and ASTER Global Water Body Dataset (ASTWBD), Remote Sens., 12, 1156, https://doi.org/10.3390/rs12071156, 2020.
Baig, M. H. A., Zhang, L., Shuai, T., and Tong, Q.: Derivation of a tasselled cap transformation based on Landsat 8 at-satellite reflectance, Remote Sens. Lett., 5, 423–431, https://doi.org/10.1080/2150704X.2014.915434, 2014.
Banskota, A., Kayastha, N., Falkowski, M. J., Wulder, M. A., Froese, R. E., and White, J. C.: Forest Monitoring Using Landsat Time Series Data: A Review, Can. J. Remote Sens., 40, 362–384, https://doi.org/10.1080/07038992.2014.987376, 2014.
Belgiu, M. and Drãguþ, L.: Random forest in remote sensing: A review of applications and future directions, ISPRS J. Photogramm. Remote Sens., 114, 24–31, https://doi.org/10.1016/j.isprsjprs.2016.01.011, 2016.
Breidenbach, J., Ellison, D., Petersson, H., Korhonen, K. T., Henttonen, H. M., Wallerman, J., Fridman, J., Gobakken, T., Astrup, R., and Næsset, E.: Harvested area did not increase abruptly – how advancements in satellite-based mapping led to erroneous conclusions, Ann. For. Sci., 79, 2, https://doi.org/10.1186/s13595-022-01120-4, 2022.
Buma, B.: Disturbance interactions: characterization, prediction, and the potential for cascading effects, Ecosphere, 6, 1–15, https://doi.org/10.1890/ES15-00058.1, 2015.
Cardille, J. A., Perez, E., Crowley, M. A., Wulder, M. A., White, J. C., and Hermosilla, T.: Multi-sensor change detection for within-year capture and labelling of forest disturbance, Remote Sens. Environ., 268, 112741, https://doi.org/10.1016/j.rse.2021.112741, 2022.
Ceccherini, G., Duveiller, G., Grassi, G., Lemoine, G., Avitabile, V., Pilli, R., and Cescatti, A.: Abrupt increase in harvested forest area over Europe after 2015, Nature, 583, 72–77, https://doi.org/10.1038/s41586-020-2438-y, 2020.
Chawla, N. V., Bowyer, K. W., Hall, L. O., and Kegelmeyer, W. P.: SMOTE: Synthetic Minority Over-sampling Technique, J. Artif. Intell. Res., 16, 321–357, https://doi.org/10.1613/jair.953, 2002.
Chazdon, R. L., Brancalion, P. H. S., Laestadius, L., Bennett-Curry, A., Buckingham, K., Kumar, C., Moll-Rocek, J., Vieira, I. C. G., and Wilson, S. J.: When is a forest a forest? Forest concepts and definitions in the era of forest and landscape restoration, Ambio, 45, 538–550, https://doi.org/10.1007/s13280-016-0772-y, 2016.
Ciais, P., Schelhaas, M. J., Zaehle, S., Piao, S. L., Cescatti, A., Liski, J., Luyssaert, S., Le-Maire, G., Schulze, E.-D., Bouriaud, O., Freibauer, A., Valentini, R., and Nabuurs, G. J.: Carbon accumulation in European forests, Nat. Geosci., 1, 425–429, https://doi.org/10.1038/ngeo233, 2008.
Cohen, W., Healey, S., Yang, Z., Stehman, S., Brewer, C., Brooks, E., Gorelick, N., Huang, C., Hughes, M., Kennedy, R., Loveland, T., Moisen, G., Schroeder, T., Vogelmann, J., Woodcock, C., Yang, L., and Zhu, Z.: How Similar Are Forest Disturbance Maps Derived from Different Landsat Time Series Algorithms?, Forests, 8, 98, https://doi.org/10.3390/f8040098, 2017.
Cohen, W. B., Yang, Z., and Kennedy, R.: Detecting trends in forest disturbance and recovery using yearly Landsat time series: 2. TimeSync – Tools for calibration and validation, Remote Sens. Environ., 114, 2911–2924, https://doi.org/10.1016/j.rse.2010.07.010, 2010.
Cohen, W. B., Yang, Z., Healey, S. P., Kennedy, R. E., and Gorelick, N.: A LandTrendr multispectral ensemble for forest disturbance detection, Remote Sens. Environ., 205, 131–140, https://doi.org/10.1016/j.rse.2017.11.015, 2018.
Coops, N. C., Shang, C., Wulder, M. A., White, J. C., and Hermosilla, T.: Change in forest condition: Characterizing non-stand replacing disturbances using time series satellite imagery, Forest Ecol. Manag., 474, 118370, https://doi.org/10.1016/j.foreco.2020.118370, 2020.
Crist, E. P.: A TM Tasseled Cap equivalent transformation for reflectance factor data, Remote Sens. Environ., 17, 301–306, https://doi.org/10.1016/0034-4257(85)90102-6, 1985.
d'Andrimont, R., Yordanov, M., Martinez-Sanchez, L., Eiselt, B., Palmieri, A., Dominici, P., Gallego, J., Reuter, H. I., Joebges, C., Lemoine, G., and Van Der Velde, M.: Harmonised LUCAS in-situ land cover and use database for field surveys from 2006 to 2018 in the European Union, Sci. Data, 7, 352, https://doi.org/10.1038/s41597-020-00675-z, 2020.
Dutrieux, L., Senf, C., Feret, J.-B., Malenovský, Z., and Beck, P. S. A.: JRC Expert Meeting on Remote Sensing: based bark beetle outbreak detection and mapping: held 22 November 2022 online, Publications Office of the European Union, Luxembourg, https://doi.org/10.2760/616623, 2023.
European Commission, Joint Research Centre, Dutrieux, L., Beck, P., Herold, M., Olofsson, P., and Tsendbazar, N.: JRC expert meeting on accuracy assessment and comparison of forest disturbance products, Publications Office of the European Union, https://doi.org/10.2760/881978, 2023.
FAO: Global Forest Resources Assessment 2020: Main report, Rome, https://doi.org/10.4060/ca9825en, 2020.
Fassnacht, F. E., White, J. C., Wulder, M. A., and Næsset, E.: Remote sensing in forestry: current challenges, considerations and directions, For. Int. J. For. Res., 97, 11–37, https://doi.org/10.1093/forestry/cpad024, 2024.
Ferretti, M.: Europe needs a joined-up approach for monitoring and protecting its forests, Nature, 626, 954–954, 2024.
Ferretti, M., Gessler, A., Cools, N., Fleck, S., Guerrieri, R., Jakovljeviæ, T., Nicolas, M., Nieminen, T. M., Pitar, D., Potoèiæ, N., Raspe, S., Schaub, M., Schwärzel, K., Timmermann, V., Vejpustková, M., Vesterdal, L., Vanninen, P., Waldner, P., Zimmermann, L., and Sanders, T. G.: Perspectives: Resilient forests need joint forces for better inventorying and monitoring, Forest Ecol. Manag., 561, 121875, https://doi.org/10.1016/j.foreco.2024.121875, 2024.
FOREST EUROPE: State of Europe's Forests, in: Ministerial Conference on the Protection of Forests in Europe – FOREST EUROPE, Liaison Unit Bratislava, https://doi.org/10.13140/RG.2.2.12881.76643, 2020.
Forman, G. and Scholz, M.: Apples-to-apples in cross-validation studies: pitfalls in classifier performance measurement, ACM SIGKDD Explor. Newsl., 12, 49–57, https://doi.org/10.1145/1882471.1882479, 2010.
Forzieri, G., Pecchi, M., Girardello, M., Mauri, A., Klaus, M., Nikolov, C., Rüetschi, M., Gardiner, B., Tomaštík, J., Small, D., Nistor, C., Jonikavicius, D., Spinoni, J., Feyen, L., Giannetti, F., Comino, R., Wolynski, A., Pirotti, F., Maistrelli, F., Savulescu, I., Wurpillot-Lucas, S., Karlsson, S., Zieba-Kulawik, K., Strejczek-Jazwinska, P., Mokroš, M., Franz, S., Krejci, L., Haidu, I., Nilsson, M., Wezyk, P., Catani, F., Chen, Y.-Y., Luyssaert, S., Chirici, G., Cescatti, A., and Beck, P. S. A.: A spatially explicit database of wind disturbances in European forests over the period 2000–2018, Earth Syst. Sci. Data, 12, 257–276, https://doi.org/10.5194/essd-12-257-2020, 2020.
Forzieri, G., Dutrieux, L. P., Elia, A., Eckhardt, B., Caudullo, G., Taboada, F. Á., Andriolo, A., Bãlãcenoiu, F., Bastos, A., Buzatu, A., Dorado, F. C., Dobrovolný, L., Duduman, M., Fernandez-Carrillo, A., Hernández-Clemente, R., Hornero, A., Ionuţ, S., Lombardero, M. J., Junttila, S., Lukeš, P., Marianelli, L., Mas, H., Mlèoušek, M., Mugnai, F., Neţoiu, C., Nikolov, C., Olenici, N., Olsson, P., Paoli, F., Paraschiv, M., Patoèka, Z., Pérez-Laorga, E., Quero, J. L., Rüetschi, M., Stroheker, S., Nardi, D., Ferenèík, J., Battisti, A., Hartmann, H., Nistor, C., Cescatti, A., and Beck, P. S. A.: The Database of European Forest Insect and Disease Disturbances: DEFID2, Glob. Change Biol., 29, 6040–6065, https://doi.org/10.1111/gcb.16912, 2023.
Francini, S., McRoberts, R. E., Giannetti, F., Marchetti, M., Scarascia Mugnozza, G., and Chirici, G.: The Three Indices Three Dimensions (3I3D) algorithm: a new method for forest disturbance mapping and area estimation based on optical remotely sensed imagery, Int. J. Remote Sens., 42, 4693–4711, https://doi.org/10.1080/01431161.2021.1899334, 2021.
Francini, S., McRoberts, R. E., D'Amico, G., Coops, N. C., Hermosilla, T., White, J. C., Wulder, M. A., Marchetti, M., Mugnozza, G. S., and Chirici, G.: An open science and open data approach for the statistically robust estimation of forest disturbance areas, Int. J. Appl. Earth Obs., 106, 102663, https://doi.org/10.1016/j.jag.2021.102663, 2022.
Francini, S., Hermosilla, T., Coops, N. C., Wulder, M. A., White, J. C., and Chirici, G.: An assessment approach for pixel-based image composites, ISPRS J. Photogramm. Remote Sens., 202, 1–12, https://doi.org/10.1016/j.isprsjprs.2023.06.002, 2023.
Franquesa, M., Vanderhoof, M. K., Stavrakoudis, D., Gitas, I. Z., Roteta, E., Padilla, M., and Chuvieco, E.: Development of a standard database of reference sites for validating global burned area products, Earth Syst. Sci. Data, 12, 3229–3246, https://doi.org/10.5194/essd-12-3229-2020, 2020.
Frantz, D.: FORCE – Landsat + Sentinel-2 Analysis Ready Data and Beyond, Remote Sens., 11, 1124, https://doi.org/10.3390/rs11091124, 2019.
Frantz, D.: force, GitHub [code], https://github.com/davidfrantz/force (last access: 4 June 2025), 2025.
Frantz, D., Roder, A., Udelhoven, T., and Schmidt, M.: Enhancing the Detectability of Clouds and Their Shadows in Multitemporal Dryland Landsat Imagery: Extending Fmask, IEEE Geosci. Remote Sens. Lett., 12, 1242–1246, https://doi.org/10.1109/LGRS.2015.2390673, 2015.
Frantz, D., Roder, A., Stellmes, M., and Hill, J.: An Operational Radiometric Landsat Preprocessing Framework for Large-Area Time Series Applications, IEEE T. Geosci. Remote Sens., 54, 3928–3943, https://doi.org/10.1109/TGRS.2016.2530856, 2016.
García, M. L. and Caselles, V.: Mapping burns and natural reforestation using Thematic Mapper data, Geocarto Int., 6, 31–37, 1991.
Gómez, C., Alejandro, P., Hermosilla, T., Montes, F., Pascual, C., Ruiz, L. Á., Álvarez-Taboada, F., Tanase, M. A., and Valbuena, R.: Remote sensing for the Spanish forests in the 21st century: A review of advances, needs, and opportunities, Forest Syst., 28, eR001, https://doi.org/10.5424/fs/2019281-14221, 2019.
Griffiths, P., Van Der Linden, S., Kuemmerle, T., and Hostert, P.: A Pixel-Based Landsat Compositing Algorithm for Large Area Land Cover Mapping, IEEE J. Sel. Top. Appl. Earth Obs. Remote Sens., 6, 2088–2101, https://doi.org/10.1109/JSTARS.2012.2228167, 2013.
Grünig, M., Seidl, R., and Senf, C.: Increasing aridity causes larger and more severe forest fires across Europe, Glob. Change Biol., 29, 1648–1659, https://doi.org/10.1111/gcb.16547, 2022.
Hammond, W. M., Williams, A. P., Abatzoglou, J. T., Adams, H. D., Klein, T., López, R., Sáenz-Romero, C., Hartmann, H., Breshears, D. D., and Allen, C. D.: Global field observations of tree die-off reveal hotter-drought fingerprint for Earth's forests, Nat. Commun., 13, 1761, https://doi.org/10.1038/s41467-022-29289-2, 2022.
Hansen, M. C., Potapov, P. V., Moore, R., Hancher, M., Turubanova, S. A., Tyukavina, A., Thau, D., Stehman, S. V., Goetz, S. J., Loveland, T. R., Kommareddy, A., Egorov, A., Chini, L., Justice, C. O., and Townshend, J. R. G.: High-Resolution Global Maps of 21st-Century Forest Cover Change, Science, 342, 850–853, https://doi.org/10.1126/science.1244693, 2013.
Hantson, S. and Chuvieco, E.: Evaluation of different topographic correction methods for Landsat imagery, Int. J. Appl. Earth Obs., 13, 691–700, https://doi.org/10.1016/j.jag.2011.05.001, 2011.
Healey, S., Cohen, W., Zhiqiang, Y., and Krankina, O.: Comparison of Tasseled Cap-based Landsat data structures for use in forest disturbance detection, Remote Sens. Environ., 97, 301–310, https://doi.org/10.1016/j.rse.2005.05.009, 2005.
Hermosilla, T., Wulder, M. A., White, J. C., Coops, N. C., and Hobart, G. W.: Regional detection, characterization, and attribution of annual forest change from 1984 to 2012 using Landsat-derived time-series metrics, Remote Sens. Environ., 170, 121–132, https://doi.org/10.1016/j.rse.2015.09.004, 2015.
Hermosilla, T., Wulder, M. A., White, J. C., Coops, N. C., and Hobart, G. W.: Updating Landsat time series of surface-reflectance composites and forest change products with new observations, Int. J. Appl. Earth Obs., 63, 104–111, https://doi.org/10.1016/j.jag.2017.07.013, 2017.
Hermosilla, T., Wulder, M. A., White, J. C., and Coops, N. C.: Prevalence of multiple forest disturbances and impact on vegetation regrowth from interannual Landsat time series (1985–2015), Remote Sens. Environ., 233, 111403, https://doi.org/10.1016/j.rse.2019.111403, 2019.
Hermosilla, T., Wulder, M. A., White, J. C., and Coops, N. C.: Land cover classification in an era of big and open data: Optimizing localized implementation and training data selection to improve mapping outcomes, Remote Sens. Environ., 268, 112780, https://doi.org/10.1016/j.rse.2021.112780, 2022.
Hirschmugl, M., Gallaun, H., Dees, M., Datta, P., Deutscher, J., Koutsias, N., and Schardt, M.: Methods for Mapping Forest Disturbance and Degradation from Optical Earth Observation Data: a Review, Curr. For. Rep., 3, 32–45, https://doi.org/10.1007/s40725-017-0047-2, 2017.
Hlásny, T., König, L., Krokene, P., Lindner, M., Montagné-Huck, C., Müller, J., Qin, H., Raffa, K. F., Schelhaas, M.-J., Svoboda, M., Viiri, H., and Seidl, R.: Bark Beetle Outbreaks in Europe: State of Knowledge and Ways Forward for Management, Curr. For. Rep., 7, 138–165, https://doi.org/10.1007/s40725-021-00142-x, 2021.
Huang, C., Goward, S. N., Masek, J. G., Thomas, N., Zhu, Z., and Vogelmann, J. E.: An automated approach for reconstructing recent forest disturbance history using dense Landsat time series stacks, Remote Sens. Environ., 114, 183–198, https://doi.org/10.1016/j.rse.2009.08.017, 2010.
Hughes, M., Kaylor, S., and Hayes, D.: Patch-Based Forest Change Detection from Landsat Time Series, Forests, 8, 166, https://doi.org/10.3390/f8050166, 2017.
Kennedy, R. E., Cohen, W. B., and Schroeder, T. A.: Trajectory-based change detection for automated characterization of forest disturbance dynamics, Remote Sens. Environ., 110, 370–386, https://doi.org/10.1016/j.rse.2007.03.010, 2007.
Kennedy, R. E., Yang, Z., and Cohen, W. B.: Detecting trends in forest disturbance and recovery using yearly Landsat time series: 1. LandTrendr – Temporal segmentation algorithms, Remote Sens. Environ., 114, 2897–2910, https://doi.org/10.1016/j.rse.2010.07.008, 2010.
Knutzen, F., Averbeck, P., Barrasso, C., Bouwer, L. M., Gardiner, B., Grünzweig, J. M., Hänel, S., Haustein, K., Johannessen, M. R., Kollet, S., Müller, M. M., Pietikäinen, J.-P., Pietras-Couffignal, K., Pinto, J. G., Rechid, D., Rousi, E., Russo, A., Suarez-Gutierrez, L., Veit, S., Wendler, J., Xoplaki, E., and Gliksman, D.: Impacts on and damage to European forests from the 2018–2022 heat and drought events, Nat. Hazards Earth Syst. Sci., 25, 77–117, https://doi.org/10.5194/nhess-25-77-2025, 2025.
Kobayashi, S. and Sanga-Ngoie, K.: The integrated radiometric correction of optical remote sensing imageries, Int. J. Remote Sens., 29, 5957–5985, https://doi.org/10.1080/01431160701881889, 2008.
Lecina-Diaz, J., Senf, C., Grünig, M., and Seidl, R.: Ecosystem services at risk from disturbance in Europe's forests, Glob. Change Biol., 30, e17242, https://doi.org/10.1111/gcb.17242, 2024.
Lindner, M., Maroschek, M., Netherer, S., Kremer, A., Barbati, A., Garcia-Gonzalo, J., Seidl, R., Delzon, S., Corona, P., Kolström, M., Lexer, M. J., and Marchetti, M.: Climate change impacts, adaptive capacity, and vulnerability of European forest ecosystems, Forest Ecol. Manag., 259, 698–709, https://doi.org/10.1016/j.foreco.2009.09.023, 2010.
Liu, S., Brandt, M., Nord-Larsen, T., Chave, J., Reiner, F., Lang, N., Tong, X., Ciais, P., Igel, C., Pascual, A., Guerra-Hernandez, J., Li, S., Mugabowindekwe, M., Saatchi, S., Yue, Y., Chen, Z., and Fensholt, R.: The overlooked contribution of trees outside forests to tree cover and woody biomass across Europe, Sci. Adv., 9, 37, https://doi.org/10.1126/sciadv.adh4097, 2023.
Mandl, L., Viana-Soto, A., Seidl, R., Stritih, A., and Senf, C.: Unmixing-based forest recovery indicators for predicting long-term recovery success, Remote Sens. Environ., 308, 114194, https://doi.org/10.1016/j.rse.2024.114194, 2024.
Maroschek, M., Seidl, R., Poschlod, B., and Senf, C.: Quantifying patch size distributions of forest disturbances in protected areas across the European Alps, J. Biogeogr., 51, 368–381, https://doi.org/10.1111/jbi.14760, 2024.
McDowell, N. G., Allen, C. D., Anderson-Teixeira, K., Aukema, B. H., Bond-Lamberty, B., Chini, L., Clark, J. S., Dietze, M., Grossiord, C., Hanbury-Brown, A., Hurtt, G. C., Jackson, R. B., Johnson, D. J., Kueppers, L., Lichstein, J. W., Ogle, K., Poulter, B., Pugh, T. A. M., Seidl, R., Turner, M. G., Uriarte, M., Walker, A. P., and Xu, C.: Pervasive shifts in forest dynamics in a changing world, Science, 368, eaaz9463, https://doi.org/10.1126/science.aaz9463, 2020.
Miguel, S., Ruiz-Benito, P., Rebollo, P., Viana-Soto, A., Mihai, M. C., García-Martín, A., and Tanase, M.: Forest disturbance regimes and trends in continental Spain (1985–2023) using dense Landsat time series, Environ. Res., 262, 119802, https://doi.org/10.1016/j.envres.2024.119802, 2024.
Moisen, G. G., Meyer, M. C., Schroeder, T. A., Liao, X., Schleeweis, K. G., Freeman, E. A., and Toney, C.: Shape selection in Landsat time series: a tool for monitoring forest dynamics, Glob. Change Biol., 22, 3518–3528, https://doi.org/10.1111/gcb.13358, 2016.
Morresi, D., Maeng, H., Marzano, R., Lingua, E., Motta, R., and Garbarino, M.: High-dimensional detection of landscape dynamics: A Landsat time series-based algorithm for forest disturbance mapping and beyond, GISci. Remote Sens., 61, https://doi.org/10.1080/15481603.2024.2365001, 2024.
Nabuurs, G.-J., Harris, N., Sheil, D., Palahi, M., Chirici, G., Boissière, M., Fay, C., Reiche, J., and Valbuena, R.: Glasgow forest declaration needs new modes of data ownership, Nat. Clim. Change, 12, 415–417, https://doi.org/10.1038/s41558-022-01343-3, 2022.
Oeser, J., Pflugmacher, D., Senf, C., Heurich, M., and Hostert, P.: Using Intra-Annual Landsat Time Series for Attributing Forest Disturbance Agents in Central Europe, Forests, 8, 251, https://doi.org/10.3390/f8070251, 2017.
Olofsson, P., Foody, G. M., Herold, M., Stehman, S. V., Woodcock, C. E., and Wulder, M. A.: Good practices for estimating area and assessing accuracy of land change, Remote Sens. Environ., 148, 42–57, https://doi.org/10.1016/j.rse.2014.02.015, 2014.
Orsi, F., Ciolli, M., Primmer, E., Varumo, L., and Geneletti, D.: Mapping hotspots and bundles of forest ecosystem services across the European Union, Land Use Policy, 99, 104840, https://doi.org/10.1016/j.landusepol.2020.104840, 2020.
Palahí, M., Valbuena, R., Senf, C., Acil, N., Pugh, T. A. M., Sadler, J., Seidl, R., Potapov, P., Gardiner, B., Hetemäki, L., Chirici, G., Francini, S., Hlásny, T., Lerink, B. J. W., Olsson, H., González Olabarria, J. R., Ascoli, D., Asikainen, A., Bauhus, J., Berndes, G., Donis, J., Fridman, J., Hanewinkel, M., Jactel, H., Lindner, M., Marchetti, M., Marušák, R., Sheil, D., Tomé, M., Trasobares, A., Verkerk, P. J., Korhonen, M., and Nabuurs, G.-J.: Concerns about reported harvests in European forests, Nature, 592, E15–E17, https://doi.org/10.1038/s41586-021-03292-x, 2021.
Patacca, M., Lindner, M., Lucas-Borja, M. E., Cordonnier, T., Fidej, G., Gardiner, B., Hauf, Y., Jasinevièius, G., Labonne, S., Linkevièius, E., Mahnken, M., Milanovic, S., Nabuurs, G., Nagel, T. A., Nikinmaa, L., Panyatov, M., Bercak, R., Seidl, R., Ostrogoviæ Sever, M. Z., Socha, J., Thom, D., Vuletic, D., Zudin, S., and Schelhaas, M.: Significant increase in natural disturbance impacts on European forests since 1950, Glob. Change Biol., 29, 1359–1376, https://doi.org/10.1111/gcb.16531, 2023.
Pedregosa, F., Varoquaux, G., Gramfort, A., Michel, V., Thirion, B., Grisel, O., Blondel, M., Prettenhofer, P., Weiss, R., and Dubourg, V.: Scikit-learn: Machine learning in Python, J. Mach. Learn. Res., 12, 2825–2830, 2011.
Pflugmacher, D., Rabe, A., Peters, M., and Hostert, P.: Mapping pan-European land cover using Landsat spectral-temporal metrics and the European LUCAS survey, Remote Sens. Environ., 221, 583–595, https://doi.org/10.1016/j.rse.2018.12.001, 2019.
Pugh, T. A. M., Arneth, A., Kautz, M., Poulter, B., and Smith, B.: Important role of forest disturbances in the global biomass turnover and carbon sinks, Nat. Geosci., 12, 730–735, https://doi.org/10.1038/s41561-019-0427-2, 2019.
Reinosch, E., Backa, J., Adler, P., Deutscher, J., Eisnecker, P., Hoffmann, K., Langner, N., Puhm, M., Rüetschi, M., Straub, C., Waser, L. T., Wiesehahn, J., and Oehmichen, K.: Detailed validation of large-scale Sentinel-2-based forest disturbance maps across Germany, For. Int. J. For. Res., cpae038, https://doi.org/10.1093/forestry/cpae038, 2024.
Roy, D. P., Kovalskyy, V., Zhang, H. K., Vermote, E. F., Yan, L., Kumar, S. S., and Egorov, A.: Characterization of Landsat-7 to Landsat-8 reflective wavelength and normalized difference vegetation index continuity, Remote Sens. Environ., 185, 57–70, https://doi.org/10.1016/j.rse.2015.12.024, 2016.
Saarikoski, H., Jax, K., Harrison, P. A., Primmer, E., Barton, D. N., Mononen, L., Vihervaara, P., and Furman, E.: Exploring operational ecosystem service definitions: The case of boreal forests, Ecosyst. Serv., 14, 144–157, https://doi.org/10.1016/j.ecoser.2015.03.006, 2015.
Sabatini, F. M., Burrascano, S., Keeton, W. S., Levers, C., Lindner, M., Pötzschner, F., Verkerk, P. J., Bauhus, J., Buchwald, E., Chaskovsky, O., Debaive, N., Horváth, F., Garbarino, M., Grigoriadis, N., Lombardi, F., Marques Duarte, I., Meyer, P., Midteng, R., Mikac, S., Mikoláš, M., Motta, R., Mozgeris, G., Nunes, L., Panayotov, M., Ódor, P., Ruete, A., Simovski, B., Stillhard, J., Svoboda, M., Szwagrzyk, J., Tikkanen, O., Volosyanchuk, R., Vrska, T., Zlatanov, T., and Kuemmerle, T.: Where are Europe's last primary forests?, Divers. Distrib., 24, 1426–1439, https://doi.org/10.1111/ddi.12778, 2018.
Sebald, J., Senf, C., and Seidl, R.: Human or natural? Landscape context improves the attribution of forest disturbances mapped from Landsat in Central Europe, Remote Sens. Environ., 262, 112502, https://doi.org/10.1016/j.rse.2021.112502, 2021.
Seidl, R.: The Shape of Ecosystem Management to Come: Anticipating Risks and Fostering Resilience, BioScience, 64, 1159–1169, https://doi.org/10.1093/biosci/biu172, 2014.
Seidl, R. and Rammer, W.: Climate change amplifies the interactions between wind and bark beetle disturbances in forest landscapes, Landsc. Ecol., 32, 1485–1498, https://doi.org/10.1007/s10980-016-0396-4, 2017.
Seidl, R. and Senf, C.: Changes in planned and unplanned canopy openings are linked in Europe's forests, Nat. Commun., 15, 4741, https://doi.org/10.1038/s41467-024-49116-0, 2024.
Senf, C.: Manually interpreted reference data on forest disturbances across Europe, Zenodo [data set], https://doi.org/10.5281/zenodo.3561925, 2019.
Senf, C.: Seeing the System from Above: The Use and Potential of Remote Sensing for Studying Ecosystem Dynamics, Ecosystems, 25, 1719–1737, https://doi.org/10.1007/s10021-022-00777-2, 2022.
Senf, C. and Seidl, R.: Natural disturbances are spatially diverse but temporally synchronized across temperate forest landscapes in Europe, Glob. Change Biol., 24, 1201–1211, https://doi.org/10.1111/gcb.13897, 2018.
Senf, C. and Seidl, R.: Mapping the forest disturbance regimes of Europe, Nat. Sustain., 4, 63–70, https://doi.org/10.1038/s41893-020-00609-y, 2021a.
Senf, C. and Seidl, R.: Storm and fire disturbances in Europe: Distribution and trends, Glob. Change Biol., 27, 3605–3619, https://doi.org/10.1111/gcb.15679, 2021b.
Senf, C., Pflugmacher, D., Zhiqiang, Y., Sebald, J., Knorn, J., Neumann, M., Hostert, P., and Seidl, R.: Canopy mortality has doubled in Europe's temperate forests over the last three decades, Nat. Commun., 9, 4978, https://doi.org/10.1038/s41467-018-07539-6, 2018.
Senf, C., Sebald, J., and Seidl, R.: Increasing canopy mortality affects the future demographic structure of Europe's forests, One Earth, 4, 749–755, https://doi.org/10.1016/j.oneear.2021.04.008, 2021.
Sommerfeld, A., Senf, C., Buma, B., D'Amato, A. W., Després, T., Díaz-Hormazábal, I., Fraver, S., Frelich, L. E., Gutiérrez, Á. G., Hart, S. J., Harvey, B. J., He, H. S., Hlásny, T., Holz, A., Kitzberger, T., Kulakowski, D., Lindenmayer, D., Mori, A. S., Müller, J., Paritsis, J., Perry, G. L. W., Stephens, S. L., Svoboda, M., Turner, M. G., Veblen, T. T., and Seidl, R.: Patterns and drivers of recent disturbances across the temperate forest biome, Nat. Commun., 9, 4355, https://doi.org/10.1038/s41467-018-06788-9, 2018.
Stahl, A. T., Andrus, R., Hicke, J. A., Hudak, A. T., Bright, B. C., and Meddens, A. J. H.: Automated attribution of forest disturbance types from remote sensing data: A synthesis, Remote Sens. Environ., 285, 113416, https://doi.org/10.1016/j.rse.2022.113416, 2023.
Stritih, A., Senf, C., Seidl, R., Grêt-Regamey, A., and Bebi, P.: The impact of land-use legacies and recent management on natural disturbance susceptibility in mountain forests, Forest Ecol. Manag., 484, 118950, https://doi.org/10.1016/j.foreco.2021.118950, 2021.
Thom, D. and Seidl, R.: Natural disturbance impacts on ecosystem services and biodiversity in temperate and boreal forests, Biol. Rev., 91, 760–781, https://doi.org/10.1111/brv.12193, 2016.
Tucker, C. J.: Red and photographic infrared linear combinations for monitoring vegetation, Remote Sens. Environ., 8, 127–150, 1979.
Turner, M. G. and Seidl, R.: Novel Disturbance Regimes and Ecological Responses, Annu. Rev. Ecol. Evol. Syst., 54, 63–83, https://doi.org/10.1146/annurev-ecolsys-110421-101120, 2023.
Turubanova, S., Potapov, P., Hansen, M. C., Li, X., Tyukavina, A., Pickens, A. H., Hernandez-Serna, A., Arranz, A. P., Guerra-Hernandez, J., Senf, C., Häme, T., Valbuena, R., Eklundh, L., Brovkina, O., Navrátilová, B., Novotný, J., Harris, N., and Stolle, F.: Tree canopy extent and height change in Europe, 2001–2021, quantified using Landsat data archive, Remote Sens. Environ., 298, 113797, https://doi.org/10.1016/j.rse.2023.113797, 2023.
Valavi, R., Elith, J., Lahoz-Monfort, J. J., and Guillera-Arroita, G.: blockCV: An r package for generating spatially or environmentally separated folds for k-fold cross-validation of species distribution models, Meth. Ecol. Evol., 10, 225–232, https://doi.org/10.1111/2041-210X.13107, 2019.
Valavi, R., Guillera-Arroita, G., Lahoz-Monfort, J. J., and Elith, J.: Predictive performance of presence-only species distribution models: a benchmark study with reproducible code, Ecol. Monogr., 92, e01486, https://doi.org/10.1002/ecm.1486, 2022.
Verbesselt, J., Hyndman, R., Newnham, G., and Culvenor, D.: Detecting trend and seasonal changes in satellite image time series, Remote Sens. Environ., 114, 106–115, https://doi.org/10.1016/j.rse.2009.08.014, 2010.
Viana-Soto, A. and Senf, C.: European Forest Disturbance Atlas (2.1.1.), Zenodo [data set], https://doi.org/10.5281/zenodo.13333034, 2024.
Viana Soto, A.: Code for The European Forest Disturbance Atlas: A forest disturbance monitoring system using the Landsat archive, Zenodo [code], https://doi.org/10.5281/zenodo.15579709, 2025.
Viana-Soto, A. and Senf, C.: European Forest Disturbance Atlas viewer, Forest Paths [data set], https://albaviana.users.earthengine.app/view/european-forest-disturbance-map (last access: 1 June 2025), 2025.
Wulder, M. A., Roy, D. P., Radeloff, V. C., Loveland, T. R., Anderson, M. C., Johnson, D. M., Healey, S., Zhu, Z., Scambos, T. A., Pahlevan, N., Hansen, M., Gorelick, N., Crawford, C. J., Masek, J. G., Hermosilla, T., White, J. C., Belward, A. S., Schaaf, C., Woodcock, C. E., Huntington, J. L., Lymburner, L., Hostert, P., Gao, F., Lyapustin, A., Pekel, J.-F., Strobl, P., and Cook, B. D.: Fifty years of Landsat science and impacts, Remote Sens. Environ., 280, 113195, https://doi.org/10.1016/j.rse.2022.113195, 2022.
Wulder, M. A., Hermosilla, T., White, J. C., Bater, C. W., Hobart, G., and Bronson, S. C.: Development and implementation of a stand-level satellite-based forest inventory for Canada, For. Int. J. For. Res., cpad065, https://doi.org/10.1093/forestry/cpad065, 2024.
Zhao, K., Wulder, M. A., Hu, T., Bright, R., Wu, Q., Qin, H., Li, Y., Toman, E., Mallick, B., Zhang, X., and Brown, M.: Detecting change-point, trend, and seasonality in satellite time series data to track abrupt changes and nonlinear dynamics: A Bayesian ensemble algorithm, Remote Sens. Environ., 232, 111181, https://doi.org/10.1016/j.rse.2019.04.034, 2019.
Zhu, Z.: Change detection using landsat time series: A review of frequencies, preprocessing, algorithms, and applications, ISPRS J. Photogramm. Remote Sens., 130, 370–384, https://doi.org/10.1016/j.isprsjprs.2017.06.013, 2017.
Zhu, Z. and Woodcock, C. E.: Object-based cloud and cloud shadow detection in Landsat imagery, Remote Sens. Environ., 118, 83–94, https://doi.org/10.1016/j.rse.2011.10.028, 2012.
Zhu, Z. and Woodcock, C. E.: Automated cloud, cloud shadow, and snow detection in multitemporal Landsat data: An algorithm designed specifically for monitoring land cover change, Remote Sens. Environ., 152, 217–234, https://doi.org/10.1016/j.rse.2014.06.012, 2014a.
Zhu, Z. and Woodcock, C. E.: Continuous change detection and classification of land cover using all available Landsat data, Remote Sens. Environ., 144, 152–171, https://doi.org/10.1016/j.rse.2014.01.011, 2014b.