the Creative Commons Attribution 4.0 License.
the Creative Commons Attribution 4.0 License.
 | 02 Jun 2025
Distribution and characteristics of lightning-ignited wildfires in boreal forests – the BoLtFire database
Ivan Bratoev
Morgan A. Crowley
Yanan Zhu
Cornelius Senf
The frequency and severity of fire weather have been projected to increase under climate change, particularly in high-latitude boreal forests. Lightning, a key ignition source globally, is also expected to become more frequent with climate change and could significantly increase burn area. Current research on lightning-ignited wildfire (LIWs) has a long history in boreal ecosystems but has typically focused on North America due to better data availability, while the lack of publicly available data for Eurasia has hindered our comprehensive understanding of important characteristics of LIWs, such as holdover time, lightning ignition efficiency, frequency, and spatial distribution in boreal forests. This study introduces the temporal minimum distance (TMin) method, a novel approach to matching lightning strikes with wildfires without requiring ignition location that outperformed current methodologies. As a result, we developed a comprehensive dataset of lightning-ignited wildfires across the entire boreal forest from 2012 to 2022, encompassing 6902 fires, 4201 in Eurasia and 2701 in North America, each over 200 ha in size. This dataset (https://doi.org/10.5281/zenodo.14940326, Engle et al., 2024) provides new opportunities to model the ignition and spread dynamics of boreal wildfires and offers deeper insights into lightning-driven fire activity globally.
- Article
(4195 KB) - Full-text XML
- BibTeX
- EndNote


Forest fires are the primary disturbance agent in global boreal forests, burning an estimated 10–15×106 ha each year on average across Siberia, Canada, and Alaska (Flannigan et al., 2009). Boreal fires play a crucial role in shaping boreal forest composition and structure (Podur et al., 2003), and they also have a significant impact on the global carbon cycle (Stocks et al., 2001). The global boreal forests house roughly 32 % of terrestrial carbon stocks (Pan et al., 2011) and are considered to be globally important carbon sinks. However, due to the observed and predicted increases in temperatures in high latitudes (Melillo et al., 2014; Natali et al., 2019; Post et al., 2019; Soja et al., 2007), thawing of the permafrost, increases in vegetation stress due to drought, and an increase in fire frequency and burned area (Gillett et al., 2004; Flannigan et al., 2009), there is concern that boreal forests could be pushed to be a net positive carbon source (Watts et al., 2023, and references therein). Since at least 2000, carbon dioxide emissions from boreal forest fires have been on the rise, reaching a record high in 2021, where they contributed to 23 % of global wildfire carbon dioxide emissions, a significant increase from the historical average of 10 % (Zheng et al., 2023). Additionally, black carbon from boreal forest fires contributes to increased pollution levels in the Arctic (Bond et al., 2013; Lavoué et al., 2000; Stohl, 2006) and could accelerate losses of snow and ice (Hansen and Nazarenko, 2004). Kim et al.'s (2005) findings indicate, for example, that black carbon aerosols (soot) are rapidly transported from central Alaska to the Arctic Ocean, as well as to glaciers in southern Alaska, where up to 20 % of these aerosols may be deposited, changing the albedo and possibly increasing the melting of the arctic. All in all, increasing forest fires will challenge the boreal carbon sink, and it is thus essential to understand global distributions and trends in boreal forest fires.
One of the major processes underlying the observed increase in forest fires in boreal regions is a notable rise in the frequency and intensity of fire weather, a trend that is projected to worsen with global warming (Hessilt et al., 2022; Jones et al., 2022). This trend in fire weather frequency has already led to an increase of approximately 50 % in burned area between 2001–2019 in certain extratropical forest ecoregions, such as the Pacific US and high-latitude forests, with an expected increase in forest fire activity and severity in some higher-latitude regions (de Groot et al., 2013; Descals et al., 2022; Flannigan et al., 2000; Stocks et al., 1998; Zheng et al., 2023). Yet, for a forest to burn, there needs to be a source of ignition, with lightning being a key source of wildfire ignition in boreal forests (Gao et al., 2024; Moris et al., 2020; Pérez-Invernón et al., 2023; Sofronov et al., 1998; Veraverbeke et al., 2017). Lightning-ignited wildfires are a significant cause of burned area in boreal forests (Hanes et al., 2019; Kasischke et al., 2002; Nash and Johnson, 1996; Veraverbeke et al., 2017), and they are more difficult to detect, suppress, and extinguish than human-caused fires (Flannigan and Wotton, 1991; Kourtz and Todd, 1992; Podur et al., 2003; Wotton and Martell, 2005). Under the influence of climate change, the scale and occurrence of lightning-ignited wildfires in boreal forests are projected to increase significantly. Janssen et al. (2023), for instance, estimated that 77 % of the burned areas in extratropical intact forests are attributable to lightning, with lightning occurrences being projected to increase by 11 % to 31 % for each degree of warming. Additionally, Krause et al. (2014) suggest a potential 21.3 % rise in cloud-to-ground lightning activity by the end of the century under the RCP8.5 scenario, potentially doubling the burned area in high-latitude regions. That said, the lightning ignition efficiency, i.e. the number of fires ignited per lightning event, can differ significantly by region and land cover (Podur et al., 2003). Lightning storms can also result in concentrated clusters of large numbers of fires (Flannigan and Wotton, 1991; Kourtz and Todd, 1992; Podur et al., 2003; Woolford et al., 2021), and lightning-ignited wildfires can smoulder for long periods of time before igniting fully in what is referred to as the holdover time (time between fire ignition and detection; Flannigan and Wotton, 1991; Wotton and Martell, 2005). Holdover time presents a true challenge for real-time lightning-ignited wildfire detection in boreal forests. This is still not fully understood and likely depends heavily on initial detection and ignition characteristics. The holdover time duration can vary heavily, with some literature suggesting up to around a week (Anderson, 2002; Flannigan and Wotton, 1991; Moris et al., 2023), while other sources suggest that holdover time can last up to a few weeks in boreal forests (Moris et al., 2023; Nash and Johnson, 1996; Scholten et al., 2021; Wotton and Martell, 2005). From an Eurasian perspective, when reviewing lightning ignition in the boreal forests of northeastern China, Gao et al. (2024) found that close to 80 % of lightning-ignited wildfires (LIWs) occurred within 1 km of the igniting lightning and within 24 h, while Moris et al.'s (2023) analysis of Xu et al.'s (2022) LIW data in eastern Siberia shows a maximum holdover time of 8 d, with most occurring for 24–48 h. Conversely, from a North American perspective, Scholten et al. (2021) reported that fire managers in Alaska and Canada have started reporting extreme holdover times, where fires “hibernate” over winter (up to 7 or 8 months) only to re-emerge the following fire season as “overwintering fires”. The spatial distribution, characteristics, and potentially complex interactions of lightning-ignited wildfires in boreal forests are thus not fully understood, partly due to a lack of global data on lightning-ignited fires.
Recent advancements in remote sensing and lightning location systems have significantly enhanced our understanding of lightning-ignited wildfires. More specifically, the precise geolocation of lightning paired with spatially explicit information on wildfires allows us to better distinguish lightning from human-caused ignitions by matching wildfire and lightning location data (Larjavaara et al., 2005; Nash and Johnson, 1996; Wotton and Martell, 2005). Current methods search for the most likely individual lightning event based on its temporal and spatial distance to the fire's ignition point. These methods use a buffer area around the ignition point and a backward temporal window to account for location and holdover time and typically stem from Larjavaara et al.'s (2005) proximity index: a spatio-temporal index to match candidate lightning to fires using holdover time (t) and spatial distance (S). Unfortunately, it is currently not possible to use these methodologies to definitively identify – with absolute certainty – that a fire was ignited by lightning. Testing the effectiveness of some of these variations, Moris et al. (2020) found that the maximum index A (MaxA; Pineda et al., 2014) and the daily minimum distance (DMin; Schultz et al., 2019) produced a high match between candidate lightning (lightning that was most likely to start the ignition) and the ignition, as well as the lowest values of distance and holdover time (e.g. MaxA within a 10 km radius and a 14 d holdover time were found to be highly effective, with 80 % of fires detected within 3 d). However, these existing methodologies rely on the availability of ignition point locations, which are often absent in datasets produced without inputs from local fire and forest authorities. Most research on lightning-ignited wildfires has thus been conducted in North America, where fire point and polygon datasets are available from the Canadian National Fire Database (Canadian Forest Service, 2024) and the Bureau of Land Management's Alaska Fire Service (US Department of the Interior et al., 2024a, b). Both datasets include key information such as fire start and end dates and ignition cause and location (Table A3). Unfortunately, at this time, there are no other publicly available agency datasets within the boreal biome that provide this crucial information. Both existing products are built upon local context and knowledge provided by forest authorities and personnel, which is not reproducible on a global scale. Although global remote-sensing-based burned-pixel datasets do exist, such as the Collection 6 MCD64A1 Burned Area data product (Giglio et al., 2018) and FIRECCI5 (Lizundia-Loiola et al., 2020), along with global remote-sensing-based fire patch datasets, such as FRY (Laurent et al., 2018), they lack ignition location and cause. Consequently, a comprehensive pan-boreal forest lighting-ignited wildfire dataset does not currently exist.
Here, we introduce the pan-boreal forest lightning-ignited wildfire dataset (BoLtFire), an Earth-observation-based database on lightning-ignited wildfire across global boreal forests. Our database overcomes challenges with existing methods by introducing a new methodology specifically designed for detecting lightning-ignited wildfires in boreal forests and without exact ignition location. More specifically, the objectives of our study were to
-
develop and implement a new approach to identify lightning-ignited wildfires that do not rely on pre-existing ignition locations and benchmark this new approach with a regional test case using the Canadian National Fire Database and Alaska Fire Service datasets;
-
apply the new approach globally across the boreal forest biome to create a pan-boreal dataset of lightning-ignited wildfires across the global boreal forest, leveraging lightning location data from the Earth Networks Total Lightning Network (ENTLN) and fire location data from the GlobFire Fire Perimeters dataset (Artés et al., 2019);
-
enhance our understanding of holdover time, the distance to fire perimeter, lightning ignition efficiency, the frequency of fires, the total burned area, and the spatial distribution of lightning-ignited wildfires in boreal forests.
2.1 Study area
The boreal zone, a vast circumpolar vegetation region situated between latitudes of 45 and 70° N, represents one of the world's largest biogeoclimatic zones. It plays a critical role in providing renewable resources, supporting diverse habitats, regulating global climate, and sequestering carbon and is recognized as one of the fastest-warming biomes (Brandt, 2009; Brandt et al., 2013; Zheng et al., 2023). Spanning 1.89×10⁹ ha, the boreal zone encompasses 1.133×10⁶ ha in Russia, 552×106 ha in Canada, and 73.7×10⁶ ha in the United States, with additional areas across Finland, Sweden, China, Norway, Mongolia, Iceland, Kazakhstan, Greenland, and Saint Pierre and Miquelon (Brandt, 2009; Brandt et al., 2013).
2.2 Boreal forest fire regimes
A lightning-ignited fire progresses through three primary phases: (1) ignition, (2) survival (or smouldering), and (3) arrival (Anderson, 2002; Kourtz and Todd, 1992; Martell and Sun, 2008; Pérez-Invernón et al., 2023). The survival and arrival phases of ignition depend heavily on the fuel availability and composition, weather conditions, and topography (Anderson, 2002; Flannigan and Wotton, 1991; Kourtz and Todd, 1992; Martell and Sun, 2008; Pérez-Invernón et al., 2023). During the ignition phase, lightning triggers an ignition which can then smoulder within the duff layers. Certain duff layers, such as the needle-covered ground beneath conifers, are particularly susceptible to ignition and prolonged smouldering (Flannigan and Wotton, 1991). The ignition will either “self-extinguish”, or, if the conditions are conducive to fire, the fire will enter the survival and arrival phases (Anderson, 2002; Flannigan and Wotton, 1991; Martell and Sun, 2008; Pérez-Invernón et al., 2023).
Wildfires are a natural process and important drivers of forest dynamics (Latham and Williams, 2001; Podur et al., 2003; Seidl et al., 2020; Vajda et al., 2013). Over long timescales, fires will create a mosaic of burned, recovering, and unburned patches, with patch characteristics (i.e. size and shape), fire frequency, and recovery dynamics largely determining the resulting landscape mosaic (Turner, 2010). Fire-adapted forests can typically be classified into two distinct categories: (1) forests with species that can regenerate independently of their species members and (2) forests that require species members to regenerate (Rogers et al., 2015). The first category includes species such as conifers, which store their seeds in insulated serotinous cones that only open to heat, or hardwoods which regenerate from the root layer after a fire (Stocks et al., 2001). The second type includes conifers that release their seeds yearly as the cones mature (Stocks et al., 2001). North American boreal forests, for example, contain Pinus banksiana (Jack pine) and Picea mariana (black spruce), which both require fire to regenerate (Rogers et al., 2015; Stocks et al., 2001; Van Wagner, 1983). In contrast, Eurasian boreal forests are dominated by non-serotinous conifers and other species that release seeds annually, resulting in heterogeneous, unevenly aged forests (Stocks et al., 2001). Due to the predominant tree species, Rogers et al. (2015) suggest that North American boreal forests are more prone to high-intensity crown fires, which consume large amounts of vegetation and detritus, whereas Eurasian forests typically experience lower-intensity surface fires that burn less vegetation and fewer trees (de Groot et al., 2013; Rogers et al., 2015).
2.3 Summary of datasets
2.3.1 Lightning data
The Earth Networks Total Lightning Network (ENTLN) is a global network of 1800 sensors across more than 100 countries (Zhu et al., 2022). Their network is further enhanced by an integration with the World Wide Lightning Location Network (Rodger et al., 2004). The ENTLN detects wideband electric field signals (1 Hz to 12 MHz) that are emitted by cloud-to-ground and intracloud lightning. Only cloud-to-ground flash data from the period 2012–2022 are used in this study. Each cloud-to-ground flash has at least one return stroke (Liu and Heckman, 2011). Intracloud pulses occur within the cloud and do not strike the ground as a return stroke, making them irrelevant for wildfire ignition. Using the time-of-arrival technique, they report the time in UTC, location (latitude and longitude), type of discharge, peak current, and polarity (positive or negative) of each lightning event. Individual strokes are clustered into a flash if they are located within 10 km and within 0.7 s of each other (Liu and Heckman, 2011). For each flash, multiplicity, start time, end time, and duration are reported.
Detection efficiency refers to the percentage of flashes or strokes detected by the network and can vary depending on the location and the distance between the sensors and the lightning event. Relative detection efficiency assumes a uniform detection efficiency across the network. The ENTLN's cloud-to-ground stroke detection efficiency across the CONUS is reported to be greater than 90 % (Lapierre et al., 2020), with relative detection efficiency values ranging from 85 % to 100 % across the Americas and with similar levels in Europe and Australia (Bui et al., 2015). Significant improvements have been observed over the years due to advancements in processor technology (Mallick et al., 2013, 2015; Zhu et al., 2017b, 2022). The most recent processor has achieved a stroke classification accuracy of 94 % and reduced the median location error from 215 to 92 m when compared to ground truth data in Florida (Zhu et al., 2022). Globally, this upgrade has resulted in a 149 % increase in the overall global detection of pulses, with North America showing a 145 % gain, Asia showing a 142 % gain, and Europe showing a 152 % gain. However, in more remote areas, detection efficiency tends to be lower, and location errors can extend up to several kilometres. Due to both geopolitical limitations and the mid-range nature of the ENTLN, flash level detection in Russia is low. However, storm level detection remains around 50 %. As there are no sensors located in Russia, all lightning is detected by sensors in neighbouring countries.
2.3.2 Wildfire data
The MODIS Collection 6 MCD64A1 Burned Area product (Giglio et al., 2018) utilizes daily 500 m resolution MODIS surface reflectance data in conjunction with 1 km resolution MODIS Active Fire observations (Giglio et al., 2020). The GlobFire algorithm was applied to the MCD64A1 product to create the GlobFire Fire Perimeters (2002–2023) dataset (Artés et al., 2019). Each yearly fire shapefile has a unique fire ID, an initial date, a final date, the geometry, and the final area in hectares for each fire within. Within their algorithm, a fire event is a set of burned areas that are intersecting or touching. Each fire event comprises interconnected burned areas that are only treated as separate fires if there is a temporal distance of more than 5 d between each event. If there is no new burned area after 16 d, the fire is no longer considered to be active.
2.3.3 Agency reference fire occurrence records
We used the Canadian National Fire Database Fire Point and Polygon datasets along with the Alaska Fire History Location Points and Perimeter Polygons datasets to assess our BoLtFire dataset (Table A3 in the Appendix). The Canadian National Fire Database fire points and polygons are compiled from various jurisdictions, including provinces, territories, and Parks Canada, and represent a collaborative effort by all Canadian fire agencies. This database is the most comprehensive resource for fire points and perimeters in Canada. The point data include critical fire information such as fire ID, fire report date, fire-out date, cause, and ignition point. Hanes et al. (2019) state that these points are just the presumed points of ignition. The polygon data include similar information, with fire ID, fire report date, fire-out date, cause, and map source, available until December 2020. None of the report dates contain an exact discovery time and were reported in local time. Fire perimeters are typically derived through the interpretation of Landsat (30 m) or other satellite imagery and are sometimes derived from aerial or field surveys by fire management agencies.
The Bureau of Land Management's Alaska Fire Service maintains a detailed record of all detected natural or human-caused wildfire events in Alaska from 1940 to 2023 (Table A3). The Alaska Fire History Location Points dataset provides fire-specific information, including fire ID, discovery date and exact discovery time in UTC, fire-out date, estimated fire size, and cause. The perimeters in the Alaska Fire History Perimeter dataset were mapped using ground and airborne surveys, as well as aerial photography and Sentinel-2 satellite imagery (10 m). This dataset includes details such as fire ID, estimated burned-area size, map source, geographical coordinates, and fire-out date but does not include the fire start date or cause.
2.4 Processing of the lightning and wildfire datasets
Both the lightning and wildfire location datasets utilized in this study are global products and were initially filtered to only include those points which fell within the boreal forests or taiga biome as defined by Ecoregions 2017 (Olson et al., 2001). Due to detection efficiency and location errors with regard to lightning, the ENTLN was only filtered according to the biome location, while the GlobFire dataset went through additional filtering. Given the MODIS Burned Area product's inability to adequately detect smaller fires, those less than 200 ha were excluded from the analysis (Giglio et al., 2009). This should not significantly influence the overall outcome of this dataset as, typically, within boreal forests, large fires account for 85 % of the burned area (Macias Fauria and Johnson, 2007). Fires were then filtered based on the majority of land cover class using the MODIS MCD12Q1v061 Land Cover Type 1: Annual IGBP classification datasets for the period 2012–2022, with a 500 m spatial resolution (Friedl and Sulla-Menashe, 2022). Non-forest land covers (land covers that clearly have no dominance of trees; Table A1) were excluded from the analysis. Fire class size was then added based on Talucci et al. (2022) (Table A2). Each fire was then assigned a country using the same methodology, along with the World Bank Official Boundaries dataset (World Bank, 2020). We removed three fires as they did not fall within a country boundary of the World Bank Official Boundaries dataset. A complete list of input datasets used can be found in Table 1. After the initial filtering, all fire start dates were set to 12:00 LT (local time) and then were converted to UTC for the lightning-matching process. Noon was selected as the start time for every fire as this information is not available within the GlobFire dataset, and 12:00 LT is when wildfire conditions are most favourable (Van Wagner, 1987; Vitolo et al., 2020).
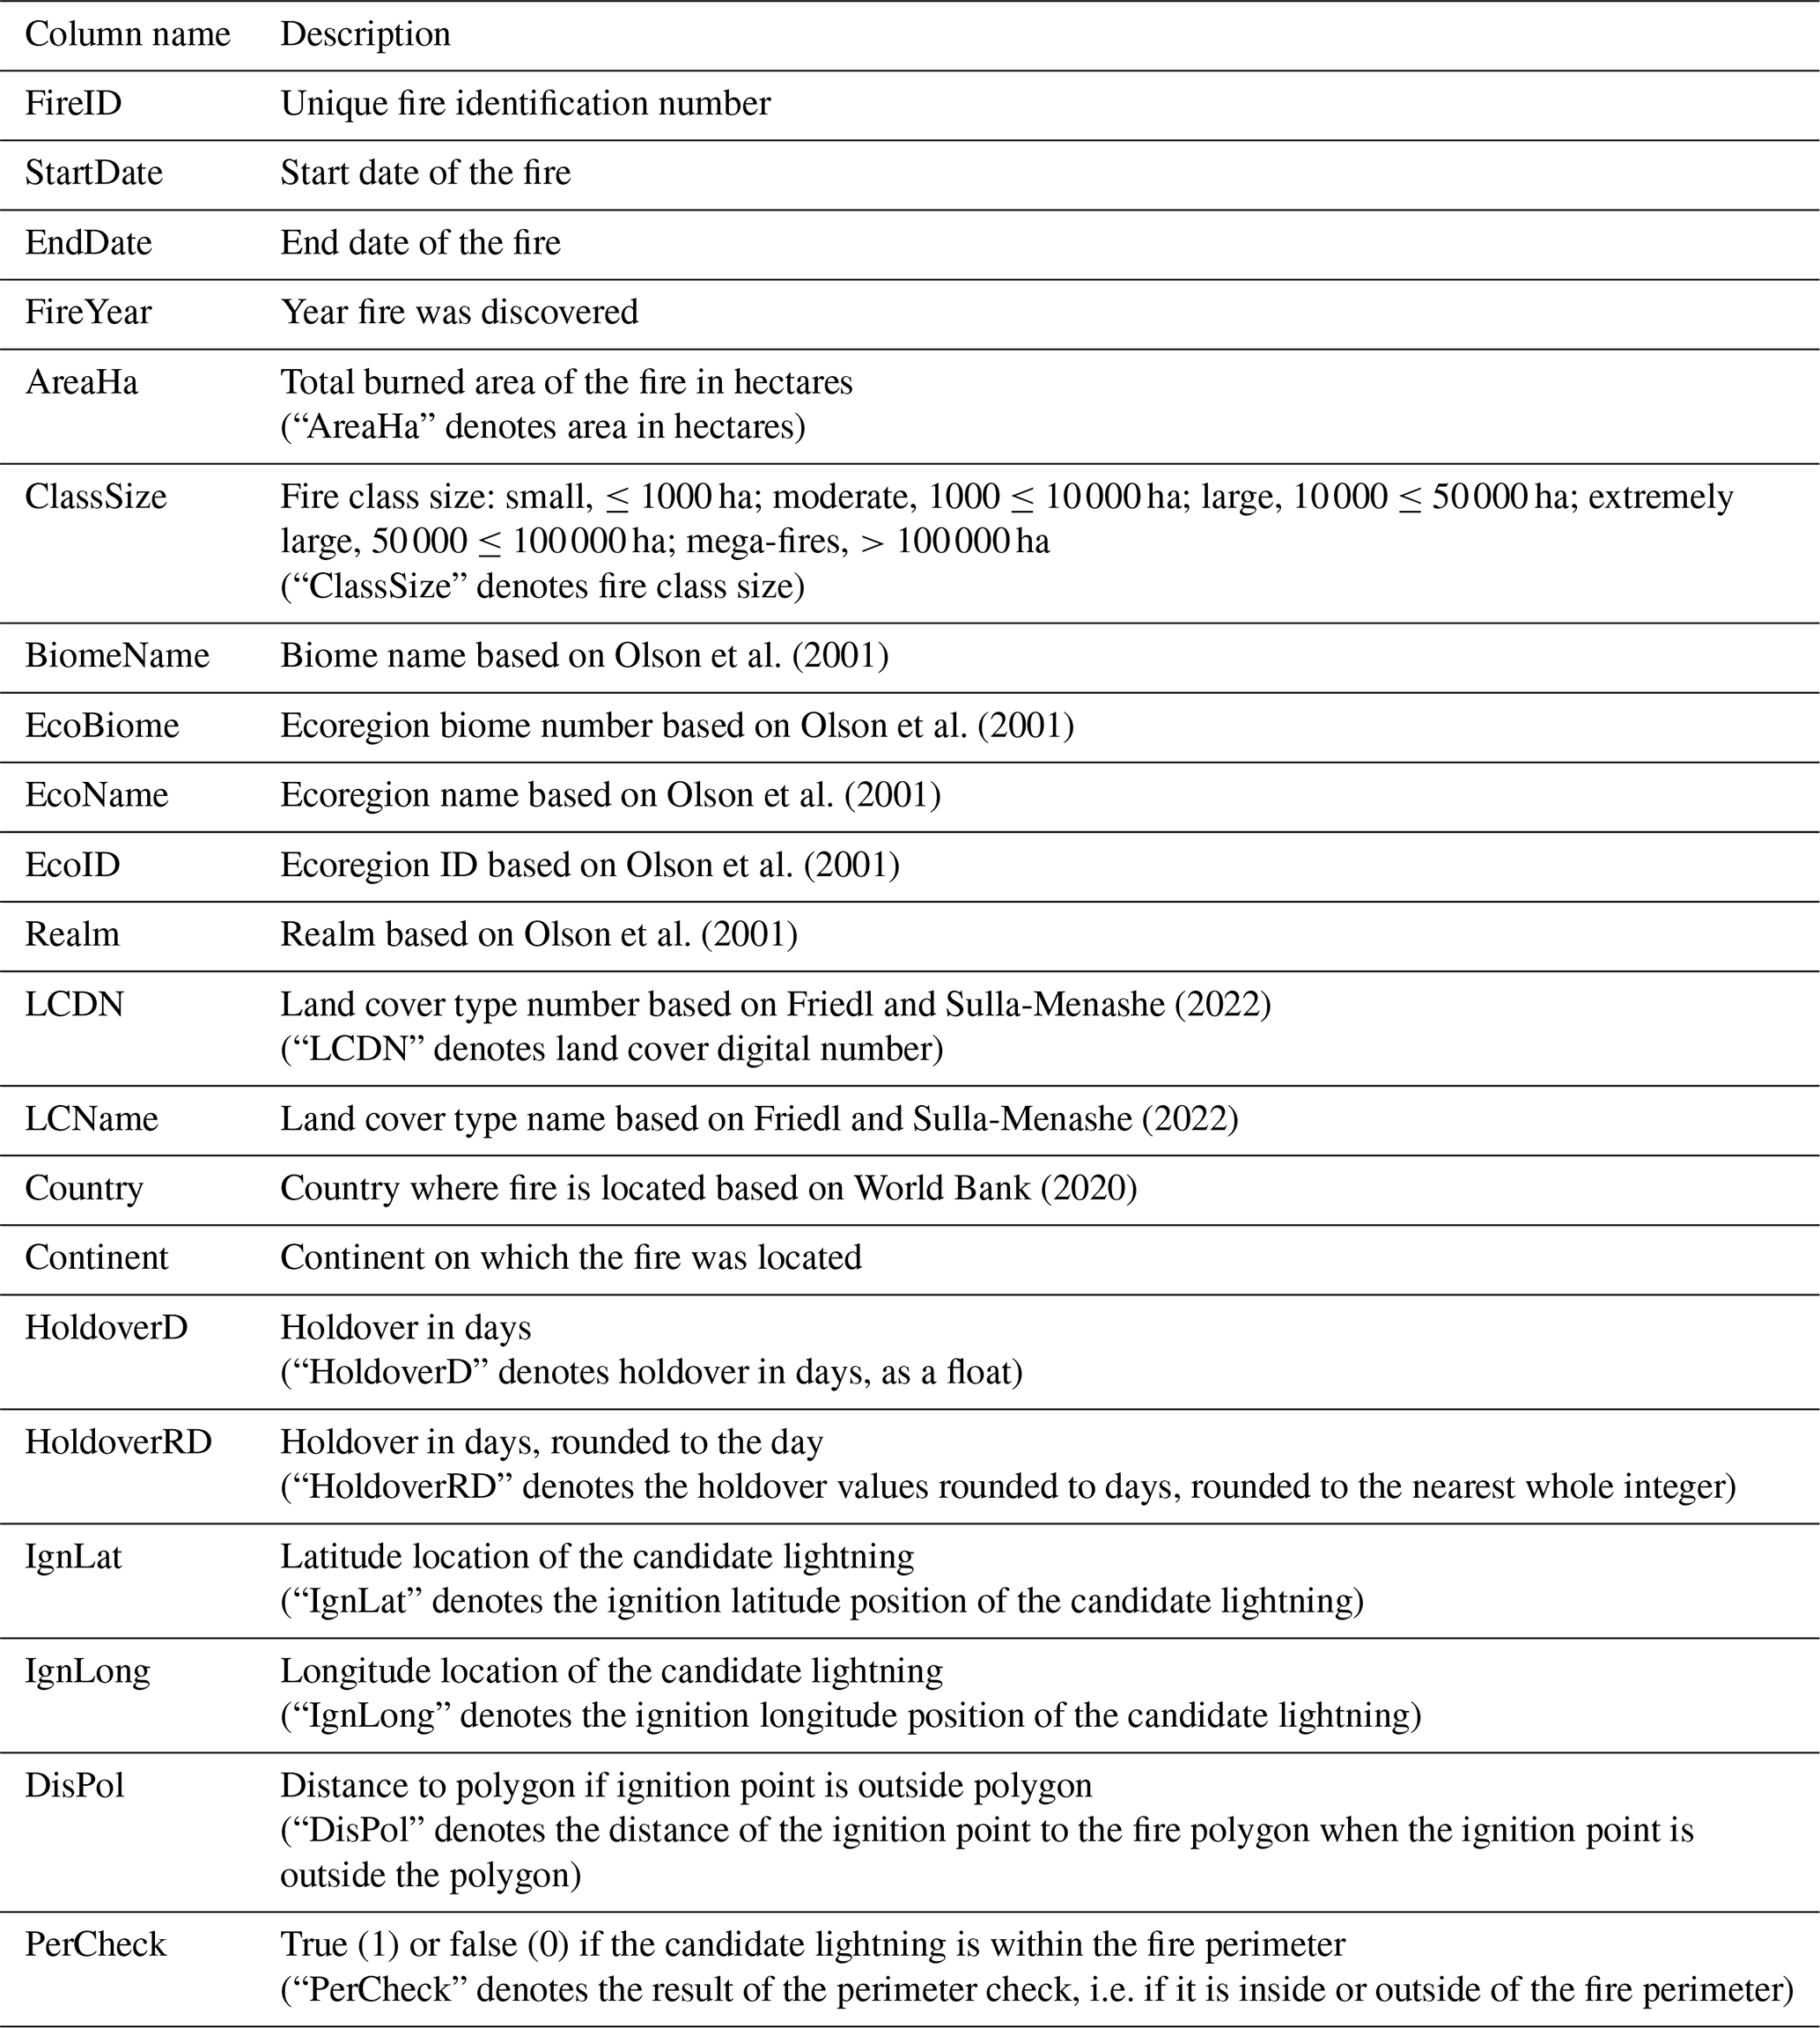
Table 1Description of variables provided for each lightning-ignited wildfire within the BoLtFire dataset.
Both the lightning and wildfire location datasets were then converted from their original coordinate system to their respective Global LANd Cover mapping and Estimation (GLANCE) Grids – Version 01 CRS (North American, Europe, and Asia) for the matching process (Arevalo et al., 2022). Though the ENTLN dataset was only filtered by its biome, it did receive land cover and country labels for additional analysis. The filtering process identified a total of 27 525 747 lightning flashes within the boreal forest biome, with 12 526 781 occurring in North America and 14 998 966 occurring in Eurasia. Data for 4 November 2014, 9 May 2016, and 19 May 2019 were unavailable. Additionally, the process identified 21 019 total GlobFire events, comprising 3659 in North America and 17 360 in Eurasia.
2.5 Processing of the agency reference datasets
To ensure a consistent assessment between the agency reference dataset and the BoLtFire dataset, the agency reference datasets were filtered by size, start date, and ignition cause. The Alaska Large Fire Dataset includes the discovery time of each fire to the second. Fire start times are not available within either of the Canadian agency reference datasets. The fire start times were also set to 12:00 LT and were then converted to UTC for the lightning-matching process. Prescribed burns were removed. The fire perimeters and points from the agency references were initially joined based on their respective fire ID keys (Canadian National Fire Database: NFDBFIREID and CFS_REF_ID; Alaska Fire Service: ID and FIREID). Polygons without points were removed from the dataset. Points without corresponding perimeter IDs were categorized into two groups: those located within an existing fire perimeter and occurring within 7 d of the fire start date and those that do not meet these criteria. For the latter (as not all fire parameters have been mapped yet; Canadian Forest Service, 2024), the fire area was used to determine the fire radius, which was then used to generate a fire buffer perimeter. For perimeters without corresponding point IDs, if there was an unmatched point within the perimeter within 7 d of the fire start date, that became the fire's ignition point. If there were no points located within the perimeter, the fire was left without an ignition point and was removed from the dataset. Both datasets were then merged and filtered based on the majority land cover class. The filtering process yielded an agency reference dataset consisting of 2424 fires across Alaska and Canada.
2.6 BoLtFire dataset creation method
Existing methodologies for fire ignition detection require an ignition point for each fire, which is not provided by the original MCD64A1 or by the GlobFire dataset. To address this, a temporal minimum distance (TMin) methodology is proposed. Based on previous methodologies (Larjavaara et al., 2005, Nash and Johnson, 1996; Pineda et al., 2022, Wotton and Martell, 2005), this approach first searches for a candidate lightning within the fire's perimeter, starting from its ignition date and continuing to search until a candidate lightning is found or until a 14 d window has been reached. If only one flash is found within the perimeter, it is designated as the candidate lightning and the ignition point. If multiple potential candidate lightnings are found, the one closest in time to the ignition date (12:00 LT, converted to UTC) is chosen. If no candidate lightning is found within the perimeter, the search extends to a 10 km radius outside the perimeter, following the same temporal process. If multiple potential candidate lightnings are found outside the perimeter, the stroke closest both spatially to the perimeter and temporally to the start date is selected as the ignition point. A visualization of the process can be seen in Fig. 1. The proposed TMin methodology was then applied to the filtered ENTLN and GlobFire datasets to create the BoLtFire dataset.
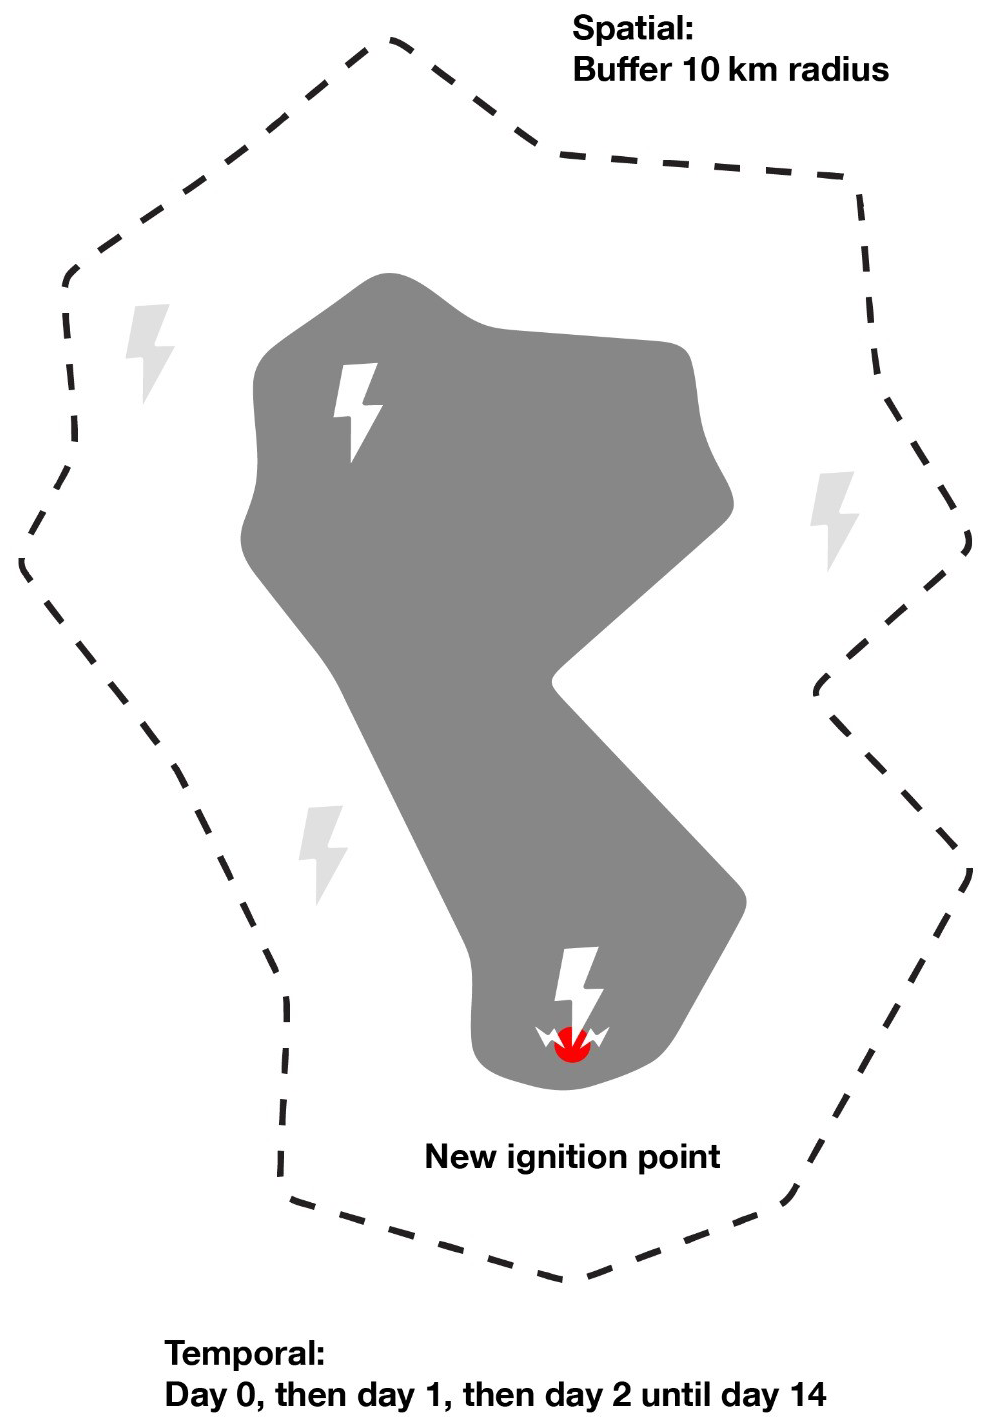
Figure 1Visualization of the temporal minimum distance process, where lightning candidates are first searched for within the fire perimeter before then being searched for in the buffered area if one is not found. The grey polygon depicts the fire and its associated perimeter, while the dotted line represents the 10 km buffer.
2.7 Agency reference comparison and analysis
We conducted three different comparison assessments using the proposed TMin approach: (1) a candidate lightning methodology comparison, (2) a spatial and temporal accuracy comparison, and (3) fire count and size comparison. The comparison of the matching-lightning methodologies was implemented to gauge the performance of the proposed (TMin) methodology in relation to currently established methodologies, namely MaxA and DMin. Max A, proposed by Pineda et al. (2014), selects the stroke with the maximum index A while setting the maximum holdover time (Tmax) to 7 d and the maximum buffer radius (Smax) to 14 d. The DMin, introduced by Schultz et al. (2019), searches backwards day by day from the reported start date until either a matching flash within a 15 d window (Tmax) and 10 km (Smax) is found or until this temporal window is exhausted. If multiple flashes are found then the one closest to the ignition point is selected. To compensate for possible misreporting of start dates, if no flash was found within the temporal window then a day after the reported start date was searched. To align our methodologies to the current literature, all three methodologies were implemented using input parameters of a Tmax of 14 d and an Smax of 10 km. The methodologies were applied to the agency reference dataset as both datasets provide a start date and an ignition point, allowing for a more precise comparison of the candidate lightning's distance to the ignition location and holdover time across the methodologies. As the Canadian agency reference dataset does not contain fires after 2020, these fires were also removed from the North American BoLtFire dataset (allowing for a total of 2072 fires; hereafter referred to as the North American BoLtFire agency reference dataset version or NA BoLtFire ARD dataset) to conduct the comparisons, but these are contained within the complete set. The following variables were analysed: candidate lightning agreement, fire count, fire size, holdover time, and distance to the ignition point. The mean, median, and histograms of distance and holdover time were also produced. Additionally, a detailed analysis of the location of the candidate lightning inside or outside (and distance therefrom) the fire perimeter was conducted to gauge the approach's ability to accurately locate the ignition point. We conducted a secondary benchmark comparison, where we compared the temporal and spatial locations of the fire perimeters to determine the overlap and difference between both datasets (agency vs. NA BoLtFire ARD version). The NA BoLtFire ARD version dataset successfully located a fire if it was within 7 d (before or after the start date) and 10 km of the agency's fire perimeter. Large spatial and temporal windows were used to encompass reporting errors by both the agencies and errors from MODIS. Multiple NA BoLtFire ARD version fires could be matched to one agency fire. If an NA BoLtFire ARD version fire was not within these spatial and temporal windows then it was unsuccessful. A confusion matrix was used to evaluate the performance of the dataset. A third and final comparison was conducted in line with that by Artés et al. (2019), where the total fire count and fire size between the NA BoLtFire ARD version and the agency reference datasets were compared.
3.1 Comparison of matching-lightning methodologies
3.1.1 Candidate lightning agreement
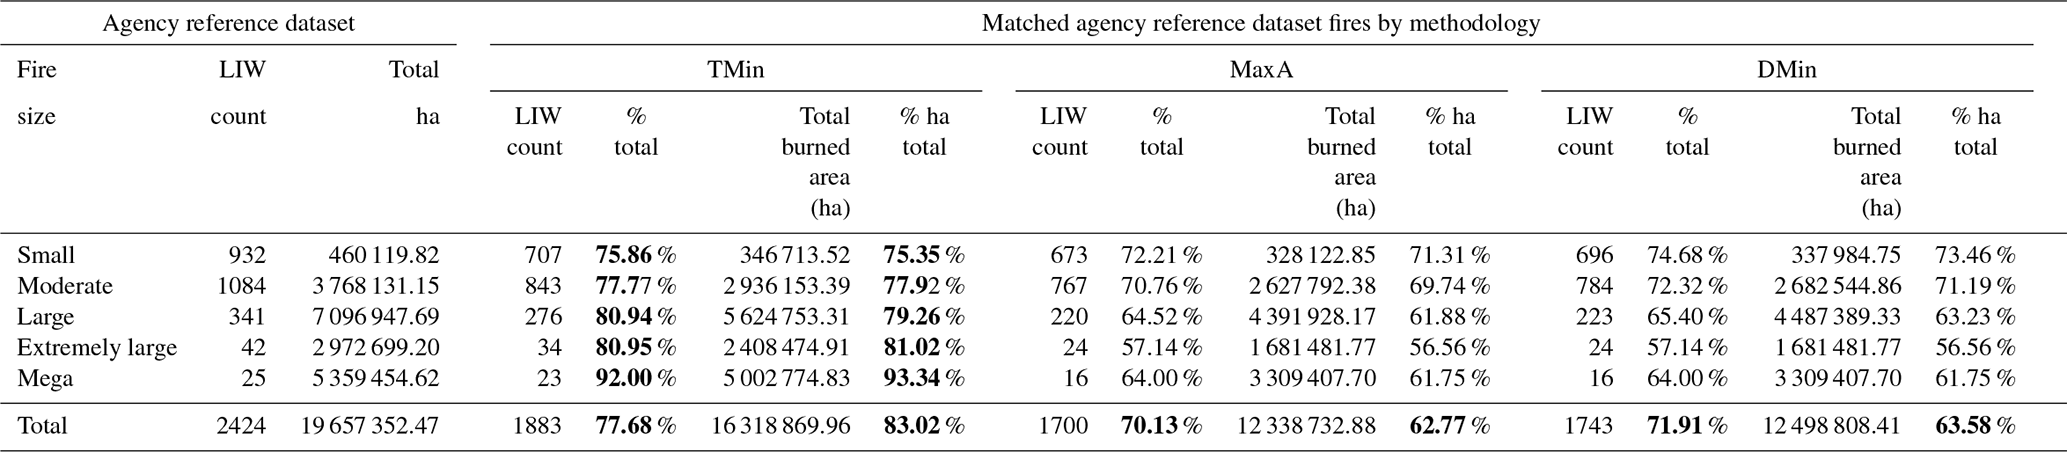
The TMin method outperformed the MaxA and DMin methods slightly, matching 77.68 % of the total agency reference dataset fires, while DMin matched 71.91 %, and MaxA matched 70.13 % (Table 2). Each methodology selected different candidate lightnings, with general agreement between all three methodologies at 36.01 %. DMin and MaxA selected 55.07 % of the same overlapping lightning. There was a general decreasing trend in identical candidate lightnings as fire size increased. For 20.79 % of the fires, all three methodologies failed to find a matching lightning candidate, and 43.19 % of the matched fires had different or no candidate lightning. Breaking down candidate lightning agreement by fire size, the TMin method shows the highest matching for all fire sizes, with improvement as fire size grows, achieving its highest matching for mega-fires at 92.00 %. The DMin method shows the second highest candidate lightning matching for small, moderate, and large fires (74.25 %, 72.32 %, and 65.40 %, respectively), but its performance declines significantly for larger fires, particularly for extremely large and mega-fires, where it drops to 57.14 % and 64.00 %, respectively. MaxA, while less accurate overall, shows a similar trend to DMin, with a decreasing accuracy with increasing fire size, particularly for extremely large fires, where it also drops to 57.14 %.
Table 2Total count and total burned area in hectares of the candidate lightnings found by the three methodologies: TMin, MaxA, and DMin. The total count and burned area as percentages of the total count and total burned hectares of the agency reference dataset are also included for all methodologies. Significant results are in bold.
The average number of possible candidate lightning flashes per LIW was highest for MaxA and DMin for small, moderate, and large fires (Table B1). On the other hand, for extremely large fires and mega-fires, TMin found more possible candidate lightning flashes. This makes sense due to the fact that the TMin first searches within the fire perimeter, and, if no flashes are found, it then searches a 10 km buffer outside the perimeter, while the MaxA and DMin search inside a 10 km buffer around the ignition point. If the fire is within a smaller perimeter, the TMin would only find flashes within that smaller perimeter as opposed to the MaxA's and DMin's 10 km buffer.
3.1.2 Fire size (ha)
For small fires, the TMin method matches more lightning candidates (75.35 % by total burned area) in the agency reference dataset compared to MaxA (71.31 % by ha) and slightly outperforms DMin (73.46 %; Table 2). For moderate and large fires, TMin continues to perform better (77.92 %, 79.26 %) than MaxA (69.74 %, 61.88 %) and DMin (71.19 %, 63.23 %), showing a significant drop in accuracy for MaxA in relation to large fires. Extremely large fires exhibit a consistent pattern, with TMin at 81.02 %, ahead of MaxA (56.56 %) and DMin (56.56 %), demonstrating the lowest accuracy for both MaxA and DMin. Mega-fires also see the highest accuracy for TMin (93.34 %), outperforming both MaxA (61.75 %) and DMin (61.75 %).
3.1.3 Holdover times
In all three methods, the holdover time showed an exponential decrease over the observed period (Fig. 2; Table B2). After being applied to the agency reference dataset, the holdover times for over 50 % of candidate lightnings among the three methodologies (TMin: 57.51 %; MaxA: 58.88 %; and DMin: 65.75 %) were found within the first 3 d (day ); over 88 % were found within the first 10 d (TMin: 90.23 %; MaxA: 92.00 %; and DMin: 93.80 %). The largest frequencies for TMin, MaxA, and DMin were found on day 0 (469, 429, and 576, respectively). These results align with the overall trend that most wildfires occur within the first few days following a lightning event, with the majority occurring within 2 weeks. The TMin method shows the highest median and mean holdover times (2.65 and 4.01 d, respectively; Table B3), with overlapping confidence intervals for both medians and means when compared to MaxA, which has slightly lower values (2.6 and 3.81 d). The DMin method shows the shortest median and mean holdover times (1.88 and 3.22 d).
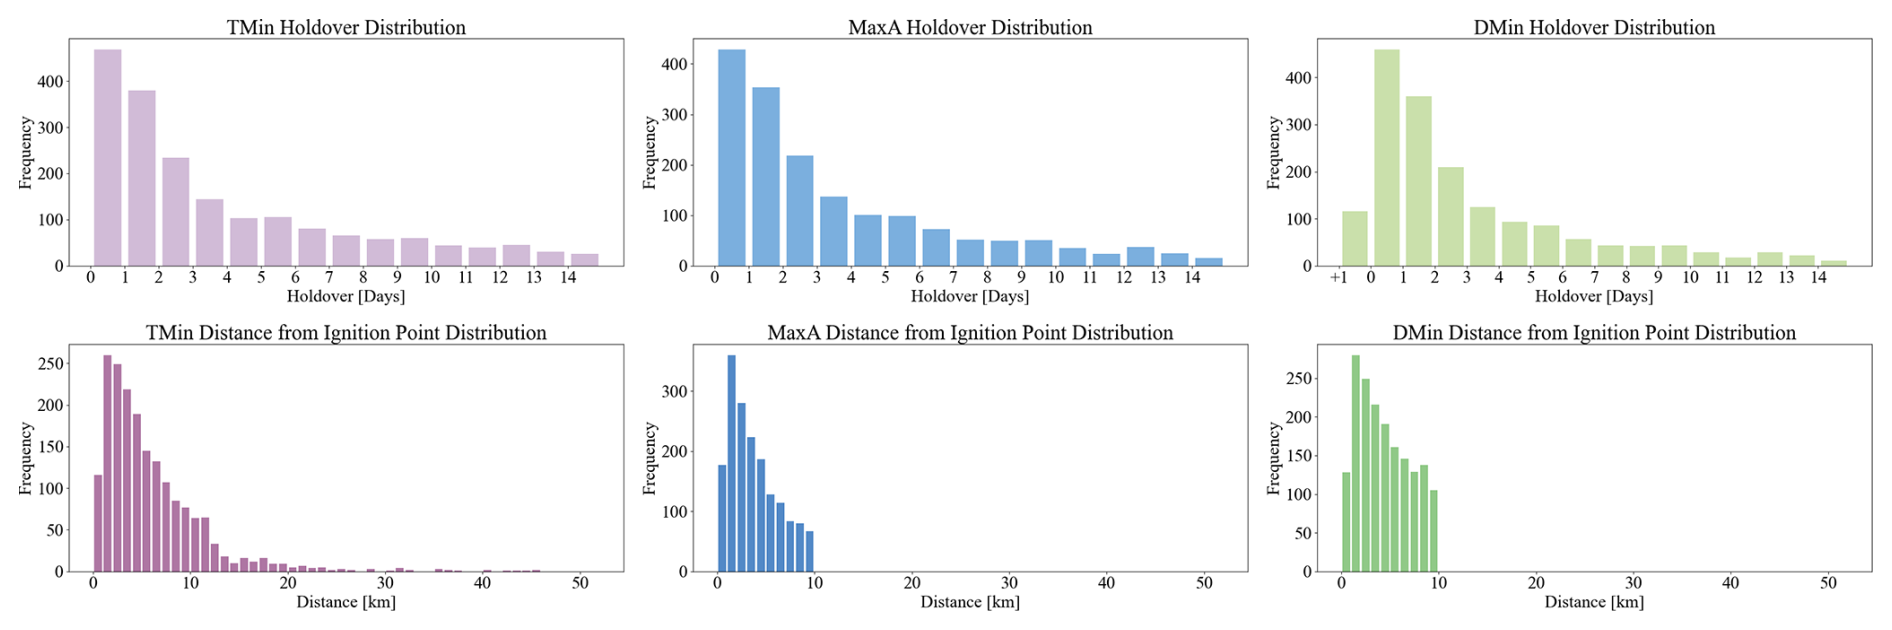
Figure 2Distribution of lightning candidates by holdover time and distance to the agency reference dataset ignition point. Holdover time is calculated as the difference between the start date of each lightning-ignited wildfire and the time of the occurrence of the candidate lightning. Distance is calculated as the distance of the lightning candidate from the ignition point of each lightning-ignited wildfire.
3.1.4 Distance to the ignition point
The median distance of the selected candidate lightnings from the agency reference dataset ignition point varied greatly for all three methodologies. Both the MaxA and DMin methods identify candidate lightnings with shorter distances from the ignition point compared to the TMin method (Table B3). The TMin has a median of 4560 m and a mean of 6065 m. MaxA identified the lightning candidates closest to the ignition point with a median distance of 3128 m and a mean distance of 3749 m. DMin also identifies candidate lightnings with a shorter distance than TMin, with a median of 3991 m and a mean of 4431 m. These results were expected as both the MaxA and the DMin approaches rely on the ignition point in order to select the candidate lightning, while the TMin first looks to select the lightning candidate within the fire perimeter, prioritizing candidates that are only closer temporally to the start date, before then checking outside the perimeter.
To better understand the capacity of the methodologies to locate the igniting flash within the perimeter, a review of the agency reference dataset was conducted as the dataset includes the ignition location. Within the agency reference dataset, 246 of the fires had ignition points located outside of the fire perimeter, and 2178 were located within the fire perimeter (where the ignition of the fire is most likely to occur). To determine the accuracy, the candidate lightnings of all three methodologies were compared to the actual ignition point location (inside vs. outside the perimeter). All three methodologies show varying levels of effectiveness in selecting a lightning candidate point inside or outside the ignition perimeter. The TMin methodology offers the best overall performance, with an overall accuracy of 36.26 %, which is the most accurate when selecting ignition points inside the fire perimeter (Table B4). While both the MaxA and DMin methodologies did the best locating points outside the fire perimeter (57.72 % and 61.79 %, respectively), both struggled to locate them inside the fire perimeter, leading to an overall accuracy of 24.52 % and 20.11 %, respectively. Overall, while all three struggle to accurately determine if the ignition point is inside or outside the perimeter, TMin appears to be the most consistent, with a higher overall accuracy.
3.2 Evaluation of TMin and the BoLtFire dataset
3.2.1 Confusion matrix results
The overall accuracy was 63.39 %, the commission error was 30.07 %, and the omission error was 53.16 %, indicating that approximately 70 % of the fires detected in the NA BoLtFire ARD version were correctly classified, but approximately 53 % of all occurring fires were missed (Table C1). The BoLtFire database is thus conservative in comparison to the agency datasets. Within the agency reference dataset, of the 2424 lightning-ignited wildfires, 1136 wildfires had an NA BoLtFire ARD version match, while 1288 remained unmatched. Of the 2072 lightning-ignited wildfires in the NA BoLtFire ARD version dataset, 1568 lightning-ignited wildfires were matched, while 504 remained unmatched. Overall, the matched fires accounted for 46.86 % of the total fires in the agency reference dataset but covered only 68.81 % of the total burned area from the agency reference dataset. An example of agency fires and the matched NA BoLtFire ARD version can be seen in Fig. 3. Within the agency reference dataset, fire count and size fluctuated drastically across the years, with a recorded total of 2424 fires, burning approximately 19.66×10⁶ ha (Table C2). The year 2015 recorded the highest number of fires, with 514 incidents burning approximately 4.53×10⁶ ha, while 2021 witnessed the lowest number of fires, with only 7 incidents, burning only around 30 259.57 ha (most likely due to the fact that the Canadian agency reference dataset only includes fires until 2020). In terms of matched fires, 2017 had the highest match rate at 187 fires (55.49 % of the 2017 agency reference dataset total lightning-ignited wildfire count), and 2020 had the lowest, with just 11 of the 62 agency reference dataset lightning-ignited wildfires, representing 17.74 % of the total lightning-ignited wildfire count for that year.
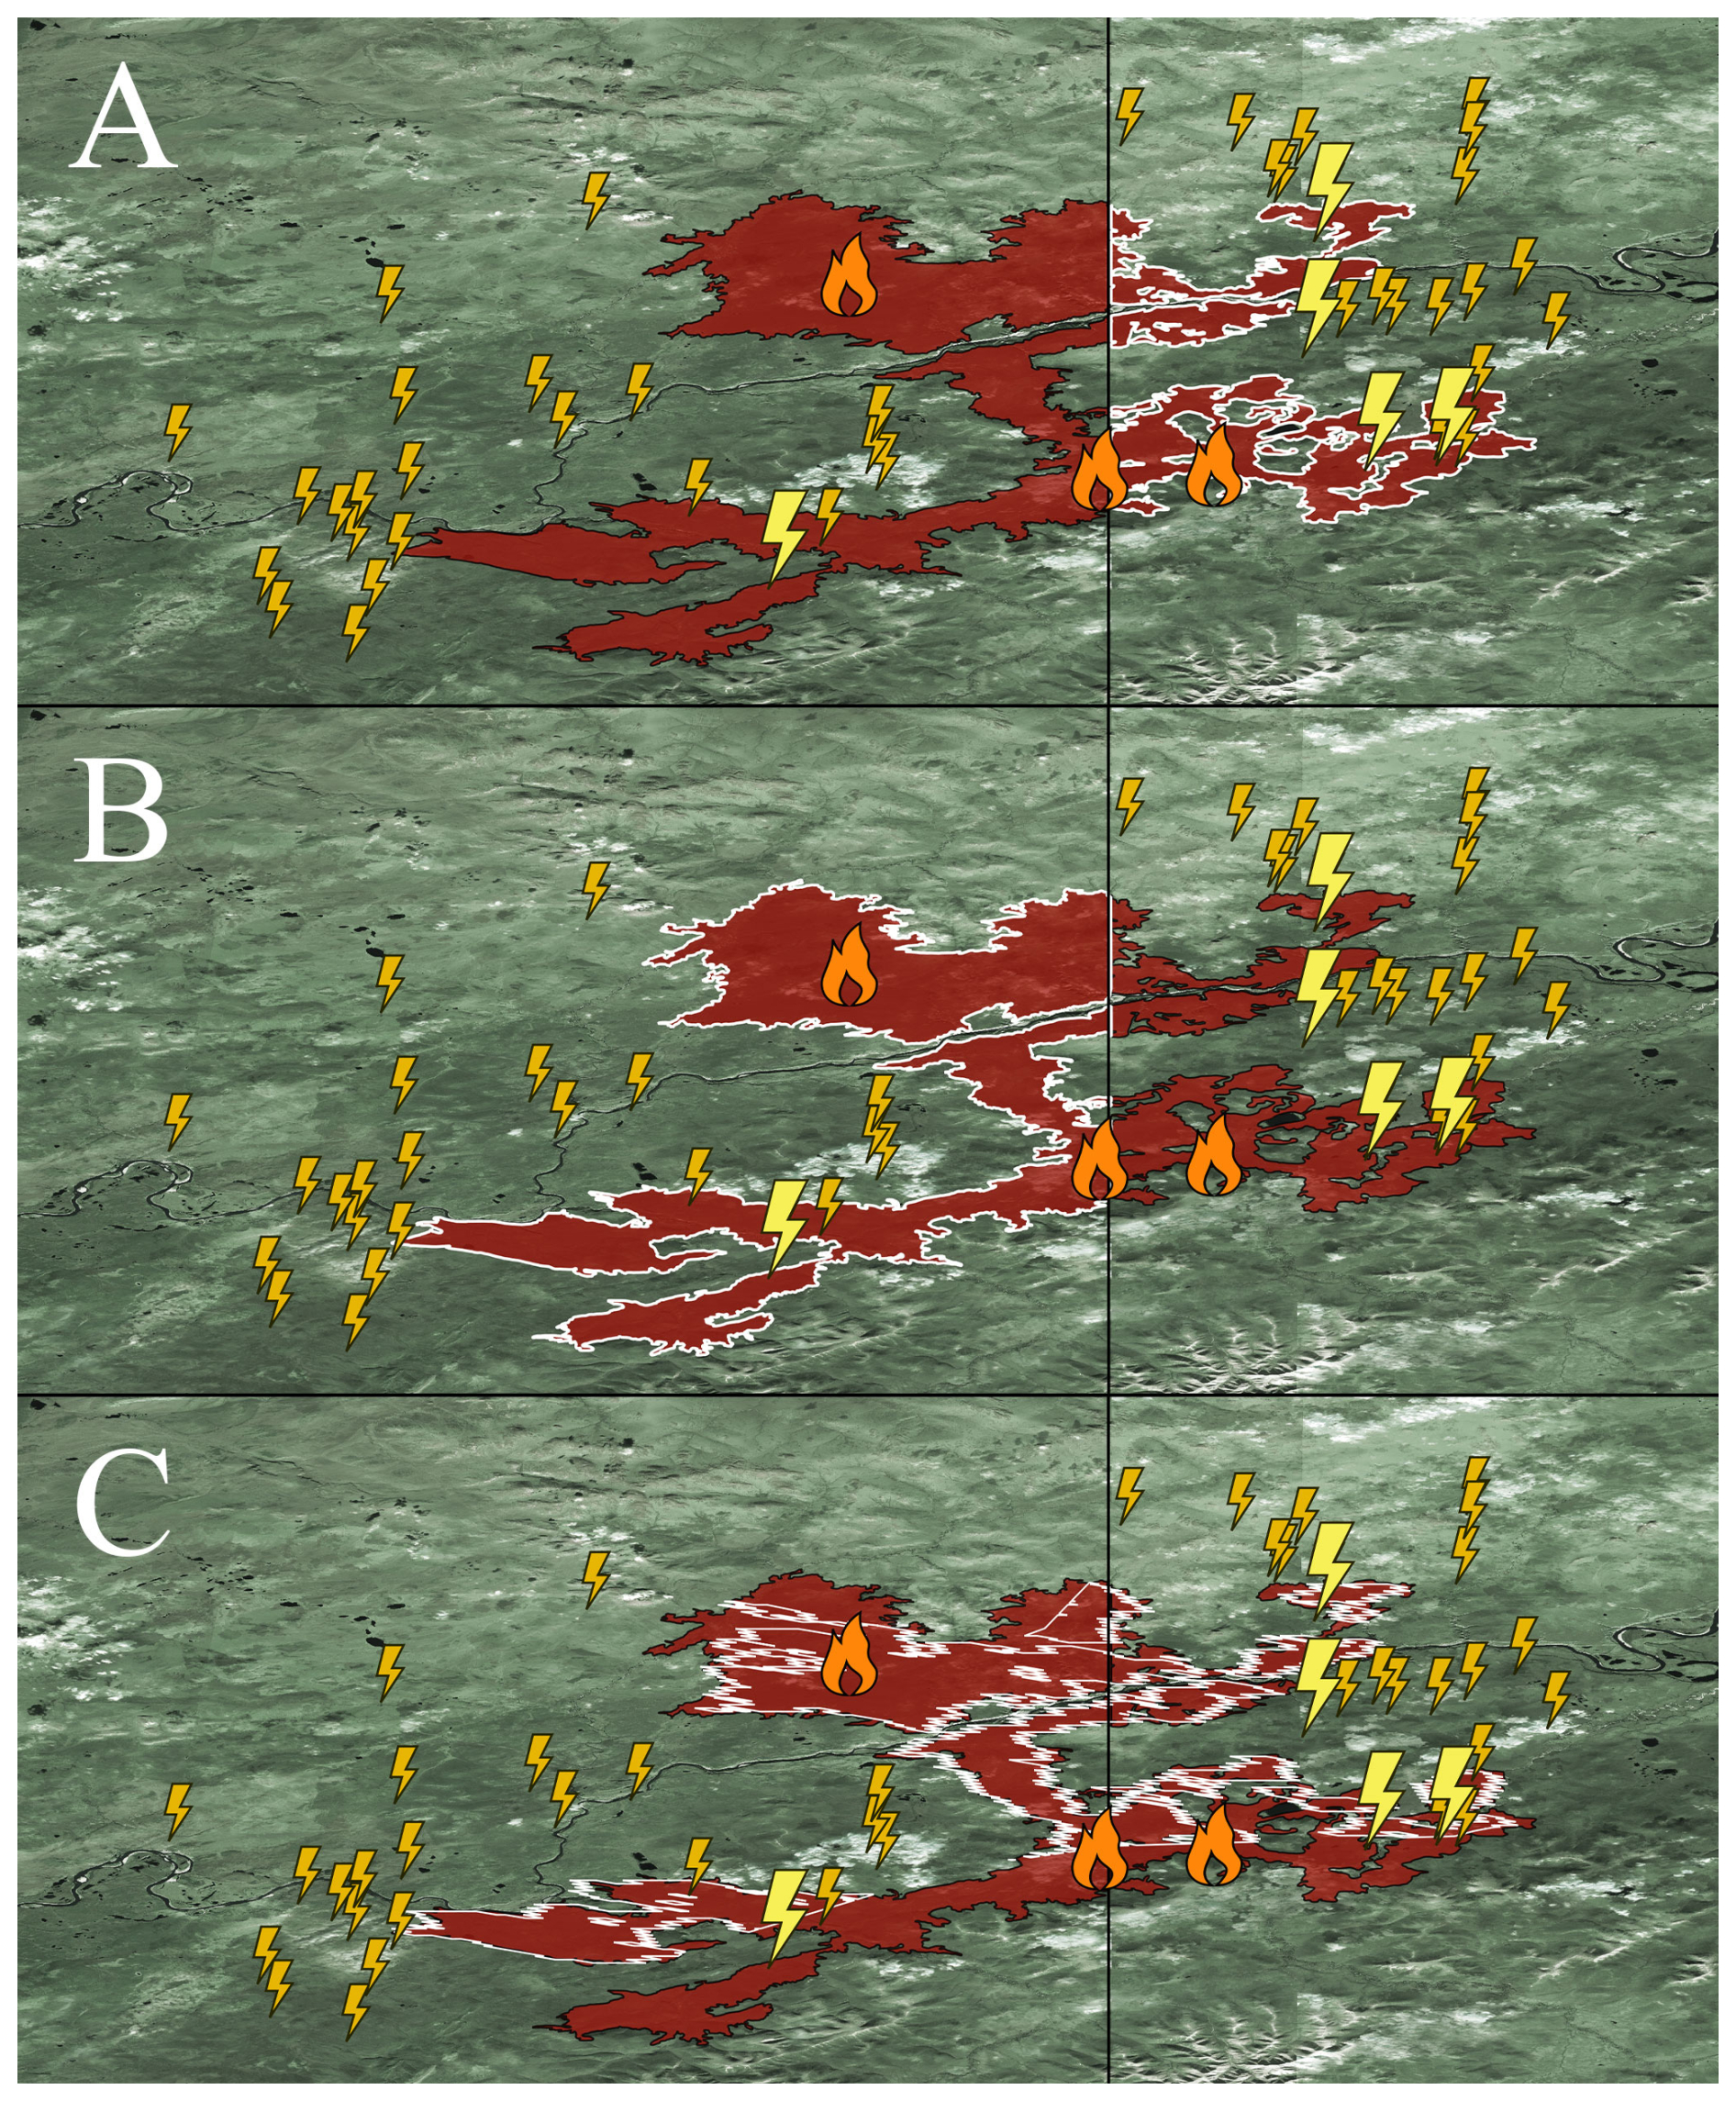
Figure 3Lightning-ignited wildfires that occurred at the Alaskan–Canadian border in the summer of 2017. (a) One LIW on the Canadian side; fire ID no. 2017OC010 was ignited on 22 June and burned 97 102.29 ha. (b) Two LIWs in Alaska: White Mountain Creek (fire ID no. 39800) was ignited on 26 June and burned 37 846.33 ha, and Campbell River (fire ID no. 3983) began on 3 July and burned 31 912.67 ha. (c) Five NA BoLtFire fires with their ignition dates and burned areas: ID no. 19933837 (19 July; 2053.58 ha), ID no. 19856818 (22 June; 1448.33 ha), ID no. 19856822 (22 June; 972.65 ha), ID no. 19933815 (1 July; 1297.02 ha), and ID no. 19856819 (29 July; 64 932.06 ha), totalling 70 704.23 ha. Orange fire icons indicate the official fire start locations from the agency reference dataset, the small gold lightings are lightning flashes, while the larger yellow lightnings are the matched candidate lightning flashes. Base imagery is Landsat 8, USGS.
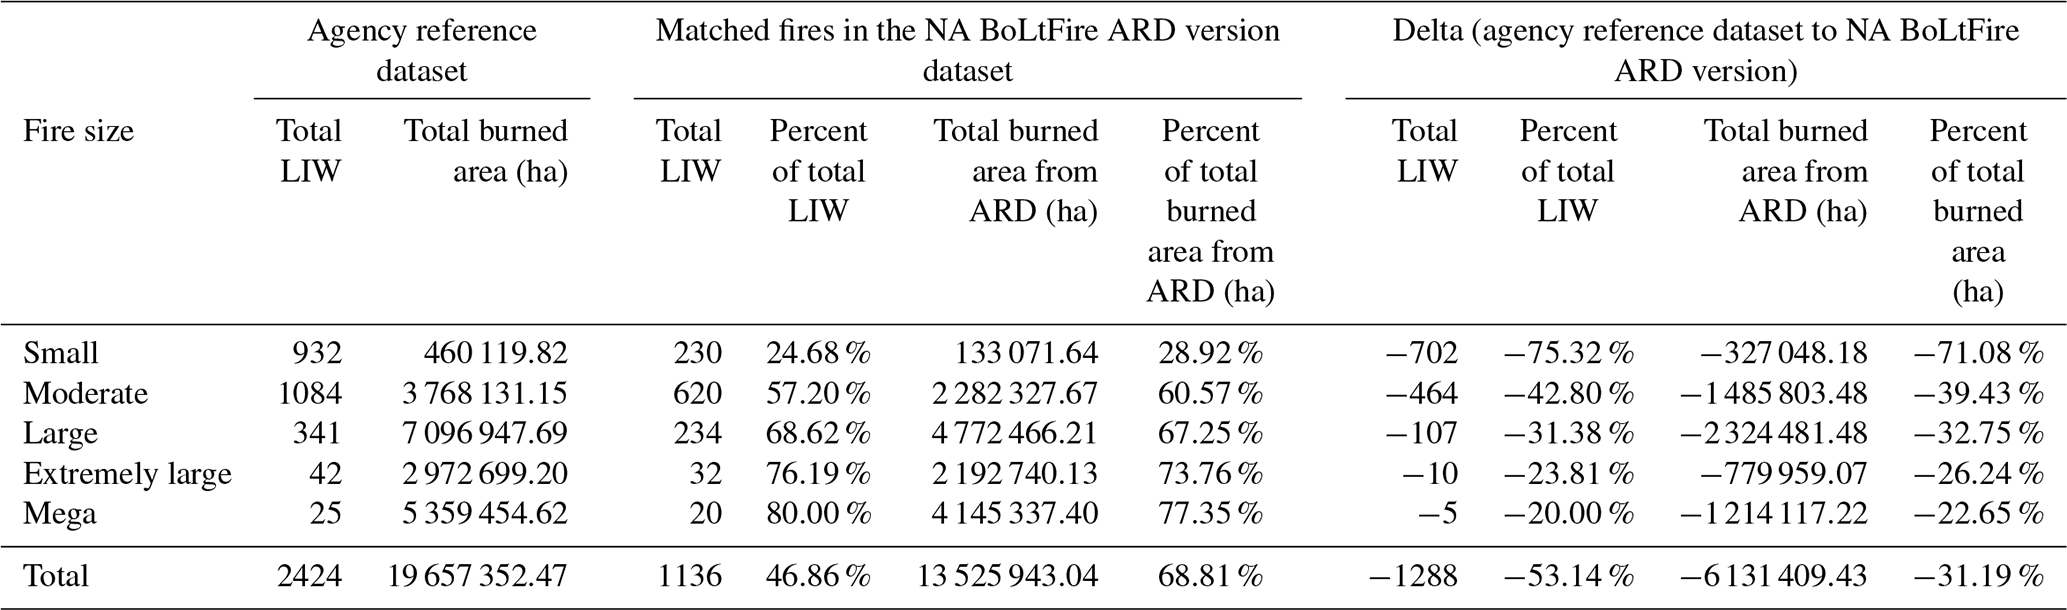
One noticeable trend was that, as fire size increased, both the number of total fires and the total burned area generally improved. Small fires have the lowest matching success as only 24.68 % of the total small fires successfully matched the agency reference dataset (Table 3), with a delta of −71.03 % of the total burned area matched. Moderate and large fires show moderate success, with about 57 %–69 % of fires and burned areas matching, while extremely large fires and mega-fires exhibit a strong matching performance, with 76.19 % of extremely large fires matching with 73.76 % of the total burned area and 80.00 % of the mega-fires matching with 77.35 % of the total burned area. The 10 unmatched extremely large and 5 unmatched mega-fires accounted for approximately 1.99×10⁶ unmatched hectares, representing 32.52 % of the total unmatched burned area. When small and moderate fires were removed, 286 of the remaining 408 fires were matched, increasing the overall matching from 46.86 % to 70.10 % of total fires and increasing the matched total burn area from 68.81 % to 72.01 %. Overall, we found that the matching process is more effective for larger fires in terms of both the number of fires and the total burned area matched.
Table 3Comparison of the total number of fires and the total burned area by fire size category between the agency reference dataset (ARD) and the matched fires in the North American BoLtFire dataset using the total burned area for both from the agenda reference dataset.
3.2.2 Fire count and fire size comparison
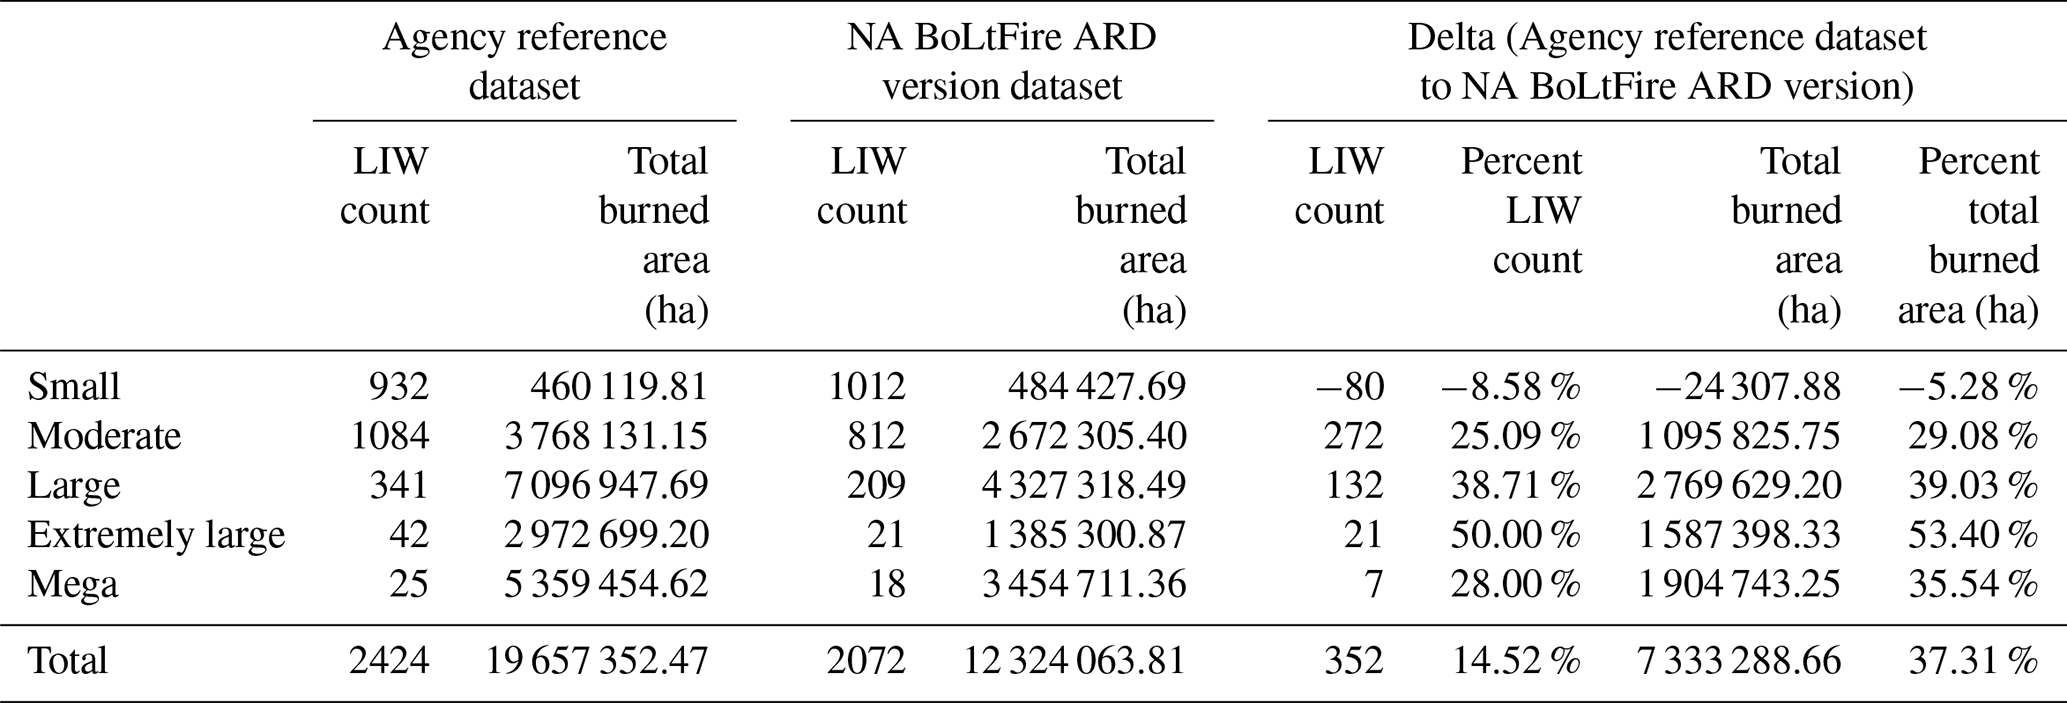
The agency reference dataset reports 2424 fires, burning approximately 19.66×10⁶ ha, while the NA BoLtFire ARD version dataset records 2072 lightning-ignited wildfires, with a total burned area of approximately 12.32×10⁶ ha (Table 4). Small fires were more frequently recorded in the NA BoLtFire ARD version dataset (1012 fires) compared to the agency reference dataset (932 fires), though the difference in the burned area for small fires was relatively small. However, the agency reference dataset records a higher number of moderate (delta of 272), large (delta of 132), extremely large fires (delta of 21), and mega-fires (delta of 7), burning significantly more hectares than in the NA BoLtFire ARD version dataset. Moderate fires also show a significant difference, with the agency reference dataset reporting 272 more incidents and a 25.09 % larger total burned area. The most notable differences between the two datasets can be seen in the larger fire categories, with the agency reference dataset showing significantly more large fires, extremely large fires, and mega-fires, resulting in a 35 % to 53 % larger burned area (39.03 %, 53.40 %, and 35.54 %, respectively). Overall, the NA BoLtFire ARD version dataset reflects a higher total count, while the agency reference dataset reflects a larger burned area. However, when looking at fire size categories, the NA BoLtFire ARD version dataset is slightly higher in terms of small fires but substantially lower across all other fire sizes with regard to both count and total burned area.
Table 4Total count and total burned area of both the agency reference dataset and the NA BoLtFire ARD version from 2012 to 2022, organized by fire size. The delta was calculated between the agency reference dataset and the NA BoLtFire ARD version dataset.
3.3 BoLtFire dataset overview
Of the original 21 816 total filtered GlobFire events, 6902 were identified through the TMin methodology (within 14 d and 10 km of the GlobFire event) to be lightning ignited (31.63 %). The BoLtFire dataset encompasses lightning-ignited wildfires located in forest and forest-like land covers in boreal forests from 2012 to 2022 that are at least 200 ha in size. Of the 6902 fires, 4201 were located in Eurasia, and 2701 were located in North America (Fig. 4). Within those 4201 fires identified as lightning-ignited wildfires within Eurasia, 4151 are located in Russia, 41 are in Mongolia, 8 are in Sweden, and 1 is located in Finland. Of the 2701 in the North American BoLtFire, 2421 are located in Canada, and 280 are located in Alaska, United States. The BoLtFire dataset encompasses a total of approximately 36.65×10⁶ ha of burned area (21.09×10⁶ ha in Eurasia and 15.57×10⁶ ha in North America), with an overall average burned area per fire of 5310.74 ha. The information included for each fire within the dataset can be found in Table 1.
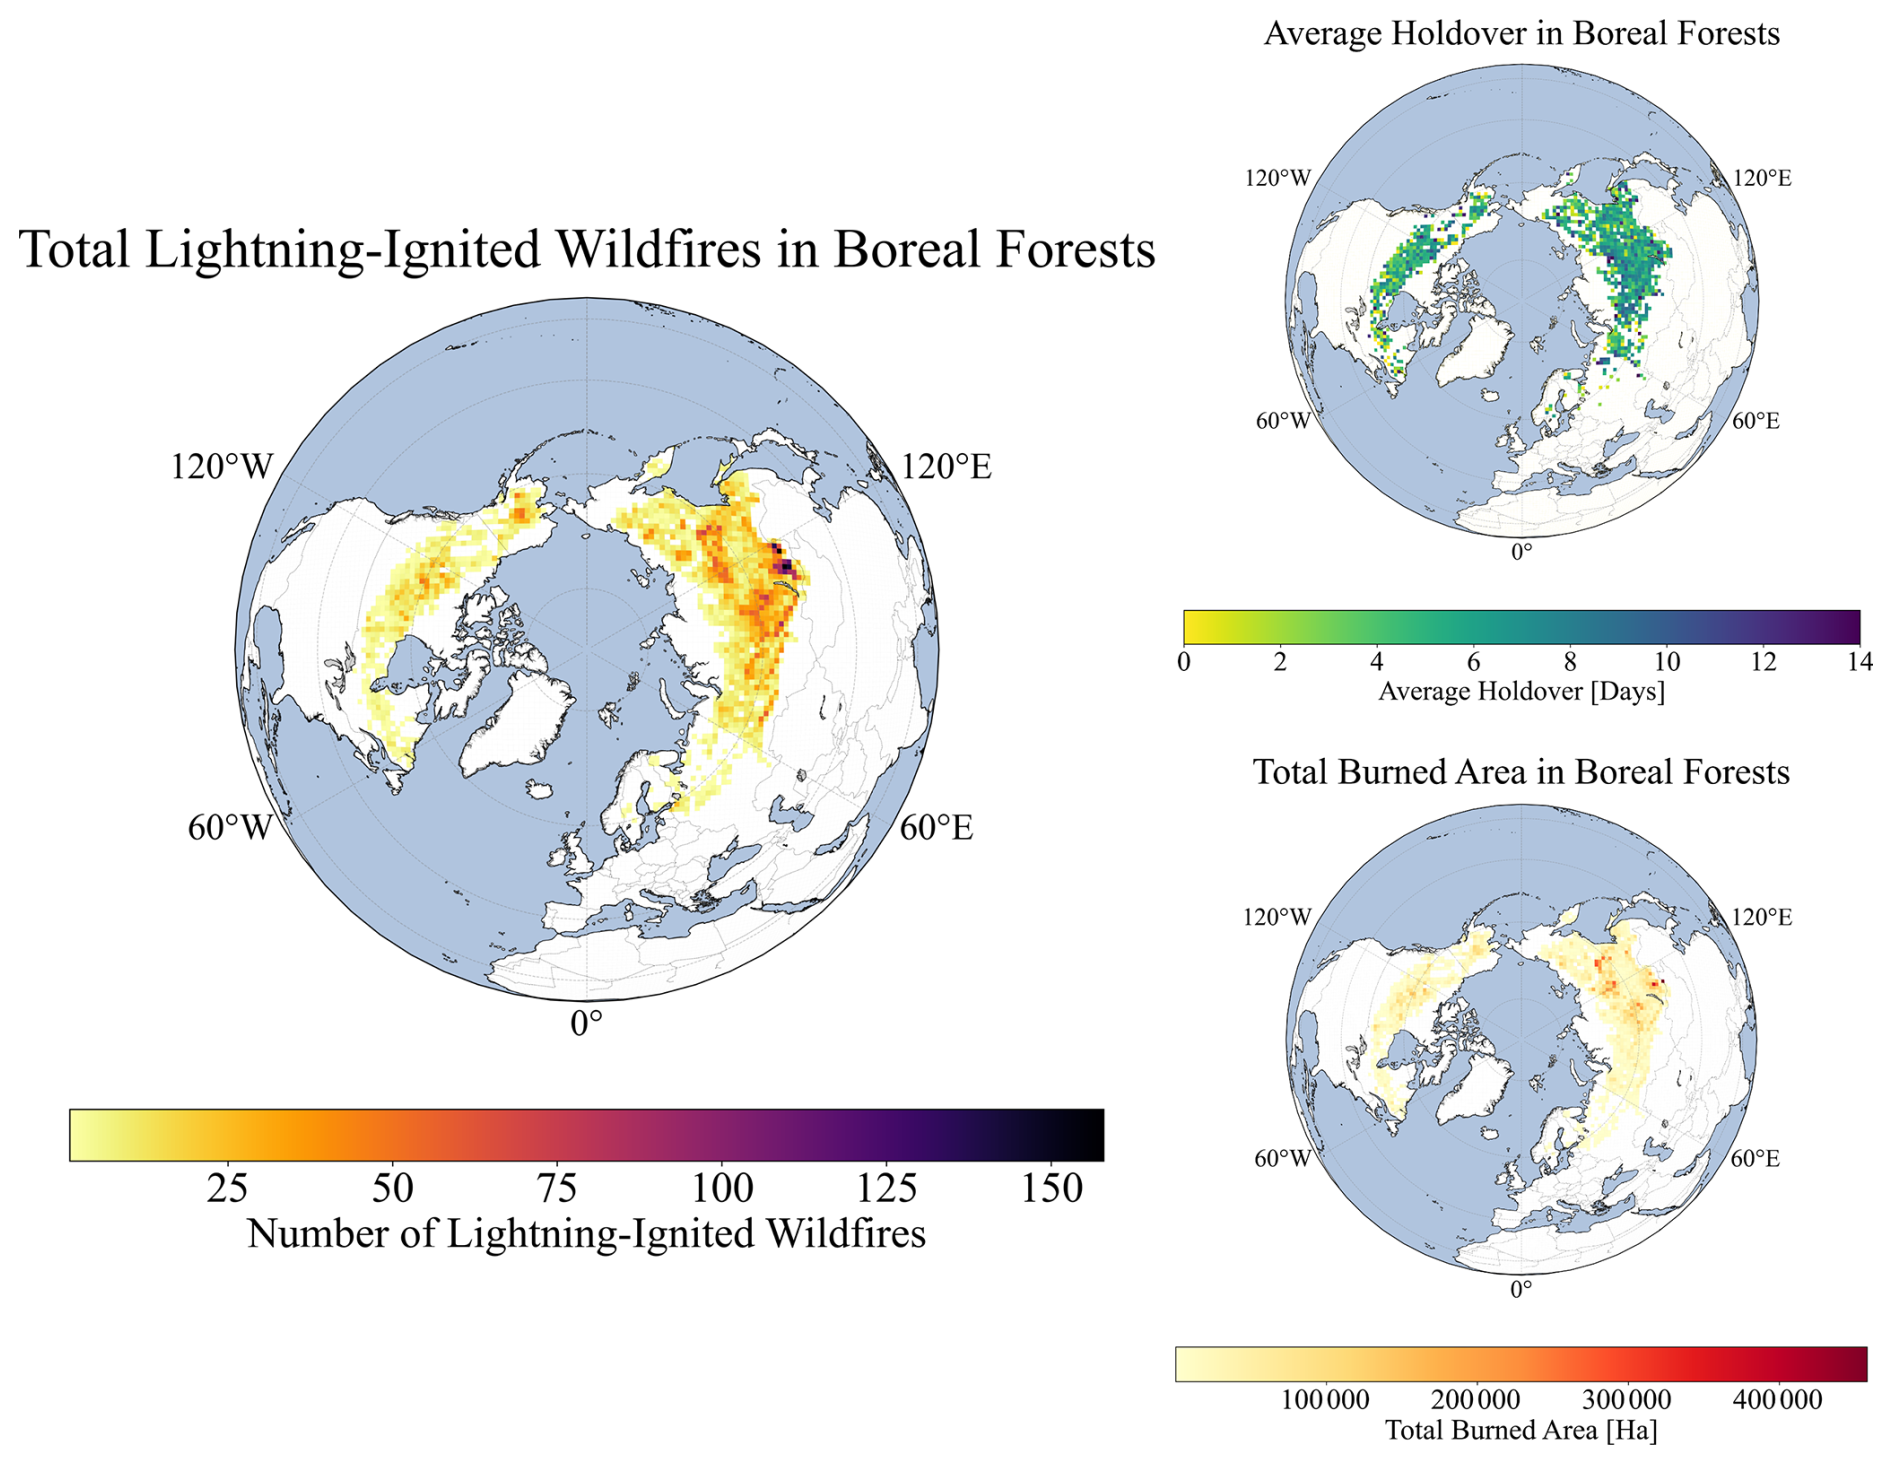
Figure 4Visual depiction of all fires located in forest and forest-like land covers in boreal forests from 2012 to 2022 that are equal to or greater than 200 ha.
3.4 Characterization of lightning-ignited wildfires
We summarized the following metrics for each continent: holdover time; distance to fire perimeter; lightning ignition efficiency; frequency of fires per year; and total burned area, area burned by fire size class, and total burned area per land cover.
3.4.1 Holdover
Similarly to the agency reference dataset, the holdover time within the BoLtFire dataset exhibited an exponential decline, with the highest frequency occurring within the first 24 h (Fig. 5). Specifically, 734 lightning-ignited wildfires (10.63 %) were identified on the first day, and 2137 lightning-ignited wildfires (30.96 %) ignited within the first 3 d (day 0 to day 2; Table D1). The cumulative number of lightning-ignited wildfires increased quickly, with over half of all fires being recorded within 5 d (day 0 to day 4) and 79.24 % occurring within the first 10 d.
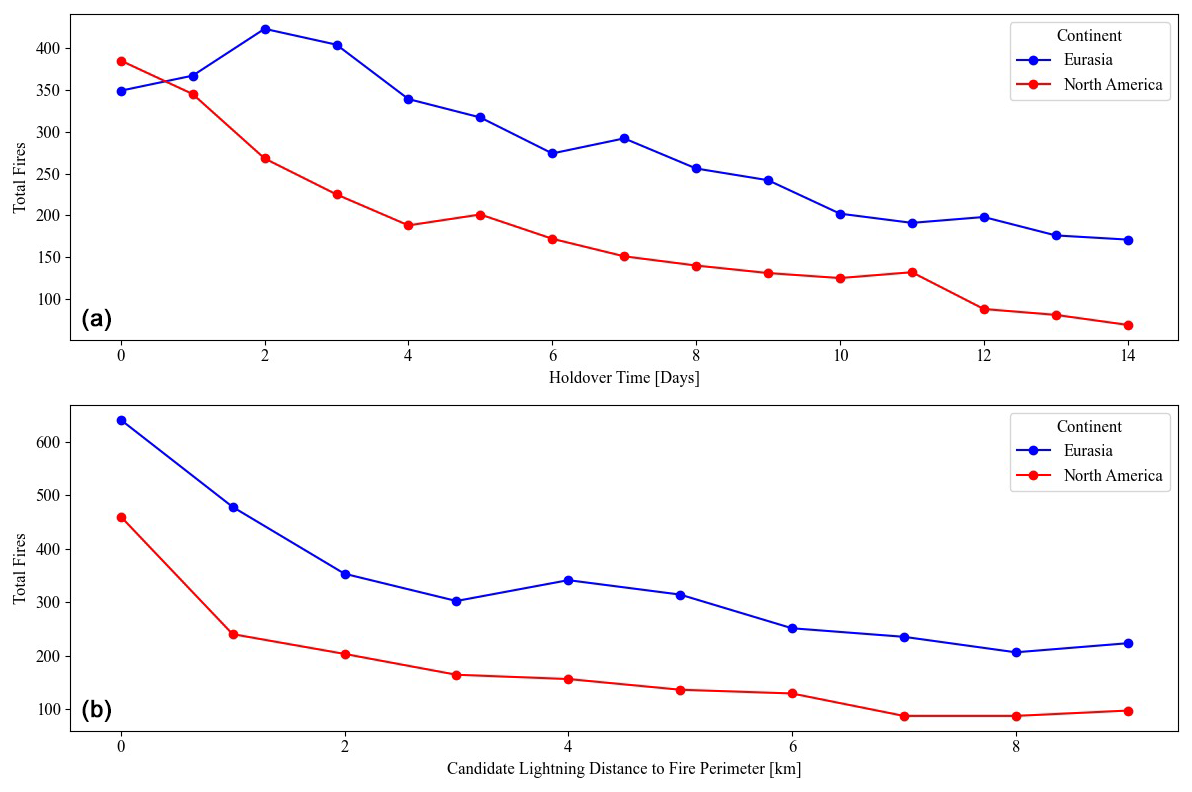
Figure 5(a) Top graph compares the holdover time for the total number of fires over a 15 d period between the Eurasia and North America BoLtFire dataset continents. (b) Bottom graph compares the distance of the candidate lightning from the fire perimeter for all of the fires whose candidate lighting was located outside the fire perimeter within the Eurasia and North America BoLtFire dataset continents.
3.4.2 Distance to fire perimeter
The analysis of the distance of the ignition point from the perimeter of the fire revealed a pattern similar to that of the holdover, namely a decrease in total fires as the distance from the perimeter increases (Fig. 5). A total of 1799 of the ignition points were located within the perimeter of the fire. The remaining 5103 ignition points were located outside of the perimeter, where 208 were within 100 m of the fire perimeter, 1101 (21.58 %) were within 1 km, and over half (2841, 55.67 %) were within 4 km (Table D2). This trend was mirrored in both Eurasia and North America.
3.4.3 Lightning ignition efficiency
The BoLtFire dataset reveals variations in the incidence of lightning ignition efficiency (LIE) across both continents for fire sizes of at least 200 ha (Table D3). Eurasia recorded a higher number of total flashes (approximately 15 million) and a greater number of lightning-ignited wildfires (4201) compared to North America's 12.53 million flashes and 2701 lightning-ignited wildfires. Approximately 0.000280 of lightning flashes resulted in ignition in Eurasia, while 0.000216 of flashes led to an ignition in North America. Overall, the combined data across both continents show a total of nearly 27.53 million flashes, resulting in 6902 lightning-ignited wildfires, with an overall lightning ignition efficiency of 0.000251. To better understand the lightning ignition efficiency at a more regional level, it was calculated by country: the United States (Alaska) has the highest lightning ignition efficiency at 0.005025. Mongolia has the next highest efficiency at 0.000769, with Russia following with 0.000291. Canada has a much lower lightning ignition efficiency of 0.000194, while Sweden and Finland have the lowest lightning ignition efficiencies at 0.000037 and 0.000003, respectively. These data suggest that the likelihood of lightning igniting wildfires varies considerably across these countries for larger fires.
3.4.4 Frequency of fires per year and total burned area
Understanding the number of fires per year is critical for assessing the frequency and trends of wildfire occurrences. The total frequency of lightning-ignited wildfires exhibited substantial year-to-year variability across both continents, with the highest number of lightning-ignited wildfires being found in 2013 (942) and the lowest number being found in 2019 (105) (Table D4). From a total-burned-area perspective, even though 2013 had the most lightning-ignited wildfires, it burned only the third highest amount of area at close to 4.53×10⁶ ha, while 2021 had the most burned area at 8.54×10⁶ ha, and 2019 had the least at 840 774.68 total ha burned. In 2012, the dataset shows that Eurasia had no lightning-ignited wildfires, while North America had 223. This discrepancy is most likely due to the ENTLN having fewer sensors available at the time as only 244 total lightning flashes were found in that year in Eurasia (the average amount is approximately 1 363 542 per year). In 2013, despite Eurasia having more lightning-ignited wildfires, North America experienced a significantly larger burned area (2.81×10⁶ ha compared to 1.73×10⁶ ha in Eurasia).
3.4.5 Area burned by fire size class
Within the BoLtFire dataset, small fires are the most common, with 3623 LIWs, burning a total of approximately 1.71×10⁶ ha, resulting in an average of 155 516.33 ha yr−1 and 472.17 ha per fire (Tables D5 and D6). Moderate fires follow, with 2614 lightning-ignited wildfires, contributing to a total burned area of about 8.46×10⁶ ha and an average of 769 264.20 ha yr−1 and 3237.15 ha per fire. Although large fires are less frequent, with 555 incidents, they account for a significant burned area of approximately 11.6×10⁶ ha, averaging 1 054 329.48 ha yr−1 and 20,896.62 ha per fire. Extremely large fires and mega-fires are the least common (58 and 52 incidents, respectively), but they contribute disproportionately to the total burned area. Extremely large fires burned 3.96×10⁶ ha, with an average of 360 420.93 ha yr−1 and 68 355.69 ha per fire, while mega-fires had the largest average burned area at 992 715.94 ha yr−1 and 209 997.60 ha per fire, totalling approximately 10.92×10⁶ ha. When reviewing all fire sizes, North America has an average burned area of 5762.97 ha per fire, which is relatively close to Eurasia's 5019.98 ha per fire. When averaging the smaller fire sizes (small and moderate fires), North America has a higher average burned area of 1765.82 ha per fire compared to Eurasia's 1547.53 ha per fire. When looking at just the larger fire sizes (large, extremely large, and mega), Eurasia has a significantly larger average burned area of 43 346.26 ha compared to North America's 35 931.28 ha burned area. Overall, North American small and moderate fires tend to be larger than Eurasia's, but Eurasia tends to have larger large fires, extremely large fires, and mega-fires.
3.4.6 Total burned area per land cover
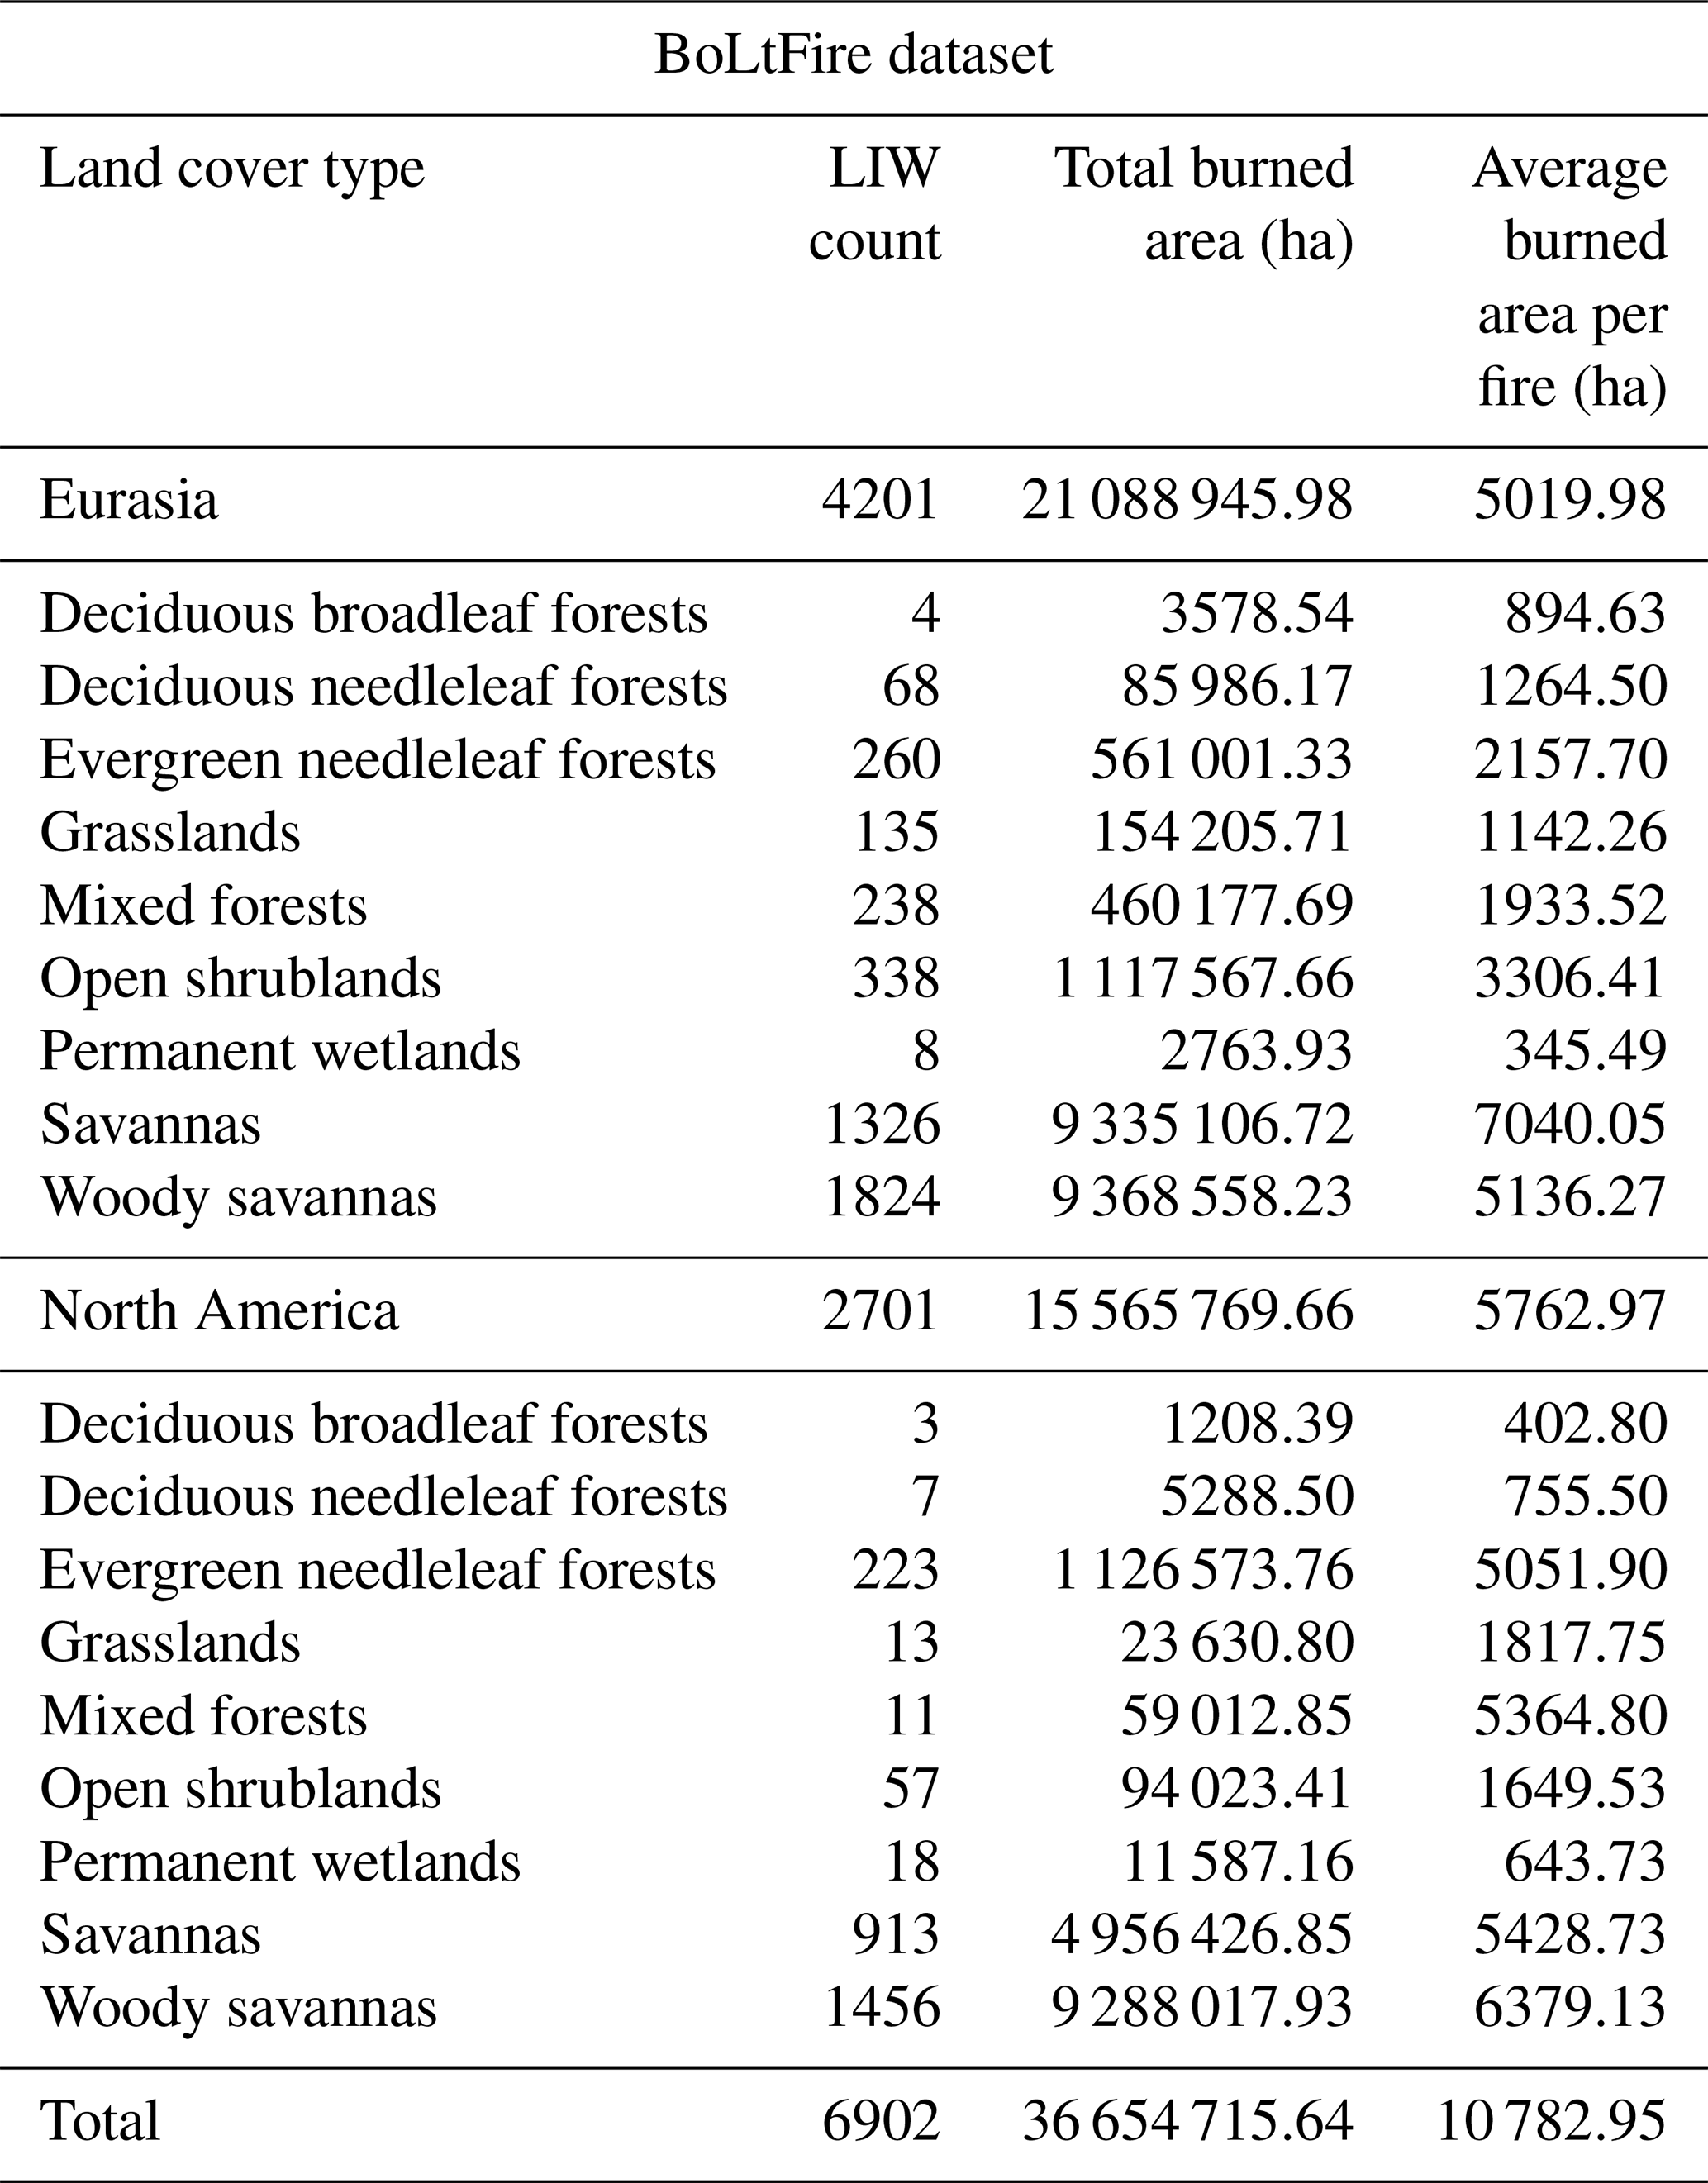
Within the BoLtFire dataset, woody savannas and savannas are the most affected forest or forest-like land cover types, with 3280 and 2239 fires, respectively, contributing to the largest total burned areas of approximately 18.66×10⁶ ha and 14.3×10⁶ ha or 89.89 % of the total burned area (Table D7). Evergreen needleleaf forests also had an impact, with 483 fires burning approximately 1.69×10⁶ ha, accounting for 4.6 % of the total burn area. Open shrublands and mixed forests experienced moderate impacts, accounting for 3.31 % and 1.42 % of the total burned area, respectively. Unsurprisingly, savannas had the largest average burn area per fire at 6383 ha, followed closely by woody savannas at 5687.98 ha, evergreen needleleaf forests at 3493.94 ha, and open shrublands at 3067.32 ha. Deciduous broadleaf forests, permanent wetlands, and deciduous needleleaf forests had the fewest total burned hectares and some of the smallest average burned area per hectare. The total burned area was driven strongly by the savanna and woody savanna land covers, and this trend was also mirrored in both Eurasia and North America.
When all other land covers besides forest-specific ones (deciduous broadleaf forests, deciduous needleleaf forests, evergreen needleleaf forests, and mixed forests) were removed, Eurasia contained a total of 570 fires, contributing to a combined fire area of 1 110 743.72 ha, with an overall average fire size of 1948.67 ha. In North America, there were 244 fires, with a total area burned of 1 192 083.51 ha and an overall average fire size of 4885.59 ha. North America had, on average, larger small (492.81 ha vs. 459.92 ha, respectively), moderate (3671.42 ha vs. 2968.27 ha), and large fires (20 704.42 ha vs. 17 680.42 ha). Eurasia did not contain any forest-specific extremely large fires, while North America had five extremely large fires, totalling 517 610.42 ha, with an average fire size of 20 704.42 ha. Neither Eurasia nor North America had forest-specific land-cover-based mega-fires. While Eurasia experienced a significantly higher number of fires, North America had fewer but larger fires on average. This suggests potential differences in fire management or environmental conditions influencing fire behaviour between the two continents.
4.1 Agency reference dataset and NA BoLtFire ARD version dataset comparison
The candidate lightning agreement highlighted the important methodological choices when matching lightning candidates (Moris et al., 2020). Although all three methods performed relatively well, finding candidate lightnings for at least 71 % of the agency reference dataset, they had difficulty agreeing on the “correct” lightning candidate, with only 36.01 % agreement across all three methodologies. This discrepancy is likely to be due to the differences in methodological approaches as MaxA and DMin, which have similar methodologies, agreed on 55.07 % of candidates, while TMin agreed with MaxA on only 44.31 % and with DMin on 37.33 %. Overall, TMin matched the most lightning candidates (77.68 %), while DMin and MaxA matched slightly fewer at 71.91 % and 70.13 %, respectively. However, significant differences became clear in the total burned area matched: out of approximately 19.66×10⁶ ha in the agency reference dataset, TMin identified candidate lightning for approximately 16.32×10⁶ ha, whereas DMin identified candidate lightning for only 12.50×10⁶ ha (3.82×10⁶ ha less than TMin), and MaxA identified candidate lightning for only 12.34×10⁶ ha (3.98×10⁶ ha less than TMin).
While TMin matched more large fire sizes, MaxA identified the lightning candidates closest to the ignition point but correctly located only 24.52 % within the fire perimeter. While the agency reference dataset did have 246 ignition locations outside the fire perimeter, 89.85 % of ignitions occurred within the fire perimeter. Of the 2178 ignitions inside the fire perimeter, TMin had the highest accuracy, correctly identifying 754 of those ignitions within the perimeter (34.62 % accuracy). This low accuracy could be attributed to several factors, one of which could be the TMin methodology, though it originally looks for only candidate lightnings within the perimeter; if one is not found within a certain window (14 d) then it starts to look outside the perimeter. The holdover for these fires could be longer than 14 d as holdovers in boreal forests can last for a significant period of time before flaming (Scholten et al., 2021). Additionally, it could be due to location error of the lightning locations as quite a large portion of the boreal forest is remotely located. Furthermore, as noted by Hanes et al. (2019), the Canadian National Fire Database points are just the presumed points of ignition, which may also explain why 246 of the ignition locations were not within their corresponding fire polygons. Furthermore, as Crowley et al. (2023) highlighted, both points and perimeter polygons in the Canadian National Fire Database are compiled and submitted by different provinces, potentially adding additional discrepancies and leading to variations in definitions across the datasets.
The results of the confusion matrix comparing the temporal and spatial overlap of the agency reference dataset and the NA BoLtFire ARD version dataset indicated that our proposed TMin methodology was promising, with low commission and moderate omission errors of 30.07 % and 53.16 %, respectively. Interestingly, small and moderate fires matched the fewest fires, and when they were removed, the overall matching increased from 46.86 % to 70.10 % of total fires, indicating that fires that are less than 10 000 ha are more difficult to match than larger fires. This may be due to the difficulty MODIS has in detecting smaller wildfires (discussed further in Sect. 4.3, Limitations). Another possible explanation could be the size of the matching temporal window. In their study, Fusco et al. (2019) used a 7 d window when spatially matching their MODIS fires, which is what we also implemented. After applying this window, we had five unmatched mega-fires, which we then reviewed visually to better understand why they were unmatched. We noticed that three of the five had fire perimeters within the agency reference dataset that matched well visually, but all had start dates outside of 7 d but within 30 d of the agency reference fire. Due to the remoteness of some of these fires and possible fire recognition issues with the underlying MODIS data, an increase in the window size could include more fires. This increase in window size could also cause fires to be incorrectly associated with neighbouring fires due to the increase in window size. Overall errors of omission are likely to be due to the detailed limitations mentioned below, as well as differences in pixel resolution, satellite overpass time, and cloud and smoke cover (Giglio et al., 2009; Hantson et al., 2013; Hawbaker et al., 2008; Johnston et al., 2018; Roy et al., 2005). Errors of commission are likely to be due to fire-free surfaces that are highly reflective (Cardoso et al., 2005; Giglio et al., 2009; Hantson et al., 2013), though this is less likely in this study as both urban and agricultural land uses were removed. As we removed fires that were smaller than 200 ha, our errors of omission and commission are likely to be lower than expected.
4.2 BoLtFire dataset
From a global perspective, the BoLtFire dataset provided interesting insights that could help enhance our understanding of the holdover time, lightning ignition efficiency, primary characteristics, frequency, and spatial distribution of lightning-ignited wildfires in boreal forests. The holdover phenomenon poses a significant challenge to the real-time detection of lightning-ignited wildfires. While our results generally align with the current literature as the frequency of the holdover decreased over time, they differ with regard to the initial detection as the majority of lightning-ignited wildfires are typically detected within the first 24 h (Gao et al., 2024; Moris et al., 2023). Our lightning-ignited wildfire holdovers resulted in just 10.63 % occurring within the first 24 h, with 47.71 % occurring within a 5 d window (day 0 to day 4). This could be due to a variety of factors, including the global scale of our results (most studies are done at a local or more regional level). Additionally, lightning-ignited wildfires are strongly influenced by fuel type, weather, and topography; holdover times could reflect this dependency.
The analysis of the distance of the ignition point from the perimeter of the fire also revealed a decrease in total fires as the distance from the perimeter increased. While the agency reference dataset did have ignition points outside the fire perimeter, these accounted for 10.15 % of the total dataset. Within the BoLtFire dataset, 73.94 % of fires have an ignition point outside the fire perimeter. This could be due to a couple of different reasons: it could be that the ignition point was associated with the wrong fire perimeter (i.e. the correct fire perimeter was not identified by MODIS or was removed in the filtering process); the correct lightning candidate within the fire perimeter was not within the ENTLN dataset; or, possibly, there were spatial location errors in either the underlying MODIS dataset or the ENTLN dataset or in both of them. Benali et al. (2016) found that there could be up to a 12 h temporal and 2 km spatial lag between data reported by agencies and data that were derived by a satellite. We think it is most likely both as, within the 5103 ignition points located outside the perimeter, 21.58 % were located within 1 km of the perimeter, 35.65 % were within 2 km, and over half were within 4 km.
While thunderstorms generate thousands of strikes a year, the likelihood of ignition occurring from a lightning strike is low as only a few manage to persist long enough to enter a flaming stage (Wotton and Martell, 2005; Pineda and Rodríguez, 2023; Podur et al., 2003). Latham and Williams (2001) found that, within much of North America, 0.01 to 0.04 lightning strikes actually ignite a fire; on average, about 0.00167 caused an ignition in Alaska (Wendler et al., 2011), 0.001329 caused an ignition in Alberta and Saskatchewan (Nash and Johnson, 1996), 0.02 caused an ignition in British Columbia, and 0.00071 caused an ignition in Alberta (Wierzchowski et al., 2002). Our lightning ignition efficiency across North America and Eurasia varies from that found in the literature, though this is likely to be due to the regionality of the other studies and our filtering process. When reviewed more closely, the lightning ignition efficiency of our lightning-ignited wildfires in Canada was roughly 0.000194, and Alaska's lightning ignition efficiency was roughly 0.005025 or 3/595. Though Canada's lightning ignition efficiency rate is not in line with the literature, Alaska's is. This could be due to the 200 ha filter, which would have removed a significant number of smaller fires. Additionally, this could be due to the filtering but could also indicate that lightning ignition efficiency needs to be conducted at a more local and regional level. Furthermore, upon visual inspection, some lightning data were located within a country but were not labelled as such due to imperfections within the World Bank (2020) Official Boundaries dataset. This could lead to a higher lightning-ignited efficiency than what was reported.
There was no distinct increase or decrease in fire count and size over the years, with both variables experiencing high year-to-year variation. As mentioned, weather and other climatic factors play a significant role in lightning-ignited wildfire ignition, which could help explain the general variation between and within the total count and burned area in fire seasons. However, one of the most prevalent trends in the BoLtFire dataset shows that larger fires, despite the smaller overall fire count, are disproportionately responsible for the largest portion of the total burned area, whereas small and moderate fires represent 90.37 % of the total fire count but account for just 27.75 % of the total burned area. Conversely, large fires, extremely large fires, and mega-fires make up 9.63 % of the total fires but are responsible for 72.25 % of the total burned area. This trend is also observed in the agency reference dataset, where small and moderate fires constitute 83.17 % of the total fire count but only contribute to 21.51 % of the total burned area. In contrast, large fires, extremely large fires, and mega-fires, although comprising only 16.83 % of the total fires, are responsible for 78.49 % of the total burned area. These results are in line with the current literature (Grünig et al, 2022; Hanes et al., 2019; Stocks et al., 2002). Interestingly, when reviewing larger fire sizes (large, extremely large, and mega) between Eurasia and North America, Eurasian fires are, on average, 20.64 % larger than fires in North America. This seems to be due to the dominant land cover type underlying the fires. The overwhelming majority of the burned area occurred within either savannas or woody savanna (accounting for a combined 89.89 % of the total burned land cover). When only reviewing forest-specific land covers, while Eurasia still had a larger total burned area, North America had fire sizes that were, on average, 250.71 % bigger.
4.3 Limitations
While our overall results were promising, there are several uncertainties and limitations that need to be considered when working with our data. First, it is important to emphasize that the comparison between the MODIS-based dataset and the agency reference dataset should be viewed as an assessment rather than a validation. The production of similar values between the datasets enhanced our confidence in the reliability of our resulting BoLtFire datasets. However, interpreting discrepancies between the results is complex due to a multitude of influencing factors. Second, our current understanding of global fire regimes relies heavily on satellite-based products; MODIS Active Fire and Burned Area products are one of the most widely used (e.g. Crowley et al., 2023). The efficacy of MODIS products, along with other satellite-based fire products, is constrained by limitations in resolution and sensitivity, as demonstrated by comparative validation with higher-resolution sensors like Landsat. Within the US, Hawbaker et al. (2008) found that the MODIS Active Fire product detected 82 % of all Landsat reference fires, but their detection efficacy decreased with fire size, and just 50 % of fires were detected at 105 ha. The mean detected fire sizes were 915 and 1044 ha, which could heavily impact the frequency and size of fires found within BoLtFire datasets. When reviewing small (>0.2 ha) sub-canopy fires in Canada, Johnston et al. (2018) found that coarser-spatial-resolution sensors would be incapable of early fire detection for 44 %–70 % of historic wildfires in boreal forests in Canada. Additionally, Loboda et al. (2011) found that MODIS Burned Area products can underestimate the extent of fires by 15 %–70 %. This could be an indication that the overall total count and fire size of the BoLtFire dataset are lower than expected. Furthermore, there are limitations within the agency reference datasets that affect the overall commission and omission errors. Some fires that were identified by MODIS might not be identified by an agency due to the remoteness of their location (Fusco et al., 2019), incomplete lightning data or incorrect occurrence dates (Flannigan and Wotton, 1991), or misidentification as lightning ignited due to nearby thunderstorm activities (Müller et al., 2013). However, the former reason is unlikely due to the methods and experience of those investigating the fire (Schultz et al., 2019). Additionally, fires that are mapped later in the season could have fire scars that are insensitive to multiple fire events, making it difficult to distinguish between singular fire events and fire complexes. Yet, this is also an issue for agency databases as they can also fail to distinguish between the two (Benali et al., 2016). Third, since we used a lightning detection network, there is a possibility that not all lightning strikes were detected. As mentioned, in more remote areas, detection efficiency can be relatively low, and location errors are expected to be larger (up to several kilometres for the ENTLN). Additionally, as the ENTLN currently has no sensors located in Russia, this could create larger spatial errors or possibly lead to some lightning strikes not being detected. Since our lightning-matching methodology heavily depends on the detection of lightning strikes, these factors could influence not only the likelihood of a correct match but also the selection of the candidate lightning strike in the absence of the “correct” match. Moreover, as there is currently not a foolproof method for identifying lightning-ignited wildfires using these methodologies, there is a chance that some of our BoLtFire dataset fires have been misclassified. Based on the spatial and temporal windows that were selected, we assume – but cannot definitively confirm (especially in Eurasia) – that these fires were ignited by lightning. To minimize the possibility of these false positives, we deliberately selected a 14 d temporal window and a 10 km spatial window based on previous research and our own observations of our data. Had we increased the size of either of these windows, we could have inadvertently matched a lightning candidate to a fire that may not have been ignited by lightning. Finally, as the currently available reference datasets are limited to boreal forests, we were only able to assess the BoLtFire dataset in relation to those resulting fires within Canada and Alaska. Fire records from other agencies, especially those in Siberia and Russia, are difficult to obtain or might be inaccurate (Stocks et al., 2001). As tree canopies can obscure fires (Johnston et al., 2018; Kolden et al., 2012) and as surface fires are more prevalent in Eurasia than the crown fires dominant in North America, omission rates could be higher in Eurasia. Additionally, Talucci et al. (2022) found when comparing MODIS to Landsat fire detection in Siberia from 2001 to 2020 that Landsat captured 47.9 % more burned area, which could indicate that our dataset does not fully reflect the true burned area in Siberia and, thus, within Eurasia.
4.4 Outlook
The effectiveness of lightning in igniting wildfires is expected to be amplified by climate change; under the RCP8.5 scenario, Hessilt et al. (2022) predict that changes in fire weather and vegetation will increase the effectiveness of lightning ignition by 31±28 % in Canada's Northwest Territories and 14±9 % in Alaska per 1 °C of warming. Understanding the characteristics of these fires is crucial for improving our knowledge of where, why, and how they ignite, which could enhance our ability to model and mitigate their occurrence in the future. Furthermore, research by Zhu et al. (2017a) suggests that the effects of Eurasian boreal wildfire emissions on Arctic warming may be underestimated. Given that lightning is a predominant cause of wildfires in boreal forests, improving the identification of lightning-ignited fires will enhance our understanding of their emissions and their contribution to global warming.
Data described in this paper are available at https://doi.org/10.5281/zenodo.14940326 (Engle et al., 2024).
The code used in this dataset is available at https://doi.org/10.5281/zenodo.15425619 (Engle and Bratoev, 2025).
Challenges in identifying lightning-ignited wildfires, coupled with limitations in data availability, have hindered our understanding of the characteristics of these wildfires in boreal forests. In this paper, we introduced the temporal minimum distance (TMin) methodology, a novel approach specifically developed to match lightning strikes without an ignition point. It outperformed current methods, allowing us to create the largest pan-boreal forest dataset. This groundbreaking dataset consists of 6902 lightning-ignited wildfires located in forest and forest-like land covers from 2012 to 2022 that are at least 200 ha. When benchmarked in relation to the agency reference dataset, this new dataset performed reasonably well, with an overall commission error of 30.07 % and an omission error of 53.16 %, though further fine-tuning of the TMin methodology and input parameters could lead to an even better performance. This dataset can be further used in conjunction with climate and additional environmental data to help better model lightning-ignited wildfire ignition characteristics and to provide additional insights into lightning-ignited wildfires in boreal forests.
Table A1Descriptive list of which land cover types were either forest or forest-like and thus labelled as “forest”. Those labelled as “forest” were included within the dataset, while those that were not were removed.
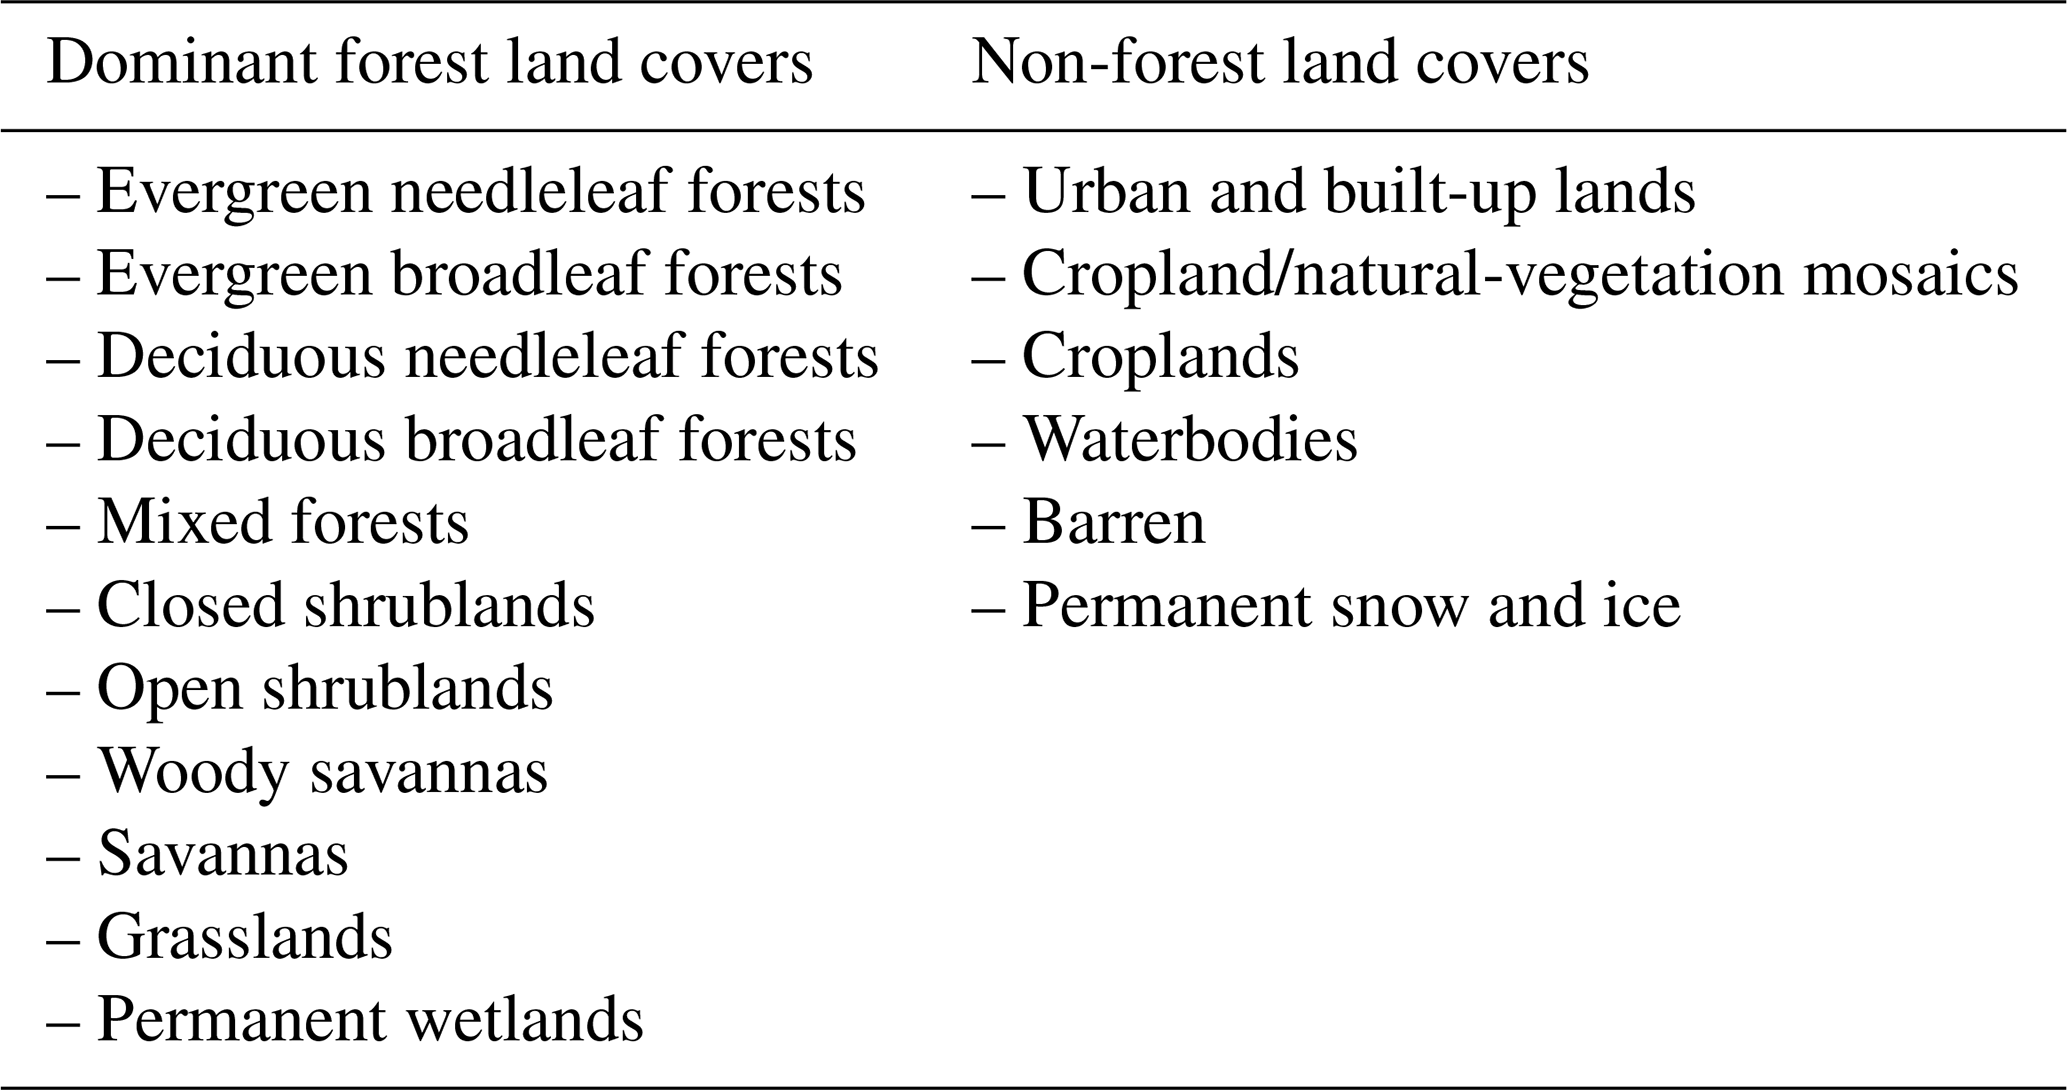
Table A2Description of the total burned area per fire size class.
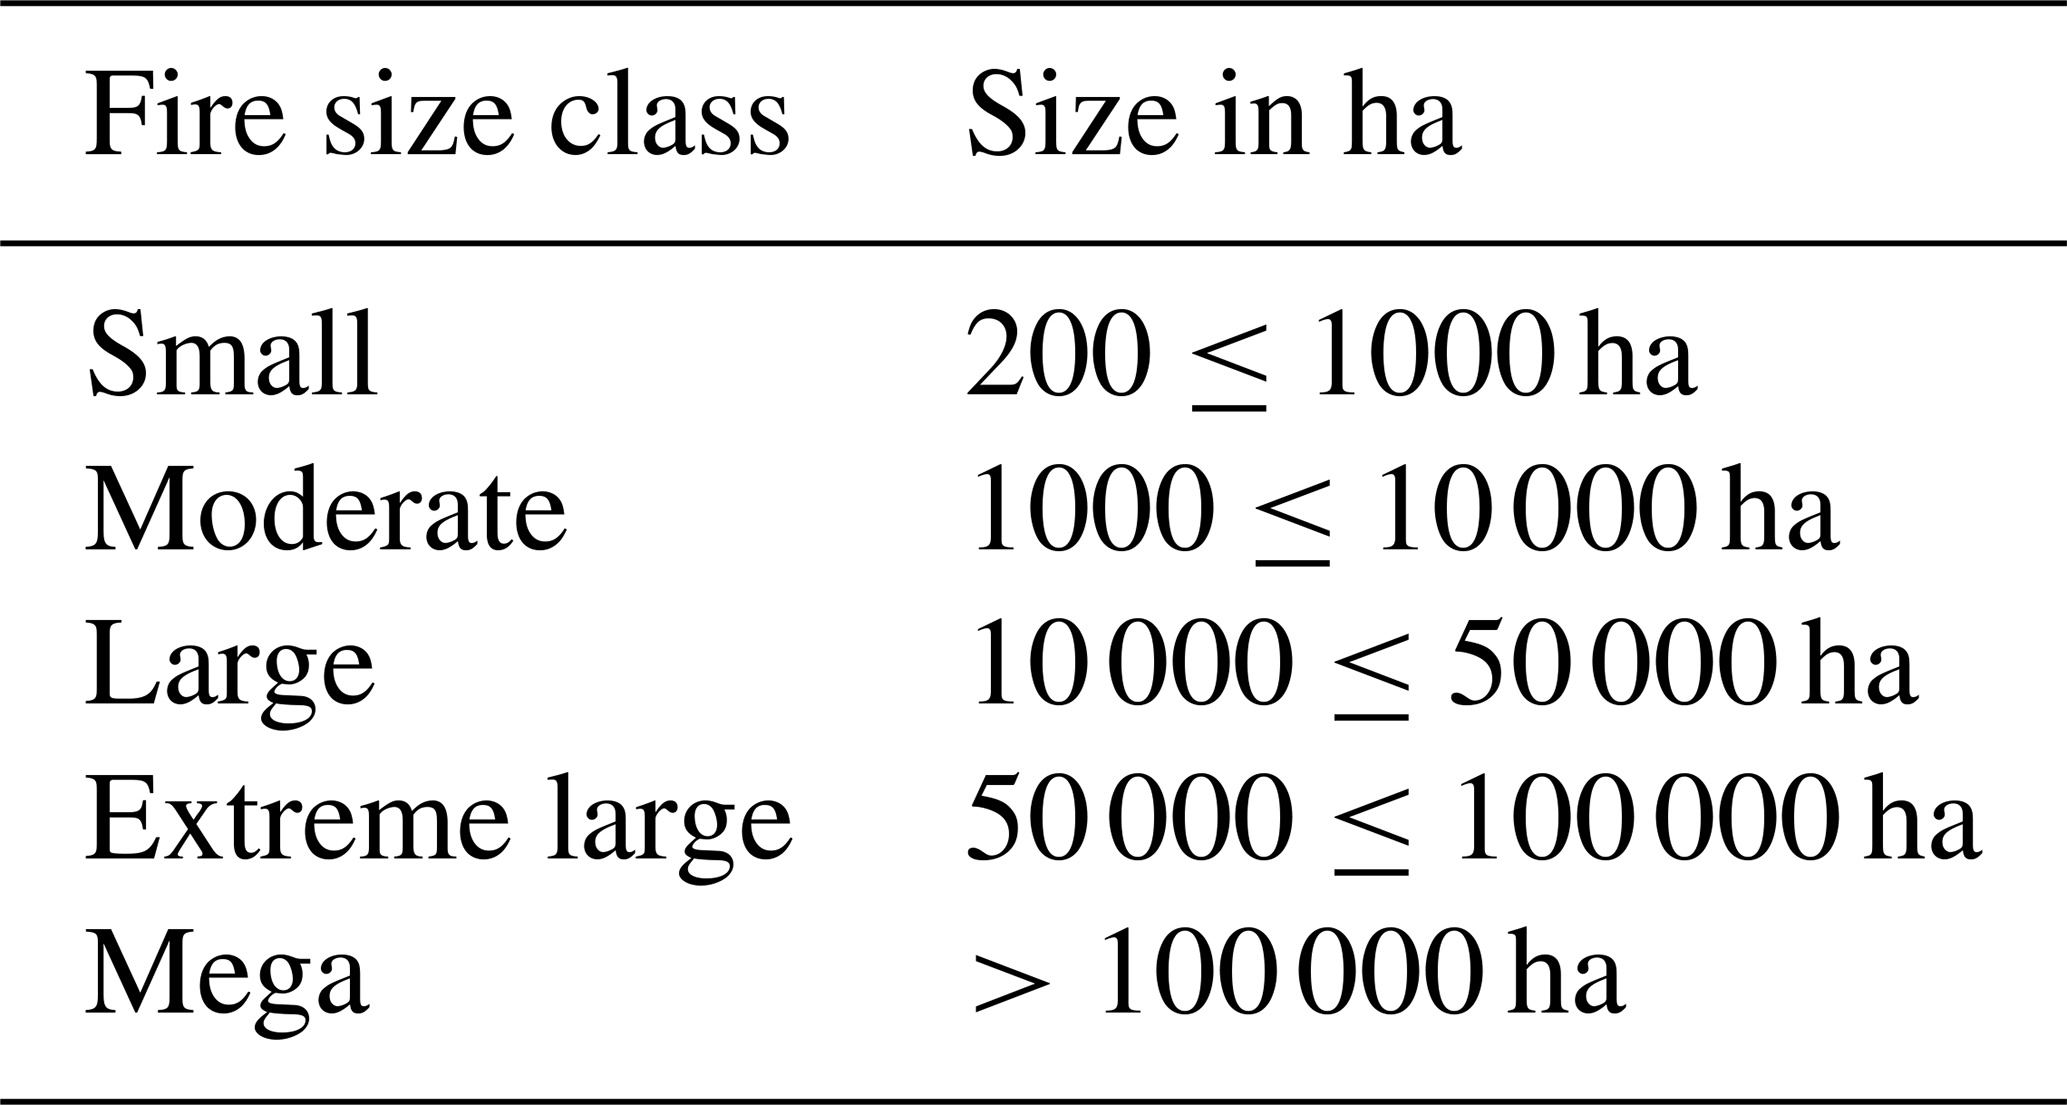
Table A3List of every dataset used to create the BoLtFire dataset, their spatial and temporal extent, a citation, and a link to their location.
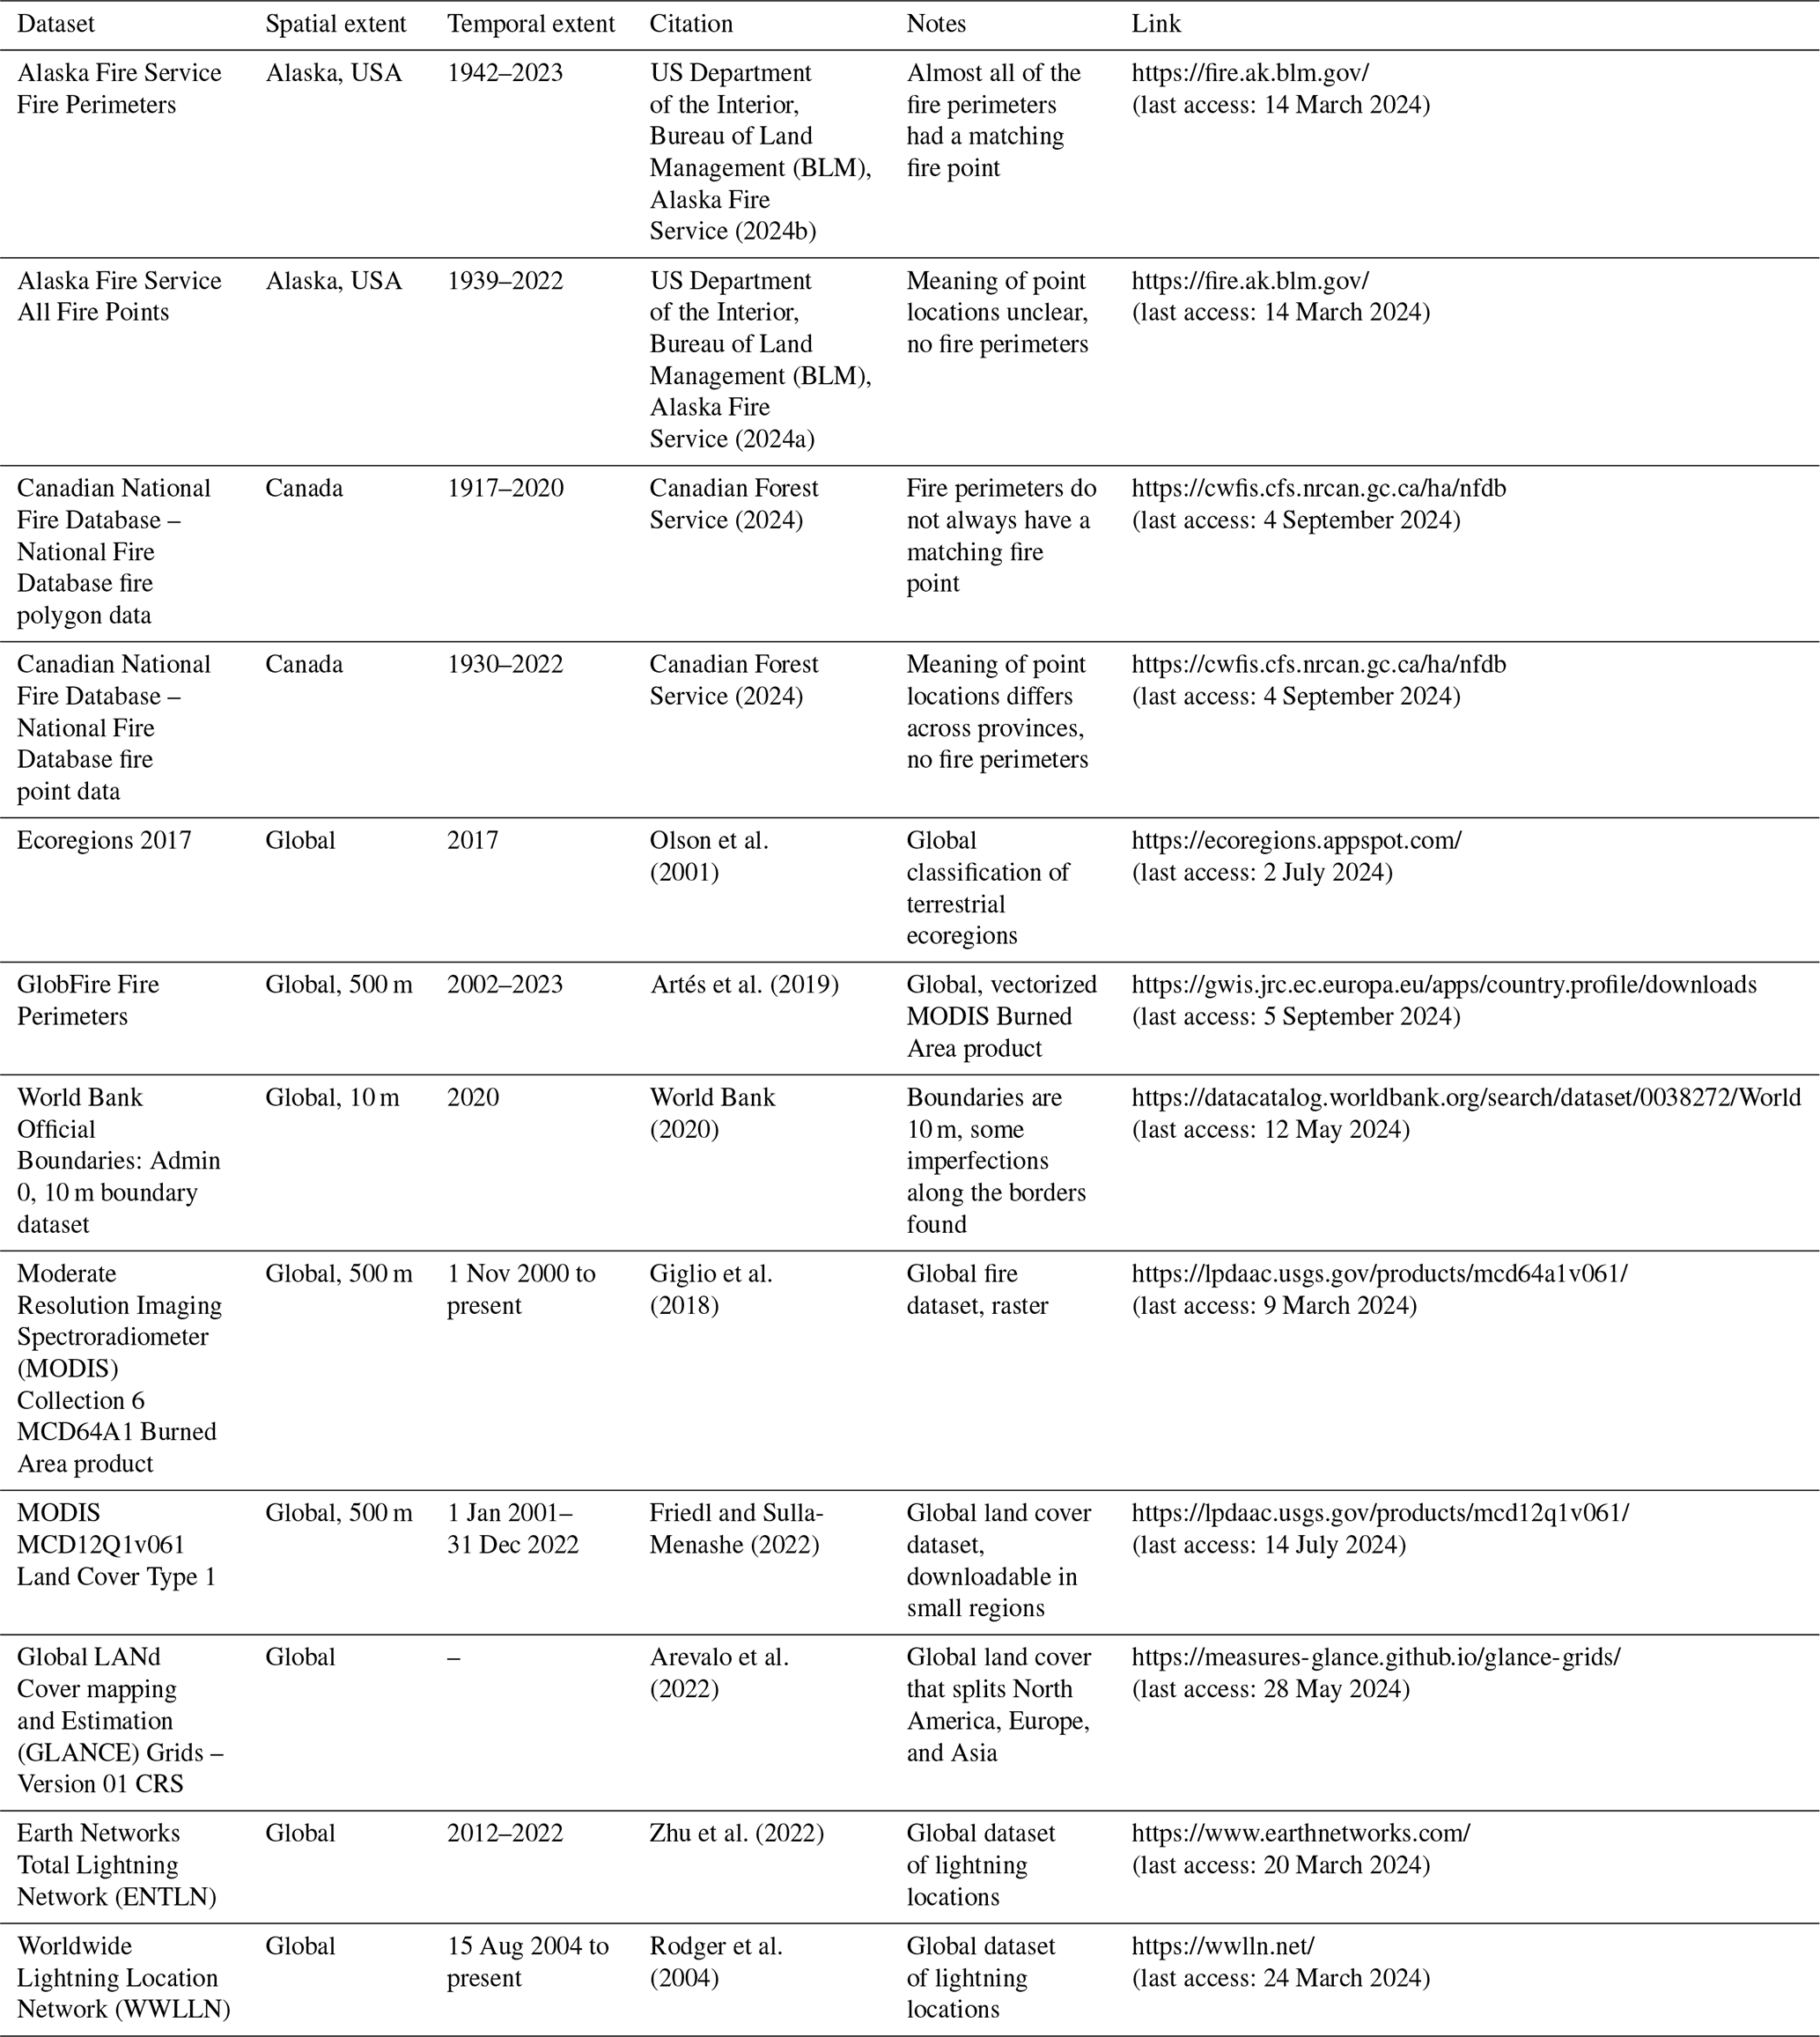
Table B1Cumulative count of the number of candidate lighting flashes per LIW by fire class.
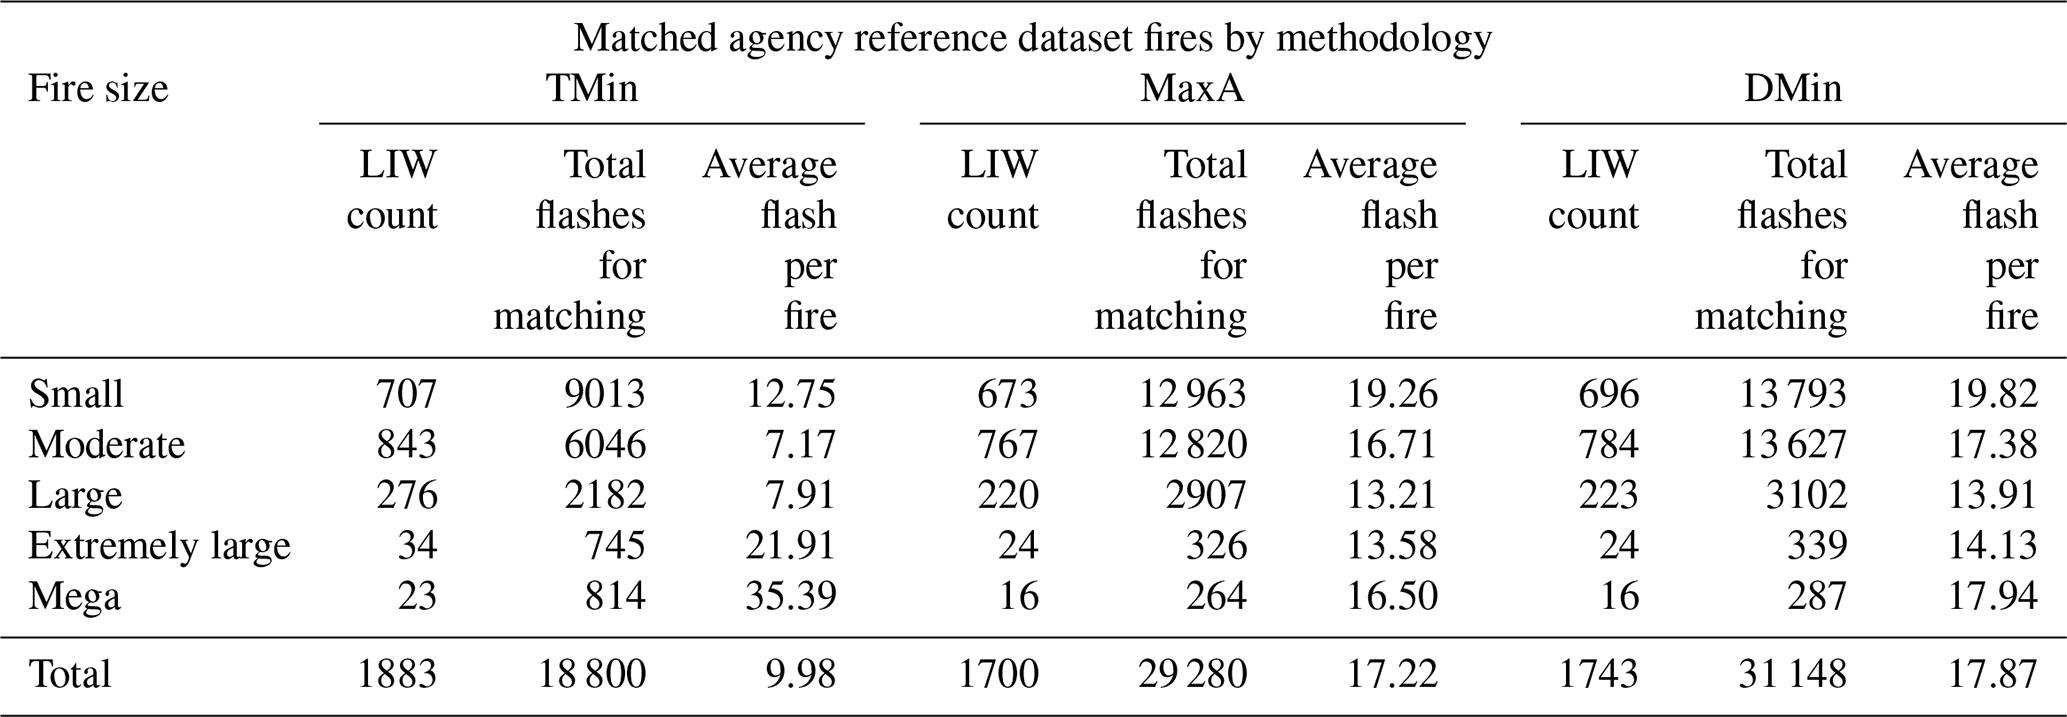
Table B2Cumulative percentage values of the holdover time distribution for all three methodologies within the NA BoLtFire ARD version dataset, TMin, MaxA, and DMin. Holdover time is calculated as the difference between the start date of each lightning-ignited wildfire and the time of the occurrence of the candidate lightning.
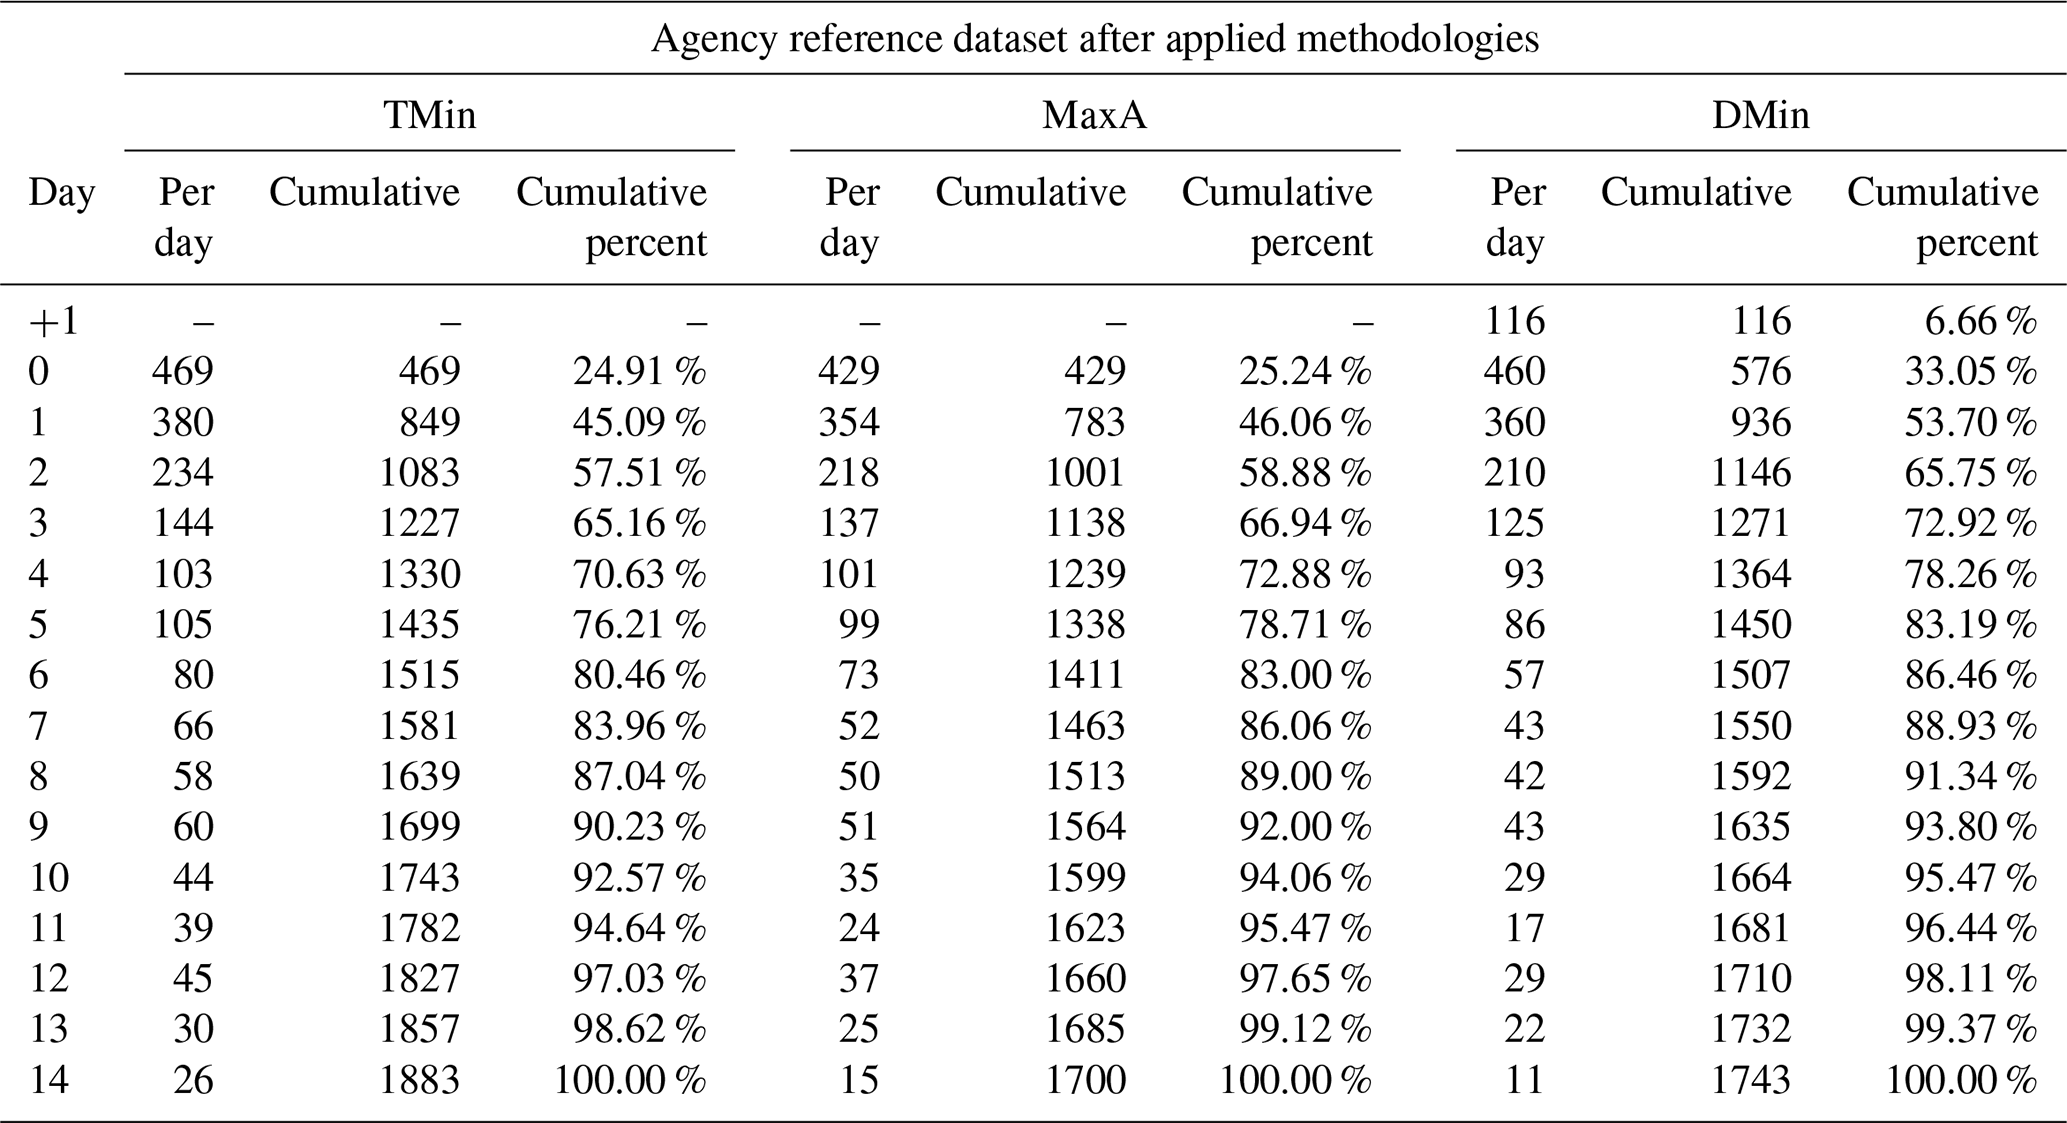
Table B3Median and mean holdover time, rounded to the second decimal for the TMin, MaxA, and DMin lighting-matching methodologies. Holdover time is calculated as the difference between the start date of each lightning-ignited wildfire and the time of the occurrence of the candidate lightning. Median and mean distance from the agency reference dataset ignition point locations to the TMin, MaxA, and DMin candidate lightning.
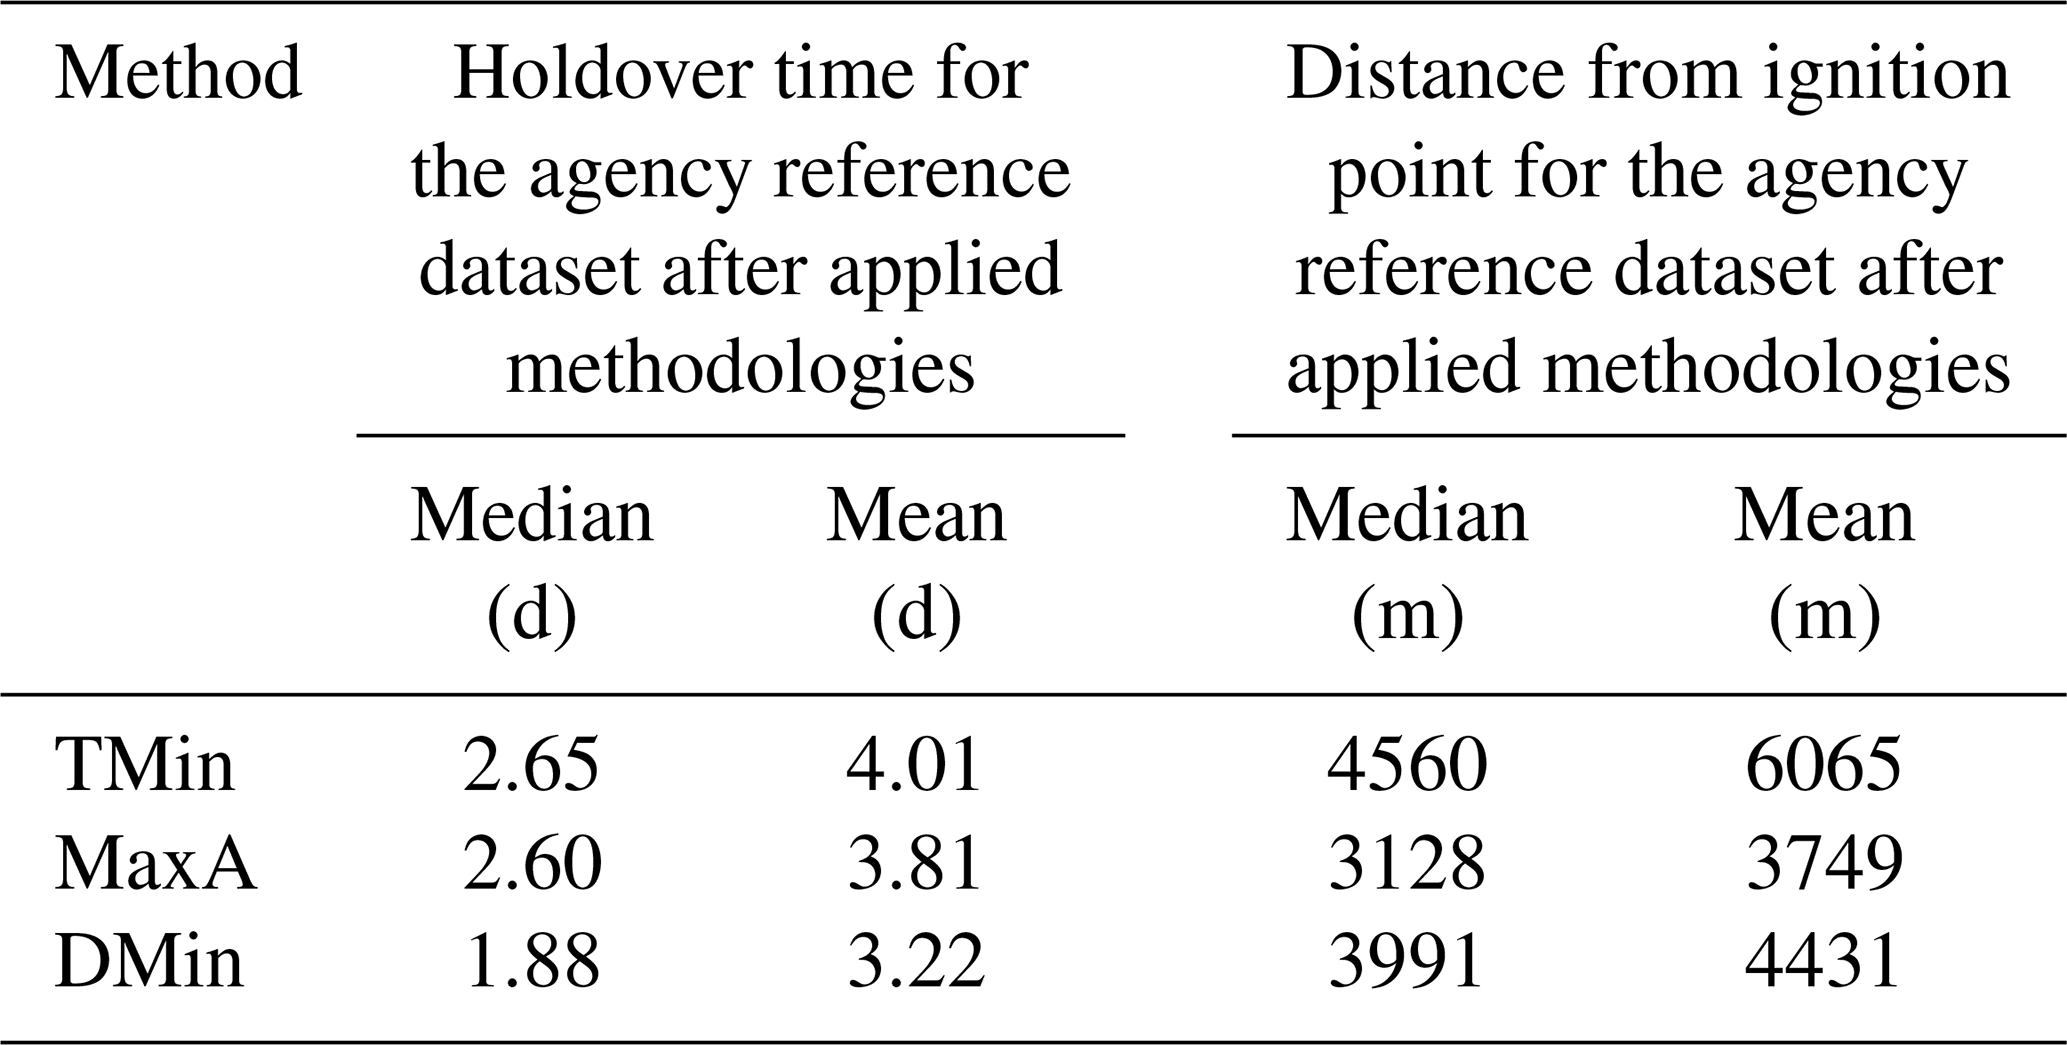
Table B4Comparison of ignition point location (inside or outside the perimeter) of the agency reference dataset with that predicted by the TMin, MaxA, and DMin methodologies.
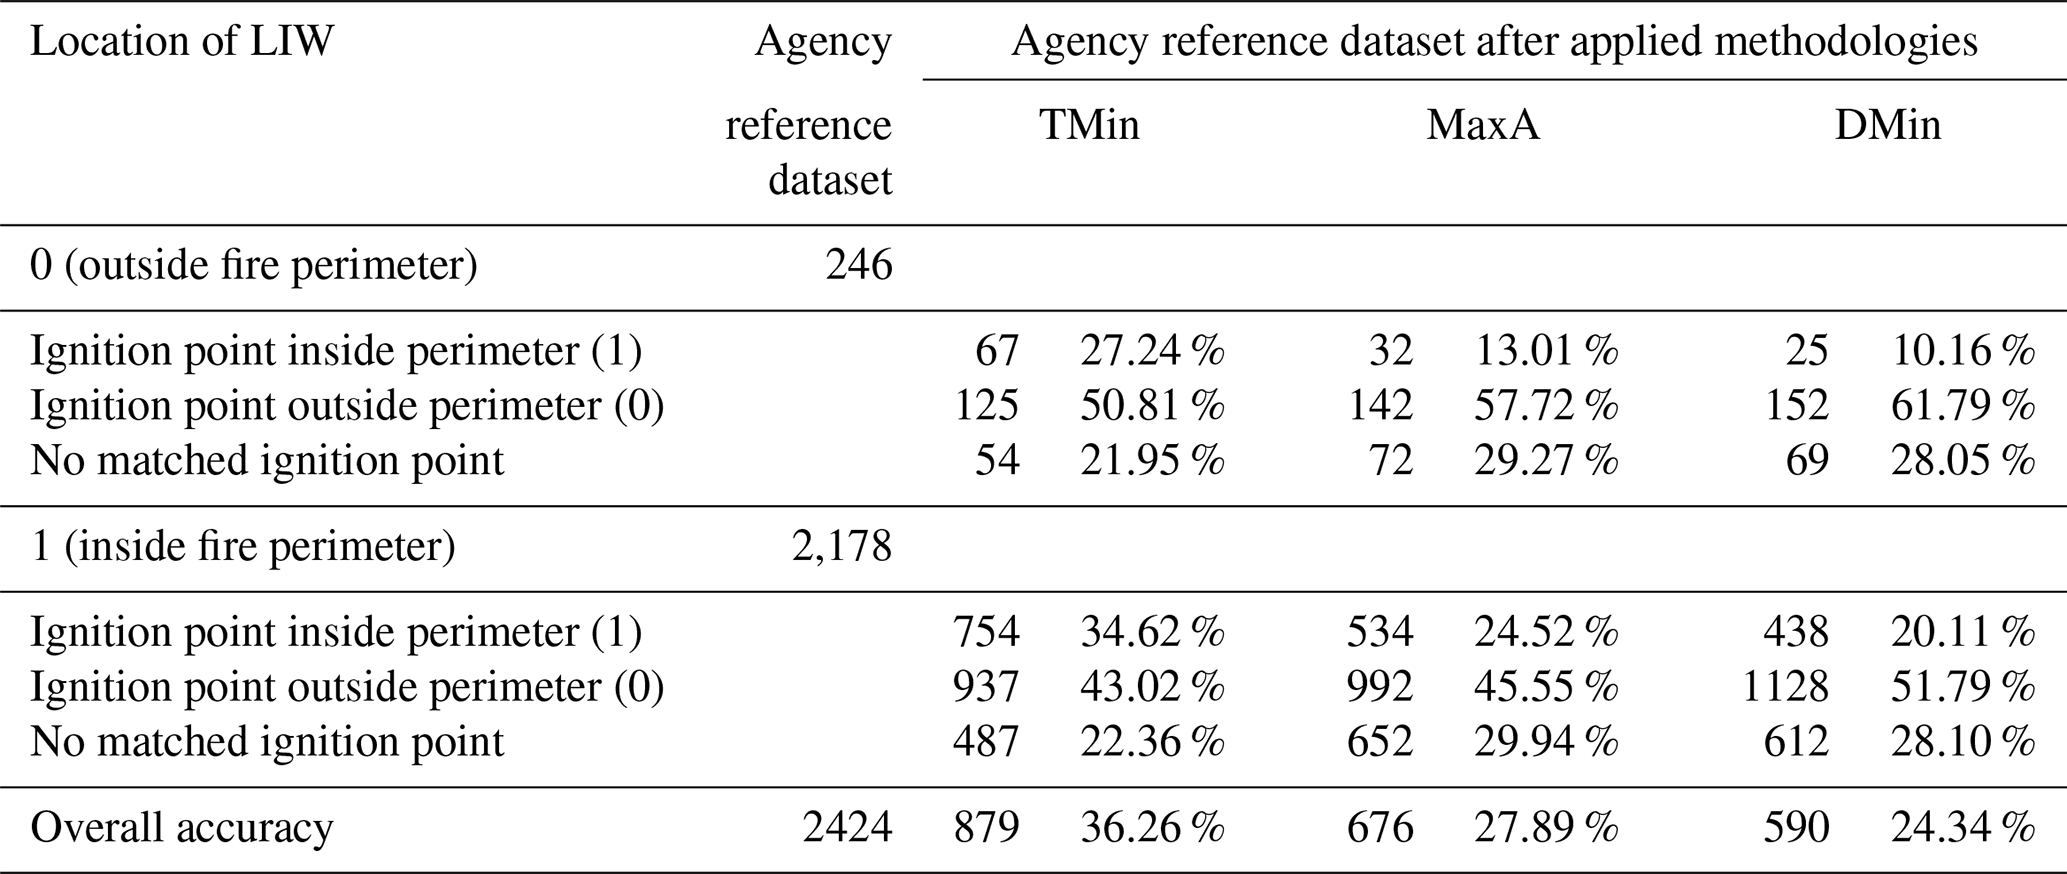
Table C1The table shows the confusion matrix for the agency reference dataset and the NA BoLtFire ARD version dataset. n/a stands for not applicable.
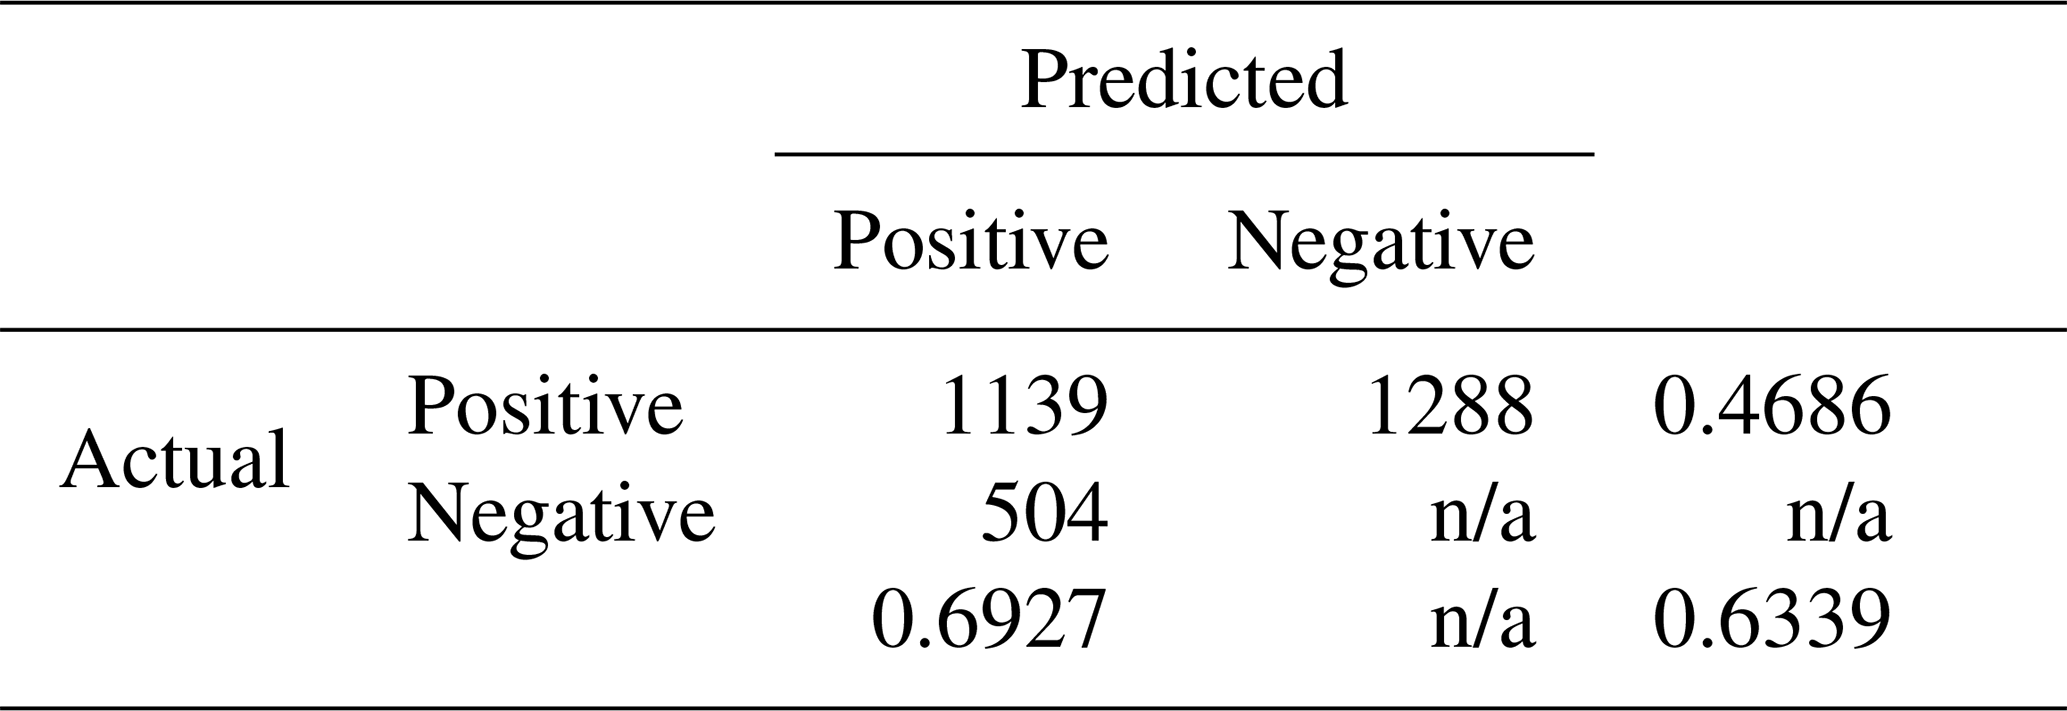
Table C2The table compares the total number of fires and total burned area in hectares from the agency reference dataset to those of the matched fires from 2012 to 2022, focusing on the percentage of fires and burned areas successfully matched to the NA BoLtFire ARD version dataset each year.
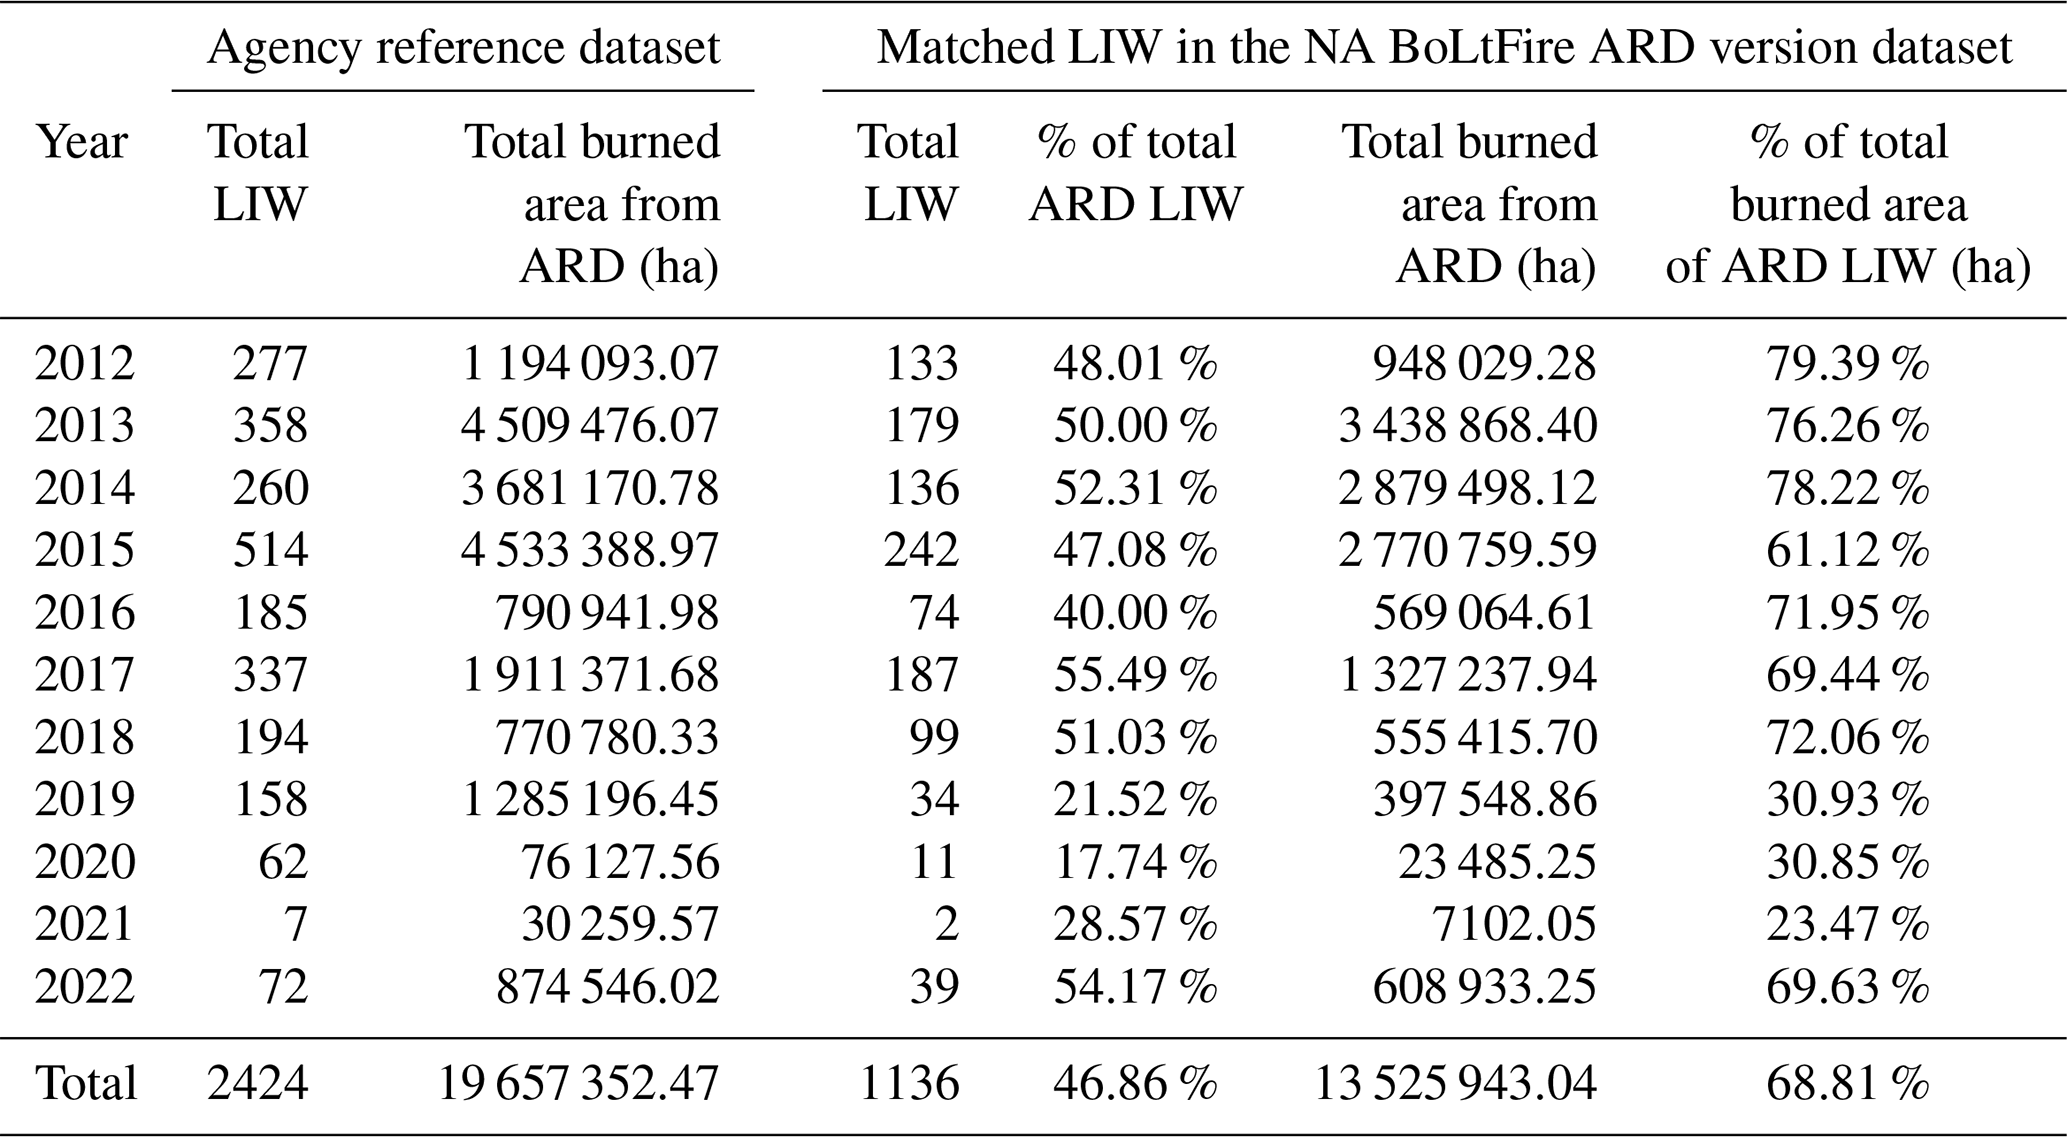
Table D1Distribution of holdover time across the BoLtFire dataset. Holdover time refers to the time difference between when the fire was ignited by the lightning candidate and when it was detected. The detection time used was the start date.
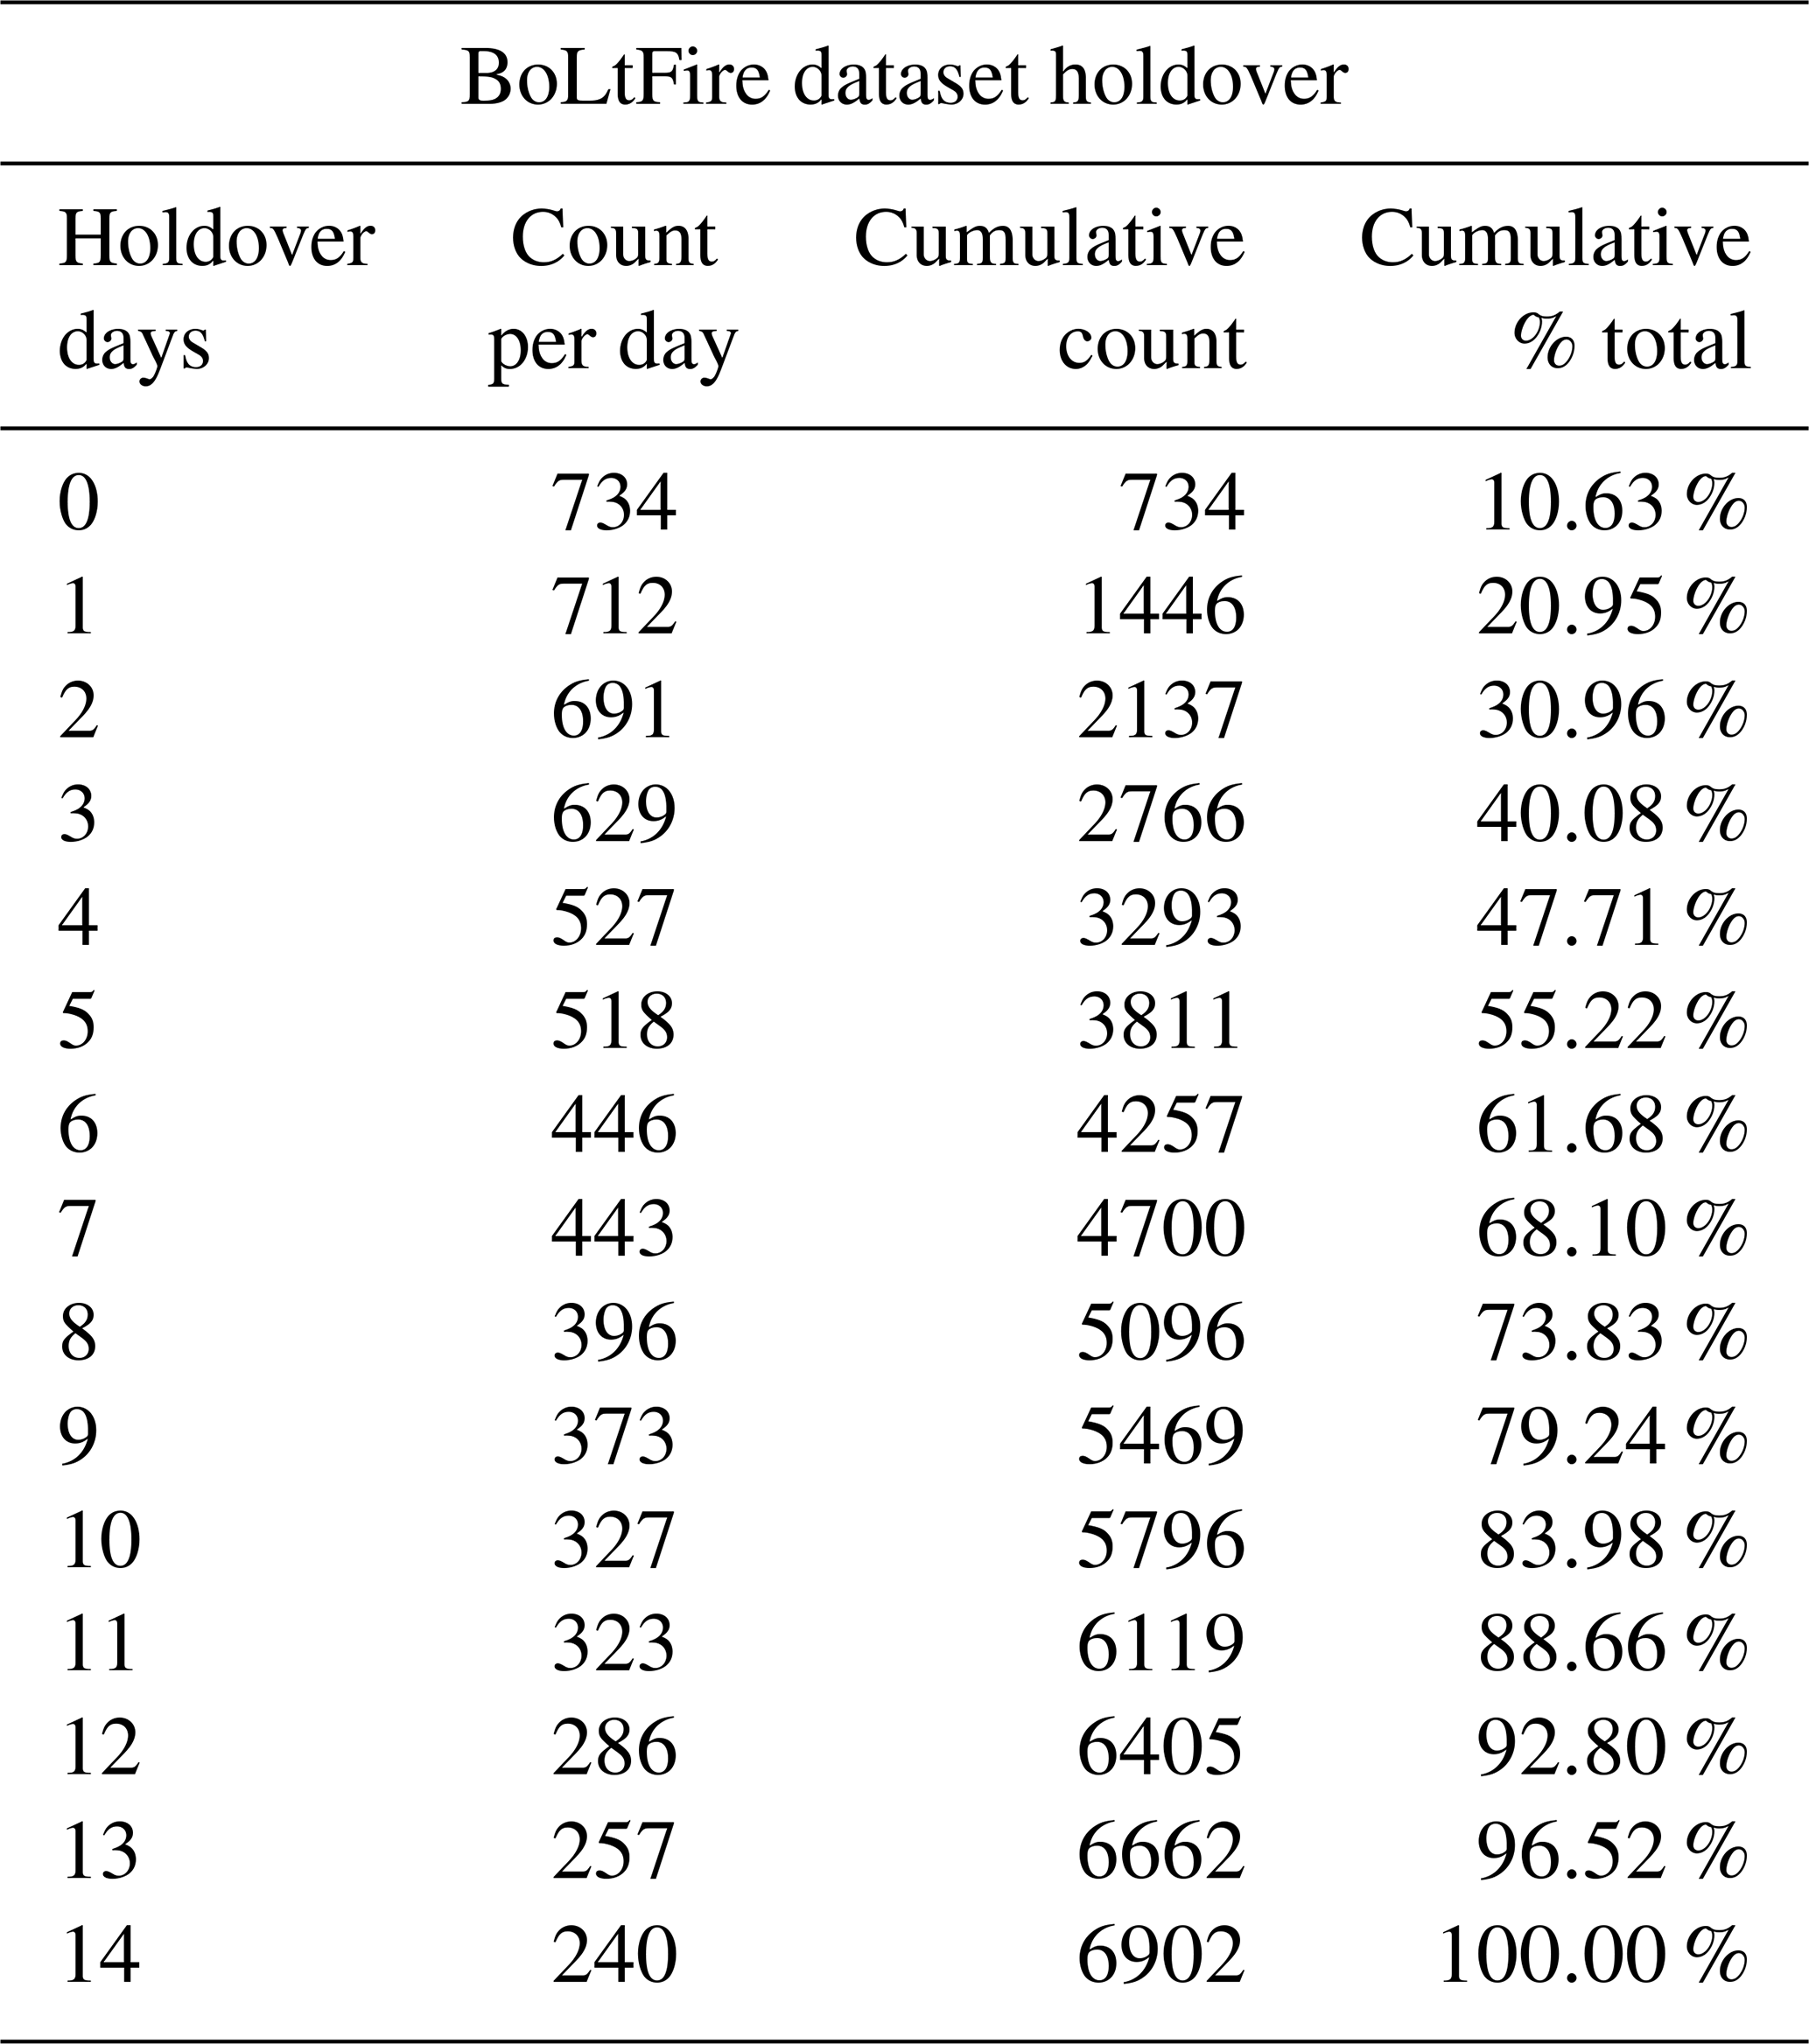
Table D2Distribution of candidate lightning ignition points relative to their corresponding fire perimeters, categorized by distance in kilometres. Shown is the number of ignition points at each distance, along with their cumulative counts and cumulative percentages.
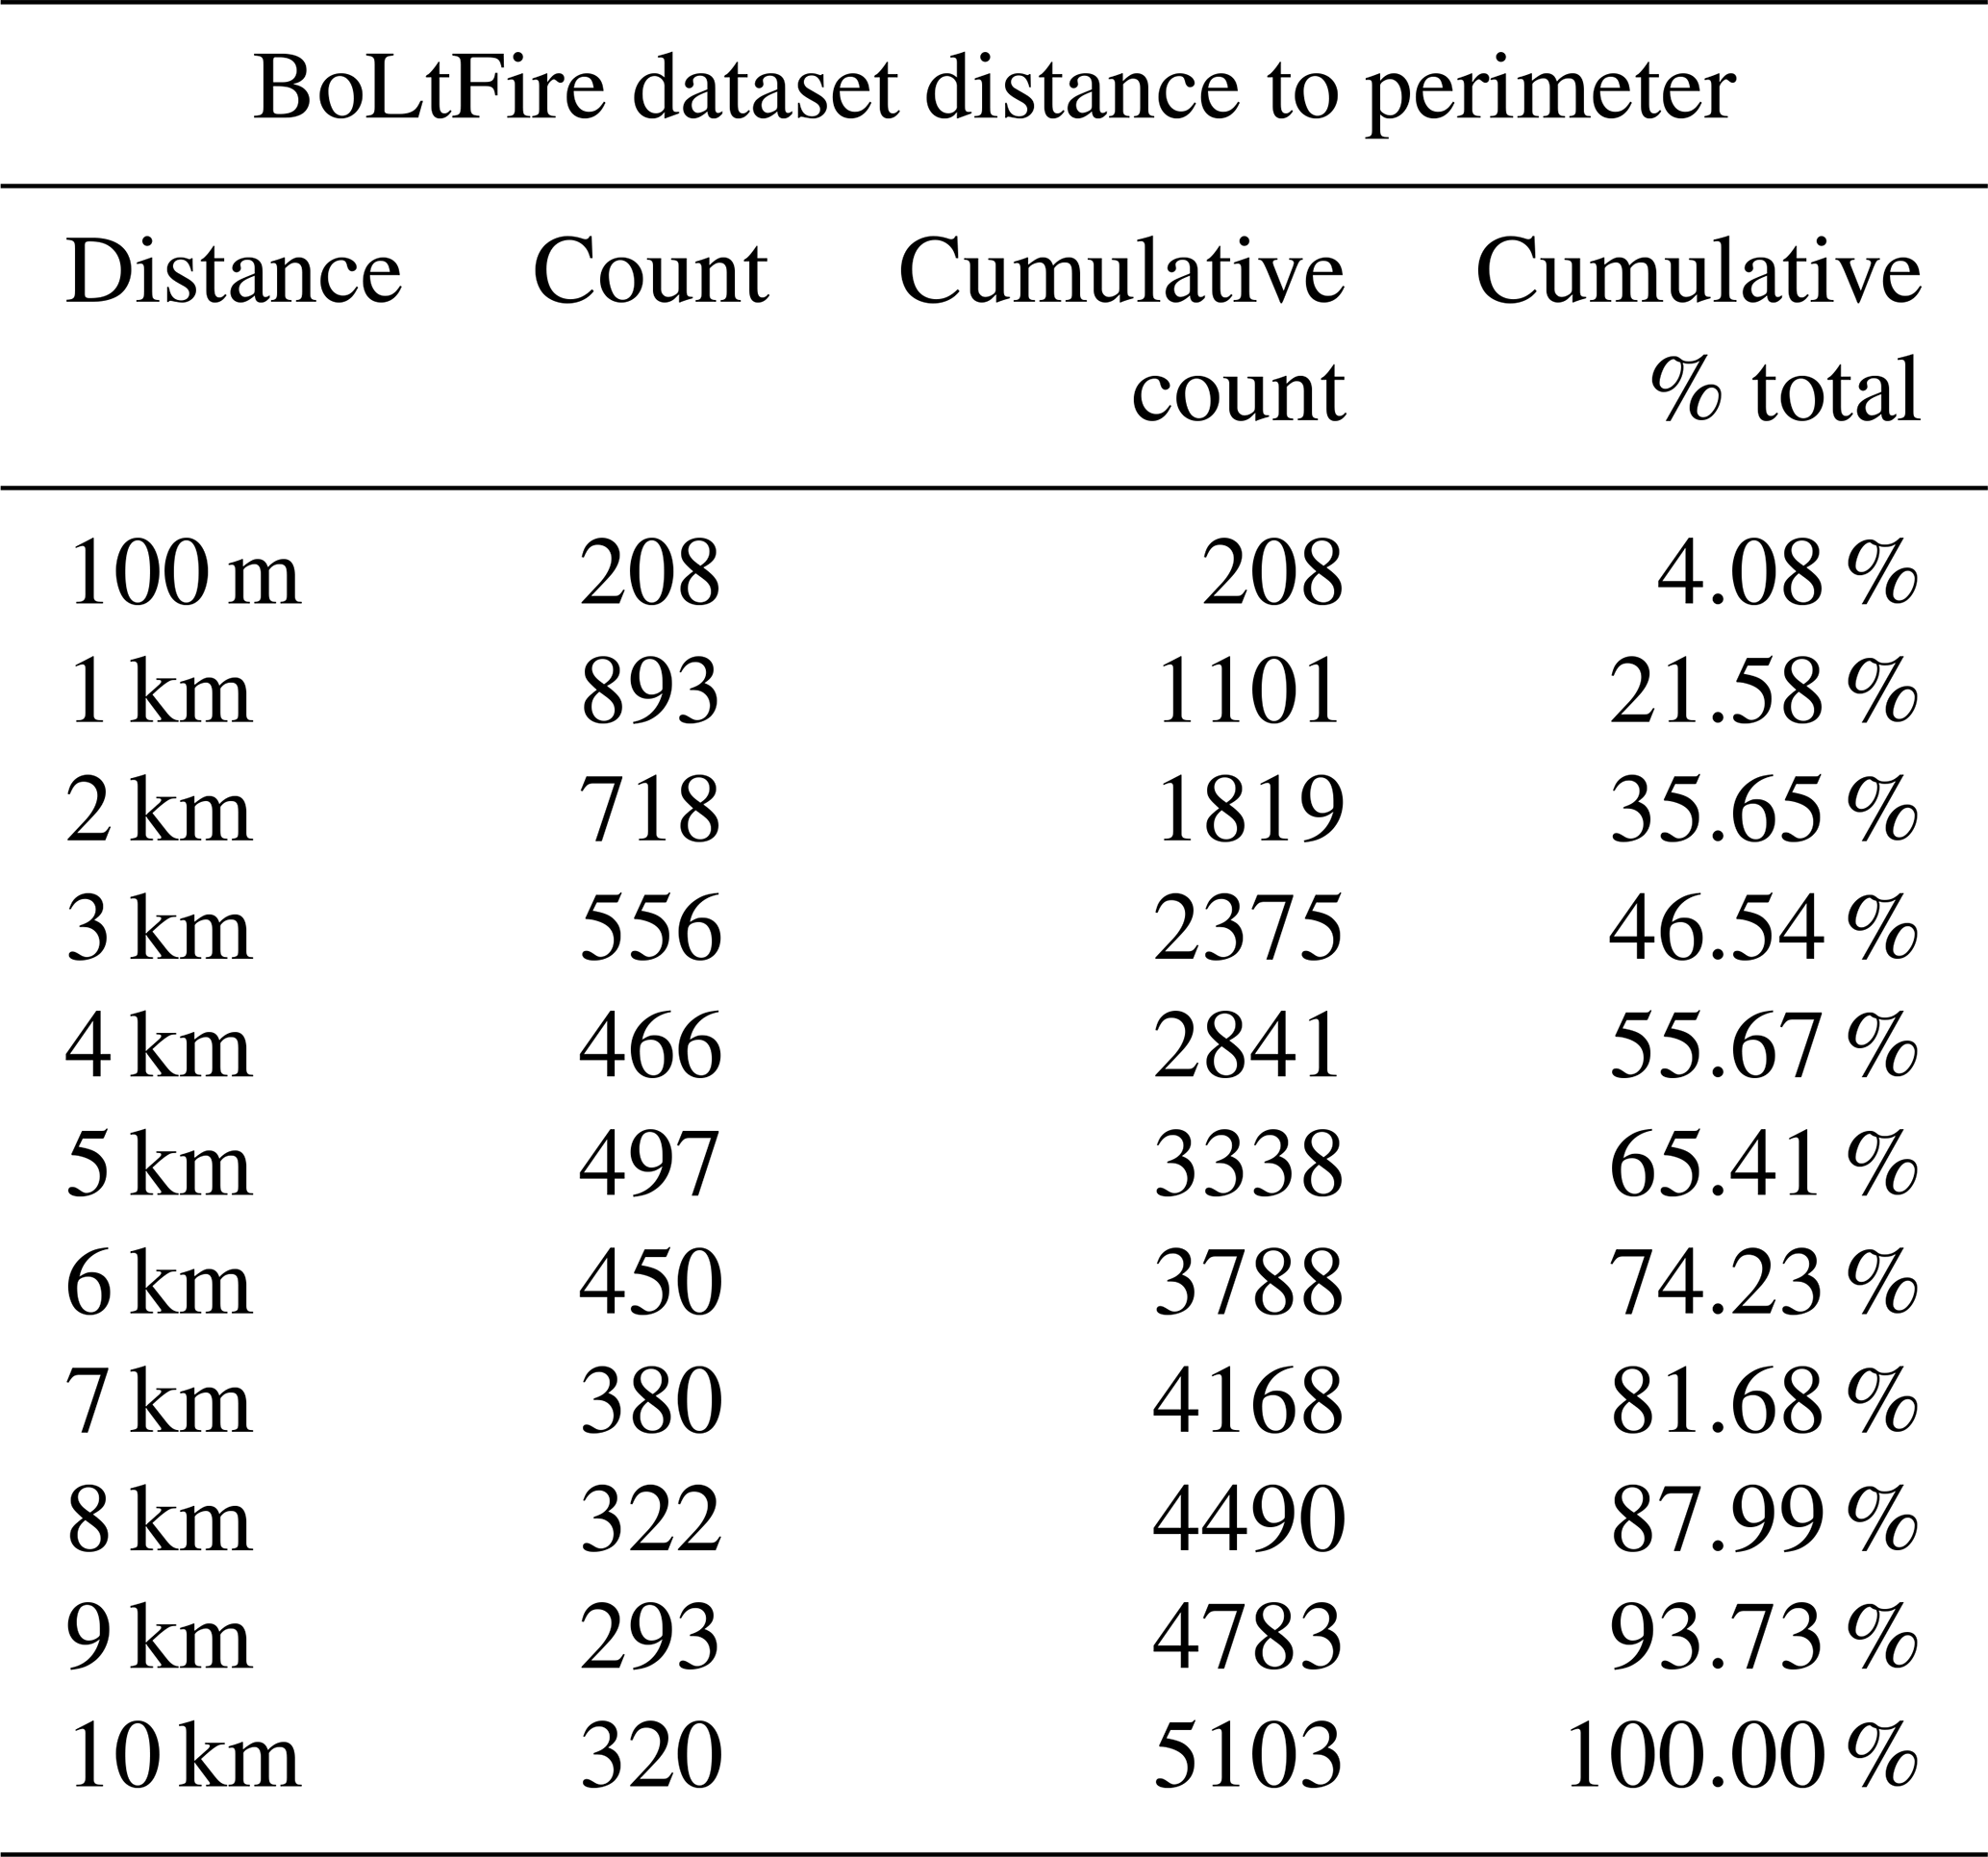
Table D3Total count of lightning-ignited wildfires and total count of ENTLN flashes per country and per region. Lightning ignition efficiency was calculated as the percent of total flashes that caused an ignition.
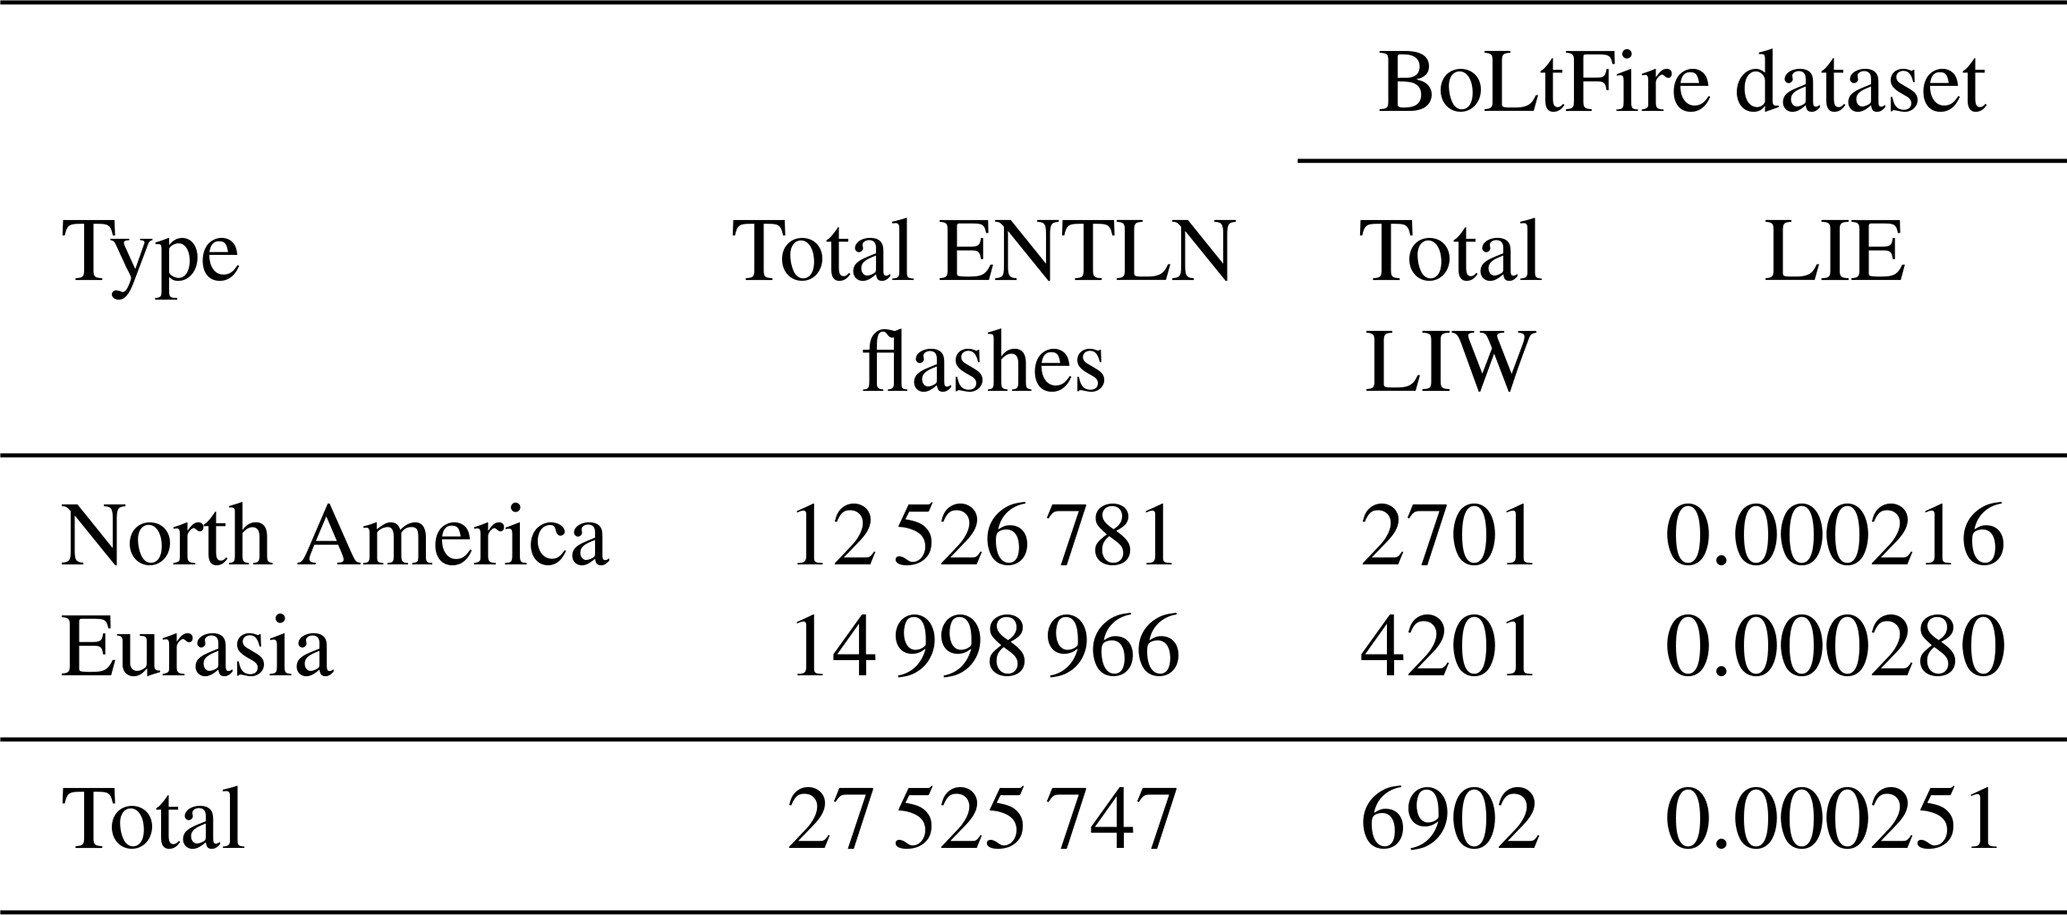
Table D4Total count of lightning-ignited wildfires and total burned area per continent across the study period.
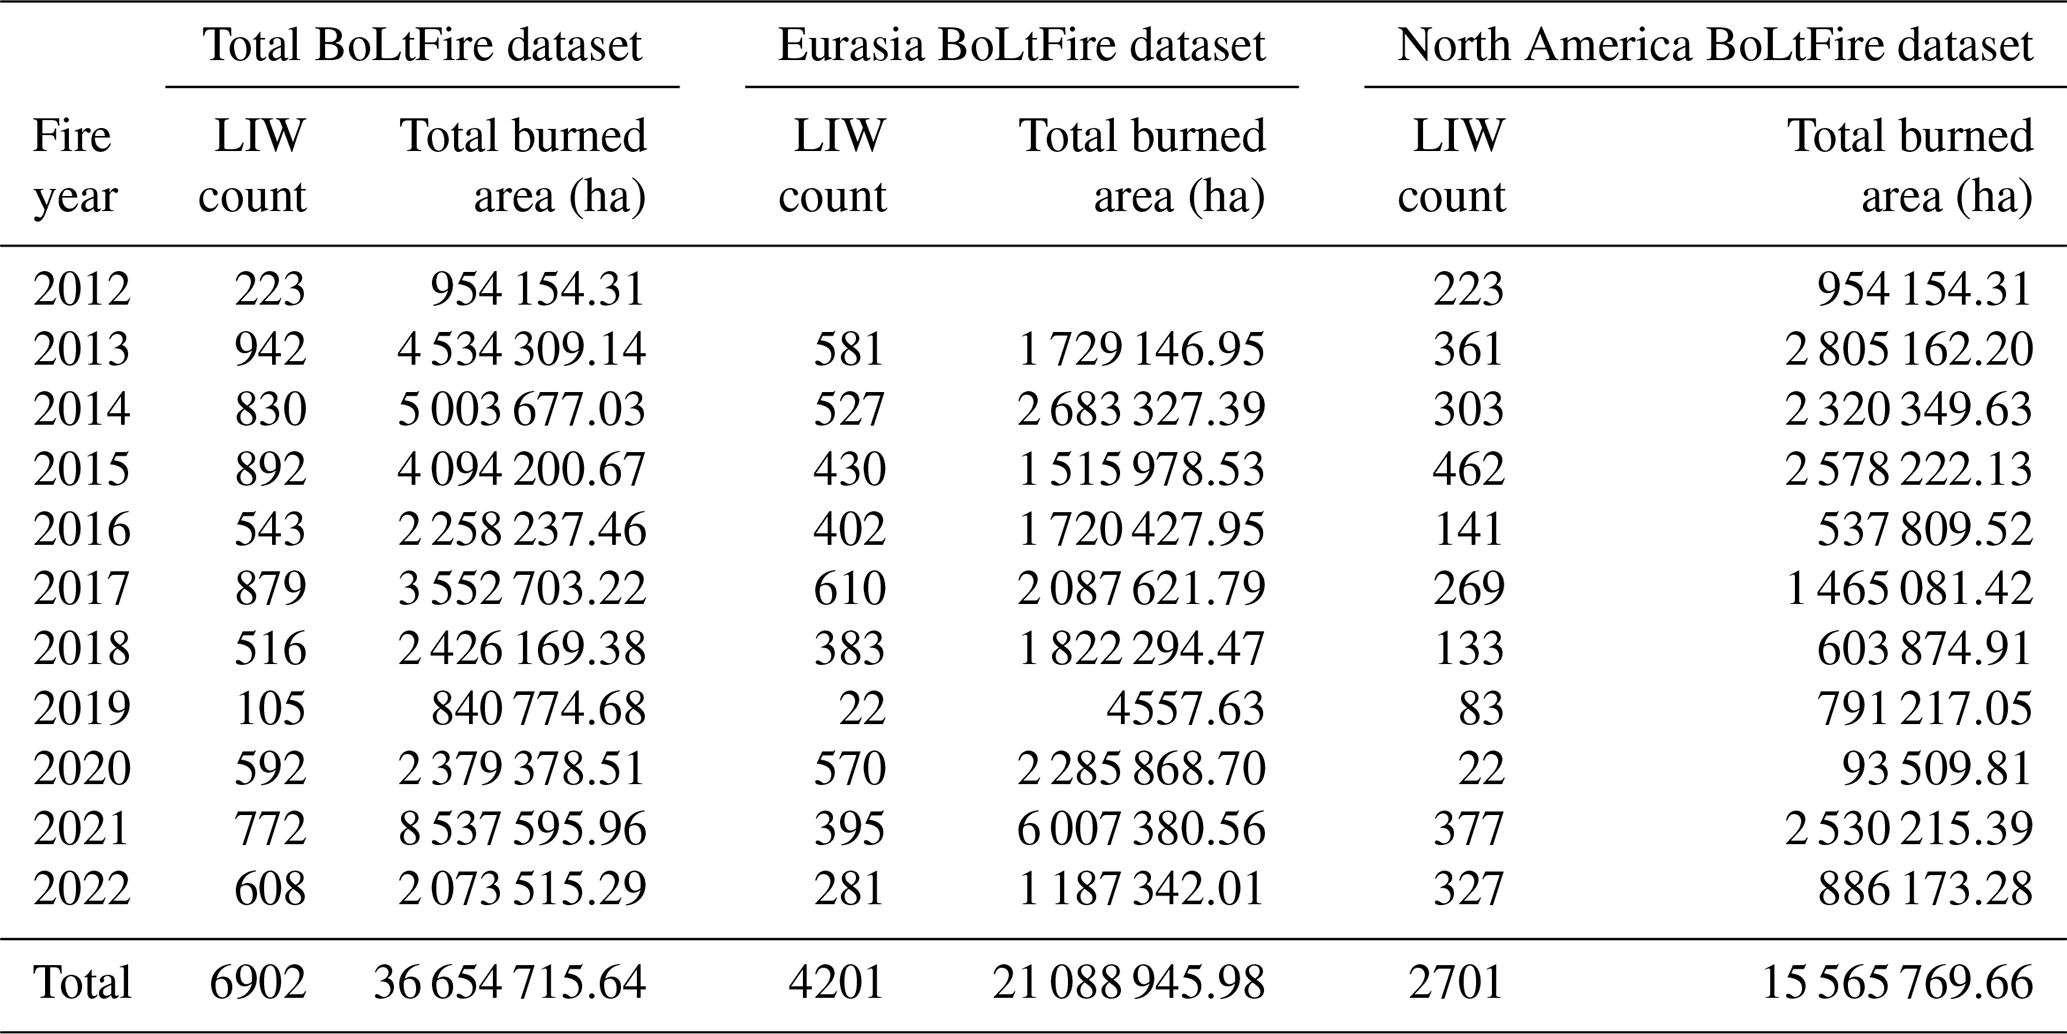
Table D5Overall view of the Eurasia and North America BoLtFire datasets by total lightning-ignited wildfire count, total burned area, and average burned area within the BoLtFire dataset by fire size.
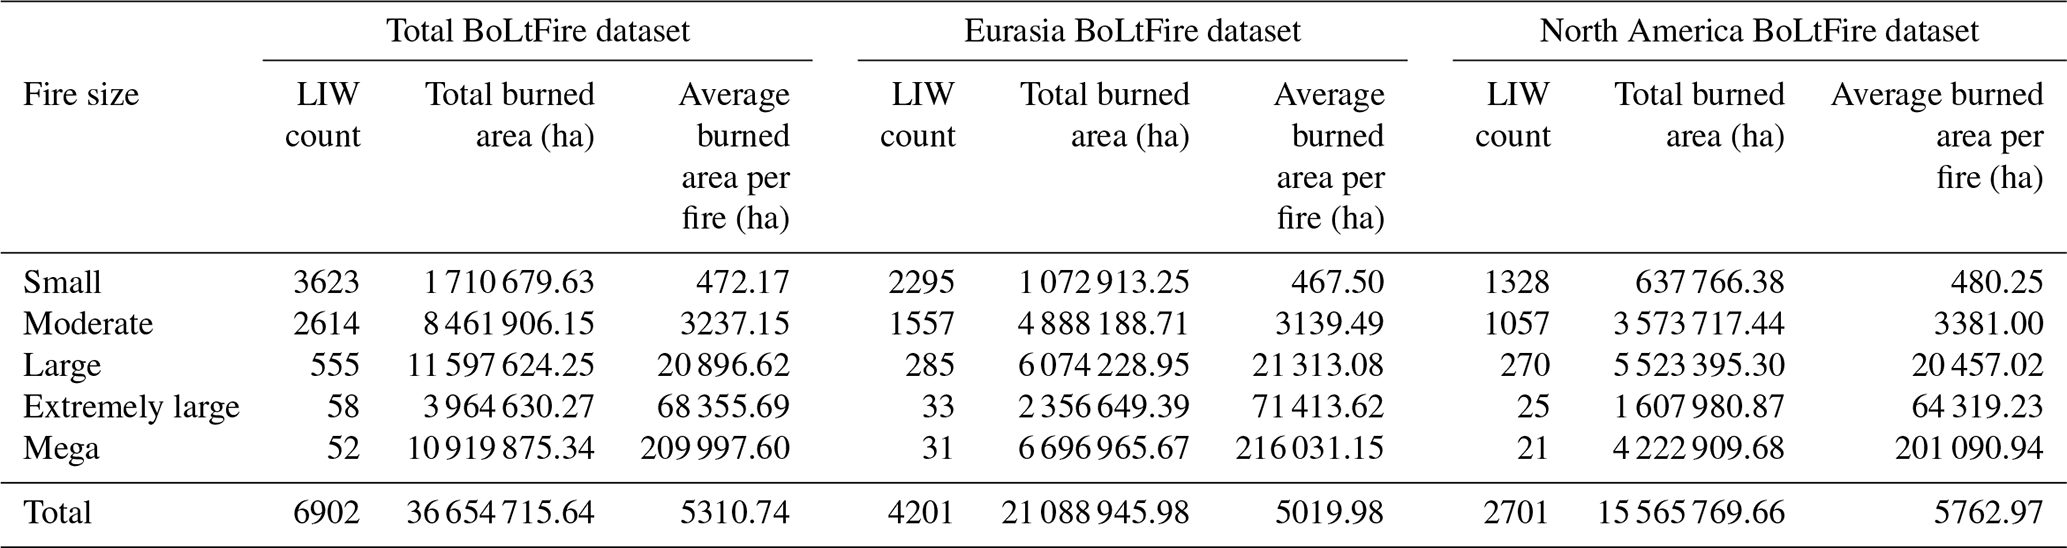
Table D6Total BoLtFire dataset count and average fire size by year.
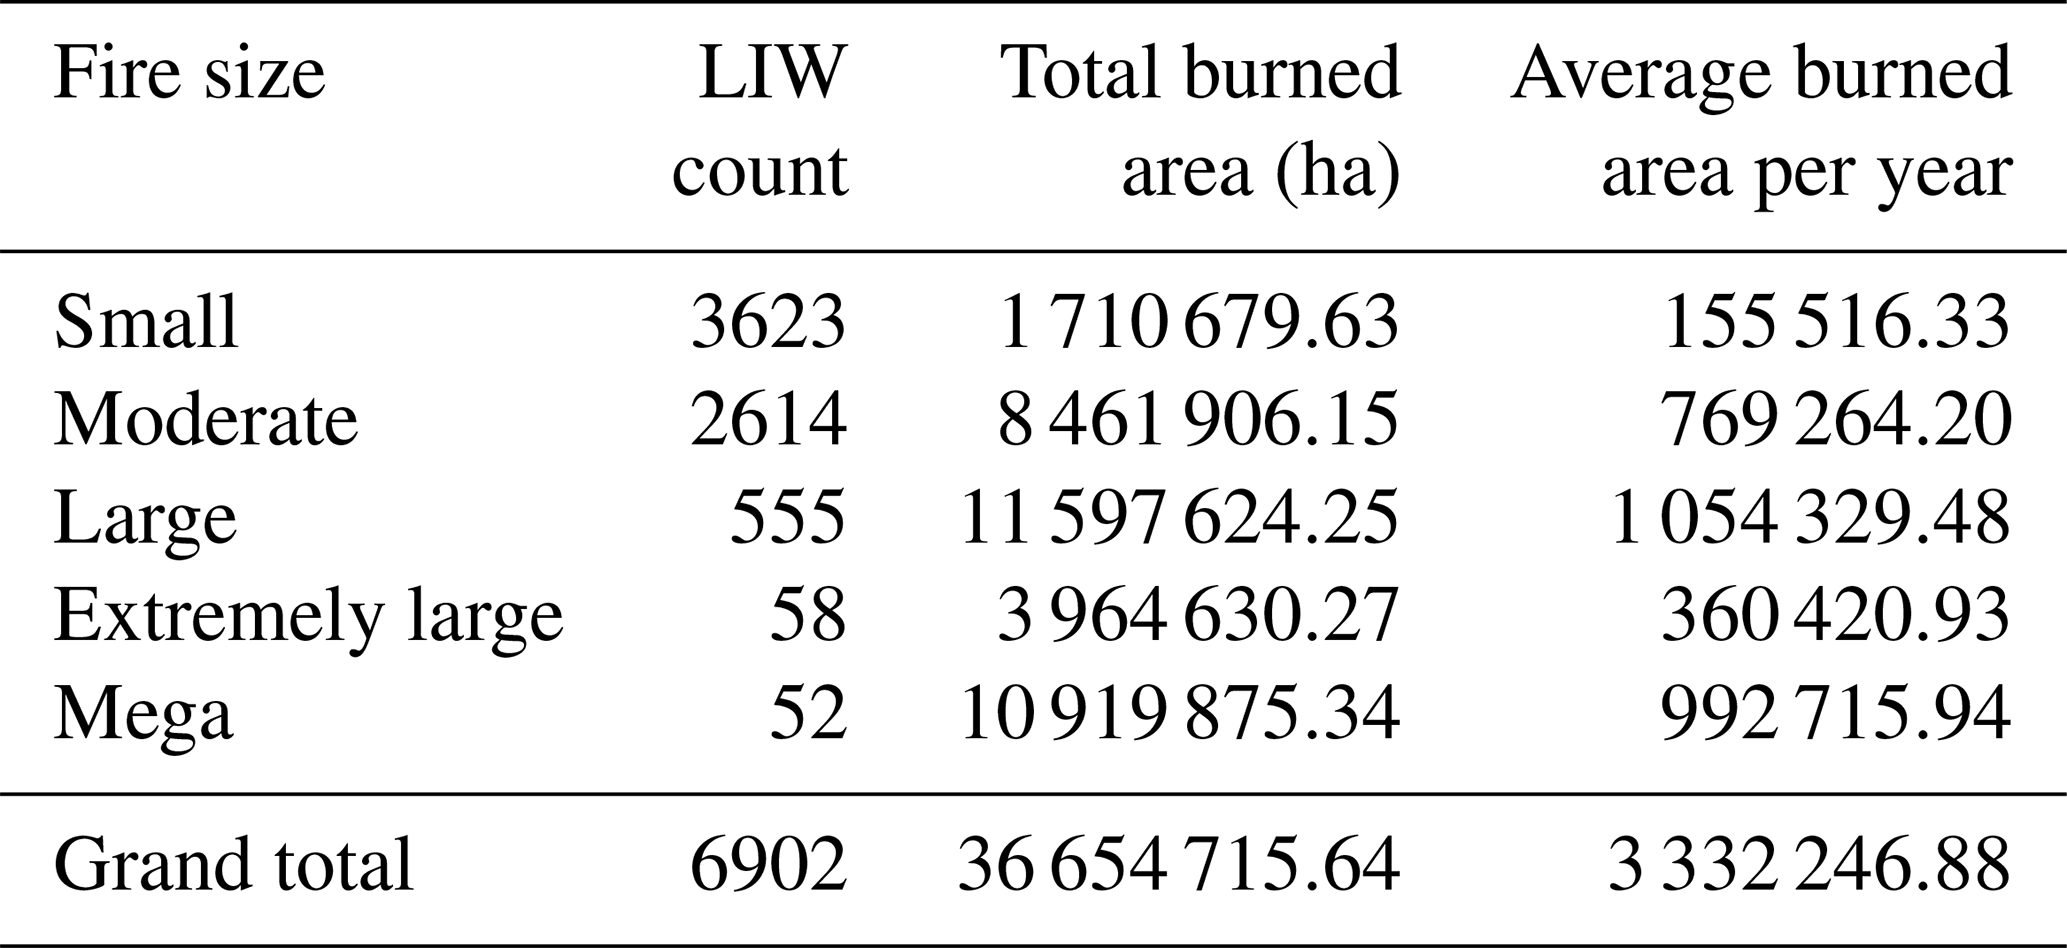
Table D7Total count and average fire size of fires in the BoLtFire dataset.
BE developed the methodology and workflow with IB and CS. Supervision and oversight was provided by CS. BE and IB developed the code, curated and validated the data, and created the visualizations. BE wrote the original draft. Review and editing of the final draft was conducted by CS, IB, MC, and YZ.
The contact author has declared that none of the authors has any competing interests.
Publisher's note: Copernicus Publications remains neutral with regard to jurisdictional claims made in the text, published maps, institutional affiliations, or any other geographical representation in this paper. While Copernicus Publications makes every effort to include appropriate place names, the final responsibility lies with the authors.
The authors would like to thank Steve Prinzivalli and Jeff Lapierre from Earth Networks for providing the data and for their valuable discussions on the limitations of the ENTLN data.
This research has been supported by the European Space Agency through the Climate-Space RECCAP2 project (4000144908/24/I-LR).
This paper was edited by Jia Yang and reviewed by three anonymous referees.
Anderson, K.: A model to predict lightning-caused fire occurrences, Int. J. Wildland Fire, 11, 163–172, https://doi.org/10.1071/wf02001, 2002.
Arevalo, P., Stanimirova, R., Bullock, E., Zhang, Y., Tarrio, K., Turlej, K., Hu, K., McAvoy, K., Pasquarella, V., Woodcock, C., Olofsson, P., Zhu, Z., Gorelick, N., Loveland, T., Barber, C., and Friedl, M.: Global Land Cover Mapping and Estimation Yearly 30 m V001, NASA EOSDIS Land Processes Distributed Active Archive Center [data set], https://doi.org/10.5067/MEaSUREs/GLanCE/GLanCE30.001, 2022.
Artés, T., Oom, D., De Rigo, D., Durrant, T. H., Maianti, P., Giorgio, L., and San-Miguel-Ayanz, J.: A global wildfire dataset for the analysis of fire regimes and fire behaviour, Sci. Data, 6, 296, https://doi.org/10.1038/s41597-019-0312-2, 2019.
Benali, A., Russo, A., Sá, A., Pinto, R., Price, O., Koutsias, N., and Pereira, J.: Determining Fire Dates and Locating Ignition Points with Satellite Data, Remote Sens., 8, 326, https://doi.org/10.3390/rs8040326, 2016.
Bond, T. C., Doherty, S. J., Fahey, D. W., Forster, P. M., Berntsen, T., Deangelo, B. J., Flanner, M. G., Ghan, S., Kärcher, B., Koch, D., Kinne, S., Kondo, Y., Quinn, P. K., Sarofim, M. C., Schultz, M. G., Schulz, M., Venkataraman, C., Zhang, H., Zhang, S., Bellouin, N., Guttikunda, S. K., Hopke, P. K., Jacobson, M. Z., Kaiser, J. W., Klimont, Z., Lohmann, U., Schwarz, J. P., Shindell, D., Storelvmo, T., Warren, S. G., and Zender, C. S.: Bounding the role of black carbon in the climate system: A scientific assessment, J. Geophys. Res.-Atmos, 118, 5380–5552, https://doi.org/10.1002/jgrd.50171, 2013.
Brandt, J. P.: The extent of the North American boreal zone, Environ. Rev., 17, 101–161, https://doi.org/10.1139/a09-004, 2009.
Brandt, J. P., Flannigan, M. D., Maynard, D. G., Thompson, I. D., and Volney, W. J. A.: An introduction to Canada's boreal zone: ecosystem processes, health, sustainability, and environmental issues, Environ. Rev., 21, 207–226, https://doi.org/10.1139/er-2013-0040, 2013.
Bui, V., Chang, L.-C., and Heckman, S.: A Performance Study of Earth Networks Total Lighting Network (ENTLN) and Worldwide Lightning Location Network (WWLLN), in: 2015 International Conference on Computational Science and Computational Intelligence (CSCI), 7–9 December 2015, Las Vegas, Nevada, USA, 386–391, https://doi.org/10.1109/CSCI.2015.120, 2015.
Canadian Forest Service: Canadian National Fire Database – Agency Fire Data, Natural Resources Canada, Canadian Forest Service, Northern Forestry Centre, Edmonton, Alberta [data set], http://cwfis.cfs.nrcan.gc.ca/en_CA/nfdb (last access: 4 September 2024), 2024.
Cardoso, M. F., Hurtt, G. C., Moore, B., Nobre, C. A., and Bain, H.: Field work and statistical analyses for enhanced interpretation of satellite fire data, Remote Sens. Environ., 96, 212–227, https://doi.org/10.1016/j.rse.2005.02.008, 2005.
Crowley, M. A., Stockdale, C. A., Johnston, J. M., Wulder, M. A., Liu, T., McCarty, J. L., Rieb, J. T., Cardille, J. A., and White, J. C.: Towards a whole-system framework for wildfire monitoring using Earth observations, Global Change Biol., 29, 1423–1436, https://doi.org/10.1111/gcb.16567, 2023.
de Groot, W. J., Flannigan, M. D., and Cantin, A. S.: Climate change impacts on future boreal fire regimes, Forest Ecol. Manage., 294, 35–44, https://doi.org/10.1016/j.foreco.2012.09.027, 2013.
Descals, A., Gaveau, D. L. A., Verger, A., Sheil, D., Naito, D., and Peñuelas, J.: Unprecedented fire activity above the Arctic Circle linked to rising temperatures, Science, 378, 532–537, https://doi.org/10.1126/science.abn9768, 2022.
Engle, B. and Bratoev, I.: BoLtFire Code Release version 1 (v1.0.0), Zenodo [code], https://doi.org/10.5281/zenodo.15425619, 2025.
Engle, B., Bratoev, I., Crowley, M. A., Zhu, Y., and Senf, C.: Distribution and Characteristics of Lightning-Ignited Wildfires in Boreal Forests – the BoLtFire database (3.0), Zenodo [data set], https://doi.org/10.5281/zenodo.14940326, 2024.
Flannigan, M. D. and Wotton, B. M.: Lightning-ignited forest fires in northwestern Ontario, Can. J. Forest Res., 21, 277–287, https://doi.org/10.1139/x91-035, 1991.
Flannigan, M. D., Stocks, B. J., and Wotton, B. M.: Climate change and forest fires, Sci. Total. Environ., 262, 221–229, https://doi.org/10.1016/s0048-9697(00)00524-6, 2000.
Flannigan, M. D., Stocks, B. J., Turetsky, M. R., and Wotton, M.: Impacts of climate change on fire activity and fire management in the circumboreal forest, Global Change Biol., 15, 549–560, https://doi.org/10.1111/j.1365-2486.2008.01660.x, 2009.
Friedl, M. and Sulla-Menashe, D.: MODIS/Terra+Aqua Land Cover Type Yearly L3 Global 500 m SIN Grid V061, NASA EOSDIS Land Processes Distributed Active Archive Center [data set], https://doi.org/10.5067/MODIS/MCD12Q1.061, 2022.
Fusco, E. J., Finn, J. T., Abatzoglou, J. T., Balch, J. K., Dadashi, S., and Bradley, B. A.: Detection rates and biases of fire observations from MODIS and agency reports in the conterminous United States, Remote. Sens. Environ., 220, 30–40, https://doi.org/10.1016/j.rse.2018.10.028, 2019.
Gao, C., Shi, C., Li, J., Yuan, S., Huang, X., Zhang, Q., Qiming, M., and Wu, G.: Igniting lightning, wildfire occurrence, and precipitation in the boreal forest of northeast China, Agr. Forest Meteorol., 354, 110081, https://doi.org/10.1016/j.agrformet.2024.110081, 2024.
Giglio, L., Loboda, T., Roy, D. P., Quayle, B., and Justice, C. O.: An active-fire based burned area mapping algorithm for the MODIS sensor, Remote Sens. Environ., 113, 408–420, https://doi.org/10.1016/j.rse.2008.10.006, 2009.
Giglio, L., Boschetti, L., Roy, D. P., Humber, M. L., and Justice, C. O.: The Collection 6 MODIS burned area mapping algorithm and product, Remote Sens. Environ., 217, 72–85, https://doi.org/10.1016/j.rse.2018.08.005, 2018.
Giglio, L., Boschetti, L., Roy, D., Hoffmann, A., Humber, M., and Hall, J.: Collection 6 MODIS Burned Area Product User's Guide Version 1.3. National Aeronautics and Space Administration (NASA), https://lpdaac.usgs.gov/documents/875/MCD64_User_Guide_V6.pdf (last access: 9 March 2024), 2020.
Gillett, N. P., Weaver, A. J., Zwiers, F. W., and Flannigan, M. D.: Detecting the effect of climate change on Canadian forest fires, Geophys. Res. Lett., 31, 2004GL020876, https://doi.org/10.1029/2004gl020876, 2004.
Hanes, C. C., Wang, X., Jain, P., Parisien, M.-A., Little, J. M., and Flannigan, M. D.: Fire-regime changes in Canada over the last half century, Can. J. Forest Res., 49, 256–269, https://doi.org/10.1139/cjfr-2018-0293, 2019.
Hansen, J. and Nazarenko, L.: Soot climate forcing via snow and ice albedos, P. Natl. Acad. Sci. USA, 101, 423–428, https://doi.org/10.1073/pnas.2237157100, 2003.
Hantson, S., Padilla, M., Corti, D., and Chuvieco, E.: Strengths and weaknesses of MODIS hotspots to characterize global fire occurrence, Remote Sens. Environ., 131, 152–159, https://doi.org/10.1016/j.rse.2012.12.004, 2013.
Hawbaker, T. J., Radeloff, V. C., Syphard, A. D., Zhu, Z., and Stewart, S. I.: Detection rates of the MODIS active fire product in the United States, Remote Sens. Environ., 112, 2656–2664, https://doi.org/10.1016/j.rse.2007.12.008, 2008.
Hessilt, T. D., Abatzoglou, J. T., Chen, Y., Randerson, J. T., Scholten, R. C., van der Werf, G., and Veraverbeke, S.: Future increases in lightning ignition efficiency and wildfire occurrence expected from drier fuels in boreal forest ecosystems of western North America, Environ. Res. Lett., 17, 054008, https://doi.org/10.1088/1748-9326/ac6311, 2022.
Janssen, T. A. J., Jones, M. W., Finney, D., van der Werf, G. R., van Wees, D., Xu, W., and Veraverbeke, S.: Extratropical forests increasingly at risk due to lightning fires, Nat. Geosci., 16, 1136–1144, https://doi.org/10.1038/s41561-023-01322-z, 2023.
Johnston, L. M., Wooster, M. J., Brookes, A., McFayden, C., and Cantin, A. S.: Satellite Detection Limitations of Sub-Canopy Smouldering Wildfires in the North American Boreal Forest, Fire, 1, 28, https://doi.org/10.3390/fire1020028, 2018.
Jones, M. W., Abatzoglou, J. T., Veraverbeke, S., Andela, N., Lasslop, G., Forkel, M., Smith, A. J. P., Burton, C., Betts, R. A., van der Werf, G. R., Sitch, S., Canadell, J. G., Santín, C., Kolden, C., Doerr, S. H., and Le Quéré, C.: Global and Regional Trends and Drivers of Fire Under Climate Change, Rev. Geophys., 60, e2020RG000726, https://doi.org/10.1029/2020rg000726, 2022.
Kasischke, E. S., Williams, D., and Barry, D.: Analysis of the patterns of large fires in the boreal forest region of Alaska, Int. J. Wildland Fire, 11, 131–144, https://doi.org/10.1071/wf02023, 2002.
Kim, Y., Hatsushika, H., Muskett, R. R., and Yamazaki, K.: Possible effect of boreal wildfire soot on Arctic sea ice and Alaska glaciers, Atmos. Environ., 39, 3513–3520, https://doi.org/10.1016/j.atmosenv.2005.02.050, 2005.
Kolden, C. A., Lutz, J. A., Key, C. H., Kane, J. T., and van Wagtendonk, J. W.: Mapped versus actual burned area within wildfire perimeters: Characterizing the unburned, Forest Ecol. Manage., 286, 38–47, https://doi.org/10.1016/j.foreco.2012.08.020, 2012.
Kourtz, P. H. and Todd, J. B.: Predicting the daily occurrence of lightning-caused forest fires, PI-X-112, Petawawa National Forestry Institute, Chalk River, Ont., Canada, 18 pp., ISBN 0662199480, 1992.
Krause, A., Kloster, S., Wilkenskjeld, S., and Paeth, H.: The sensitivity of global wildfires to simulated past, present, and future lightning frequency, J. Geophys. Res.-Biogeo., 119, 312–322, https://doi.org/10.1002/2013jg002502, 2014.
Lapierre, J. L., Laughner, J. L., Geddes, J. A., Koshak, W., Cohen, R. C., and Pusede, S. E.: Observing U.S. Regional Variability in Lightning NO2 Production Rates, J. Geophys. Res.-Atmos., 125, e2019JD031362, https://doi.org/10.1029/2019JD031362, 2020.
Larjavaara, M., Pennanen, J., and Tuomi, T. J.: Lightning that ignites forest fires in Finland, Agr. Forest Meteorol., 132, 171–180, https://doi.org/10.1016/j.agrformet.2005.07.005, 2005.
Latham, D. and Williams, E.: Chapter 11 – Lightning and Forest Fires, in: Forest Fires, edited by: Johnson, A. and Miyanishi, K., Academic Press, 375–418, https://doi.org/10.1016/B978-012386660-8/50013-1, 2001.
Laurent, P., Mouillot, F., Yue, C., Ciais, P., Morenos, V. M., and Nogueira, J. M. P.: FRY, a global database of fire patch functional traits derived from space-borne burned area products, Sci. Data, 5, 180132, https://doi.org/10.1038/sdata.2018.132, 2018.
Lavoué, D., Liousse, C., Cachier, H., Stocks, B. J., and Goldammer, J. G.: Modeling of carbonaceous particles emitted by boreal and temperate wildfires at northern latitudes, J. Geophys. Res.-Atmos., 105, 26871–26890, https://doi.org/10.1029/2000jd900180, 2000.
Liu, C. and Heckman, S.: Using total lightning data in severe storm prediction: Global case study analysis from north America, Brazil and Australia, in: 2011 International Symposium on Lightning Protection, 3–7 October 2011, Fortaleza, Brazil, 20–24, https://doi.org/10.1109/SIPDA.2011.6088433, 2011.
Lizundia-Loiola, J., Otón, G., Ramo, R. and Chuvieco, E.: A spatio-temporal active-fire clustering approach for global burned area mapping at 250 m from MODIS data, Remote. Sens. Environ., 236, 111493, https://doi.org/10.1016/j.rse.2019.111493, 2020.
Loboda, T. V., Hoy, E. E., Giglio, L., and Kasischke, E. S.: Mapping burned area in Alaska using MODIS data: a data limitations-driven modification to the regional burned area algorithm, Int. J. Wildland Fire, 20, 487–496, https://doi.org/10.1071/wf10017, 2011.
Macias Fauria, M. and Johnson, E. A.: Climate and wildfires in the North American boreal forest, Philos. T. Roy. Soc. A, 363, 2315–2327, https://doi.org/10.1098/rstb.2007.2202, 2007.
Mallick, S., Rakov, V. A., Hill, J. D., Gamerota, W. R., Uman, M. A., Heckman, S., Sloop, C. D., and Liu, C.: Calibration of the ENTLN against rocket-triggered lightning data, in: 2013 International Symposium on Lightning Protection (XII SIPDA), 7–11 October 2013, Belo Horizonte, Brazil, 39–46, https://doi.org/10.1109/sipda.2013.6729186, 2013.
Mallick, S., Rakov, V. A., Hill, J. D., Ngin, T., Gamerota, W. R., Pilkey, J. T., Jordan, D. M., Uman, M. A., Heckman, S., Sloop, C., and Liu, C.: Performance characteristics of the ENTLN evaluated using rocket-triggered lightning data, Elect. Pow. Syst. Res. Elect., 118, 15–28, https://doi.org/10.1016/j.epsr.2014.06.007, 2015.
Martell, D. L. and Sun, H.: The impact of fire suppression, vegetation, and weather on the area burned by lightning-caused forest fires in Ontario, Can. J. Forest Res., 38, 1547–1563, https://doi.org/10.1139/x07-210, 2008.
Melillo, J. M., Richmond, T. T., and Yohe, G. W.: Climate change impacts in the United States: Third National Climate Assessment, US Global Change Research Program, 841 pp., https://doi.org/10.7930/J0Z31WJ2, 2014.
Moris, J. V., Conedera, M., Nisi, L., Bernardi, M., Cesti, G., and Pezzatti, G. B.: Lightning-caused fires in the Alps: Identifying the igniting strokes, Agr. Forest Meteorol., 290, 107990, https://doi.org/10.1016/j.agrformet.2020.107990, 2020.
Moris, J. V., Álvarez-Álvarez, P., Conedera, M., Dorph, A., Hessilt, T. D., Hunt, H. G., Libonati, R., Menezes, L. S., Müller, M. M., Pérez-Invernón, F. J., Pezzatti, G. B., Pineda, N., Scholten, R. C., Veraverbeke, S., Wotton, B. M., and Ascoli, D.: A global database on holdover time of lightning-ignited wildfires, Earth Syst. Sci. Data, 15, 1151–1163, https://doi.org/10.5194/essd-15-1151-2023, 2023.
Müller, M. M., Vacik, H., Diendorfer, G., Arpaci, A., Formayer, H., and Gossow, H.: Analysis of lightning-induced forest fires in Austria, Theor. Appl. Climatol., 111, 183–193, https://doi.org/10.1007/s00704-012-0653-7, 2013.
Nash, C. H. and Johnson, E. A.: Synoptic climatology of lightning-caused forest fires in subalpine and boreal forests, Can. J. Forest Res., 26, 1859–1874, https://doi.org/10.1139/x26-211, 1996.
Natali, S. M., Watts, J. D., Rogers, B. M., Potter, S., Ludwig, S. M., Selbmann, A.-K., Sullivan, P. F., Abbot B. W., Arndt K. A., Birch L., Björkman, M. P., Bloom, A. A., Celis, G., Christensen, T. R., Christensen, C. T., Commane, R., Cooper, E. J., Crill, P., Czimczik, C., Davydov, S., Du, J., Egan, J. E., Elberling, B., Euskirchen, E. S., Friborg, T., Genet, H., Göckede, M., Goodrich, J. P., Grogan, P., Helbig, M., Jafarov, E. E., Jastrow, J. D., Kalhori, A. A. M., Kim, Y., Kimball, J., Kutzbach, L., Lara, M. J., Larsen, K. S., Lee, B.-Y., Liu, Z., Loranty, M. M., Lund, M., Lupascu, M., Madani, N., Malhotra, A., Matamala, R., McFarland, J., McGuire, A. D., Michelsen, A., Minions, C., Oechel, W. C., Olefeldt, D., Paramentier, F.-J. W., Pirk, N., Poulter, B., Quinton, W., Rezanezhad, F., Risk, D., Sachs, T., Schaefer, K., Schmidt, N. M., Schuur, E. A. G., Semenchuk, P. R., Shaver, G., Sonnentag, O., Starr, G., Treat, C. C., Waldrop, M. P., Wang, Y., Welker, J., Wille, C., Xu, X., Zhang, Z., Zhuang, Q., and Zona, D.: Large loss of CO2 in winter observed across the northern permafrost region, Nat. Clim. Change, 9, 852–857, https://doi.org/10.1038/s41558-019-0592-8, 2019.
Olson, D. M., Dinerstein, E., Wikramanayake, E. D., Burgess, N. D., Powell, G. V. N., Underwood, E. C., D'amico, J. A., Itoua, I., Strand, H. A., Morrison, J. C., Loucks, C. J., Allnutt, T. F., Ricketts, T. H., Kura, Y., Lamoreux, J. F., Wettengel, W. W., Hedao, P., and Kassem, K. R.: Terrestrial Ecoregions of the World: A New Map of Life on Earth, BioScience, 51, 933, https://doi.org/10.1641/0006-3568(2001)051[0933:teotwa]2.0.co;2, 2001.
Pan, Y., Birdsey, R. A., Fang, J., Houghton, R., Kauppi, P. E., Kurz, W. A., Phillips, O. L., Shvidenko, A., Lewis, S. L., Canadell, J. G., Ciais, P., Jackson, R. B., Pacala, S. W., McGuire, A. D., Piao, S., Rautiainen, A., Sitch, S., and Hayes, D.: A Large and Persistent Carbon Sink in the World's Forests, Science, 333, 988–993, https://doi.org/10.1126/science.1201609, 2011.
Pérez-Invernón, F. J., Moris, J. V., Gordillo-Vázquez, F. J., Füllekrug, M., Pezzatti, G. B., Conedera, M., Lapierre, J., and Huntrieser, H.: On the Role of Continuing Currents in Lightning-Induced Fire Ignition, J. Geophys. Res.-Atmos., 128, e2023JD038891, https://doi.org/10.1029/2023jd038891, 2023.
Pineda, N. and Rodríguez, O.: ERA5 Reanalysis of Environments Conducive to Lightning-Ignited Wildfires in Catalonia, Atmosphere, 14, 936, https://doi.org/10.3390/atmos14060936, 2023.
Pineda, N., Montanyà, J., and Van Der Velde, O. A.: Characteristics of lightning related to wildfire ignitions in Catalonia, Atmos. Res., 135–136, 380–387, https://doi.org/10.1016/j.atmosres.2012.07.011, 2014.
Pineda, N., Peña, J. C., Soler, X., Aran, M., and Pérez-Zañón, N.: Synoptic weather patterns conducive to lightning-ignited wildfires in Catalonia, Adv. Sci. Res., 19, 39–49, https://doi.org/10.5194/asr-19-39-2022, 2022.
Podur, J., Martell, D. L., and Csillag, F.: Spatial patterns of lightning-caused forest fires in Ontario, 1976–1998, Ecol. Model., 164, 1–20, https://doi.org/10.1016/s0304-3800(02)00386-1, 2003.
Post, E., Alley, R. B., Christensen, T. R., Macias-Fauria, M., Forbes, B. C., Gooseff, M. N., Iler, A., Kerby, J. T., Laidre, K. L., Mann, M. E., Olofsson, J., Stroeve, J. C., Ulmer, F., Virginia, R. A., and Wang, M.: The polar regions in a 2 °C warmer world, Sci. Adv., 5, eaaw9883, https://doi.org/10.1126/sciadv.aaw9883, 2019.
Rodger, C. J., Brundell, J. B., Dowden, R. L., and Thomson, N. R.: Location accuracy of long distance VLF lightning location network, Ann. Geophys., 22, 747–758, https://doi.org/10.5194/angeo-22-747-2004, 2004.
Rogers, B. M., Soja, A. J., Goulden, M. L., and Randerson, J. T.: Influence of tree species on continental differences in boreal fires and climate feedbacks, Nat. Geosci., 8, 228–234, https://doi.org/10.1038/ngeo2352, 2015.
Roy, D. P., Jin, Y., Lewis, P. E., and Justice, C. O.: Prototyping a global algorithm for systematic fire-affected area mapping using MODIS time series data, Remote Sens. Environ., 97, 137–162, https://doi.org/10.1016/j.rse.2005.04.007, 2005.
Scholten, R. C., Jandt, R., Miller, E. A., Rogers, B. M., and Veraverbeke, S.: Overwintering fires in boreal forests, Nature, 593, 399–404, https://doi.org/10.1038/s41586-021-03437-y, 2021.
Schultz, C. J., Nauslar, N. J., Wachter, J. B., Hain, C. R., and Bell, J. R.: Spatial, Temporal and Electrical Characteristics of Lightning in Reported Lightning-Initiated Wildfire Events, Fire, 2, 18, https://doi.org/10.3390/fire2020018, 2019.
Seidl, R., Honkaniemi, J., Aakala, T., Aleinikov, A., Angelstam, P., Bouchard, M., M., Boulanger, Y., Burton, P. J., Grandpre, L., Gauthier, S., Hansen, W. D., Jepsen, J. U., Jogiste, K., Kneesbaw, D. D., Kuuluvainen, T., Lisitsyna, O., Makoto, K., Mori, A. S., Purswaran, D. S., Shorobova, E., Shubnitsina, E., Taylor, A. R., Vladimirova, N., Vodde, F., and Senf, C.: Globally consistent climate sensitivity of natural disturbances across boreal and temperate forest ecosystems, Ecography, 43, 967–978, https://doi.org/10.1111/ecog.04995, 2020.
Sofronov, M. A., Volokitina, A. V., and Shvidenko, A. Z.: Wildland fires in the north of Central Siberia, Commonwealth Forest. Rev., 77, 124–127, 1998.
Soja, A. J., Tchebakova, N. M., French, N. H. F., Flannigan, M. D., Shugart, H. H., Stocks, B. J., Sukhinin, A. I., Parfenova, E. I., Chapin III, F. S., and Stackhouse, P. W.: Climate-induced boreal forest change: Predictions versus current observations, Global Planet. Change, 56, 274–296, https://doi.org/10.1016/j.gloplacha.2006.07.028, 2007.
Stocks, B. J., Fosberg, M. A., Lynham, T. J., Mearns, L., Wotton, B. M., Yang, Q., Jin, J.-Z., Lawrence, K., Hartley, G. R., Mason, J. A., and McKenney, D. W.: Climate Change and Forest Fire Potential in Russian and Canadian Boreal Forests, Climatic Change, 38, 1–13, https://doi.org/10.1023/a:1005306001055, 1998.
Stocks, B. J., Wotton, B. M., Flannigan, M. D., Fosberg, M. A., Cahoon, D. R., and Goldammer, J. G.: Boreal Forest Fire Regimes and Climate Change, in: Advances in Global Change Research, Remote Sensing and Climate Modeling: Synergies and Limitations, edited by: Beniston, M. and Verstraete, M. M., Springer, Dordrecht, the Netherlands, 233–246, https://doi.org/10.1007/0-306-48149-9_10, 2001.
Stocks, B. J., Mason, J. A., Todd, J. B., Bosch, E. M., Wotton, B. M., Amiro, B. D., Flannigan, M. D., Hirsch, K. G., Logan, K. A., Martell, D. L., and Skinner, W. R.: Large forest fires in Canada, 1959–1997, J. Geophys. Res.-Atmos., 107, 8149, https://doi.org/10.1029/2001jd000484, 2002.
Stohl, A.: Characteristics of atmospheric transport into the Arctic troposphere. J. Geophys. Res.-Atmos., 111, 2005JD006888, https://doi.org/10.1029/2005jd006888, 2006.
Talucci, A. C., Loranty, M. M., and Alexander, H. D.: Siberian taiga and tundra fire regimes from 2001–2020, Environ. Res. Lett., 17, 025001, https://doi.org/10.1088/1748-9326/ac3f07, 2022.
Turner, M. G.: Disturbance and landscape dynamics in a changing world, Ecology, 91, 2833–2849, https://doi.org/10.1890/10-0097.1, 2010.
US Department of the Interior, Bureau of Land Management (BLM), and Alaska Fire Service: BLM AFS Alaska Statewide fire History Locations 1939–2023 points, NAD83 [data set], https://fire.ak.blm.gov/ (last access: 14 March 2024), 2024a.
US Department of the Interior, Bureau of Land Management (BLM), and Alaska Fire Service: BLM AFS Alaska Statewide Fire History Perimeters 1940–2023 Polygons, AKAlbersNAD83 [data set], https://fire.ak.blm.gov/ (last access: 14 March 2024), 2024b.
Vajda, A., Venäläinen, A., Suomi, I., Junila, P., and Mäkelä, H. M.: Assessment of forest fire danger in a boreal forest environment: description and evaluation of the operational system applied in Finland, Meteorol. Appl., 21, 879–887, https://doi.org/10.1002/met.1425, 2013.
Van Wagner, C. E.: Development and structure of the Canadian forest fire weather index system, Canadian Forestry Service, Headquarters, Ottawa, 36 pp., ISBN 0-662-15198-4, 1987.
Van Wagner, C. E.: Fire behaviour in northern conifer forests and shrublands, in: The Role of Fire in Northern Circumpolar Ecosystems, edited by: Wein, R. W. and MacLean, D. A., John Wiley and Sons, New York, NY, USA, 65–80, ISBN 978-0471102229, 1983.
Veraverbeke, S., Rogers, B. M., Goulden, M., Jandt, R. R., Miller, C. E., Wiggins, E. B., and Randerson, J. T.: Lightning as a major driver of recent large fire years in North American boreal forests, Nat. Clim. Change, 7, 529–534, https://doi.org/10.1038/nclimate3329, 2017.
Vitolo, C., Di Giuseppe, F., Barnard, C., Coughlan, R., San-Miguel-Ayanz, J., Libertá, G., and Krzeminski, B.: ERA5-based global meteorological wildfire danger maps, Sci. Data., 7, 216, https://doi.org/10.1038/s41597-020-0554-z, 2020.
Watts, J. D., Farina, M., Kimball, J. S., Schiferl, L. D., Liu, Z., Arndt, K. A., Zona, D., Ballantyne, E. S., Parmentier, F.-J. W., Helbig, M., Sonnentag, O., Tagesson, T., Rinne., J., Ikawa, H., Ueyama, M., Kobayashi, H., Sachs, T., Nadeau, D. F., Kochendorfer, J., Jackowicz-Korczynski, M., Virkkala, A., Aurela, M., Commane, R., Byrne, B., Birch, L., Johnson, M. S., Madani, N., Rogers, B., Du, J., Endsley, A., Savage, K., Poulter, B., Zhang, Z., Burhwiler, L. M., Miller, C. E., Goetz, S., and Oechel, W. C.: Carbon uptake in Eurasian boreal forests dominates the high-latitude net ecosystem carbon budget, Global Change Biol., 29, 1870–1889, https://doi.org/10.1111/gcb.16553, 2023.
Wendler, G., Conner, J., Moore, B., Shulski, M., and Stuefer, M.: Climatology of Alaskan wildfires with special emphasis on the extreme year of 2004, Theor. Appl. Climatol., 104, 459–472, https://doi.org/10.1007/s00704-010-0357-9, 2011.
Wierzchowski, J., Heathcott, M., and Flannigan, M. D.: Lightning and lightning fire, central cordillera, Canada. Int. J. Wildland Fire, 11, 41–51, https://doi.org/10.1071/wf01048, 2002.
Woolford, D. G., Martell, D. L., McFayden, C. B., Evens, J., Stacey, A., Wotton, B. M., and Boychuk, D.: The development and implementation of a human-caused wildland fire occurrence prediction system for the province of Ontario, Canada, Can. J. Forest Res., 51, 303–325, https://doi.org/10.1139/cjfr-2020-0313, 2021.
World Bank: World Bank Official Boundaries: Admin 0, 10 meter boundary, World Bank, [data set], https://datacatalog.worldbank.org/search/dataset/0038272/World-Bank-Official-Boundaries (last access: 12 May 2024), 2020.
Wotton, B. M. and Martell, D. L.: A lightning fire occurrence model for Ontario, Can. J. Forest Res., 35, 1389–1401, https://doi.org/10.1139/x05-071, 2005.
Xu, W., Scholten, R. C., Hessilt, T. D., Liu, Y., and Veraverbeke, S.: Overwintering fires rising in eastern Siberia, Environ. Res. Lett., 17, 045005, https://doi.org/10.1088/1748-9326/ac59aa, 2022.
Zheng, B., Ciais, P., Chevallier, F., Yang, H., Canadell, J. G., Chen, Y., Van Der Velde, I. R., Aben, I., Chuvieco, E., Favis, S. J., Deeter, M., Hong, C., Kong, Y., Xin Lin, H. L., He, K., and Zhang, Q.: Record-high CO2 emissions from boreal fires in 2021, Science, 379, 912–917, https://doi.org/10.1126/science.ade0805, 2023.
Zhu, C., Kobayashi, H., Kanaya, Y., and Saito, M.: Size-dependent validation of MODIS MCD64A1 burned area over six vegetation types in boreal Eurasia: Large underestimation in croplands, Sci. Rep., 7, 4181, https://doi.org/10.1038/s41598-017-03739-0, 2017a.
Zhu, Y., Rakov, V. A., Tran, M. D., Stock, M. G., Heckman, S., Liu, C., Sloop, D. M., Uman, M. A., Caicedo, J. A., Kotovsky, D. A., Wilkes, R. A., Carvalho, F. L., Ngin, T., Gamerota, W. R., Pilkey, J. T., and Hare, B. M.: Evaluation of ENTLN Performance Characteristics Based on the Ground Truth Natural and Rocket-Triggered Lightning Data Acquired in Florida, J. Geophys. Res.-Atmos., 122, 9858–9866, https://doi.org/10.1002/2017jd027270, 2017b.
Zhu, Y., Stock, M., Lapierre, J., and DiGangi, E.: Upgrades of the Earth Networks Total Lightning Network in 2021, Remote Sens., 14, 2209, https://doi.org/10.3390/rs14092209, 2022.