the Creative Commons Attribution 4.0 License.
the Creative Commons Attribution 4.0 License.
 | 27 May 2025
Global and national CO2 uptake by cement carbonation from 1928 to 2024
Le Niu
Songbin Wu
Robbie M. Andrew
Zi Shao
Jiaoyue Wang
Fengming Xi
The hydration products of cement materials can absorb atmospheric CO2, and this carbonation process provides an important decarbonization pathway for the cement industry. Global carbon sequestration by cement materials has been reported, but carbon uptake in different countries remains unquantified. Here, we quantify the national cement carbon uptake from 1928 to 2023 based on 58 517 activity data from 163 cement-producing countries and regions worldwide and 6186 carbonation parameters from detailed data records of 42 countries, and we project the trend in carbon uptake by countries in 2024. The global CO2 uptake by cement materials has increased from 7.74 Mt yr−1 (95 % confidence interval, CI: 5.84–9.85 Mt CO2 yr−1) in 1928 to 0.84 Gt yr−1 (95 % CI: 0.71–1.00 Gt yr−1) in 2023, and it was projected to rise to 0.86 Gt yr−1 (95 % CI: 0.73–1.02 CO2 yr−1) in 2024. The accumulated CO2 uptake from 1928 to 2023 is 21.26 Gt CO2 (95 % CI: 17.93–25.17 Gt CO2), which offsets about 46 % of the cement process emissions (46.06 Gt CO2) in the past 96 years. Simultaneously, the dominance in cement carbon uptake has shifted from the USA, Japan, and some European countries to emerging economies such as China and India, which account for 38.0 % and 9.1 % of total CO2 uptake, respectively, in the last decade (2014–2023). By analysing the long time series of carbon emissions and uptake of the 42 countries with detailed data, we find that they contributed 82.1 % of global cement CO2 uptake from 1928 to 2023, including 21 countries for which cement emissions have peaked and 21 countries for which they have not yet peaked. The annual carbon offset level (the ratio of uptake to process emissions in a given year) shows a remarkable decrease due to the temporal lag in cement carbon uptake. This is significant for countries with higher cement imports; for example, the cement industries in Australia and Japan have achieved net-zero emissions when considering the cement carbonation sink. This study provides an accurate bottom-up quantification of cement carbonation sinks at national and global levels. All of the data described in this study are accessible at https://doi.org/10.5281/zenodo.14583866 (Wu et al., 2024).
- Article
(8117 KB) - Full-text XML
-
Supplement
(1097 KB) - BibTeX
- EndNote


The global cement industry is the third-largest source of difficult-to-eliminate CO2 emissions, after load-following electricity and iron and steel (Davis et al., 2018; Shah et al., 2022), accounting for up to 8 % of anthropogenic CO2 emissions (Cheng et al., 2023; Farfan et al., 2019). Cement production CO2 emissions arise from fossil energy inputs (about 40 %) and from process emissions (about 60 %) induced by the calcination of carbonate (mostly CaCO3). As the largest source of carbonate decomposition emissions, global cement production process emissions in 2023 were about 1.6 Gt CO2 (Andrew, 2019). Conversely, cement products such as concrete and mortar are important CO2 sinks because of their capacity to react with environmental CO2 (Snæbjörnsdóttir et al., 2020). The carbonation mechanism of cement is mainly attributed to alkaline hydration products (Xue et al., 2021), such as calcium hydroxide (Ca(OH)2), calcium silicate ((CaO)3 ⋅ xSiO2), and calcium aluminate (CaO ⋅ xAl2O3), as described by the following respective equations (Goyal and Sharma, 2020):
A substantial fraction of process CO2 emissions from cement production are reabsorbed on a timescale of 100 years via the natural carbonation of cement materials, and net cement emissions (industrial process of cement production minus the estimated annual CO2 sequestration from carbonation of cement materials) have been reduced by 43 % compared to accumulated process emissions without absorption from 1930 to 2013 (Xi et al., 2016).
Cement carbon uptake is helpful to achieve net-zero ambitions for the cement industry (CEMBUREAU, 2024). Although studies have demonstrated a significant reduction in CO2 emissions via the use of industrial by-products as substitutes for raw materials (Coffetti et al., 2022; Kurtis, 2015) and the use of alternative fuels to meet energy needs (de Lorena Diniz Chaves et al., 2021), carbon sequestration by cement carbonation plays an essential role in reaching the net-zero emission goal of the cement industry. Therefore, there is an urgent need to scientifically quantify the contribution of cement carbonation in the decarbonization efforts of this industry. Currently, the “Roadmap to Carbon Neutrality”, published by the Portland Cement Association of the United States (PCA, 2021), highlights the fact that approximately 10 % of the CO2 generated during the manufacture of cement and concrete can ultimately be absorbed over the life of a concrete structure (not including cement mortar); moreover, this publications underscores the significance of recognizing and validating cement carbonation. The European Cement Association (CEMBUREAU, 2024) has proposed a net-zero ambition with respect to cement by 2050, with mineral carbonation contributing about 6.4 % (74 kg CO2 t−1 reduction) to achieving this emission goal. The report explicitly indicated that CO2 absorption facilitated by concrete structures and infrastructure should be incorporated into national greenhouse gas inventories. In addition, estimates of cement carbon uptake are used by the Global Carbon Budget (Friedlingstein et al., 2023) as an important part of the anthropogenic carbon sink for modelling the annual global carbon cycle. Therefore, it is imperative that these uptake estimates are as accurate as possible.
However, due to the lack of detailed activity data and accurate carbonation parameters for various countries, there is still a gap in the national-scale accounting of cement carbon uptake. Cement consumption, influenced by international trade, provides the activity data for estimating carbon sequestration (Ambec et al., 2024). In previous accounting, cement production was used as a proxy for consumption (Xi et al., 2016). However, while that is sufficient at the global level (as production and consumption are almost equal globally), it is imperative to collect more accurate activity data on cement consumption with an improved spatial resolution in order to achieve more accurate results at the country level. To establish a national cement carbon sink database, it is essential to refine cement carbonation parameters at the national level, including cement type, exposure conditions, and building lifespan, which directly impact cement carbonation properties.
Many studies have made great contributions to a better understanding of cement carbon emissions. Andrew (2019) provided a long-time-series global cement carbon emission database by calibrating carbon emissions from cement production processes across various countries. Cheng et al. (2023) offered bottom-up quantifications of emissions in developing countries. Moreover, some studies have accounted for cement emissions and proposed reduction strategies, particularly for major emitters like China (Doh Dinga and Wen, 2022; Liu et al., 2021) and India (Krishna Priya et al., 2024). Nonetheless, corresponding carbon sequestration accounting for cement with the same accuracy has not yet been established. It is, therefore, imperative to enhance the spatial resolution of the cement carbon uptake database to understand the specifics of cement carbon sinks and their contributions to emission reductions across different countries.
This study is the fourth update of the Global Cement Carbon Uptake Database, and it provides a detailed bottom-up quantification of global cement CO2 uptake and reveals a shift in the main countries contributing to this uptake. Key updates compared to previous versions (Xi et al., 2016; Guo et al., 2021; Huang et al., 2023) are as follows:
-
Global cement carbon uptake is now calculated as the sum of 163 countries and regions, offering a more comprehensive view than the previous coarse-scale partition summation.
-
To reduce accounting uncertainty, we have shifted from using cement clinker production to apparent consumption as the activity data for national cement carbon sequestration accounting.
-
We have updated national-level cement carbonation parameters to improve accounting accuracy, including factors such as cement utilization type, concrete strength class, and concrete exposure time.
-
The database has been updated to include time series from 1928 to 2023, with projected cement carbon uptake for 2024 aligning with the latest Global Carbon Budget.
-
This update also highlights the cement carbon sequestration characteristics at a national-level and their carbon offset levels to process emissions.
2.1 Data sources and treatment
In this study, national cement clinker production data and emission factors were used to calculate carbon emissions from cement production processes. The cement clinker production data for 163 countries and regions were obtained from two sources. The first source comprised direct cement clinker production data submitted to the United Nations Framework Convention on Climate Change (UNFCCC) by 43 countries. The second source comprised estimated cement clinker production data derived by multiplying the clinker-to-cement ratio (the ratio of cement clinker production to cement production) by cement production. Cement production data for 163 countries and regions from 1928 to 2022 were accessed from the United States Geological Survey (USGS: Cement statistics and information, 2025). For the year 2023, the cement production data were updated from the CCF2Up database website (https://ccf2up.com/, last access: 4 August 2024). For countries lacking updated data for 2023 and all countries in 2024, projections were made based on historical data (see Sect. 2.3 for forecasting methods). The cement-to-clinker ratio data for China and India aligned with our prior research (Xi et al., 2016; Guo et al., 2021; Huang et al., 2023). For other countries, the ratios were estimated using the methods outlined by Andrew (2020): utilizing a 95 % clinker-to-cement ratio for the years before 1970 and employing linear interpolation to estimate the ratio for the period after 1970, based on the assumption of steady increases in clinker substitution over time. Country-specific cement emission factors are obtained from the UNFCCC for 43 countries. For those not listed in the database, the default value of 0.507 kg CO2 per tonne of clinker provided by the Intergovernmental Panel on Climate Change (IPCC, 2006) was used.
To provide a more accurate national-level database of carbon uptake by cement, data updates have been made in this study, based on previous work (Huang et al., 2023), and the following modifications have been incorporated:
-
Cement consumption for 163 countries and regions has been updated. Cement consumption in different countries was adjusted using import and export data (accessed on the UN Comtrade Database at https://comtradeplus.un.org/, last access: 2 June 2024) for cement clinker, based on the cement production data collected and estimated for each country.
-
The proportions of cement used for concrete and mortar in 42 countries, comprising the share of concrete and mortar in total cement consumption, respectively, were updated. Statistics on the types of cement utilized in European countries were sourced from the European Ready Mixed Concrete Organization (ERMCO, 2020). Data for South Africa (Muigai et al., 2013), India (Kumar and Kaushik, 2003), and Thailand were collected from the literature. For China and the USA, the data remain consistent with previous work.
-
Concrete strength is a comprehensive parameter for assessing its quality, and the carbonization rate generally decreases with increasing concrete strength class (Pade and Guimaraes, 2007); therefore, we collected data on concrete strength classes for 42 countries. For European countries, concrete strength-class data were derived and updated from European Ready Mixed Concrete Organization statistics (ERMCO, 2020). For other countries, like Brazil, Egypt, South Africa, Saudi Arabia, India, Malaysia, Thailand, and the United Arab Emirates, the concrete categories were estimated based on building types from China Economic Information Center Data (CEIC Data, 2023).
-
The building lifespan determines the exposure time of concrete during the service stage, which is crucial for defining the concrete life cycle in the accounting model. Therefore, we collected data on the distribution of building lifespans for 42 countries. Building lifespan data were primarily referenced from statistical and survey data (Xi et al., 2016); however, for countries with limited statistical data, such as Vietnam and India, engineering design and model data were used (Bhyan et al., 2023; Ji et al., 2021).
Altogether, there are 58 517 activity data for 163 cement-producing countries and regions worldwide, and 6186 carbonation parameters for 42 countries were updated and enriched in the model of global cement carbon uptake. The detailed activity data and carbonation parameters are given in Tables S1 and S2 in the Supplement (available from https://doi.org/10.5281/zenodo.14583866, Wu et al., 2024).
2.2 Estimating cement process CO2 emissions
The methodology recommended by the IPCC is widely used for estimating CO2 emissions from industrial processes. In this study, we used the Tier-2 method to estimate country-specific emissions (Eq. 4):
where Eprocess,i represents process CO2 emissions from the cement industry in country i, Pcement,i refers to the weight (mass) of cement produced, fclinker,i is the clinker-to-cement ratio, and is the country-specific emission factor for clinker.
Table 1Accounting model for cement CO2 uptake.
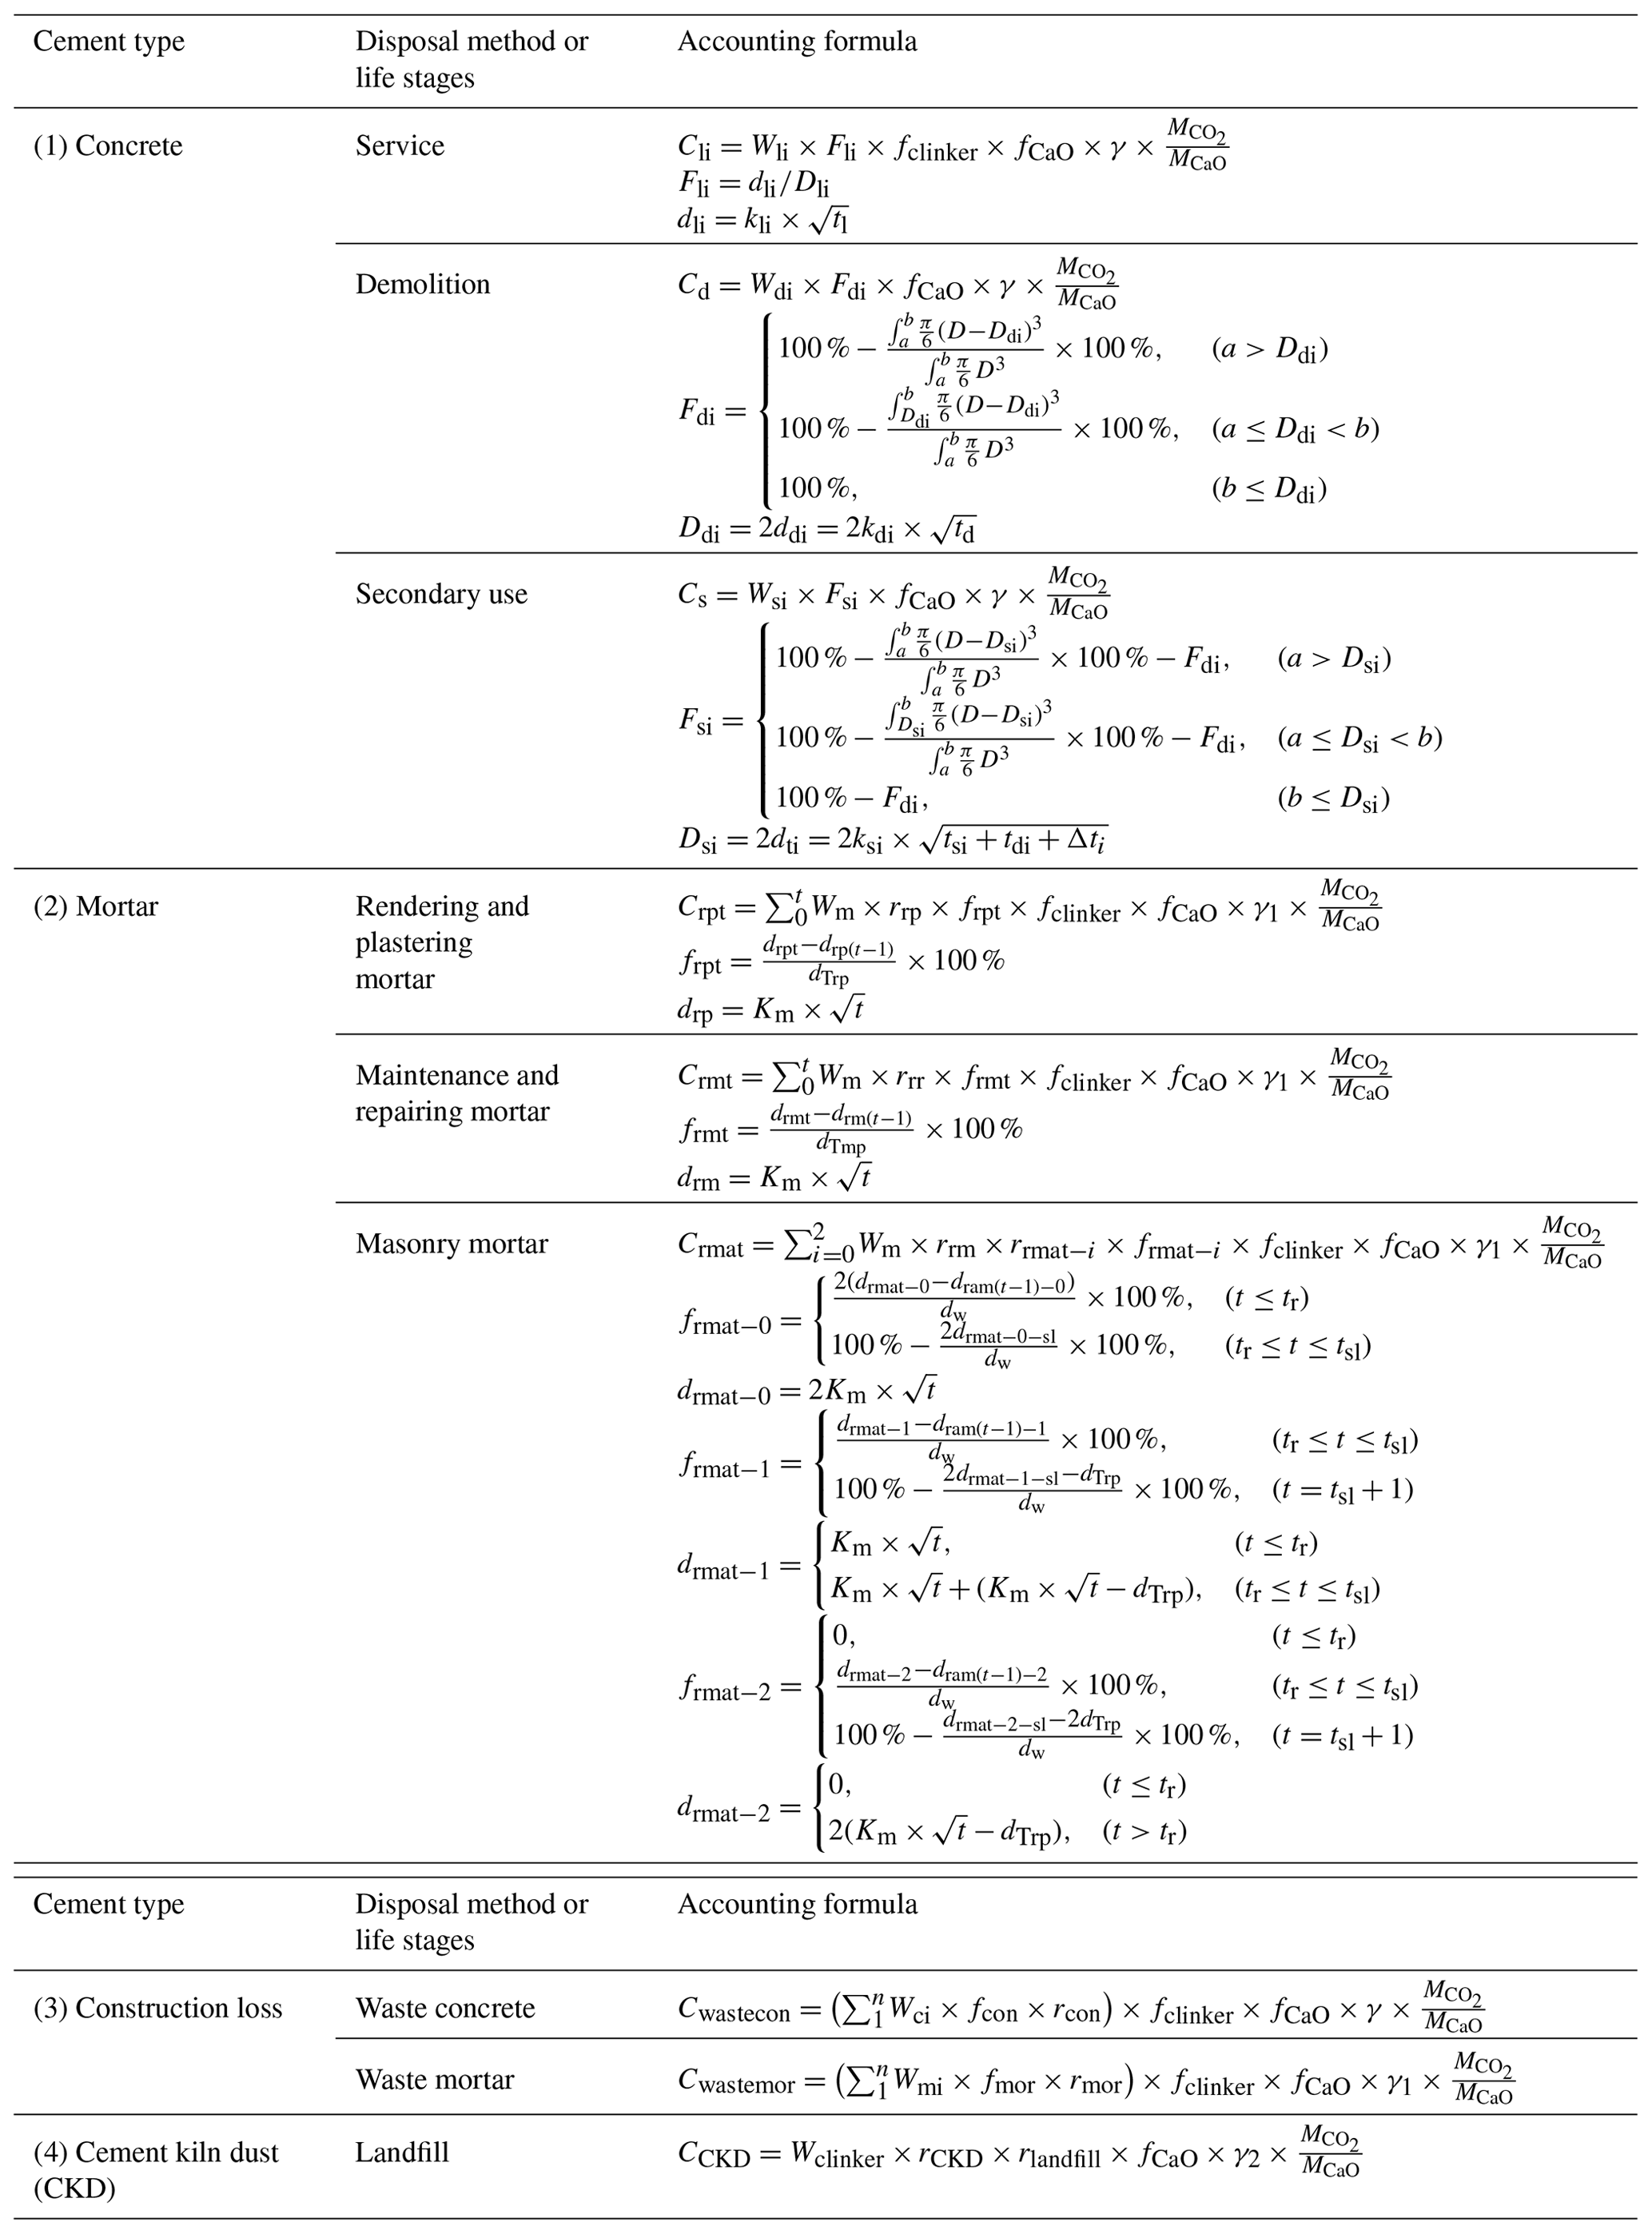
(1) Concrete: Wli, Wdi, and Wsi represent cement consumption for i-grade-strength concrete in the construction service, demolition, and secondary-use phases, respectively; Fli, Fdi, and Fsi represent the carbonization ratio for i-grade-strength concrete in the construction service, demolition, and secondary-use phases, respectively; D is the particle size of concrete debris in the demolition phase of construction; Dli is the wall thickness during concrete services; Ddi and Dsi are the maximum particle size of i-grade-strength concrete for complete carbonization in the demolition and secondary-use phases, respectively; a and b are the respective maximum and minimum particle size of waste concrete debris; dli, ddi, and dsi represent the carbonation depth of i-grade-strength concrete in the construction service, demolition, and secondary-use phases, respectively; kli, kdi, and ksi represent the carbonation rate of i-grade-strength concrete in the construction service, demolition, and secondary-use phases, respectively; tl, td, tsi, tdi, and Δti represent the use time of i-grade-strength concrete buildings, exposure time during the demolition phase, secondary-use time of burial, and carbonation lag time for burial, respectively; fCaO is the proportion of CaO in cement clinker; γ is the fraction of CaO converted to CaCO3 in concrete; and and MCaO are the respective molar mass values of CO2 and CaO. (2) Mortar: Wm is the cement consumption for mortar; rrp, rrr, and rrm represent the proportion of mortar used for rendering and plastering, maintenance and repair, and masonry, respectively; rrmat−i is the proportion of masonry mortar that does not have plaster (i=0), plaster on one side (i=1), and plaster on both sides (i=2); frpt, frmt, and frmat-i denote the carbonization ratio in year t for three mortars; γ1 is the fraction of CaO converted to CaCO3 in mortar; drpt, drmt, and drmat−i represent the carbonation depth of different types mortar in year t; drp(t−1), drm(t−1), and represent the carbonation depth of different types mortar in year t−1; dTrp, dTmp, and dw represent the thickness of mortar used for rendering and plastering, maintenance and repair, and masonry, respectively; Km is the carbonation rate of mortar; t is the mortar exposure time; and tr is the time required for complete carbonation of plaster mortar at thickness. (3) Construction loss: Wci and Wmi represent cement consumption for i-grade-strength concrete and mortar, respectively; fcon and fmor represent the loss rate of concrete and mortar during the construction phase, respectively; and rcon and rmor represent the carbonation ratio of lost concrete and lost mortar during the construction phase, respectively. (4) Cement kiln dust (CKD): Wclinker denotes cement clinker production; rCKD is the production rate of CKD; rlandfill is the proportion of cement kiln ash used for landfill disposal; and γ2 is the fraction of CaO converted to CaCO3 in CKD.
2.3 Estimating cement CO2 uptake
We employ the national geographic boundary as the accounting boundary for cement carbon uptake, aligning with the accounting methods for carbon emissions from cement production. The accounting model for cement CO2 uptake (Table 1) in this study adheres to the model constructed in our prior research, which can be summarized as follows:
In the expressions above, C is the carbon uptake by cement materials; W is the clinker consumption, which is adjusted by clinker production (Pclinker) with its exports (Ex) and imports (Im) (Eq. 6); f is the proportion of CaO in cement clinker; γ is the fraction of CaO converted to CaCO3 of cement material; and F is the annual carbonation proportion, which is the percentage of the carbonation depth (d) in the accounting year compared to the theoretical maximum carbonation depth (D) (Eq. 7). Based on Fick's diffusion law (Eq. 8; You et al., 2022), the carbonation depth of cement is the product of the carbonation rate (k) and the square root of time. The carbonation rate in the model is calculated by considering the impact of exposure conditions (βcsec), cement additives (βad), the CO2 concentration (), and coating and cover (βcc) (Eq. 9). M is the molar mass ratio of CO2 to CaO ().
Considering the carbon uptake mechanism of cement in different life cycles, cement carbon uptake has been categorized into four types: (1) concrete use, (2) mortar use, (3) construction loss, and (4) cement kiln dust (CKD) landfills. For concrete, the whole life cycle of concrete services, demolition, and secondary-use (including both disposal in a landfill and recycling) is considered when calculating the carbon uptake. For cement mortar, there are three kinds of use: rendering and plastering mortar, maintenance and repairing mortar, and masonry mortar. Concrete and mortar loss are both carbon sinks for construction-loss cement. The carbon uptake of CKD occurs during landfill disposal. Table 1 lists the carbon sequestration accounting equations for different cement materials.
2.4 Projection of 2024 cement uptake
We provide a projection of cement process carbon emissions and uptake for 163 countries and regions for the year 2024. We use the autoregressive integrated moving average model, or “ARIMA(p,d,q)”, which is a time-series analysis method commonly used for yield forecasting. This regression-based model forecasts values by regressing the variable's past values using various lag lengths, along with the current and past values of the error term (Cox and Vladescu, 2023). Based on extensive long-term cement production data spanning from 1928 to 2023 for 163 countries and regions, we use the ARIMA model to forecast cement production for the year 2024 and then cross-validate the model (see “SI data 1” in Table S1 for details). Our forecasts are further validated by industry economic reports from major cement-producing nations. For example, the “2023 Cement Industry Economic Operation Report” published by the China Cement Association (CCA, 2024) considered upstream raw materials prices and the downstream real estate market and projected a 2 %–3 % decline in cement production by 2024. This prediction aligns with our model's 2.1 % decline. Similarly, for the USA, the USGS provided monthly data on cement production, showing a 4 % year-over-year decline in the first half of 2024, which is consistent with our model's trend prediction. The 2024 cement clinker consumption data are adjusted based on import and export data in recent years and used to forecast cement carbon uptake in 2024.
2.5 Uncertainty analysis
We employed the Monte Carlo method suggested by the IPCC to simulate cement carbon emissions and uptake 10 000 times in order to assess the uncertainty in cement production process emissions and carbon sequestration in cement materials. The results of the uncertainty accounting are given in Table S4 in the Supplement (available from https://doi.org/10.5281/zenodo.14583866, Wu et al., 2024). We identified 24 variables that contribute to uncertainty in cement carbon uptake. This count is two less than previous version due to the revised cement clinker production and clinker-to-cement ratio. The 24 variables include the following: 3 variables related to cement clinker, namely the CaO content, MgO content, and proportion of CaO converted to CaCO3; 10 variables for concrete, including the strength class, proportion of cement for concrete, carbonation rate, building lifespan, particle size distribution, demolition exposure time, and correction factor; 6 variables for mortar, including the proportion of cement for mortar, type of utilization, mortar thickness, and carbonation rate; 2 variables for building loss, including the utilization ratio and carbonation period; and 3 variables for CKD, including the production rate, landfill ratio, and CaO content.
Compared to our previous study, this study reduces the uncertainty in global cement carbon uptake estimations. The improvements in accuracy are reflected in three aspects:
-
The activity data used in this study are based on the annual apparent consumption of cement clinker in each country, which is adjusted by the international trade (import–export) of clinker. These updated national-level activity data reduce the uncertainty range of [−30.0 %, 30.6 %] in previous estimations, which arose due to the approximated substitution of cement production data for consumption data.
-
The clinker-to-cement ratios used in the previous versions were based on values recommended by the IPCC guideline (86 %, with an uncertainty range of [75 %, 97 %]), whereas we have refined the clinker-to-cement ratio in this study by conducting an annual fitting for each country, which further reduces the uncertainty.
-
We updated the country-specific cement carbonation parameters, including the cement utilization proportion in concrete and mortar, concrete strength classes, and building lifespan, which greatly improved the accuracy compared to using global, clustered parameters for carbon uptake calculation in our previous reports.
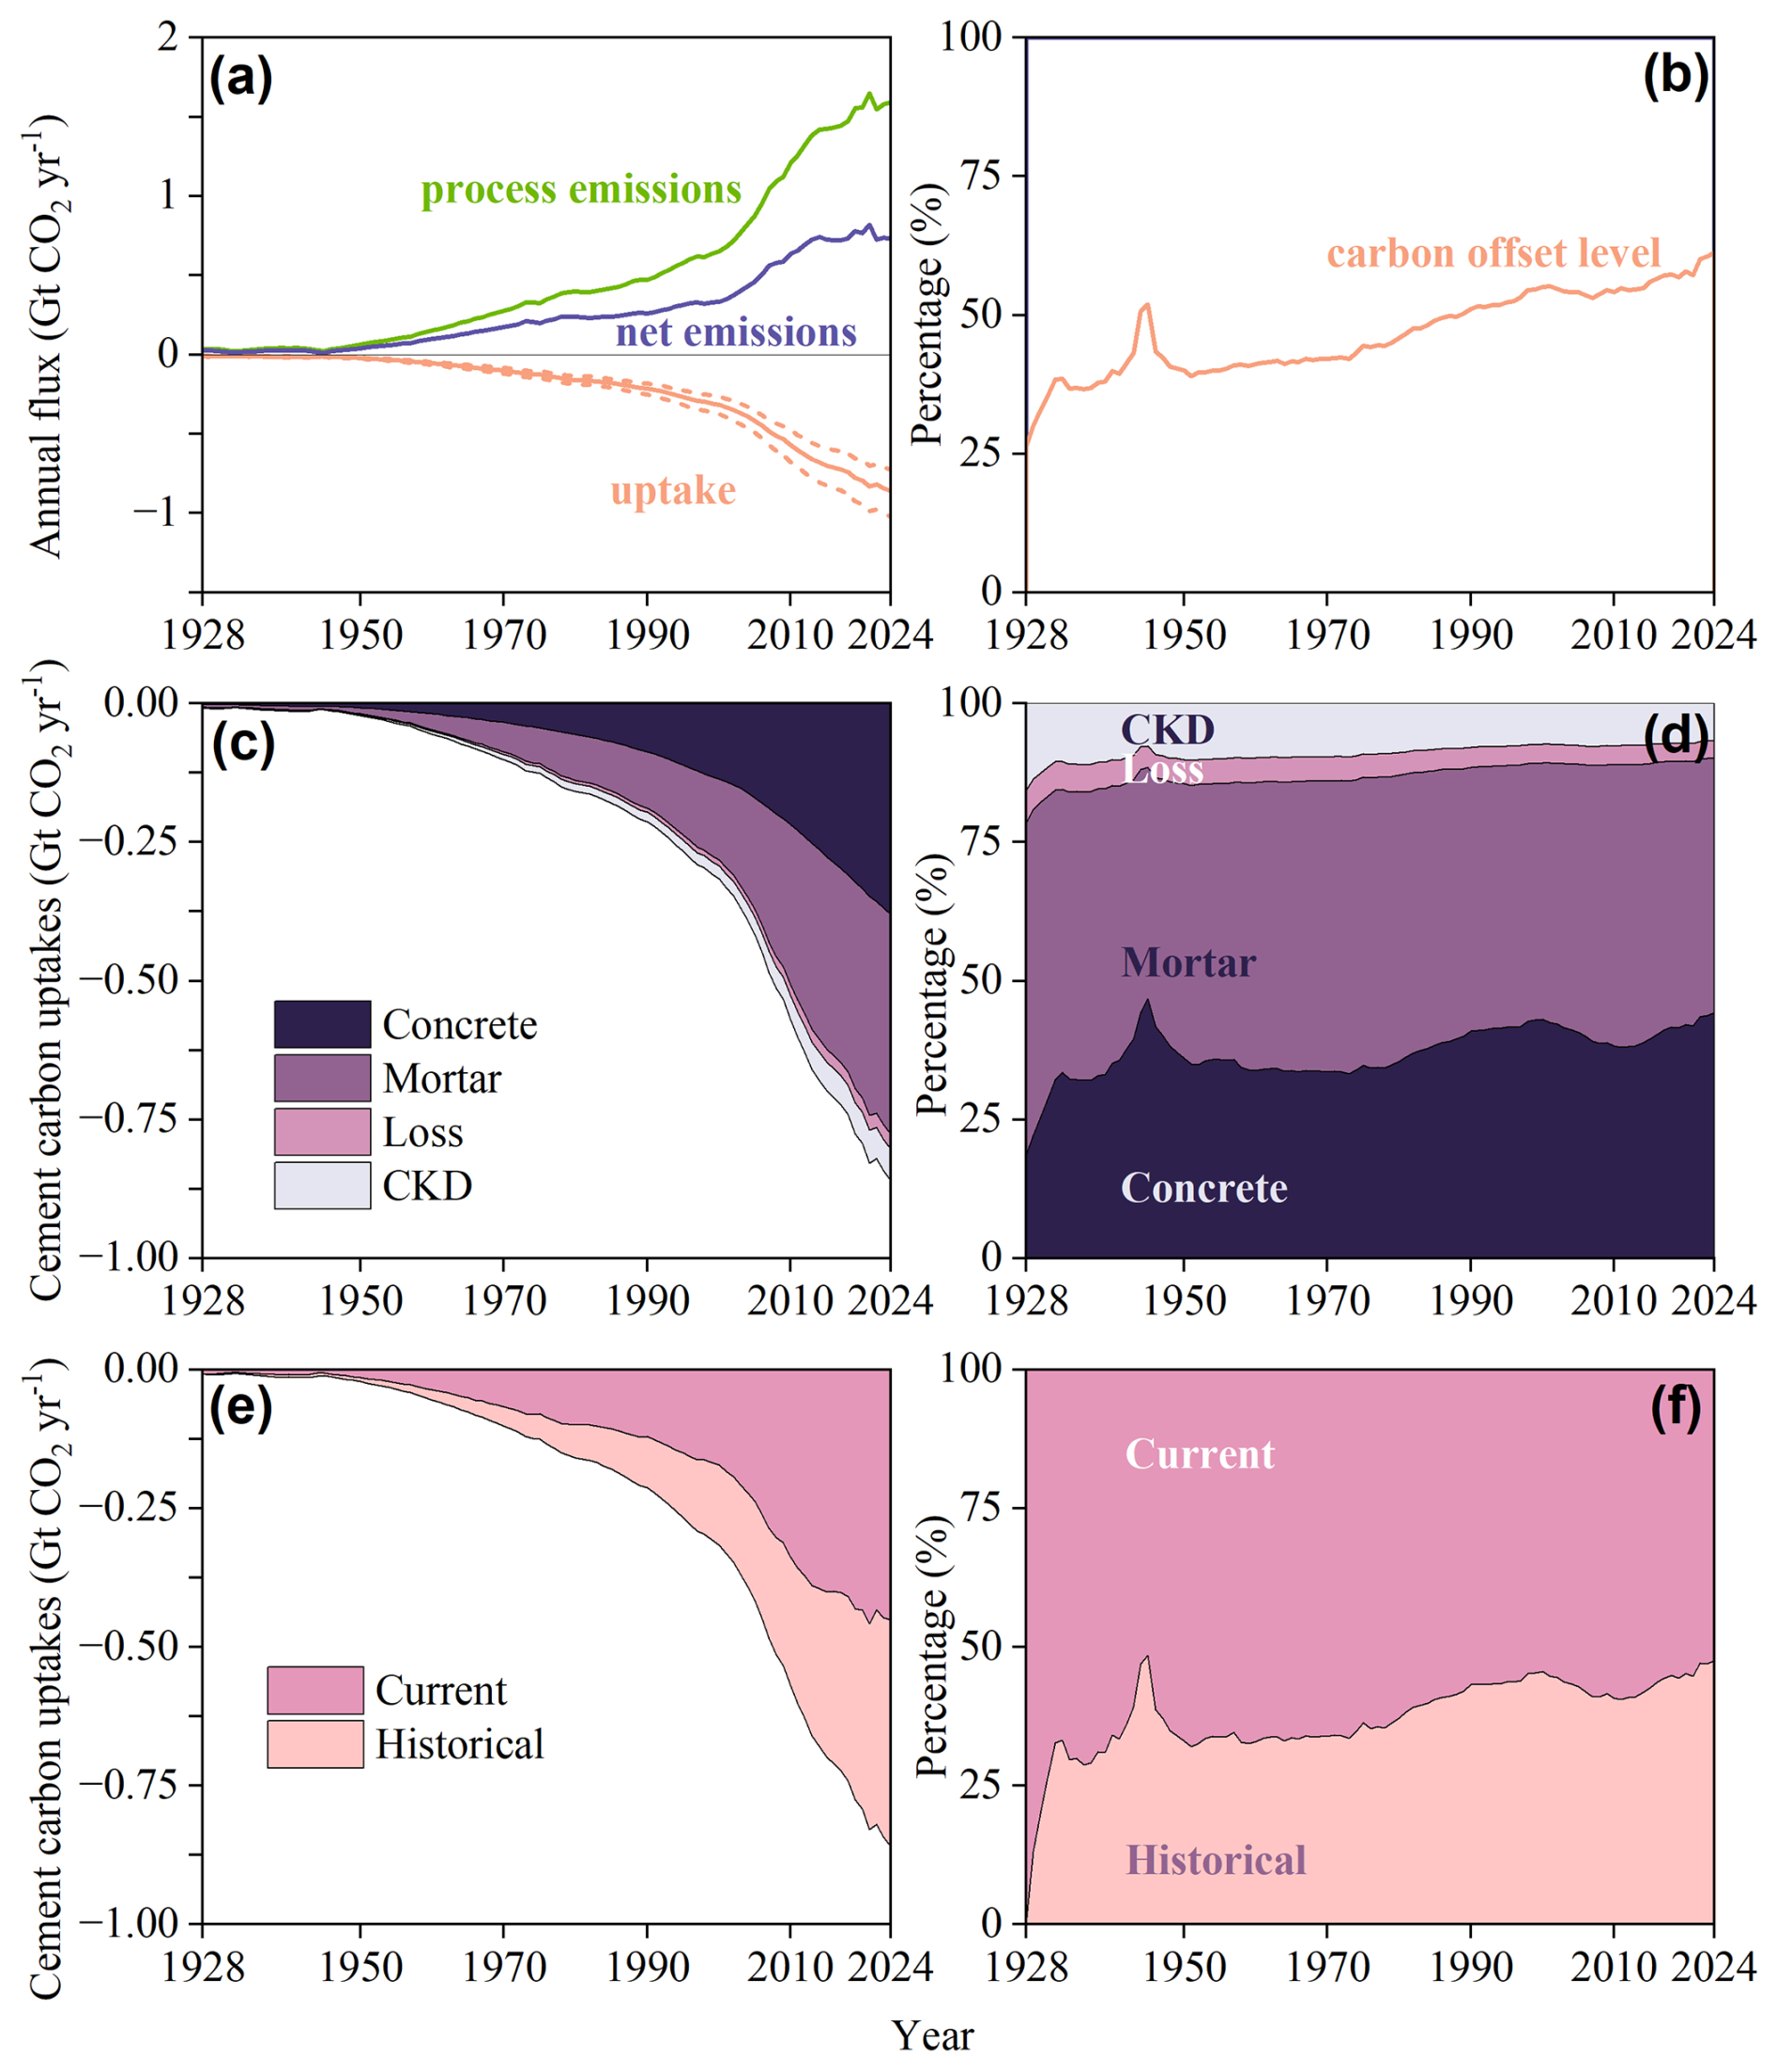
Figure 1Global cement CO2 uptake. (a) Global annual process CO2 emissions and uptake by cement. (b) Carbon offset level (share of CO2 uptake to emissions). (c) Global annual CO2 uptake by four cement materials. (d) Share of CO2 uptake by four cement materials. (e) Global annual cement CO2 uptake in the current and historical year. (f) Share of CO2 uptake by current and historical year. The detailed data used to obtain the results are given in Table S3 in the Supplement (available from https://doi.org/10.5281/zenodo.14583866, Wu et al., 2024).
3.1 Global cement carbon emissions and uptake
3.1.1 Global cement process emissions and carbon uptake
Global cement process emissions increased from 34.58 Mt CO2 yr−1 in 1928 to 1.58 Gt CO2 yr−1 in 2023, with an average annual growth rate of 4.1 % and an accumulated emission value of 46.07 Gt CO2 over past 96 years (Fig. 1a). The increase in global cement process emissions is closely linked to the significant expansion of cement clinker production, which has increased 45-fold since 1928, with an average annual growth rate of 4.1 %. Correspondingly, global carbon uptake by cement increased from 7.74 Mt CO2 yr−1 (95 % CI: 5.84–9.85 Mt CO2 yr−1) in 1928 to 0.84 Gt CO2 yr−1 (95 % CI: 0.71–10.03 Gt CO2 yr−1) in 2023. Notably, 79.2 % of cement carbon sinks have occurred since 1990. The total amount of CO2 uptake by cement over the years is estimated to be 21.26 Gt CO2 (95 % CI: 17.93–25.17 Gt CO2), indicating that cement has reabsorbed approximately 46.1 % of the process emissions from its production process. Unsurprisingly, the carbon offset level (uptake-to-emission ratio; Fig. 1b) shows a clearly increasing overall trend over the past nearly 100 years. This trend is primarily due to the time lag of cement carbonation; unlike the transient carbon process emissions from cement, the gradual accumulation of historical carbon sequestration results in a steady increase in the carbon offset level. This effect becomes particularly evident during periods of declining cement production. For instance, during the Second World War in 1944, when global cement clinker production declined by 28.2 %, the carbon offset level rose to 45.0 %, an increase of 15.8 % compared to the previous year. Conversely, periods of rapid growth in cement process carbon emissions, such as the period between 2000 and 2007, which saw an average annual growth rate of 7.0 % in cement clinker production due to accelerated urbanization and industrialization, witnessed a decline in the carbon offset level at an average annual rate of 0.7 %. This trend is primarily due to the time lag of cement carbonation, such that much of the carbonation occurs in the years following the cement's production. The results show that global cement carbon uptake in 2022 was 0.82 Gt CO2 (95 % CI: 0.69–0.98 Gt CO2 yr−1), representing a decrease of 1.1 % from 2021. This is mainly attributable to the decline in both global cement production and apparent cement consumption in 2022, which decreased by 5.6 % and 6.2 % from 2021, respectively. In particular, as the largest cement producer, China's cement production and apparent consumption decreased by 11.1 %. In 2023, global cement carbon uptake showed a 2.8 % increase from 2022, in which the global cement production declined by 1.4 %, but the apparent consumption of cement clinker increased by 2.0 %. This suggests a strong correlation between cement carbon uptake and cement consumption. A modest recovery in global cement consumption is anticipated for 2024, primarily driven by rapidly growing markets in Southeast Asia and Africa (Cheng et al., 2023). This recovery is expected to correspond to a continuation of growth in the global cement carbon uptake, which is forecast to reach 0.86 Gt CO2 (95 % CI: 0.73–10.23 Gt CO2 yr−1), marking an increase of 2.0 % from the 2023 levels.
3.1.2 Global carbon uptake by different cement products
The carbon uptake of all cement material types has increased steadily (Fig. 1c). Mortar is the most important cement product for CO2 sequestration, with an average annual uptake of 0.37 Gt yr−1 (95 % CI: 0.32–0.42 Gt CO2 yr−1) in the last decade (2014–2023), accounting for 48.0 % of the total (Fig. 1d). This is largely explained by mortar's much higher surface-to-volume ratio compared with concrete. Since 1928, mortar's CO2 uptake has increased from 4.64 Mt yr−1 (95 % CI: 3.55–5.95 Mt yr−1) to 0.39 Gt yr−1 (95 % CI: 0.34–0.44 Gt yr−1), with an average annual growth rate of 4.7 %. The CO2 uptake by concrete has also played a significant role, with an average annual uptake of 0.32 Gt yr−1 in the last decade, contributing to 41.5 % of the total. Its uptake increased from 1.43 Mt yr−1 (95 % CI: 1.11–1.67 Mt yr−1) in 1928 to 0.37 Gt yr−1 (95 % CI: 0.31–0.45 Gt yr−1) in 2023, with an average annual growth rate of 6.0 %. CKD and construction-loss cement absorbed respective amounts of 0.05 and 0.025 Gt CO2 yr−1 in last decade, contributing corresponding values of 7.2 % and 3.3 % of the total carbon uptake, with average annual corresponding growth rates of 4.1 % and 4.4 % from 1928 to 2023. We project that mortar, concrete, CKD, and construction loss in 2024 will absorb 0.40, 0.38, 0.06, and 0.027 Gt CO2 yr−1, respectively. With respect to the share of carbon sinks of different cement materials, we find that the share of concrete carbon uptake has similar trend to the carbon offset level (Fig. 1b). Notably, concrete is the main material contributing to the time-lag effect of cement carbon sinks; this is due to its exposure conditions and larger fragment particle size, which reduce the carbonation occurring within the first year. The significant carbon sequestration of cement materials makes them one of the important carbon sinks in the global carbon cycle. It is necessary to strengthen the carbonation management of cement materials during the waste disposal and recycling stage. For example, many studies have explored the mechanisms and properties of accelerated carbonation in cement materials, such as waste concrete (Mo and Panesar, 2013) and CKD (Pu et al., 2023). Certainly, carbon capture is widely regarded as the only viable solution for significantly reducing CO2 emissions from cement production in order to meet the 2050 mitigation targets (Schneider, 2019); however, further research is required to assess the economic costs and potential risks associated with its implementation.
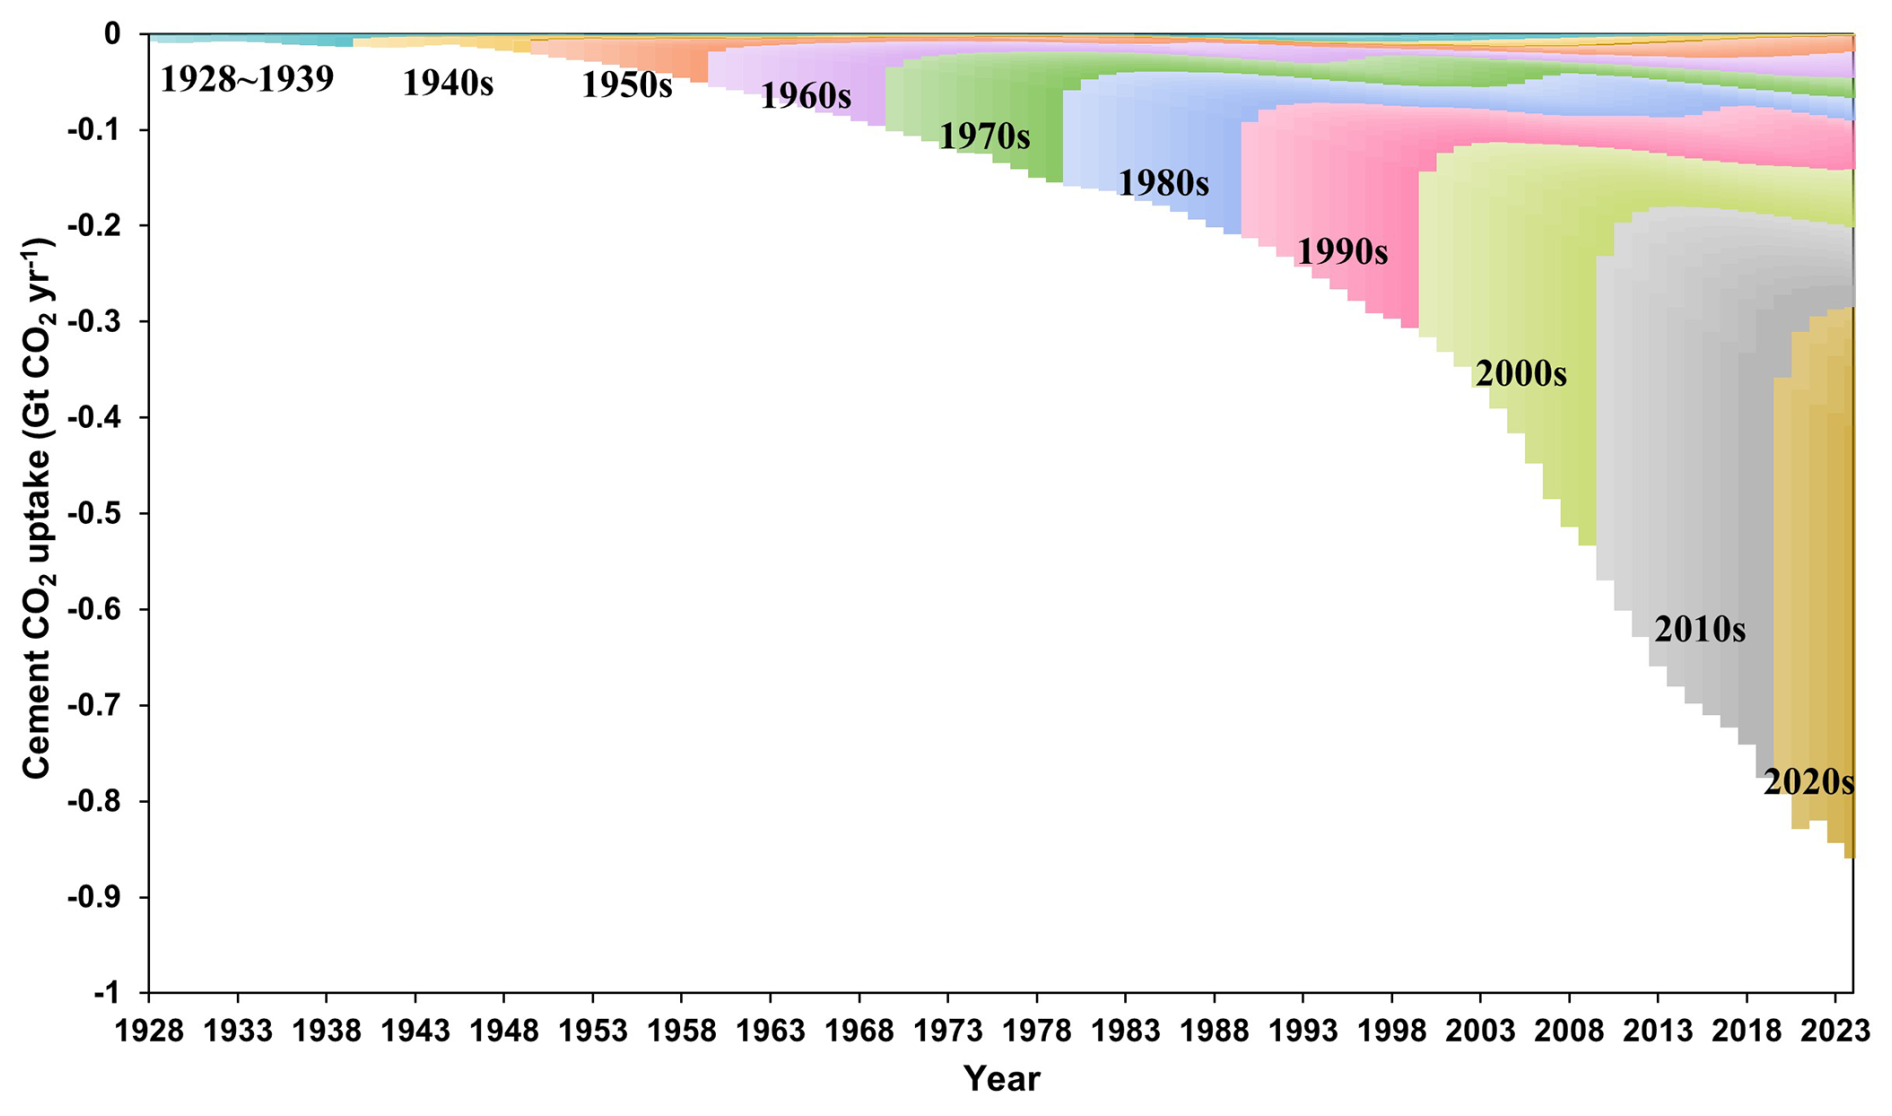
Figure 2Time-lag effect on carbon uptake by cement from 1928 to 2024. Different colours represent changes in carbon sequestration over time for different years of cement consumption.
3.1.3 Time-lag effect of cement carbon uptake
The cement carbon uptake values in both the current year and historical year show an increasing trend (Fig. 1e). The current-year carbon uptake, which represents the absorption of CO2 by cement produced in the current year, increased from 9.08 Mt CO2 yr−1 in 1928 to 0.54 Gt CO2 yr−1 in 2023, with an average annual growth rate of 4.4 %. In contrast, the historical-year uptake refers to carbon uptake due to the incomplete carbonization of cement material consumed in the previous years, which continues to carbonize in the current year. This process increased historical-year uptake to 0.42 Gt yr−1 in 2023. Our projections indicate that, for 2024, the current-year uptake and historical-year uptake will reach 0.45 and 0.41 Gt CO2 yr−1, respectively, with corresponding increases of 0.9 % and 3.2 % compared to 2023. Current-year uptake is the main contributor to the global cement uptake, with an average annual share of 62.7 % during the 1928–2023 period (Fig. 1f). It is noteworthy that the trend in the share of historical-year uptake aligns with the carbon offset level. In 1944, when cement consumption decreased, the share of historical-year carbon uptake rose to 47.0 %. Conversely, during the period from 2000 to 2007, when cement consumption increased rapidly, the share of historical-year carbon uptake decreased at an average rate of 1.5 %. This pattern suggests that the carbon offset level of cement carbonation sinks will increase as cement production and consumption decline in the future. Specifically, the annual carbonation rate of cementitious materials shows a steady decline (Fig. 2). Mortar and CKD, with their faster carbonation rates, are the primary cement materials contributing to current-year uptake, whereas concrete is the main material resulting in the time-lag effect of cement carbon sinks (Fig. 2); this is because the natural carbonation of concrete cannot be completed in 1 year (Pan et al., 2016), and the carbonation rate gradually slows down (Qiu, 2020). For example, the carbon uptake of cement consumed in 1990 was 121 Mt, while the sequestration from the same cement had decreased to only 2.0 Mt by 2023.
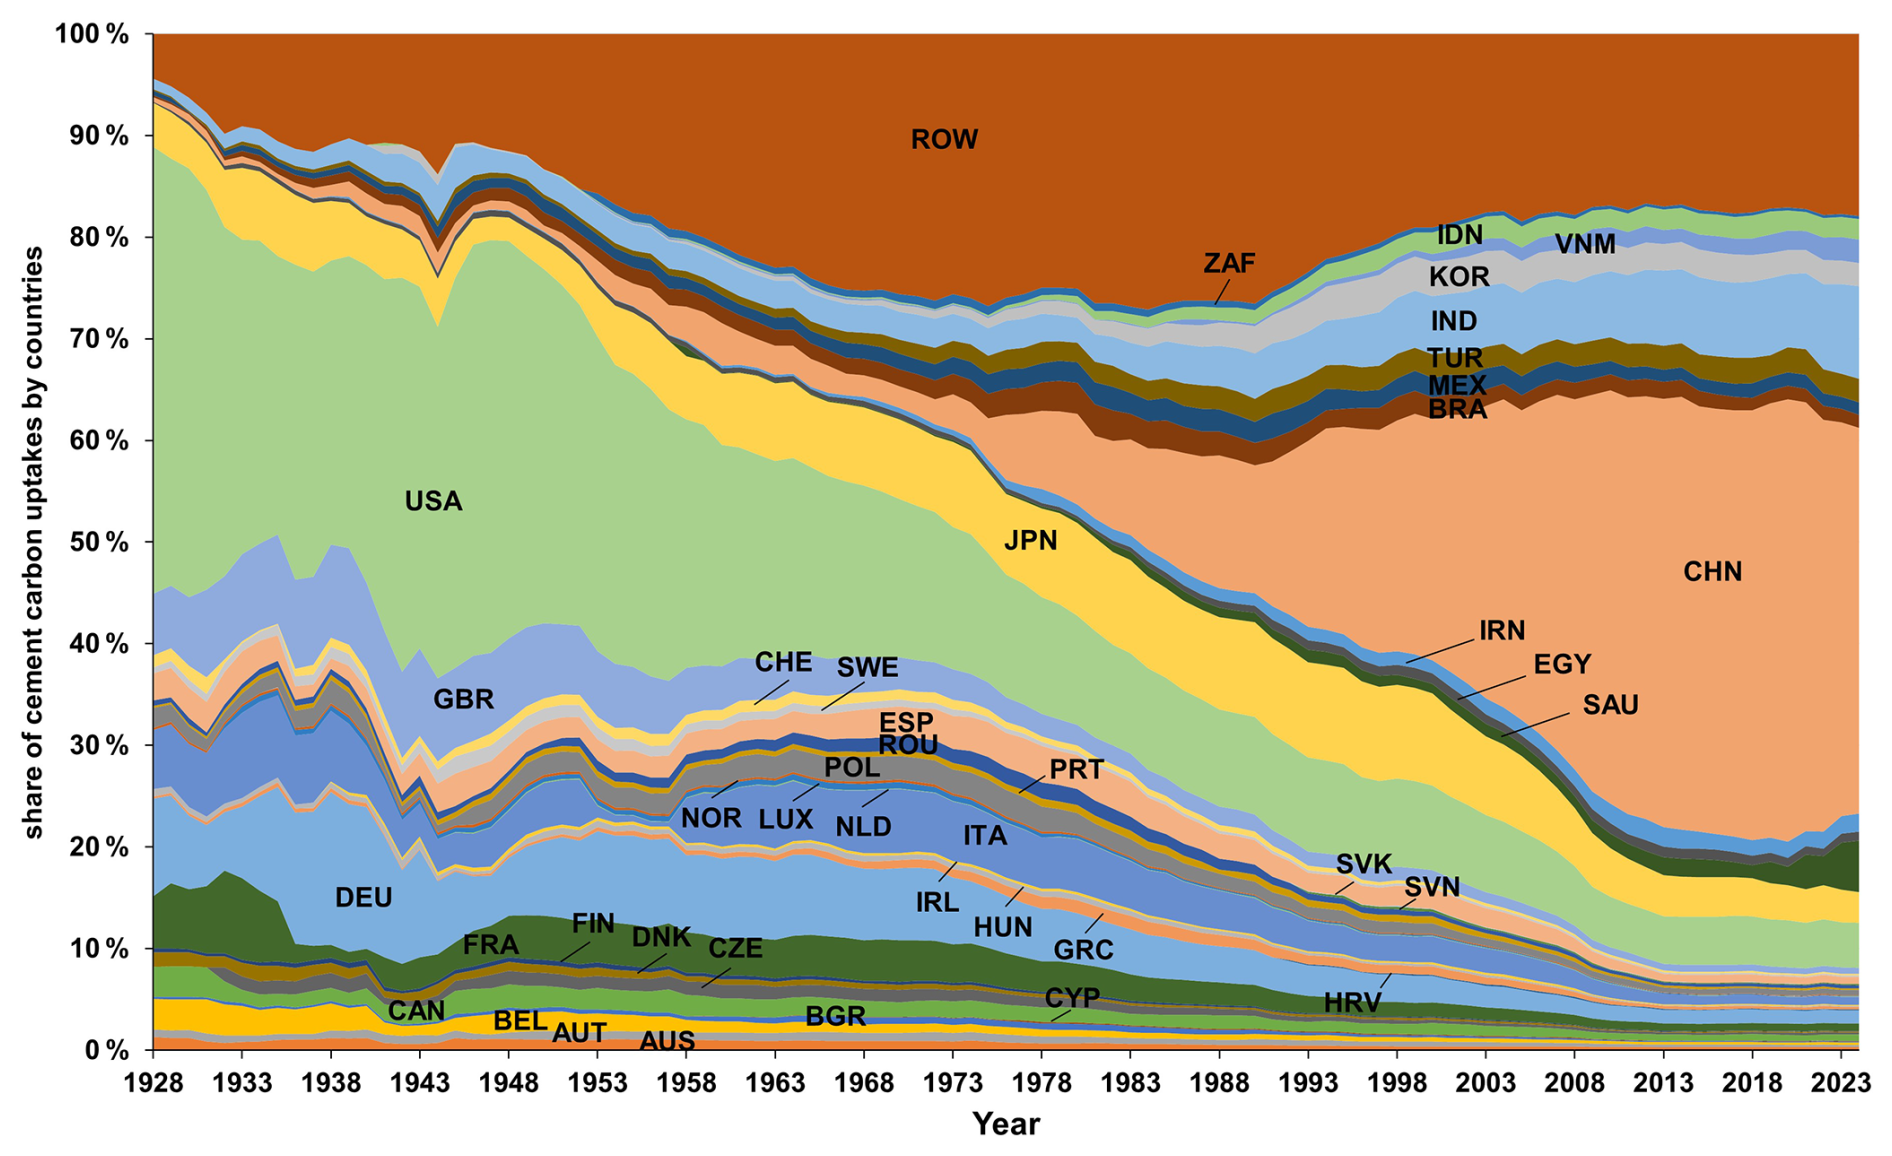
Figure 3Share of cement carbon uptake from 1928 to 2023 for 42 countries and the rest of the world (ROW). The full names corresponding to the country abbreviations are as follows: AUS (Australia), AUT (Austria), BEL (Belgium), BGR (Bulgaria), CAN (Canada), HRV (Croatia), CYP (Cyprus), CZE (Czechia), DNK (Denmark), FIN (Finland), FRA (France), DEU (Germany), GRC (Greece), HUN (Hungary), IRL (Ireland), ITA (Italy), LUX (Luxembourg), NLD (the Netherlands), NOR (Norway), POL (Poland), PRT (Portugal), ROU (Romania), SVK (Slovakia), SVN (Slovenia), ESP (Spain), SWE (Sweden), CHE (Switzerland), GBR (the United Kingdom), the USA (USA), MEX (Mexico), BRA (Brazil), EGY (Egypt), TUR (Türkiye), IRN (Iran), SAU (Saudi Arabia), IND (India), CHN (China), KOR (South Korea), JPN (Japan), VNM (Vietnam), IDN (Indonesia), and ZAF (South Africa).
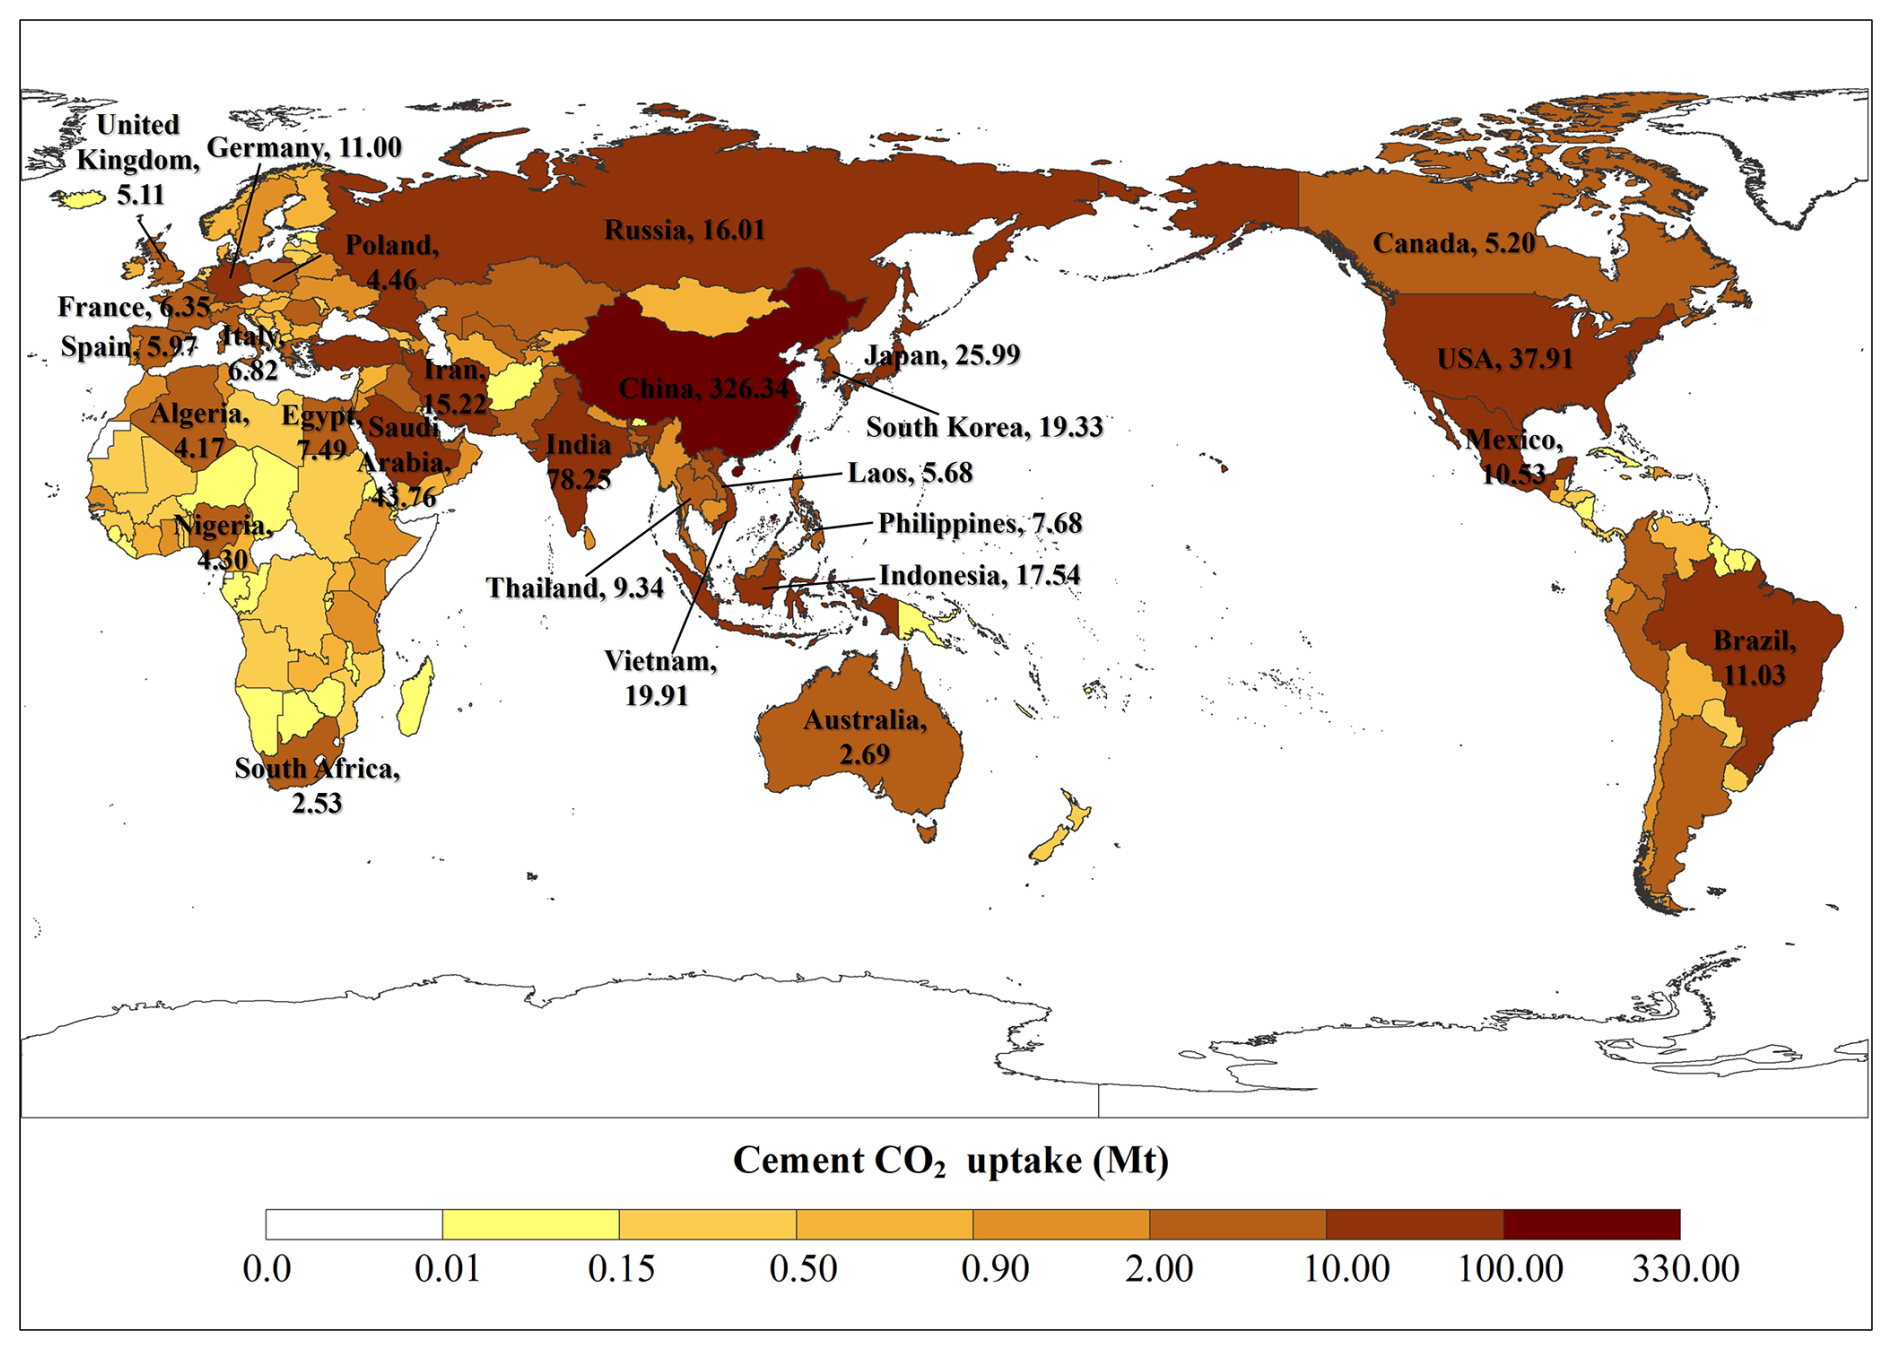
Figure 4Spatial distributions of cement CO2 uptake in 2024 (©Institute of Geographic Sciences and Resources of the Chinese Academy of Sciences, with no modifications to the base map). Publisher's remark: please note that the above figure contains disputed territories.
3.2 Spatial distribution of cement carbon uptake
In this study, we gathered carbonation parameters from 42 countries to enrich the cement uptake accounting model. Figure 3 shows the share of cement CO2 uptake for 42 countries and the rest of the world (ROW) during the period from 1928 to 2023. The accumulated carbon uptake by cement in these 42 countries was 16.60 Gt CO2 over the past 96 years, accounting for 78.1 % of the global total. Their contributions peaked in 1928 (95.6 %) and were minimal in 1984 (72.9 %). It is evident that cement CO2 uptake by China and other emerging economies, including South Africa, Indonesia, Vietnam, Korea, India, Türkiye, Mexico, and Brazil, has gradually replaced the leading roles played by the USA, Japan, and Canada as well as European countries like the United Kingdom, Spain, Italy, Germany, France, and Belgium after 1982. Specifically, the USA was the largest contributor to cement carbon uptake, with an average contribution of 23.6 %, between 1928 and 1991. From 1928 to 1966, Germany and the United Kingdom were major contributors alongside the USA, with respective contributions of 8.7 % and 6.9 %. From 1967 to 1982, Japan became the second-largest contributor, with an average contribution of 8.2 %. Subsequently, between 1983 and 1991, China replaced Japan with an average contribution of 11.9 %. Since 1992, China has been the country with largest cement carbonation sink, reaching a maximum contribution of 43.5 % in 2020. Additionally, since 2008, India has been the second-largest contributor, replacing Japan's position during 1992–2006. In 2023, the cement carbon uptake values in China and India were 0.33 Gt CO2 yr−1 (38.0 % of global, CI: 0.25–0.41 Gt yr−1) and 0.07 Gt CO2 yr−1 (9.1 %, 0.06–0.09 Gt yr−1), respectively.
Based on the clinker production data for 163 countries and regions worldwide and the carbonation parameters for 42 countries, we estimated and projected the carbon uptake across these 163 entities. From the spatial distribution of the cement CO2 uptake in 2024 (Fig. 4), we found that the dominant countries with respect to carbon uptake by cement are still distributed in Asia, particularly due to the region's high demand for infrastructure development. China leads the global carbon uptake charge, with 326.84 Mt CO2 (44.0 % of the total), followed by India and Saudi Arabia, with 78.25 and 43.76 Mt CO2, respectively. Japan and South Korea are ranked 7th and 10th, with sequestration values of 25.99 and 19.33 Mt CO2, respectively. Southeast Asian countries like Vietnam, Indonesia, Thailand, the Philippines, and Laos also contribute significantly, sequestering 19.91, 17.54, 9.34, 7.68, and 5.68 Mt CO2, respectively. For the Americas, the main countries with respect to CO2 uptake are the USA, Brazil, Mexico, and Canada, with 37.91, 11.03, 10.53, and 5.20 Mt, respectively; these countries are ranked 4th, 12th, 14th, and 28th in the world with respect to uptake. In Africa, cement carbon uptake is concentrated in Egypt, Nigeria, Algeria, and South Africa, which sequester 7.49, 4.30, 4.17, and 2.53 Mt CO2, respectively. In Europe, key countries for CO2 sequestration via cement are Germany, Italy, France, Spain, the United Kingdom, and Poland, with values of 11.00, 6.82, 6.35, 5.97, 5.11, and 4.46 Mt, respectively.
Table 2List of country classifications.
“Peaked” denotes that emissions have reached a peak, whereas “Non-peaked” denotes that emissions have not yet reached a peak.
3.3 National cement carbon emissions and uptake
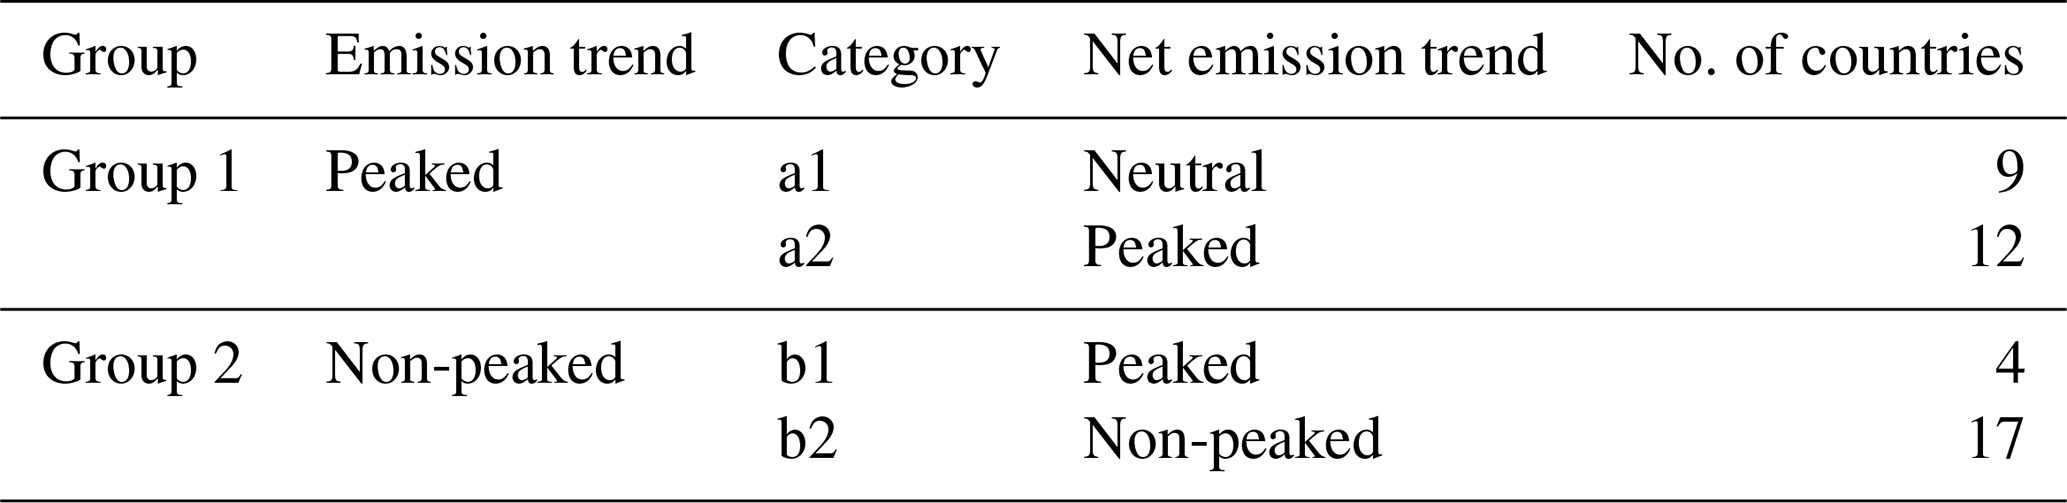
In this study, we enriched the national cement process carbon emission and uptake database. We categorized the countries into two sets according to the trends in their cement process carbon emission curves (Table 2). Group 1 comprises 21 countries in which the process carbon emissions have shown a peak in their emission trend during 1928–2024. These countries can be further divided into two categories based on their net emission trends: 9 countries with a neutral trend (category a1) and another 12 countries that have peaked but do not exhibit a neutral trend (category a2). Meanwhile, Group 2 includes 21 countries in which the process carbon emissions are still increasing and have not yet peaked, but their net emission trends encompass both countries that have reached a peak (“peaked”, category-b1 countries) and countries that have not yet reached a peak (“non-peaked”, category-b2 countries), comprising 4 and 17 countries, respectively.
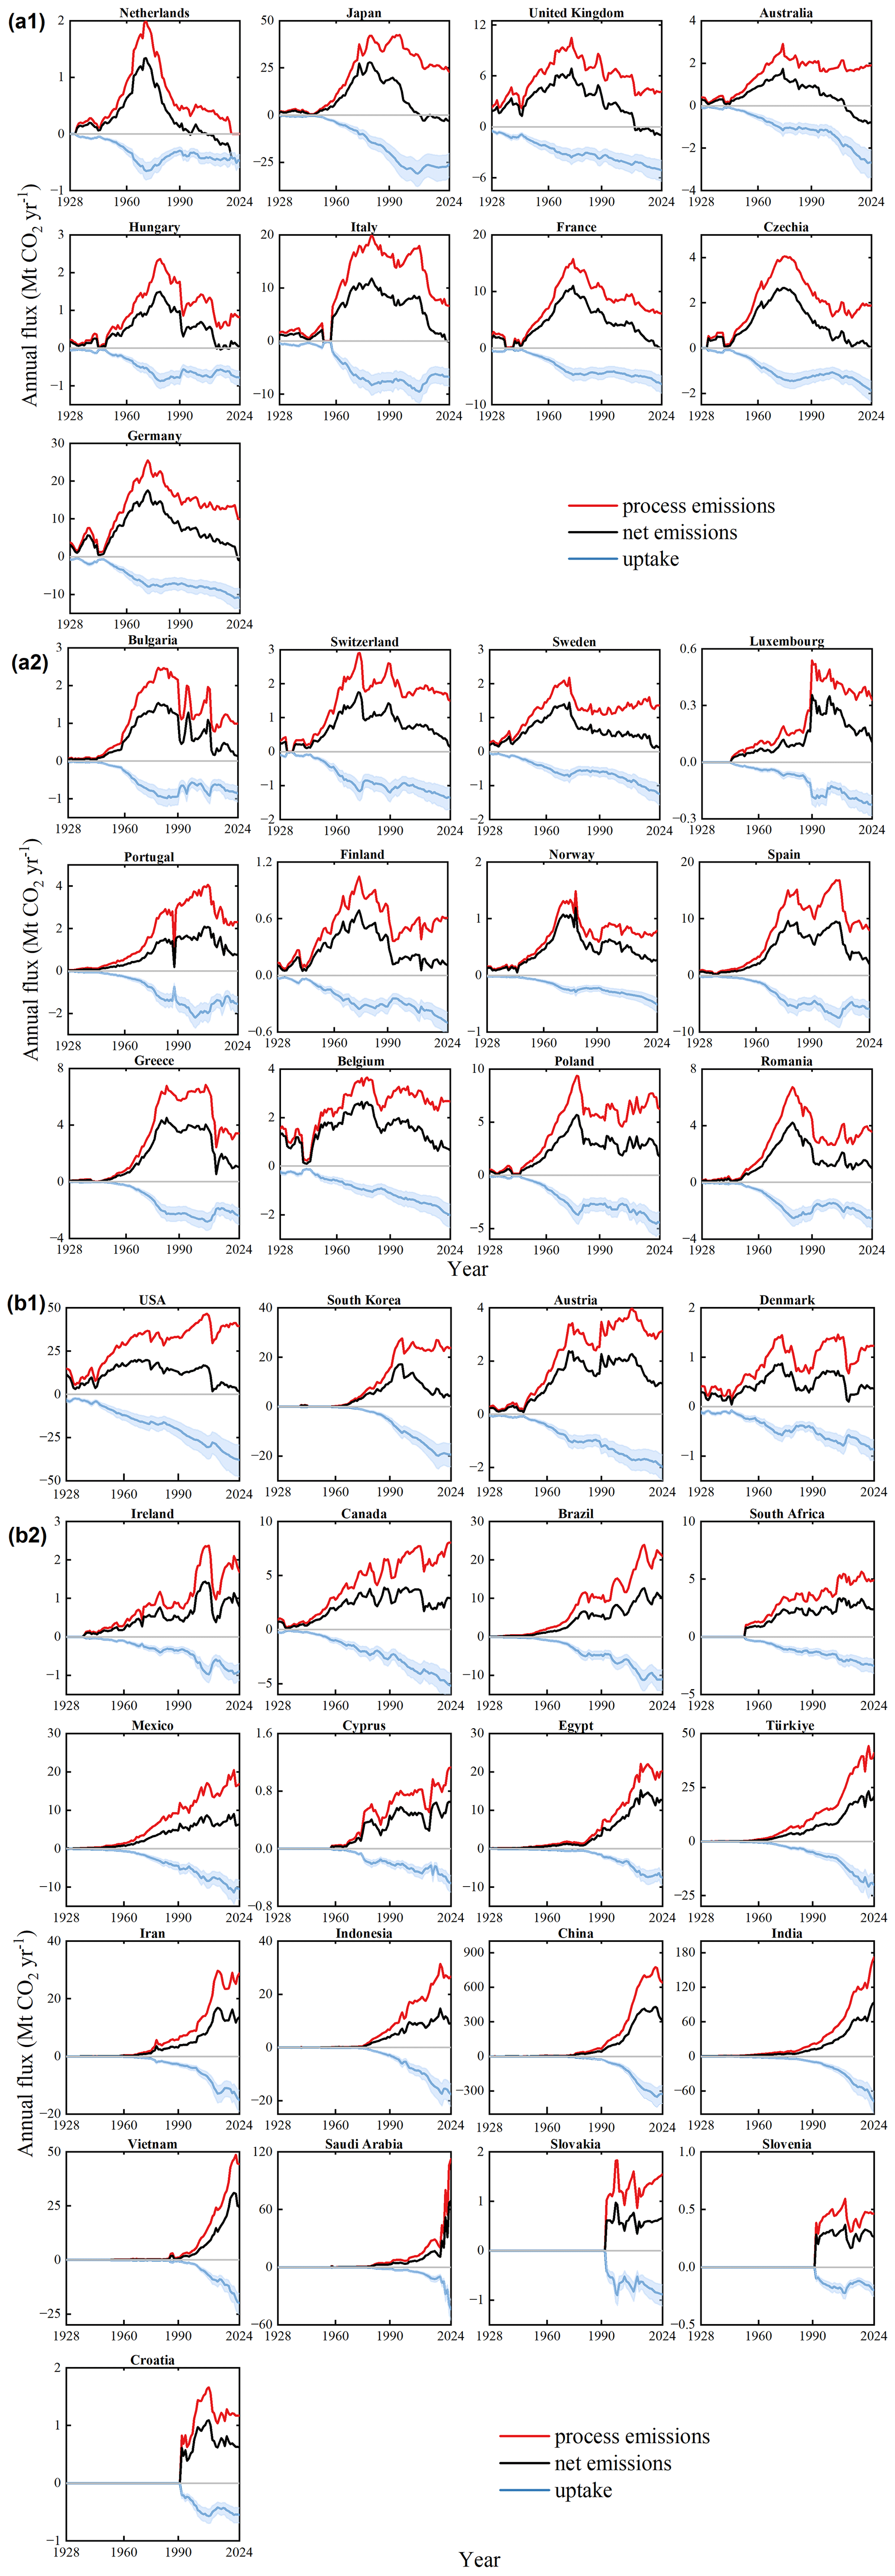
Figure 5Cement carbon process emissions and uptake in 42 countries during 1928–2024. Panel (a) presents the 21 countries in Group 1 for which the cement process emissions have reached a peak. Panel (b) presents the 21 countries in Group 2 for which the process carbon emissions have not yet peaked.
Figure 6Comparison of trends in process carbon emissions and uptake in peaked and non-peaked countries.
Figure 5 shows cement process carbon emissions and uptake for 42 countries from 1928 to 2024. Group 1 (Fig. 5a) predominantly comprises European countries, which were early producers and consumers of cement. In category-a1 countries, carbon emissions from cement production have peaked and followed a steady decline, but carbon sinks from cement consumption in these countries have not decreased, resulting in net-zero or even negative emissions with increasing uptake. For instance, cement process emissions in Australia peaked at 2.91 Mt in 1974 and then decreased at an average rate of 0.8 %. In contrast, Australia's cement carbon uptake was 1.17 Mt in 1974 (offset level 40.3 %) and then continued to rise, especially from 2000 to 2024, with an average rate of increase of 3.3 %. By 2009, net cement emissions had become negative (−0.02 Mt CO2 yr−1), and they reached −2.7 Mt CO2 yr−1 in 2024. This is due to the fact that, despite Australia producing less clinker than it used to, the country's cement consumption has not decreased owing to substantial clinker imports, with an import penetration ratio of 52.8 % in 2023. Countries like the Netherlands, Japan, the United Kingdom, Hungary, Italy, France, Czechia, and Germany have exhibited similar trends. In category-a2 countries, the net emissions are not yet neutral, but offsets from cement carbon sequestration effectively reduce actual cement emissions. For instance, in most category-a2 countries, like Sweden, Luxembourg, Finland, Norway, and Belgium, the increase in cement carbon uptake outpaces the growth of process carbon emissions, leading to a rapid decline in net emissions after the peak year.
In Group-2 countries (Fig. 5b), the cement process emissions have not peaked. However, net emissions have peaked in category-b1 countries, such as the USA, South Korea, Austria, and Denmark, due to carbon sequestration by cement consumption. For instance, due to a constant demand for cement in the USA, process carbon emissions are expected to have reached 39.57 Mt CO2 in 2024. However, as the leading importer of cement, the USA has shown a peak in the trend in net emissions when considering the carbon uptake of cement. Specifically, from 2009 to 2024, the average carbon offset level in the USA has been 89.0 %. The non-peaked (category-b2) countries are primarily developing countries, and their cement production and consumption have expanded significantly, albeit later than Group-1 countries. China, India, Vietnam, Iran, and Indonesia are notable examples, having experienced rapid growth in cement demand after the 1980s. The accumulated carbon uptake from cement in these countries between 1980 and 2023 accounts for more than 95 % of their totals from 1928 to 2023. Notably, Saudi Arabia has recently witnessed a sharp increase, with 39.21 Mt of cement CO2 uptake in 2023, an 1.7-fold increase compared to 2020, likely due to its recent economic diversification policies. Due to the higher production and lower imports in category-b2 countries, the trends in process emissions and uptake from cement in these countries are similar, with net emissions increasing in line with the process emissions. It is worth mentioning that some countries in category b2 have shown decreasing trends in recent years. For instance, the cement process emissions in China, Brazil, and Ireland have decreased for 3 consecutive years (2022–2024). However, these decreases primarily stem from the decline in cement production, rather than from offsets in the cement carbonation sink, as their carbon uptake values also show a decreasing trend, with projections of −1.1 %, −1.1 %, and −5.0 % for 2024, respectively. In summary, the carbon offset by cement CO2 uptake is more significant in peaked countries than in non-peaked countries. Nowadays, many studies have indicated carbon leakage due to outsourcing from these peaked countries (Allevi et al., 2017; Grubb et al., 2022), and our results show that the gap in cement process carbon emissions between countries will further widen if the carbon uptake is taken into account.
A time lag in cement process carbon emissions and uptake exists among different countries. The majority of Group-2 countries are in the initial phases of cement production compared to Group-1 countries. As shown in Fig. 6, the trends for four countries are comparable with respect to cement production levels but vary with respect to their peak years. Germany and France, which began using cement before 1930, experienced a rapid increase in cement process carbon emissions and uptake during 1950s–1970s, peaking in the 1970s. Korea and Ireland has similar trends, although with about a 20-year time lag.
3.4 Uncertainty analysis
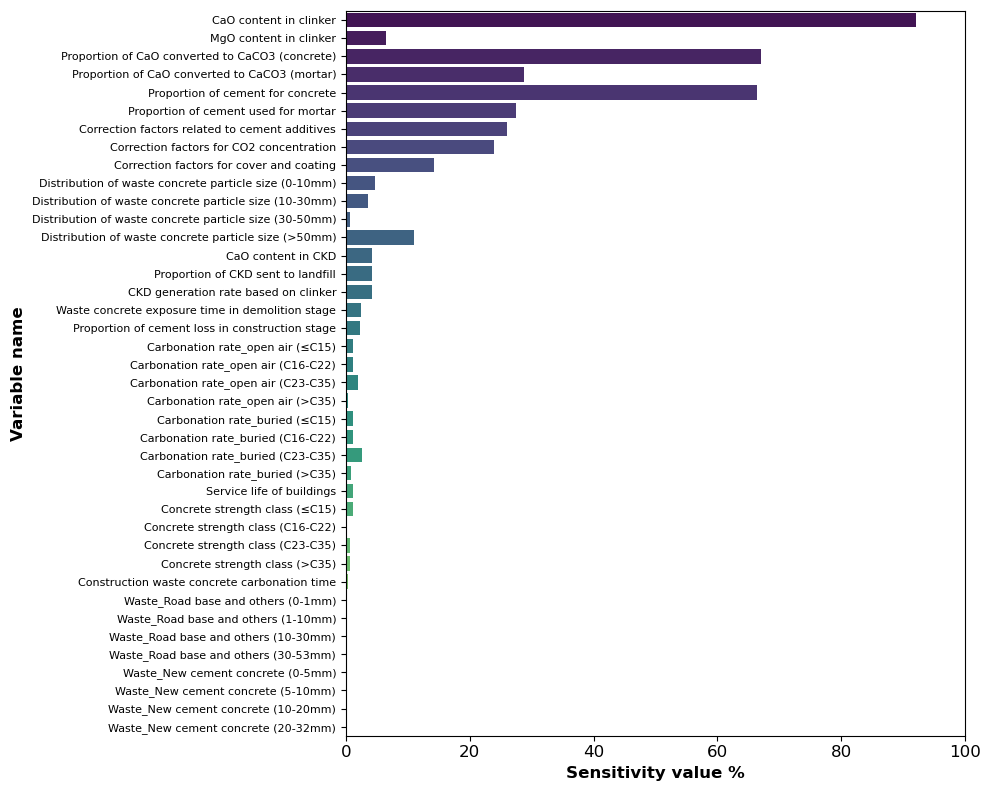
This study uses the Monte Carlo method to simulate carbon uptake from cement 10 000 times in order to evaluate the uncertainty. The results reveal that the 95 % confidence interval for accumulated carbon uptake spanning from 1928 to 2024 ranges from 17.93 to 25.17 Gt CO2. The uncertainties associated with carbon sequestration from cement for each country are detailed in Table S4 in the Supplement. Our accounting is based on the accounting model of Xi et al. (2016), and the variable entries and sensitivity values are basically consistent with this prior work (Fig. 7). A key difference in our approach is that we have removed the two variables of “Proportion of clinker in cement” and “Ratio of cement consumption to production”, as we use a more accurate cement clinker consumption in this study. For specific parameters, “CaO content in clinker” (92.0 %) has the greatest impact on the scale of carbon absorption, as it widely affects the carbon absorption in all stages of cement consumption; moreover, “Proportion of cement used for concrete or mortar” and “Proportion of CaO converted to CaCO3 in concrete or mortar” are also important, with sensitivity values of 66.4 %, and 67.09 %, respectively, due to the fact that these two parameters each affect all stages of carbon absorption by concrete and mortar, and concrete and mortar account for the largest proportion of the total carbon absorption of cement materials. Other parameters have lower sensitivity values, mostly below 10 %, because they only have a slight impact on the local accounting results of the model. Therefore, it is essential to prioritize the more sensitive parameters and ensure their accurate collection and measurement across different countries in order to further minimize the uncertainty in the model's accounting results.
The original datasets utilized for estimating cement process emissions and uptake as well as the results and associated uncertainties in this study can be accessed on Zenodo at https://doi.org/10.5281/zenodo.14583866 (Wu et al., 2024).
In this study, we further advance research on the cement carbon uptake accounting system in order to (1) enrich both the temporal scale (1928–2024) and spatial distribution (163 countries and regions) of the global cement carbon uptake database and (2) provide a more accurate bottom-up quantification. Our study reveals that global and national CO2 uptake from cement material carbonation cannot be negligible. From 1928 to 2023, global cement materials have absorbed an accumulated total of 21.26 Gt CO2 (95 % CI: 17.93–25.17 Gt CO2), offsetting 46.1 % of emissions from the production process. In 2023, global carbon uptake by cement was 0.83 Gt CO2 yr−1 (95 % CI: 0.71–1.00 CO2 yr−1), and a value of 0.86 Gt CO2 yr−1 (95 % CI: 0.73–1.02 CO2 yr−1) was projected for 2024. The updated national-level databases in this study offer more detailed insights into cement carbon uptake. We find that emerging economies have gradually been becoming major contributors to global cement carbon uptake since 1982, with increasing cement production, particularly in China and India. In contrast, some Southwest Asian countries have achieved net-zero cement carbon emissions, after having been major contributors from 1928 to 1981. Moreover, according to the characteristics of carbonation kinetics, cement carbonation is a dynamic process, and the share of carbon uptake from historical legacy will gradually increase. This means that the carbon offset by cement carbonation is expected to be more significant in relative terms as cement production decreases in the future, driven by carbon reduction policies across various countries.
The accounting of global carbon uptake by cement is continually improving, and refinements to activity data and carbonation parameters are critical to ensure an accurate carbon sequestration inventory. In this study, we focus on updating the country-specific cement consumption activity data and carbonation parameters based on concrete materials in their service stage, leveraging the extensive civil engineering research available. Considering the increasing demand for cement in emerging economies and their significant contribution to global carbon uptake, optimizing these parameters for these countries in future work is crucial. It is necessary to refine the carbonation parameters related to concrete demolition and secondary use, as well as other cement products; this is especially true for cement mortar, which consumes less but contributes more to cement carbonation uptake. Efforts should be made to optimize methodology, thereby enabling organizations to rely on better estimates when integrating cement carbonation absorption accounting into national greenhouse gas inventories.
The supplement related to this article is available online at https://doi.org/10.5194/essd-17-2231-2025-supplement.
LN design the study; collected and assembled the data; and prepared, reviewed, and edited the manuscript. SW design the study, conducted modelling, constructed the database, and collected and assembled the data. RMA collected and assembled the data and revised the manuscript. ZS collected and assembled the data. JW revised the manuscript. FX led the project, design the study, and revised the manuscript.
The contact author has declared that none of the authors has any competing interests.
Publisher's note: Copernicus Publications remains neutral with regard to jurisdictional claims made in the text, published maps, institutional affiliations, or any other geographical representation in this paper. While Copernicus Publications makes every effort to include appropriate place names, the final responsibility lies with the authors.
Fengming Xi acknowledges the valuable suggestions provided by Anlin Shao, a member of the Chinese Academy of Engineering.
This research was supported by Technology Innovation and Management of the Whole Process Green Development of Mineral Resources (grant no. 2023-JB-09-07), the Major Program of the Institute for Applied Ecology of the Chinese Academy of Sciences (grant no. IAEMP202201), and the Miljødirektoratet (grant no. 24010001).
This paper was edited by Kuishuang Feng and reviewed by three anonymous referees.
Allevi, E., Oggioni, G., Riccardi, R., and Rocco, M.: Evaluating the carbon leakage effect on cement sector under different climate policies, J. Clean. Prod., 163, 320–337, https://doi.org/10.1016/j.jclepro.2015.12.072, 2017.
Ambec, S., Esposito, F., and Pacelli, A.: The economics of carbon leakage mitigation policies, J. Environ. Econ. Manag., 125, 102973, https://doi.org/10.1016/j.jeem.2024.102973, 2024.
Andrew, R. M.: Global CO2 emissions from cement production, 1928–2018, Earth Syst. Sci. Data, 11, 1675–1710, https://doi.org/10.5194/essd-11-1675-2019, 2019.
Andrew, R. M.: A comparison of estimates of global carbon dioxide emissions from fossil carbon sources, Earth Syst. Sci. Data, 12, 1437–1465, https://doi.org/10.5194/essd-12-1437-2020, 2020.
Bhyan, P., Shrivastava, B., and Kumar, N.: Systematic literature review of life cycle sustainability assessment system for residential buildings: Using bibliometric analysis 2000–2020, Environ. Dev. Sustain., 25, 13637–13665, https://doi.org/10.1007/s10668-022-02636-5, 2023.
CEIC Data: Building Work Completed, CEIC Data [data set], https://www.ceicdata.com/zh-hans (last access: 25 August 2024), 2023.
China Cement Association (CCA): Cement Industry Economic Operation Report 2023. China Cement Association, http://www.ccawz.com/chinacca/ (last access: 4 August 2024), 2024.
Cheng, D., Reiner, D. M., Yang, F., Cui, C., Meng, J., Shan, Y., Liu, Y., Tao, S., and Guan, D.: Projecting future carbon emissions from cement production in developing countries, Nat. Commun., 14, 8213, https://doi.org/10.1038/s41467-023-43660-x, 2023.
Coffetti, D., Crotti, E., Gazzaniga, G., Carrara, M., Pastore, T., and Coppola, L.: Pathways towards sustainable concrete, Cement Concrete Res., 154, 106718, https://doi.org/10.1016/j.cemconres.2022.106718, 2022.
Cox, D. J. and Vladescu, J. C.: Chapter 9 – This math and time thing is cool! Time series decomposition and forecasting behavior, in: Statistics for Applied Behavior Analysis Practitioners and Researchers, edited by: Cox, D. J. and Vladescu, J. C., Academic Press, https://doi.org/10.1016/B978-0-323-99885-7.00002-7, 225–249, 2023.
Davis, S. J., Lewis, N. S., Shaner, M., Aggarwal, S., Arent, D., Azevedo, I. L., Benson, S. M., Bradley, T., Brouwer, J., Chiang, Y.-M., Clack, C. T. M., Cohen, A., Doig, S., Edmonds, J., Fennell, P., Field, C. B., Hannegan, B., Hodge, B.-M., Hoffert, M. I., Ingersoll, E., Jaramillo, P., Lackner, K. S., Mach, K. J., Mastrandrea, M., Ogden, J., Peterson, P. F., Sanchez, D. L., Sperling, D., Stagner, J., Trancik, J. E., Yang, C.-J., and Caldeira, K.: Net-zero emissions energy systems, Science, 360, eaas9793, https://doi.org/10.1126/science.aas9793, 2018.
de Lorena Diniz Chaves, G., Siman, R. R., Ribeiro, G. M., and Chang, N.-B.: Synergizing environmental, social, and economic sustainability factors for refuse derived fuel use in cement industry: A case study in Espirito Santo, Brazil, J. Environ. Manage., 288, 112401, https://doi.org/10.1016/j.jenvman.2021.112401, 2021.
Doh Dinga, C. and Wen, Z.: China's green deal: Can China's cement industry achieve carbon neutral emissions by 2060?, Renew. Sust. Energ. Rev., 155, 111931, https://doi.org/10.1016/j.rser.2021.111931, 2022.
European Ready mixed Concrete Organization (ERMCO): Ready-mixed Concrete Industry Statistics 2001—2019, European Ready mixed Concrete Organization [data set], https://ermco.eu/statistics-previous-years/ (last access: 24 August 2024), 2020.
Farfan, J., Fasihi, M., and Breyer, C.: Trends in the global cement industry and opportunities for long-term sustainable CCU potential for Power-to-X, J. Clean. Prod., 217, 821–835, https://doi.org/10.1016/j.jclepro.2019.01.226, 2019.
Friedlingstein, P., O'Sullivan, M., Jones, M. W., Andrew, R. M., Bakker, D. C. E., Hauck, J., Landschützer, P., Le Quéré, C., Luijkx, I. T., Peters, G. P., Peters, W., Pongratz, J., Schwingshackl, C., Sitch, S., Canadell, J. G., Ciais, P., Jackson, R. B., Alin, S. R., Anthoni, P., Barbero, L., Bates, N. R., Becker, M., Bellouin, N., Decharme, B., Bopp, L., Brasika, I. B. M., Cadule, P., Chamberlain, M. A., Chandra, N., Chau, T.-T.-T., Chevallier, F., Chini, L. P., Cronin, M., Dou, X., Enyo, K., Evans, W., Falk, S., Feely, R. A., Feng, L., Ford, D. J., Gasser, T., Ghattas, J., Gkritzalis, T., Grassi, G., Gregor, L., Gruber, N., Gürses, Ö., Harris, I., Hefner, M., Heinke, J., Houghton, R. A., Hurtt, G. C., Iida, Y., Ilyina, T., Jacobson, A. R., Jain, A., Jarníková, T., Jersild, A., Jiang, F., Jin, Z., Joos, F., Kato, E., Keeling, R. F., Kennedy, D., Klein Goldewijk, K., Knauer, J., Korsbakken, J. I., Körtzinger, A., Lan, X., Lefèvre, N., Li, H., Liu, J., Liu, Z., Ma, L., Marland, G., Mayot, N., McGuire, P. C., McKinley, G. A., Meyer, G., Morgan, E. J., Munro, D. R., Nakaoka, S.-I., Niwa, Y., O'Brien, K. M., Olsen, A., Omar, A. M., Ono, T., Paulsen, M., Pierrot, D., Pocock, K., Poulter, B., Powis, C. M., Rehder, G., Resplandy, L., Robertson, E., Rödenbeck, C., Rosan, T. M., Schwinger, J., Séférian, R., Smallman, T. L., Smith, S. M., Sospedra-Alfonso, R., Sun, Q., Sutton, A. J., Sweeney, C., Takao, S., Tans, P. P., Tian, H., Tilbrook, B., Tsujino, H., Tubiello, F., van der Werf, G. R., van Ooijen, E., Wanninkhof, R., Watanabe, M., Wimart-Rousseau, C., Yang, D., Yang, X., Yuan, W., Yue, X., Zaehle, S., Zeng, J., and Zheng, B.: Global Carbon Budget 2023, Earth Syst. Sci. Data, 15, 5301–5369, https://doi.org/10.5194/essd-15-5301-2023, 2023.
Goyal, S. and Sharma, D.: CO2 sequestration on cement, in: Start-Up Creation (second edition), edited by: Pacheco-Torgal, F., Rasmussen, E., Granqvist, C.-G., Ivanov, V., Kaklauskas, A., and Makonin, S., Woodhead Publishing, https://doi.org/10.1016/B978-0-12-819946-6.00006-0, 109–142, 2020.
Grubb, M., Jordan, N. D., Hertwich, E., Neuhoff, K., Das, K., Bandyopadhyay, K. R., Asselt, H. van, Sato, M., Wang, R., Pizer, W. A., and Oh, H.: Carbon Leakage, Consumption, and Trade, Ann. Rev. Env. Resour., 47, 753–795, https://doi.org/10.1146/annurev-environ-120820-053625, 2022.
Guo, R., Wang, J., Bing, L., Tong, D., Ciais, P., Davis, S. J., Andrew, R. M., Xi, F., and Liu, Z.: Global CO2 uptake by cement from 1930 to 2019, Earth Syst. Sci. Data, 13, 1791–1805, https://doi.org/10.5194/essd-13-1791-2021, 2021.
Huang, Z., Wang, J., Bing, L., Qiu, Y., Guo, R., Yu, Y., Ma, M., Niu, L., Tong, D., Andrew, R. M., Friedlingstein, P., Canadell, J. G., Xi, F., and Liu, Z.: Global carbon uptake of cement carbonation accounts 1930–2021, Earth Syst. Sci. Data, 15, 4947–4958, https://doi.org/10.5194/essd-15-4947-2023, 2023.
Intergovernmental Panel on Climate Change (IPCC): 2006 IPCC Guidelines for National Greenhouse Gas Inventories, Institute for Global Environmental Strategies (IGES), Hayama (Japan), https://www.ipcc-nggip.iges.or.jp/public/2006gl/index.html (last access: 27 August 2023), 2006.
Ji, S., Lee, B., and Yi, M. Y.: Building life-span prediction for life cycle assessment and life cycle cost using machine learning: A big data approach, Build. Environ., 205, 108267, https://doi.org/10.1016/j.buildenv.2021.108267, 2021.
Krishna Priya, G. S., Gundre, R., Bandyopadhyay, S., and Seethamraju, S.: Analysis of decarbonization measures for the Indian Cement Sector, J. Environ. Manage., 358, 120860, https://doi.org/10.1016/j.jenvman.2024.120860, 2024.
Kumar, P. and Kaushik, S. K.: Some trends in the use of concrete: Indian scenario, Indian Concrete Journal, 77, 15031508, 2003.
Kurtis, K. E.: Innovations in cement-based materials: Addressing sustainability in structural and infrastructure applications, MRS Bull., 40, 1102–1109, https://doi.org/10.1557/mrs.2015.279, 2015.
Liu, J., Tong, D., Zheng, Y., Cheng, J., Qin, X., Shi, Q., Yan, L., Lei, Y., and Zhang, Q.: Carbon and air pollutant emissions from China's cement industry 1990–2015: trends, evolution of technologies, and drivers, Atmos. Chem. Phys., 21, 1627–1647, https://doi.org/10.5194/acp-21-1627-2021, 2021.
Mo, L. and Panesar, D. K.: Accelerated carbonation – A potential approach to sequester CO2 in cement paste containing slag and reactive MgO, Cement Concrete Comp., 43, 69–77, https://doi.org/10.1016/j.cemconcomp.2013.07.001, 2013.
Muigai, R., Alexander, M. G., and Moyo, P.: Cradle-to-gate environmental impacts of the concrete industry in South Africa, J. S. Afr. Inst. Civ. Eng., 55, 02–07, 2013.
Pade, C. and Guimaraes, M.: The CO2 uptake of concrete in a 100 year perspective, Cement Concrete Res., 37, 1348–1356, https://doi.org/10.1016/j.cemconres.2007.06.009, 2007.
Pan, H., Yang, Z., and Xu, F.: Study on concrete structure’s durability considering the interaction of multi-factors, Constr. Build. Mater., 118, 256261, https://doi.org/10.1016/j.conbuildmat.2016.05.032, 2016.
Portland Cement Association (PCA): Roadmap to carbon neutrality: A more sustainable world is shaped by concrete, Portland Cement Association, https://www.cement.org/sustainability/roadmap-to-carbon-neutrality (last access: 4 August 2024), 2021.
Pu, Y., Li, L., Shi, X., Wang, Q., and Abomohra, A.: Recent advances in accelerated carbonation for improving cement-based materials and CO2 mitigation from a life cycle perspective, Constr. Build. Mater., 388, 131695, https://doi.org/10.1016/j.conbuildmat.2023.131695, 2023.
Qiu, Q.: A state-of-the-art review on the carbonation process in cementitious materials: Fundamentals and characterization techniques, Constr. Build. Mater., 247, 118503, https://doi.org/10.1016/j.conbuildmat.2020.118503, 2020.
Schneider, M.: The cement industry on the way to a low-carbon future, Cement Concrete Res., 124, 105792, https://doi.org/10.1016/j.cemconres.2019.105792, 2019.
Shah, I. H., Miller, S. A., Jiang, D., and Myers, R. J.: Cement substitution with secondary materials can reduce annual global CO2 emissions by up to 1.3 gigatons, Nat. Commun., 13, 5758, https://doi.org/10.1038/s41467-022-33289-7, 2022.
Snæbjörnsdóttir, S. Ó., Sigfússon, B., Marieni, C., Goldberg, D., Gislason, S. R., and Oelkers, E. H.: Carbon dioxide storage through mineral carbonation, Nat. Rev. Earth Environ., 1, 90–102, https://doi.org/10.1038/s43017-019-0011-8, 2020.
The European Cement Association (CEMBUREAU): CEMBUREAU's Net Zero Roadmap, The European Cement Association, https://cembureau.eu/library/reports/cembureau-s-net-zero-roadmap/ (last access: 4 August 2024), 2024.
United States Geological Survey (USGS): Cement statistics and information, United States Geological Survey [data set], https://www.usgs.gov/centers/national-minerals-information-center/cement-statistics-and-information (last access: 7 January 2025).
Wu, S., Niu, L., Wang, J., and Xi, F.: Global and national CO2 uptake by cement carbonation from 1928 to 2024, Zenodo [data set], https://doi.org/10.5281/zenodo.14583866, 2024.
Xi, F., Davis, S. J., Ciais, P., Crawford-Brown, D., Guan, D., Pade, C., Shi, T., Syddall, M., Lv, J., Ji, L., Bing, L., Wang, J., Wei, W., Yang, K.-H., Lagerblad, B., Galan, I., Andrade, C., Zhang, Y., and Liu, Z.: Substantial global carbon uptake by cement carbonation, Nat. Geosci., 9, 880–883, https://doi.org/10.1038/ngeo2840, 2016.
Xue, L., Zhang, Z., and Wang, H.: Hydration mechanisms and durability of hybrid alkaline cements (HACs): A review, Constr. Build. Mater., 266, 121039, https://doi.org/10.1016/j.conbuildmat.2020.121039, 2021.
You, X., Hu, X., He, P., Liu, J., and Shi, C.: A review on the modelling of carbonation of hardened and fresh cement-based materials, Cement Concrete Comp., 125, 104315, https://doi.org/10.1016/j.cemconcomp.2021.104315, 2022.kl.