the Creative Commons Attribution 4.0 License.
the Creative Commons Attribution 4.0 License.
 | 19 May 2025
Seismic survey in an urban area: the activities of the EMERSITO INGV emergency group in Ancona (Italy) following the 2022 Mw 5.5 Costa Marchigiana–Pesarese earthquake
Giuseppe Di Giulio
Giovanna Cultrera
Francesca Pacor
Sara Lovati
Gaetano Riccio
Maurizio Vassallo
Giulio Brunelli
Antonio Costanzo
Antonella Bobbio
Marta Pischiutta
Rodolfo Puglia
Marco Massa
Rocco Cogliano
Salomon Hailemikael
Alessia Mercuri
Giuliano Milana
Luca Minarelli
Alessandro Di Filippo
Lucia Nardone
Simone Marzorati
Chiara Ladina
Debora Pantaleo
Carlo Calamita
Maria Grazia Ciaccio
Antonio Fodarella
Stefania Pucillo
Giuliana Mele
Carla Bottari
Gaetano De Luca
Luigi Falco
Antonino Memmolo
Giulia Sgattoni
Gabriele Tarabusi
This paper illustrates the activities of EMERSITO, an emergency task force of the Istituto Nazionale di Geofisica e Vulcanologia (INGV, Italy) devoted to site effects and microzonation studies during the seismic sequence that occurred close to the Adriatic coast in central Italy starting from 9 November 2022, following the Mw 5.5 mainshock localized in the sea. In particular, we describe the steps that led to the deployment of a temporary network of seismic stations in the urban area of Ancona, the main city of the Adriatic coastline. Data collected by the temporary Ancona network (identification code 6N; https://doi.org/10.13127/sd/qctgd6c-3a, EMERSITO Working Group, 2024) from November 2022 to the end of February 2023 have been preliminary analyzed with different techniques to characterize the deployment sites and are now available for further and detailed studies.
- Article
(16987 KB) - Full-text XML
-
Supplement
(143975 KB) - BibTeX
- EndNote


On 9 November 2022, at 06:07:24 UTC (07:07:24 local time), a Mw 5.5 earthquake localized in the Adriatic Sea struck the Marchigiana–Pesarese coast in central Italy (Fig. 1). Due to its magnitude, exceeding the threshold of 5.0, and the closeness to urban areas (Fano and Pesaro are about 30–35 km and Ancona 45 km away from the epicenter), Istituto Nazionale di Geofisica e Vulcanologia (INGV, National Institute of Geophysics and Volcanology in English, https://www.ingv.it/en/index.php, last access: 1 May 2025) soon activated the Seismic Crisis Unit to monitor the ongoing seismic sequence. Among several tasks, the Crisis Unit coordinates the INGV emergency task forces (https://www.ingv.it/en/monitoring-and-infrastructure/emergencies/emergency-groups, last access: 1 May 2025) devoted to specific issues and scientific support for the activities of the civil protection: SISMIKO (Moretti et al., 2023, https://sismiko.ingv.it/, last access: 1 May 2025) for adding seismic stations in the epicentral area to improve the localization of the seismic events of the sequence, EMERGEO (https://emergeo.ingv.it, last access: 1 May 2025) for investigating the surface geological effects, QUEST (https://quest.ingv.it, last access: 1 May 2025) for the macroseismic survey and EMERSITO (http://emersitoweb.rm.ingv.it/index.php/it/, last access: 1 May 2025) for site effects and seismic microzonation studies. In general, the INGV task forces operate synergistically although with a different intervention timing. In particular, SISMIKO, EMERGEO and QUEST start their activities within a few hours to 1–2 d after the mainshock. EMERSITO activities, on the contrary, usually start from 2 to 7 d after the main seismic event, depending on the level of damage caused by the mainshock and, therefore, the accessibility of the epicentral area where the site effects are often more evident (Cara et al., 2019).
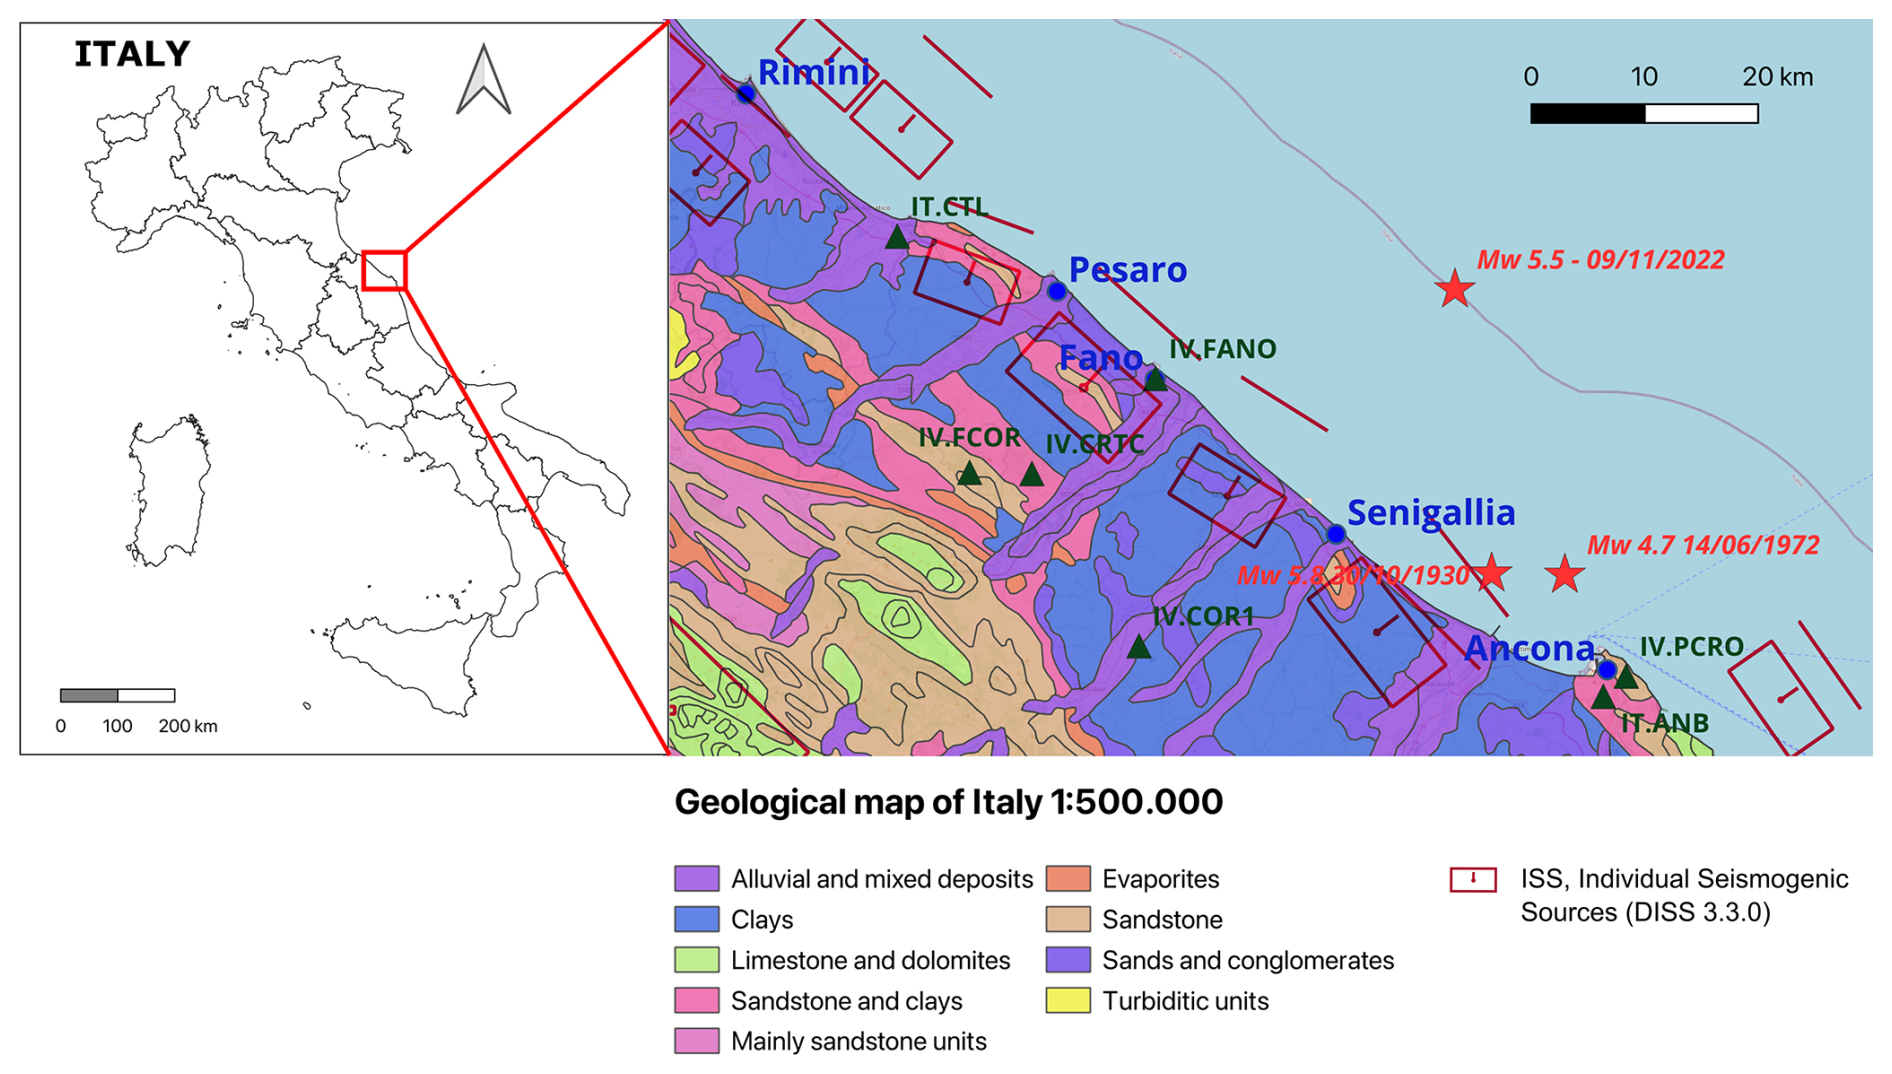
Figure 1Left: Map of Italy, the red square indicates the Costa Marchigiana–Pesarese. Right: zoom of the study area with the geological map (1:500 000 scale) and the individual seismogenic sources, showing (a) the epicenter of the Mw 5.5 event of 9 November 2022 and the epicenters of the two strongest earthquakes which occurred in the previous century that affected Ancona significantly (red stars), (b) the main cities on the Adriatic coast (blue dots), and (c) the accelerometric stations (green triangles) of RAN and RSN seismic networks closest to the Mw 5.5 event. The map has been realized with QGIS (QGIS Development Team, 2024). The individual seismogenic sources are taken from DISS Working Group (2021). The geological data (Console et al., 2017) are distributed under the CC-BY 4.0 license.
In this paper, we focus on the activities of the EMERSITO working group following the Mw 5.5 mainshock in the Adriatic Sea. The area of the Adriatic coast where the earthquake was felt is very broad, approximately ranging between the cities of Rimini and Ancona that are about 90 km away from each other (Fig. 1). However, the level of damage, reported by both the fire brigade and the QUEST surveys, was very low (maximum IV MCS, modified Mercalli intensity scale), so the logistics left us some options for planning an intervention for site effect studies. After several considerations, EMERSITO decided to deploy a temporary seismic network in the urban area of Ancona, the regional capital of Marche. This choice was driven by (a) the relative high values of peak ground acceleration (PGA) recorded for the mainshock (the maximum PGA has been recorded in Ancona at IV.PCRO station with 197 cm s−2 on the east–west component), (b) the damage and evacuations reported by the fire brigade and the technicians of the Marche region, (c) the strong lithological heterogeneities in town, and (d) the scientific interest in improving the approach for the evaluation of the local seismic response in urban areas.
The deployment of the network started 4 d after the mainshock and was completed in 3 d, also taking advantage of the presence of an INGV office in Ancona and with the collaboration of the municipality and of the Marche region technicians. During the emergency, which lasted from November 2022 to March 2023, EMERSITO carried out four public reports to describe its activities (Cara et al., 2022a, b, c; Famiani et al., 2023).
In this paper, we describe in detail the EMERSITO network, the data collected and some preliminary analyses.
2.1 Seismological and geological framework
The 2022 Mw 5.5 seismic sequence struck the Adriatic coast and affected some major towns, such as Pesaro, Rimini, Fano, Senigallia and Ancona (Fig. 1). This latter city (about 100 000 citizens) is the administrative center of the Marche region and one of the main seaports of the Adriatic Sea. Before this event, in the previous century, Ancona was hit by significant earthquakes: in 1930 (epicenter close to Senigallia, 10–15 km away from Ancona, estimated Mw 5.8 and MCS intensity VIII; Guidoboni et al., 2018; Rovida et al., 2020, 2022; see Fig. 1) and more recently in 1972 by an important seismic sequence (Kisslinger, 1972; Console et al., 1973) that lasted 11 months. The shocks of the 1972 sequence were short in duration but showed rather high values of PGA; the strongest earthquake occurred on 14 June, with a magnitude of Mw 4.7 and estimated MCS intensity VIII. The epicenter of this event was localized in the Adriatic Sea in front of the Ancona seaport (Fig. 1), about 10 km from the Ancona downtown area in the northeast direction (Rovida et al., 2017). The city experienced diffuse but moderate damage, with 7000 of 35 000 buildings declared unusable. More than 30 000 people left their homes. At the end of the 1972 sequence, Ancona was the object of the first large-scale seismic monitoring in Italy, with the deployment of a network (Ferraris et al., 1975) followed by an extensive microzonation survey of the area (Calza et al., 1981). The reconstruction, also in the downtown area, was exemplary for Italian standards and followed strict anti-seismic rules.
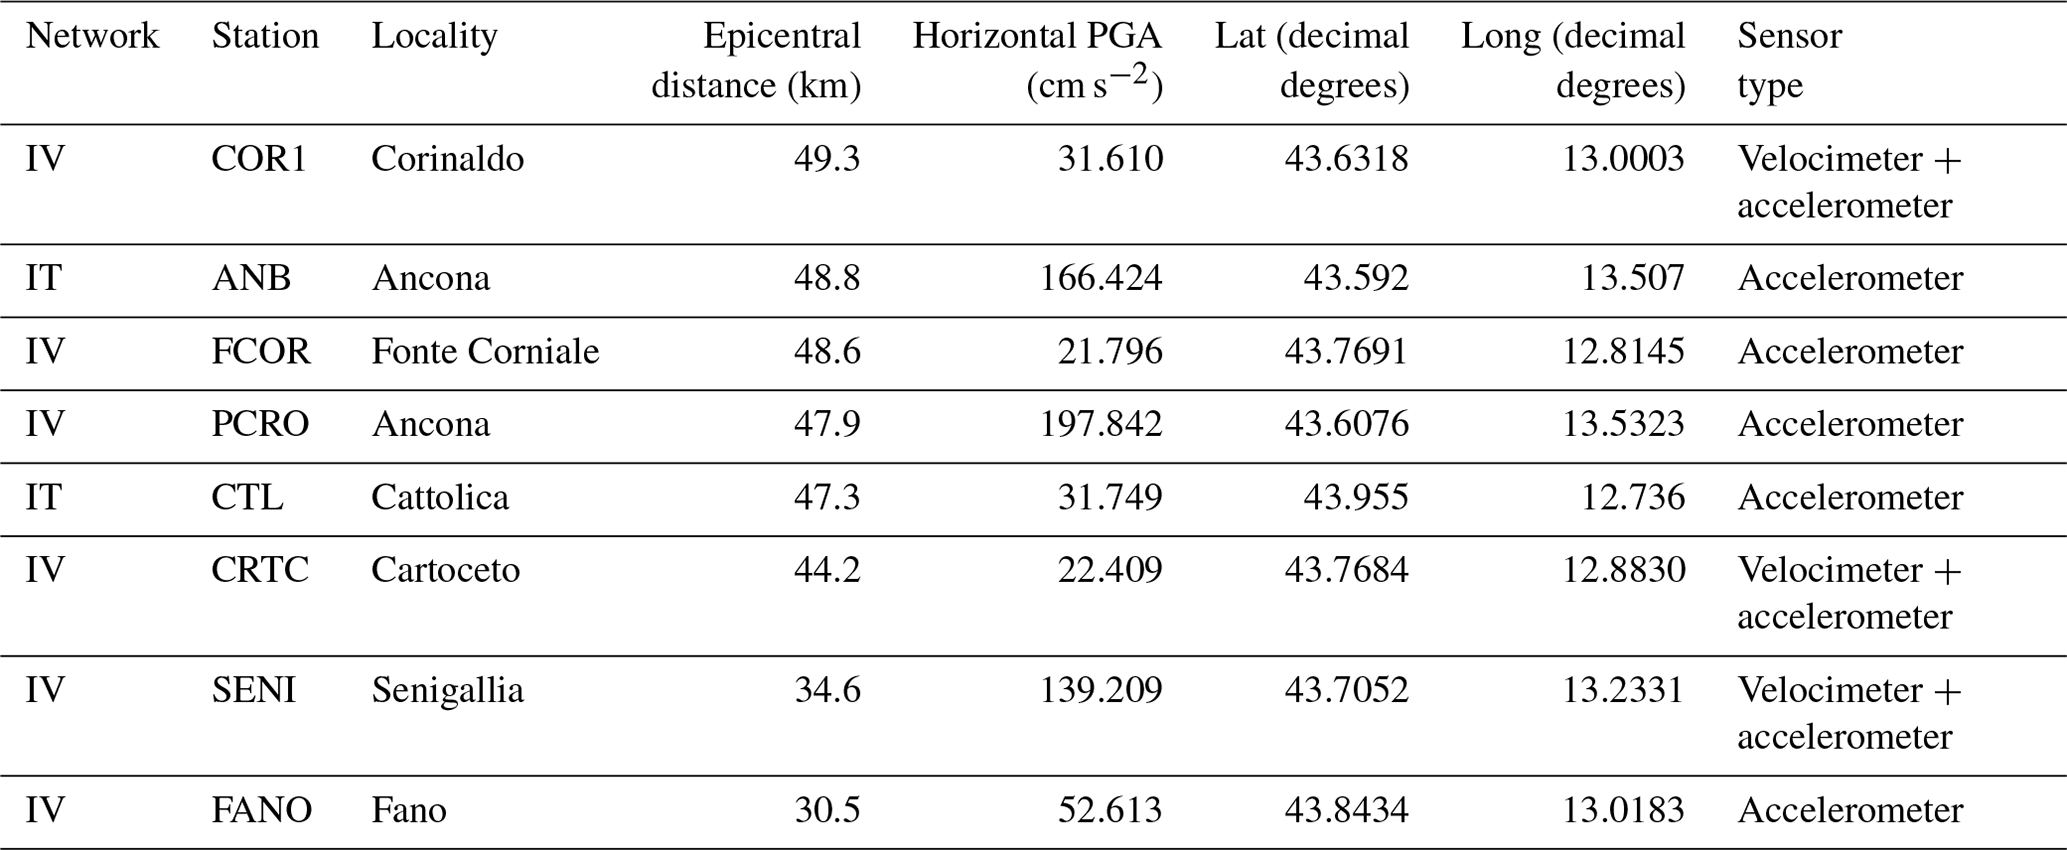
During the 2022 mainshock, localized at a distance of about 45 km from Ancona (see Fig. 1), the city experienced some negligible damage and evacuations, as reported by the regional technicians and the fire brigade (Fig. 2). As for the 1972 event, higher levels of PGA were recorded during the mainshock compared with instrumented sites at a similar distance (Engineering Strong Motion Database, ESM; Luzi et al., 2020, https://esm-db.eu/#/event/INT-20221109_0000046, last access: 1 May 2025). A subset of the recorded PGA values is reported in Table 1 (see also Fig. 1 for details on the position of the considered instrumented sites).
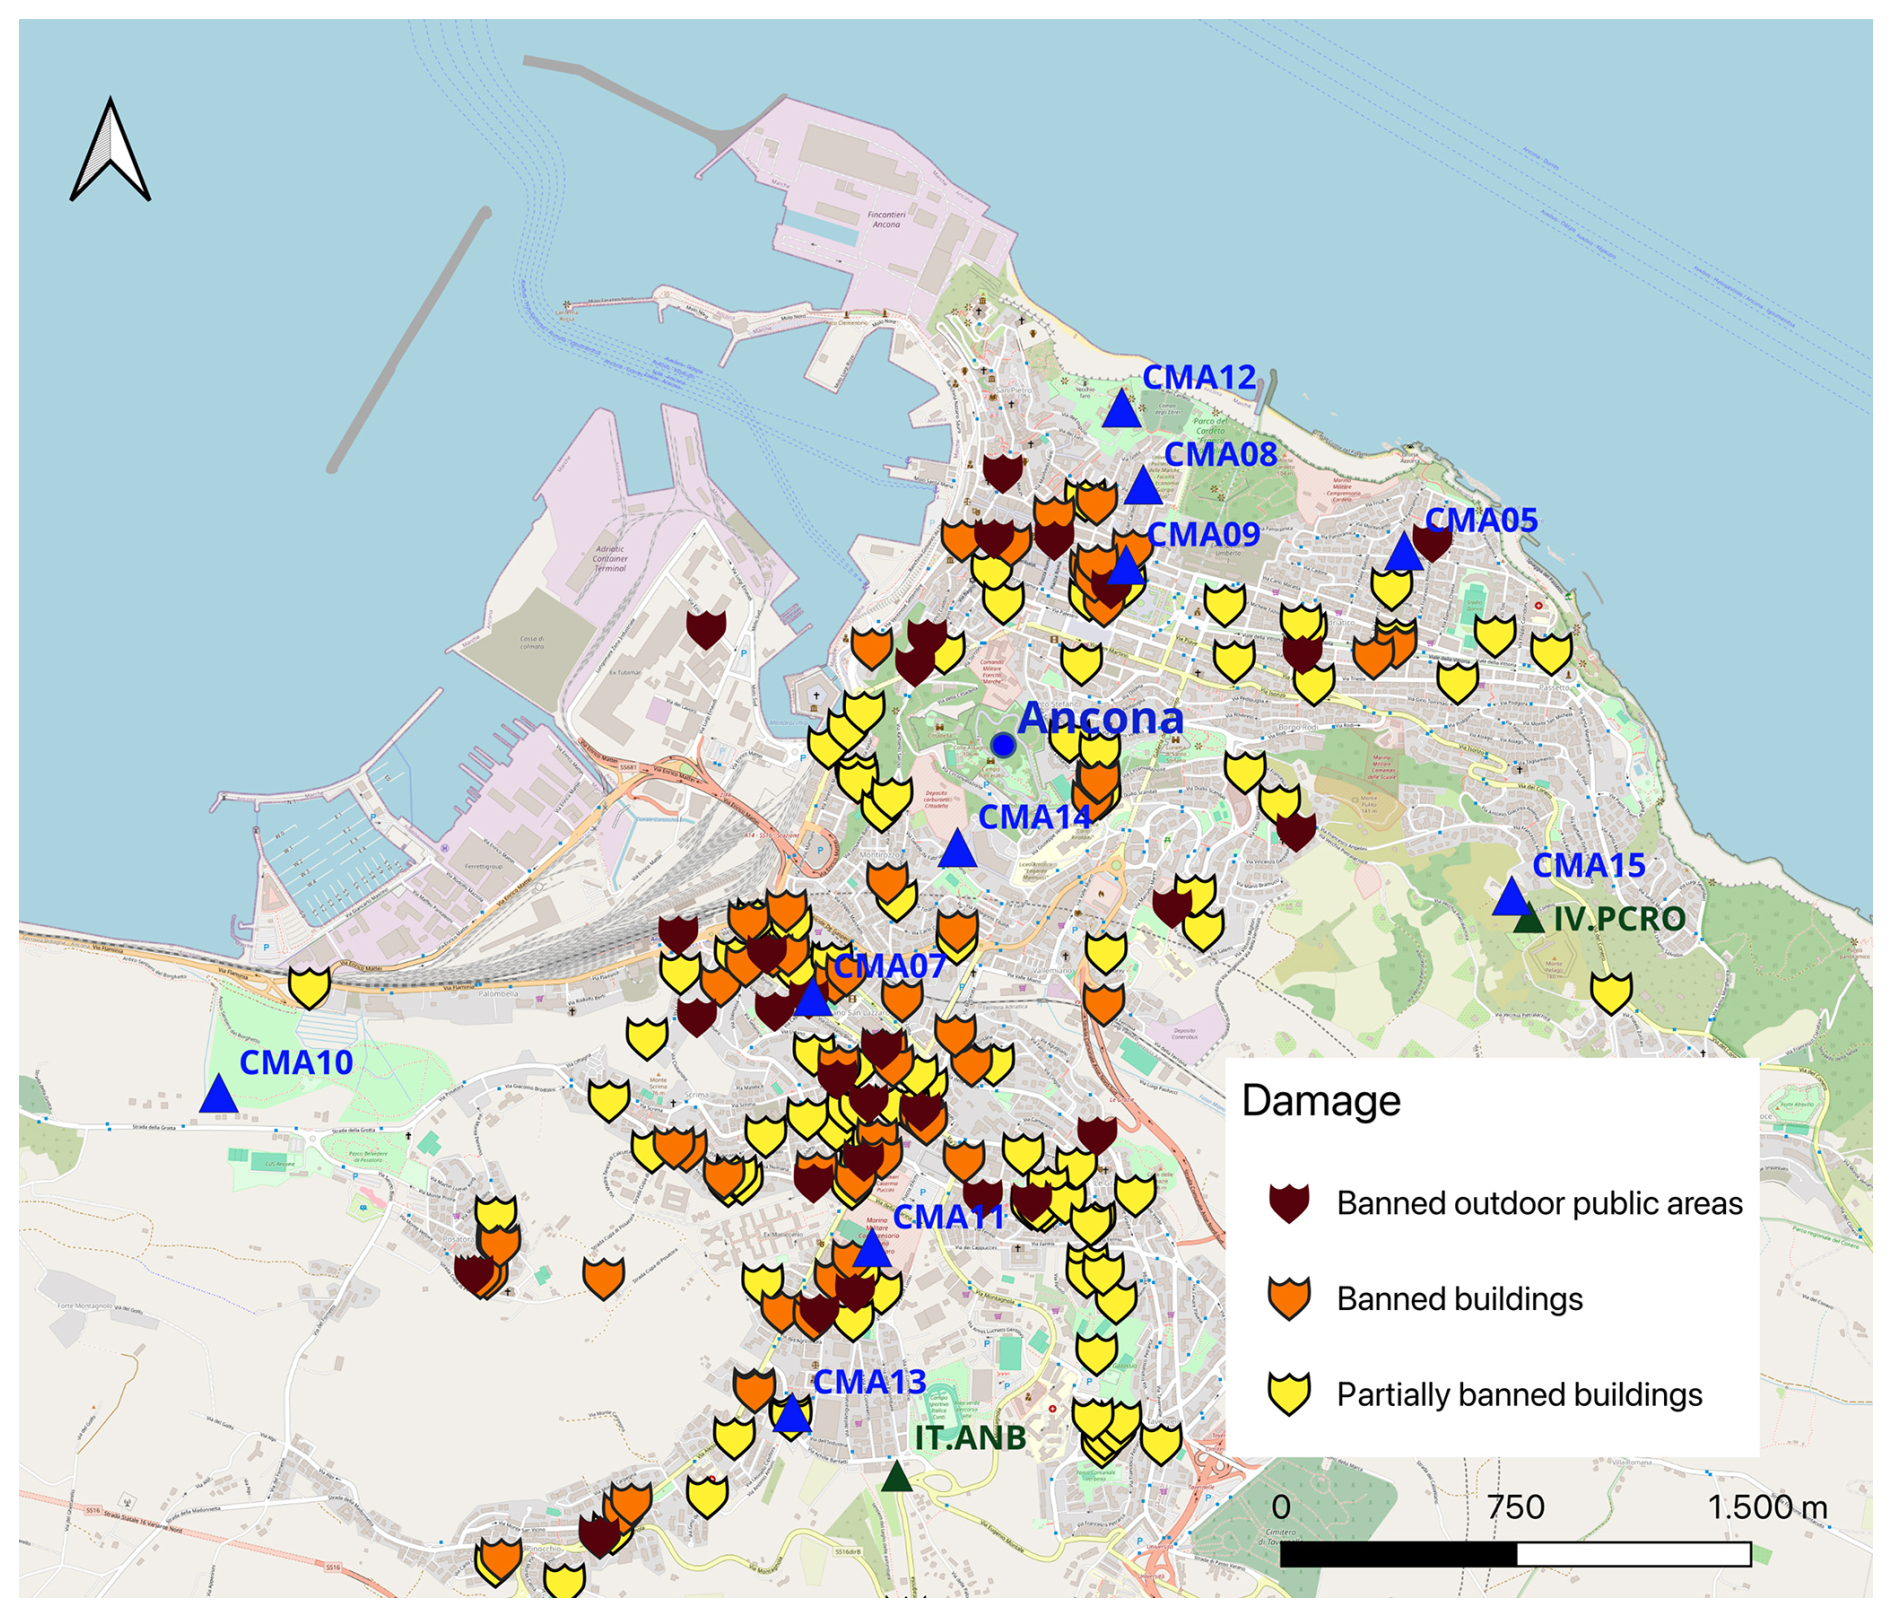
Figure 2Map of the Ancona municipality with the indication of damage as reported by the fire brigades. The blue triangles are most of the stations of the temporary network 6N installed by the EMERSITO working group. The green triangles represent the two permanent stations installed at Ancona, IT.ANB and IV.PCRO. The map has been realized with QGIS (QGIS Development Team, 2024). © OpenStreetMap contributors 2024. Distributed under the Open Data Commons Open Database License (ODbL) v1.0.
Table 19 November 2022, Mw 5.5 earthquake: PGA recorded by some stations of the two permanent networks in Italy, IV (https://doi.org/10.13127/SD/X0FXnH7QfY, INGV, 2005) and IT (https://doi.org/10.7914/SN/IT, PCM-CPD, 1972), ordered by epicentral distance. The two stations in Ancona are highlighted in bold. More information about stations of IV and IT networks can be found on the ITalian ACcelerometric Archive (ITACA, https://itaca.mi.ingv.it/, last access: 1 May 2025) and on the Site Characterization of the Permanent Seismic Stations database (CRISP, http://crisp.ingv.it/, last access: 1 May 2025).
From a geological point of view, Ancona is characterized by strong lithological heterogeneity (Amanti et al., 2007) and represents a scientifically interesting case for the evaluation of the local seismic response in an urban area. Moreover, the western area of Ancona is built on a deep landslide (Stucchi et al., 2005; Stucchi and Mazzotti, 2009). In 1982, after a period of heavy rain, the landslide suddenly moved (Crescenti et al., 2005), involving several suburban districts of Ancona: Posatora, Borghetto and partially Torrette (Fig. 3). The movement of the landslide damaged two hospitals and the Faculty of Medicine of the local university, 280 buildings were destroyed and overall 865 homes damaged, the railway was torn up, and the coastal road was damaged along a front of approximately 2.5 km. The disaster forced the authorities to evacuate 3661 people from the affected area. Nowadays, the landslide zone, as well the aquifer, is constantly monitored through an early-warning system (Cardellini and Osimani, 2013), and it is still exhibiting very slow movement (Agostini et al., 2014).
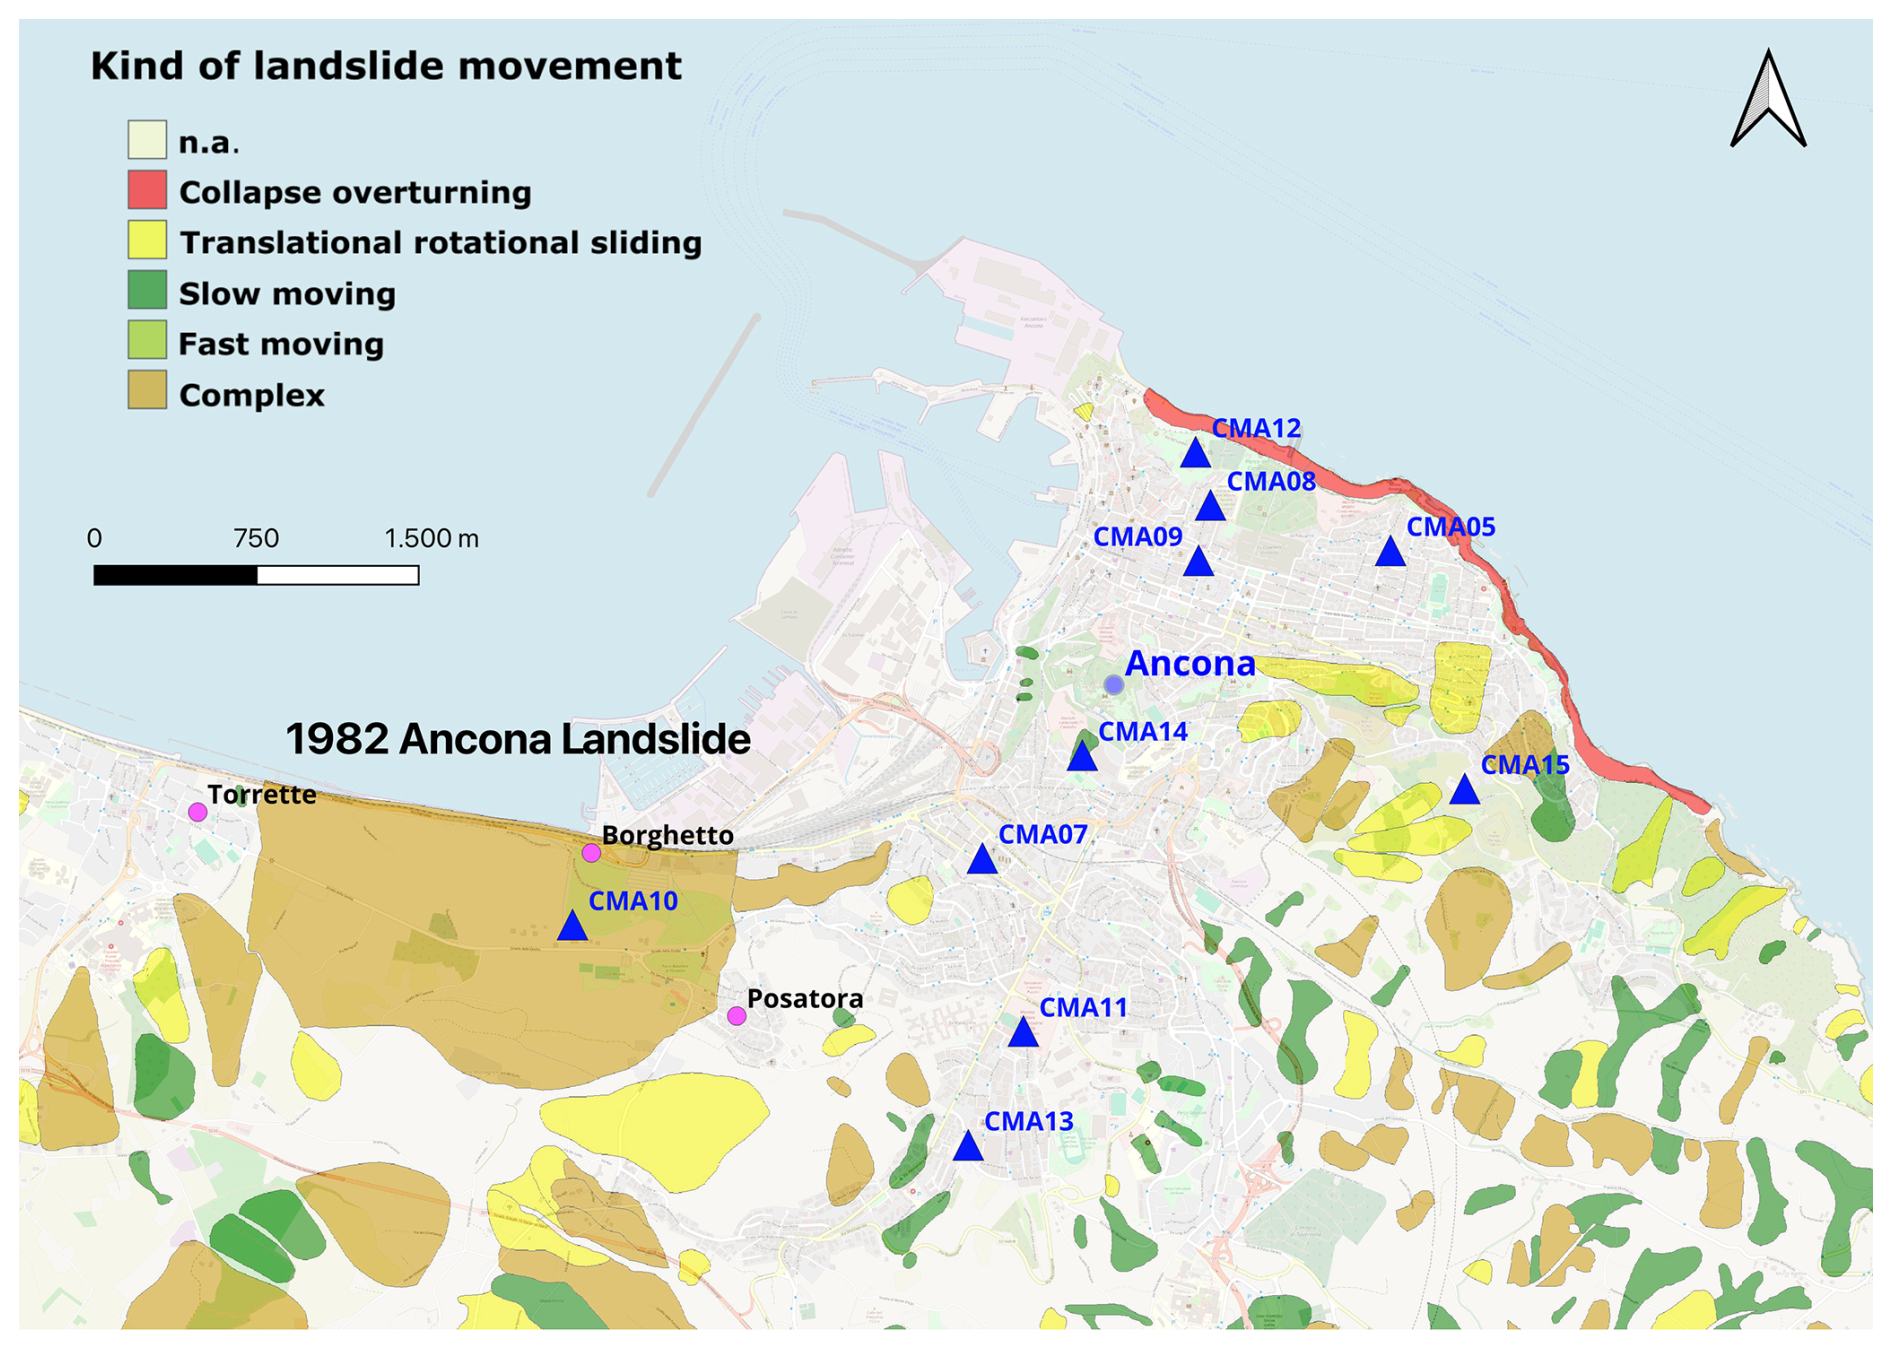
Figure 3Map of the Ancona municipality with landslide phenomena, as carried out by Italian Institute for Environmental Protection and Research (ISPRA) and the Italian regions and autonomous provinces during the project IFFI (Inventory of Landslide Phenomena in Italy). On the map, the huge area of the 1982 landslide is highlighted. The magenta dots represent the three districts of Ancona involved in landslide movement. The blue triangles are most of the stations of the temporary network 6N installed by the EMERSITO working group. The green triangles represent the two permanent stations installed at Ancona, IT.ANB and IV.PCRO. The complete IFFI database is available at the following website: https://www.isprambiente.gov.it/it/progetti/cartella-progetti-in-corso/suolo-e-territorio-1/iffi-inventario-dei-fenomeni-franosi-in-italia (last access: 1 May 2025). The map has been realized with QGIS (QGIS Development Team, 2024). © OpenStreetMap contributors 2024. Distributed under the Open Data Commons Open Database License (ODbL) v1.0.
The Ancona area falls in the marginal part of the central Apennine thrust system, where Miocene–Pliocene–Pleistocene terrigenous deposits overlie a mostly carbonate succession referable to the Umbria–Marche succession (Cello and Tondi, 2011). In the periadriatic sector, the geological structures related to the origin of the central Apennine chain are generally buried under the foredeep turbidite successions that sedimented starting from the Miocene age (Bally et al., 1986). In particular, in the area of Ancona (Fig. 4), this foredeep succession is mainly characterized, in its upper part, by Pleistocene grey–blue marly clays (Argille Azzurre, FAA). During the late Pliocene, there was an intense phase of regional uplift that in the Middle Pleistocene, which resulted in the emergence of the external part of the Marche region from the sea level. Subsequently, and in relation to the different climatic phases, there were erosion processes of various intensity (also stasis) and sedimentation. All these phenomena modeled the landscape defining the current morphostructural arrangement of the region and producing alluvial, eluvial–colluvial marine and landscape deposits, widely outcropping in the study area.
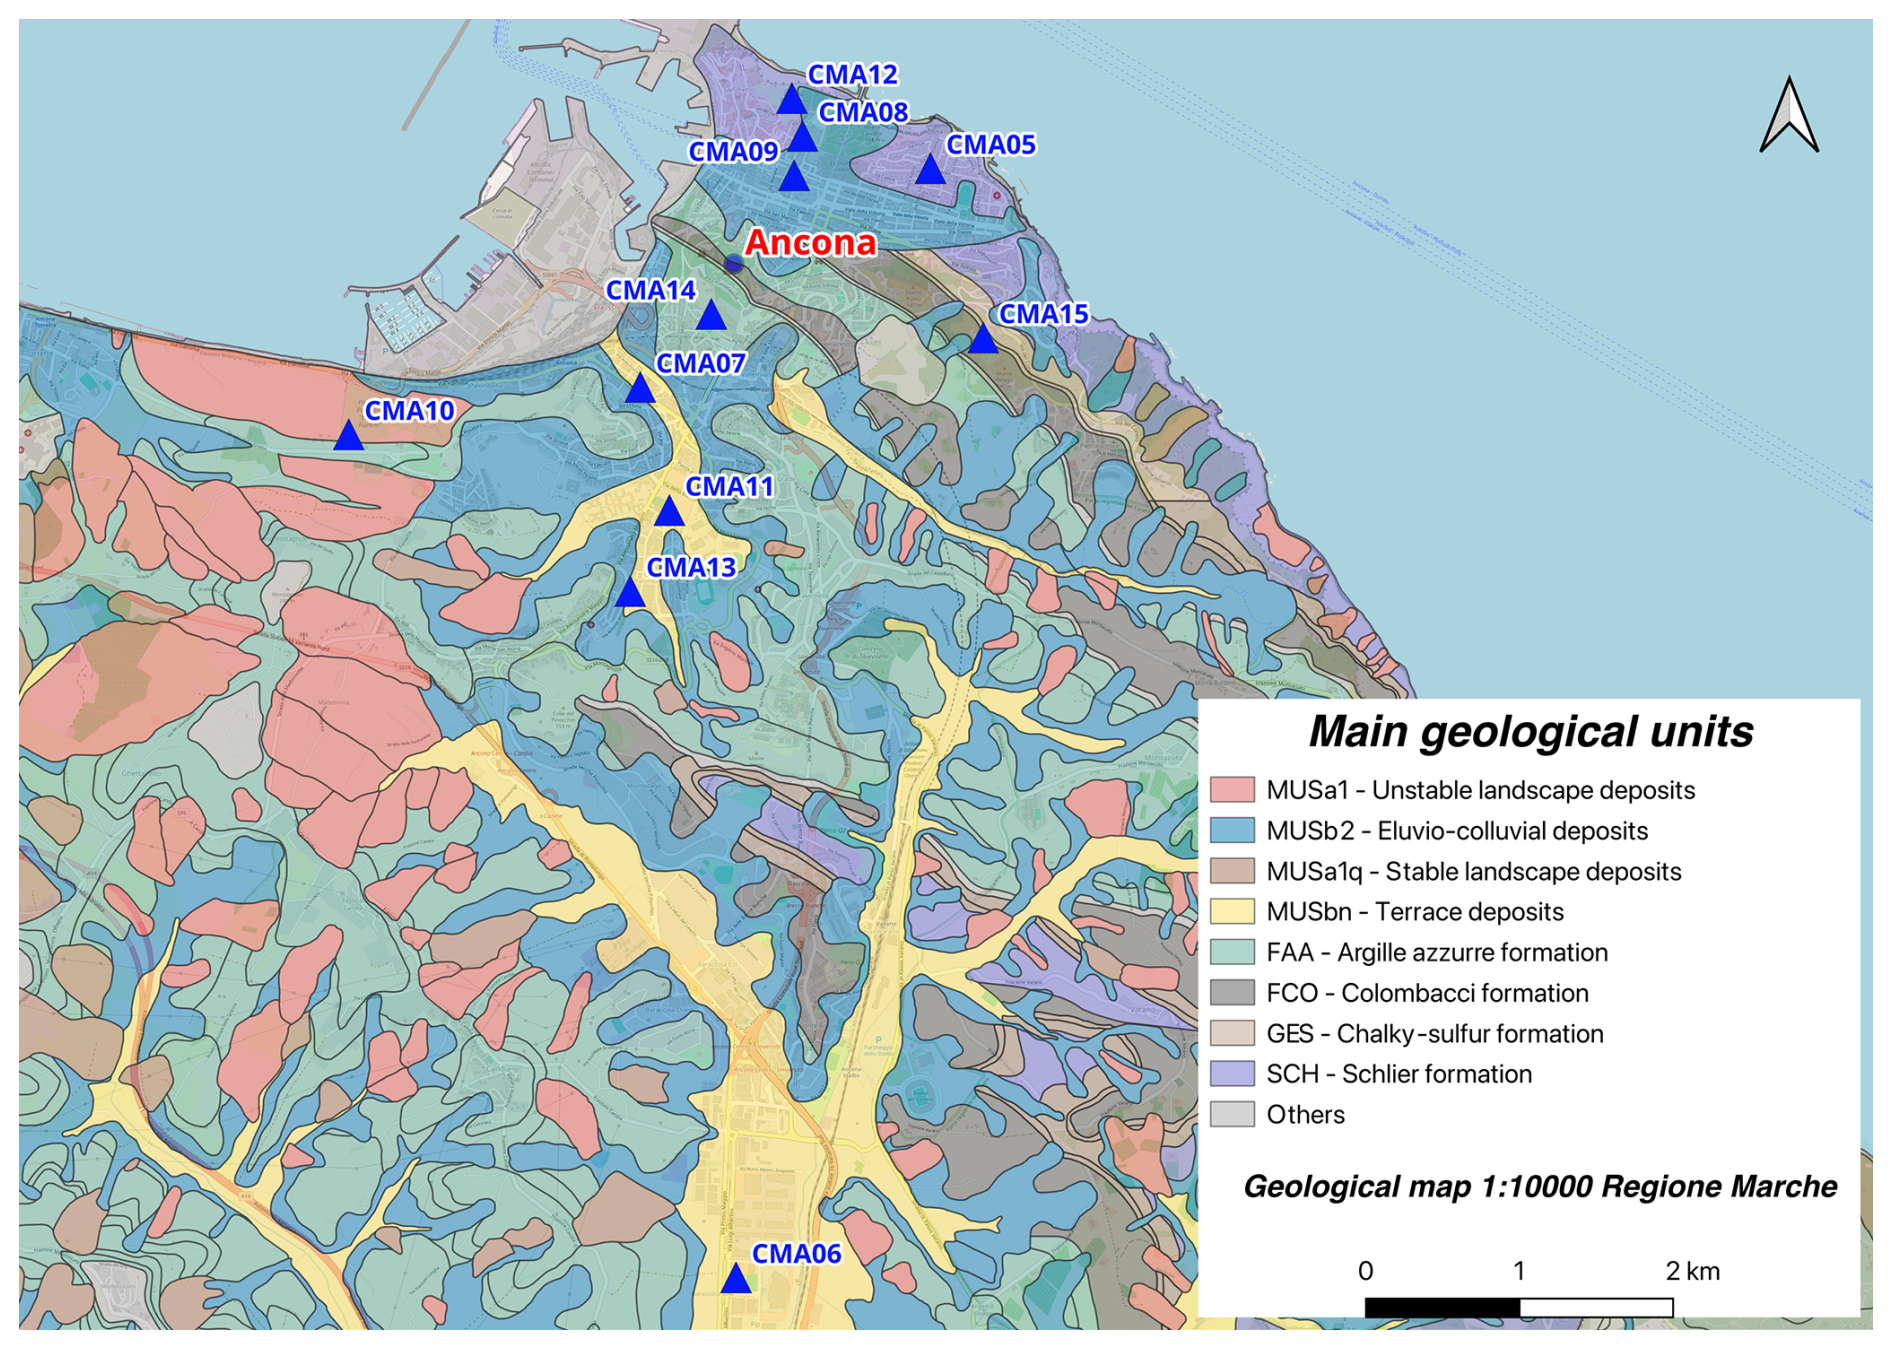
Figure 4Geological map (scale 1:10 000) of the Ancona area. Stations of the 6N EMERSITO seismic network (blue triangles) are superimposed. The map has been realized with QGIS (QGIS Development Team, 2024). © OpenStreetMap contributors 2024. Distributed under the Open Data Commons Open Database License (ODbL) v1.0. The geological data, coming from the Marche region, are distributed under the CC-BY 4.0 license.
The recent anthropization and urbanization are strongly altering the original morphology, in particular in the coastal area, introducing erosion and accumulation processes.
The outcropping marine succession in Ancona has been classified into four lithostratigraphic units from bottom to top:
- a.
Schlier Formation (SCH),
- b.
chalky-sulfur formation (GES),
- c.
Colombacci Formation (FCO),
- d.
Argille Azzurre Formation (FAA).
The SCH formation (Late Miocene age, hemipelagic origin) diffusely outcrops along the coastline and consists of quite stiff marls and calcareous marls, with expected thickness of up to 250 m.
The GES unit (Late Miocene, evaporitic origin) consists of bituminous clays, sulfureous limestones and whitish nodular chalk banks. Also, this formation outcrops along the coastline and has a maximum thickness of 40–50 m.
The Colombacci Formation (FCO, Late Miocene age) is mainly composed of clays and marly–silty clays. The maximum thicknesses are greater than 100 m.
The FAA formation (early Pliocene–Early Pleistocene) widely outcrops in the Ancona area (thickness up to 300 m), and it is a pelitic succession that, in its upper part, consists of massive grey–blue stratified marly clays with rare sand lenses. It is worth noting that this unit has strong lateral and vertical variations.
The Quaternary deposits in Ancona, according to the 282 sheet of the 1:50 000 geological map of Italy (Lettieri, 2009; Console et al., 2017), have been merged into the Musone River syntheme: the eluvial–colluvial deposits (MUSb2) sometimes cover large sectors of the hillsides and the surfaces of the terraces and fill the bottom of most of the valleys. Thickness can be up to 10–15 m, and they consist of fine sediments (sands, clays and silts).
Quaternary slope instabilities (Agostini et al., 2014) affect areas in the east and west of Ancona, characterized by Pliocene–Pleistocene clay soils (e.g., Centamore et al., 1982; Cancelli et al., 1984; Fiorillo, 2003). The landslide deposits, whenever it was possible to represent them on a 1:25 000 map, were distinguished to be unstable (MUSa1) or stable (MUSa1q). The Ancona landslide, at west of Ancona, represents one of these instabilities.
The alluvial deposits (MUSbn) comprise the terraces and consist of heterometric silt–gravel units. They are spread across the city of Ancona and their thickness is variable from point to point but on the order of 15–50 m. In more urbanized areas, they can be completely covered by anthropic sediments, 2 m thick, consisting of coarse calcareous pebbles mixed to the old natural soil.
2.2 EMERSITO INGV intervention
EMERSITO is the INGV task force devoted to site effect and microzonation studies during significant seismic crises in Italy. As for other INGV task forces, EMERSITO is activated for earthquakes exceeding magnitude 5.0 or whenever the observed damage is likely due to local amplification effects. Since its official constitution in 2015, the group has consisted of a variable number of people, to date about 50 INGV employees on a voluntary basis, among researchers, technicians and technical collaborators, and involves various INGV departments and offices spread throughout the Italian territory. An operational protocol regulates the operation of the group, organized by two national coordinators that lead a management team that includes a contact person for each INGV office. EMERSITO worked in the 2016–2017 central Italy seismic sequence (Cara et al., 2019; Priolo et al., 2020; Milana et al., 2020) and the 2017 Ischia emergency (Nardone et al., 2023), but the group participated, in an unofficial form, also in previous Italian emergencies (San Giuliano di Puglia, 2002; Palermo, 2002; L'Aquila, 2009; and Emilia-Romagna, 2012), increasing its experience in this research field.
From the beginning of the emergency, EMERSITO started its activities by organizing itself in specific working groups mainly to collect a variety of information regarding the epicentral area: geology, damage surveys, previous studies on site effects and microzonation, seismic data by nearby stations of the National Seismic Network run by the INGV (INGV Rete Sismica Nazionale (RSN), 2005) and Italian Strong Motion Network run by the Civil Protection (Rete Accelerometrica Nazionale, RAN; PCM-CPD, 1972). This information has been uploaded to an online WebGIS project (Cogliano and Famiani, 2018), shared with and updatable in real time by all the users located in different offices of INGV (Fig. 5). This procedure was useful for sharing the knowledge of the area and the ideas on the intervention through live and virtual meetings, which guided the preliminary field inspections and the deployment of the seismic temporary network.
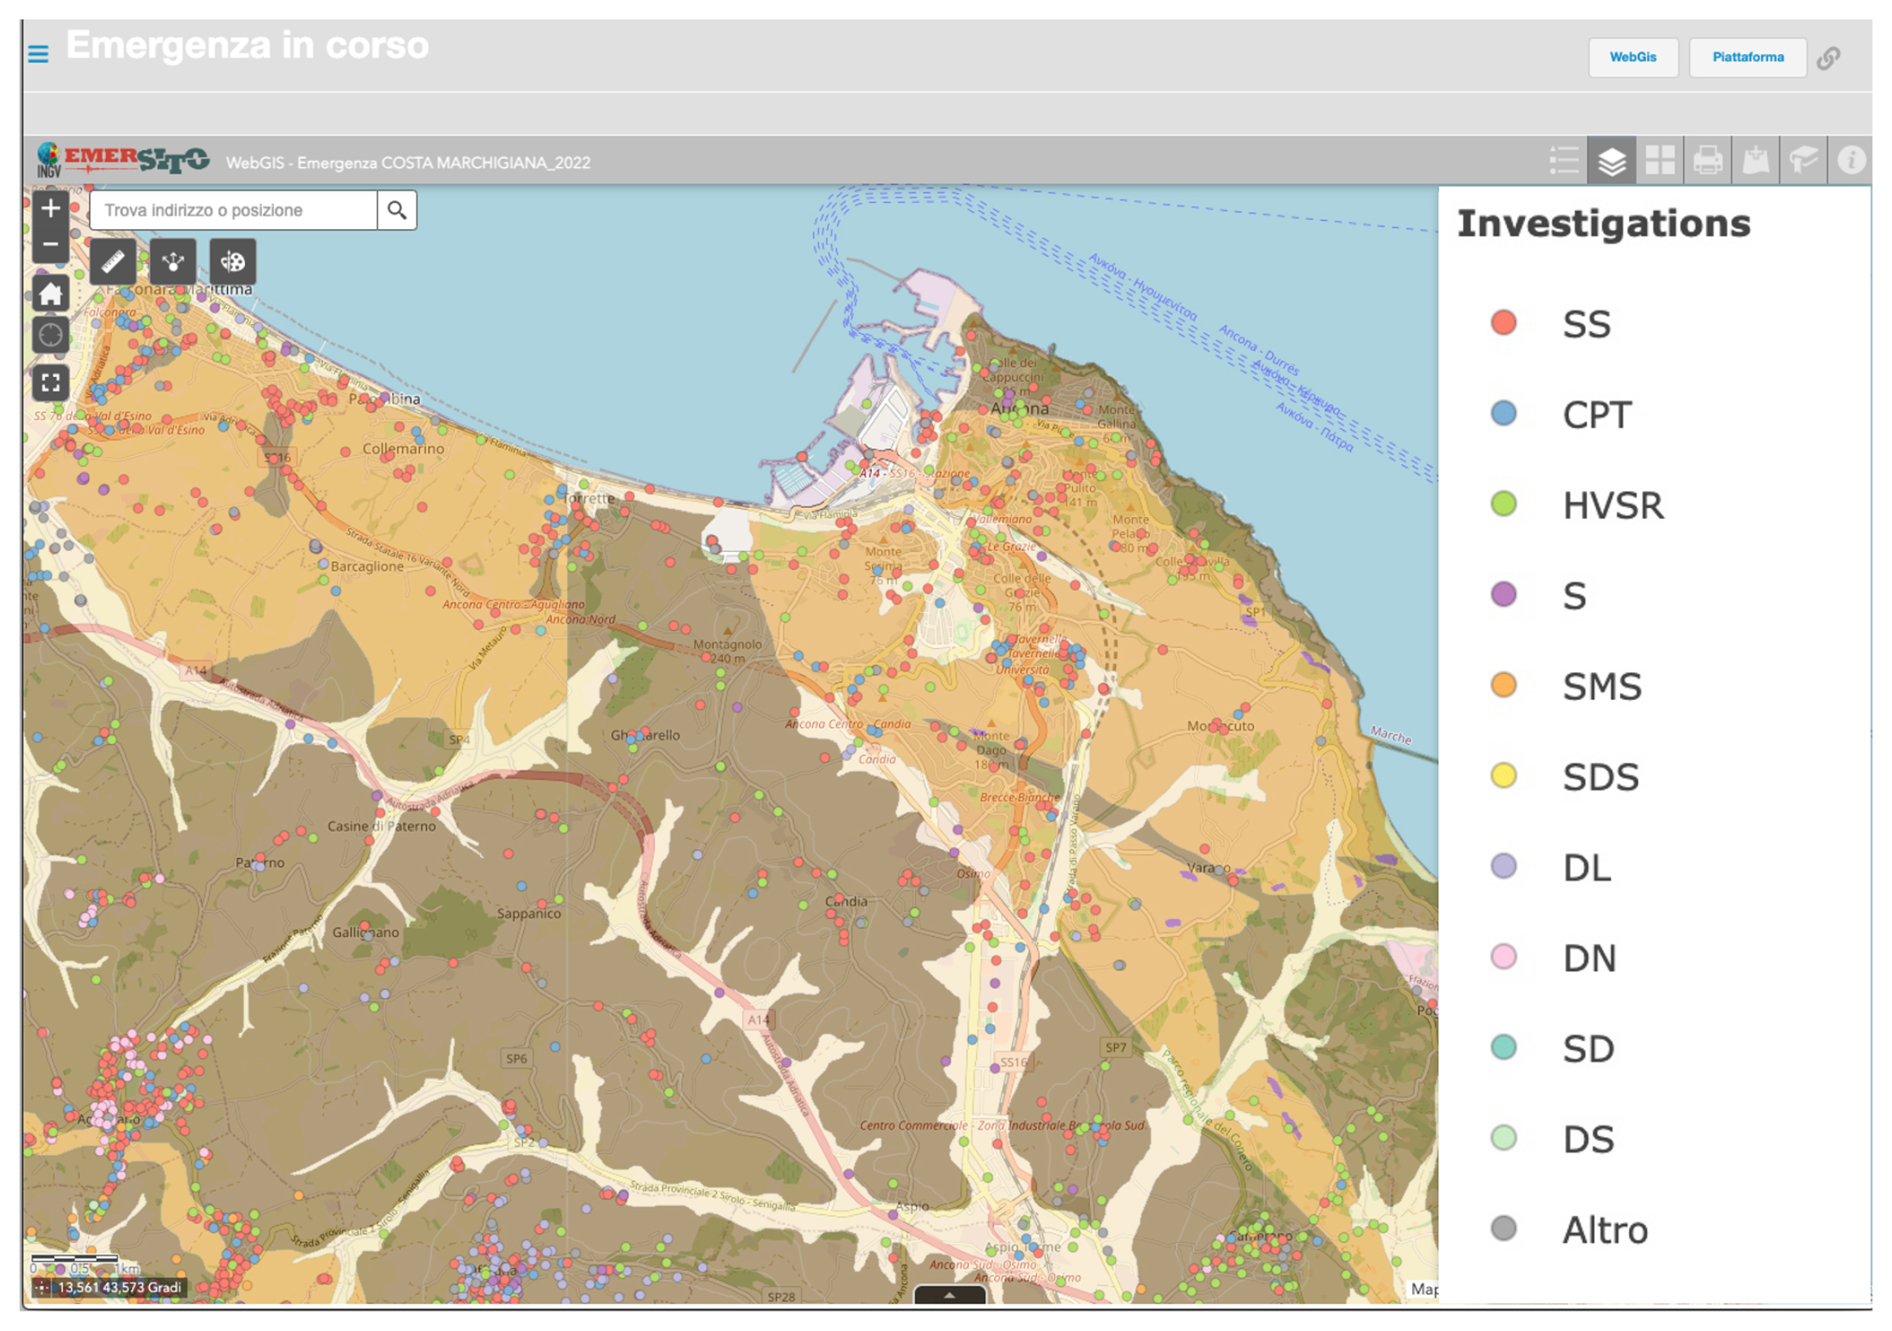
Figure 5Example of the layout used in the online WebGIS project of EMERSITO (Cogliano and Famiani, 2018), showing the Adriatic coast of Ancona, the lithological map and the available surveys used in microzonation studies (colored dots). The map was created using ArcGIS® software by Esri. ArcGIS® and ArcMap™ are the intellectual property of Esri and are used herein under license. Copyright © Esri. © OpenStreetMap contributors 2024. Distributed under the Open Data Commons Open Database License (ODbL) v1.0. The lithological data (Amanti et al., 2007) are distributed under the CC-BY 4.0 license.
The initial planning was carried out remotely considering the available level 1 seismic microzonation study that incorporates noise measurements, downholes and boreholes with stratigraphy (https://qmap-protciv.regione.marche.it/cs/, last access: 1 May 2025), and preliminary evidence of earthquake-induced damage coming from the other INGV task forces (SISMIKO, EMERGEO and QUEST). QUEST in particular has provided first indications about the most damaged areas in terms of affected buildings (Tertulliani et al., 2022): they reported a macroseismic intensity of V (EMS-98) for Ancona and individuated state of damage of up to the third degree in some buildings in the downtown area and damage of 1–2° in a suburban neighborhood for some recent reinforced concrete buildings (vulnerability class C and D). Afterwards, the fire brigade performed a detailed survey for all buildings and public areas, distinguishing between the partial and complete banning of buildings and the banning of outdoor public areas (Fig. 2).
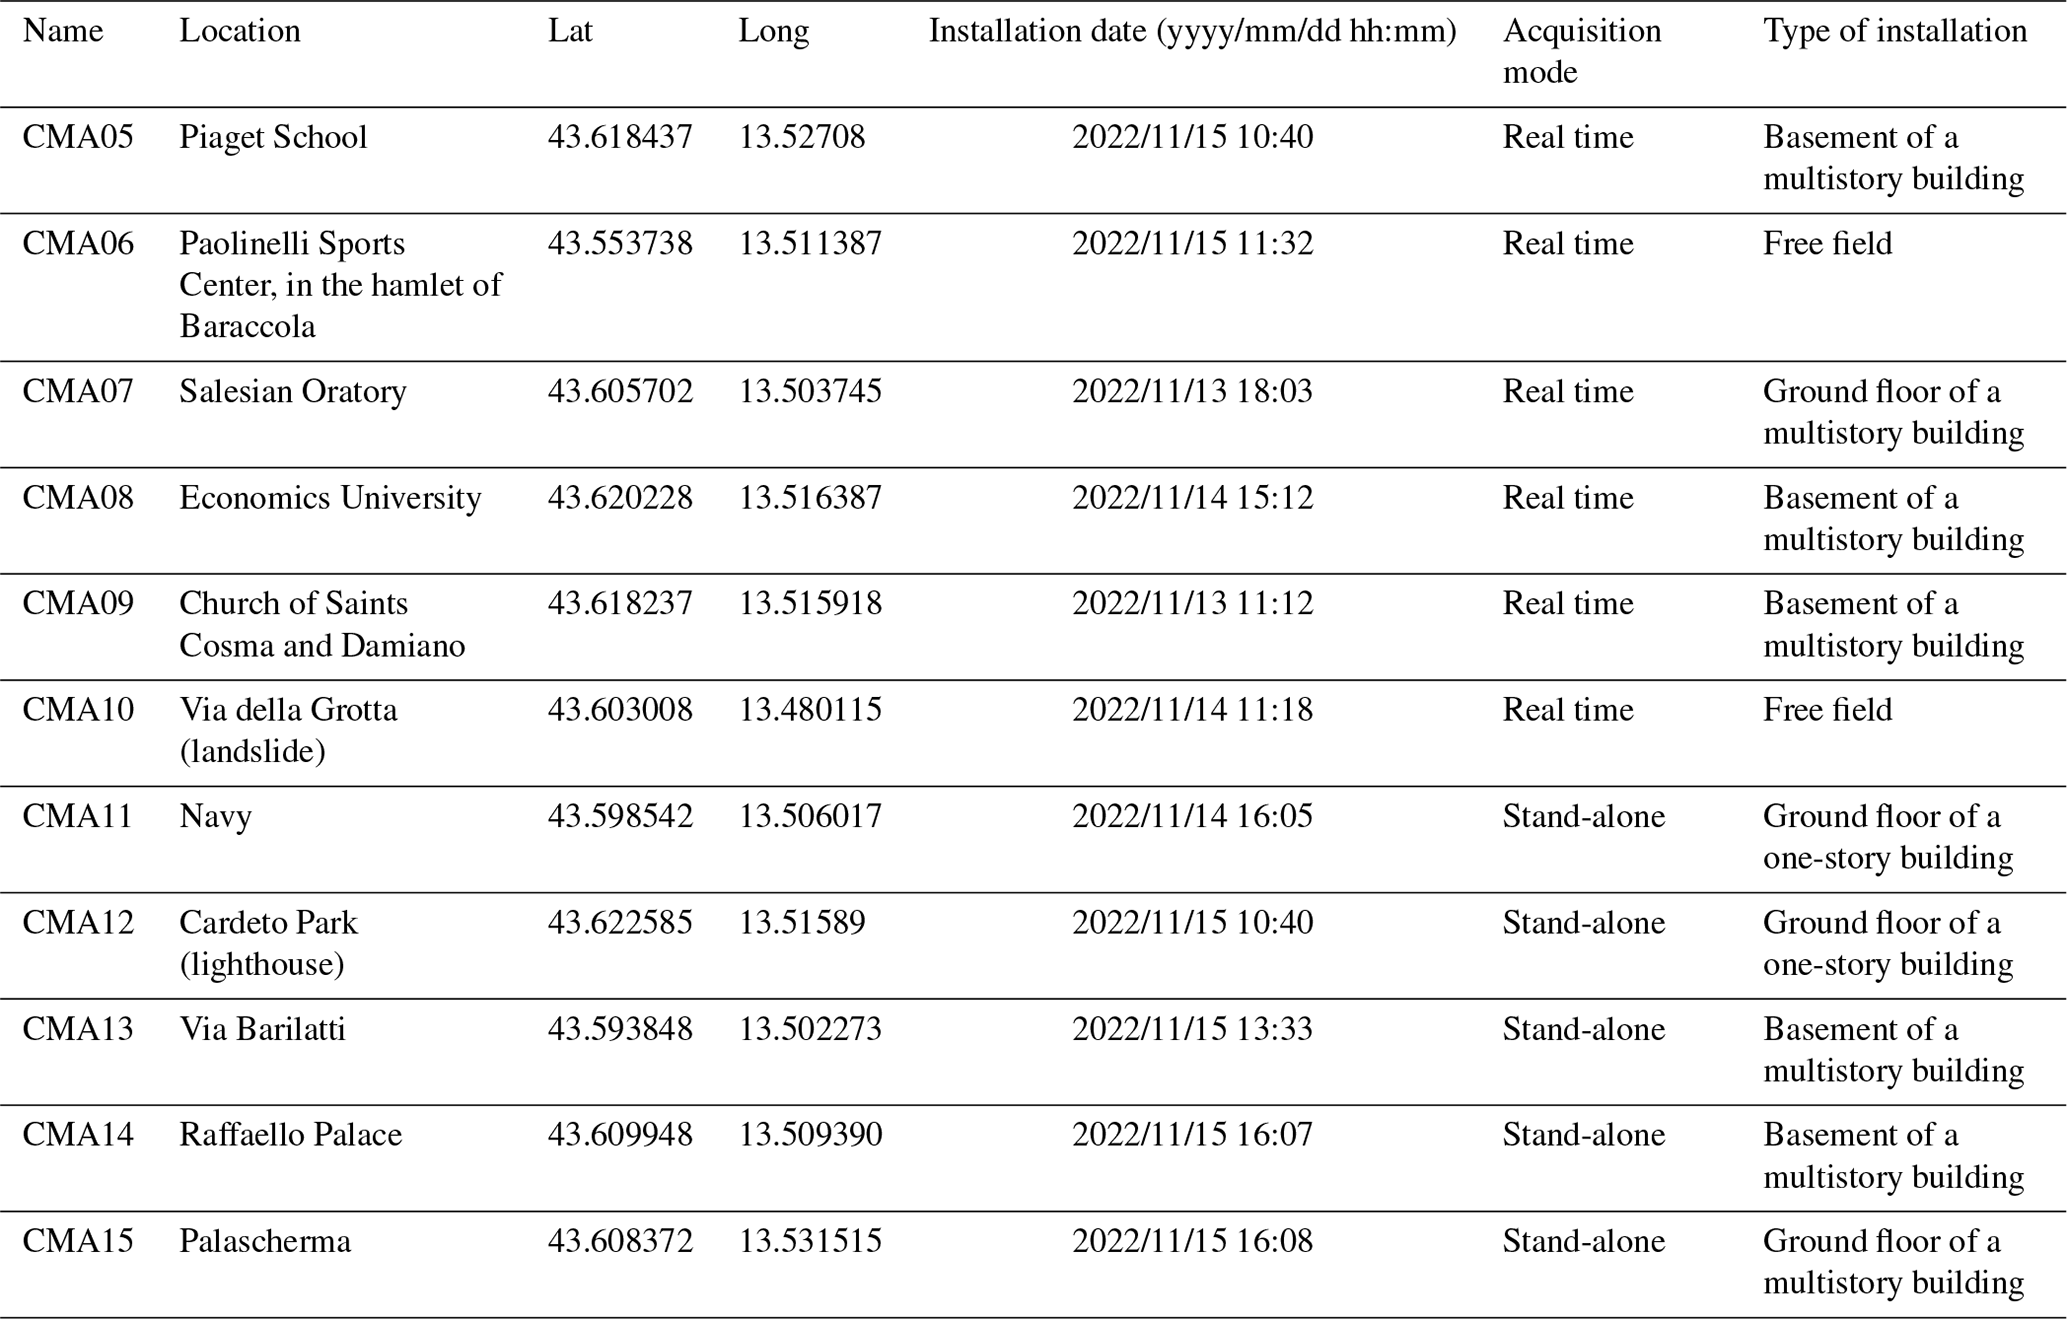
Table 2List of the sites of the 6N seismic network equipped with both accelerometric and velocimetric sensors. The dismissal date of the stations was 24 February 2023.
Ad hoc site inspections were carried out in collaboration with the INGV Ancona office, which has become a logistic support for all the task forces. It was then possible to contact several institutions, i.e., the Marche region (Albarello et al., 2022), the regional civil protection, the Municipality of Ancona and the navy headquarter in Ancona. They were really collaborative, giving us suitable places for station deployments, helping us find further investigation points and technical reports in the vicinity of the sites. The final choice of the sites was also made on the basis of fast single-station ambient noise measurements in order to have a first-order evaluation of possible resonance effects.
As aforementioned, the city suffered a low level of damage, and then it did not have any major impact on its usual activities. For this reason, installations inside buildings have been preferred to guarantee continuous power supply and security of the seismic stations. We then identified ground floors, basements or courtyards of private and public buildings, such as schools, universities, sports centers, Palace of the Marche Region and religious structures.
Although the EMERSITO intervention was not focused on the landslide hazard, we decided to install one station (CMA10) in the western part of Ancona, where the deep landslide moved in 1982.
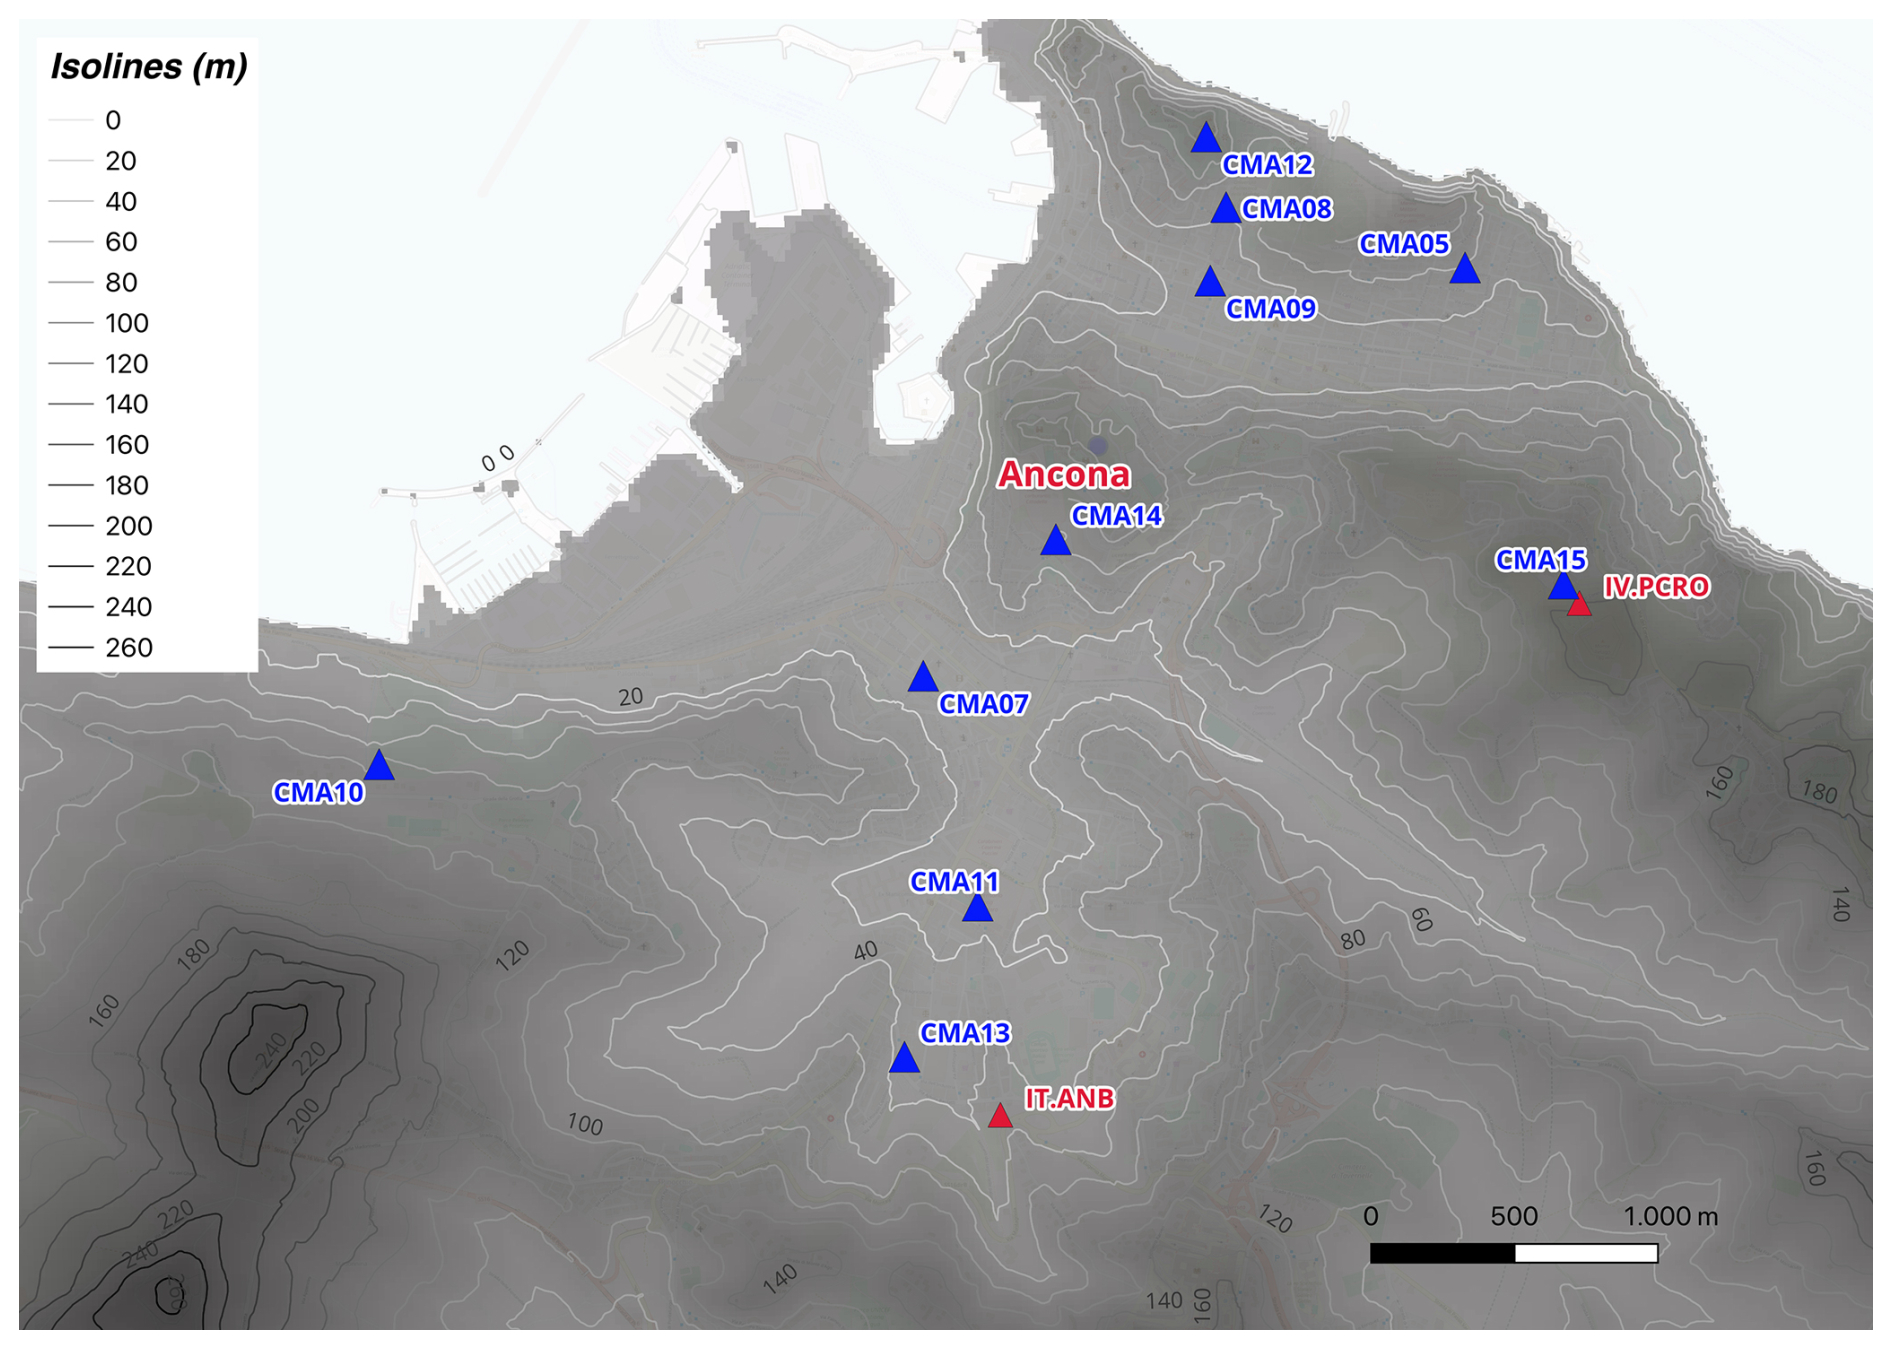
Figure 6Topography map with the isoline of the Ancona area. The blue triangles represent most of the stations of the 6N EMERSITO network, and the orange triangles are the two permanent stations of RAN (IT.ANB) and RSN (IV.PCRO). © Tarquini et al. (2007). The map has been realized with QGIS (QGIS Development Team, 2024).
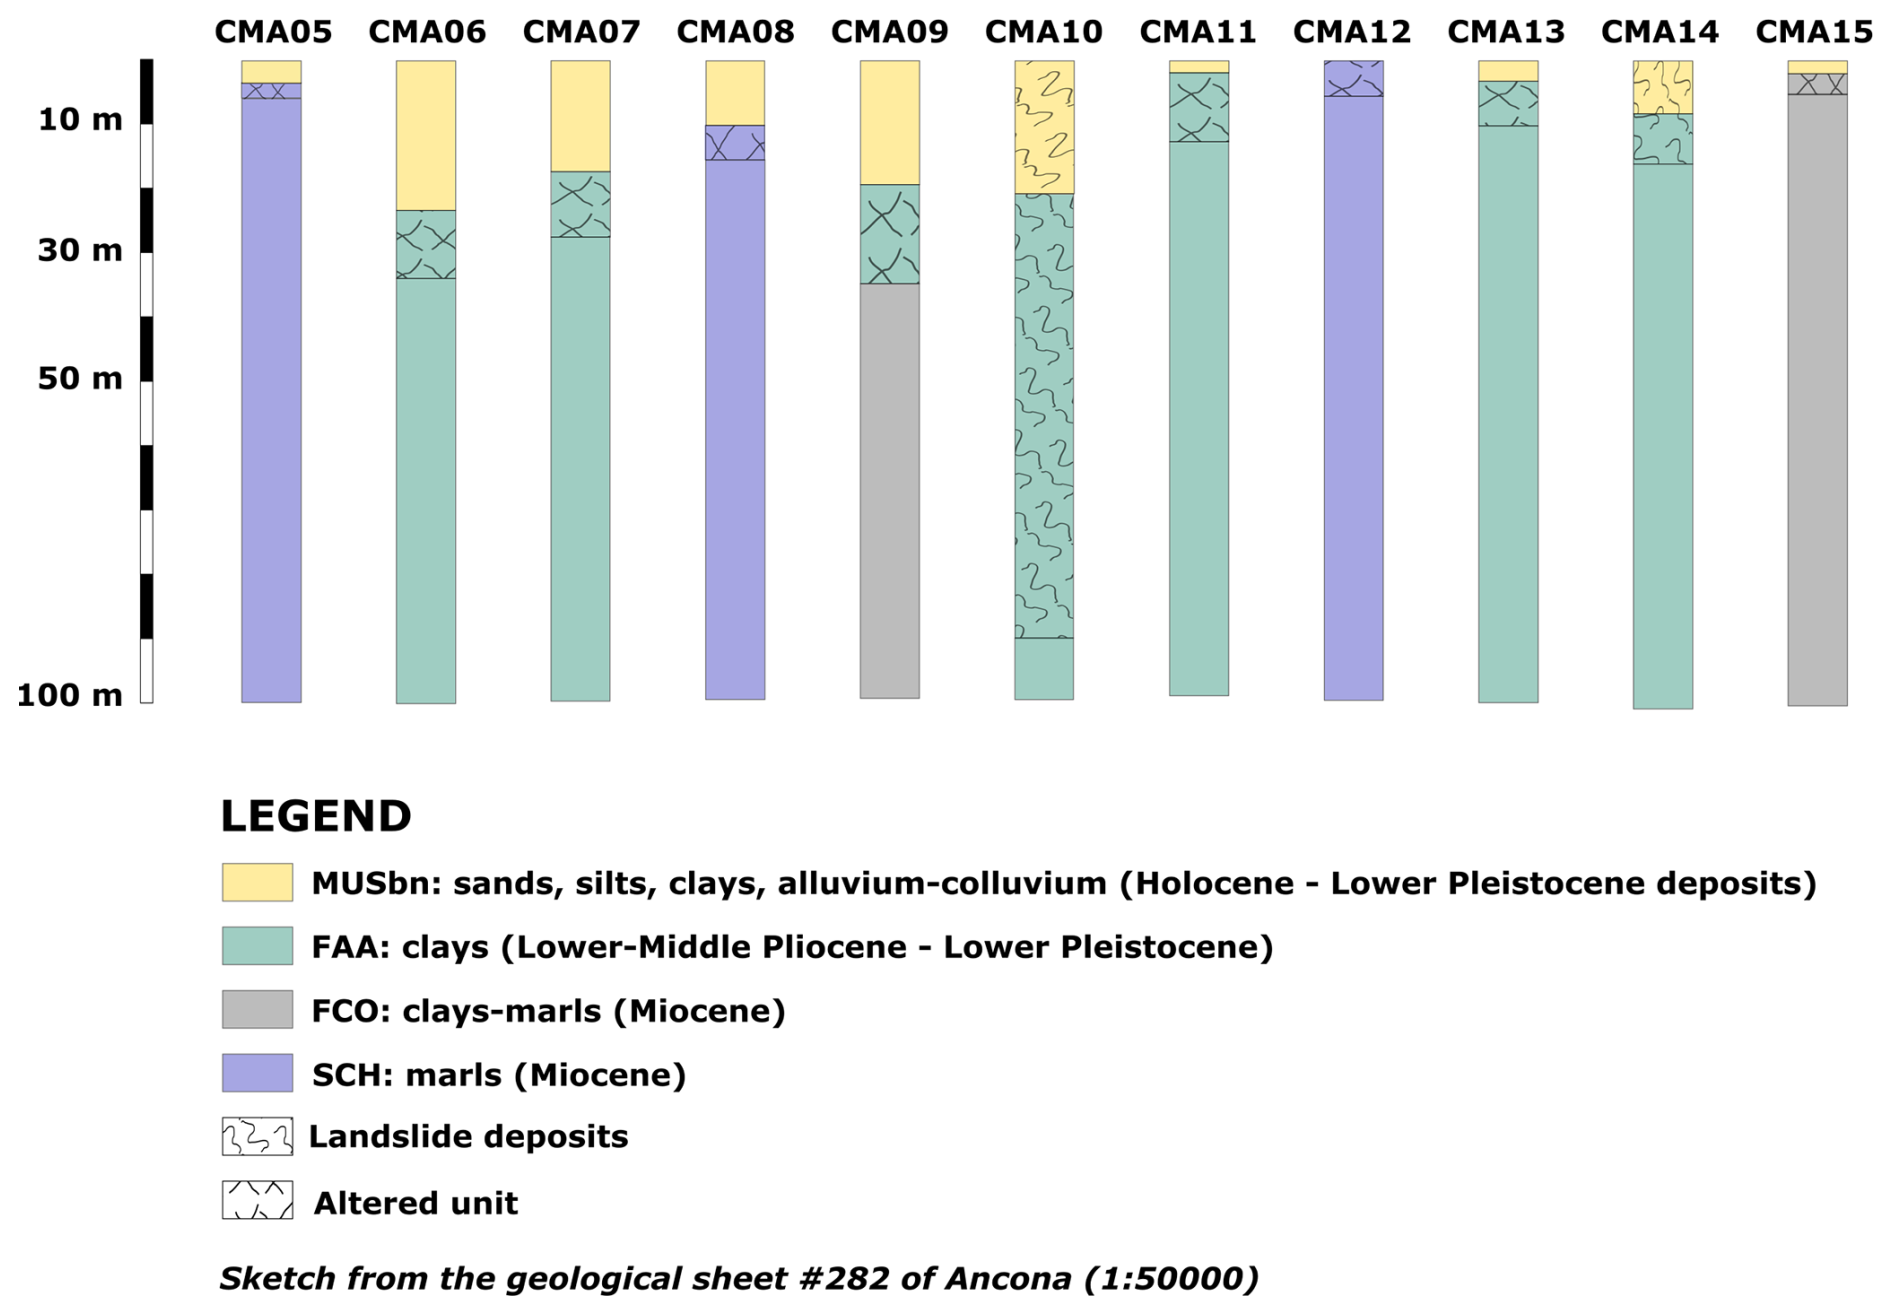
Figure 7One-dimensional stratigraphic models derived at the sites where 6N seismic stations are located.
After this preliminary phase, the final configuration of the temporary EMERSITO network covered the urban area of the Ancona municipality and consisted of 11 six-channel digitizers coupled with velocimetric (Lennartz 3D-5 s) and accelerometric (Kinemetrics EpiSensor) sensors. Figure 4 illustrates the position of the seismic stations in relation with the outcropping geology, while Table 2 shows their location, coordinates, date of installation and data transmission mode. The EMERSITO temporary seismic network was registered with the International Federation of Digital Seismograph Networks (FDSN, https://www.fdsn.org/, last access: 1 May 2025) with the network code 6N (https://fdsn.org/networks/detail/6N_2022/, last access: 1 May 2025). At the same time, station codes have been registered with the International Seismological Center (ISC, http://www.isc.ac.uk, last access: 1 May 2025).
Most of the stations are installed close to the most damaged areas (compare with Fig. 2); CMA06 is in the new industrial area in the south and CMA10 in the 1982 landslide area, close to the district of Posatora.
A difficult task was the identification of sites characterized by the presence of outcropping stiff lithologies where to install a reference station. After several tests, we found a possible reference site on the so-called Colombacci Formation (FCO), i.e., clay marls of the Miocene age, about 90 m from IV.PCRO station, free from clear resonance effects on noise, and installed the reference station CMA15 (Figs. 4 and 6).
The topography at the Ancona downtown area is not flat (Fig. 6). The average elevation is about 70 m, but there are some hills that reach about 180–250 m and quickly slope towards the Adriatic Sea. Stations CMA15 and IV.PCRO are on a hill 140–160 m high, whereas station CMA12 was placed on the top of a hill 100 m high that quickly slopes towards the Adriatic Sea and where there is also the lighthouse of Ancona (Fig. 6). To avoid possible soil interaction with the lighthouse, the station was placed at about 30 m from it, inside a building of the navy facilities.
Figure 7 shows the one-dimensional stratigraphic models under the installation sites based on the available boreholes close to the stations and, to our interpretation, information on the geological evolution of the area. The information used for the construction of these one-dimensional stratigraphic models was located at a distance between 5 and 250 m from the stations, determining different levels of reliability and uncertainty in the models, especially for the non-outcropping layers, considering the lateral variability and the different thickness and lithologies encountered.
The models reach a depth of 100 m and are characterized by a variable thickness of altered/fractured layers. In particular, CMA06, CMA07 and CMA11 stations, installed in flat valley areas, are composed of fine alluvial unconsolidated deposits (MUSb2) above the clayey formation of Argille Azzurre (FAA). CMA05, CMA08, CMA09, CMA13, CMA14 and CMA15 stations are installed in quite flat areas, and their stratigraphy features fine and more heterometric colluvial unconsolidated deposits (MUSb2, MUSbn) above the clayey (Argille Azzurre FAA) or marly (Schlier, SCH) or clayey–marly (Argille a Colombacci, FCO) geological formations. CMA10 is installed on the 1982 landslide sediments (MUSa1), whereas CMA12 is set on SCH formation in a topographic relief.
3.1 Data availability
The installation of the seismic stations was completed in 3 d, and the 6N network was fully operative for 3 months, from 13 November 2022 until 24 February 2023.
The six stations in real-time acquisition mode (Table 2) transmitted data as well as their state of health (SOH), such as input voltage and quality of GPS signal received, to the EMERSITO servers. Data availability and SOH were frequently checked with dedicated software tools. During the acquisition period, several maintenance interventions were carried out to download data from stand-alone stations and to verify their correct operation.
Raw data were converted into the standard binary miniSEED format and organized in a structured seismic archive (following the SeisComP data structure). Then, data quality and completeness were checked, and all the relevant information was used for creating the metadata volumes with the perspective to upload them in the INGV node of the European Integrated Data Archive portal (EIDA; Danecek et al., 2021, https://eida.ingv.it/en/, last access: 1 May 2025).
All continuous data have been transferred to EIDA and are currently available to everyone interested. The dataset acquired by the EMERSITO temporary network 6N and described in this paper can be accessed under https://doi.org/10.13127/sd/qctgd6c-3a (EMERSITO Working Group, 2024) according to a set of rules defined by the INGV data management office (Open Data Portal, ODP, https://data.ingv.it/en/, last access: 1 May 2025) and EMERSITO.
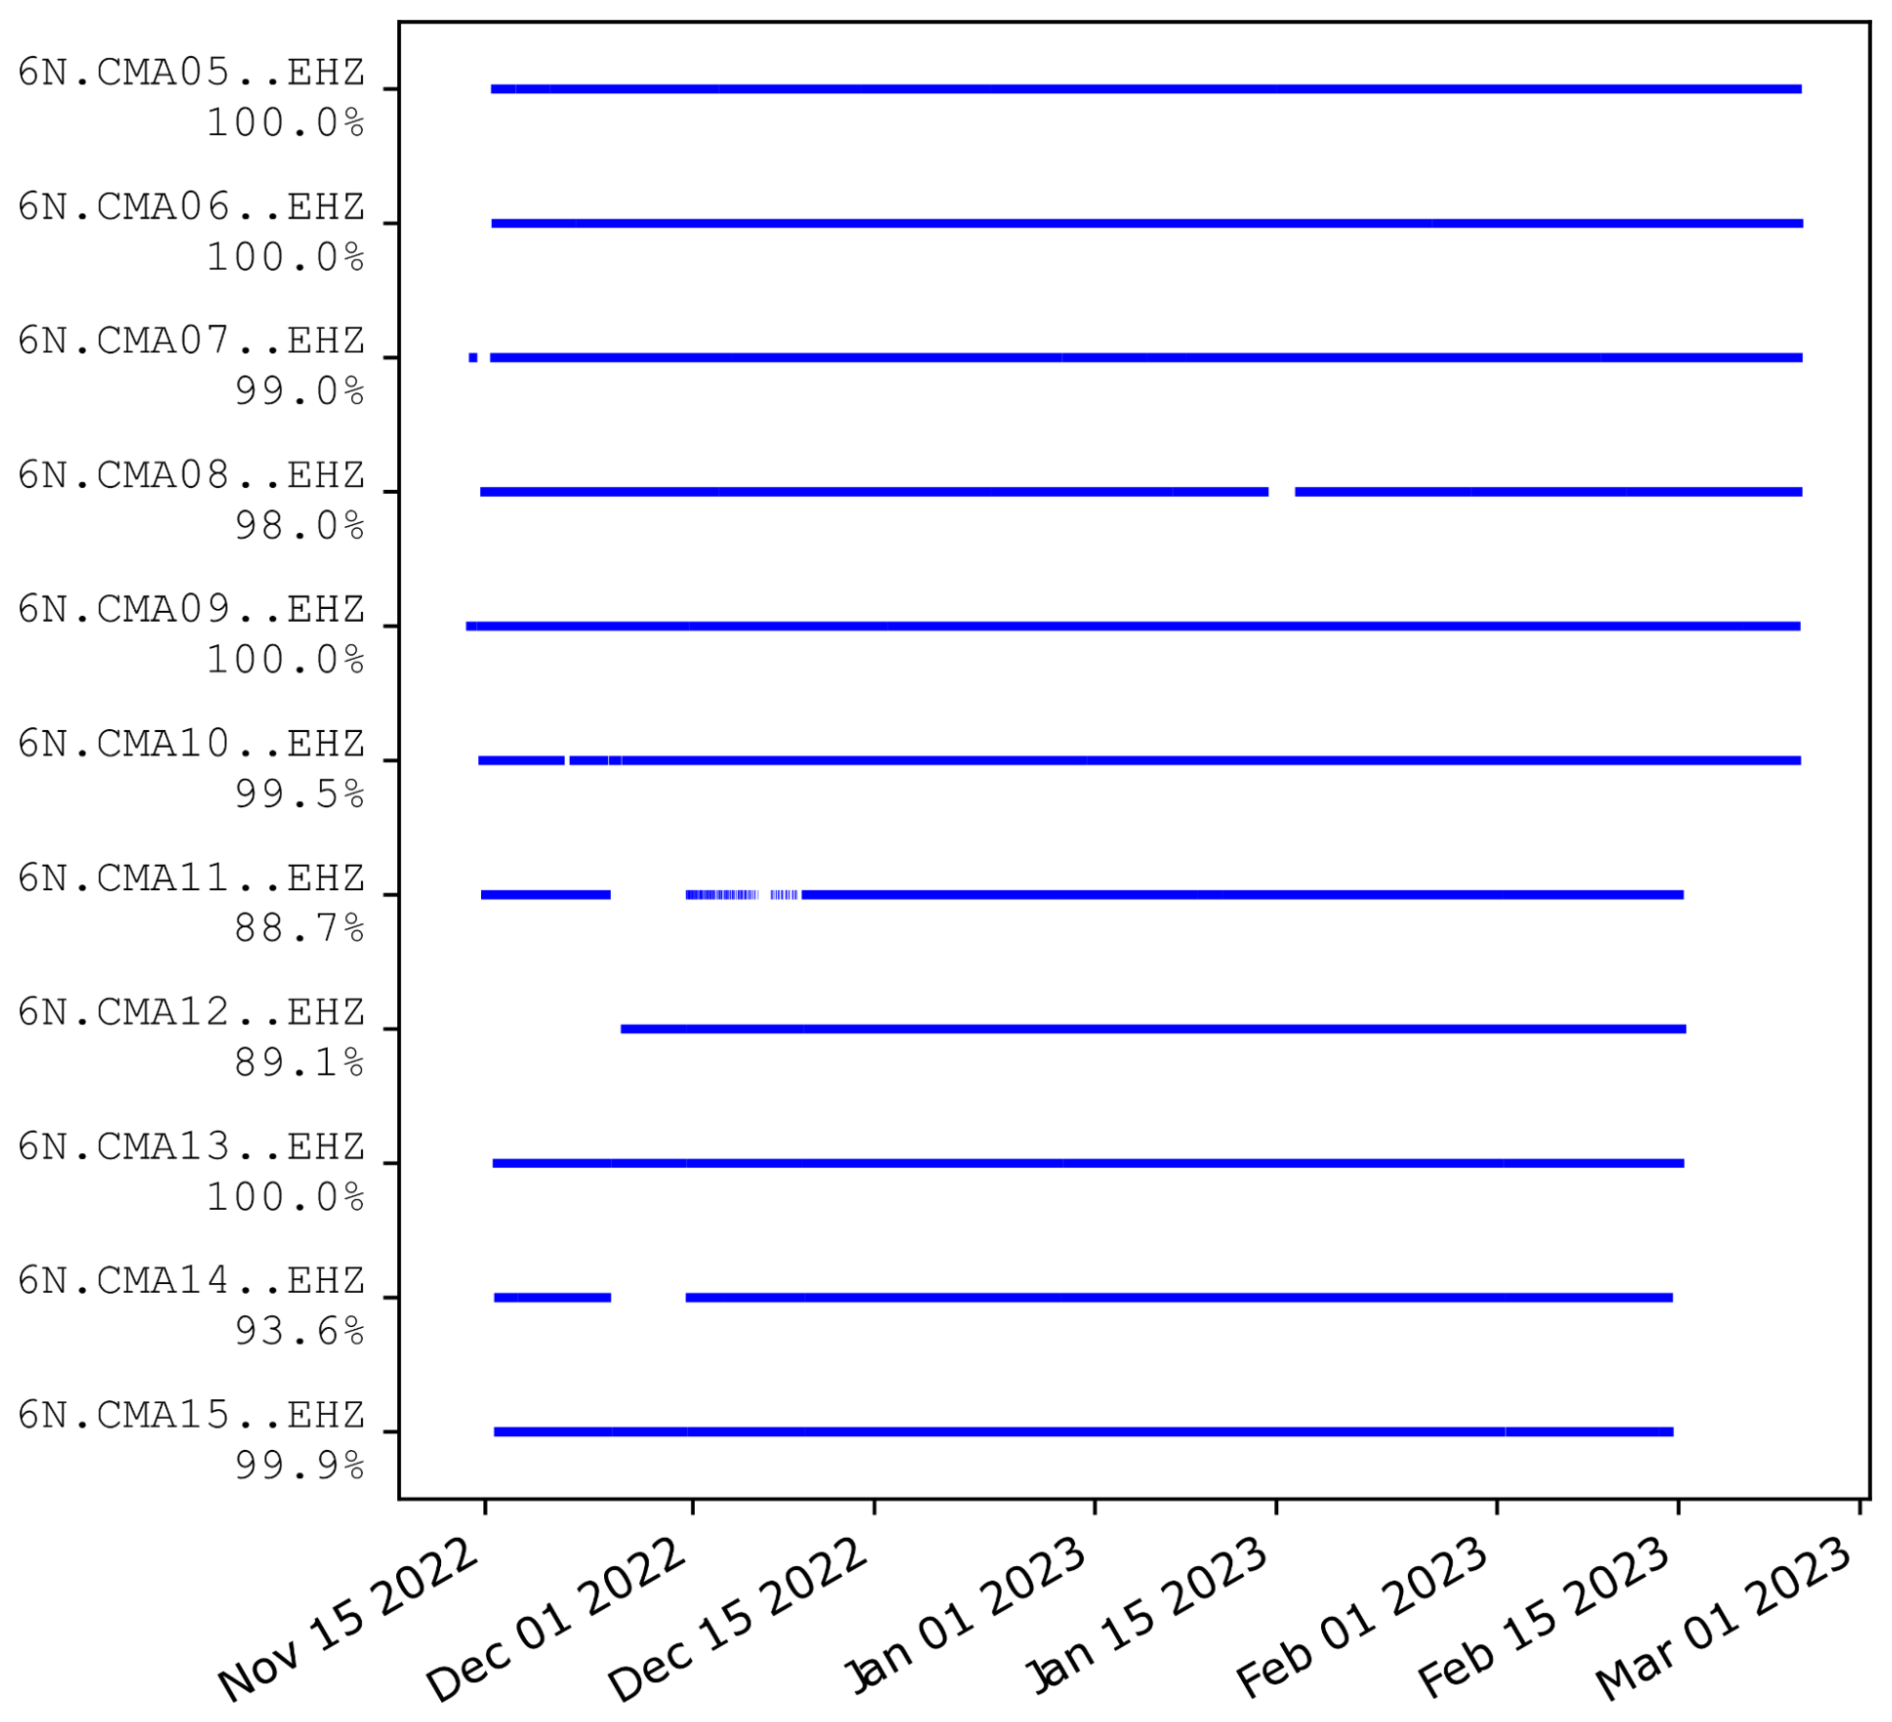
Figure 8 shows availability of recordings for each station of the 6N network as a function of time. The gaps in the records of some stations were caused by some malfunctions, in general due to power failures; however, data completeness turned out to be quite satisfactory for all the stations, with an average value of about 97 %.
3.2 Data quality
In order to characterize the seismic background noise at the seismic stations of the temporary EMERSITO 6N network, we computed the power spectral density (PSD) using the three-component continuous signals.
PSD and probability density functions (PDFs) were obtained from the waveform data and the corresponding response files using the PPSD class (https://docs.obspy.org/packages/autogen/obspy.signal.spectral_estimation.PPSD.html, last access: 1 May 2025) of ObsPy (https://docs.obspy.org/, last access: 1 May 2025), a Python toolbox for seismology (Beyreuther et al., 2010), in which the computation of the PSD and PDFs is based on the algorithm proposed by McNamara and Buland (2004). For each seismic channel, the software computes the PDFs from the distribution of the PSD values at each spectral interval, providing the probability of occurrence of a given seismic signal level in a fixed frequency interval.
We used the 90th-percentile curves to get a robust estimate of the noise level and to compare it between different stations, as shown in Fig. 9 for the three components of motion. They are often above the reference curves (new high and new low noise models, NHNM and NLNM, respectively) as computed by Peterson (1993). This was expected because the stations are located in a highly urbanized area. The high noise level occurs mainly at frequencies above 1 Hz during the daytime, and there is a strong reduction in the noise level during the nighttime (about 10–15 dB) and also during the daytime on Christmas holidays (by about 5 dB) (Fig. S1a in the Supplement).
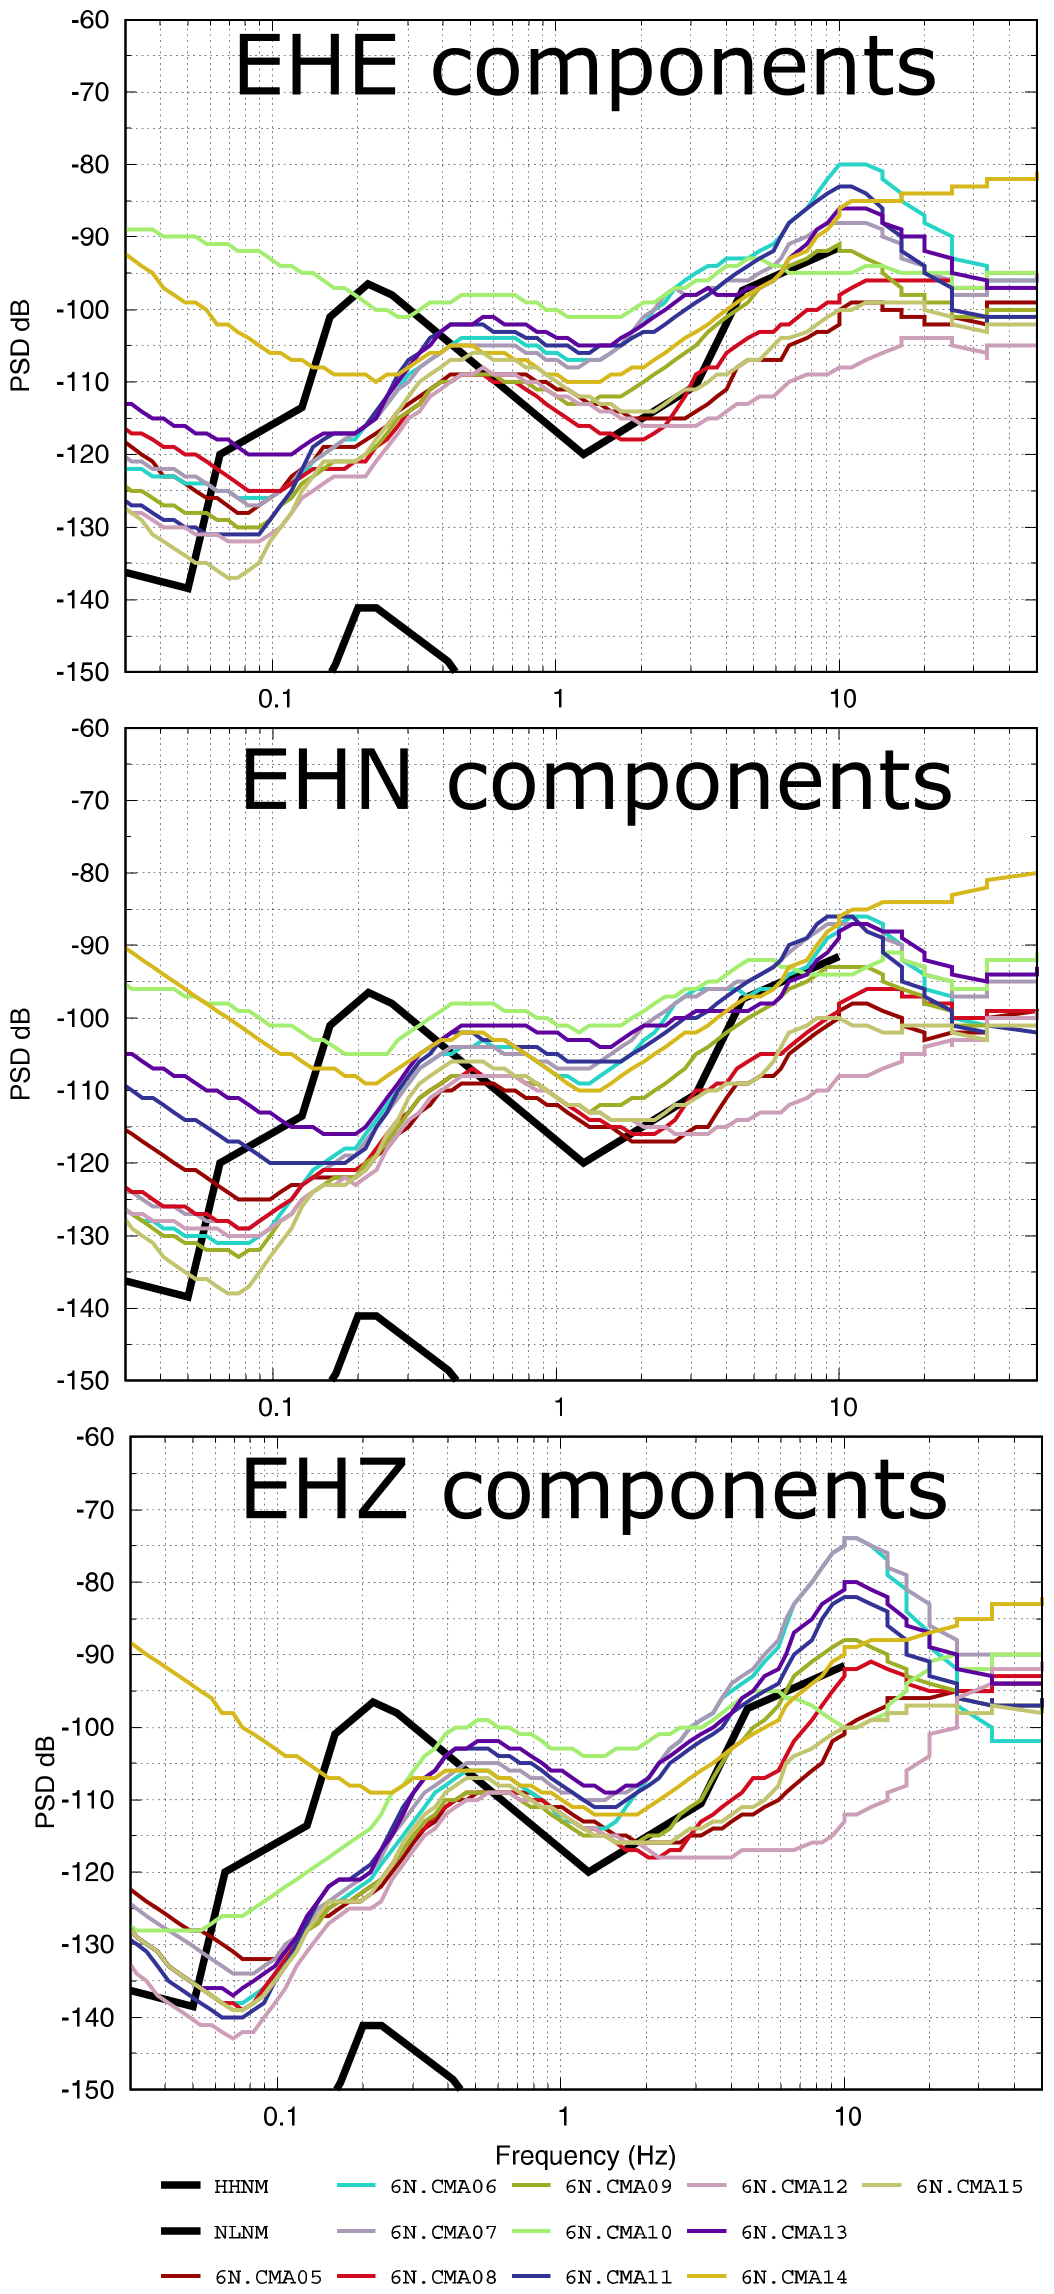
Figure 9PSD 90th-percentile curves computed for all stations on the three components of motion.
The inspection of spectral and time amplitude levels allowed us to evaluate the suitability of the installation sites and find critical situations. In particular, the CMA10 station was initially installed inside a shelter that hosts electronic devices for monitoring movements of the active landslide. This situation negatively affected the data quality of this station (Fig. S1b) with evident disturbances on the recordings. Consequently, the station was moved outside the structure, about 2 m away from the previous position, obtaining an improvement in the data quality, with more stable and lower amplitude spectra (although some artifacts are still present at about 20 s).
3.3 Recorded earthquakes
During the operating time of network 6N, there were 258 aftershocks of the Marchigiana–Pesarese seismic sequence with 2.0 ≤ M < = 2.9, 28 with 3.0 ≤ M ≤ 4.0 and 1 with M = 4.2 that was the strongest one after the mainshock (Fig. 10a). Eight M ≥ 3.0 events are related to other local seismic sources in Italy located at a maximum distance of 100 km from Ancona (Fig. 10b). Of course, not all the local events have been recorded by the stations of network 6N, or, although recorded, not all of them have good quality.
Seven M ≥ 4.0 events have an epicentral distance ranging from 100 to 500 km (Fig. 10c), and the network was also able to record the strong Turkish earthquake that occurred on 6 February 2022 (Mwpd 7.9) at a distance of about 2200 km from Ancona (Fig. 10d).
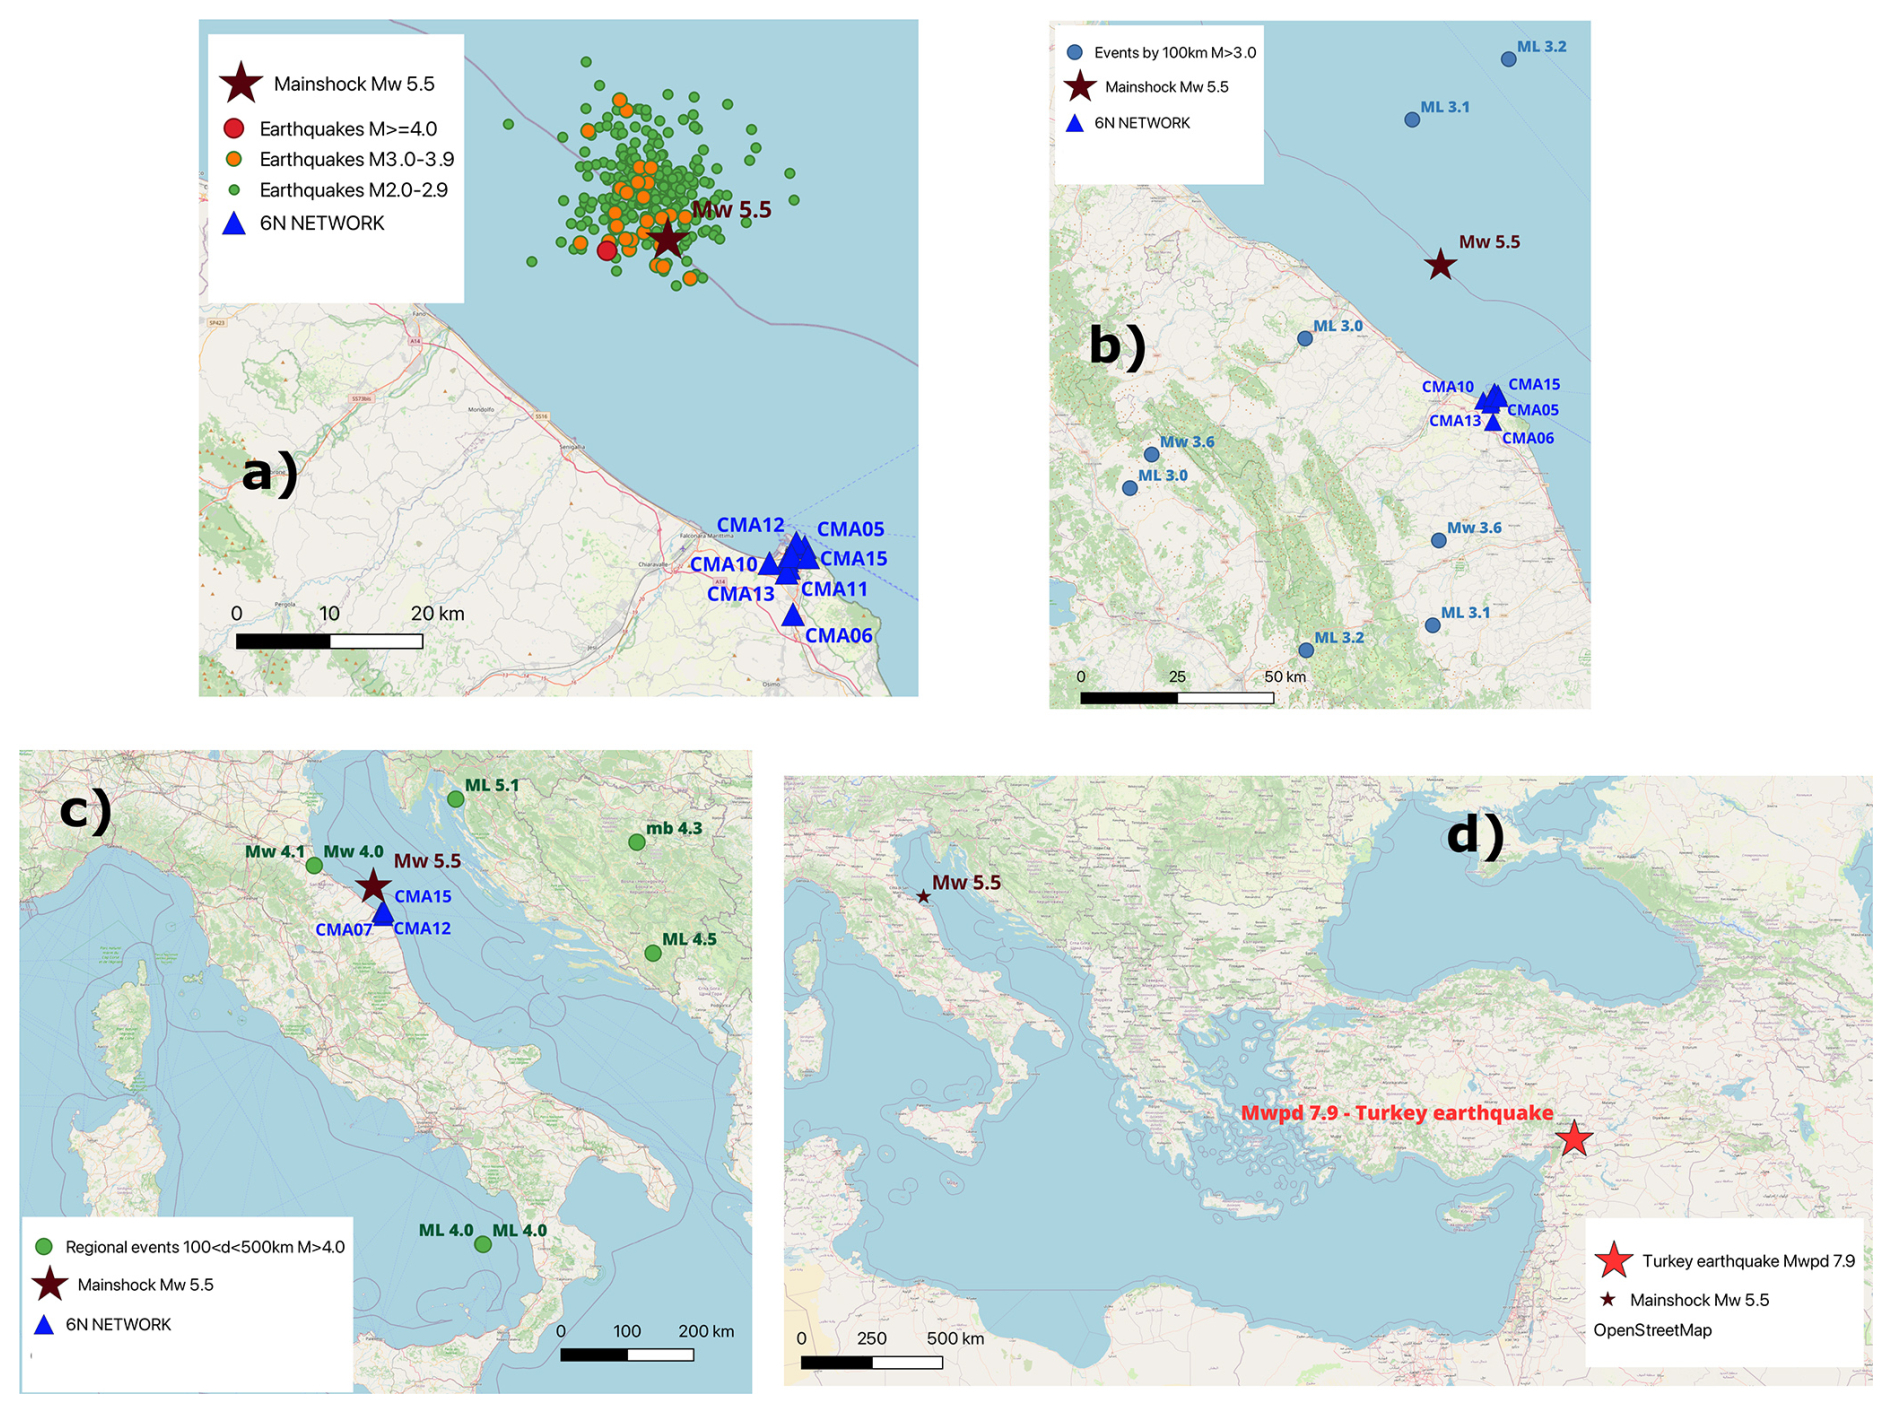
Figure 10Seismicity during the operation of the 6N network: (a) Costa Marchigiana–Pesarese seismic sequence; (b) events of other Italian seismic sources within 100 km of Ancona; (c) regional events; (d) teleseismic Türkiye event. The maps have been realized with QGIS (QGIS Development Team, 2024). © OpenStreetMap contributors 2024. Distributed under the Open Data Commons Open Database License (ODbL) v1.0.
Table 3Location and focal mechanism parameters of the two analyzed seismic events. EventID: numerical unique identifier of the INGV earthquakes database (http://terremoti.ingv.it, last access: 1 May 2025).
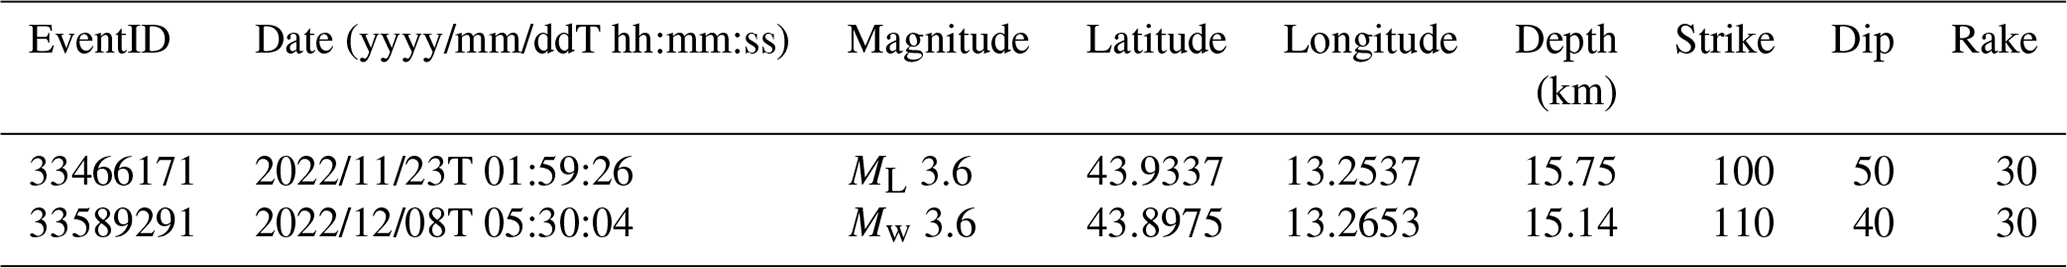
Figure 11 shows an example of the Mw 3.9 aftershock of 8 December at 07:08 UTC recorded by some 6N stations. The seismograms and the spectrograms highlight clear differences in the site response: CMA12 and CMA15 sites, located on stiff units (FCO and SCH formations, respectively), are characterized by short durations and small amplitudes, whereas stations installed on poor sediments over stiffer materials (CMA10, CMA13 and CMA14) show longer durations and higher amplitudes. The spectrograms also point out frequency variations.
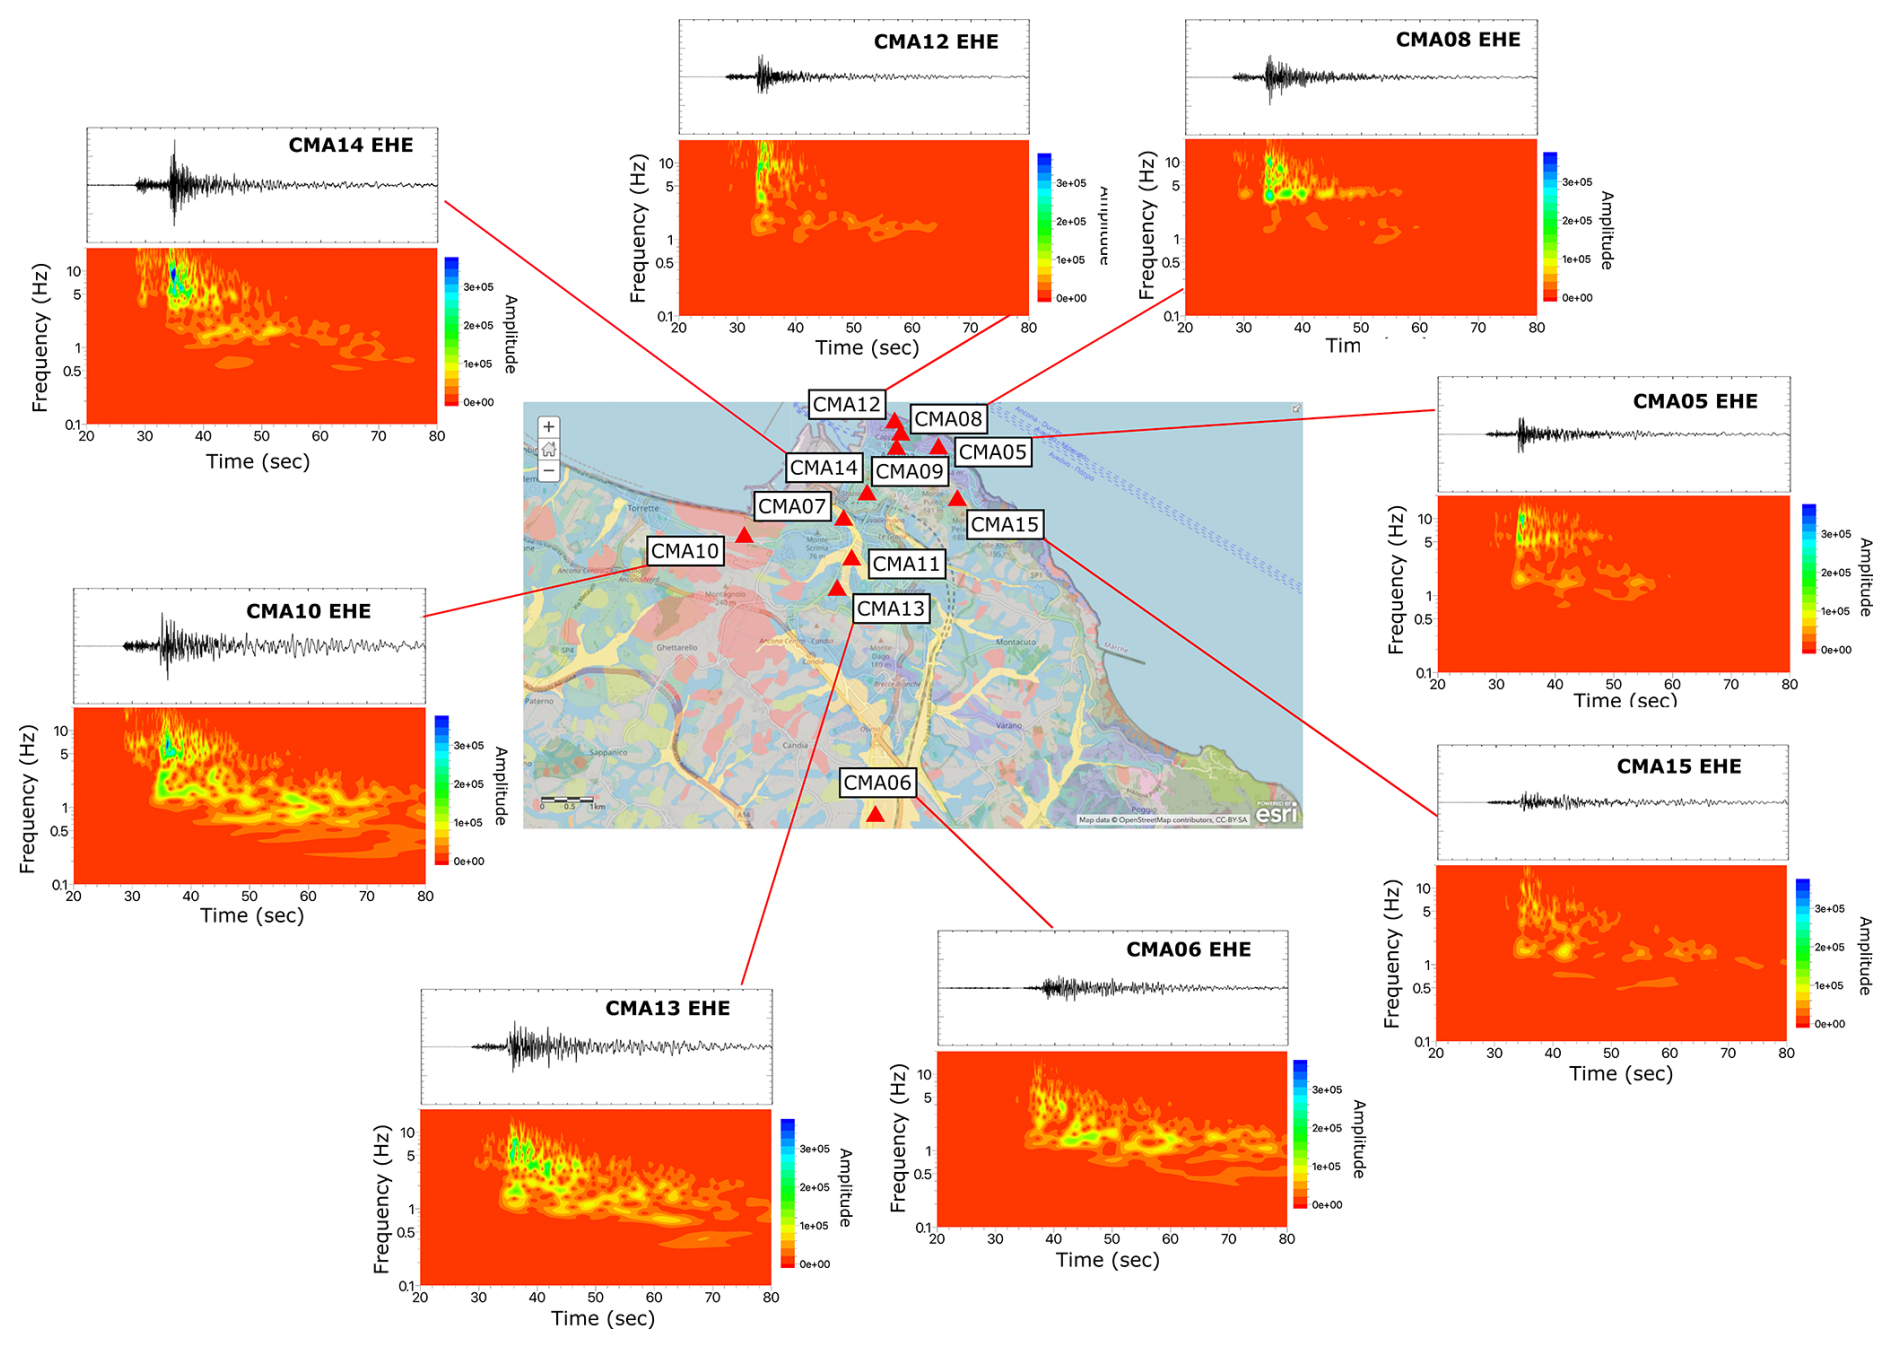
Figure 11Time series and spectrograms of the Mw 3.9 earthquake (EHE components) occurred the 8 December 2022 at 07:08:18 UTC for some stations of the 6N network. The map was created using ArcGIS® software by Esri. ArcGIS® and ArcMap™ are the intellectual property of Esri and are used herein under license. Copyright © Esri. © OpenStreetMap contributors 2024. Distributed under the Open Data Commons Open Database License (ODbL) v1.0. The geological data are distributed under the CC-BY 4.0 license. Graphics were realized using The MathWorks Inc. (2022).
Some differences can be also observed for low-frequency events, such as the teleseismic Mwpd 7.9 Turkish earthquake (Fig. 12).
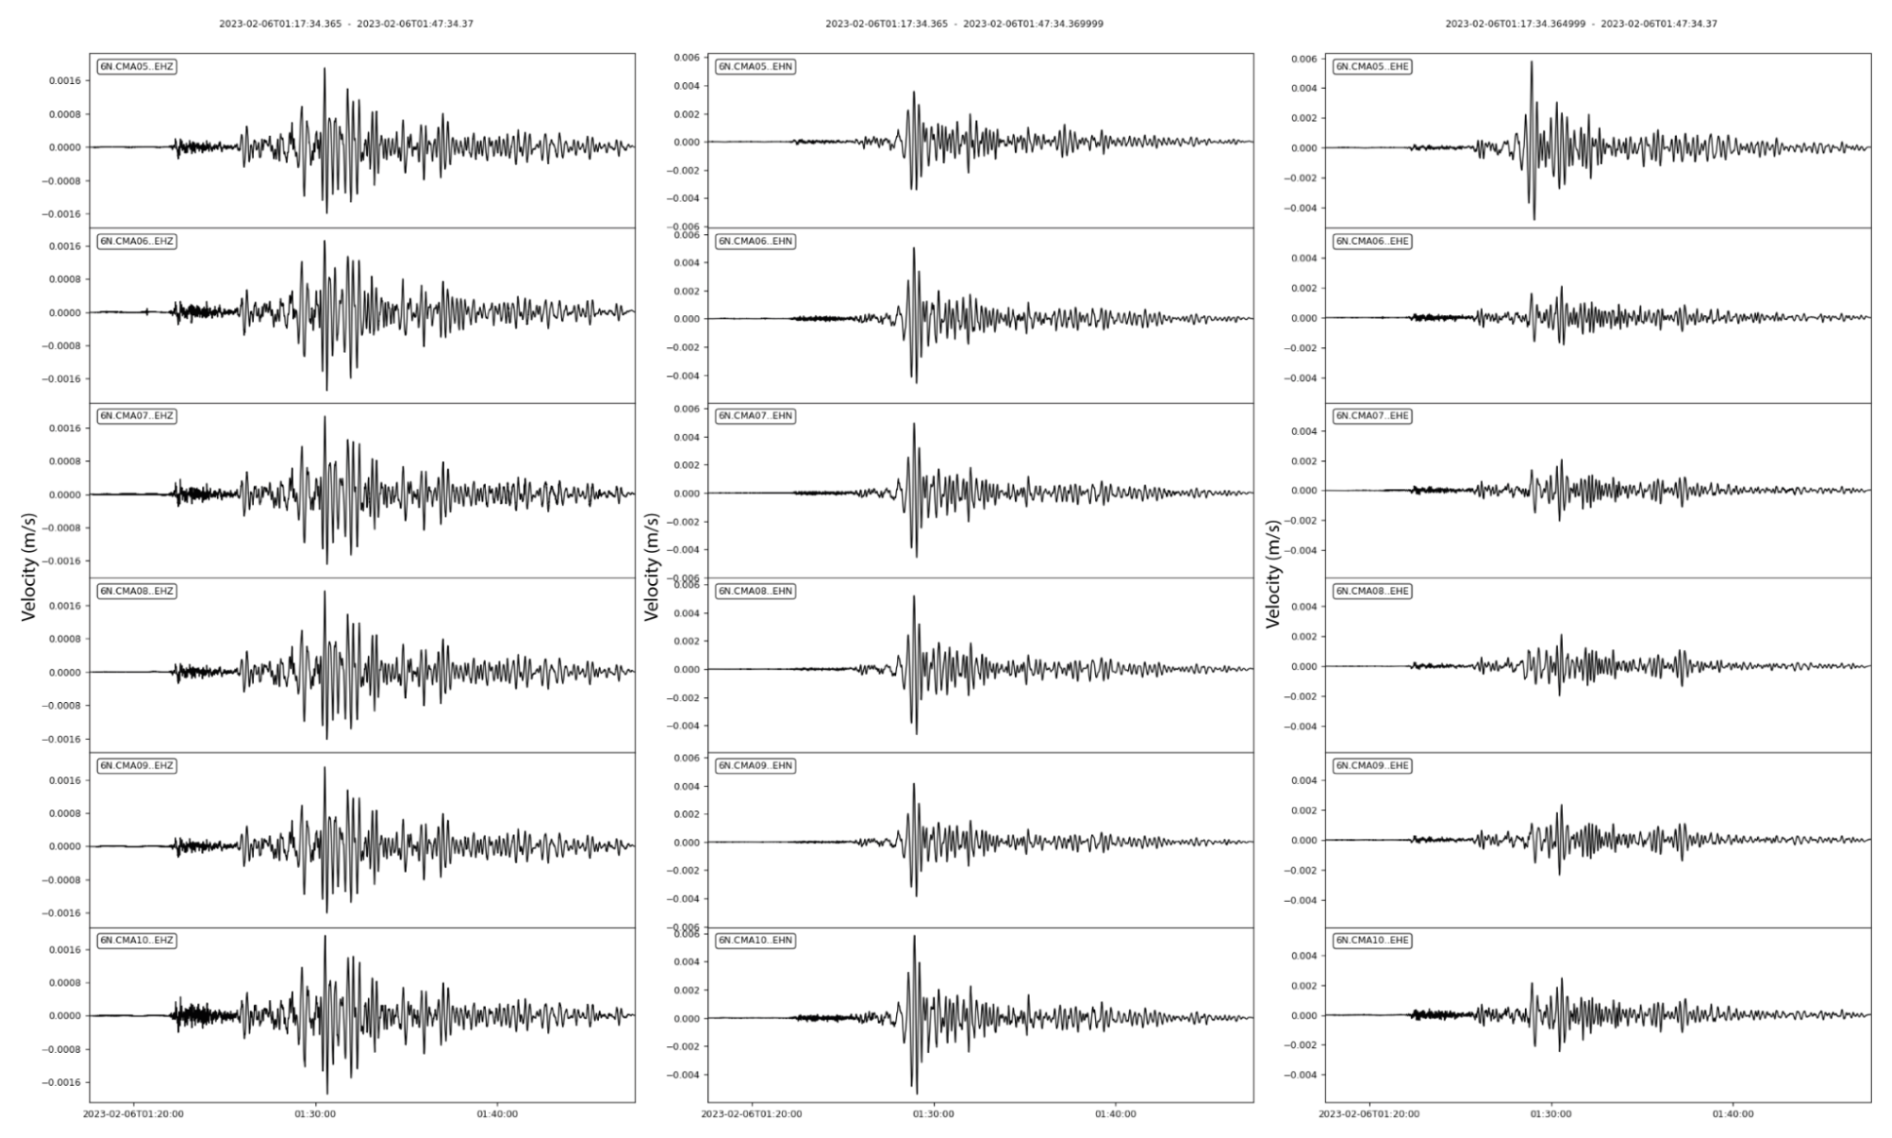
Figure 12Seismic traces of the Mwpd 7.9 Turkish earthquake occurred the 6 February 2022 (01:17 UTC) recorded by the real-time 6N EMERSITO stations. Graphics were realized using The MathWorks Inc. (2022).
The recordings of ambient vibrations and earthquakes collected by the 6N network allowed us to perform some preliminary analyses for characterizing the recording sites. Moreover, the joint use of data of the temporary networks installed during the emergency, such as the 6N one, and of the permanent networks in principle increases the chance of improving the estimates of the earthquakes' parameters (i.e., their localization and focal mechanism).
We first present the different techniques used for the analyses and some illustrative results. The overall results for each station of the network are presented as synthetic sheets collected in the Supplement.
4.1 Localization and focal mechanism improvements
The availability of the local events recorded by network 6N, as well of other networks, increases the chance to get better localization and to constrain the calculations of the focal mechanisms, especially for the earthquakes where the first polarities can be depicted.
As an example, we used data of two events (see Table 3) recorded simultaneously by three networks: 6N, Y1 (managed by the SISMIKO INGV emergency task force; D'Alema et al., 2022; Moretti et al., 2023) and IV (INGV Rete Sismica Nazionale (RSN), 2005). For event no. 33466171, using only data from IV and Y1, it was not possible to calculate the focal mechanism. Therefore, we added the 6N data; first, using the phase picks from the seismograms, we relocated the event using a multi-parameter procedure (Ciaccio et al., 2021) that explores the hypocenter solutions space by changing the a priori key conditions that strongly influence the solution convergence in the linearized approach. Then, we computed the double-couple fault plane solutions from P-wave first motion data (FPFIT program, Reasenberg and Oppenheimer, 1985). Finally, because our data allowed for a significant increase of the sampling of the focal sphere, the procedure successfully calculated the focal mechanism of the event (Fig. 13). This focal mechanism shows a transpressive solution and is of good quality in terms of uncertainties in strike, dip, rake (quality code QP = A) and station distribution ratio (STDR < 0.5), with this last quantity being sensitive to the distribution of the data on the focal sphere (Reasenberg and Oppenheimer, 1985).
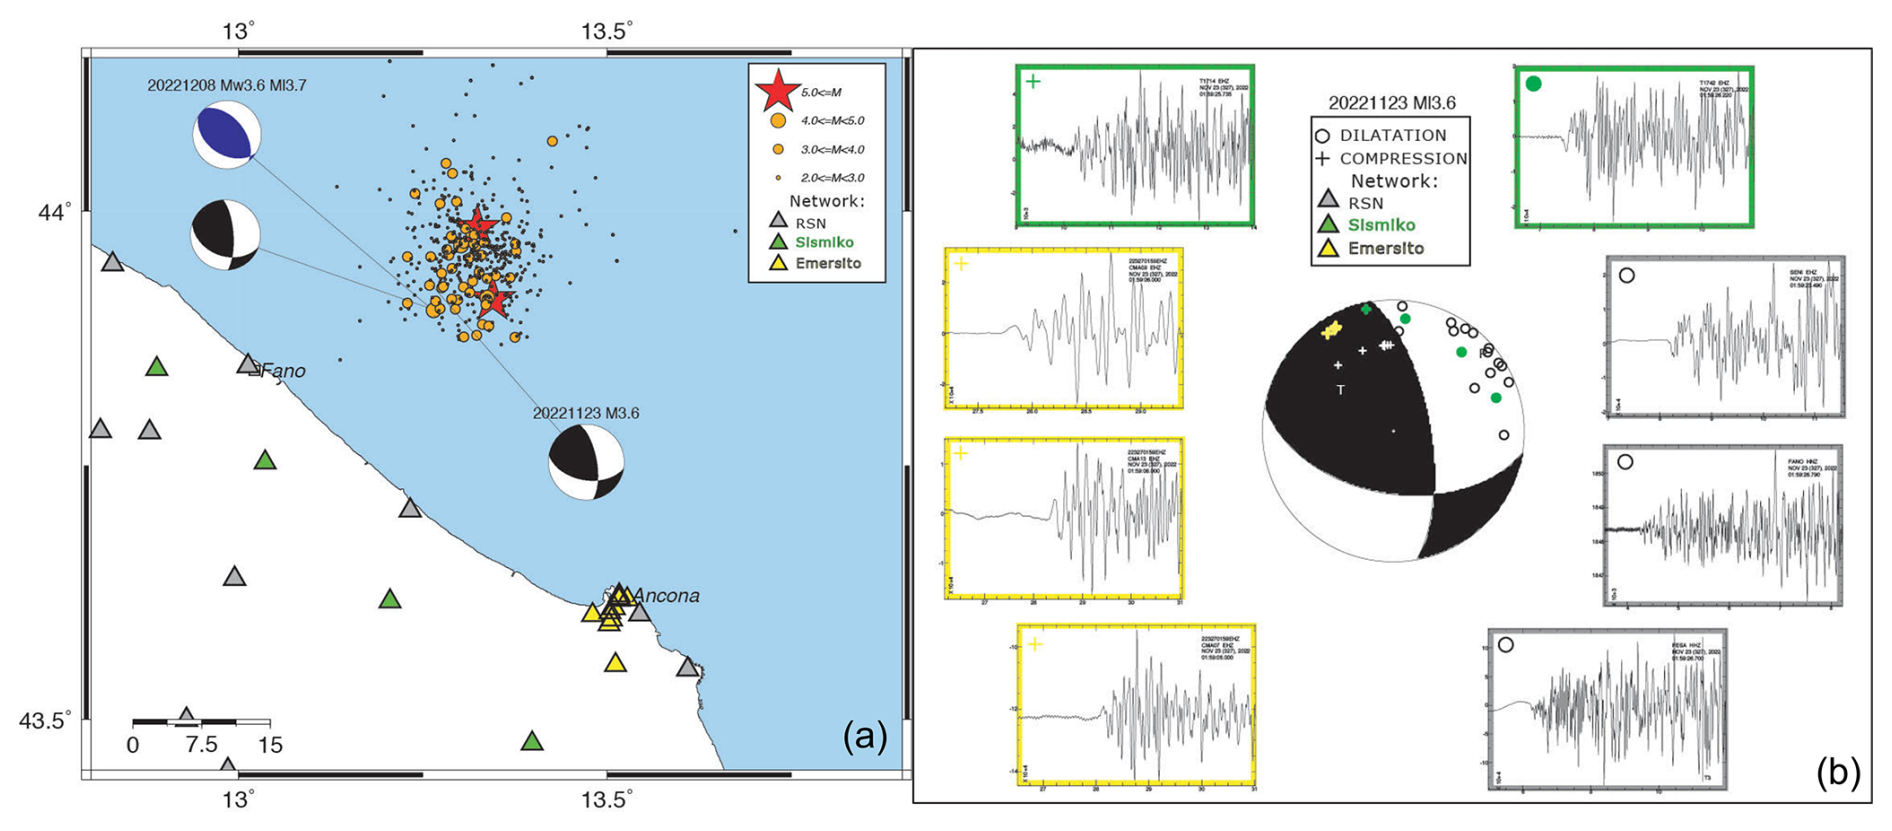
Figure 13(a) Fault-plane fit (FPFIT) focal solutions (black) for the earthquakes reported in Table 3. For the second event (ID no. 33589291), the available time domain moment tensor (TDMT) is also shown (in blue); circles are 2.0 earthquakes of the seismic sequence (see the insert for the different sizes and the correspondence with difference magnitude), and red stars are 5.0 earthquakes. (b) Distribution of polarities, up and down, for the first event in Table 3 (ID no. 33466171). Seismograms recorded by Y1 (green boxes), IV (grey boxes) and 6N (yellow boxes) networks are also shown. Map and graphics have been realized with GMT 6 (2019).
The same procedure was followed for event no. 33589291 (Table 3). In this case, the focal solution was already available, but adding 6N data improved the STDR quantity (from 0.6 to 0.55), giving greater robustness to the solution.
4.2 Data analysis methods
4.2.1 Horizontal-to-vertical spectral ratio on noise (HVNSR) and earthquakes (HVSR)
The horizontal-to-vertical spectral ratio on noise (HVNSR) and earthquake (HVSR) techniques play an important role in seismic microzonation and site effect studies (Hailemikael et al., 2020). Indeed, they are widely used and can provide information on the resonance frequencies of the site, which is related to the thicknesses of the layers and their average shear wave velocity.
The HVNSR analysis (Nakamura, 1989), although not able to define the transfer function of the site, can provide useful indications on the possible resonance frequencies and on the susceptibility of a site towards possible amplification phenomena. To estimate the HVNSR at the Ancona network, we used the HVNEA software on the continuous recordings (Vassallo et al., 2022) which takes advantage of the Geopsy software (Wathelet et al., 2020). The computation results in hourly HVNSR curves as the average of 120 s windows, repeated over the entire duration of the acquisition (about 3 months). In the end, we produced 1600 to 2200 hourly HVNSR curves for each station.
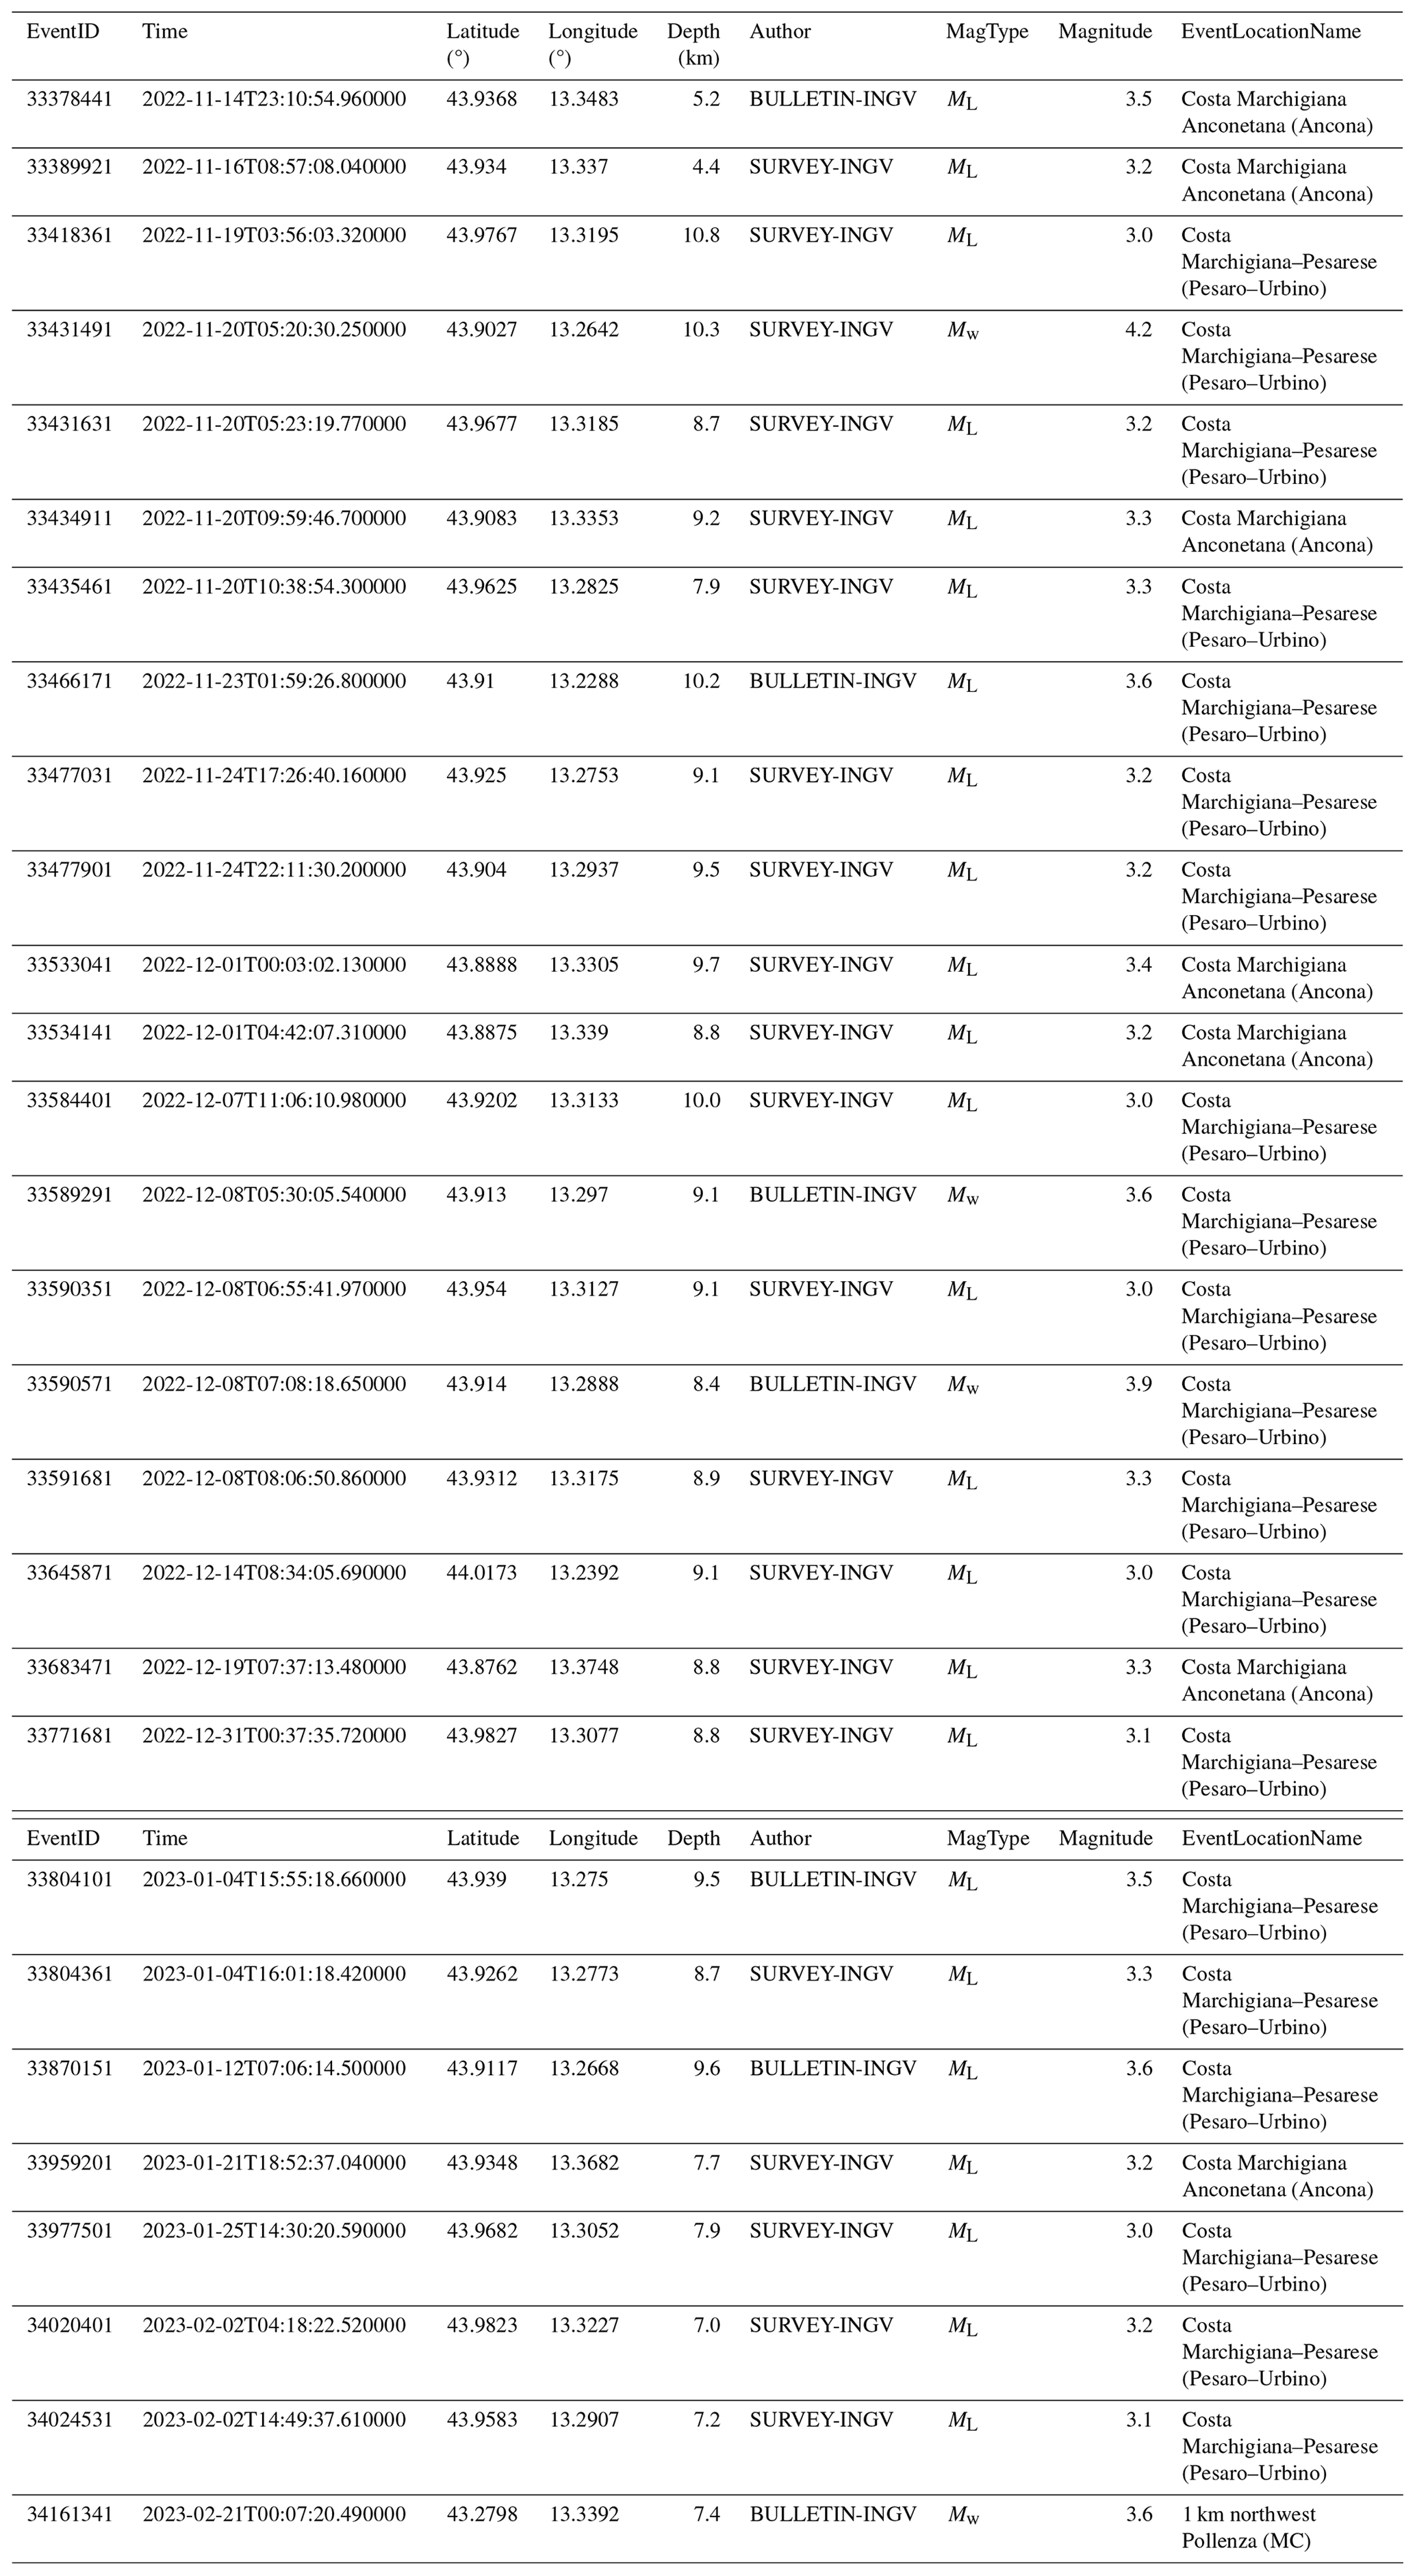
The HVSR analysis (Lermo and Chávez-García, 1993) is conceptually similar to HVNSR but is performed on earthquakes rather than on noise. Similarly to HVNSR, HVSR was performed with the software HVNEA, described in Vassallo et al. (2022). For each event, HVSR is calculated on a 6 s window from the theoretical S-wave arrival time. The averages were obtained by a subset of events from the INGV earthquake bulletin (http://terremoti.ingv.it/en/, last access: 1 May 2025) using a circular search of magnitude M> ≧ 3 events at a maximum distance of 50 km from Ancona (Table 4). With these criteria, the considered earthquakes had a signal-to-noise ratio (SNR) > = 3 in the frequency range of 0.5–15.0 Hz. The number of selected events ranges from 17 to 29; then, the results are indicative.
Table 4List of the earthquakes used for HVSR and horizontal-to-horizontal spectral ratio (SSR) analysis.
4.2.2 Directional amplification in frequency and time domain
Directional amplification effects imply that there is a preferential direction of amplification of the horizontal Fourier spectra, reported as a strike from the geographic north, as firstly proposed by Bonamassa and Vidale (1991). In the time domain, they correspond to linearly polarized ground motion, with mean polarization along the direction of maximum amplification.
In this work, directional amplification effects are preliminarily investigated in the frequency domain through the calculation of rotated horizontal-to-vertical spectral ratios of both noise (HVNSR) and earthquakes (HVSR) and in the time domain using the covariance matrix analysis (Kanasewich, 1981; Jurkevics, 1988).
The use of rotated spectral ratios was first introduced by Spudich et al. (1996) and subsequently exploited by several authors to detect the horizontal polarization of ground motion on topography and in fault zones (e.g., Rigano et al., 2008; Di Giulio et al., 2009; Pischiutta et al., 2012) or on sedimentary basins (Theodoulidis et al., 2018).
For the computation on noise, we used the Geopsy software (Wathelet et al., 2020), applying an anti-trigger algorithm to select the most stationary part of the signals, as well as a cosine taper and a Konno–Ohmachi smoothing filter with the coefficient b= 40 (Konno and Ohmachi, 1998). We calculated HVNSR after rotating the north–south and east–west components by steps of 10° from 0 to 180°.
For earthquakes, we considered the same list in Table 4 used for HVSR analysis. We first cut a portion of each event, a 6 s long window, including the S and early coda waves. Then, we computed the direction of maximum amplification as the azimuth at which the HVSR peak reaches the maximum value. Conventionally, the directional amplification effect is considered significant if the ratio between the maximum and minimum amplitude levels at the frequency peak exceeds 1.5 (Pischiutta et al., 2018). The complete values retrieved by the rotated HVNSR and HVSR are given in the Supplement (Tables S1 and S2, corresponding to results from earthquake and ambient noise recordings, respectively).
The covariance matrix method in the time domain (Jurkevics, 1988) is an alternative method to estimate the ground motion polarization of both noise and earthquakes, in particular when directional peaks have been observed with the rotated HVNSR or HVSR. The method results in the estimation of the polarization ellipsoid. In order to give a quantitative evaluation on how elongated the polarization ellipsoids is, we apply the hierarchical criterion proposed by Pischiutta et al. (2012), the results of which are given in the Supplement (Tables S1 and S2, corresponding to results from earthquake signals and ambient noise, respectively).
4.2.3 Horizontal-to-horizontal spectral ratio (SSR)
The horizontal-to-horizontal spectral ratio (SSR) technique is based on the assumption that the ratio between horizontal Fourier spectra from earthquakes recorded at a given site and at a bedrock site represents a good estimate of the transfer function of the site. The implicit assumption is that the contribution of the source and the crustal propagation is the same for the two sites and that the spectrum of the rock site (i.e., the reference station) is free from amplification effects (Borcherdt, 1970; Cara et al., 2011). For these reasons, this technique is believed to give the seismic response of a given site and not only limited to the resonance effects as for HVNSR or HVSR.
For network 6N, we chose the CMA15 station as the most suitable reference site, which is installed on an outcropping geological bedrock (FCO, Colombacci Formation). Moreover, its recordings are characterized by short duration, small amplitudes and no resonance frequency peaks (see Figs. 11 and 14).
In order to automate the calculation, a script implemented in a Python environment and based on the ObsPy framework (Beyreuther et al., 2010) was used. The code allows us to (1) extract the signal related to a seismic event over a time window of definable duration (6 s in this case) starting from the arrival of the S wave, which has been estimated using the technique proposed by Akazawa (2004); (2) calculate the signal-to-noise ratio (SNR); (3) process the signals with a Konno and Ohmachi (1998) filter and, finally, (4) calculate the SSR ratios. The iterative application was applied to the same list as the HVSR analysis, taking into account the simultaneous presence of events on both the considered site and the reference site (Table 4).
4.3 Summary results
This subsection illustrates the results of the techniques described in the previous sections using three selected stations as representative of the network: CMA08, CMA14 and CMA15. The results for all the stations of the 6N network are given as synthetic sheets and collected in the Supplement (Figs. S3 to S13). Moreover, the results have been uploaded to the Zenodo repository (see Sect. 5 for details).
Figure 14 shows the HVNSR, HVSR and SSR results for the three considered stations. In the following, we summarize some preliminary conclusions:
- a.
HVNSR amplitudes are relatively low (about 2 on average), and no clear resonance peaks are observed.
- b.
HVNSR and HVSR of station CMA15 are flat, which is as expected for a reference site.
- c.
HVSR curves of CMA08 and CMA14 are slightly different from HVNSR ones: the amplitudes are higher, and also the frequency peaks depicted by the two techniques are different. It should be considered that the number of earthquakes used for HVSR is not very high; therefore, the result is only indicative.
- d.
The SSR analysis shows very different outcomes than the HVSR analysis. This behavior could be due to the choice of the reference site (CMA15), and/or to possible two- or three-dimensional site effects not accounted for by the HVSR. technique.
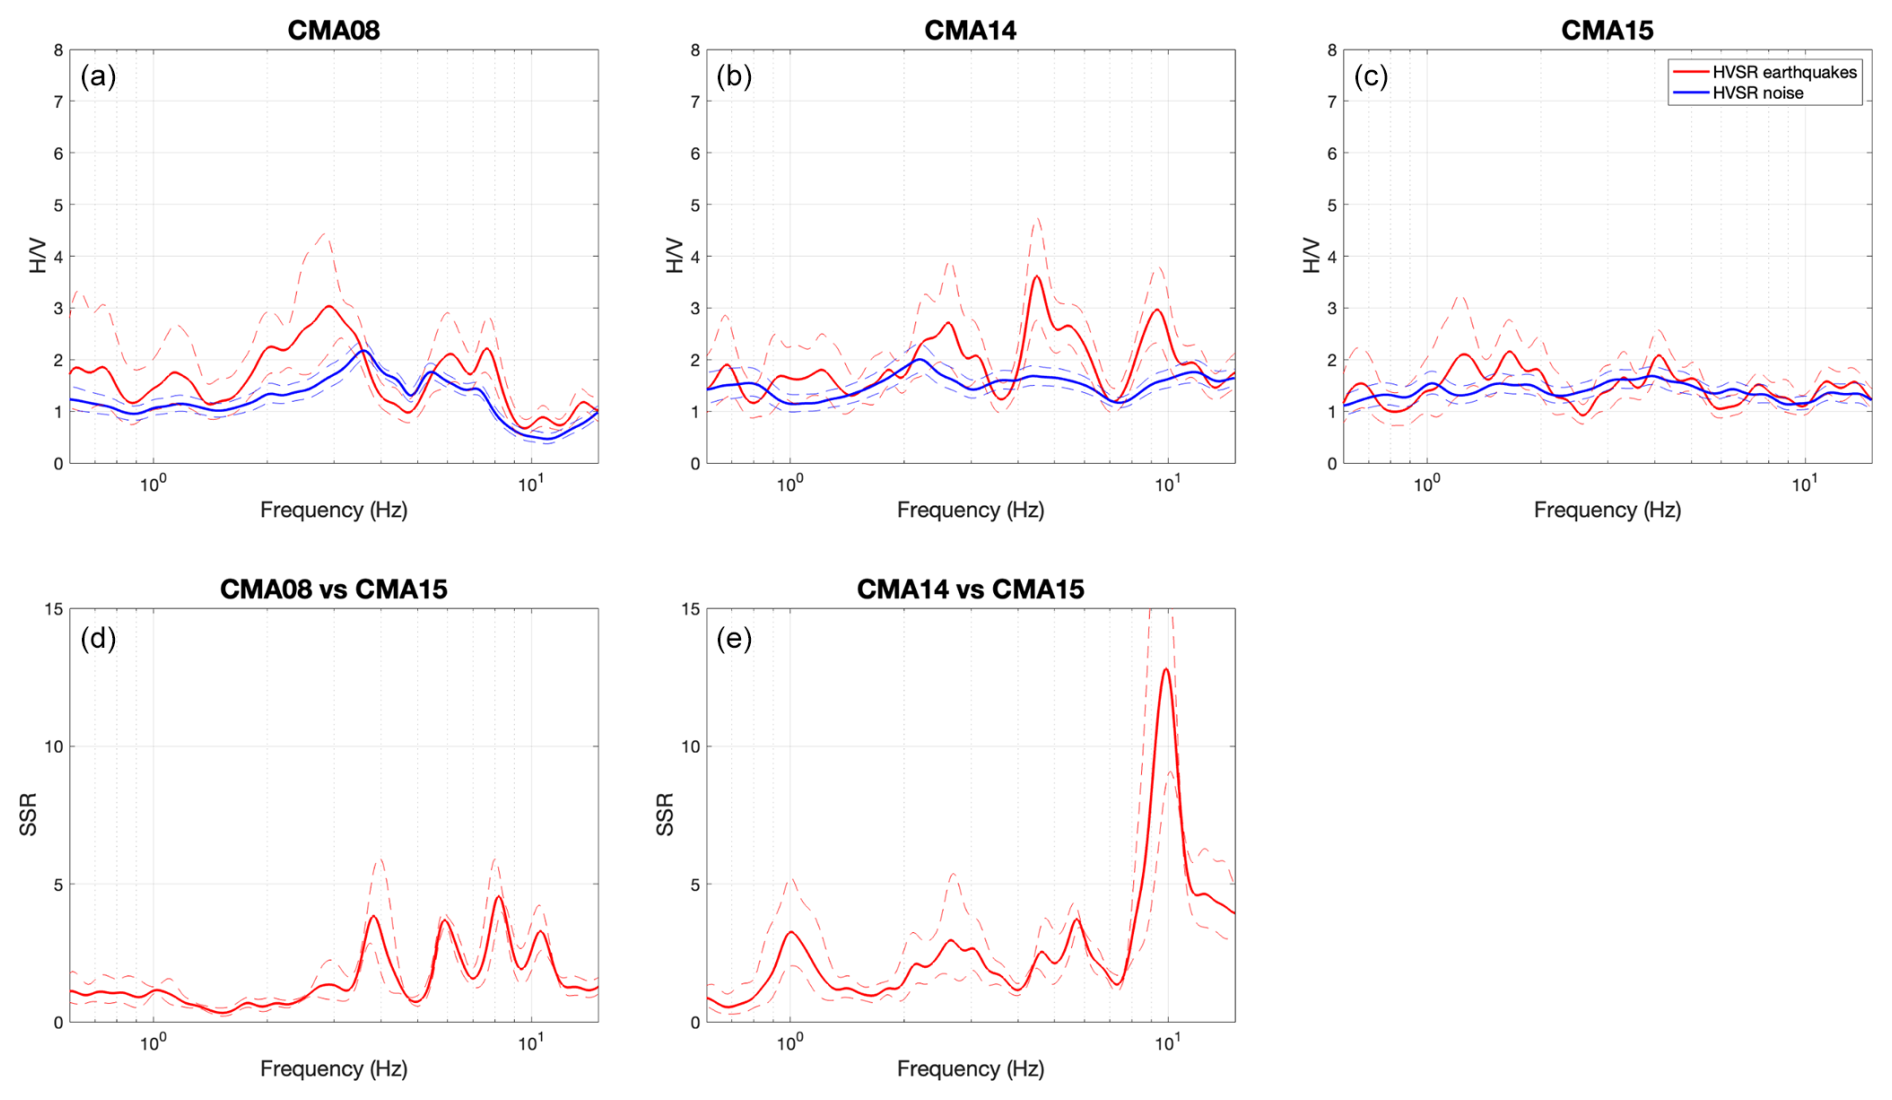
Figure 14(a, b, c) HVNSR (blue lines) and HVSR (red lines) from HVNEA for CMA08, CMA14 and CMA15 stations. (d, e) SSR for CMA08 and CMA14 stations (red lines). For all plots, the solid lines are the averages and the dotted lines the average minus and plus 1 standard deviation. Graphics were realized using The MathWorks Inc. (2022).
The analysis of HVNSR carried out over the entire recording period was also important to assess the temporal stability of the spectral peaks at each site (see Fig. S2). There was no relevant variation in the peak frequencies, whereas the peak amplitude shows temporal variations of up to 20 %. These variations are mostly related to day–night spectral level reduction, especially in the vertical components and above 4 Hz.
Results of directional and polarization analyses, on both earthquake and noise, are shown in Fig. 15 for two stations, CMA08 and CMA14.
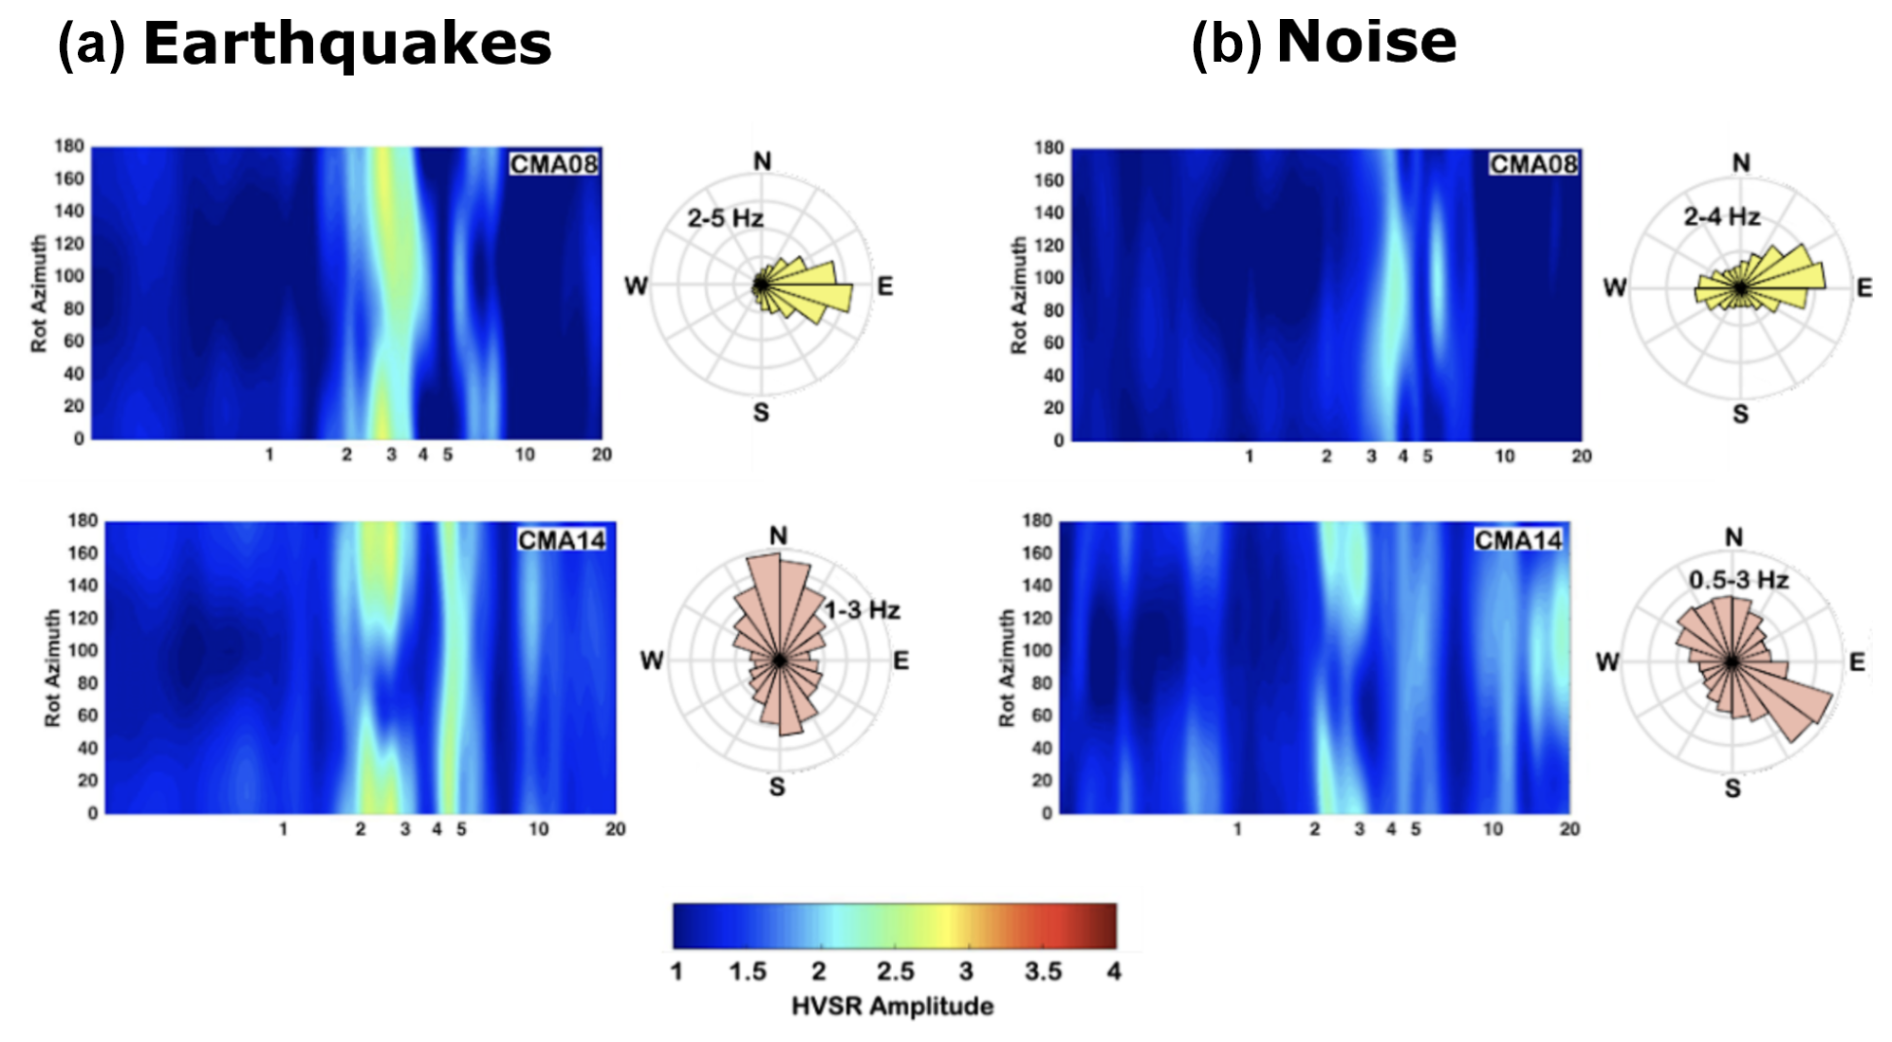
Figure 15Directional amplification at two exemplificative stations: CMA08 (top) and CMA14 (bottom) using seismic events (a) and ambient noise recordings (b). Rotated HVSR and HVNSR are graphed as contour plots, where the color scale is related to the amplitude level, the x axis represents frequency, the y axis the rotation angle (0 and 180° corresponding to north–south direction, 90° to east–west direction). The time-domain polarization analysis is summarized by means of circular histogram diagrams representing the polarization angle in the horizontal plane, obtained from filtered signals in the frequency band indicated in the rose diagram. Graphics were realized using The MathWorks Inc. (2022).
For station CMA08, the rotated HVNSR and HVSR highlights the presence of a directional peak at about 3–4 Hz and along the 90–110° N azimuth (roughly, east–west direction). The pattern is more complex at station CMA14 (Fig. 15, bottom panels), where earthquakes and noise give slightly different outcomes. Earthquake recordings show two clear peaks in the HVSR analysis, the former at 2.6 Hz, with maximum amplification roughly north–south and the latter at 4.4 Hz that is not directional. Circular histograms of polarization azimuths obtained from filtered earthquake signals in the frequency band 1–3 Hz show a similar trend in the north–south direction.
Data described in this paper can be accessed via https://doi.org/10.13127/sd/qctgd6c-3a (EMERSITO Working Group, 2024).
Moreover, the results can be accessed and downloaded in electronic format on Zenodo for
-
HVNSR curves at https://doi.org/10.5281/zenodo.14704661 (Cara and Famiani, 2025a)
-
HVSR curves at https://doi.org/10.5281/zenodo.14672464 (Cara and Famiani, 2025b)
-
SSR curves at https://doi.org/10.5281/zenodo.14672943 (Cara and Famiani, 2025c)
-
rotated HVNSR curves at https://doi.org/10.5281/zenodo.14700835 (Pischiutta et al., 2025a)
-
rotated HVSR curves at https://doi.org/10.5281/zenodo.14701171 (Pischiutta et al., 2025b).
The dataset uploaded to EIDA can be requested in two ways:
-
Firstly, one can use the ORFEUS Data Center WebDC3 Web Interface Repository (http://www.orfeus-eu.org/webdc3/, last access: 1 May 2025).
Go to the Explore stations tab, set the network type to “All temporary nets” and network code to “6N*+ (2022) – Emersito Seismic Network in Ancona (central Italy)”. Select the HN (velocimetric data) or EH (accelerometric data) channel or both. Then press the Search button. A list of the available seismic stations appears, and it is possible to select all or only the desired stations. Go to the Submit request tab and set the appropriate time selection window. If you wish to download the complete records, set the time window to be from 9 November 2022 to 28 February 2023, which includes the whole recording period of the network 6N. Unfortunately, the ORFEUS Data Center limits the maximum size of data that can be downloaded for each request at about 1.5 GB. This means that it is possible to download up to 30 d of the HN (velocimetric) channels or up to 15 d of the EH (accelerometric) channels of one station at a time. Anyhow, to reduce the waiting times, we suggest halving the request, e.g., 15 d for the station and HN channels. You can also choose to request, for the miniSEED data only, the metadata in XML format or the metadata in text format. If everything is in order, go to the Download data tab, where you can follow the status of the FDSNWS requests. At the end, click on the Save button to download the requested data.
-
The other way to access data is via INGV Web Services, based on FDSN specifications, directly from a browser. Details on how to use these web services can be found at the web page https://terremoti.ingv.it/en/webservices_and_software (last access: 1 May 2025).
The aims of this work are to illustrate the seismic dataset collected by the 6N temporary network at Ancona, stored and available from the EIDA database, describe the intervention of the EMERSITO working group and focus on the difficulties that can be encountered in urban contexts during emergency activities, and finally to present the preliminary results that can be achieved during a seismic sequence.
The overall results of the HVSR and polarization analysis on both earthquakes and noise are summarized in Fig. 16.
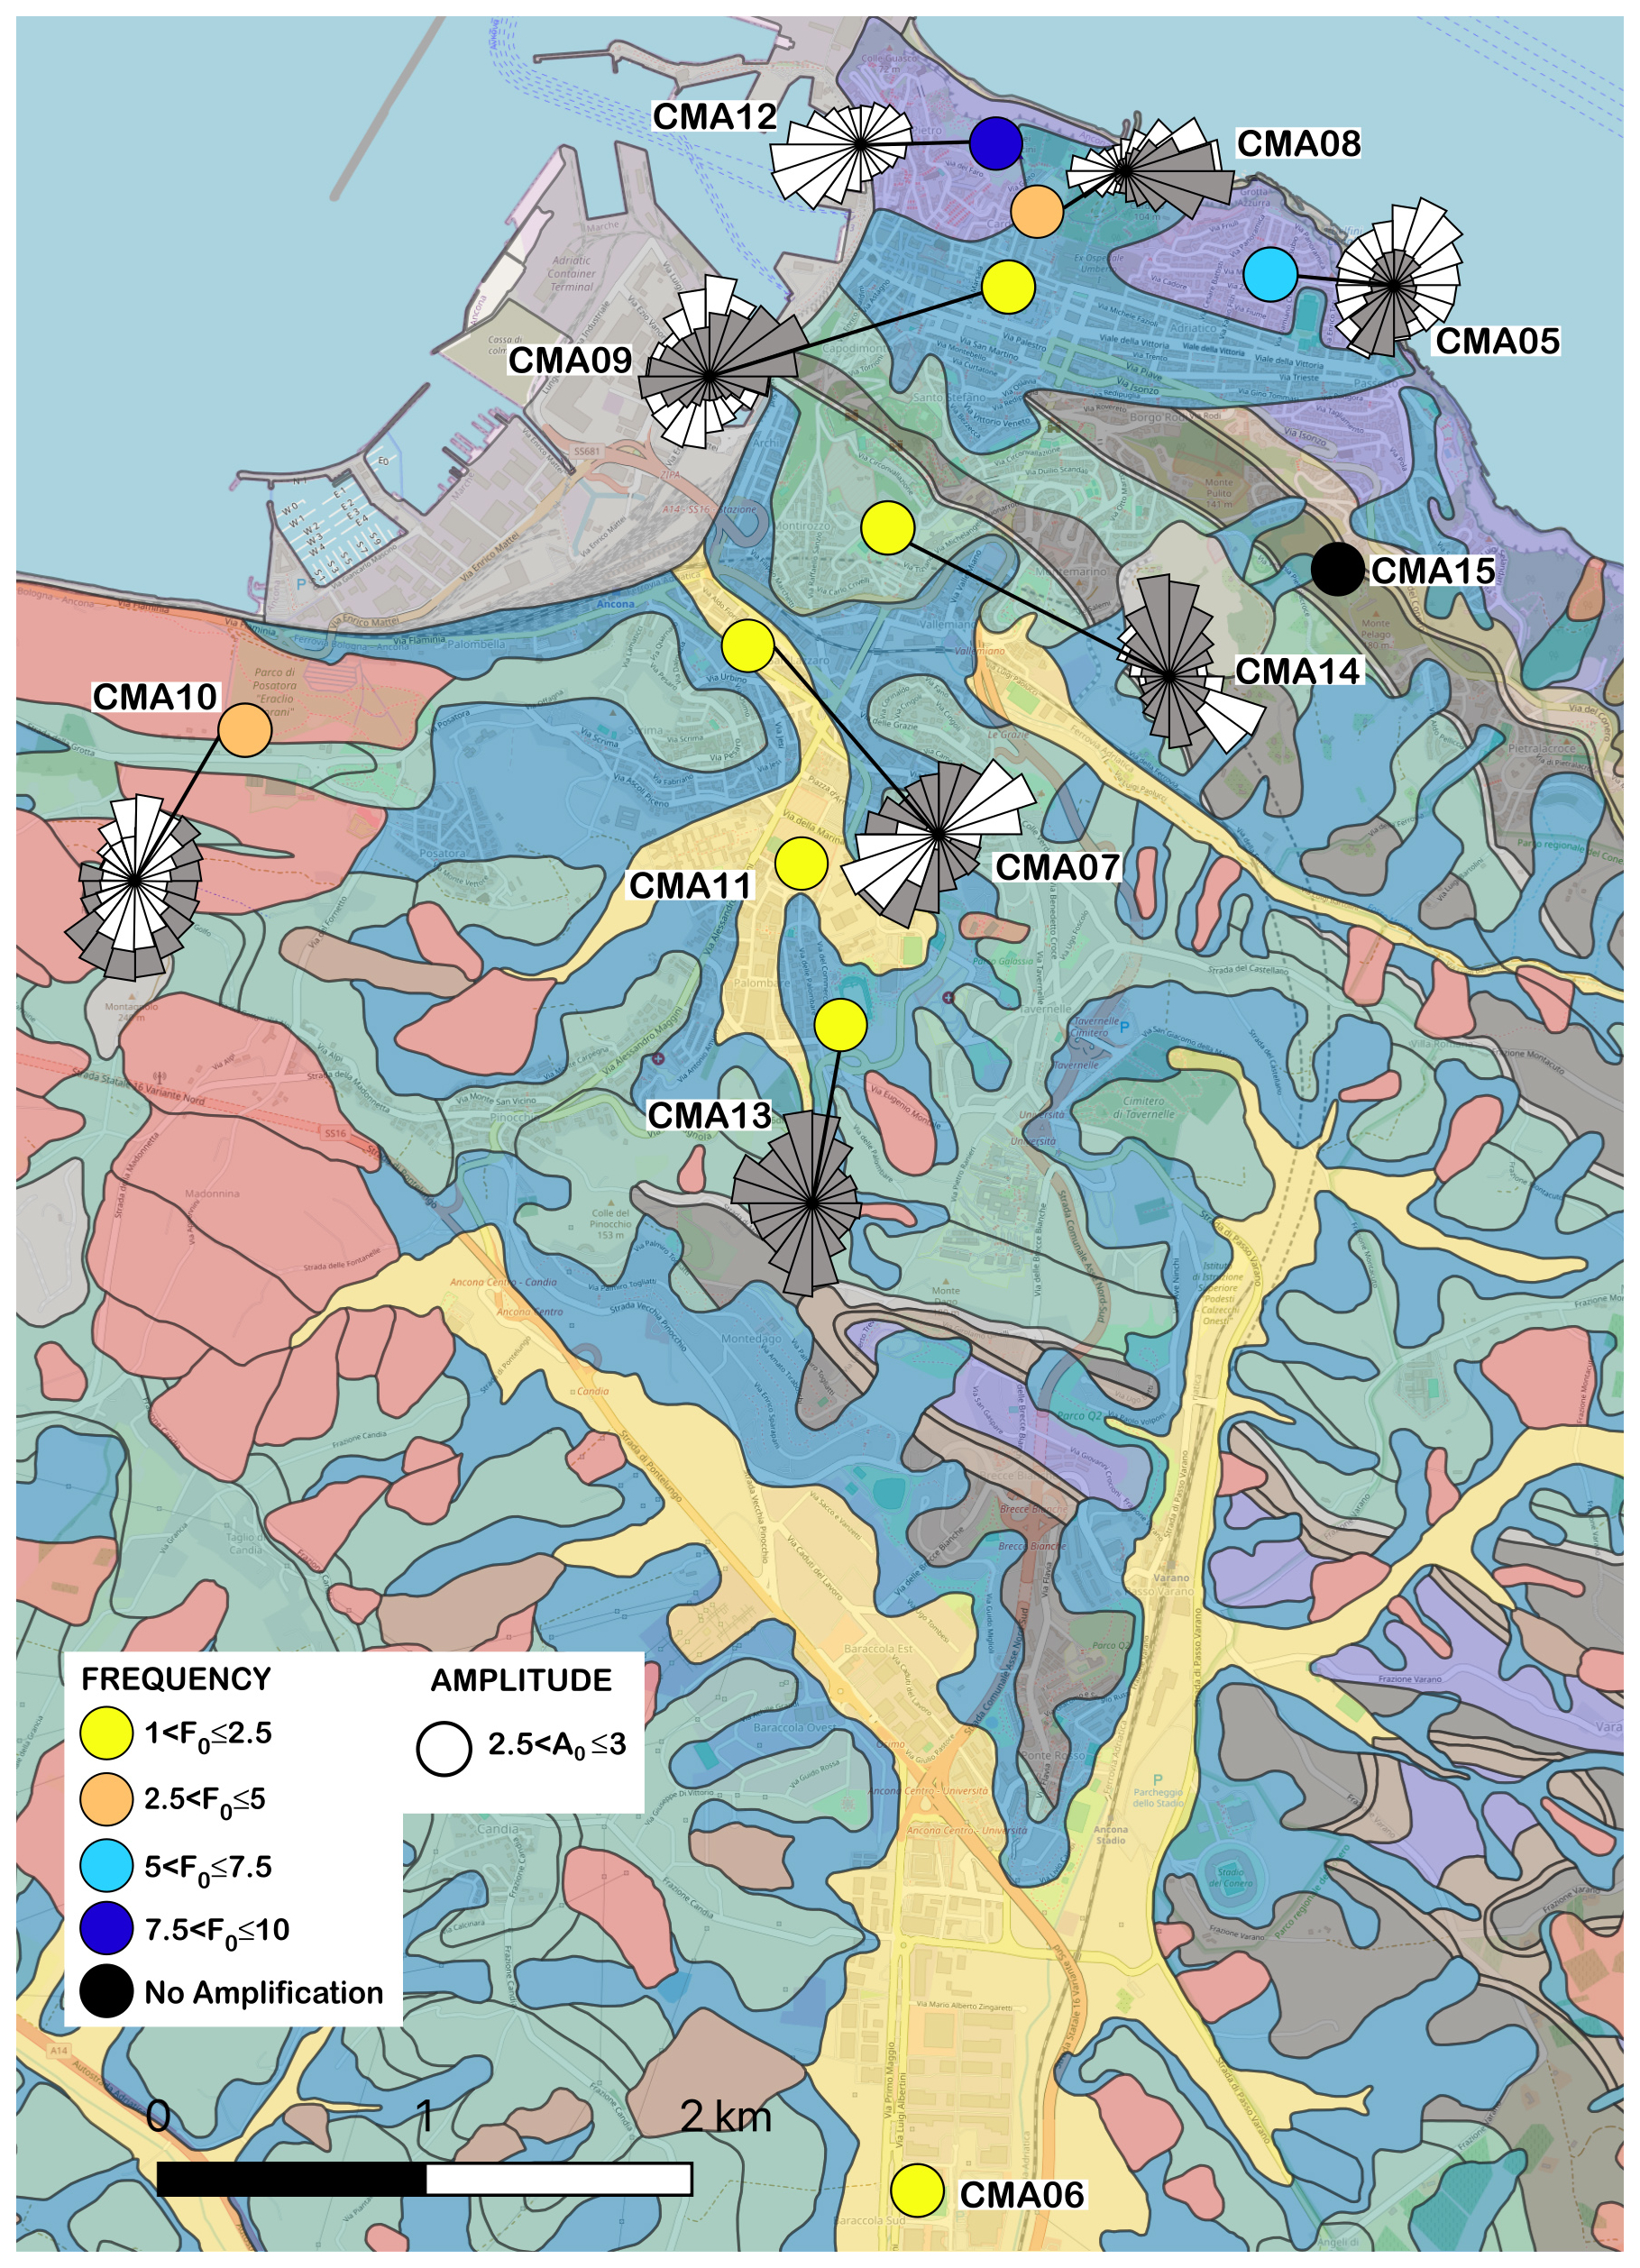
Figure 16Summary of the HVSR analyses performed on ambient noise and earthquake recordings using only the mean of the two horizontal components and by calculating rotated components. The circle dimension plotted above each station is related to the HVSR A0 value, while its color indicates the F0 value. In the case of directional amplification, we also add rose diagrams (grey and white colors are related to results retrieved using earthquakes and ambient noise, respectively). The results are superimposed onto the 1:10 000 geological map. The map has been realized with QGIS software (QGIS Development Team, 2024), the geological data. © OpenStreetMap contributors 2024. Distributed under the Open Data Commons Open Database License (ODbL) v1.0. The geological data, coming from the Marche region, are distributed under the CC-BY 4.0 license.
As aforementioned, the HV on noise does not detect some frequency peaks, which are evident only by earthquake data (CMA05, CMA06, CMA09 and CMA14), and, for some other peaks, displays lower amplitude and/or no directionality (CMA05, CMA07, CMA09, CMA12 and CMA14). HVNSR and HVSR for station CMA10, which is set on the 1982 landslide, have a shape with no clear resonance peak.
In terms of directional motion, the results between noise and earthquakes are fully consistent only at stations CMA08, CMA11 and CMA15.
Table 5 lists, for each 6N station, the outcropping lithology; the number of peaks observed on HVSRs; and, for each one, the peak frequency and amplitude values. When amplification is found to be directional, the direction of maximum amplification and polarization is given as well.
The lowest-resonance-frequency value from data analysis (Table 5), observed at the sites CMA07, CMA11 and CMA15, is around 1.5 Hz (frequency range of 1–2.5 Hz in Fig. 16) and related to thick clay deposits (Fig. 7). The majority of sites show f0 values in the range of 2.5–5 Hz. Higher frequencies (f0 > 5 Hz) are observed at two stations (CMA12 and CMA05) closest to the sea in the northern direction, where the Schlier marly formation is nearly outcropping (Fig. 7).
Table 5Synthesis of results of directional analysis (frequency and amplitude values of resonance peaks) obtained from HVSR and HVNSR analysis.
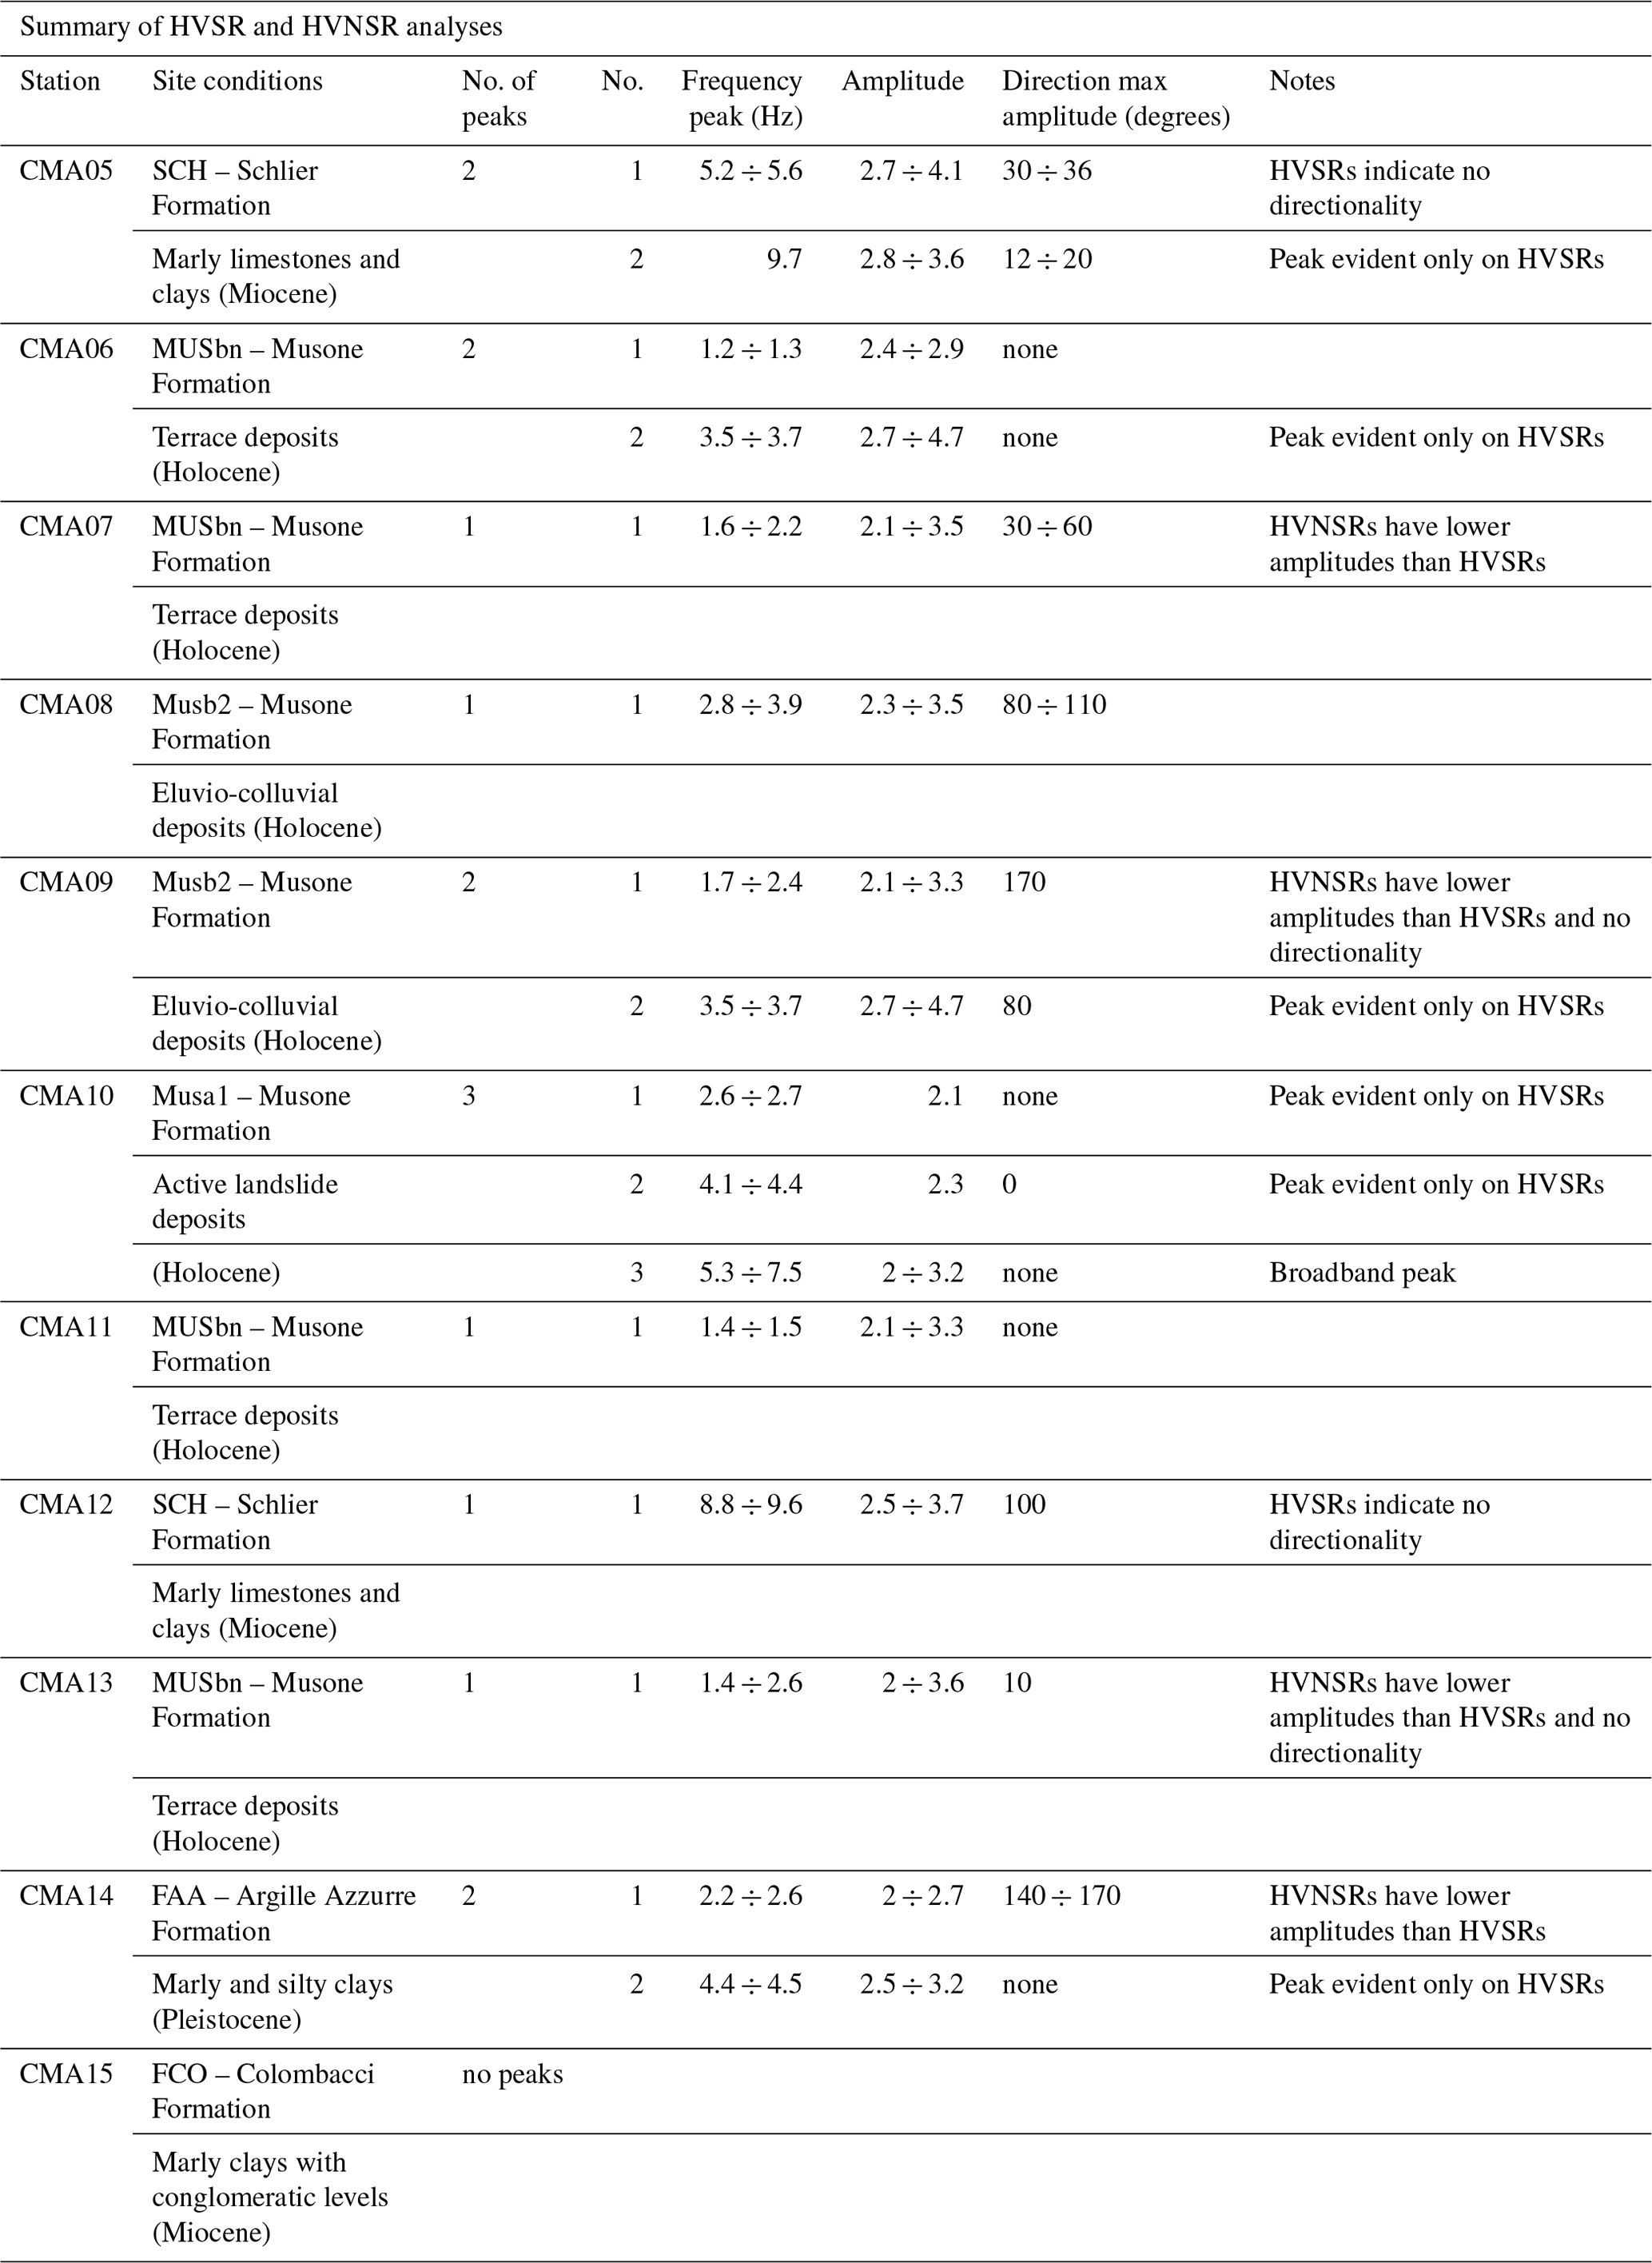
However, it is important to say that for a complete geology-based interpretation, the earthquake database collected during the experiment needs to be fully analyzed, with a detailed search of M<3.0 events with SNR > = 3, to have more robust statistics.
At the stage of the activities of EMERSITO during the seismic sequence, we can infer some points to be investigated in detail in future papers:
- a.
The HVNSR technique is a good method to test the functioning of the stations and the variability in an urban context, but it seems that for this case study, where the geological features do not show a strong impedance contrast, it is not very suitable for revealing resonance effects.
- b.
Also regarding the HVSR technique, even if it has to be refined with a greater number of earthquakes, it shows similar trends of HVNSR but with higher amplitudes and more evident peaks.
- c.
The SSRs are pointedly different from HVNSR and HVSR. Also, SSR has to be refined with a greater number of earthquakes, but the role of the reference station needs to be investigated. If the SSRs display reliable results, the next step is to compare these amplification estimates with numerical simulations based on the available geological profiles for each site. Therefore, the use of one-, two- and maybe three-dimensional simulations will hopefully explain the observed amplification pattern.
- d.
Although the role of landslide sediments in the amplification pattern is out of the aim of this work, we believe that specific and multidisciplinary studies based on extensive measurements in the unstable zones of the city are needed. It has to be taken into account that in unfavorable hydrological conditions, seismic waves of a possible moderate-to-strong earthquake could trigger the landslide movements.
- e.
Even if all the stations (except CMA06 and CMA14 situated in 25 external courtyards) are installed on the basement floors of buildings, the interaction between soil and structures could play a role in the observed results.
The supplement related to this article is available online at https://doi.org/10.5194/essd-17-2087-2025-supplement.
FC, GDG, MV, GC, GR, SL and FP are the coordinators of the EMERSITO task force. They designed and managed the experiment, so they contributed to the project administration and the conceptualization tasks. DF has been charged as the scientific manager for the experiment, supervised by the coordinators. She wrote the initial draft of this paper that was revised and completed by the coordinators, in particular by FC, GC, GDG and FP. GDG, MV, DF, GB, AB, MP, SH, AM, GM, LM, ADF, LN, SM, CL, DP and CC contributed to the investigation, finding the sites, and deploying the seismic stations and maintaining them. MV, GR, AC, AB, MP, MM, RP, SH, AM, GM, MGC, SP, GS and CL contributed to the formal analysis. GR was in charge of data curation. GB contributed to the definition of one-dimensional stratigraphy models under the investigated sites. RC contributed to the maintenance of the WebGIS, whereas SP, AF, GB and DF helped in finding resources to add to the WebGIS. GM and CB helped the coordinators in the initial dissemination of the experiment, useful also for the writing of this paper. LF and AM contributed to the instrumental part, in particular in the setting of the real-time stations. MM, GM, CB, GDL, GS and GT contributed to the initial ideas about the experiment and also to the resources.
The contact author has declared that none of the authors has any competing interests.
Publisher’s note: Copernicus Publications remains neutral with regard to jurisdictional claims made in the text, published maps, institutional affiliations, or any other geographical representation in this paper. While Copernicus Publications makes every effort to include appropriate place names, the final responsibility lies with the authors.
We thank the people of Ancona who hosted the instruments. In particular, we thank the navy and the Marche region for all the support, facilities and information that they have made available.
We gratefully acknowledge Laboratory ESITO of INGV (https://www.ingv.it/monitoraggio-e-infrastrutture/laboratori/laboratorio-effetti-di-sito, last access: 1 May 2025) for the technical support during the experiment.
We also thank the Italian Department of Civil Protection (DPC) for the economic support and extend special thanks to the INGV group, in particular Massimo Fares, Diego Franceschi and Ivano Carluccio, that helped us in the procedure of sharing the data of the network 6N in EIDA and Mario Locati for the INGV data policy task.
This paper was edited by Kirsten Elger and reviewed by two anonymous referees.
Agostini, A., Tofani, V., Nolesini, T., Gigli, G., Tanteri, L., Rosi, A., Cardellini, S., and Casagli, N.: A new appraisal of the Ancona landslide based on geotechnical investigations and stability modelling, Q. J. Eng. Geol. Hydroge., 47, 29–43, https://doi.org/10.1144/qjegh2013-028, 2014.
Akazawa, T.: A technique for automatic detection of onset time of P-and S-phases in strong motion records, 13th World Conference on Earthquake Engineering, Vancouver, Canada, 1–6 August 2004, https://www.iitk.ac.in/nicee/wcee/article/13_786.pdf (last access: 1 May 2025), 2004.
Albarello, D., Pacitti, P., Schiaroli, A., Tiberi, P., Fantozzi, P. L., Pieruccini, P., and Madiai, C.: La microzonazione sismica delle Marche. 10 anni di attività, Regione Marche, ISBN 978-88-95554-40-2, https://hdl.handle.net/2158/1325073 (last access: 1 May 2025), 2022.
Amanti, M., Battaglini, L., Campo, V., Cipolloni, C., Congi, M. P., Conte, G., Delogu, D., Ventura, R., and Zonetti, C.: La carta litologica d'italia alla scala 1:100000, in: Atti della 11a Conferenza Nazionale ASITA, Turin, Italy, 6–9 November 2007, http://atti.asita.it/Asita2007/Pdf/119.pdf (last access: 1 May 2025), 2007.
Bally, A. W., Burbi, L., Cooper, C., and Ghelardoni, R.: Balanced sections and seismic reflection profiles across the central Apennines, Mem. Soc. Geol. It., 35, 257–310, 1986.
Beyreuther, M., Barsch, R., Krischer, L., Megies, T., Behr, Y., and Wassermann, J.: ObsPy: A Python Toolbox for Seismology, Seismol. Res. Lett., 81, 530–533, https://doi.org/10.1785/gssrl.81.3.530, 2010
Bonamassa, O. and Vidale, J. E.: Directional site resonances observed from aftershocks of the 18 October 1989 Loma Prieta earthquake sequence, B. Seismol. Soc. Am., 81, 1945–1958, https://www.researchgate.net/publication/241436761_Directional_site_resonances_observed_from_aftershocks_of_the_18_October_1989_Loma_Prieta_earthquake (last access: 1 May 2025), 1991.
Borcherdt, R. D.: Effects of local geology on ground motion near San Francisco Bay, B. Seismol. Soc. Am., 60, 29–61, https://www.researchgate.net/publication/277995526_Effects_of_local_geology_on_ground_motion_near_San_Francisco_Bay (last access: 1 May 2025), 1970.
Calza, W., Maistrello, M., Marcellini, A., Morganti, C., Rampoldi, R., Rossi, B., Stucchi M., and Zonno, G.: Elementi di microzonazione dell'area anconetana, Pubbl. Prog. Final. Geodin., 430, 68 pp., 1981.
Cancelli, A., Marabini, F., Pellegrini, M., and Tonnetti, G.: Incidenze delle frane sull'evoluzione della costa adriatica da Pesaro a Vasto, Memorie della Società Geologica Italiana, 27, 555–568, 1984.
Cara, F. and Famiani, D.: Horizontal to vertical spectral ratios (HVNSR) on ambient noise recordings of stations of the 6N network during the activities of the EMERSITO INGV emergency group in Ancona (Italy) following the 2022 MW 5.5 Costa Marchigiana-Pesarese earthquake, Zenodo [data set], https://doi.org/10.5281/zenodo.14704661, 2025a.
Cara, F. and Famiani, D.: Horizontal to vertical spectral ratios (HVSR) on earthquake recordings of stations of the 6N network during the activities of the EMERSITO INGV emergency group in Ancona (Italy) following the 2022 MW 5.5 Costa Marchigiana-Pesarese earthquake, Zenodo [data set], https://doi.org/10.5281/zenodo.14672464, 2025b.
Cara, F. and Famiani, D.: Standard spectral ratios (SSR) on earthquake recordings of stations of the 6N network during the activities of the EMERSITO INGV emergency group in Ancona (Italy) following the 2022 MW 5.5 Costa Marchigiana-Pesarese earthquake, Zenodo [data set], https://doi.org/10.5281/zenodo.14672943, 2025c.
Cara, F., Di Giulio, G., Cavinato, G. P., Famiani, D., and Milana, G.: Seismic characterization and monitoring of Fucino Basin (Central Italy), B. Earthq. Eng., 9, 1961–1985, https://doi.org/10.1007/s10518-011-9282-2, 2011.
Cara, F., Cultrera, G., Riccio, G., Amoroso, S., Bordoni, P., Bucci, A., D'Alema, E., D'Amico, M., Cantore, L., Carannante, S., Cogliano, R., Di Giulio, G., Di Naccio, D., Famiani, D., Felicetta, C., Fodarella, A., Franceschina, G., Lanzano, G., Lovati, S., Luzi, L., Mascandola, C., Massa, M., Mercuri, A., Milana, G., Pacor, F., Piccarreda, D., Pischiutta, M., Pucillo, S., Puglia, R., Vassallo, M., Boniolo, G., Caielli, G., Corsi, A., de Franco, R., Tento, A., Bongiovanni, G., Hailemikael, S., Martini, G., Paciello, A., Peloso, A., Poggi, F., Verrubbi, V., Gallipoli, M. R., Stabile T. A., and Mancini, M.: Temporary dense seismic network during the 2016 Central Italy seismic emergency for microzonation studies, Sci. Data, 6, 182, https://doi.org/10.1038/s41597-019-0188-1, 2019.
Cara, F., Di Giulio, G., Cultrera, G., Lovati, S., Pacor, F., Riccio, G., Vassallo, M., Bagh, S., Bobbio, A., Bottari, C., Brunelli, G., Ciaccio, M. G., Cogliano, R., Costanzo, A., D'Alessandro, A., D'Ambrosio, M., D'Amico, V., De Luca, G., Di Filippo, A., Falco, L., Falcone, S., Famiani, D., Felicetta, C., Fodarella, A., Grassa, F., Hailemikael, S., La Piana, C., Liguoro, F., Colasanti, M., Mascandola, C., Massa, M., Mele, G., Melillo, G., Memmolo, A., Mercuri, A., Milana, G., Minarelli, L., Morelli, R. S., Nardone, L., Pagliuca, N., Paratore, M., Pischiutta, M., Pucillo, S., Puglia, R., Pulvirenti, M. S., Scudero, S., Sgattoni, G., Somma, R., Tarabusi, G., Tusa, G., Vitale, G., Zarrilli, L., and Amoroso, S.: Gruppo Operativo EMERSITO-Evento sismico Costa Marchigiana 2022, Rapporto N. 1 del 09/11/2022, https://www.earth-prints.org/handle/2122/15783 (last access: 1 May 2025), 2022a (in Italian).
Cara, F., Di Giulio, G., Cultrera, G., Pacor, F., Lovati, S., Riccio, G., Vassallo, M., Bobbio, A., Bottari, C., Brunelli, G., Cogliano, R., De Luca, G., Di Filippo, A., Falco, L., Famiani, D., Felicetta, C., Fodarella, A., Hailemikael, S., Mascandola, C., Massa, M., Memmolo, A., Mercuri, A., Milana, G., Minarelli, L., Nardone, L., Pischiutta, M., Pucillo, S., Puglia, R., Sgattoni, G., and Tarabusi, G.: Gruppo Operativo EMERSITO-Evento sismico Costa Marchigiana 2022, Rapporto N. 2 del 13/11/2022, https://www.earth-prints.org/handle/2122/15785 (last accesS: 1 May 2025), 2022b (in Italian).
Cara, F., Di Giulio, G., Cultrera, G., Pacor, F., Lovati, S., Riccio, G., Vassallo, M., Bobbio, A., Bottari, C., Brunelli, G., Cogliano, R., De Luca, G., Di Filippo, A., Falco, L., Famiani, D., Felicetta, C., Fodarella, A., Hailemikael, S., Mascandola, C., Massa, M., Memmolo, A., Mercuri, A., Milana, G., Minarelli, L., Nardone, L., Pischiutta, M., Pucillo, S., Puglia, R., Sgattoni, G., and Tarabusi, G.: Rapporto n. 3 attività del gruppo operativo emersito a seguito dell'evento sismico Costa Marchigiana Pesarese Mw 5.5 del 9/11/2022, https://www.earth-prints.org/handle/2122/15795 (last access: 1 May 2025), 2022c (in Italian).
Cardellini, S. and Osimani, P.: The Ancona Early Warning Centre, Instrumentation and Continuous Monitoring of the Landslides, in: Landslide Science and Practice, vol. 2, 57–65, Springer Berlin Heidelberg. https://doi.org/10.1007/978-3-642-31445-2_7, 2013.
Cello, G. and Tondi, E.: Note illustrative della Carta Geologica d'Italia alla scala 1:50.000, Foglio 282 Ancona, Ancona, Servizio Geologico d'Italia-ISPRA e Regione Marche, 102 pp., SELCA Firenze, https://www.isprambiente.gov.it/Media/carg/note_illustrative/282_Ancona.pdf (last access: 1 May 2025), 2011 (in Italian).
Centamore, E., Coltorti, M., Dramis, F., Cantalamessa, G., D'Angelo, S., Di Lorito, L., Sacchi, L., and Sposato, A.: Aspetti neotettonici e geomorfologici del Foglio 133–134 (Ascoli Piceno–Giulianova), CNR-Progetto Finalizzato “Geodinamica”: Contributi conclusivi per la realizzazione della Carta Neotettonica d'Italia, 2, 371–386, https://www.researchgate.net/publication/253643542_Aspetti_geomorfologici_e_neotettonici_del_F_133-134_Ascoli_Piceno-Giulianova (last access: 1 May 2025), 1982.
Ciaccio, M. G., Di Stefano, R., Improta, L., Mariucci, M. T., and BSI Working Group: First-Motion Focal Mechanism Solutions for 2015–2019 M ≥ 4.0 Italian Earthquakes, Front. Earth Sci., 9, 630116, https://doi.org/10.3389/feart.2021.630116, 2021.
Cogliano, R. and Famiani, D.: WebGIS EMERSITO: un sistema informativo geografico per la condivisione delle informazioni in situazioni di emergenza sismica, Rapp. Tec. INGV, 391, 1–22, 2018.
Console, F., Pantaloni, M., Petti, F. M., and Tacchia, D.: La cartografia del Servizio geologico d'Italia – The Geological survey of Italy mapping, Memorie Descrittive della Carta Geologia d'Italia, vol. 100, ISPRA (IStituto Superiore per la Protezione e la Ricerca Ambientale), Servizio Geologico d'Italia, ISBN 978-88-9311-052-5, https://www.isprambiente.gov.it/en/publications/technical-periodicals/descriptive-memories-of-the-geological-map-of/the-geological-survey-of-italy-mapping (last access: 14 January 2022), 2017.
Console, R., Peronaci, F., and Sonaglia, A.: Relazione sui fenomeni sismici dell'Anconetano (1972), Ann. Geofis., 26, 3–148, https://doi.org/10.4401/ag-5033, 1973 (in Italian).
Crescenti, U., Calista, M., Mangifesta, M., and Sciarra, N.: The Ancona landslide of December 1982, Giornale di Geologia Applicata, 1, 53 –62, https://www.aigaa.org/public/GGA.2005-01.0-06.0006.pdf (last access: 1 May 2025), 2005.
D'Alema, E., Alparone, S., Augliera, P., Biagini, D., Calamita, C., Castagnozzi, A., Cavaliere, A., Costanzo, A., Della Bina, E., Farroni, S., Galluzzo, D., Gasparini, A., Ladina, C., Lauciani, V., Mandiello, A. G., Margheriti, L., Marzorati, S., Moretti, M., Pantaleo, D., Pastori, M., Piccinini, D., Salimbeni, S., Scognamiglio, L., and Zaccarelli, L.: Seismic Data acquired by the SISMIKO Emergency Group – Northern Marche Coast – Italy 2022 – T17, Istituto Nazionale di Geofisica e Vulcanologia (INGV) [data set], https://doi.org/10.13127/SD/TBLKBA-3U6, 2022.
Danecek, P., Pintore, S., Mazza, S., Mandiello, A., Fares, M., and Carluccio, I.: The Italian node of the European integrated data archive, Seismol. Res. Lett., 92, 1726–1737, https://doi.org/10.1785/0220200409, 2021.
Di Giulio, G., Cara, F., Rovelli, A., Lombardo, G., and Rigano, R.: Evidences for strong directional resonances in intensely deformed zones of the Pernicana fault, Mount Etna, Italy, J. Geophys. Res.-Sol. Ea., 114, B10308, https://doi.org/10.1029/2009JB006393, 2009.
DISS Working Group. Database of Individual Seismogenic Sources (DISS), Version 3.3.0: A compilation of potential sources for earthquakes larger than M 5.5 in Italy and surrounding areas, Istituto Nazionale di Geofisica e Vulcanologia (INGV), https://doi.org/10.13127/diss3.3.0, 2021.
EMERSITO Working Group: Rete sismica temporanea 6N installata ad Ancona dal gruppo EMERSITO durante la sequenza sismica del 2022 – Costa Marchigiana-Pesarese, Istituto Nazionale di Geofisica e Vulcanologia (INGV) [data set], https://doi.org/10.13127/SD/QCTGD6C-3A, 2024.
Famiani, D., Cara, F., Cultrera, G., Di Giulio, G., Riccio, G., Pacor, F., Lovati, S., Vassallo, M., Bobbio, A., Costanzo, A., Massa, M., Nardone, L., Hailemikael, S., Fodarella, A., Sgattoni, G., Ladina, C., Mele, G., Pucillo, S., Mercuri, A., Marzorati, S., Pischiutta, M., Cogliano, R., Puglia, R., Milana, G., Felicetta, C., Minarelli, L., Brunelli, G., Ciaccio, M. G., Di Filippo, A., Pantaleo, D., Calamita, C., Falco, L., Memmolo, A., and Tarabusi, G.: Rapporto n. 4 attività del gruppo operativo emersito a seguito dell'evento sismico Costa Marchigiana Pesarese Mw 5.5 del 9/11/2022. https://www.earth-prints.org/handle/2122/16014 (last access: 1 May 2025), 2023 (in Italian).
Ferraris, G., Maistrello, M., Rampoldi, R., Secomandi, P., and Stucchi, M.: The seismological network of Ancona, Boll. Geof. Teor. Appl., 18, 299–316, 1975.
Fiorillo, F.: Geological features and landslide mechanisms of an unstable coastal slope (Petacciato, Italy), Eng. Geol., 67, 255–267, 2003.
GMT 6: Wessel, P., Luis, J. F., Uieda, L., Scharroo, R., Wobbe, F., Smith, W. H. F., and Tian, D.: The Generic Mapping Tools Version 6. Geochem. Geophy. Geosy., 20, 5556–5564, https://doi.org/10.1029/2019GC008515, 2019.
Guidoboni, E., Ferrari, G., Mariotti, D., Comastri, A., Tarabusi, G., Sgattoni, G., and Valensise, G.: CFTI5Med, Catalogo dei Forti Terremoti in Italia (461 a.C.–1997) e nell'area Mediterranea (760 a.C.–1500), Istituto Nazionale di Geofisica e Vulcanologia (INGV), https://doi.org/10.6092/ingv.it-cfti5, 2018.
Hailemikael, S., Amoroso, S., and Gaudiosi, I.: Guest editorial: seismic microzonation of Central Italy following the 2016–2017 seismic sequence, B. Earthq. Eng., 18, 5415–5422, https://doi.org/10.1007/s10518-020-00929-6, 2020.
Istituto Nazionale di Geofisica e Vulcanologia (INGV): Rete Sismica Nazionale (RSN), Istituto Nazionale di Geofisica e Vulcanologia (INGV), https://doi.org/10.13127/SD/X0FXnH7QfY, 2005.
Jurkevics, A.: Polarisation analysis of three-component array data, B. Seismol. Soc. Am., 78, 1725–1743, https://scispace.com/pdf/polarization-analysis-of-three-component-array-data-ouy5k4u597.pdf (last access: 1 May 2025), 1988.
Kanasewich, E. R.: Time Sequence Analysis in Geophysics, 3rd edn., 532 pp., Univ. of Alberta Press, Edmonton, Canada, ISBN 0-88864-074-9, 1981.
Kisslinger, C.: The Ancona, Italy Earthquake Swarm, 1972, Earthquake Notes, XLIII, 4, https://doi.org/10.1785/gssrl.43.4.9, 1972.
Konno, K. and Ohmachi, T.: Ground-motion characteristics estimated from spectral ratio between horizontal and vertical components of microtremor, B. Seismol. Soc. Am., 88, 228–241, https://doi.org/10.1785/BSSA0880010228, 1998.
Lermo, J. and Chávez-García, F. J.: Site effect evaluation using spectral ratios with only one station, B. Seismol. Soc. Am., 83, 1574–1594, https://doi.org/10.1785/BSSA0830051574, 1993.
Lettieri, M.: – Progetto CARG – Il Progetto di Cartografia geologica nazionale alla scala 1:50.000: stato di avanzamento (novembre 2008), in Mem. Descr. Carta Geol. d'It. LXXXVIII, figg. 3, 17–20, https://www.isprambiente.gov.it/files/pubblicazioni/periodicitecnici/memorie/memorielxxxviii/88-ventanni-lettieri.pdf (last access: 1 May 2025), 2009.
Luzi, L., Lanzano, G., Felicetta, C., D'Amico, M. C., Russo, E., Sgobba, S., Pacor, F., and ORFEUS Working Group 5: Engineering Strong Motion Database (ESM) (Version 2.0), Istituto Nazionale di Geofisica e Vulcanologia (INGV), https://doi.org/10.13127/ESM.2, 2020.
McNamara, D. E. and Buland, R. P.: Ambient noise levels in the continental United States, B. Seismol. Soc. Am., 94, 1517–1527, https://doi.org/10.1785/012003001, 2004.
Milana, G., Cultrera, G., Bordoni, P., Bucci, A., Cara, F., Cogliano, R., Di Giulio, G., Di Naccio, D., Famiani, D., Fodarella, A., Mercuri, A., Pischiutta, M., Pucillo, S., Riccio G., and Vassallo, M.: Local site effects estimation at Amatrice (Central Italy) through seismological methods, B. Earthq. Eng., 18, 5713–5739, https://doi.org/10.1007/s10518-019-00587-3, 2020.
Moretti, M., Margheriti, L., D'Alema, E., and Piccinini, D.: SISMIKO: INGV operational task force for rapid deployment of seismic network during earthquake emergencies, Front. Earth Sci., 11, 1146579, https://doi.org/10.3389/feart.2023.1146579, 2023.
Nakamura, Y.: A method for dynamic characteristics estimation of subsurface using microtremor on the ground surface. Railway Technical Research Institute, Quarterly Reports, 30, https://www.sdr.co.jp/papers/hv_1989.pdf (last access: 1 May 2025), 1989.
Nardone, L., Vassallo, M., Cultrera, G., Sapia, V., Petrosino, S., Pischiutta, M., Di Vito, M., de Vita, S., Galluzzo, D., Milana, G., Bellucci Sessa, E., Bobbio, A., Bordoni, P., Cara, F., Carandente, A., Civico, R., Cogliano, R., Cusano, P., Di Giulio, G., Esposito, R., Famiani, D., Fodarella, A., Giannattasio, F., Marchetti, M., Marotta, E., Moretti, M., Napolitano, F., Pucillo, S., Riccio, G., Sepe, V., Tarabusi, G., and Tramelli, A.: A geophysical multidisciplinary approach to investigate the shallow subsoil structures in volcanic environment: The case of Ischia Island, J. Volcanol. Geoth. Res., 438, 107820, https://doi.org/10.1016/j.jvolgeores.2023.107820, 2023.
PCM-CPD: Presidency of Council of Ministers – Civil Protection Department: Italian Strong Motion Network, International Federation of Digital Seismograph Networks [data set], https://doi.org/10.7914/SN/IT, 1972.
Peterson, J. R.: Observations and Modeling of Seismic Background Noise. U.S.G.S, Open File Report, 93-322, 95 pp., https://doi.org/10.3133/ofr93322, 1993.
Pischiutta, M., Salvini, F., Fletcher, J. B., Rovelli, A., and Ben-Zion, Y.: Horizontal polarization of ground motion in the Hayward fault zone at Fremont, California: Dominant fault-high-angle polarization and fault-induced cracks, Geophys. J. Int., 188, 1255–1272, https://doi.org/10.1111/j.1365-246x.2011.05319.x, 2012.
Pischiutta, M., Cianfarra, P., Salvini, F., Cara, F., and Vannoli, P.: A systematic analysis of directional site effects at stations of the Italian seismic network to test the role of local topography, Geophys. J. Int., 214, 635–650, https://doi.org/10.1093/gji/ggy133, 2018.
Pischiutta, M., Cara, F., and Famiani, D.: Rotated horizontal to vertical spectral ratios on ambient noise (HVNSR rot) recordings of stations of the 6N network during the activities of the EMERSITO INGV emergency group in Ancona (Italy) following the 2022 MW 5.5 Costa Marchigiana-Pesarese earthquake, Zenodo [data set], https://doi.org/10.5281/zenodo.14700835, 2025a.
Pischiutta, M., Cara, F., and Famiani, D.: Rotated horizontal to vertical spectral ratios on earthquake (HVSR rot) recordings of stations of the 6N network during the activities of the EMERSITO INGV emergency group in Ancona (Italy) following the 2022 MW 5.5 Costa Marchigiana-Pesarese earthquake, Zenodo [data set], https://doi.org/10.5281/zenodo.14701171, 2025b.
Priolo, E., Pacor, F., Spallarossa, D. Milana, G., Laurenzano, G., Romano, M. A., Felicetta, C., Hailemikael, S., Cara, F., Di Giulio, G., Ferretti, G., Barnaba, C., Lanzano, G., Luzi, L., D'Amico, M., Puglia, R., Scafidi, D., Barani, S., De Ferrari, R., and Cultrera, G.: Seismological analyses of the seismic microzonation of 138 municipalities damaged by the 2016–2017 seismic sequence in Central Italy, B. Earthq. Eng., 18, 5553–5593, https://doi.org/10.1007/s10518-019-00652-x, 2020.
QGIS Development Team: QGIS Geographic Information System, Open Source Geospatial Foundation Project, 2024.
Reasenberg, P. A. and Oppenheimer, D.: FPFIT, FPPLOT and FPPAGE: FORTRAN Computer Programs for Calculating and Displaying Earthquake Fault-Plane Solutions, US Geological Survey Open-File Report, 85-739, USGS, 109 pp., https://doi.org/10.3133/ofr85739, 1985.
Rigano, R., Cara, F., Lombardo, G., and Rovelli, A.: Evidence for ground motion polarization on fault zones of Mount Etna volcano, J. Geophys. Res., 113, B10306, https://doi.org/10.1029/2007JB005574, 2008.
Rovida, A., Locati, M., Antonucci, A., and Camassi, R.: Archivio Storico Macrosismico Italiano (ASMI), Istituto Nazionale di Geofisica e Vulcanologia (INGV), https://doi.org/10.13127/asmi, 2017.
Rovida, A., Locati, M., Camassi, R., Lolli, B., and Gasperini P.: The Italian earthquake catalogue CPTI15, B. Earthq. Eng., 18, 2953–2984, https://doi.org/10.1007/s10518-020-00818-y, 2020.
Rovida, A., Locati, M., Camassi, R., Lolli, B., Gasperini, P., and Antonucci A.: Catalogo Parametrico dei Terremoti Italiani (CPTI15), versione 4.0, Istituto Nazionale di Geofisica e Vulcanologia (INGV), https://doi.org/10.13127/CPTI/CPTI15.4, 2022.
Spudich, P., Hellweg, M., and Lee, W. H. K.: Directional topographic site response at Tarzana observed in aftershocks of the 1994 Northridge, California, earthquake: Implications for mainshock motions, B. Seismol. Soc. Am., 86, S193–S208, https://doi.org/10.1785/BSSA08601BS193, 1996.
Stucchi, E. and Mazzotti, A.: 2D seismic exploration of the Ancona landslide (Adriatic Coast, Italy), Geophysics, 74, B139–B151, https://doi.org/10.1190/1.3157461, 2009.
Stucchi, E., Zgur, F., and Baradello, L.: Seismic land-marine acquisition survey on the Great Ancona Landslide, Near Surf. Geophys., 3, 235–243, https://doi.org/10.3997/1873-0604.2005019, 2005.
Tarquini, S., Isola, I., Favalli, M., and Battistini, A.: TINITALY, a digital elevation model of Italy with a 10 meters cell size (Version 1.0), Istituto Nazionale di Geofisica e Vulcanologia (INGV) [data set], https://doi.org/10.13127/tinitaly/1.0, 2007.
Tertulliani, A., Antonucci, A., Berardi, M., Borghi, A., Brunelli, G., Caracciolo, C., Castellano, C., D'Amico, V., Del Mese, S., Ercolani, E., Filosa, S., Graziani, L., Hailemikael, S., Rovida, A., Vannoli, P., Anderlini, L., Arcoraci, L., Azzaro, R., Bernardini, F., Castelli, V., Fodarella, A., Lanza, T., Maramai, A., and Pinzi, S.: Gruppo Operativo Quest Rilievo Macrosismico Mw 5.5 Costa Marchigiana del 9/11/2022, Rapporto Finale del 15/11/2022, https://www.earth-prints.org/handle/2122/15794 (last access: 1 May 2025), 2022.
Theodoulidis, N., Cultrera, G., Cornou, C., Bard, P.-Y., Boxberger, T., Di Giulio, G., Imtiaz, A., Kementzetzidou, D., Makra, K., and The Argostoli NERA Team: Basin effects on ground motion: the case of a high-resolution experiment in Cephalonia (Greece), B. Earthq. Eng., 16, 529–560, https://doi.org/10.1007/s10518-017-0225-4, 2018.
The MathWorks Inc.: MATLAB version: 9.13.0 (R2022b), Natick, Massachusetts: The MathWorks Inc., https://www.mathworks.com (last access: 1 May 2025), 2022.
Vassallo, M., Riccio, G., Mercuri, A., Cultrera, G., and Di Giulio, G.: HV Noise and Earthquake Automatic Analysis (HVNEA), Seismol. Res. Lett., 94, 350–368, https://doi.org/10.1785/0220220115, 2022.
Wathelet, M., Chatelain, J. L., Cornou, C., Di Giulio, G., Guillier, B., Ohrnberger, M., and Savvaidis, A.: Geopsy: A User-Friendly Open-Source Tool Set for Ambient Vibration Processing, Seismol. Res. Lett., 91, 1878–1889, https://doi.org/10.1785/0220190360, 2020.