the Creative Commons Attribution 4.0 License.
the Creative Commons Attribution 4.0 License.
 | 06 May 2025
The 20 m Africa rice distribution map of 2023
Jingling Jiang
Hong Zhang
Ji Ge
Lijun Zuo
Mingyang Song
Yinhaibin Ding
Yazhe Xie
Wenjiang Huang
In recent years, the demand for rice in Africa has been growing rapidly, and, in order to meet this demand, the rice cultivation area is also expanding rapidly; thus, it is of great significance to monitor the rice cultivation in Africa. The spatial and temporal distribution of rice cultivation in Africa is complex, making it difficult to use phenology-based rice identification methods, and the existing rice distribution products of Africa are all made up of grid-based statistical data with a low resolution, unable to obtain accurate rice field location and available labels. To address these two difficulties, based on time series optical and dual-polarization synthetic aperture radar (SAR) data, this study proposes a sample set construction method by means of fast-coarse-positioning-assisted visual interpretation and a feature-importance-guided supervised classification combining multiple temporal optical and SAR features to reduce the impact of rice diversity in Africa. Firstly, we use the time series statistical features of vertical transmit, horizontal receive (VH) data for fast coarse positioning and screening of possible rice areas and combine multiple auxiliary data for visual interpretation to construct the sample set; secondly, based on the complementary information in SAR data and optical data, the 20 m Africa rice distribution map of 2023 was completed by combining the object-oriented segmentation results of temporal optical images and the pixel-based classification results of temporal SAR data features after feature selection. The average classification accuracy of the proposed method for the validation set is more than 85 %, and the R2 of the linear fit to various existing statistical data is more than 0.9, which proves that the proposed method can achieve the spatial distribution mapping of rice under complex climatic conditions in a large region, providing crucial data support for rice monitoring and agricultural policy development. The dataset is available at https://doi.org/10.5281/zenodo.13729353 (Jiang et al., 2024).
- Article
(12542 KB) - Full-text XML
- BibTeX
- EndNote


Rice is the staple food for half of the world's population (Kuenzer and Knauer, 2013), providing over a quarter of the calories for approximately half of the population (Wu et al., 2023), playing an important role in maintaining global food security, and also being crucial to the economies of many developing countries (Seck et al., 2012; Ajala and Gana, 2015). In 2021, rice accounted for approximately 8.3 % of the world's major crop production (FAO, 2022). In Africa, rice accounted for approximately 3.8 % of the main crop yield and 4.7 % of the global rice production. Despite its current modest share, the demand for rice in sub-Saharan Africa is increasing at over 6 % annually due to population growth, urbanization, and changes in consumer preferences, surpassing any other staple food (Arouna et al., 2021). In order to meet the higher demand for rice, the synchronous growth of local rice production and imports in Africa, along with the expansion of rice area rather than the increase in production, are the main driving forces of the increase in domestic production. In the past 30 years, the cultivated land area has expanded by about 400 000 ha yr−1 (Yuan et al., 2024).
In 2023, in order to promote food and nutrition security in Africa, the African Rice Center proposed the 2030 Africa Rice Research and Innovation Strategy (AfricaRice, 2023) to transform the rice-based agricultural food system and to allow the rice area in Africa to continue to grow. Meanwhile, rice cultivation and production are important sources of income for a large number of African households (Hussain et al., 2020). However, rice cultivation in Africa also faces many challenges. Firstly, Africa is highly susceptible to the impacts of climate change, such as extreme weather events, changes in precipitation patterns, and rising temperatures, which can have a significant impact on agricultural production (Field and Barros, 2014; Ogisi and Begho, 2023). Land use changes across Africa, particularly urban expansion and deforestation, also influence the distribution of rice cultivation areas (Lambin and Geist 2008, Bren d'Amour, Reitsma et al., 2017). Consequently, it is essential to obtain high-resolution maps of rice spatial distributions in Africa for monitoring the condition of rice cultivation across the continent.
In recent years, the global crop mapping datasets that have included rice in Africa mainly include SPAM2010 (Yu et al., 2020), GAEZ+2015 (Global Agro Ecological Zones) (Frolking et al., 2020), SPAMAF2017 (International Food Policy Research, 2020), and CROPGRIDS (Tang et al., 2023). The SPAM2010 and SPAMAF2017 datasets are based on SPAM (Spatial Production Allocation Model), developed by the International Food Policy Research Institute (IFPRI), which utilizes geographic spatial data such as land use types and crop statistical data as inputs to make reasonable estimates of crop distribution within the decomposed units using a cross-entropy approach, with a spatial resolution of 5 min (∼10 km). GAEZ+2015 utilized the GAEZ model and FAO's crop statistical data to generate grid distribution products for 26 crops, with a spatial resolution of 5 min (∼10 km). CROPGRIDS has generated the latest global georeferenced dataset of 173 crops using 26 published grid datasets, with a spatial resolution of 0.05° (∼5.5 km). The existing datasets have a low resolution and are all gridded datasets rather than high-resolution distribution maps. Moreover, these data are generally outdated, making them of limited significance for monitoring rice cultivation in Africa.
Due to the complementarity of information between synthetic aperture radar (SAR) data and optical remote sensing data, current large-scale rice mapping benefits from multi-source data that combine SAR data and optical remote sensing data as data sources (Han et al., 2021; Shen et al., 2023; Ginting et al., 2024). Current rice-mapping methods are usually divided into the following: (1) phenology-based classification methods (for example, Qiu et al. (2015) utilized the CCVS (the Combined Consideration of Vegetation phenology and Surface water variations) index, constructed using the Land Surface Water Index (LSWI) and the Enhanced Vegetation Index (EVI), during the rice heading and transplanting stages to map rice in the complex terrain of southern China, and, similarly, Zhang et al. (2023) employed the SPRI (SAR-based Rice Paddy Index), which describes the growth status from the transplanting to maturity stages to achieve sample-free mapping of double-cropping rice; these methods do not require sample data but rely heavily on accurate phenological information); (2) methods leveraging time series curve similarity measures, such as DTW (dynamic time warping) (Guan et al., 2016) and its improved version TWDTW (time-weighted dynamic time warping) (Singh et al., 2021; Tian et al., 2024), requiring only a small number of rice samples to obtain a standard rice growth curve; and (3) supervised classification methods, including various machine learning methods (Wang et al., 2020; Zhang et al., 2020; You et al., 2021) and rapidly developing deep learning methods of recent years (Zhu et al., 2021; Sun et al., 2023). These methods offer several advantages for rice mapping. They do not require phenological information, making them adaptable to different regions and growing conditions. Additionally, they provide high classification accuracy and robustness when large amounts of labeled sample data are available. This allows for more precise identification and mapping of rice fields, even in complex landscapes or where other methods struggle. However, the effectiveness of these approaches depends on the availability and quality of the training data.
The first challenge in mapping rice in Africa lies in the significant temporal and spatial variability of rice cultivation due to the tropical and subtropical climate, as illustrated in Fig. 1. The data in this figure are derived from the rice calendar product RiceAtlas (Laborte et al., 2017), published in 2017, with annotations of the months when the main and secondary seasons of rice planting in Africa end and harvest begins. African rice cultivation includes both single- and double-cropping systems, with variations in planting times and growth durations across different seasons. This makes it difficult to apply a uniform phenological description for mapping rice across the entire continent. Notably, large areas of rainfed rice cultivation (Balasubramanian et al., 2007) in Africa lack the distinct flooding signals typical of irrigated rice, which are commonly used in widely adopted rice-mapping methods that rely on detecting flooding periods (Guo et al., 2019; Zhan et al., 2021; Wei et al., 2022). Consequently, phenology-based rice-mapping methods are challenging to apply in Africa. Similarly, DTW-based approaches are difficult to implement due to the variability in rice cropping intensity and phenology, which hinders the identification of a standard rice growth curve. Therefore, integrating time series data with supervised classification emerges as the primary strategy for mapping rice spatial distributions in Africa. However, the main challenge of this approach lies in constructing the sample set. Existing rice distribution products for Africa are grid-based, making it difficult to quickly identify rice-growing areas for sample set construction. Moreover, the diversity of rice cultivation in Africa – spanning phenology (including cropping intensity), farming practices (irrigated or rainfed), and environmental conditions (plains, hills) – complicates the identification of rice fields and makes it challenging to ensure the representativeness and completeness of the samples.
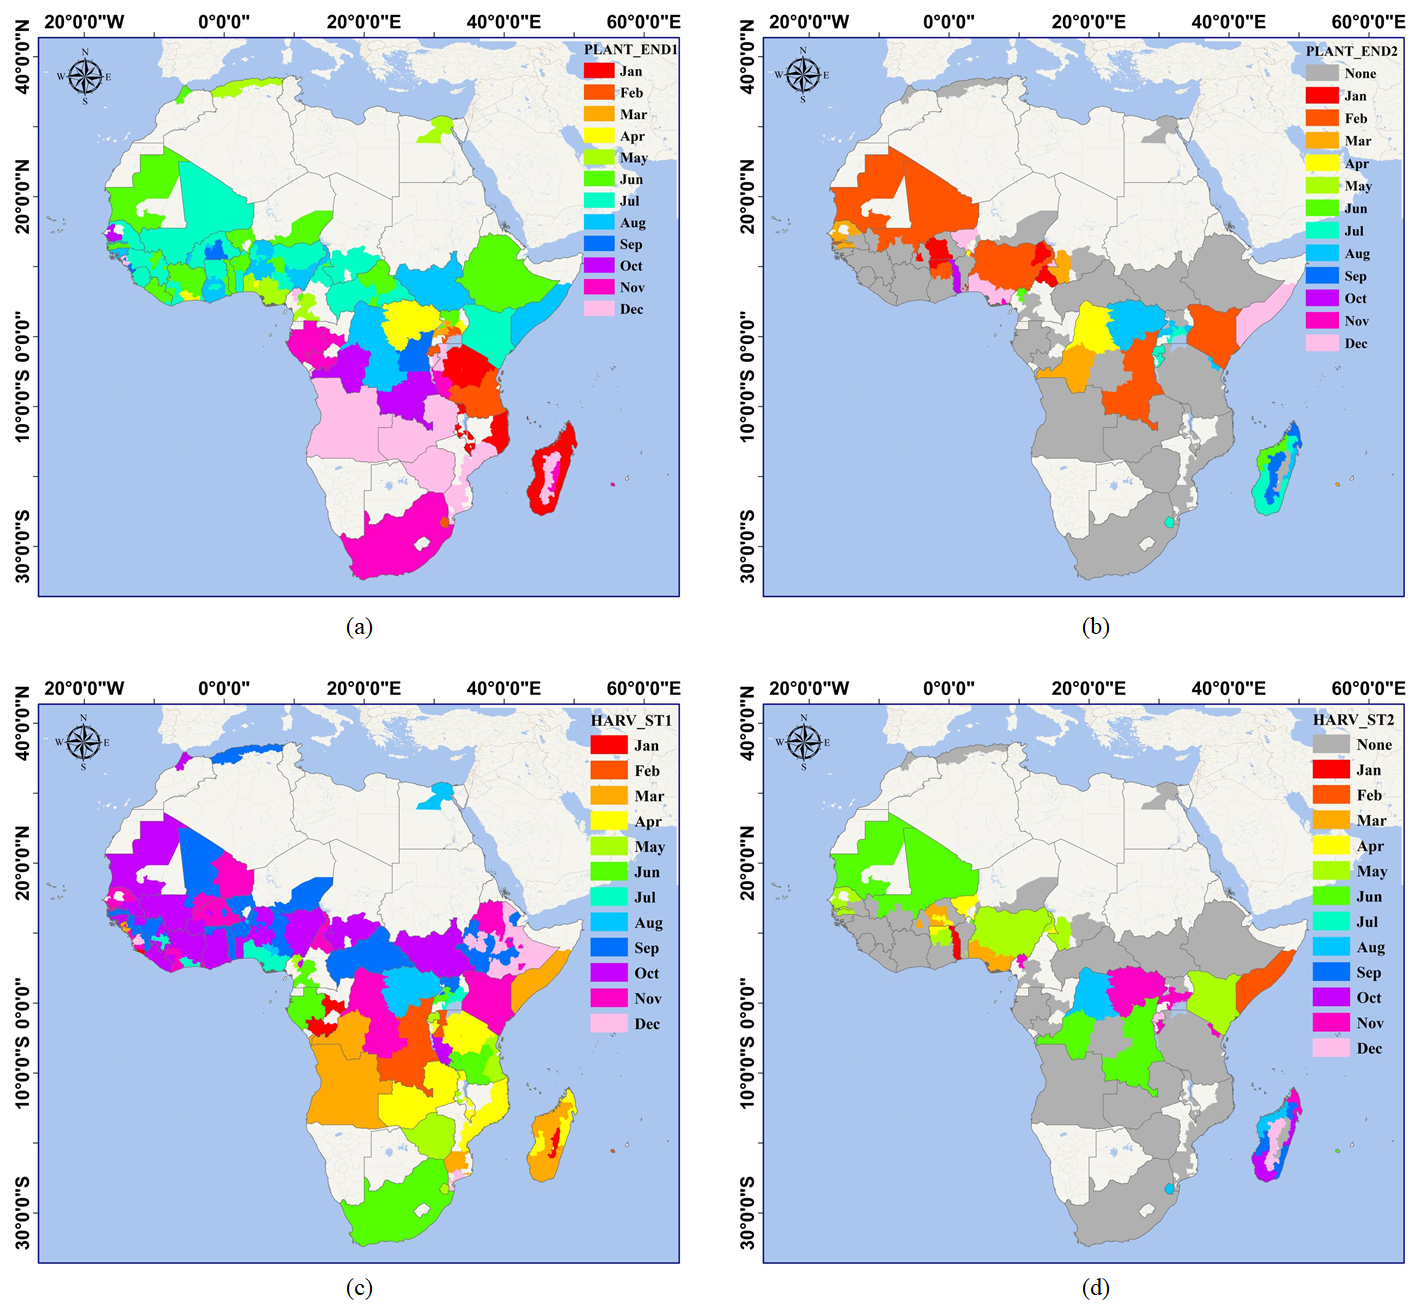
Figure 1Rice-planting calendar: (a) main rice season planting end date, (b) secondary rice season planting end date, (c) main rice season harvest start date, and (d) secondary rice season harvest start date. Data sourced from © RiceAtlas.
In recent years, the Google Earth Engine (GEE) platform has provided robust support for high-resolution crop mapping. GEE integrates extensive remote sensing data and geographic information system tools, enabling rapid processing and analysis of massive time series datasets (Gorelick et al., 2017). In particular, Sentinel satellite data (Sentinel-1 and Sentinel-2) have been widely applied in crop monitoring and mapping due to their high spatial resolution and frequent temporal coverage (Saad El Imanni et al., 2022; Waleed et al., 2022; Luo et al., 2023; Zoungrana et al., 2024). Additionally, the GEE platform supports various supervised classification methods, including random forest (RF), support vector machine (SVM), and classification and regression trees (CARTs) (Liu et al., 2020; You et al., 2021; Avcı et al., 2023). By integrating multi-source time series Sentinel data with these supervised classification algorithms available on the GEE platform, it has become feasible to achieve large-scale, high-resolution, and high-accuracy mapping of rice distributions in Africa.
In summary, this study employs a multi-source time series data approach combined with classification algorithms to produce large-scale and high-resolution rice distribution maps across Africa. Specifically, to address the challenge of sample collection, time series statistical features from Sentinel-1 VH data are used for fast coarse positioning of potential rice-planting areas, followed by visual interpretation using various auxiliary datasets to create reliable samples. During the classification stage, object-based segmentation results derived from Sentinel-2 optical time series data are integrated with feature-importance-guided random forest classification results from Sentinel-1 SAR time series to obtain more precise rice paddy boundaries and to reduce noise in heterogeneous landscapes. This approach successfully generated a 20 m resolution rice distribution map for Africa in 2023. The research could provide scientific support for rice management in Africa, contribute to improving rice yields, ensure food security, and offer data for addressing climate change. The findings are expected to be valuable for policymakers, agricultural scientists, and farmers alike.
2.1 Study site
In this study, 34 countries with harvested rice areas exceeding 5000 ha, as reported by FAO (Food and Agriculture Organization of the United Nations) statistics in 2022, were selected as the study regions for rice spatial distribution mapping (FAO, 2023), as shown in Fig. 2. These include 3 countries in northern Africa (Egypt, Morocco, Sudan), 15 countries in western Africa (Benin, Burkina Faso, Côte d'Ivoire, Gambia, Ghana, Guinea, Guinea-Bissau, Liberia, Mali, Mauritania, Niger, Nigeria, Senegal, Sierra Leone, Togo), 5 countries in Central Africa (Angola, Cameroon, Central African Republic, Chad, Democratic Republic of the Congo), and 11 countries in eastern Africa (Burundi, Ethiopia, Kenya, Madagascar, Malawi, Mozambique, Rwanda, South Sudan, Uganda, Tanzania, Zambia). The regional division follows the United Nations geoscheme (United Nations, 2013).
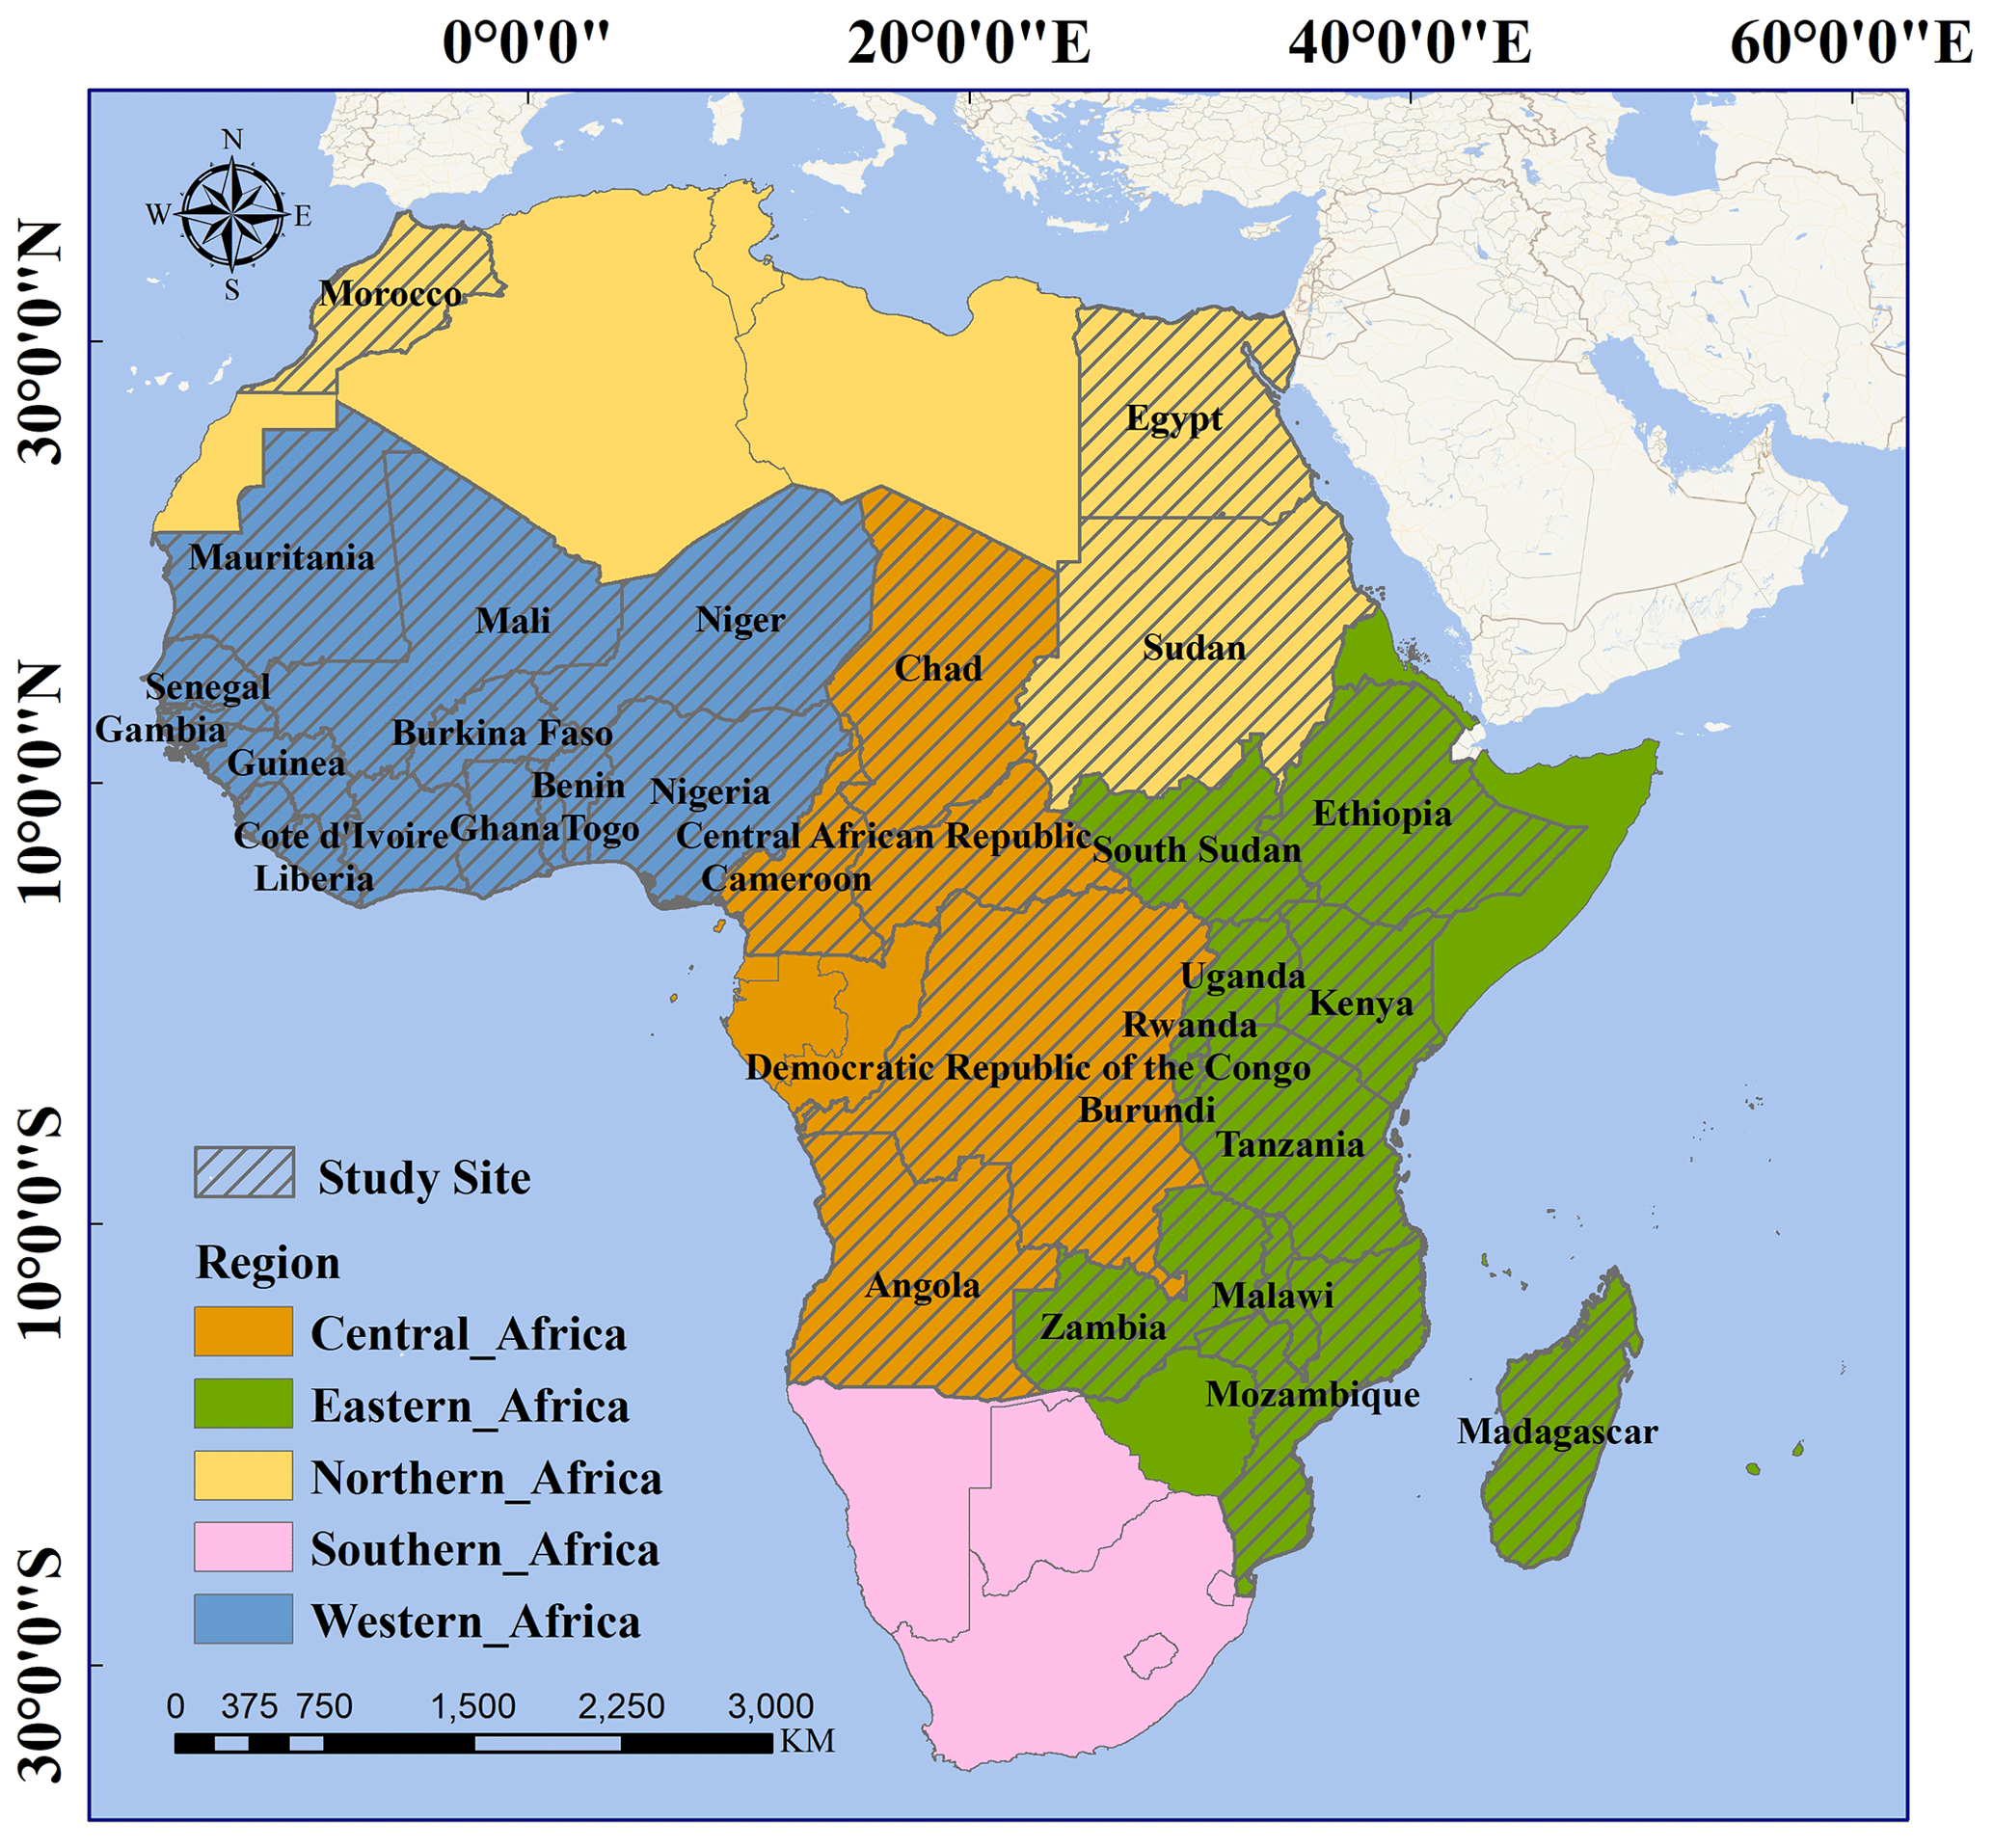
Figure 2Study site: 34 countries in Africa with rice harvest areas exceeding 5000 ha in 2022 according to FAO (diagonally marked area). Geographic information system (GIS) country boundaries in Fig. 2 are available from GADM (https://gadm.org, last access: 14 December 2023).
The climatic variations across the different sub-regions of Africa result in diverse rice cultivation practices. In northern Africa, dominated by desert and Mediterranean climates, the hot and arid conditions, coupled with scarce rainfall, limit rice cultivation to areas with stable water resources, such as the Nile River basin. Rice is primarily cultivated as a single-season crop, relying heavily on irrigation systems. In western Africa, coastal regions experience tropical rainforest climates, while the interior regions have tropical savanna climates. Rainfall decreases progressively from the coast to inland, leading to rainfed rice cultivation predominantly in coastal areas during the rainy season, which typically spans from May to October, allowing for single-season planting. In inland areas, rice cultivation often depends on flood irrigation or irrigation systems, enabling multi-season cropping. Central Africa also features a tropical rainforest and savanna climate but with uneven rainfall distribution across seasons. As a result, phenological patterns of rainfed rice vary widely in rainforest areas, while rice cultivation in savanna areas partly depends on seasonal flooding or irrigation. In eastern Africa, the highland regions are characterized by warm and humid mountain climates, where rice cultivation primarily relies on natural rainfall, with the main rainy seasons occurring from April to June and October to December. In contrast, lowland areas have tropical savanna climates, requiring irrigation support for rice cultivation.
2.2 Data source
2.2.1 Satellite data
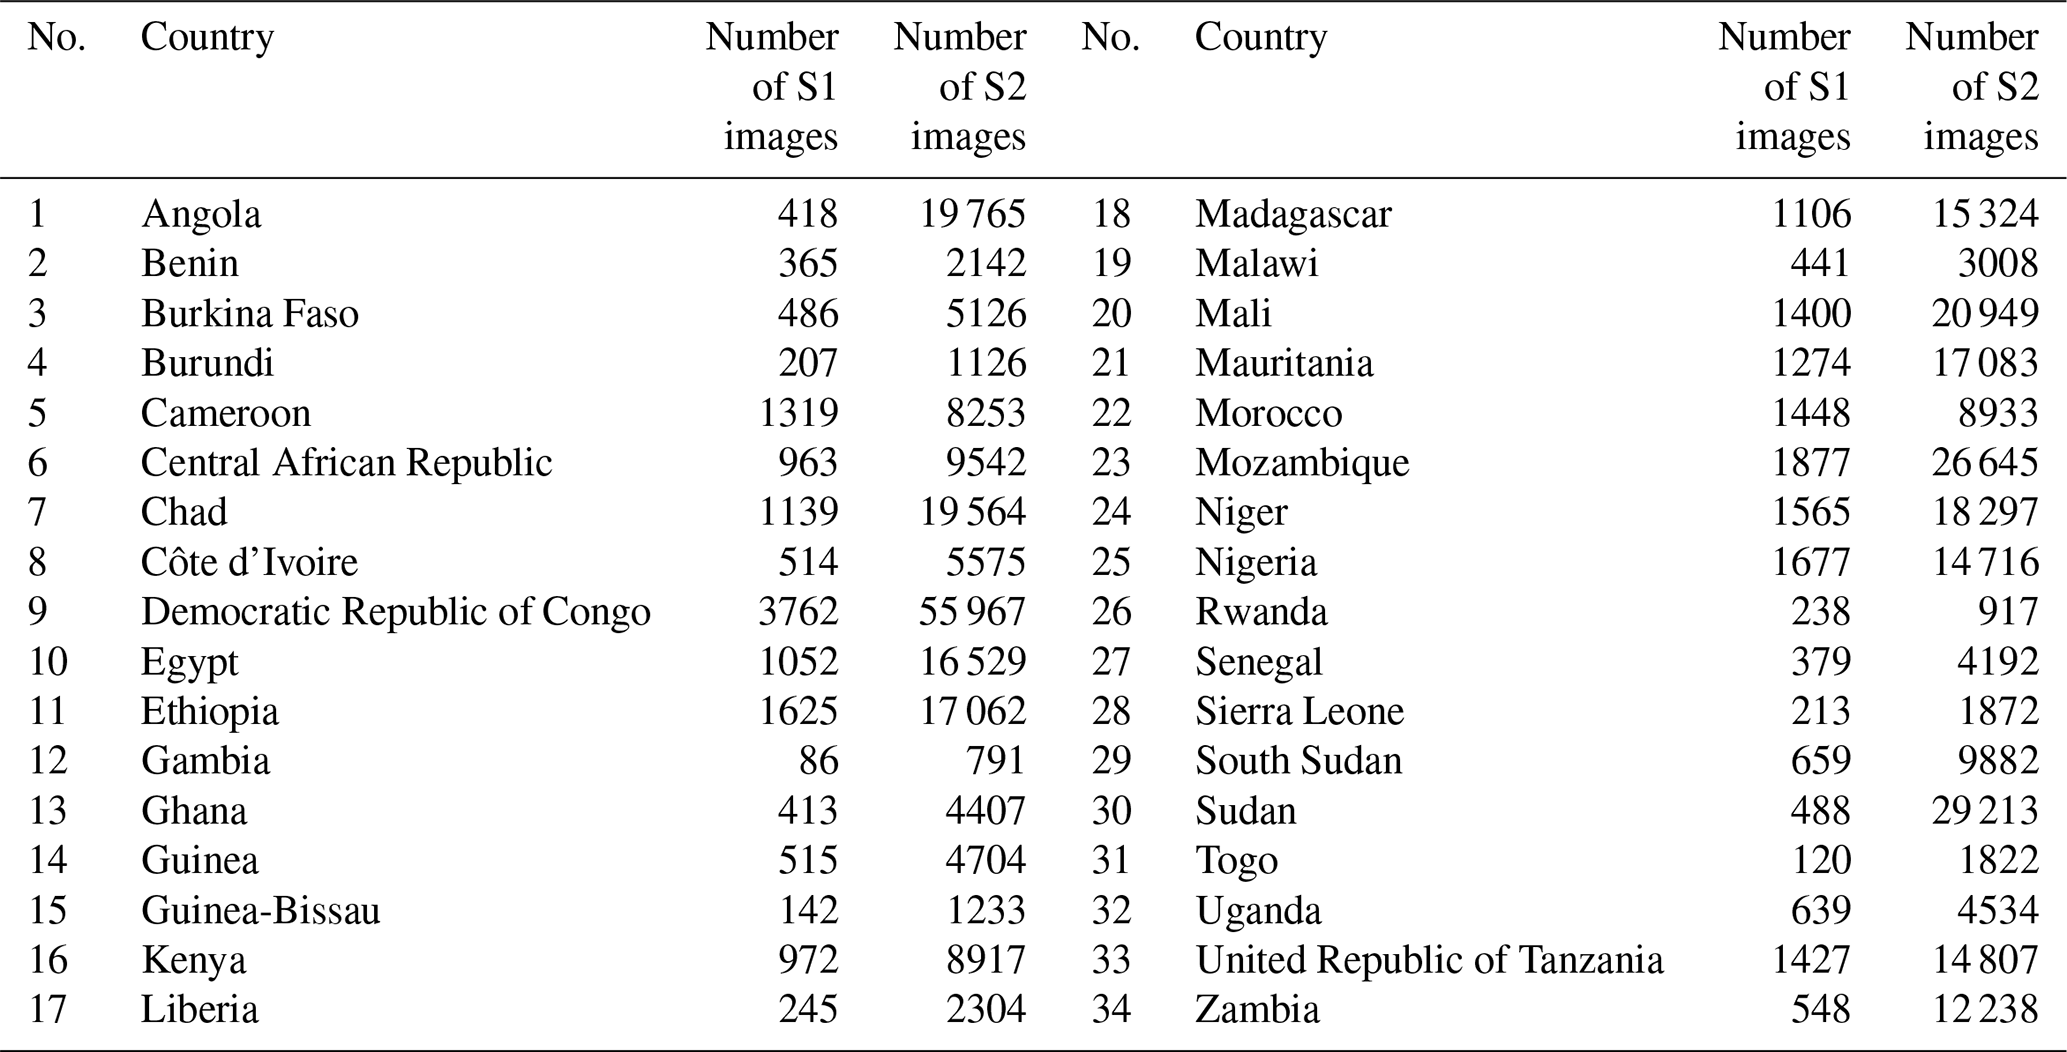
The main data sources in the study are time series SAR data and optical data for their high temporal and spatial coverage. Specifically, the monthly average VH and VV (vertical transmit, vertical receive) data of the Sentinel-1 satellite for the whole year of 2023 were obtained as SAR data inputs on the GEE platform. Because rice is sensitive to NDWI (normalized difference water index) and NDVI (normalized difference vegetation index) (Zhang et al., 2019; de Lima et al., 2021), the monthly average B3-, B4-, B8-, and B8A-band data of the Sentinel-2 satellite for the whole year of 2023 were obtained as optical data inputs into composite NDWI and NDVI. The substantial volume of data, covering multiple spectral and temporal dimensions, enhances the model's capability to detect seasonal variations and accurately map rice fields in diverse agro-ecological zones across Africa. Table 1 presents the number of satellite images utilized for the monthly average composite across each country within the study site. A total of 29 722 Sentinel-1 (S1) images and 387 439 Sentinel-2 (S2) images were employed in the experiment.
2.2.2 Land cover data
During the sample set construction phase, cropland data from the European Space Agency's (ESA) WorldCover data for 2020 and 2021 were used as a reference. By integrating land cover data from 2 consecutive years, the study ensured better temporal consistency and reliability in sample selection. The use of these land cover data also facilitated the initial separation of rice and non-rice areas, supporting more precise training and validation in the subsequent classification processes.
2.2.3 Rice grid data
During the sample set construction phase, rice grid data from the CROPGRIDS (Tang et al., 2023) grid distribution product released in 2023 were used as a reference.
2.2.4 Statistical data
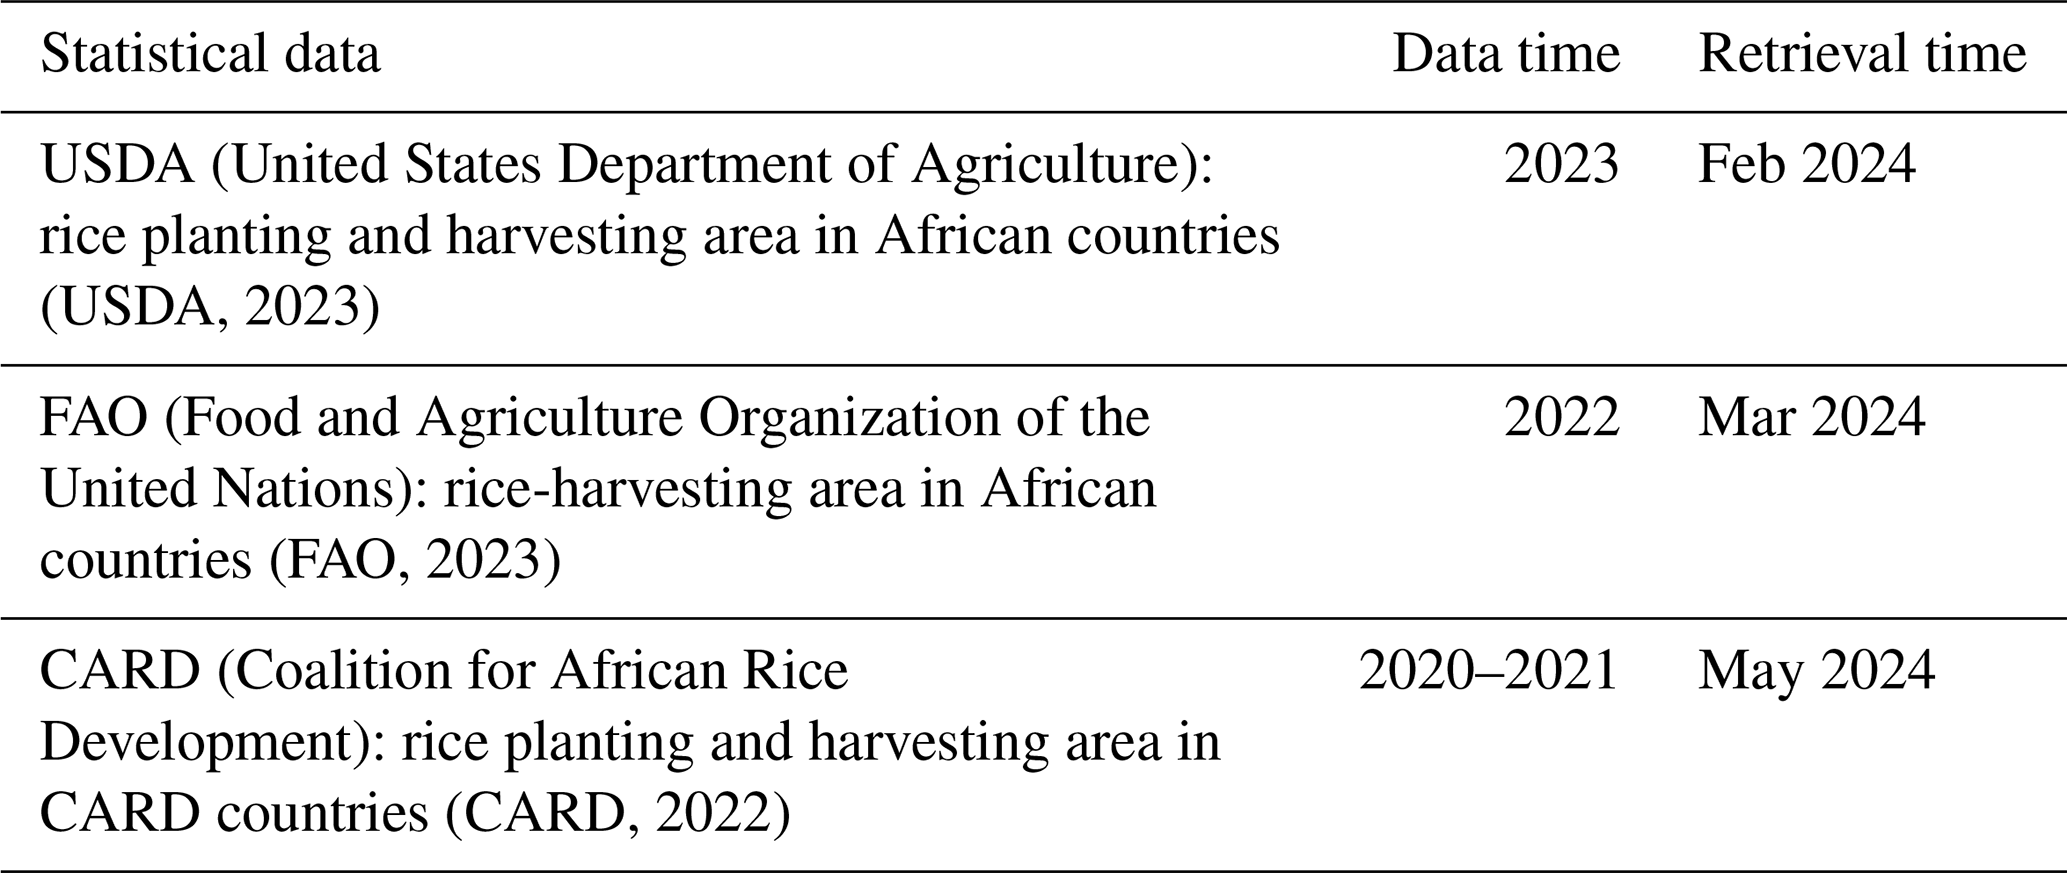
Three kinds of statistical data were used in the study, as shown in Table 2.
2.2.5 Administrative distribution data of rice-planting intensity
In the stage of comparison with statistical data, the administrative distribution data of rice-planting intensity in the RiceAtlas (Fig. 3) product (Laborte et al., 2017) were used to map the rice paddy area in the mapping results to the planting and/or harvesting area to compare with statistical data since the area data they provide all relate to planting and/or harvesting areas other than paddy area. The areas without single- or double-season information were defaulted to planting single-season rice.
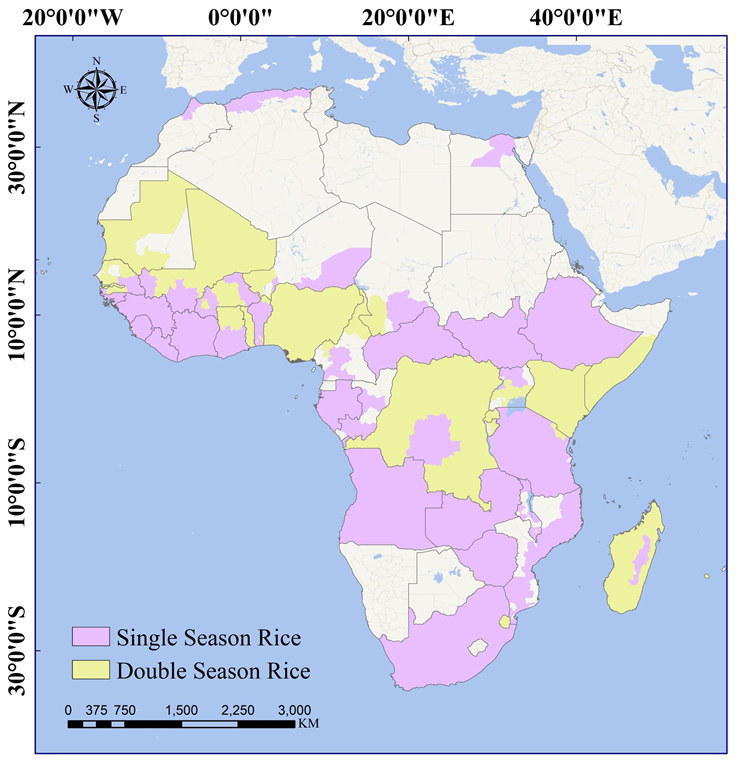
Figure 3Administrative distribution map of rice intensity from © RiceAtlas.
To calculate the planting area, the paddy area is first derived from the mapping result. Then the paddy area is allocated to the single-season paddy area and the double-season area according to the rice intensity map.
Then the planting area is calculated using the following:
The workflow for mapping the spatial distribution of rice in Africa at a 20 m resolution is depicted in Fig. 4. The study adopts a multi-source time series data approach combined with a supervised classifier to achieve large-scale, high-resolution mapping of rice distributions in Africa. The workflow is primarily divided into two main stages: sample set construction and object-based classification guided by feature importance.
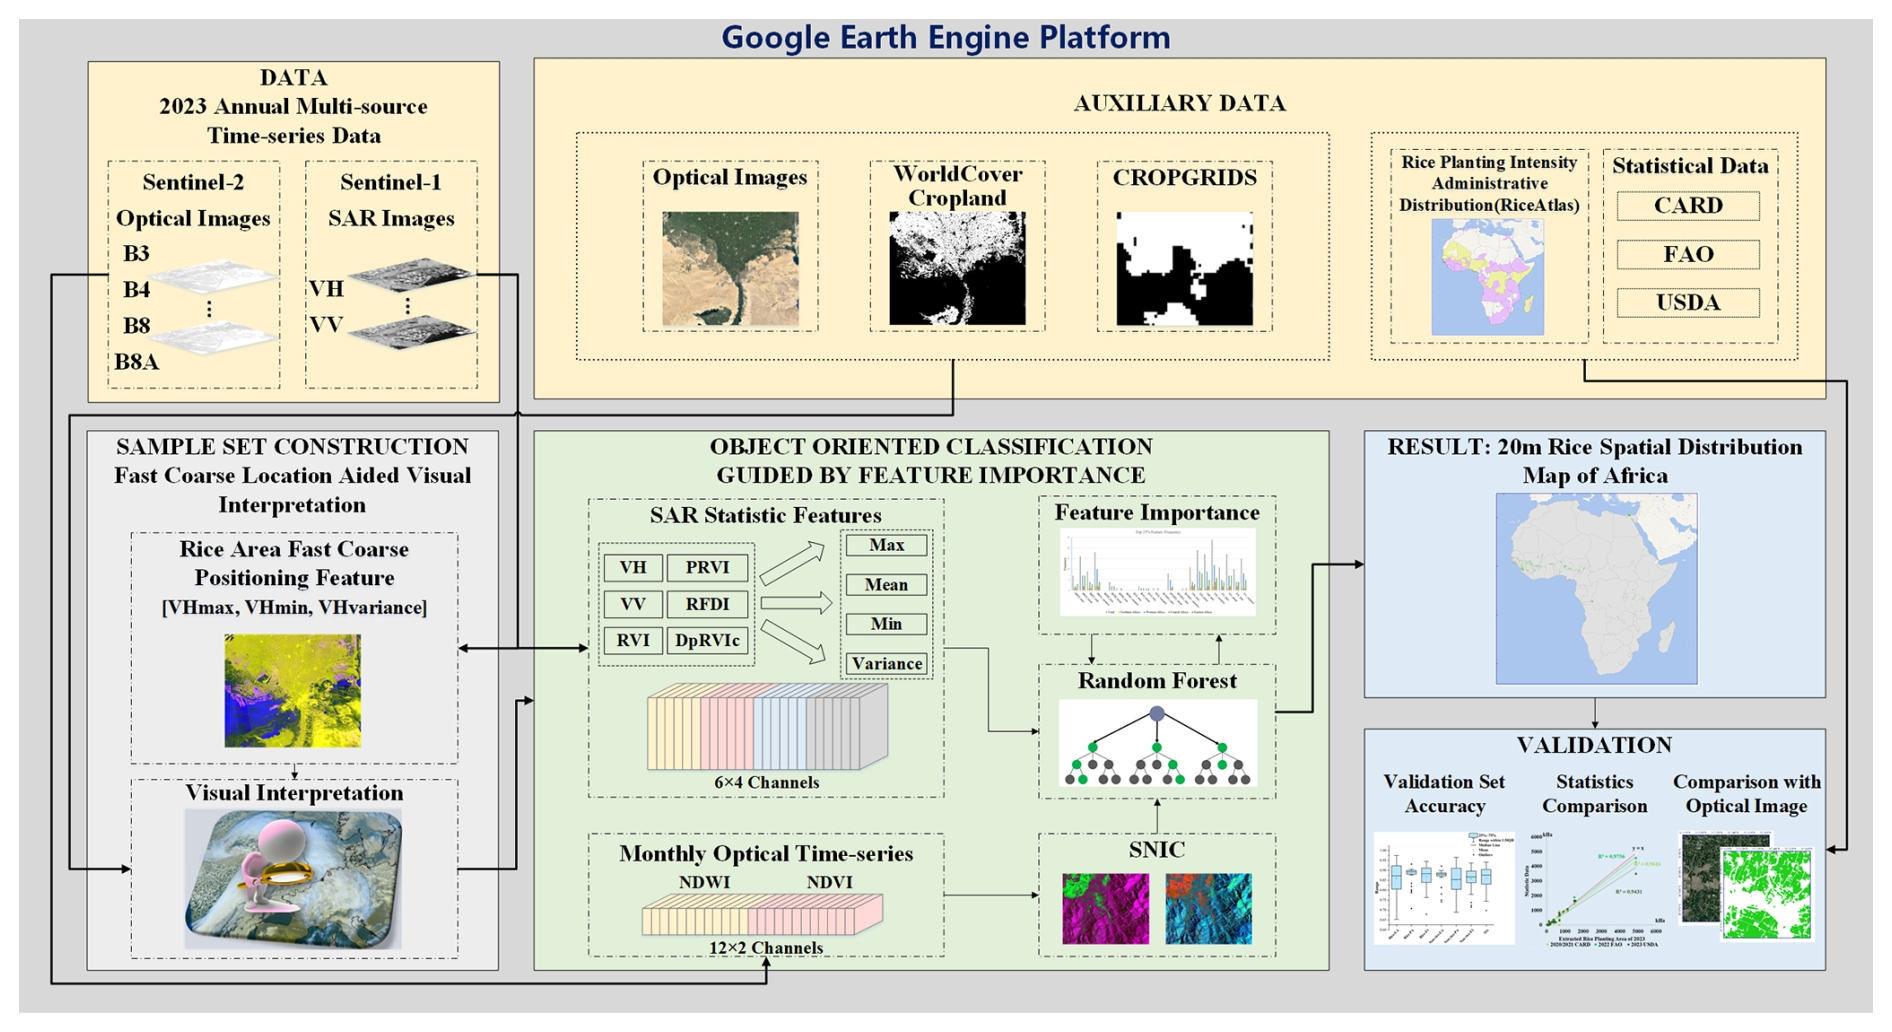
Figure 4Flowchart of the proposed rice-mapping method (optical images are from © Google Earth, WorldCover Cropland from © European Space Agency, CROPGRIDS from Tang et al. (2023), and administrative distribution map of rice intensity from © RiceAtlas).
During the sample set construction phase, visual interpretation is conducted with reference to ESA WorldCover cropland data, the CROPGRIDS rice grid map, and optical images, with statistical features from VH time series aiding in the fast coarse positioning of potential rice-growing regions.
During the classification phase, classification experiments were conducted in every country separately. Object-based segmentation is first performed on optical images to obtain super-pixel results, which help mitigate the effects of speckle noise in SAR imagery, enhance classification accuracy, and better capture the complex spatial patterns of rice fields. The mean values of SAR data (VH, VV) and various radar vegetation indices derived from SAR data within these super-pixels are then used as input features. A random forest classifier is applied to train the model, which gives ranks of the importance of the input features. The most important features of different sub-regions of Africa are selected for a subsequent classification to produce the rice paddy distribution map. Finally, accuracy validation is conducted using statistical data and validation datasets.
3.1 Sample set construction: fast-coarse-positioning-aided visual interpretation
3.1.1 Fast coarse positioning of rice-planting area
Sun et al. (2023) used the statistical features (max, min, variance) of VH time series data for pseudo-color composites in rice mapping in Southeast Asia as input features for rice extraction. In the pseudo-color feature map (R: VHmax; G: VHmin; B: VHvariance), rice appears to be purple because VHmin is small, while VHmax and VHvariance are larger, mainly caused by the drop in VH backscattering during flooding periods. This is true with both irrigated rice and rainfed rice in Southeast Asia in the literature. In the experiment, it was found that rice in Africa also exhibits similar behavior, as shown in Fig. 5, for it is a common phenomenon for rainfed rice to experience temporary floods of different durations and depths caused by rainfall, though this is not the same with the stable flooding periods of irrigated rice (Yamamoto et al., 2012; Kwesiga et al., 2019; Panda and Barik, 2021; Mwakyusa et al., 2023). Furthermore, it can be seen from Fig. 5 that the rice-planting region stands out distinctly in the feature map, making it easy to locate the general rice-planting region. However, it cannot be completely distinguished from ground objects like wetlands due to their similarity in the feature map. Therefore, the feature map was only used for fast coarse positioning and preliminary screening of rice regions. Specific examples of selected rice fields are presented in Fig. 6.
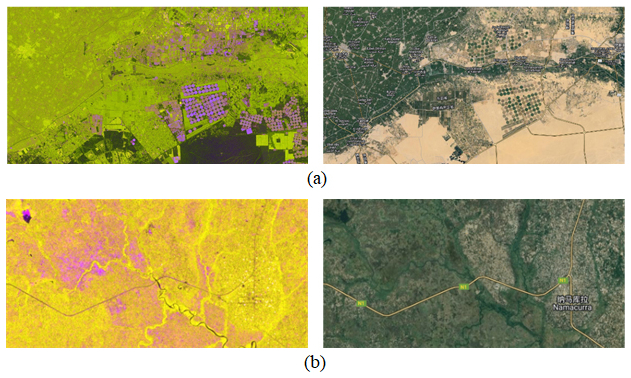
Figure 5Pseudo-color composite image (R: VHmax; G: VHmin; B: VHvariance) used for fast coarse positioning and corresponding optical images in Africa (from © Google Earth): (a) irrigated region in Egypt (Mathieu, 2022) and (b) rainfed lowland region in Mozambique (Kajisa and Vu, 2023). Examples of rice fields selected from these areas of Egypt and Mozambique are presented in Fig. 6.
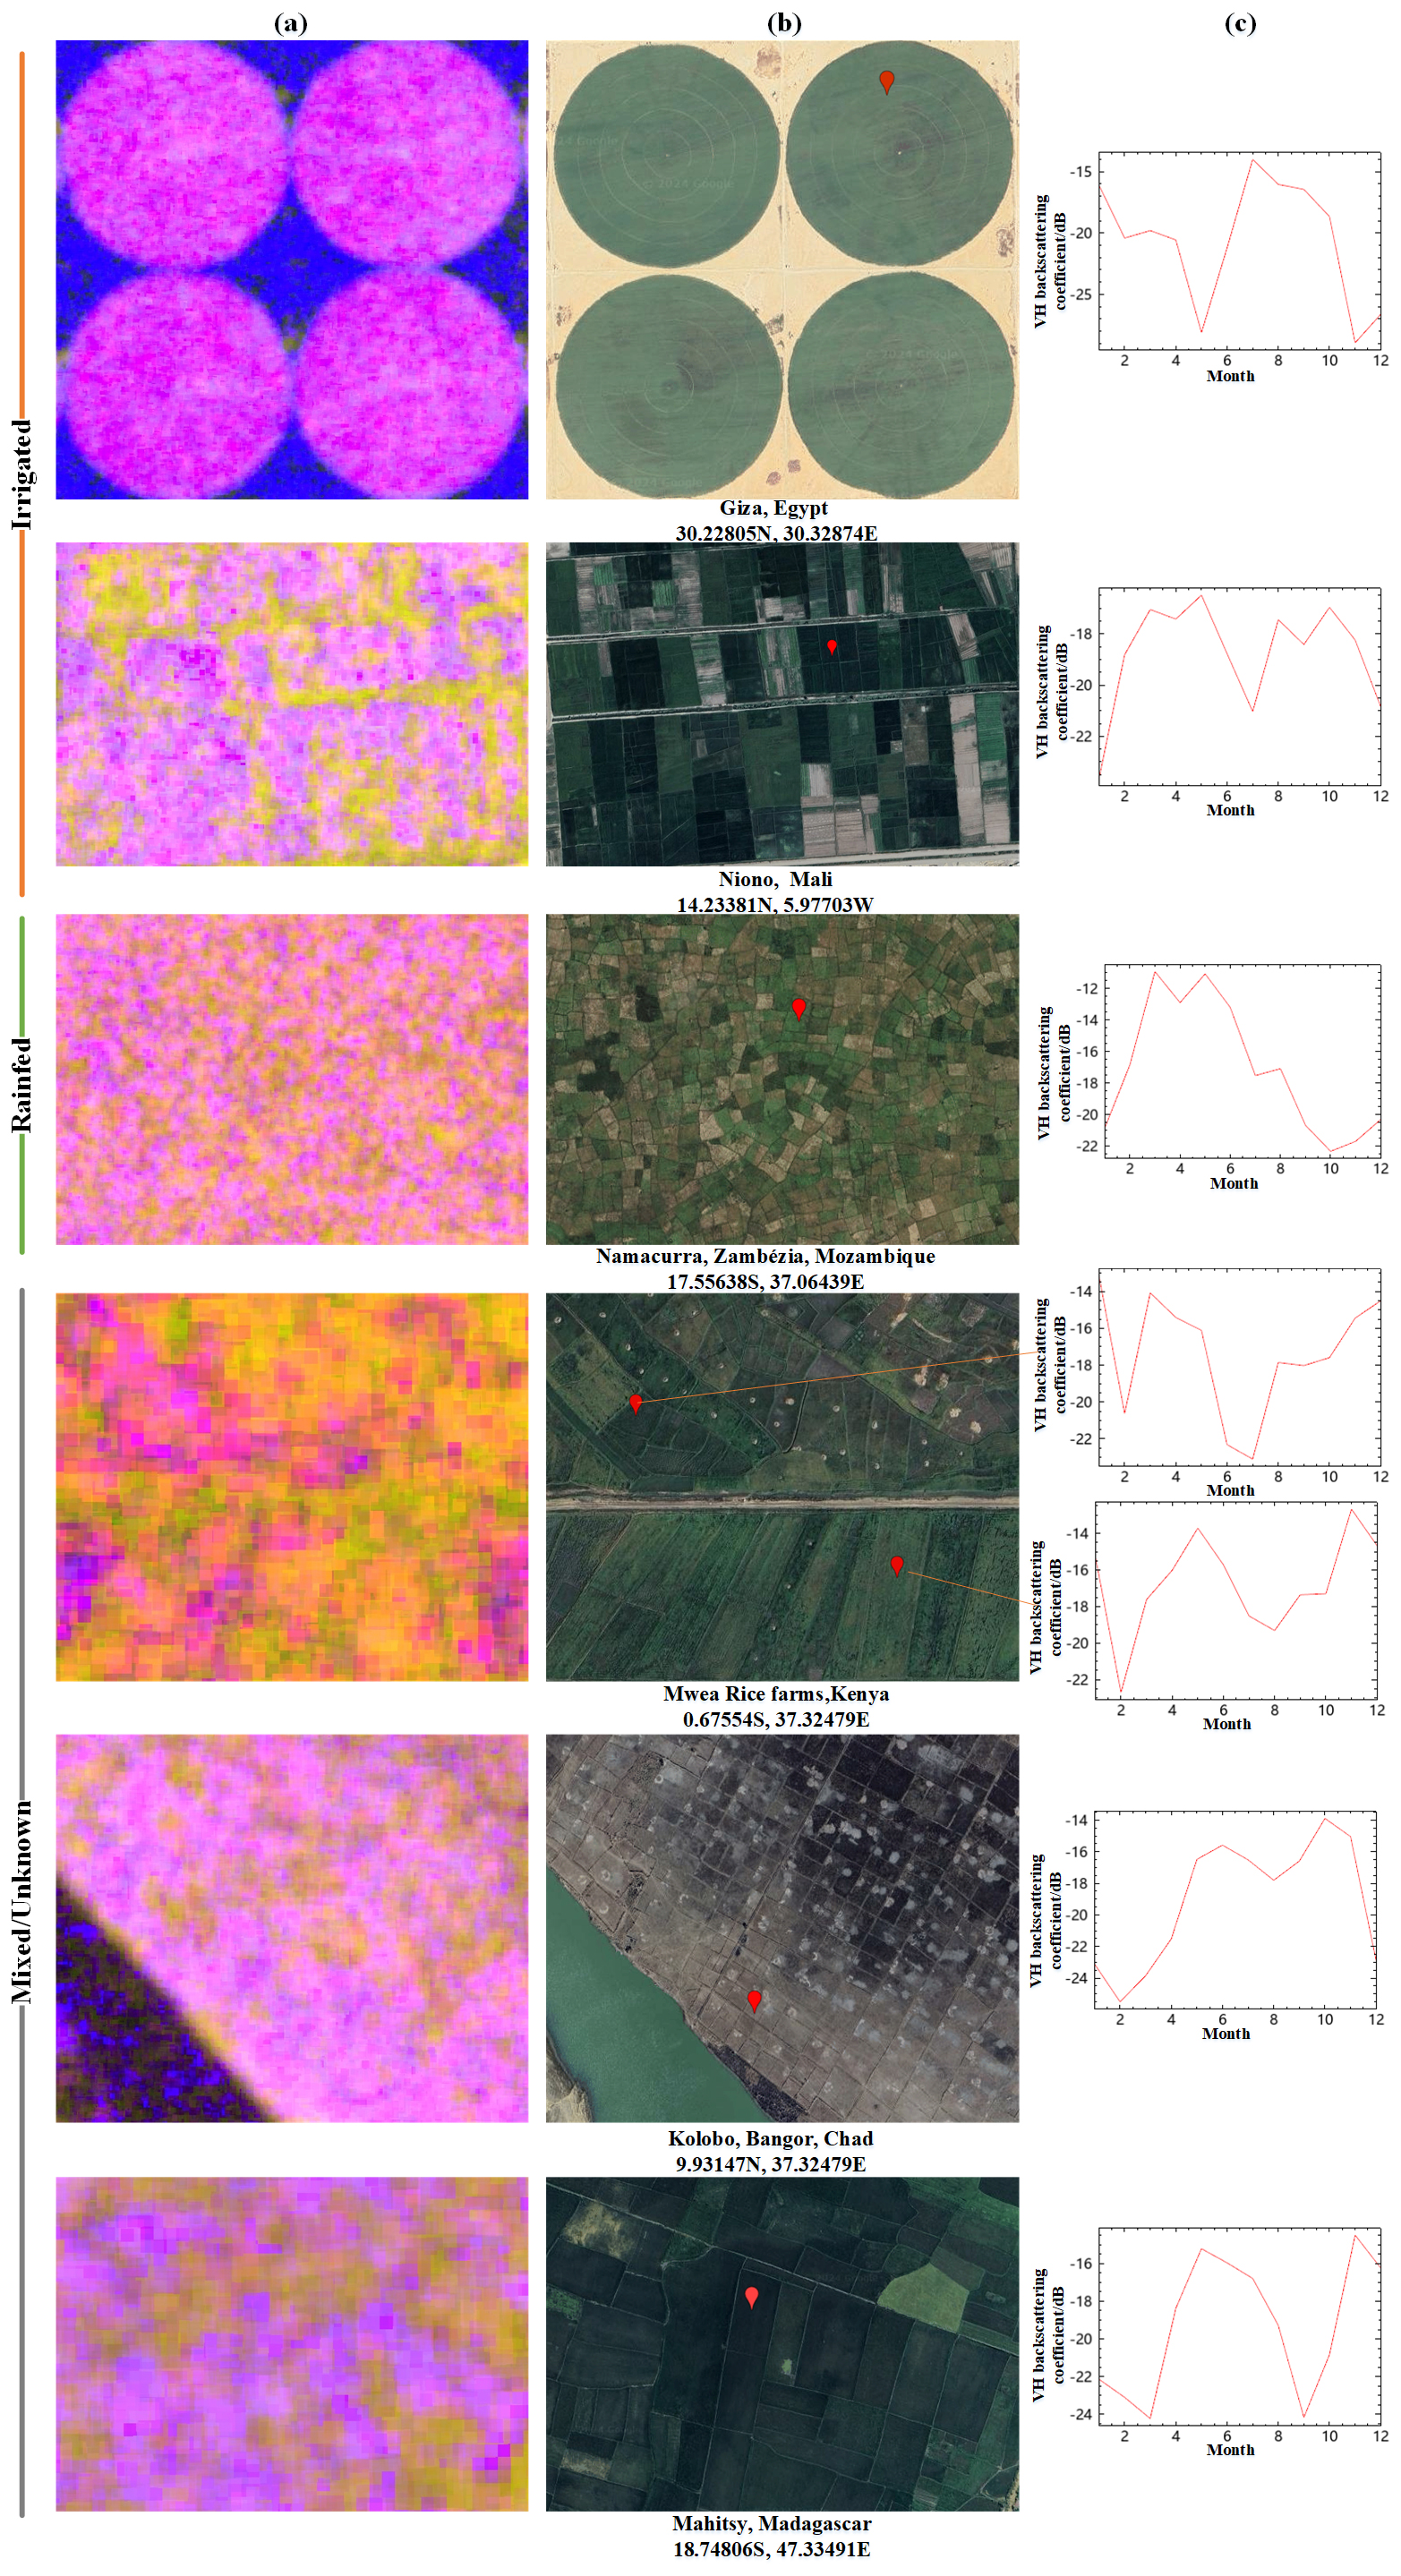
Figure 6Examples of rice fields. (a) Pseudo-color composite image (R: VHmax; G: VHmin; B: VHvariance). (b) Optical image (from © Google Earth). (c) VH backscattering coefficient time series curve of the point marked in (b).
3.1.2 Rice sample set construction
During the experiment, it was found that wetlands and other land cover types prone to misclassification with rice also appear to be purple in the pseudo-color composite image described in Sect. 3.1.1. Therefore, multiple auxiliary datasets were used for visual interpretation to construct the rice sample set. Specifically, the process begins with positioning potential rice-planting areas using the fast-coarse-positioning feature. The intersection of the high-value rice grid map from CROPGRIDS and the cropland distribution map is then utilized to further narrow-down these areas. Finally, rice plots are selected and confirmed as rice samples through visual interpretation of optical imagery. The cropland distribution maps used the union of the cropland classes from WorldCover for the years 2020 and 2021. Additionally, in some countries, existing studies or reports, as listed in Table 3, were consulted.
Table 3Reference for rice sample set construction in some countries.
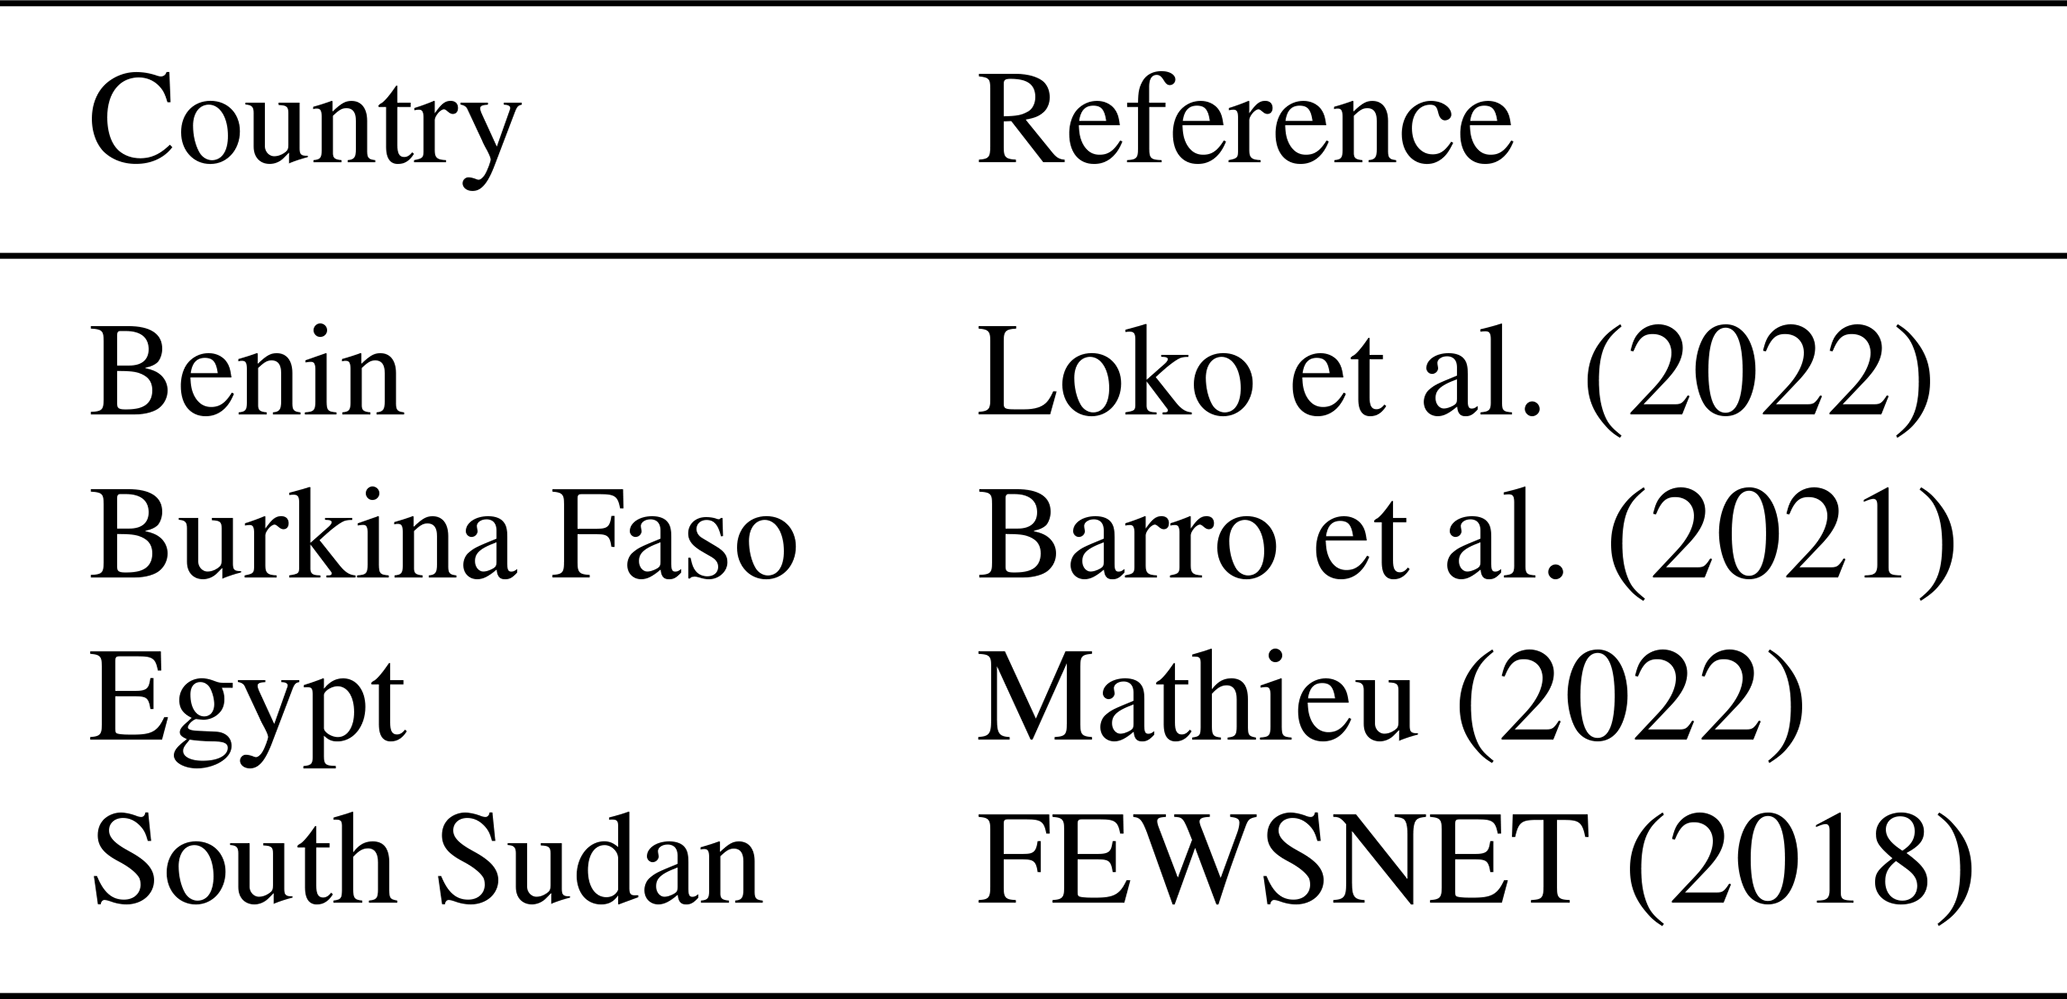
Generally, the rice plots have these features in optical images: (1) circular irrigation fields or fields with internal blocks or strips to retain water, especially near water such as rivers or lakes and (2) very uniform greenness and texture during the growing season. If the features are not clear enough, the time series curve of VH data would be examined for obvious fluctuations since the backscatter of VH polarized data of rice has a clear drop during the flooding period. Figure 6 presents some examples of rice fields and the VH backscattering coefficient time series of the red-marked point. The field in Egypt is an example of a typical circular irrigated rice paddy during the growing season, which can be located by referring to the literature (Mathieu, 2022). The fields in Mali are in the irrigated region around Niono (Diuk-Wasser et al., 2007). The fields in Mozambique are an example of rainfed rice paddies during the growing season, which can be located by referring to the literature (Kajisa and Vu, 2023). The fields in Kenya are in the concentrated rice-planting area in Mwea and can be located by referring to Menge et al. (2024); these fields are examples of rice fields with internal blocks or strips. The fields in Chad are part of the China-aided Bongor Rice Demonstration Base in Chad, which is an example of rice fields in the non-growing season (Liang et al., 2017). The fields in Madagascar are in Mahitsy, where rice cultivation has a long history (Voahanyinirina and Elie, 2007). The corresponding pseudo-color composite feature map in Fig.6 also proves the effectiveness of the fast-coarse-positioning method.
In the experiment, 50–300 rice plots were selected for each country, and 2000 rice points were randomly sampled from these plots as positive samples for the classifier input in each country's classification experiment.
3.1.3 Negative sample set
In the classification experiments conducted for each country, dozens of plots for each land cover type (non-rice cropland, built-up areas, waterbodies, wetlands, forests, grasslands, etc.) were uniformly selected by visual interpretation based on optical imagery and the WorldCover product. For each land cover type, 300 sample points were randomly selected within these plots as negative samples for the classifier input. Examples of positive and negative sample regions are provided in Fig. 7, including optical images, WorldCover data from ESA and the pseudo-color map of the proposed fast-coarse-positioning feature.
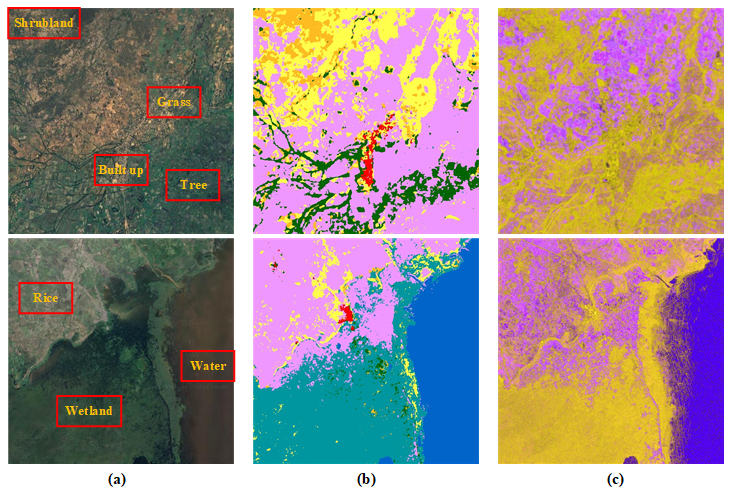
Figure 7Example of positive and negative sample regions. (a) Optical image (from © Google Earth). (b) WorldCover2021 from ESA. (c) The pseudo-color feature map (R: VHmax, G: VHmin, B: VHvariance).
3.1.4 Validation dataset
The validation dataset was constructed similarly to the training sample set. For each country, the validation dataset includes 1000 rice sample points. Non-rice sample points were uniformly selected based on the number of land cover categories present in the WorldCover product for that country, with 100 sample points chosen for each category (with the cropland category containing only non-rice cropland samples).
3.2 Object-oriented supervised classification guided by feature importance
3.2.1 SNIC object-oriented segmentation
Monthly mean time series of NDWI and NDVI data from 2023 were used as inputs to perform object-based segmentation using the Simple Non-Iterative Clustering (SNIC) algorithm (Achanta and Susstrunk, 2017). This approach was adopted to reduce the fragmentation of rice paddy extraction results and to enhance the clarity of rice paddy boundaries. The SNIC algorithm is a super-pixel segmentation method based on the principles of K-means clustering. It initializes seed points on a regular grid as initial cluster centers and assigns each pixel to the nearest cluster based on its distance from the cluster center in both color and spatial dimensions. Since the SNIC algorithm is non-iterative, it requires less computation time and memory while ensuring connectivity, resulting in good segmentation performance. It is widely used in remote sensing applications (Tassi and Vizzari, 2020; Wang et al., 2024).
In the experiment, the SNIC algorithm was implemented on the GEE platform with the following parameter settings: seed distance (size) of 10, segmentation compactness of 0.5, connectivity of 8, and neighborhood size of 100. The effect of segmentation is demonstrated in Fig. 8.
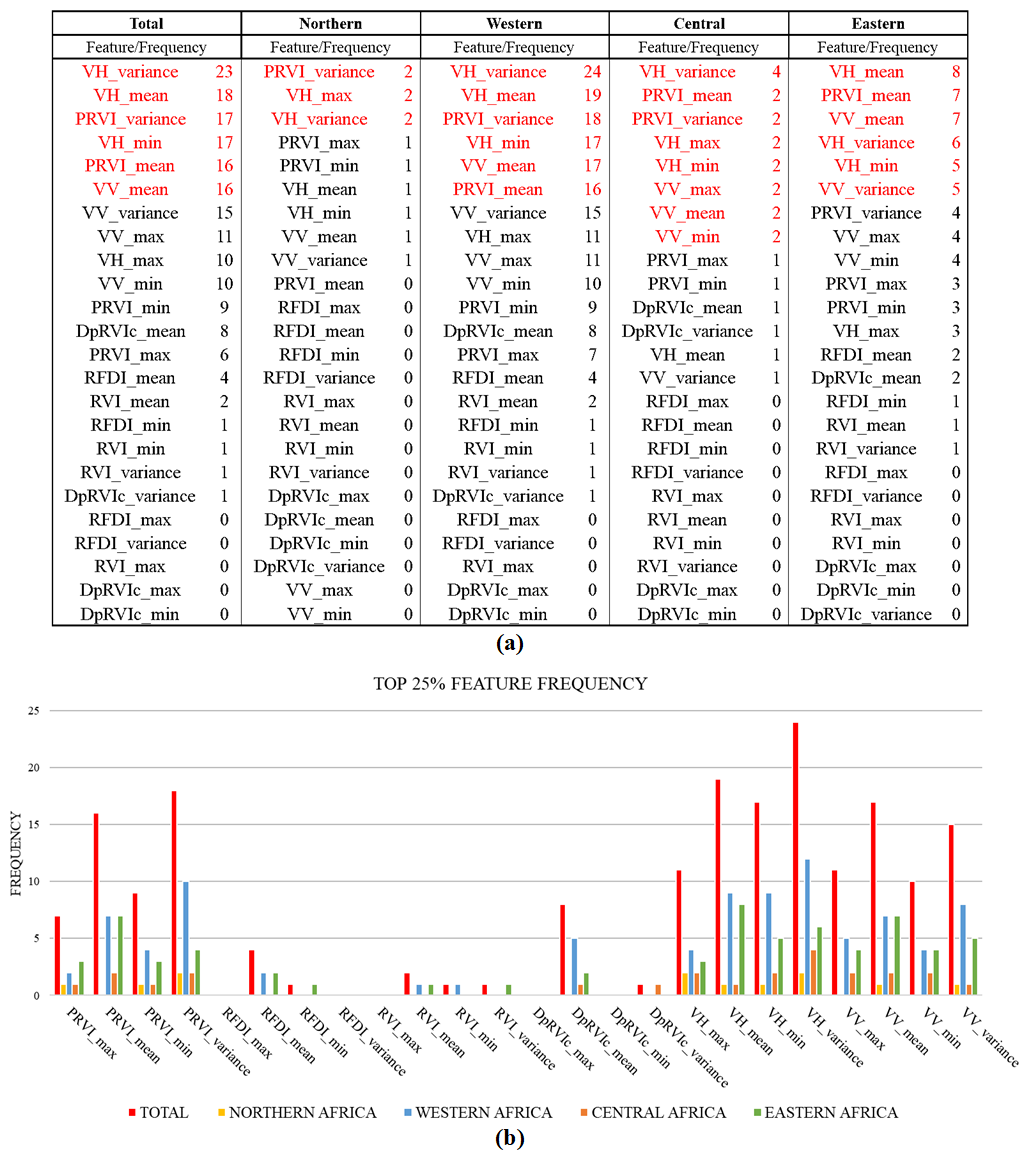
Figure 8Feature importance. (a) Regional statistics on the frequency of features appearing in the top 25 % of importance rankings (descending order). (b) Regional statistics on the frequency of features appearing in the top 25 % of importance rankings (sorted by feature).
3.2.2 Feature-importance-guided supervised classification
To address the limitations of optical imagery caused by cloud cover in large-scale mapping, SAR features were utilized after object-based segmentation based on NDVI and NDWI time series data. The mean values of the SAR features within the segmented super-pixels were used as inputs for supervised classification to achieve more accurate large-scale, high-resolution rice-mapping results. This part of the study employed the random forest algorithm available on the GEE platform. Supervised classification experiments were first conducted for each country, with all SAR data features used as inputs to determine feature importance rankings. The top-ranked features for each sub-region were then selected, and a second round of supervised classification was performed using these selected features to obtain the final mapping results.
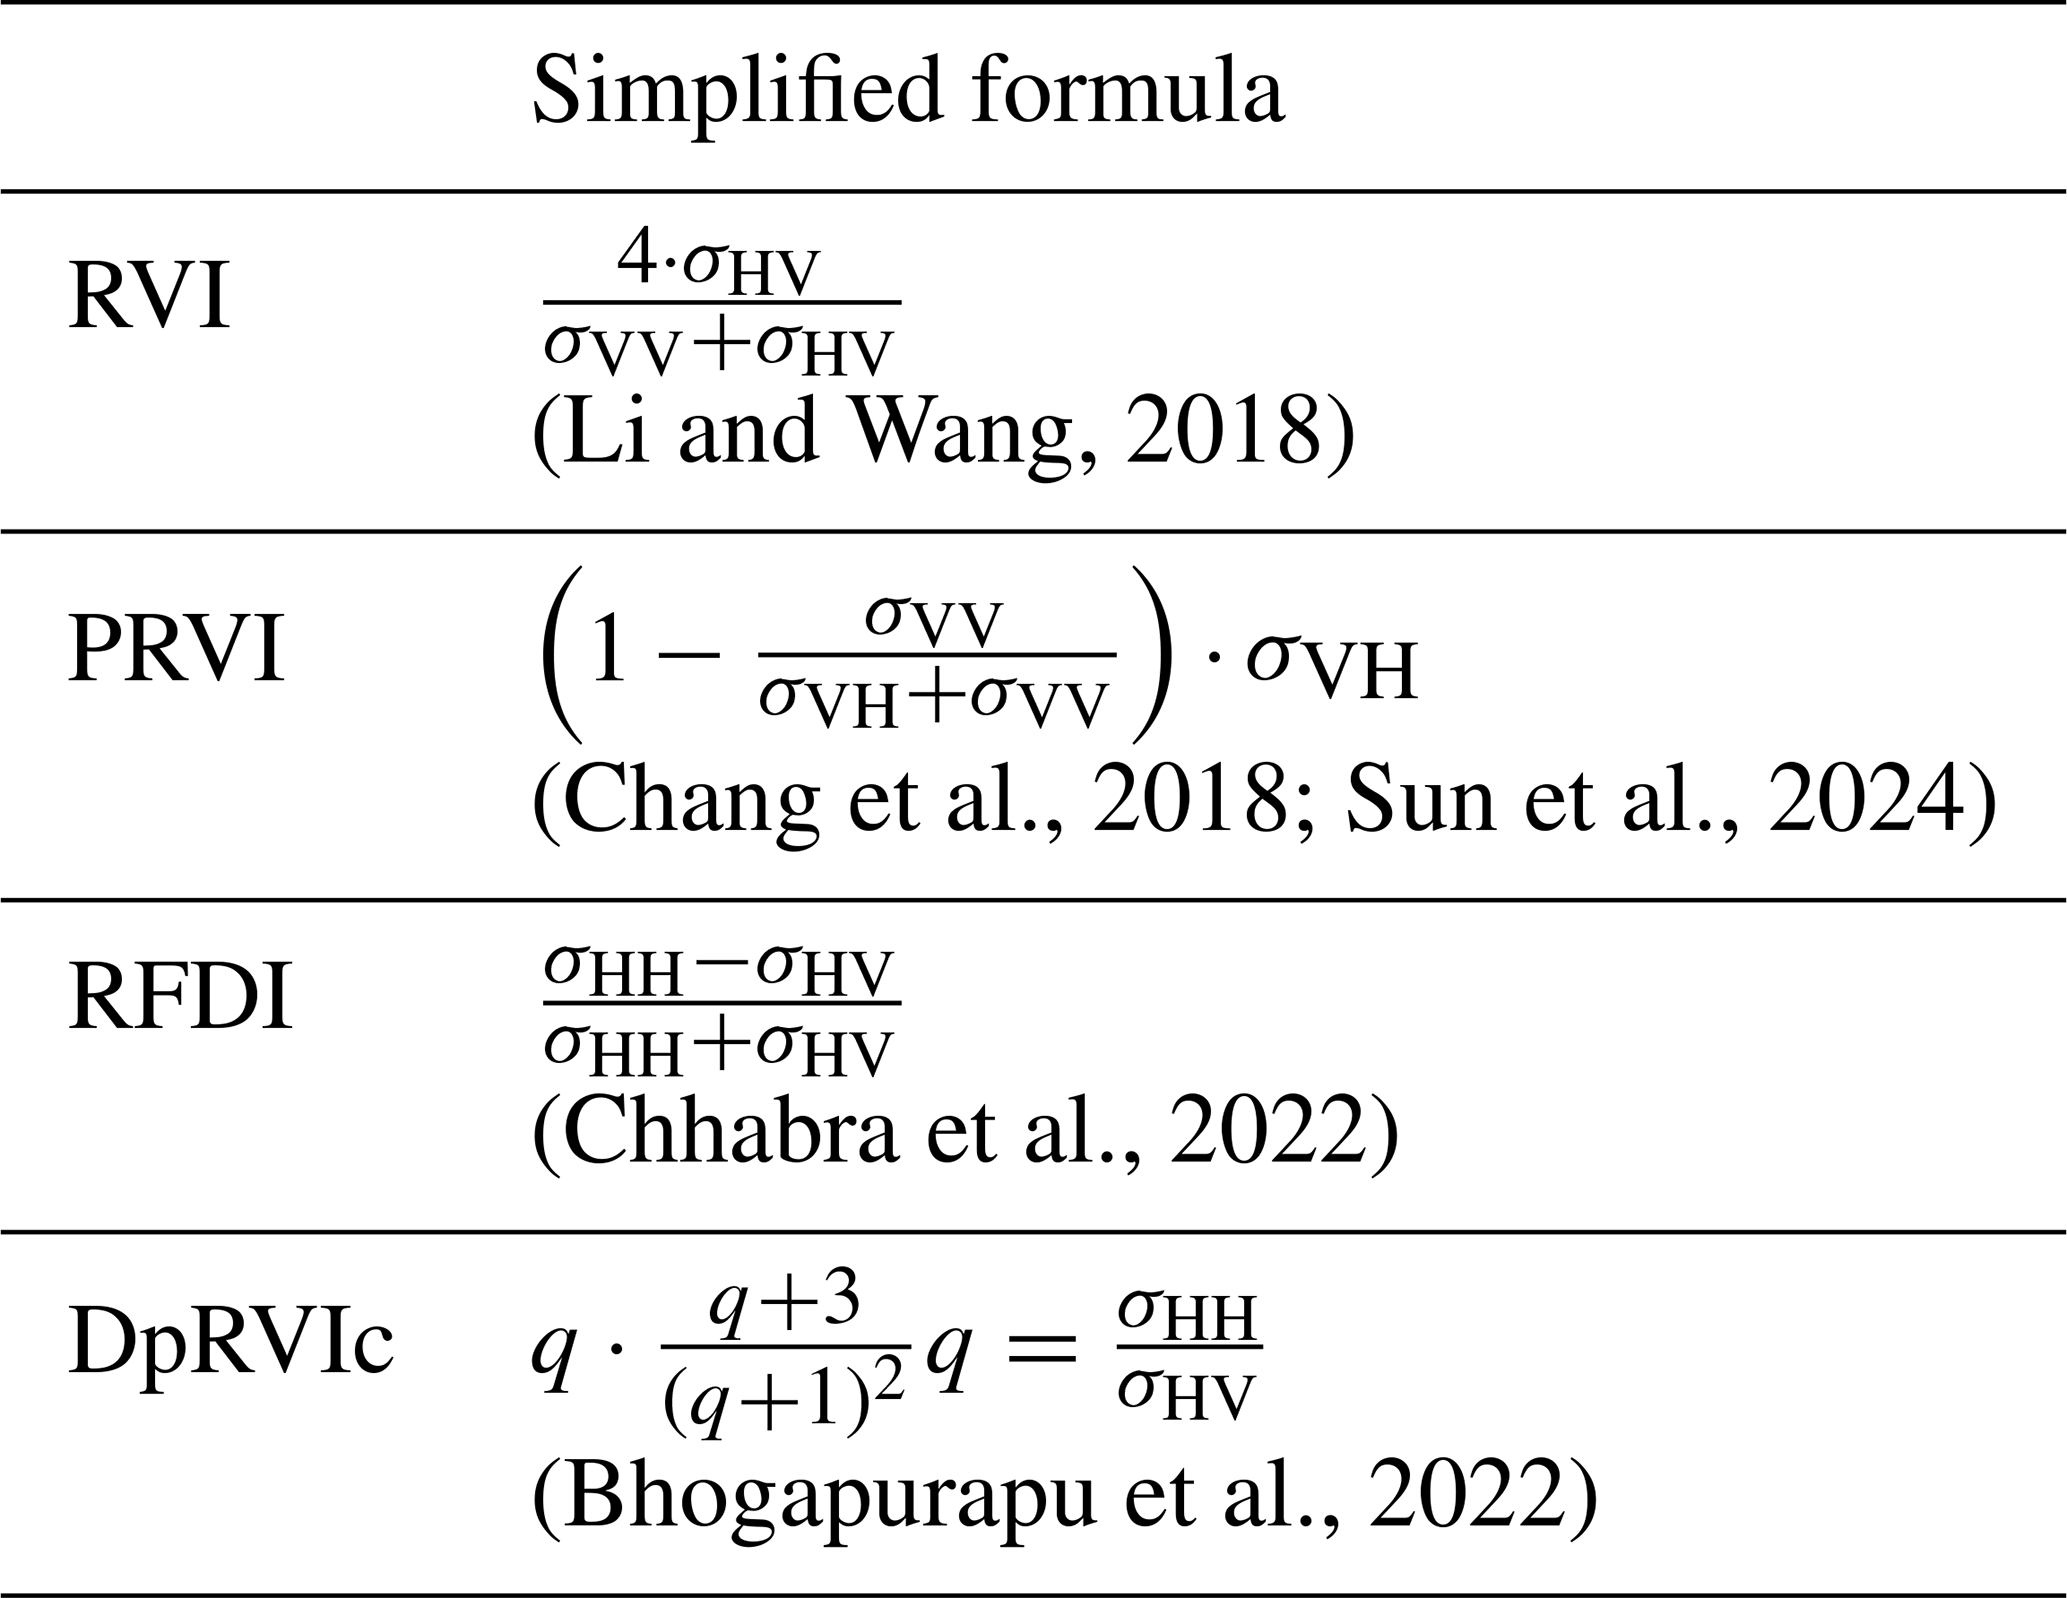
The SAR features used in the experiment included VH; VV; and four commonly used radar vegetation indices, namely RVI (radar vegetation index), PRVI (polarimetric radar vegetation index), RFDI (radar forest degradation index), and DpRVIc (dual-pol radar vegetation index for GRD (ground range detected) data). The statistical features (max, mean, min, variance) for these indices in 2023 were utilized, as defined in Table 4.
3.3 Accuracy of validation set
The validation section was first performed on the validation set, calculating the user accuracy (UA), producer accuracy (PA), F1 score, and overall classification accuracy (OA) for rice and non-rice categories:
where TP is true positive, FP is false positive, TN is true negative, and FN is false negative.
In this section, the results and accuracy will be presented with regard to five aspects: feature-screening results, mapping and analysis of rice spatial distributions, comparison of rice area statistical results, validation set accuracy, and comparison of optical images.
4.1 Feature importance
Due to the low coverage of SAR images in Angola and Sudan, these two countries only use optical images as classification input features. In the experiments of the remaining 32 countries, a total of 24 statistical features (max, mean, min, and variance) of VH, VV, RVI, PRVI, RFDI, and DpRVIc were input into random forest training to obtain feature-importance-ranking results. The frequency of each feature in the top 25 % of the feature importance ranking for each country was calculated according to the UN (United Nations)-divided African sub-region, as shown in Fig. 8a. The features marked red are the selected features used in the classification experiments for final mapping.
In Fig. 8a, the features highlighted in red represent those with the highest frequency within the top 25 % of importance rankings for each region (including features with tied frequencies). It can be observed that the top 25 % of features vary significantly across sub-regions, with the only common feature being VH_variance. Therefore, in the random forest supervised classification, each sub-region used the features ranked in the top 25 % in terms of frequency for that specific sub-region.
Figure 9 illustrates an example of selected features, focusing on an area southwest of Lake Alaotra in Madagascar. The classification features used in the supervised classification for this region include six features specific to East Africa: VH_mean, PRVI_mean, VV_mean, VH_variance, VH_min, and VV_variance. These features were combined into two groups for pseudo-color composites, where clear distinctions between rice fields and other land cover types, including wetlands and grasslands that are prone to misclassification, can be observed. Zoomed-in images are provided in the third column. The contrast between rice and non-rice fields, the field ridges, and the consistency with optical images can be observed clearly. This demonstrates that the selected features effectively differentiate rice from other land cover types, enabling accurate spatial mapping of rice distributions. Additionally, the mean values calculated from object-based segmentation of optical imagery improved the representation of SAR image noise and fragmented plots while preserving clear boundaries.
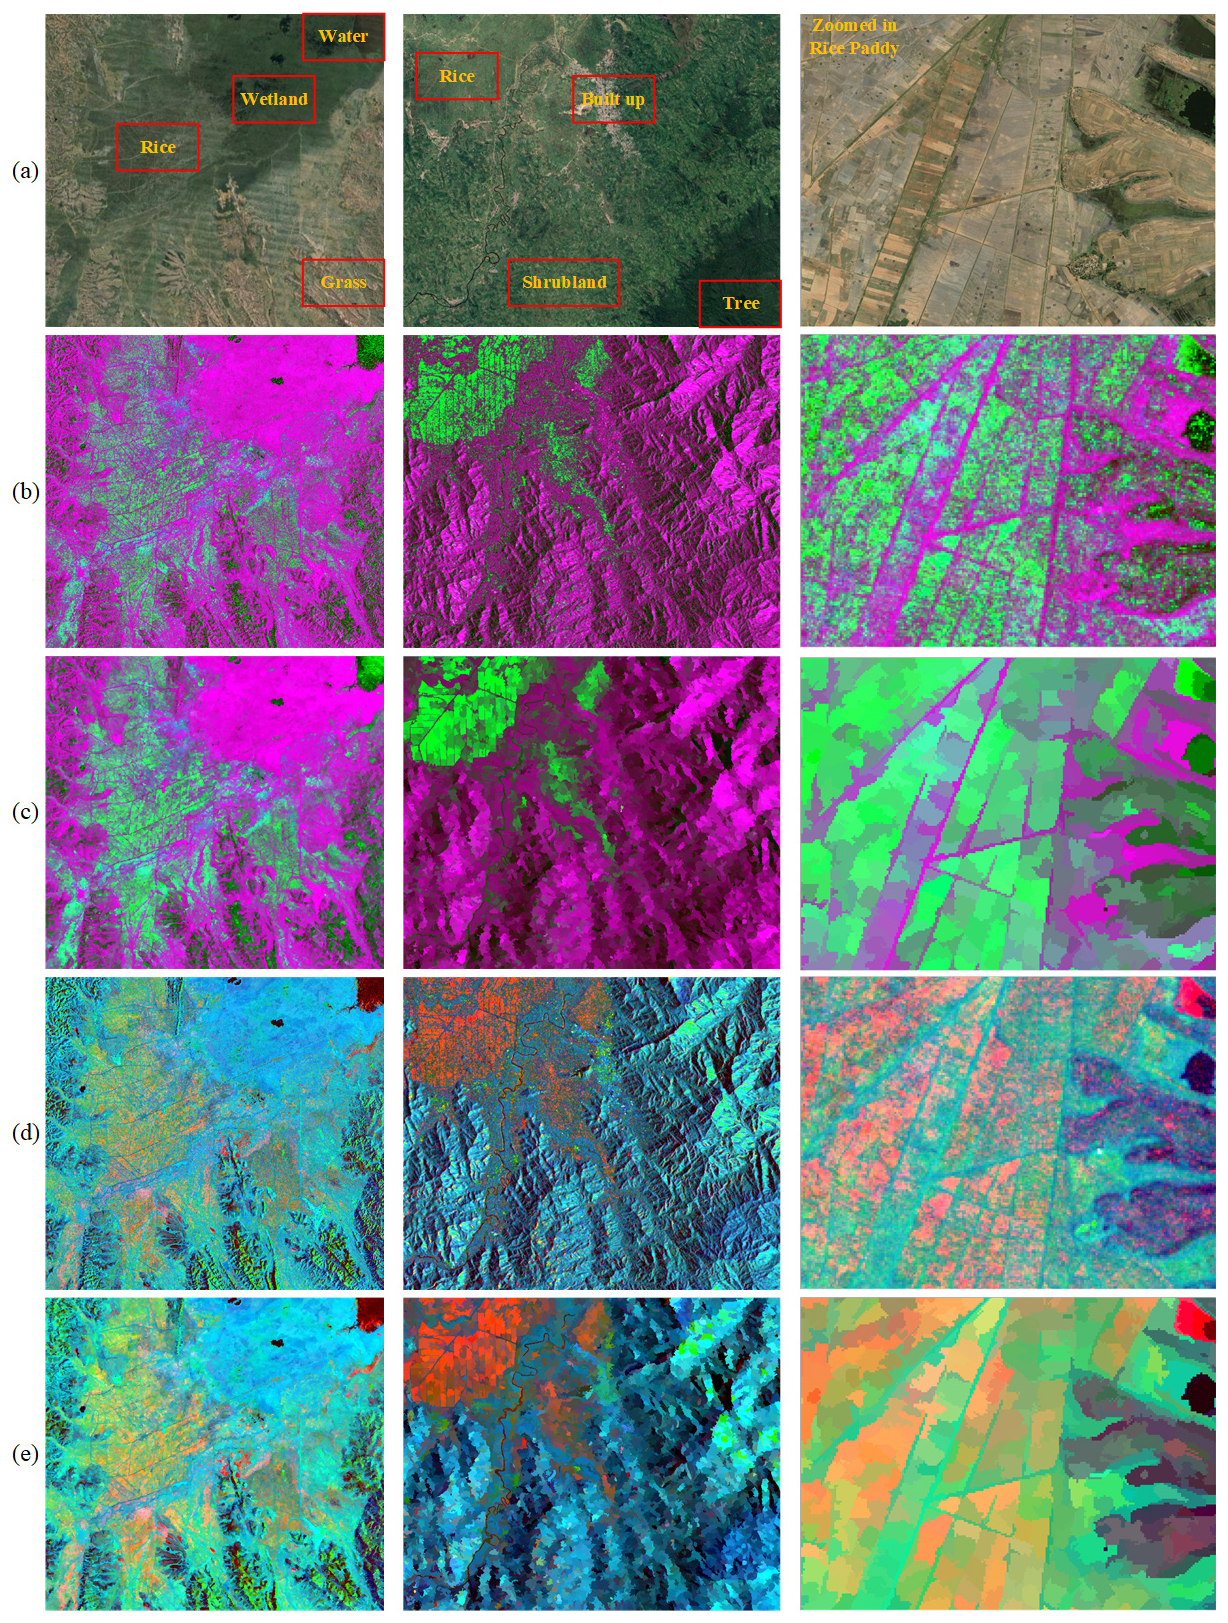
Figure 9Example of pseudo-color composites using selected SAR time series features: (a) optical image (from © Google Earth), (b) pseudo-color composite 1 (R: VH_min, G: VH_variance, B: VH_mean), (c) mean values of pseudo-color composite 1 overlaid on the object-based segmentation result from NDVI time series, (d) pseudo-color composite 2 (R: VV_variance, G: VV_mean, B: PRVI_mean, and (e) mean values of pseudo-color composite 2 overlaid on the object-based segmentation result from NDVI time series.
4.2 Results of rice spatial distribution map
Figure 10 shows the final 20 m resolution spatial distribution map of rice across Africa. The green areas represent rice. The map on the right displays the gridded result at a 0.5° resolution, with the value in the lower-left corner of each grid indicating the rice area, measured in 100 ha per grid.
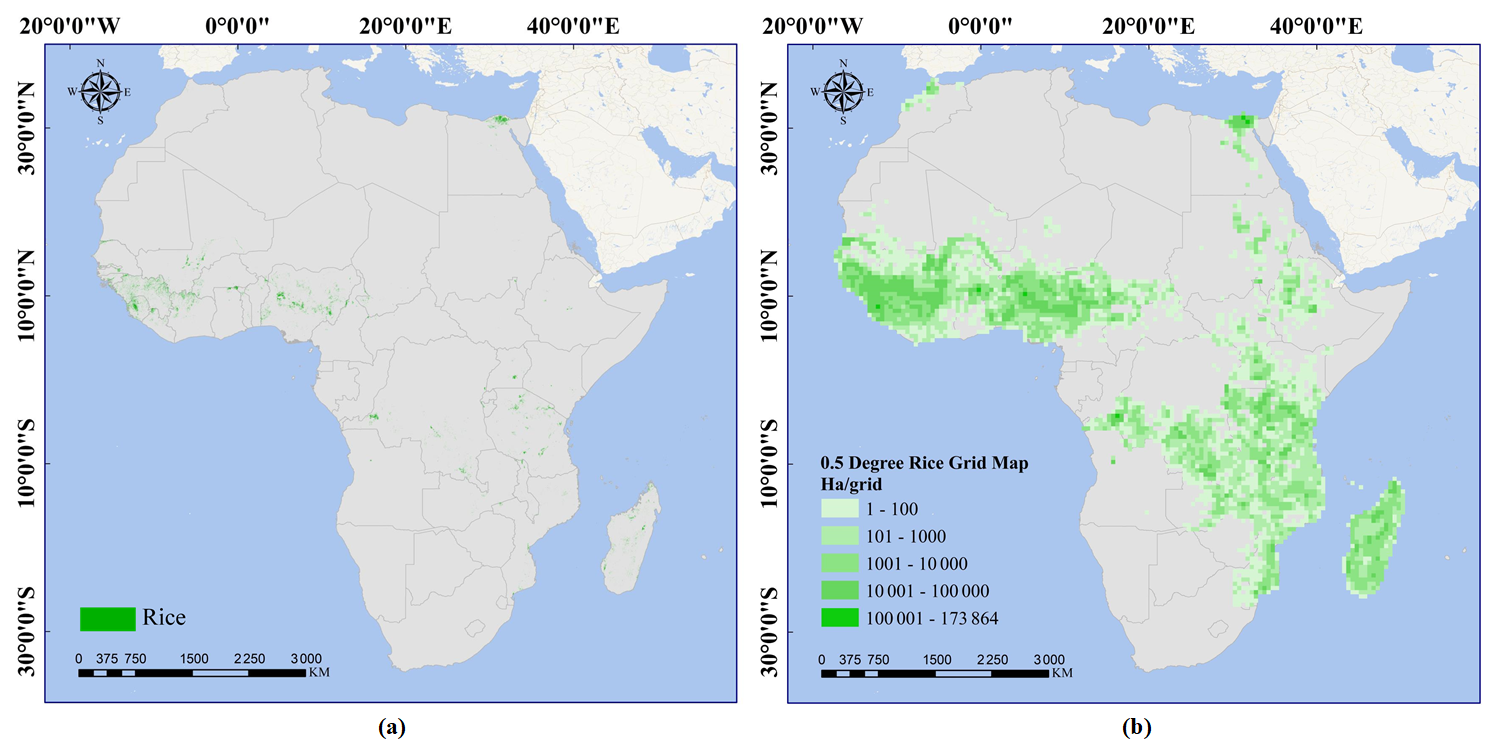
Figure 10Rice-mapping result in Africa: (a) 20 m spatial distribution map and (b) corresponding 0.5° grid map.
Table 5 presents the country-level statistics of rice paddy area in Africa based on the 20 m spatial distribution map for 2023.
Table 5Country-level statistics of rice paddy area in Africa based on the 20 m spatial distribution map for 2023.
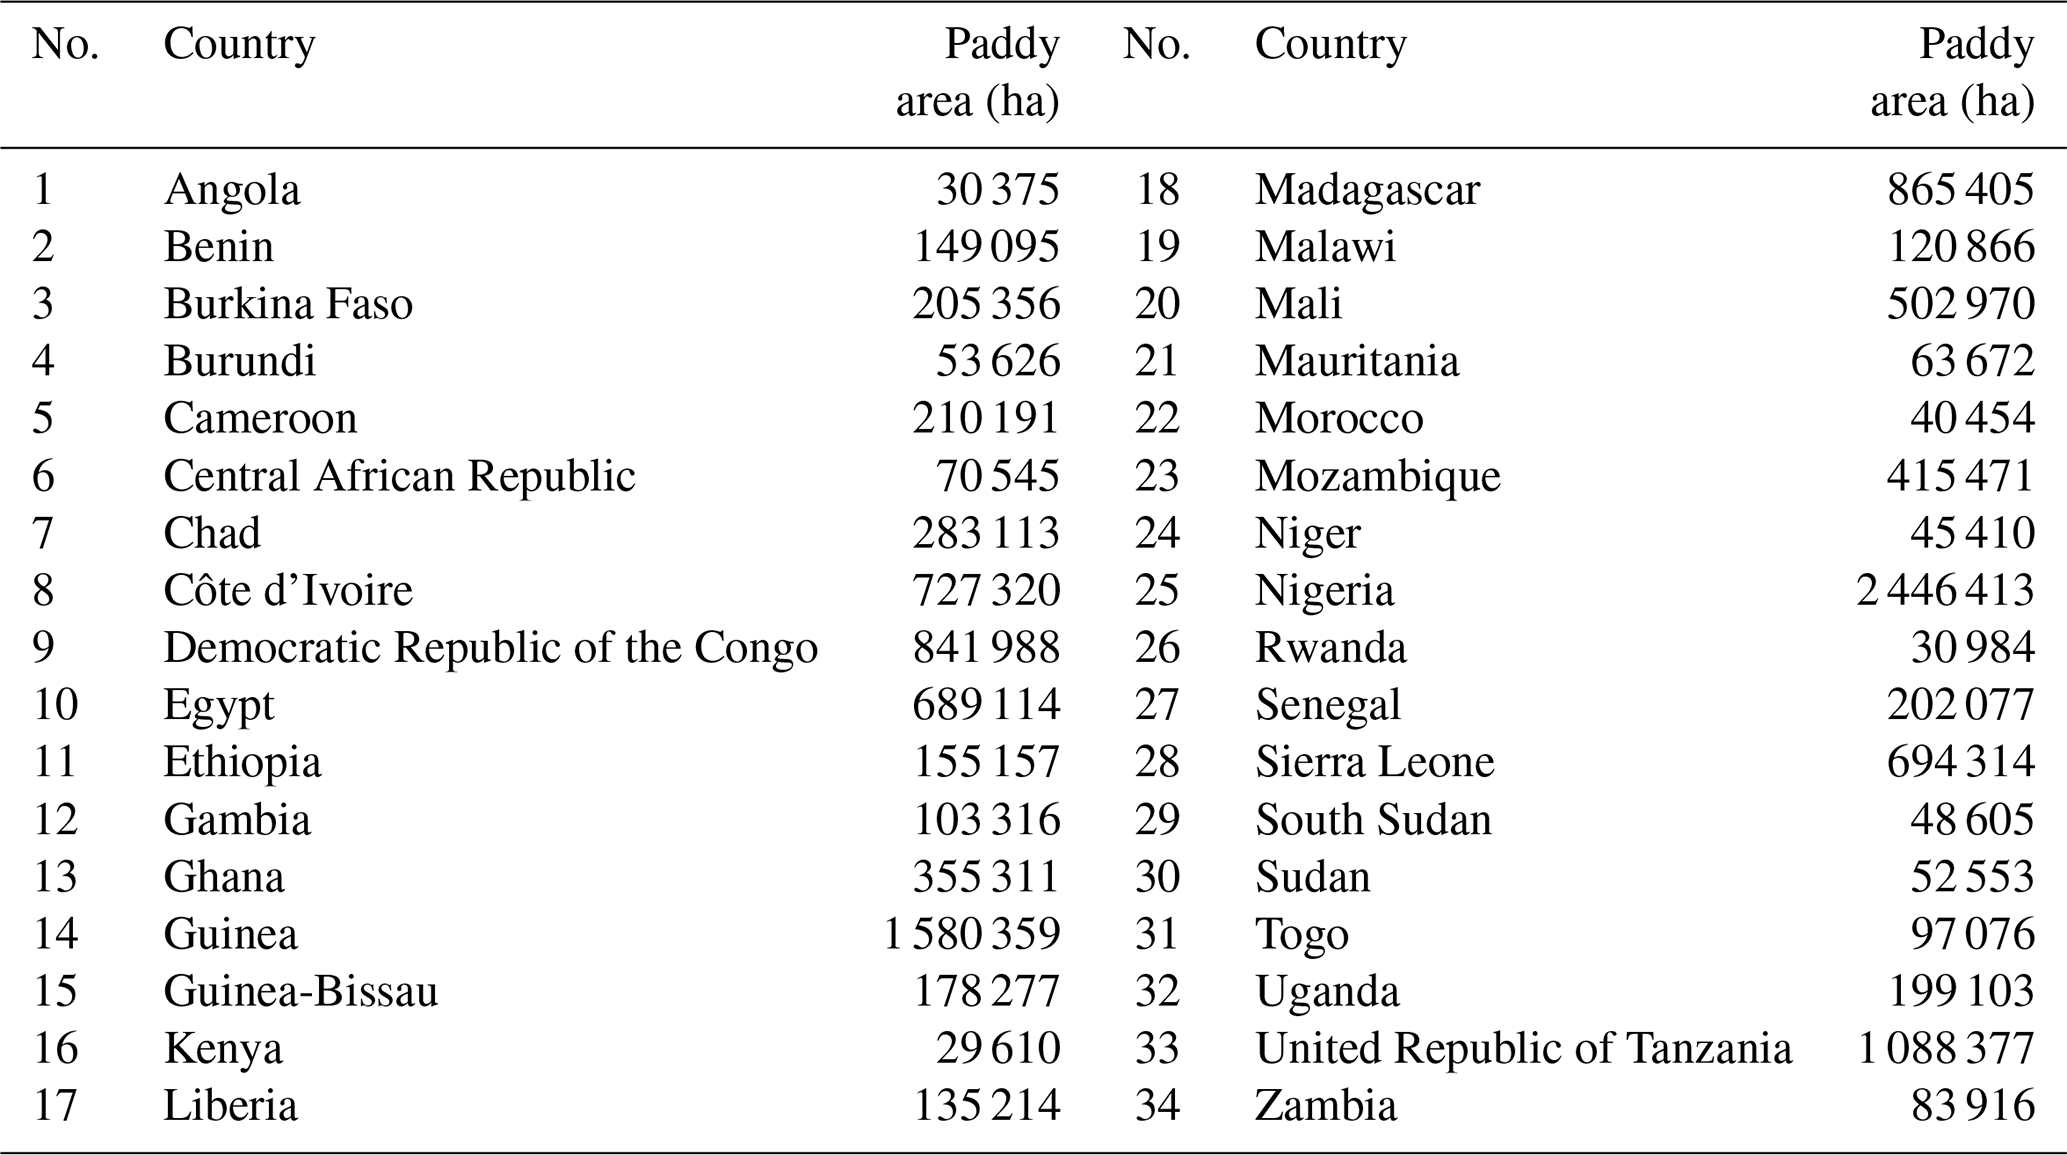
The total rice paddy area across Africa in 2023 is approximately 12 795 631 ha. Among the countries, three have rice areas exceeding 1×10⁶ ha: Nigeria, Guinea, and Tanzania. Six countries fall within the range of 500 000 to 1×10⁶ ha: Madagascar, the Democratic Republic of Congo (DRC), Côte d'Ivoire, Sierra Leone, Egypt, and Mali. A total of 13 countries have rice areas between 100 000 and 500 000 ha: Mozambique, Ghana, Chad, Cameroon, Burkina Faso, Senegal, Uganda, Guinea-Bissau, Ethiopia, Benin, Liberia, Malawi, and Gambia. Lastly, 12 countries have rice areas between 50 000 and 100 000 ha: Togo, Zambia, Central African Republic, Mauritania, Burundi, Sudan, South Sudan, Niger, Morocco, Kenya, Rwanda, and Angola. The proportion of rice area by country is illustrated in Fig. 11a.
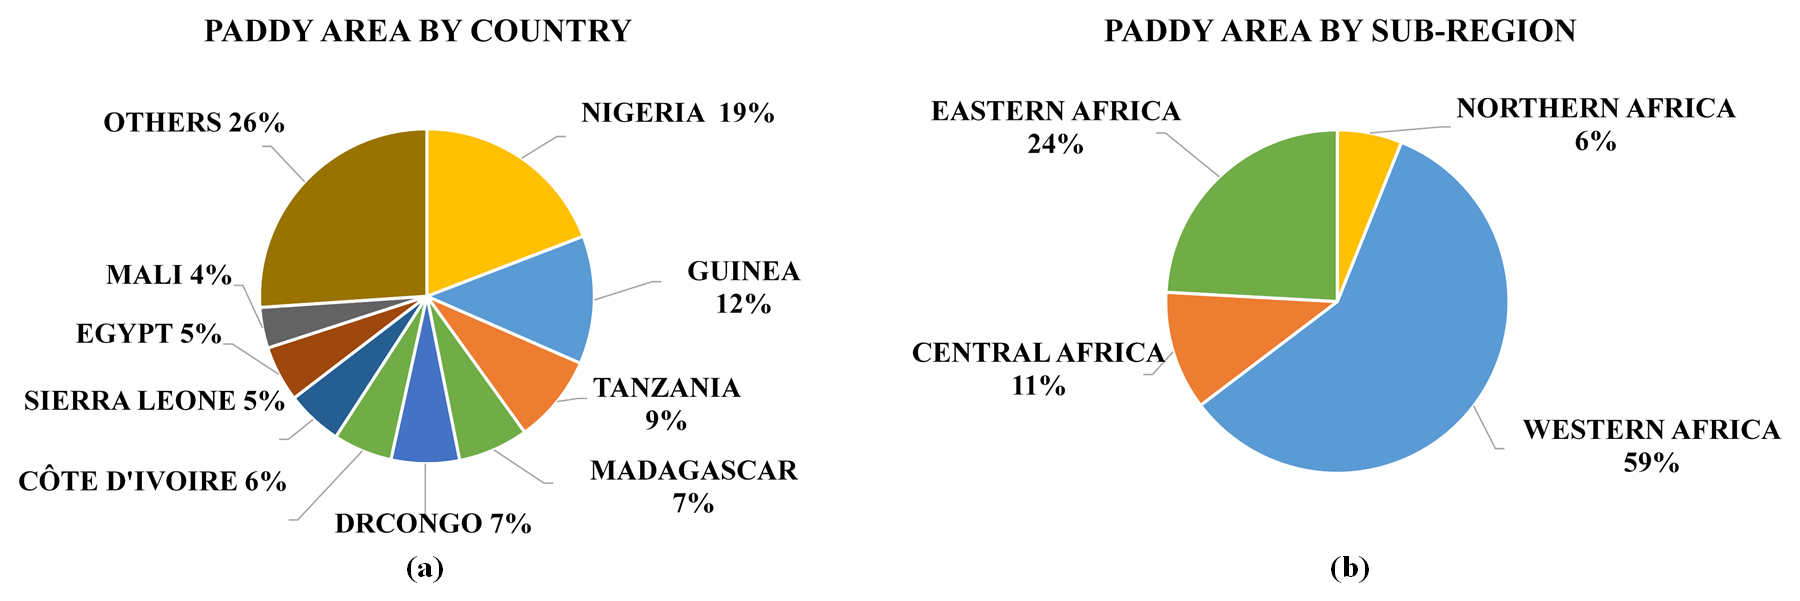
Figure 11The proportions of rice paddy area in Africa (a) by country (others: aggregate of countries with areas less than 500 000 ha) and (b) by sub-region.
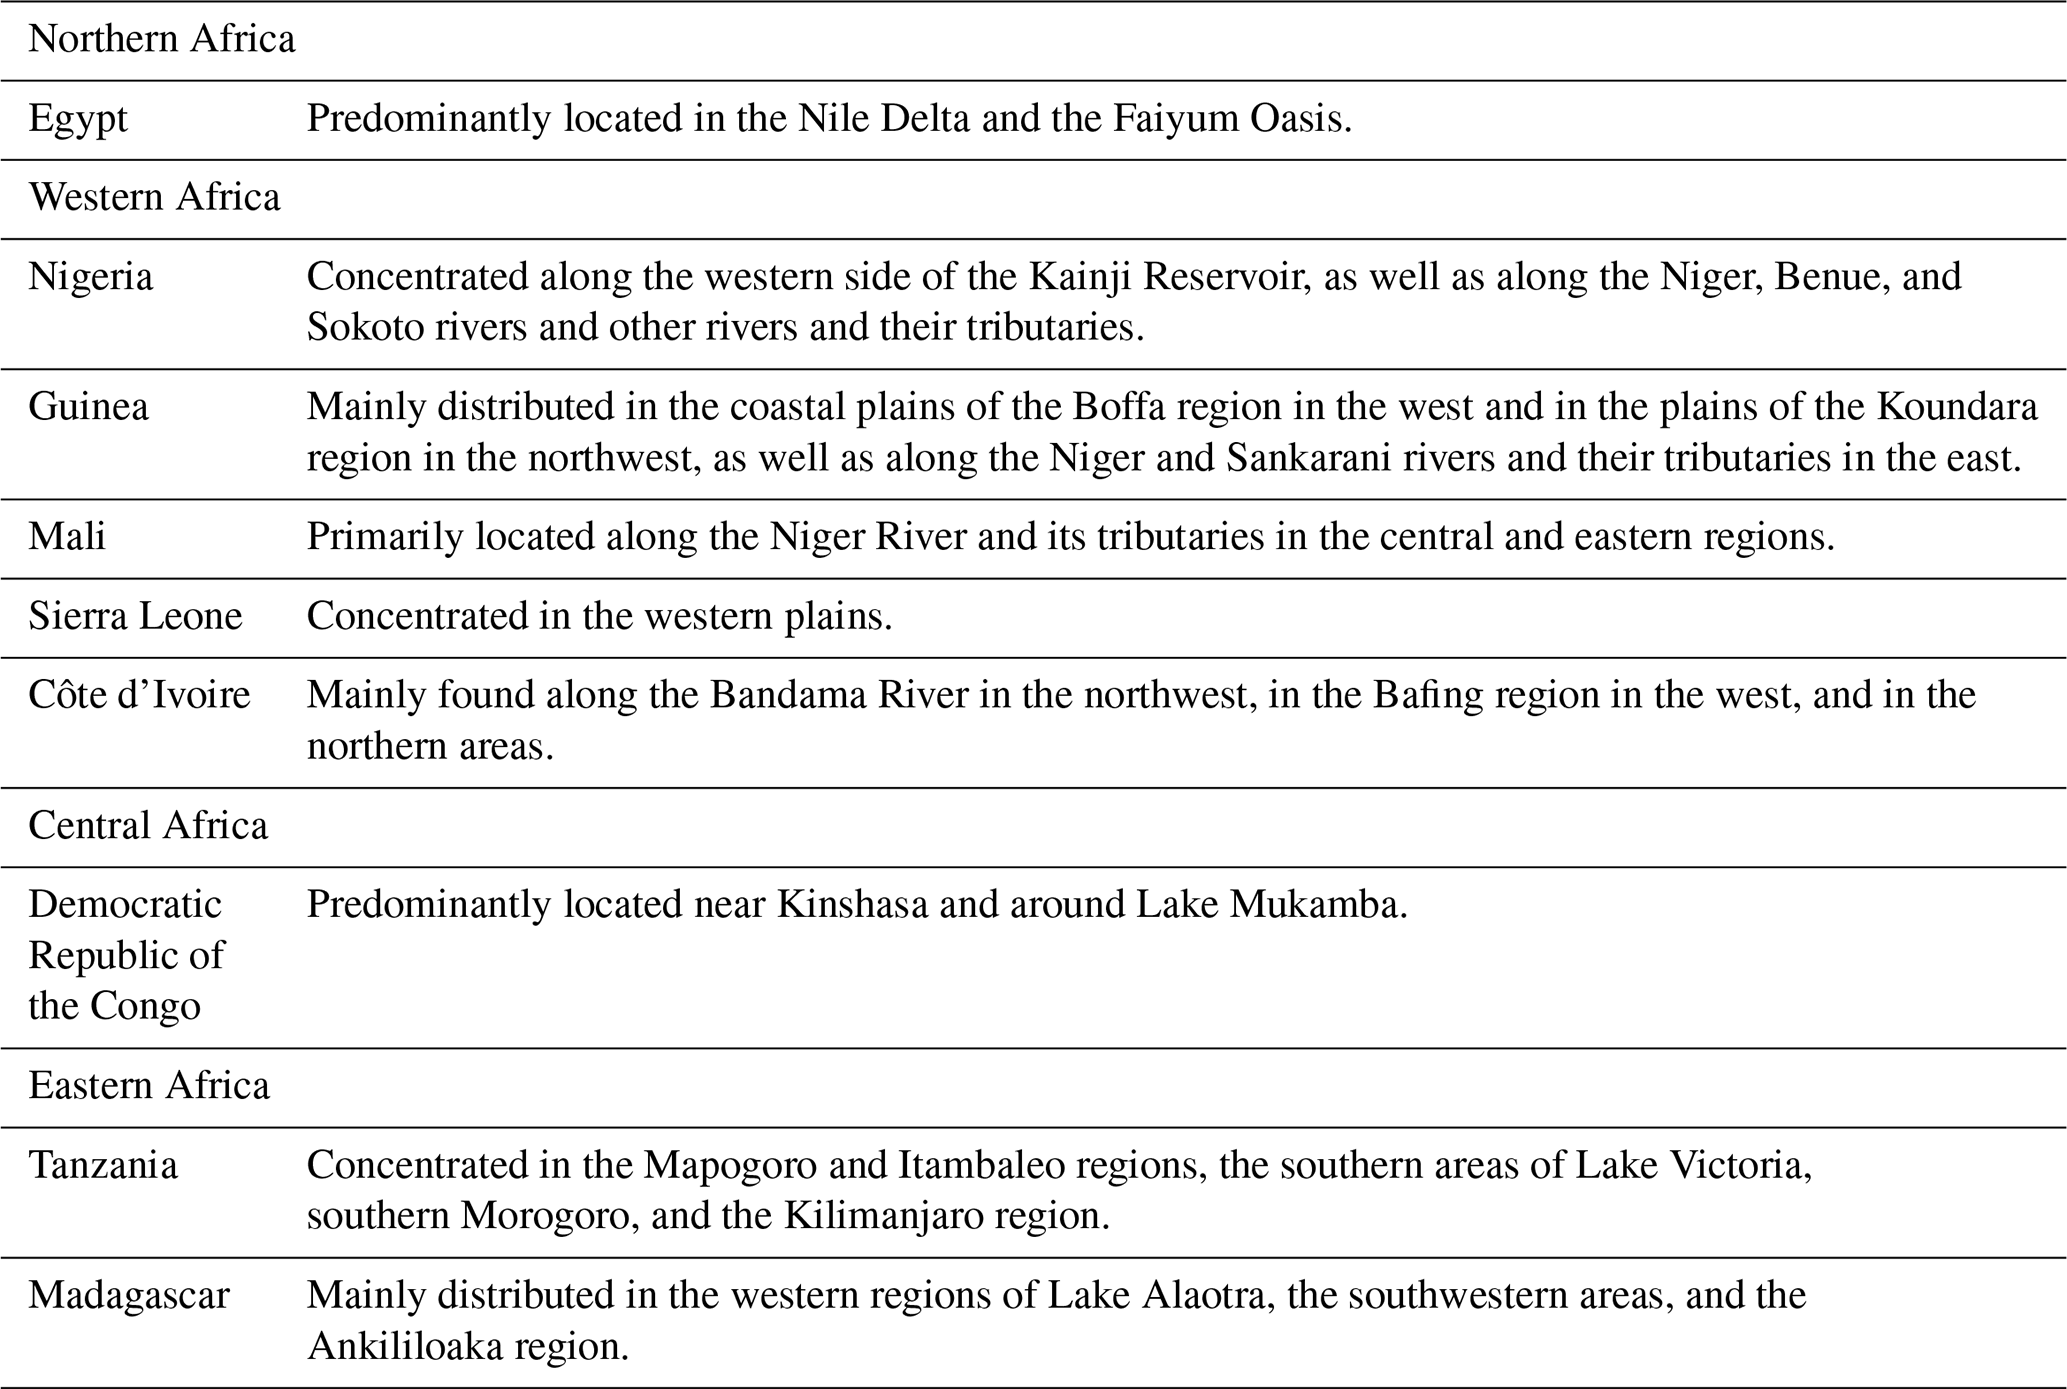
Figure 11b shows the distribution of rice area by sub-region in Africa. It can be seen that rice planting is primarily concentrated in western Africa, followed by eastern Africa and Central Africa, with the least in northern Africa. The specific distribution of major production areas is detailed in Table 6.
Table 6Distribution of major rice-producing regions in Africa.
4.3 Comparison of rice area and statistical data
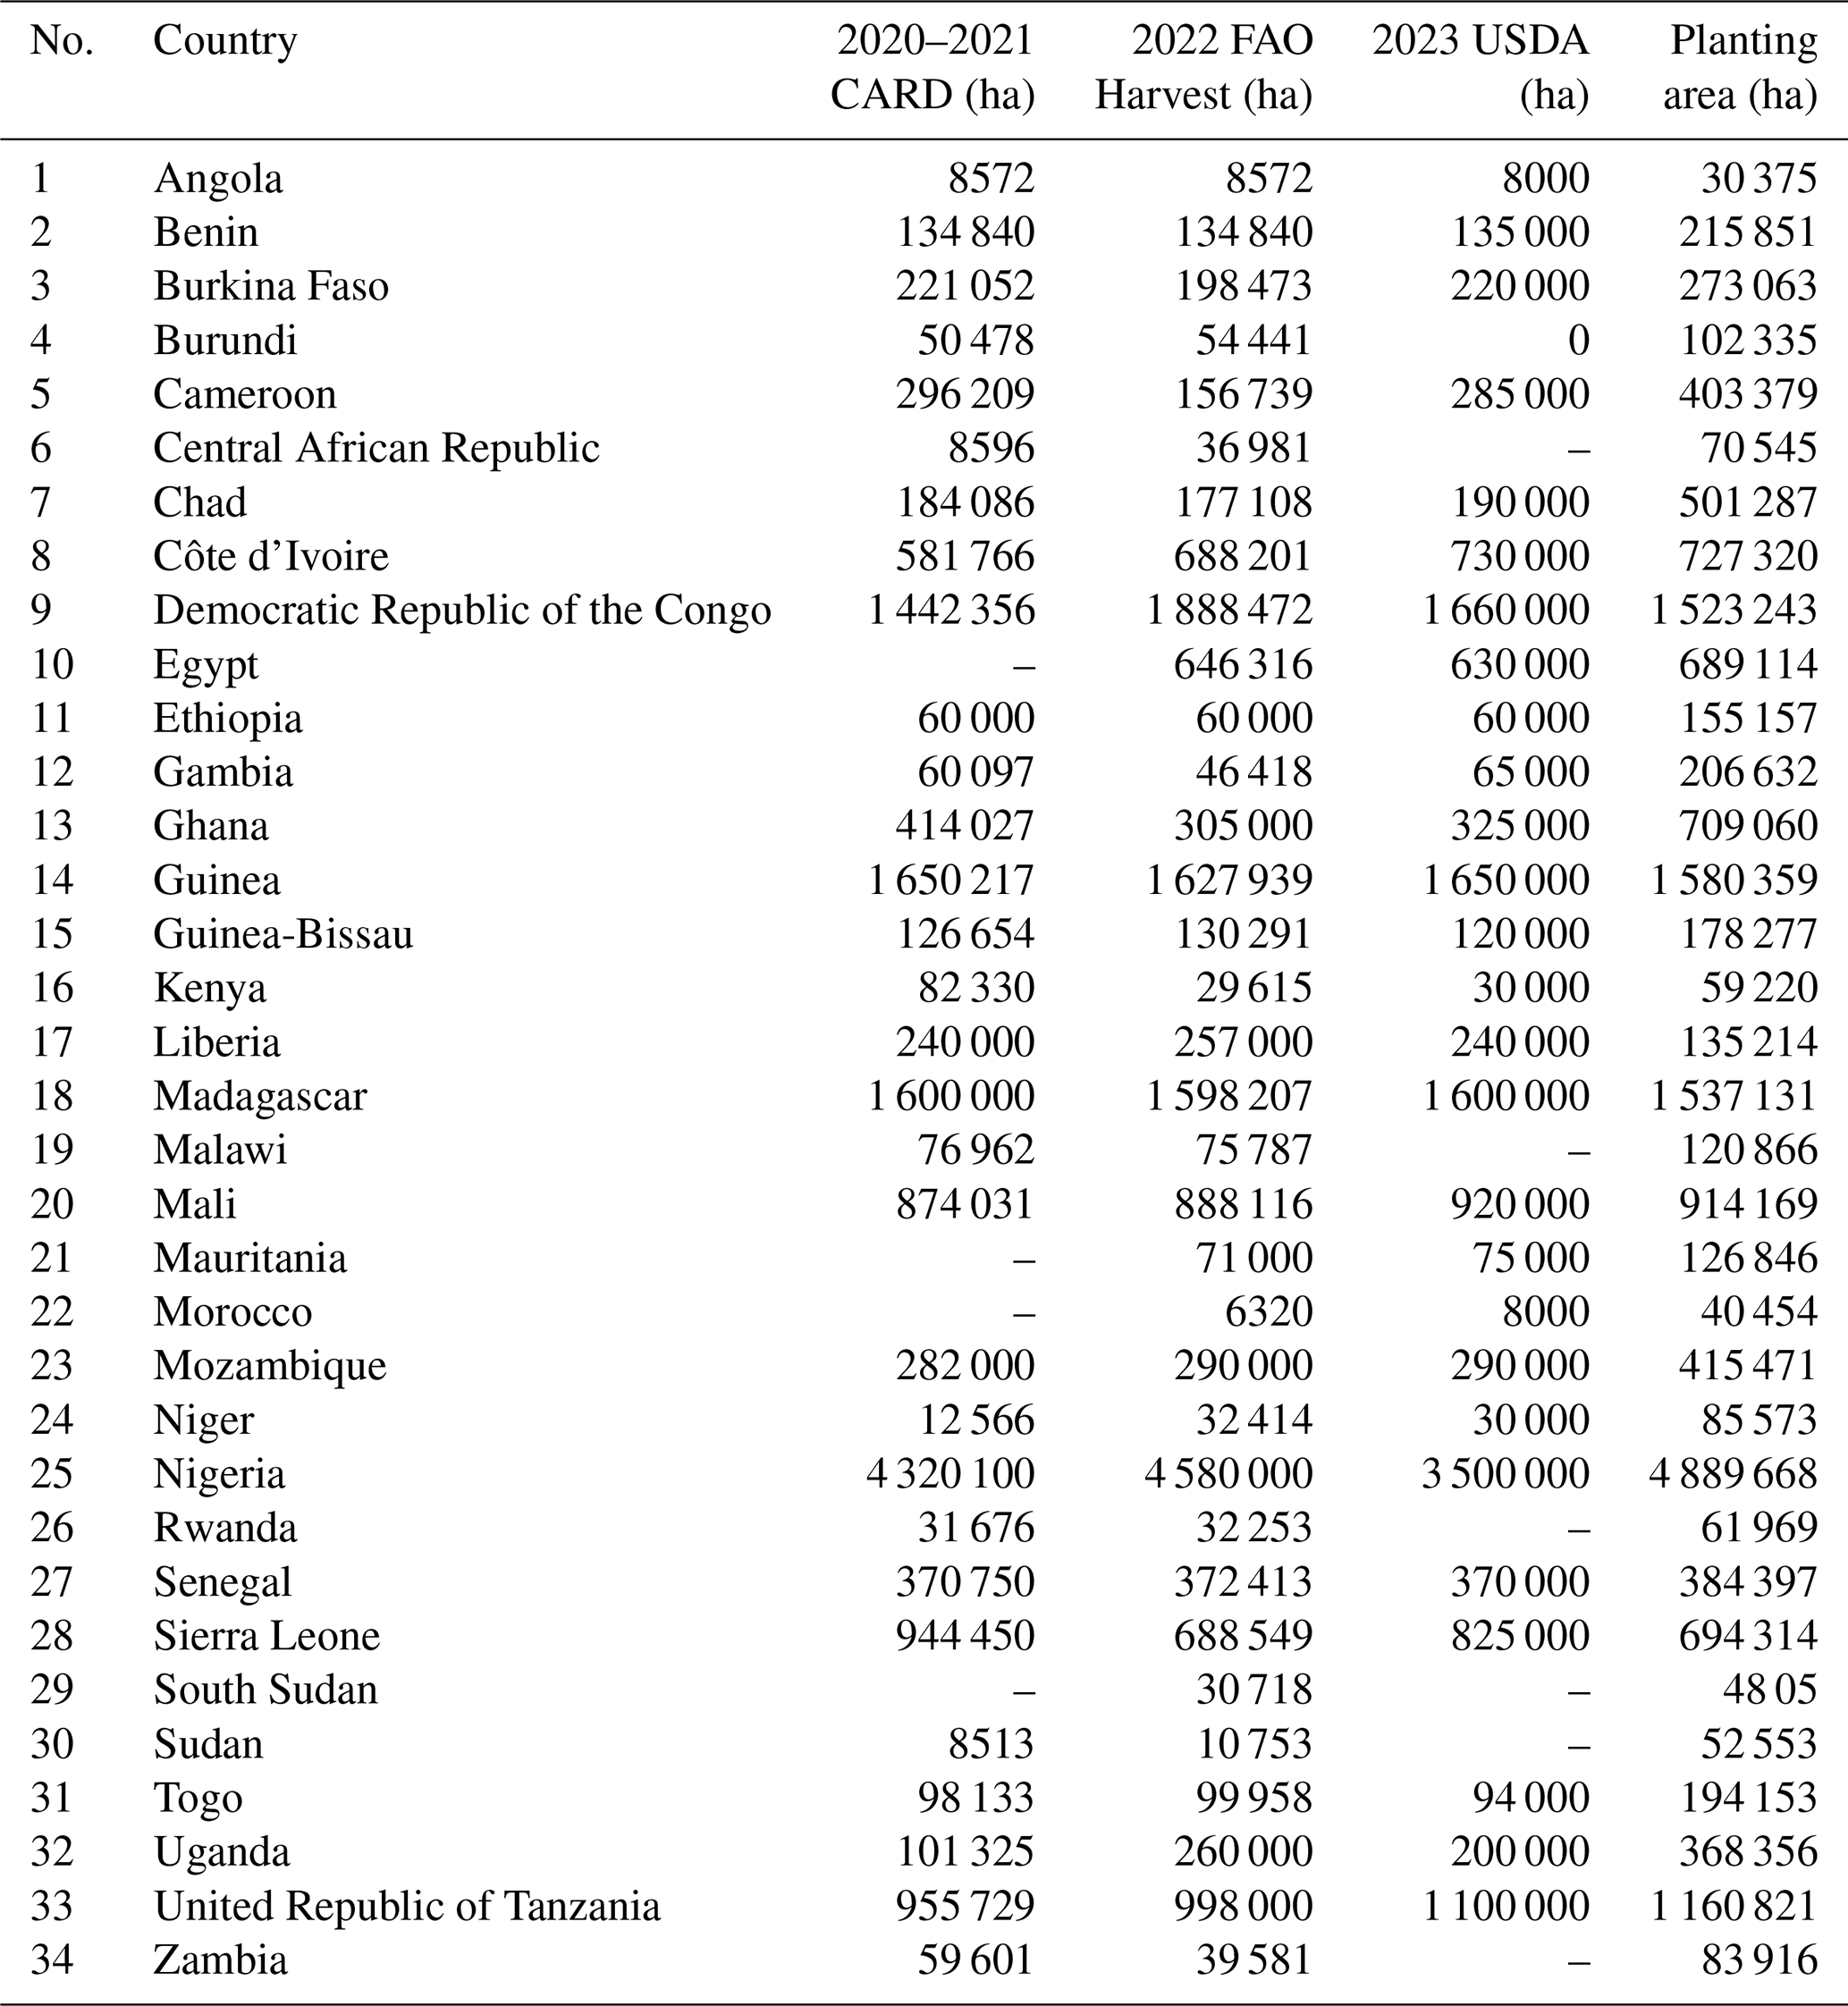
Table 7 presents the statistical data of rice-planting areas for 34 African countries with more than 5000 ha of rice area, listed in alphabetical order. The first column shows the rice-planting and rice-harvesting area reported by the Coalition for African Rice Development (CARD) for its member countries in 2020–2021 (CARD, 2020–2021). The second column provides the 2022 rice harvest area data from FAO. The third column shows the 2023 rice-planting and rice-harvesting area reported by USDA. The fourth column presents the 2023 rice-planting area derived from this study using the rice intensity data of RiceAtlas. All area units are in hectares.
The comparison between the calculated rice-planting areas from the mapping result and the rice intensity distribution data, alongside existing statistical data, reveals a strong linear relationship, as shown in Fig. 12. For all 34 countries, the R2 value for fitting with CARD (2020–2021) data is 0.9616, that for fitting with FAO (2023) data is 0.9756, and that for fitting with USDA (2023) data is 0.9431. After excluding countries with missing data, the R2 for fitting with CARD data (30 countries) improves to 0.9781, while that for fitting with USDA data (27 countries) is 0.9385, demonstrating strong consistency.
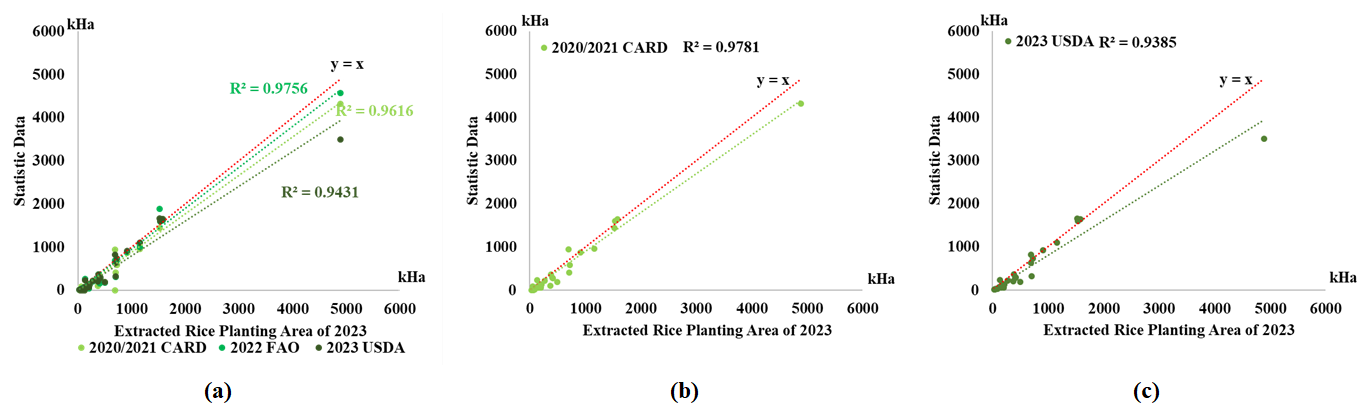
Figure 12The linear fitting results between the 2023 rice-planting area derived from this study and the existing statistical data, with mapping results on the x axis and existing statistical data on the y axis. The dashed red line represents the y=x line. (a) Fitting results for all 34 countries, (b) fitting results for 30 countries after excluding those with missing data from the CARD dataset, (c) fitting results for 27 countries after excluding those with missing data from the USDA dataset.
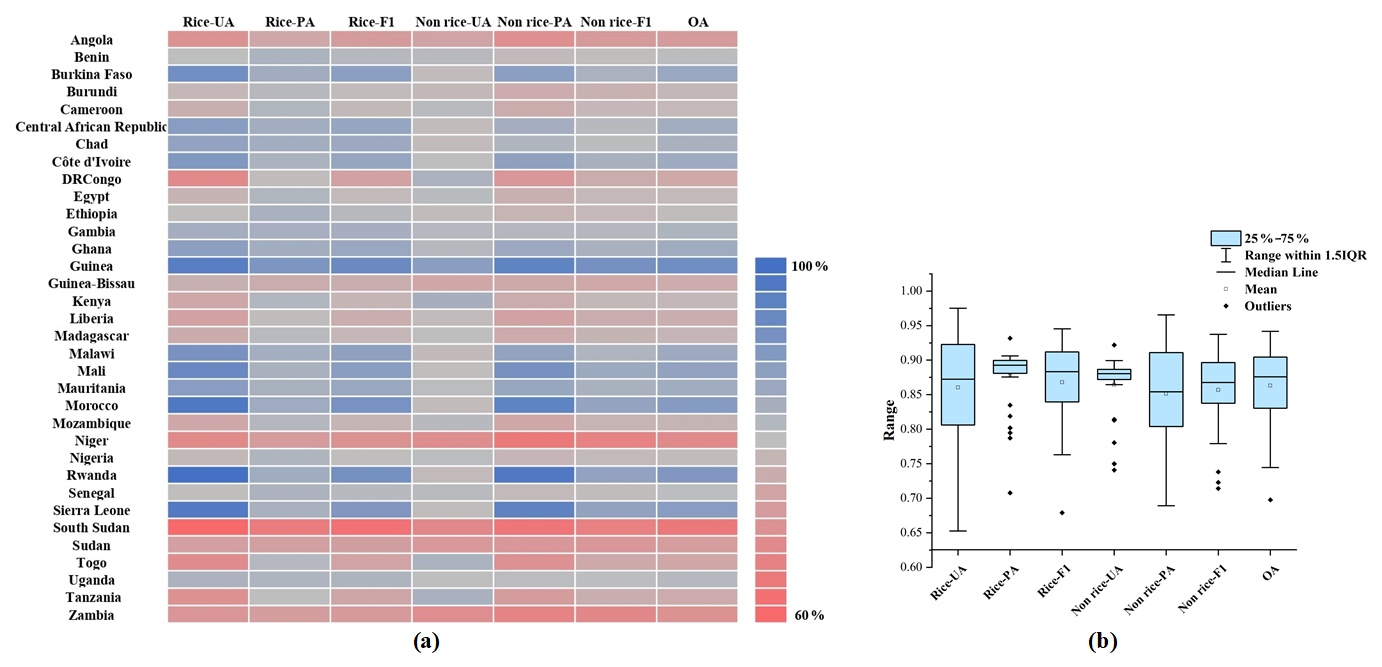
Figure 13Performance based on the validation set. (a) Heat map of validation accuracy across 34 African countries. (b) Corresponding boxplot.
The figures and tables indicate that, in countries with relatively low rice cultivation, the mapped areas generally exceed existing statistical data, shown as points below the y=x line in the fitting plot. In contrast, for countries with larger rice cultivation areas, such as the Democratic Republic of the Congo, Egypt, Guinea, Madagascar, Mali, and Tanzania, the mapped areas closely match existing statistics, with data points near the y=x line. On the other hand, in Nigeria, the mapped rice cultivation area is significantly higher than existing statistics, represented by points far below the y=x line.
These discrepancies may be attributed to several factors. In developing countries in Africa, data collection and reporting systems are often incomplete and inconsistent, leading to major gaps in the accuracy of reported rice cultivation areas. The issue is further compounded by the dominance of smallholder farming systems, where individual farm sizes are smaller and scattered, making them even harder to track and report on accurately. This often results in underreporting or outdated figures in official statistics. Additionally, rice cultivation in these regions has undergone rapid changes in recent years, with some areas seeing significant increases in planting that are not being fully captured by traditional reporting methods. Although multiple auxiliary datasets were integrated when constructing the rice sample set for this study, the process still relied heavily on expert knowledge. This is particularly challenging in countries with limited rice cultivation, where rice fields are more difficult to identify, leading to sample errors that directly affect mapping accuracy. Moreover, the rice intensity distribution information used to estimate planting areas was published in 2017 and may not fully capture the present situation in 2023, contributing to discrepancies between the mapped data and reported cultivation areas.
4.4 Classification accuracy based on the validation set
The validation results for rice and non-rice classifications across 34 African countries provide a comprehensive insight into the model's performance. Figure 13 displays key metrics, including user accuracy (UA), producer accuracy (PA), F1 scores, and overall accuracy (OA). Analyzing these metrics offers an understanding of the spatial variations and classification challenges encountered across different regions.
4.4.1 Rice classification performance
User accuracy (UA)
The UA for rice classification ranges from 65.26 % in South Sudan to 97.51 % in Rwanda. The lower values in countries like South Sudan and Niger highlight challenges in correctly identifying rice fields, possibly due to fragmented land use or small cultivation areas.
Producer accuracy (PA)
The PA for rice classification spans from 70.78 % in South Sudan to 93.17 % in Guinea. Higher PA values indicate the model's ability to correctly classify most rice areas, while lower values in regions like South Sudan suggest a tendency for rice areas to be misclassified as non-rice.
F1 score
The F1 scores, combining precision and recall, vary from 67.91 % in South Sudan to 94.54 % in Guinea. While most countries maintain F1 scores above 80 %, lower scores in regions like Angola and Niger highlight difficulties in balancing precision and recall.
4.4.2 Non-rice classification performance
User accuracy (UA)
The UA for non-rice ranges from 74.09 % in South Sudan to 92.18 % in Guinea, with most countries scoring over 85 %. The high UA values across most countries indicate effective identification of non-rice areas.
Producer accuracy (PA)
The PA ranges from 68.92 % in South Sudan to 96.55 % in Rwanda. Most countries exceed 80 %, underscoring consistent performance, though lower values in South Sudan indicate difficulties in distinguishing non-rice areas.
F1 score
The F1 scores for non-rice range from 71.41 % in South Sudan to 93.74 % in Guinea. Countries with lower scores, such as Niger and Sudan, highlight specific regional challenges in sample set construction with very limited rice cultivation.
Overall accuracy (OA)
The overall accuracy (OA) ranges from 69.76 % in South Sudan to 94.17 % in Guinea, with a mean of around 86.30 %. Of all countries in the study site, one country has an OA under 70 % (South Sudan), and four countries have OA values between 70 % and 80 % (Niger, Zambia, Angola, and Sudan). All of these countries have small areas of rice, posing extra challenges to sample set construction. When the rice paddy area of a country is too small compared to the total land area, the rice plots we can locate are very limited since wetlands are similar to rice paddies in the feature map; these have a far larger area, causing rice paddies to look like scattered noise, hence the relatively lower OA in these countries. However, countries with extensive rice cultivation, such as Ghana and Senegal, show OAs above 90 %, reflecting the model's robustness in regions with more homogeneous and concentrated rice production.
4.4.3 Key insights and implications
Regional variations
The variations in accuracy metrics indicate that regional agricultural practices, land use complexity, and data quality play significant roles in model performance. Regions with small, fragmented rice fields or mixed cropping systems, such as South Sudan, Niger, and Angola, present classification challenges that lead to lower accuracy scores.
Outliers and challenges
The boxplot (Fig. 14b) analysis reveals stable and consistent performance across most countries, with median values clustered between 85 % and 90 %. However, outliers such as South Sudan, Angola, and Niger show lower accuracy scores, mainly caused by a lack of sufficient rice samples, suggesting that additional refinement is needed for these regions.
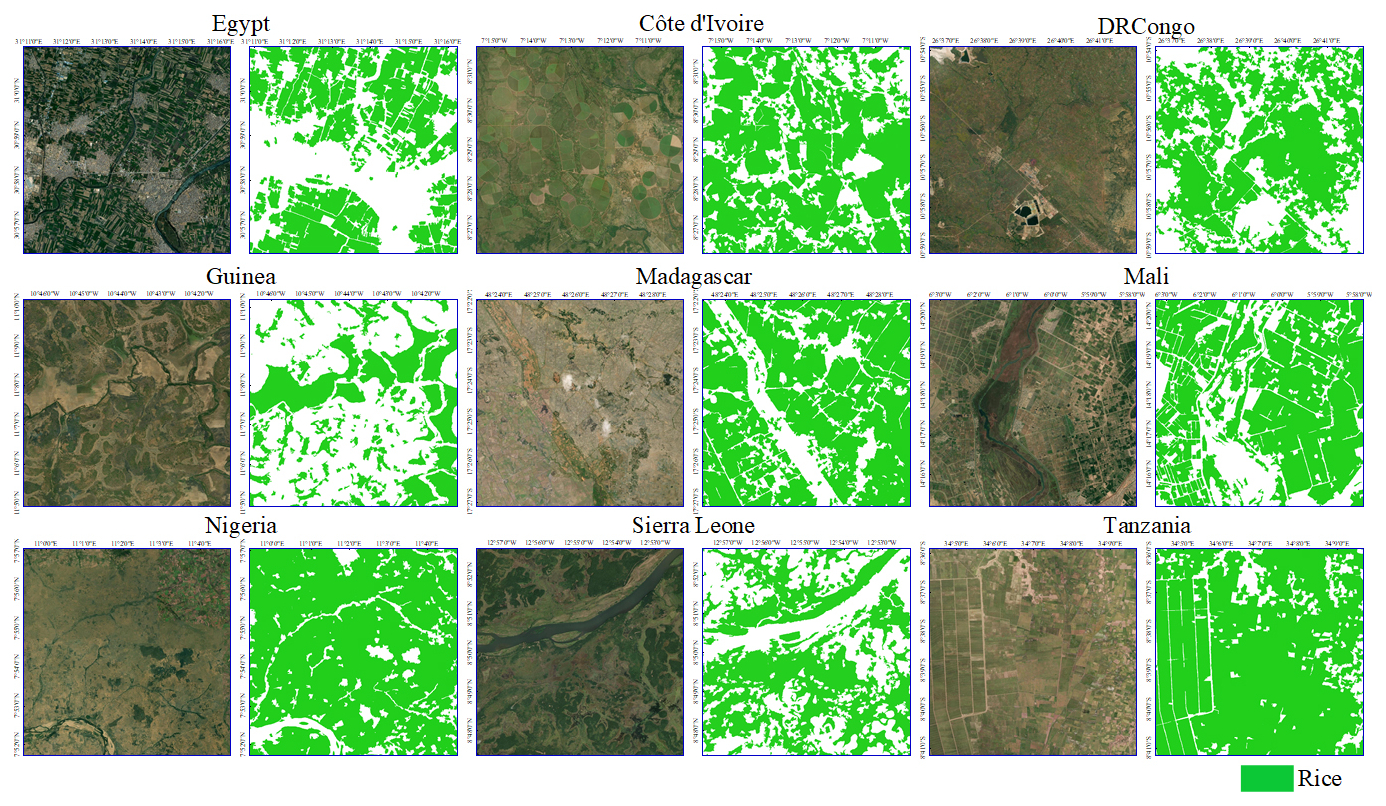
Figure 14Examples of rice-mapping results and corresponding optical imagery for major rice-producing countries in Africa. For each country, the first row shows the optical imagery (from © Google Earth), while the second row presents the rice-mapping results, with green areas representing rice fields.
Model reliability
The overall consistency in accuracy metrics across most countries highlights the robustness of the rice-mapping methodology. Future improvements could focus on addressing the specific challenges faced in regions with complex agricultural landscapes or limited data availability.
The findings underscore the importance of tailored approaches when applying classification models across diverse African environments. Addressing regional discrepancies will be crucial in enhancing data accuracy and supporting better agricultural policy development across Africa.
4.5 Comparison of rice-mapping results with optical imagery
Figure 14 illustrates the comparison between the rice-mapping results and corresponding optical images for selected regions in nine major rice-producing countries in Africa (with rice field areas exceeding 500 000 ha). The examples include both concentrated plantation zones and dispersed smallholder farming areas. The results show a strong alignment between the mapped outputs and the optical images. Additionally, due to the incorporation of the object-based segmentation step, the mapping results exhibit clear boundaries, minimal scattered noise, and fewer misclassifications.
5.1 Strengths and limitations
To produce large-scale, high-resolution rice distribution maps across Africa, this study proposed a method effectively combining Sentinel-1 SAR and Sentinel-2 optical imagery, addressing key challenges in sample collection and classification. By leveraging time series statistical features from Sentinel-1 VH data for initial fast coarse positioning of potential rice-planting areas and complementing this with visual interpretation using auxiliary datasets, the study efficiently generates reliable samples. During the classification phase, the approach integrates object-based segmentation results from Sentinel-2 optical time series data with feature-importance-guided random forest classification results from Sentinel-1 SAR time series data. This combination enhances the precision of rice paddy boundaries and reduces noise in heterogeneous landscapes, showing a significant improvement over pixel-based methods. Additionally, the proposed method requires no phenology information, allowing for a more adaptable mapping process across diverse rice-growing regions like Africa, avoiding the inaccuracies that arise from seasonal variability and diverse planting practices, which are common challenges in phenology-based methods. Collectively, these strengths underscore the method's robustness, efficiency, and scalability, positioning it as a reliable tool for high-resolution agricultural monitoring across Africa.
Despite these strengths, the study faces limitations related to the SNIC algorithm, particularly in the calibration of key parameters, namely seed distance and neighborhood size, which affects the size and definition of segmented objects. In this study, the calibration of key parameters was primarily achieved through a process of trial and visual inspection. While this method provided a practical solution within the context of this research, the robustness of the method needs to be further strengthened. Future research should focus on developing more systematic approaches to parameter optimization. This could involve the use of automated tuning algorithms or machine learning techniques that adjust parameters dynamically based on the characteristics of the input data, thereby improving the accuracy, consistency, and scalability of the segmentation process.
Another potential problem is, when comparing with statistical data, the administrative distribution data of rice-planting intensity in the RiceAtlas product is utilized to calculate the planting area from the paddy area of the mapping result. This dataset of the year 2017 could lead to gaps among the calculated planting area, actual planting area, and statistical data since rice cultivation has expanded rapidly in recent years, as mentioned in Sect. 4.3. However, there is no up-to-date dataset of rice intensity in Africa, and other datasets including rice intensity in Africa, like GCI (Global Cropping Intensity) for the years 2001 to 2019 (Liu et al., 2021) and GCI30 (Zhang et al., 2021) for the years 2016 to 2018, are pixel-level datasets, which are assumed to change more than administrative-level data over time. Therefore, RiceAtlas is chosen as the rice intensity source to balance consistency and data availability and is only used to fit with statistics to demonstrate the reliability of our results. Nevertheless, more up-to-data intensity data can provide more insight into the rice-planting status in Africa.
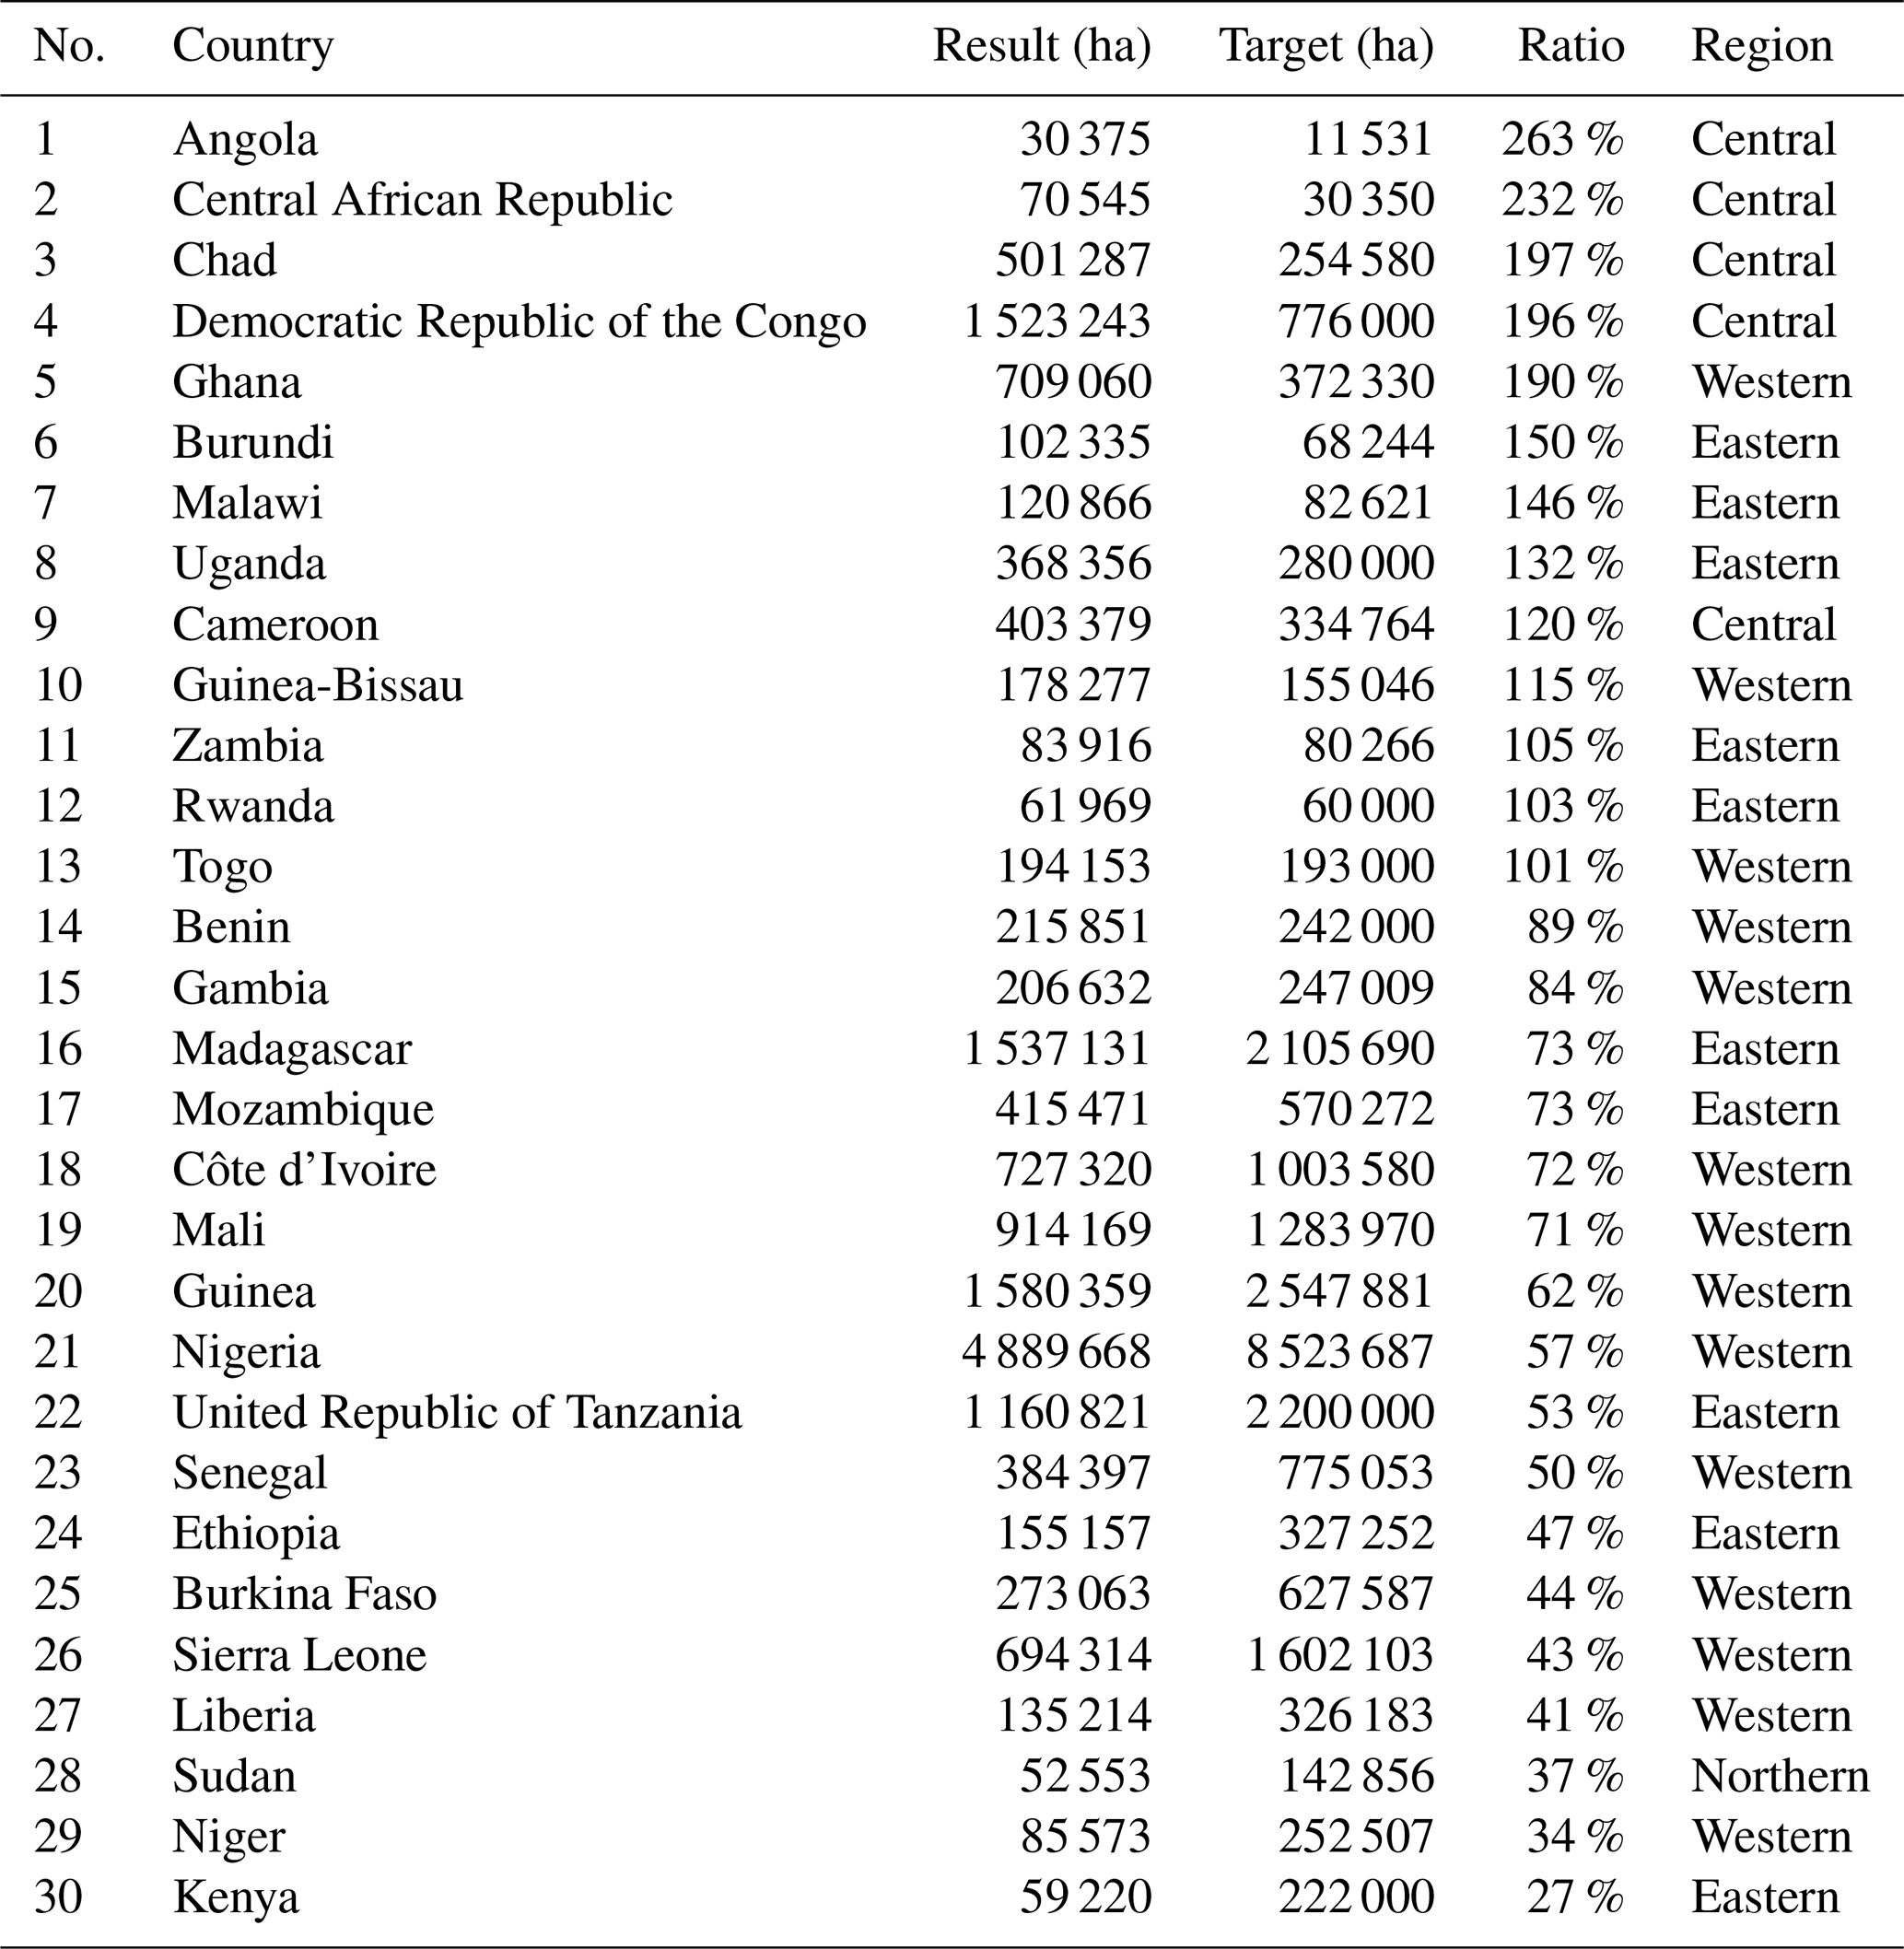
Table 8Current rice cultivation areas and 2030 targets for CARD countries (CARD, 2022), sorted by completion percentage.
Moreover, the sample set in this study was constructed through visual interpretation, assisted by the fast-coarse-positioning feature. As discussed in the part of Sect. 4.4 covering overall accuracy, when conducting sample set construction in countries with very small areas of rice (such as South Sudan, Niger, Zambia, Angola, and Sudan), the difficulty in locating rice plots is still huge since ground objects like wetlands are similar to but much larger than rice paddies in the feature map, resulting in lower OA values in these countries. To enhance the mapping accuracy in such countries, the current mapping results could serve as a reference to develop an expanded sample set for a new round of training and classification in future work. Given the relatively small spatial extent of these regions compared to the entire African continent, the spatial heterogeneity is significantly reduced. This allows for a more detailed analysis of rice phenology, which could substantially improve mapping performance. To improve the effectiveness of the proposed method of mapping rice at a large scale, weakly supervised learning algorithms could be employed to automatically augment the training sample set and to improve classification accuracy in future studies. The sample expansion process could still be guided by feature importance to ensure the reliability and robustness of the generated samples.
5.2 Enlightenment and implications
The experiment results highlight regional variations in the importance of specific features for rice mapping across Africa. Despite these variations, temporal statistical features from SAR data – particularly VH, VV, and PRVI – consistently demonstrated their utility in capturing the temporal dynamics of rice cultivation. By further exploring and experimenting with these temporal SAR features, future studies could refine rice detection models to be more sensitive to regional differences and temporal changes in Africa. This could involve integrating these features with additional data sources, such as optical imagery or other environmental variables, to create more robust and comprehensive mapping models.
The rice distribution map generated in this study has significant implications for agricultural monitoring and food security across Africa. By providing an accurate baseline for rice distribution, this study supports government and research initiatives focused on food resource management, land use planning, and climate impact assessments. Unlike current rice-mapping studies in Africa, which have been constrained by limited spatial resolutions and are primarily represented as gridded data, this approach offers a reliable, scalable framework that aligns with Africa's need for consistent agricultural data.
5.3 Progress and gaps in the National Rice Development Strategy (NRDS) of CARD countries with regard to 2030 targets
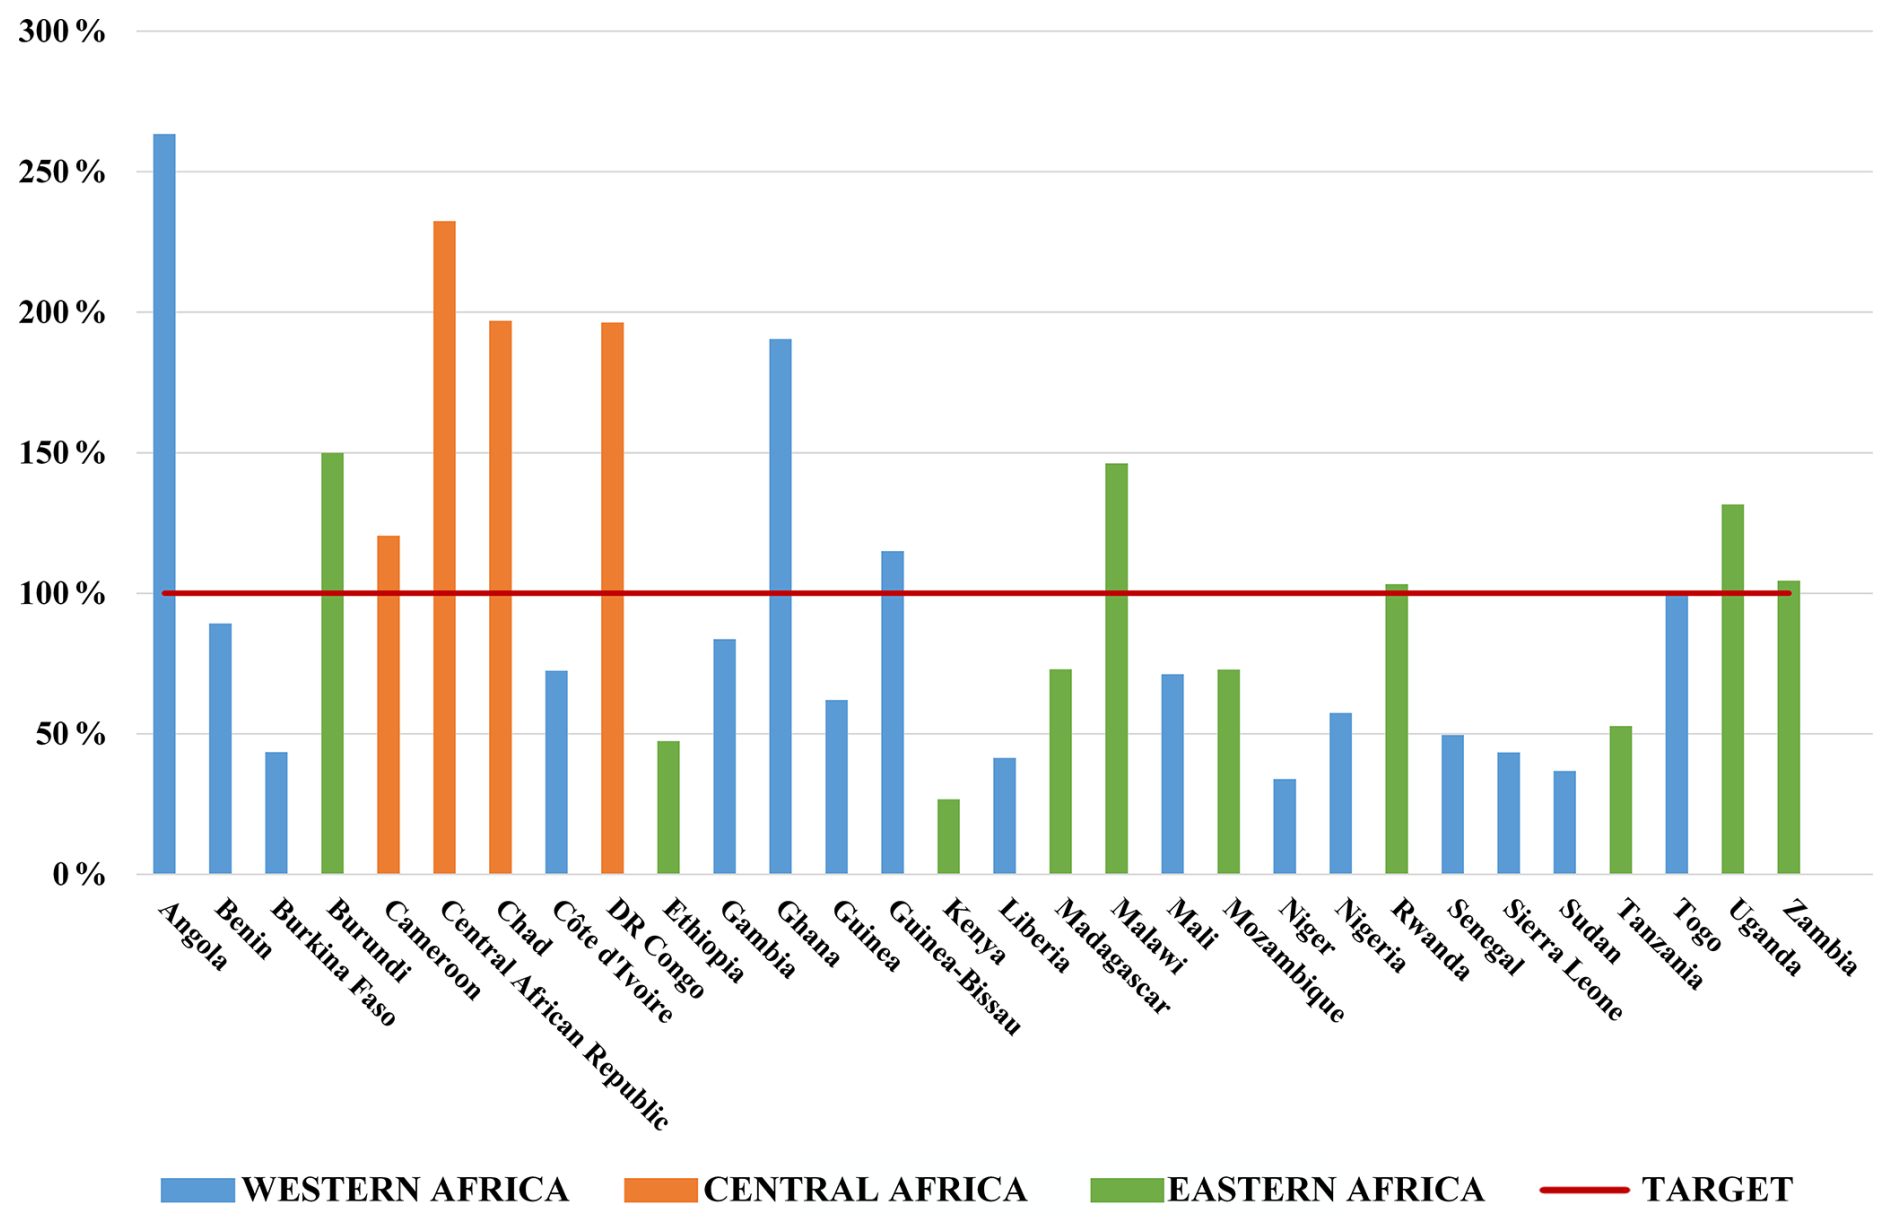
Comparing existing rice-planting and rice-harvesting statistics from African countries with the rice-planting area results obtained in this study reveals that, although rice cultivation in most African countries has fluctuated, there is still a slow upward trend. This aligns with the policy direction of promoting rice cultivation in these countries, though there remains a significant gap with regard to achieving the 2030 Rice Research and Innovation Strategy for Africa target. Table 8 and Fig. 15 present the targets of rice-planting area and the percentage of these targets completed by countries in CARD. Among the countries assessed, 15 have achieved over 80 % of the 2030 targets, 5 have achieved 60 %–80 %, 7 have achieved 40 %–60 %, and 3 have achieved less than 40 %. Of the nine countries with completion rates below 60 %, Tanzania, Senegal, Sierra Leone, and Burkina Faso currently have substantial rice cultivation areas (greater than 200 000 ha) but have set high targets. Ethiopia, Liberia, Sudan, Niger, and Kenya have smaller targets but still lag in their current rice cultivation. Countries should develop and adjust their rice cultivation strategies accordingly to achieve the goals of the “transformation of rice-based agri-food systems for food and nutrition security in Africa” and to enhance local food self-sufficiency, ultimately contributing to the SDGs (Sustainable Development Goals) of Zero Hunger.
The 20 m Africa rice distribution map of 2023 can be accessed in the Zenodo dataset from the following DOI: https://doi.org/10.5281/zenodo.13729353 (Jiang et al., 2024). The spatial reference system of the dataset is EPSG:4326(WGS84).
This study employs temporal SAR data and optical imagery, combined with object-oriented segmentation and feature-importance-guided random forest algorithms, to conduct rice extraction experiments in 34 African countries with annual rice-planting areas exceeding 5000 ha, achieving a 20 m resolution spatial distribution mapping of rice in Africa for 2023. The average classification accuracy based on the validation set exceeded 85 %, and the R2 values for linear fitting with existing statistical data all surpassed 0.9, demonstrating the effectiveness of the proposed mapping method.
This study marks the first time a high-resolution rice spatial distribution map has been generated for the entire African continent, offering significant advancements in monitoring rice cultivation patterns in the region. The map provides crucial data support for rice yield estimation, climate resilience assessments, and the development of targeted agricultural policies. Moreover, the insights derived from this research can aid in optimizing resource allocation, enhancing food security, and informing decision-making processes for stakeholders ranging from policymakers to local farmers across Africa.
Conceptualization, methodology, software: JJ, MS, and JG. Validation, formal analysis: JJ and JG. Investigation: JJ and HZ. Resources, data curation: LX, YD, and YX. Writing (original draft preparation): JJ and HZ. Writing (review and editing): HZ, LX, JG, and LZ. Visualization: JJ, YD, and YX. Supervision, project administration: HZ, LZ, and WH. All the authors have read and agreed to the published version of the paper.
The contact author has declared that none of the authors has any competing interests.
Publisher's note: Copernicus Publications remains neutral with regard to jurisdictional claims made in the text, published maps, institutional affiliations, or any other geographical representation in this paper. While Copernicus Publications makes every effort to include appropriate place names, the final responsibility lies with the authors.
The authors acknowledge the data and computational power provided by the Google Earth Engine platform.
The research was supported by the National Natural Science Foundation of China (grant no. T2261129473) and the National Key R&D Program of China (grant no. 2023YFB3906201).
This paper was edited by Hanqin Tian and reviewed by two anonymous referees.
Achanta, R. and Susstrunk, S.: Superpixels and polygons using simple non-iterative clustering, in: Proceedings of the IEEE conference on computer vision and pattern recognition, 21–26 July 2017, Honolulu, HI, USA, 4651–4660, https://doi.org/10.1109/cvpr.2017.520, 2017.
AfricaRice – Africa Rice Center: Transformation of Rice-based Agri-food Systems for Food and Nutrition Security in Africa: 2030 rice research and innovation strategy for Africa, Abidjan, Côte d'Ivoire, vi+58 pp., https://www.africarice.org/strategy (last access: 9 April 2024), 2023.
Ajala, A. and Gana, A.: Analysis of challenges facing rice processing in Nigeria, J. Food Process., 2015, 893673, https://doi.org/10.1155/2015/893673, 2015.
Arouna, A., Fatognon, I. A., Saito, K., and Futakuchi, K.: Moving toward rice self-sufficiency in sub-Saharan Africa by 2030: Lessons learned from 10 years of the Coalition for African Rice Development, World Dev. Perspect., 21, 100291, https://doi.org/10.1016/j.wdp.2021.100291, 2021.
Avcı, C., Budak, M., Yağmur, N., and Balçık, F.: Comparison between random forest and support vector machine algorithms for LULC classification, Int. J. Eng. Geosci., 8, 1–10, https://doi.org/10.26833/ijeg.987605, 2023.
Balasubramanian, V., Sie, M., Hijmans, R. J., and Otsuka, K.: Increasing Rice Production in Sub-Saharan Africa: Challenges and Opportunities, in: Advances in Agronomy, edited by: Sparks, D. L., Academic Press, 55–133, https://doi.org/10.1016/S0065-2113(06)94002-4, 2007.
Barro, M., Kassankogno, A. I., Wonni, I., Sereme, D., Somda, I., Kabore, H. K., Bena, G., Brugidou, C., Tharreau, D., and Tollenaere, C.: Spatiotemporal Survey of Multiple Rice Diseases in Irrigated Areas Compared to Rainfed Lowlands in the Western Burkina Faso, Plant Dis., 105, 3889–3899, https://doi.org/10.1094/PDIS-03-21-0579-RE, 2021.
Bhogapurapu, N., Dey, S., Mandal, D., Bhattacharya, A., Karthikeyan, L., McNairn, H., and Rao, Y.: Soil moisture retrieval over croplands using dual-pol L-band GRD SAR data, Remote Sens. Environ., 271, 112900, https://doi.org/10.1016/j.rse.2022.112900, 2022.
CARD – Coalition for African Rice Development: Countries, https://riceforafrica.net/ (last access: 1 February 2024), 2020/2021.
CARD – Coalition for African Rice Development: Countries, https://riceforafrica.net/ (last access: 1 February 2024), 2022.
Chang, J. G., Shoshany, M., and Oh, Y.: Polarimetric radar vegetation index for biomass estimation in desert fringe ecosystems, IEEE T. Geosci. Remote, 56, 7102–7108, https://doi.org/10.1109/tgrs.2018.2848285, 2018.
Chhabra, A., Rüdiger, C., Yebra, M., Jagdhuber, T., and Hilton, J.: RADAR-Vegetation Structural Perpendicular Index (R-VSPI) for the Quantification of Wildfire Impact and Post-Fire Vegetation Recovery, Remote Sens., 14, 3132, https://doi.org/10.3390/rs14133132, 2022.
de Lima, I. P., Jorge, R. G., and de Lima, J. L. P.: Remote sensing monitoring of rice fields: Towards assessing water saving irrigation management practices, Front. Remote Sens., 2, 762093, https://doi.org/10.3389/frsen.2021.762093, 2021.
Diuk-Wasser, M. A., Toure, M. B., Dolo, G., Bagayoko, M., Sogoba, N., Sissoko, I., Traoré, S. F., and Taylor, C. E.: Effect of rice cultivation patterns on malaria vector abundance in rice-growing villages in Mali, Am. J. Trop. Med. Hyg., 76, 869, https://doi.org/10.4269/ajtmh.2007.76.869, 2007.
FAO: Crops and livestock products, https://www.fao.org/faostat/en/#data/QCL (last access: 1 February 2024), 2022.
FAO: World Food and Agriculture – Statistical Yearbook 2023, https://doi.org/10.4060/cc8166en, 2023.
FEWSNET: Livelihoods Zone Map and Descriptions for South Sudan, https://pdf.usaid.gov/pdf_docs/PA00TGSD.pdf (last access: 4 February 2024), 2018.
Field, C. B. and Barros, V. R.: Climate change 2014 – Impacts, adaptation and vulnerability: Regional aspects, Cambridge University Press, 1199–1206, https://doi.org/10.1017/CBO9781107415386, 2014.
Frolking, S., Wisser, D., Grogan, D., Proussevitch, A., and Glidden, S.: GAEZ+_2015 Crop Harvest Area (V4), Harvard Dataverse [data set], https://doi.org/10.7910/DVN/KAGRFI, 2020.
Ginting, F. I., Rudiyanto, R., Fatchurahman, Mohd Shah, R., Che Soh, N., Giap, S. G. E., Fiantis, D., Setiawan, B. I., Schiller, S., Davitt, A., and Minasny, B.: SEA-Rice-Ci10: High-resolution Mapping of Rice Cropping Intensity and Harvested Area Across Southeast Asia using the Integration of Sentinel-1 and Sentinel-2 Data, Earth Syst. Sci. Data Discuss. [preprint], https://doi.org/10.5194/essd-2024-90, 2024.
Gorelick, N., Hancher, M., Dixon, M., Ilyushchenko, S., Thau, D., and Moore, R.: Google Earth Engine: Planetary-scale geospatial analysis for everyone, Remote Sens. Environ., 202, 18–27, https://doi.org/10.1016/j.rse.2017.06.031, 2017.
Guan, X., Huang, C., Liu, G., Meng, X., and Liu, Q.: Mapping Rice Cropping Systems in Vietnam Using an NDVI-Based Time-Series Similarity Measurement Based on DTW Distance, Remote Sens., 8, 19, https://doi.org/10.3390/rs8010019, 2016.
Guo, Y., Jia, X., Paull, D., and Benediktsson, J. A.: Nomination-favoured opinion pool for optical-SAR-synergistic rice mapping in face of weakened flooding signals, ISPRS J. Photogram. Remote Sens., 155, 187–205, https://doi.org/10.1016/j.isprsjprs.2019.07.008, 2019.
Han, J., Zhang, Z., Luo, Y., Cao, J., Zhang, L., Cheng, F., Zhuang, H., Zhang, J., and Tao, F.: NESEA-Rice10: high-resolution annual paddy rice maps for Northeast and Southeast Asia from 2017 to 2019, Earth Syst. Sci. Data, 13, 5969–5986, https://doi.org/10.5194/essd-13-5969-2021, 2021.
Hussain, S., Huang, J., Huang, J., Ahmad, S., Nanda, S., Anwar, S., Shakoor, A., Zhu, C., Zhu, L., and Cao, X.: Rice production under climate change: adaptations and mitigating strategies, Environment, climate, plant and vegetation growth, 659–686, Springer Nature, https://doi.org/10.1007/978-3-030-49732-3_26, 2020.
International Food Policy Research: Spatially-Disaggregated Crop Production Statistics Data in Africa South of the Sahara for 2017 (V3), Harvard Dataverse [data set], https://doi.org/10.7910/DVN/FSSKBW, 2020.
Jiang, J., Zhang, H., Ge, J., Zuo, L., Xu, L., Song, M., Ding, Y., Xie, Y., and Huang, W.: 20 m Africa rice distribution map in 2023 [dataset], Zenodo [data set], https://doi.org/10.5281/zenodo.13729353, 2024.
Kajisa, K. and Vu, T. T.: The importance of farm management training for the African rice Green Revolution: Experimental evidence from rainfed lowland areas in Mozambique, Food Policy, 114, 102401, https://doi.org/10.1016/j.foodpol.2022.102401, 2023.
Kuenzer, C. and Knauer, K.: Remote sensing of rice crop areas, Int. J. Remote Sens., 34, 2101–2139, https://doi.org/10.1080/01431161.2012.738946, 2013.
Kwesiga, J., Grotelüschen, K., Neuhoff, D., Senthilkumar, K., Döring, T. F., and Becker, M.: Site and management effects on grain yield and yield variability of rainfed lowland rice in the Kilombero Floodplain of Tanzania, Agronomy, 9, 632, https://doi.org/10.3390/agronomy9100632, 2019.
Laborte, A. G., Gutierrez, M. A., Balanza, J. G., Saito, K., Zwart, S. J., Boschetti, M., Murty, M. V. R., Villano, L., Aunario, J. K., Reinke, R., Koo, J., Hijmans, R. J., and Nelson, A.: RiceAtlas, a spatial database of global rice calendars and production, Sci. Data, 4, 170074, https://doi.org/10.1038/sdata.2017.74, 2017.
Li, J. and Wang, S.: Using SAR-Derived Vegetation Descriptors in a Water Cloud Model to Improve Soil Moisture Retrieval, Remote Sens., 10, 1370, https://doi.org/10.3390/rs10091370, 2018.
Liang, S., Li, Y., Zheng, Z., Cui, C., and Zhao, J.: Development Suggestions and Cultivation Performance of Chinese Hybrid Rice Varieties in Chad, Hubei Agricult. Sci., 56, 1422–1426, https://doi.org/10.14088/j.cnki.issn0439-8114.2017.08.006, 2017.
Liu, X., Zhai, H., Shen, Y., Lou, B., Jiang, C., Li, T., Hussain, S. B., and Shen, G.: Large-scale crop mapping from multisource remote sensing images in google earth engine, IEEE J. Select. Top. Appl.Earth Obs. Remote Sens., 13, 414–427, https://doi.org/10.1109/jstars.2019.2963539, 2020.
Liu, X., Zheng, J., Yu, L., Hao, P., Chen, B., Xin, Q., Fu, H., and Gong, P.: Annual dynamic dataset of global cropping intensity from 2001 to 2019, Sci. Data, 8, 283, https://doi.org/10.1038/s41597-021-01065-9, 2021.
Loko, Y. L. E., Gbemavo, C. D. S. J., Djedatin, G., Ewedje, E.-E., Orobiyi, A., Toffa, J., Tchakpa, C., Sedah, P., and Sabot, F.: Characterization of rice farming systems, production constraints and determinants of adoption of improved varieties by smallholder farmers of the Republic of Benin, Sci. Rep., 12, 3959, https://doi.org/10.1038/s41598-022-07946-2, 2022.
Luo, K., Lu, L., Xie, Y., Chen, F., Yin, F., and Li, Q.: Crop type mapping in the central part of the North China Plain using Sentinel-2 time series and machine learning, Comput. Elect. Agricult., 205, 107577, https://doi.org/10.1016/j.compag.2022.107577, 2023.
Mathieu, R.: Mapping of Rice Areas in Egypt using SAR Imagery, Zenodo [report], https://doi.org/10.5281/zenodo.7539805, 2022.
Menge, D. M., Musila, R. N., Kagito, S., Bii, L., Gichuki, J., Gichuhi, E., Kundu, C. A., Murori, R., Ismail, A., and Panchbhai, A.: Using principal component analysis to assess soil chemical properties in the mwea irrigation Scheme, Kenya: Implications for rice agronomic management, Int. J. Plant Soil Sci., 36, 106–126, https://doi.org/10.9734/ijpss/2024/v36i54508, 2024.
Mwakyusa, L., Dixit, S., Herzog, M., Heredia, M. C., Madege, R. R., and Kilasi, N. L.: Flood-tolerant rice for enhanced production and livelihood of smallholder farmers of Africa, Front. Sustain. Food Syst., 7, 1244460, https://doi.org/10.3389/fsufs.2023.1244460, 2023.
Ogisi, O. D. and Begho, T.: Adoption of climate-smart agricultural practices in sub-Saharan Africa: A review of the progress, barriers, gender differences and recommendations, Farm. Syst., 1, 100019, https://doi.org/10.1016/j.farsys.2023.100019, 2023.
Panda, D. and Barik, J.: Flooding tolerance in rice: Focus on mechanisms and approaches, Rice Sci., 28, 43–57, https://doi.org/10.1016/j.rsci.2020.11.006, 2021.
Qiu, B., Li, W., Tang, Z., Chen, C., and Qi, W.: Mapping paddy rice areas based on vegetation phenology and surface moisture conditions, Ecol. Indic., 56, 79–86, https://doi.org/10.1016/j.ecolind.2015.03.039, 2015.
Saad El Imanni, H., El Harti, A., Hssaisoune, M., Velastegui-Montoya, A., Elbouzidi, A., Addi, M., El Iysaouy, L., and El Hachimi, J.: Rapid and automated approach for early crop mapping using Sentinel-1 and Sentinel-2 on Google earth engine; a case of a highly heterogeneous and fragmented agricultural region, J. Imag., 8, 316, https://doi.org/10.3390/jimaging8120316, 2022.
Seck, P. A., Diagne, A., Mohanty, S., and Wopereis, M. C.: Crops that feed the world 7: Rice, Food Secur., 4, 7–24, https://doi.org/10.1007/s12571-012-0168-1, 2012.
Shen, R., Pan, B., Peng, Q., Dong, J., Chen, X., Zhang, X., Ye, T., Huang, J., and Yuan, W.: High-resolution distribution maps of single-season rice in China from 2017 to 2022, Earth Syst. Sci. Data, 15, 3203–3222, https://doi.org/10.5194/essd-15-3203-2023, 2023.
Singh, R. K., Rizvi, J., Behera, M. D., and Biradar, C.: Automated crop type mapping using time-weighted dynamic time warping – A basis to derive inputs for enhanced food and Nutritional Security, Curr. Res. Environ. Sustain., 3, 100032, https://doi.org/10.1016/j.crsust.2021.100032, 2021.
Sun, C., Zhang, H., Xu, L., Ge, J., Jiang, J., Zuo, L., and Wang, C.: Twenty-meter annual paddy rice area map for mainland Southeast Asia using Sentinel-1 synthetic-aperture-radar data, Earth Syst. Sci. Data, 15, 1501–1520, https://doi.org/10.5194/essd-15-1501-2023, 2023.
Sun, C., Zhang, H., Xu, L., Ge, J., Jiang, J., Song, M., and Wang, C.: Rice yield prediction using radar vegetation indices from Sentinel-1 data and multiscale one-dimensional convolutional long-and short-term memory network model, J. Appl. Remote Sens., 18, 024505, https://doi.org/10.1117/1.jrs.18.024505, 2024.
Tang, F. H. M., Nguyen, T. H., Conchedda, G., Casse, L., Tubiello, F. N., and Maggi, F.: CROPGRIDS: A global geo-referenced dataset of 173 crops circa 2020, Earth Syst. Sci. Data Discuss. [preprint], https://doi.org/10.5194/essd-2023-130, 2023.
Tassi, A. and Vizzari, M.: Object-oriented lulc classification in google earth engine combining snic, glcm, and machine learning algorithms, Remote Sens., 12, 3776, https://doi.org/10.3390/rs12223776, 2020.
Tian, G., Li, H., Feng, X., Jiang, Q., Li, N., Guo, Z., Zhao, J., and Yang, H.: An automatic method for rice mapping in Taishan, China using Sentinel-1A Time-series images, Remote Sens. Lett., 15, 99–109, https://doi.org/10.1080/2150704x.2024.2302946, 2024.
United Nations: Standard country or area codes for statistical use (M49)/Geographic Regions, https://unstats.un.org/unsd/methodology/m49 (last access: 6 April 2024), 2013.
USDA: Foreign Agricultural Service, https://ipad.fas.usda.gov/countrysummary (last access: 1 February 2024), 2023.
Voahanyinirina, R. and Elie, R.: Effects of planting location and storage time on lipids and fatty acids contents of some Madagascan rice varieties, Afr. J. Agricult. Res., 2, 349–355, 2007.
Waleed, M., Mubeen, M., Ahmad, A., Habib-ur-Rahman, M., Amin, A., Farid, H. U., Hussain, S., Ali, M., Qaisrani, S. A., and Nasim, W.: Evaluating the efficiency of coarser to finer resolution multispectral satellites in mapping paddy rice fields using GEE implementation, Sci. Rep., 12, 13210, https://doi.org/10.1038/s41598-022-17454-y, 2022.
Wang, G., Meng, D., Chen, R., Yang, G., Wang, L., Jin, H., Ge, X., and Feng, H.: Automatic Rice Early-Season Mapping Based on Simple Non-Iterative Clustering and Multi-Source Remote Sensing Images, Remote Sens., 16, 277, https://doi.org/10.3390/rs16020277, 2024.
Wang, Y., Zang, S., and Tian, Y.: Mapping paddy rice with the random forest algorithm using MODIS and SMAP time series, Chaos Solit. Fract., 140, 110116, https://doi.org/10.1016/j.chaos.2020.110116, 2020.
Wei, J., Cui, Y., Luo, W., and Luo, Y.: Mapping paddy rice distribution and cropping intensity in China from 2014 to 2019 with landsat images, effective flood signals, and google earth engine, Remote Sens., 14, 759, https://doi.org/10.3390/rs14030759, 2022.
Wu, H., Zhang, J., Zhang, Z., Han, J., Cao, J., Zhang, L., Luo, Y., Mei, Q., Xu, J., and Tao, F.: AsiaRiceYield4km: seasonal rice yield in Asia from 1995 to 2015, Earth Syst. Sci. Data, 15, 791–808, https://doi.org/10.5194/essd-15-791-2023, 2023.
Yamamoto, Y., Tsujimoto, Y., Fujihara, Y., Sakagami, J.-i., Ochi, S., and Fosu, M.: Assessing the probability of land submergence for lowland rice cultivation in Africa using satellite imagery and geospatial data, Environ. Dev. Sustain., 14, 955–971, https://doi.org/10.1007/s10668-012-9363-7, 2012.
You, N., Dong, J., Huang, J., Du, G., Zhang, G., He, Y., Yang, T., Di, Y., and Xiao, X.: The 10-m crop type maps in Northeast China during 2017–2019, Sci. Data, 8, 41, https://doi.org/10.1038/s41597-021-00827-9, 2021.
Yu, Q., You, L., Wood-Sichra, U., Ru, Y., Joglekar, A. K., Fritz, S., Xiong, W., Lu, M., Wu, W., and Yang, P.: A cultivated planet in 2010 – Part 2: The global gridded agricultural-production maps, Earth Syst. Sci. Data, 12, 3545–3572, https://doi.org/10.5194/essd-12-3545-2020, 2020.
Yuan, S., Saito, K., van Oort, P. A. J., van Ittersum, M. K., Peng, S., and Grassini, P.: Intensifying rice production to reduce imports and land conversion in Africa, Nat. Commun., 15, 835, https://doi.org/10.1038/s41467-024-44950-8, 2024.
Zhan, P., Zhu, W., and Li, N.: An automated rice mapping method based on flooding signals in synthetic aperture radar time series, Remote Sens. Environ., 252, 112112, https://doi.org/10.1016/j.rse.2020.112112, 2021.
Zhang, B., Liu, X., Liu, M., and Meng, Y.: Detection of Rice Phenological Variations under Heavy Metal Stress by Means of Blended Landsat and MODIS Image Time Series, Remote Sens., 11, 13, https://doi.org/10.3390/rs11010013, 2019.
Zhang, M., Wu, B., Zeng, H., He, G., Liu, C., Tao, S., Zhang, Q., Nabil, M., Tian, F., Bofana, J., Beyene, A. N., Elnashar, A., Yan, N., Wang, Z., and Liu, Y.: GCI30: a global dataset of 30 m cropping intensity using multisource remote sensing imagery, Earth Syst. Sci. Data, 13, 4799–4817, https://doi.org/10.5194/essd-13-4799-2021, 2021.
Zhang, W., Liu, H., Wu, W., Zhan, L., and Wei, J.: Mapping rice paddy based on machine learning with Sentinel-2 multi-temporal data: Model comparison and transferability, Remote Sens., 12, 1620, https://doi.org/10.3390/rs12101620, 2020.
Zhang, X., Shen, R., Zhu, X., Pan, B., Fu, Y., Zheng, Y., Chen, X., Peng, Q., and Yuan, W.: Sample-free automated mapping of double-season rice in China using Sentinel-1 SAR imagery, Front. Environ. Sci., 11, 1207882, https://doi.org/10.3389/fenvs.2023.1207882, 2023.
Zhu, A.-X., Zhao, F.-H., Pan, H.-B., and Liu, J.-Z.: Mapping rice paddy distribution using remote sensing by coupling deep learning with phenological characteristics, Remote Sens., 13, 1360, https://doi.org/10.3390/rs13071360, 2021.
Zoungrana, L. E., Barbouchi, M., Toukabri, W., Babasy, M. O., Khatra, N. B., Annabi, M., and Bahri, H.: Sentinel SAR-optical fusion for improving in-season wheat crop mapping at a large scale using machine learning and the Google Earth engine platform, Appl. Geomat., 16, 147–160, https://doi.org/10.1007/s12518-023-00545-4, 2024.