the Creative Commons Attribution 4.0 License.
the Creative Commons Attribution 4.0 License.
 | 28 Apr 2025
A new habitat map of the Lena Delta in Arctic Siberia based on field and remote sensing datasets
Alexandra Runge
Iuliia Shevtsova
Nele Landgraf
Anne Morgenstern
Ronald Reagan Okoth
Matthias Fuchs
Nikolay Lashchinskiy
Carl Stadie
Alison Beamish
Ulrike Herzschuh
Guido Grosse
The Lena Delta is the largest river delta in the Arctic (about 30 000 km2) and prone to rapid changes due to climate warming, associated cryosphere loss, and ecological shifts. The delta is characterized by ice-rich permafrost landscapes and consists of geologically and geomorphologically diverse terraces covered with tundra vegetation and of active floodplains, featuring approximately 6500 km of channels and over 30 000 lakes. Because of its broad landscape and habitat diversity, the delta is a biodiversity hotspot with high numbers of nesting and breeding migratory birds, fish, caribou, and other mammals and was designated a State Nature Reserve in 1995. Characterizing plant composition, aboveground biomass, and application of field spectroscopy was a major focus of a 2018 expedition to the delta. These field data collections were linked to Sentinel-2 satellite data to upscale local patterns in land cover and associated habitats to the entire delta. Here, we describe multiple field datasets collected in the Lena Delta during summer 2018 including foliage projective cover (Shevtsova et al., 2025, https://doi.org/10.1594/PANGAEA.935875), aboveground biomass (Shevtsova et al., 2023, https://doi.org/10.1594/PANGAEA.956067; Shevtsova et al., 2023, https://doi.org/10.1594/PANGAEA.935923), and hyperspectral field measurements (Runge et al., 2022, https://doi.org/10.1594/PANGAEA.945982). We further describe a detailed Sentinel-2 satellite image-based classification of habitats for the central Lena Delta (Landgraf et al., 2025a, https://doi.org/10.1594/PANGAEA.945057; Landgraf et al., 2025b, https://doi.org/10.1594/PANGAEA.945056; Landgraf et al., 2025c, https://doi.org/10.1594/PANGAEA.945055; Landgraf et al., 2025d, https://doi.org/10.1594/PANGAEA.945054), an upscaled classification for the entire Lena Delta (Lisovski et al., 2022, https://doi.org/10.1594/PANGAEA.946407), and the test data set for accuracy assessment (Heim et al., 2025, https://doi.org/10.5281/zenodo.14731823) and a synthesis product for disturbance regimes (Heim and Lisovski, 2023, https://doi.org/10.5281/zenodo.7575691) in the delta that is based on the classification, the described datasets, and field expertise. We present context and detailed methods of these openly available datasets and show how their combined use can improve our understanding of the rapidly changing Arctic tundra system. The new Lena Delta habitat classification represents a first baseline against which future observations can be compared. The link between such detailed habitat classifications and disturbance regime may provide a better understanding of how Arctic lowland landscapes will respond to climate change and how this will impact land surface processes.
- Article
(14621 KB) - Full-text XML
-
Supplement
(4242 KB) - BibTeX
- EndNote


Global warming has profound impacts on the polar regions (Serreze and Barry, 2011; Overland et al., 2019). Rapidly increasing temperatures and changing precipitation regimes result in declining sea ice, warming and thawing of permafrost, more frequent tundra fires, and changes in vegetation (e.g., Biskaborn et al., 2019; Hu et al., 2015; Mauclet et al., 2022; Box et al., 2019; AMAP, 2021). The Arctic tundra biome, which is normally characterized by harsh living conditions and nutrient deficiency, has experienced rapid phenological shifts, such as earlier green-up in spring, which is also associated with increasing shrubification rates (Mekonnen et al., 2021). Shifts in plant communities are also driven by changing nutrient availability in permafrost soils (Mekonnen et al., 2021; Mauclet et al., 2022), affecting the net primary productivity of tundra ecosystems.
Satellite-derived remote sensing can provide large-scale assessments of Arctic vegetation cover and changes therein (Bartsch et al., 2016). For example, the Circumpolar Arctic Vegetation Map (CAVM) project, from the Conservation of Arctic Flora and Fauna working group (CAFF), provided a first pan-Arctic vegetation composition map based on Advanced Very-High Resolution Radiometer (AVHRR) false-color infrared (CIR) composites at a 1 : 4 million map scale (Walker, 1998; Raynolds et al., 2019). Later, higher-resolution land cover maps became available across all spatial scales from national and international efforts such as the NASA Arctic-Boreal Vulnerability Experiment (ABoVE), providing open-source data collections from boreal and arctic regions (ABoVE Science Definition Team, 2014) specifically for Alaska, Canada, northern Europe, and western Siberia, providing a better bridge to field measurements. Such products greatly assist in monitoring and upscaling of patterns and dynamics of soil properties, land–atmosphere fluxes, ecosystem states, and changes therein (e.g., Walker, 1998; Beamish et al., 2020; Berner et al., 2020; Sweeney et al., 2022; Macander et al., 2022; Endsley et al., 2022). For selected eastern Siberian tundra regions, land cover maps have been produced (e.g., Veremeeva and Gubin, 2009; Bartsch et al., 2019; Schneider et al., 2009), including the Lena Delta (Bartsch et al., 2019; Schneider et al., 2009).
Arctic river deltas represent distinct and vulnerable geomorphological and ecological regions at the marine–terrestrial boundary. River deltas have been studied intensively to better understand land cover and vegetation compositions (Jorgenson, 2000; Schneider et al., 2009; Frost et al., 2020; Bartsch et al., 2020), carbon pools and fluxes (Bartlett et al., 1992; Schneider et al., 2009; Sachs et al., 2008; Rossger et al., 2022), and land cover change caused by climate change impacts (Jorgenson, 2000; Pisaric et al., 2011; Lantz et al., 2015; Nitze and Grosse, 2016; Vulis et al., 2021; Juhls et al., 2021). With diverse habitats, Arctic river deltas are biodiversity hotspots (Gilg et al., 2000), but at the same time they are prone to rapid changes (Walker, 1998; Overeem et al., 2022). Arctic deltas are affected by permafrost thaw (e.g., Pisaric et al., 2011; Nitze and Grosse, 2016; Vulis et al., 2021), sea ice loss (Overeem et al., 2022), and increased sediment transport and organic load during spring floods (Piliouras and Rowland, 2020; Juhls et al., 2021). Arctic river deltas are very dynamic systems, and high-resolution habitat information from these biodiversity hotspots is needed to assess and predict changes and implications of Arctic warming.
The Lena Delta is the largest Arctic river delta representing a typical lake-rich lowland permafrost landscape (Grigoriev, 1993). Over the past decades, the central Lena Delta has become a place of intensive international research. In addition to long-term permafrost monitoring at the Research Station Samoylov Island (Hubberten et al., 2006; Boike et al., 2019), extensive records on meteorology, soil, and ecosystem characteristics (Zibulski et al., 2016; Boike et al., 2019, 2008); hydrology (Fedorova et al., 2015); and greenhouse gas fluxes (Rossger et al., 2022; Holl et al., 2019) are available, setting an important benchmark for further assessments of changes in an Arctic river delta. During the summer season of 2018, an extensive field campaign to the Lena Delta led to an unprecedented number of field datasets, including vegetation cover recordings, aboveground biomass estimates, and spectral characterization of the different vegetation/land cover units. These in situ datasets provide improved thematic detail, allowing the development of habitat classifications. In 2009, Schneider et al. (2009) developed the first land cover classification map for the entire delta at 30 m spatial resolution based on Landsat-7 ETM+ satellite summer images from 2000 and 2001 to quantify delta-wide methane emissions. Sentinel-2 Multispectral Instrument (MSI) data from two orbiting satellite missions since 2016 and 2017 provide high-quality multispectral satellite data with a higher spatial resolution in the visible and near infrared wavelength of up to 10 m and of 20 m in the red edge and the short-wave infrared wavelength regions (Drusch et al., 2012; ESA, 2015). Together with the extensive ground observations from the Lena Delta in 2018, this enables an updated classification, using the higher-resolution Sentinel-2 images and improved thematic detail.
In the following study, field datasets as well as derived multispectral satellite images from the summer season 2018 for the Lena Delta were used to provide (1) an updated data-driven framework for plant communities and associated habitat classes in the Lena Delta, (2) a high-resolution habitat mapping product for the entire delta, and (3) a disturbance regime map linked to habitat classes. These datasets enhance our understanding of the Lena Delta system and will build a baseline and framework for future spatiotemporal analysis of more detailed processes and changes within this highly sensitive ecosystem.
The Lena Delta is located in northeastern Siberia's continuous permafrost zone between 72 and 74° N and from 123 to 130° E (Fig. 1). With an area of about 30 000 km2, it is the largest delta in the Arctic and one of the largest in the world (Walker, 1998; Schneider et al., 2009). It is surrounded by the Laptev Sea to the west, north, and east, and the Chekanovsky and Kharaulakh mountain ranges border it to the south. The delta is characterized by numerous river channels and more than 1500 islands with a diverse geologic history (Grigoriev, 1993). Morphologically, the delta can be divided into three distinct geomorphological main terraces (Grigoriev, 1993; Schwamborn et al., 2002). The first main terrace, which comprises the Holocene fluvial terraces and the active floodplains, is the youngest and most active part of the delta (Schwamborn et al., 2023) and covers most of the east–northeastern areas as well as the southern and southwesternmost parts This main terrace predominantly consists of ice wedge–polygonal tundra (Nitzbon et al., 2020) as well as barren and vegetated floodplain areas (e.g., Rossger et al., 2022). The second main terrace, located in the northwestern part, contains mostly sandy, comparably well-drained soils with low ground-ice content (Schwamborn et al., 2002; Ulrich et al., 2009). Large, mostly north-to-south-oriented lakes and depressions are abundant in this area (Morgenstern et al., 2008). The third and oldest main terrace consists mainly of remnants of a Late Pleistocene accumulation plain with ice- and organic-rich sediments (so-called yedoma deposits) and is characterized by polygonal tundra with large ice wedges, deep thermokarst lake basins, and thermo-erosional valleys (Morgenstern et al., 2011, 2021). The third terrace is found on islands in the southern delta region (Schirrmeister et al., 2003, 2011). Permafrost in the area has a thickness of about 500–600 m (Romanovskii and Hubberten, 2001). The active layer depth, i.e., the seasonally thawing upper soil layer, on the first terrace is usually in the range of 30 to 50 cm and 80 to 120 cm on the floodplains (Boike et al., 2019). The larger region is characterized by an Arctic continental climate with low mean annual air temperatures of −13 °C, a mean temperature in January of −32 °C, and a mean temperature in July of 6.5 °C. The mean annual precipitation is low and amounts to about 190 mm (World Weather Information Service).
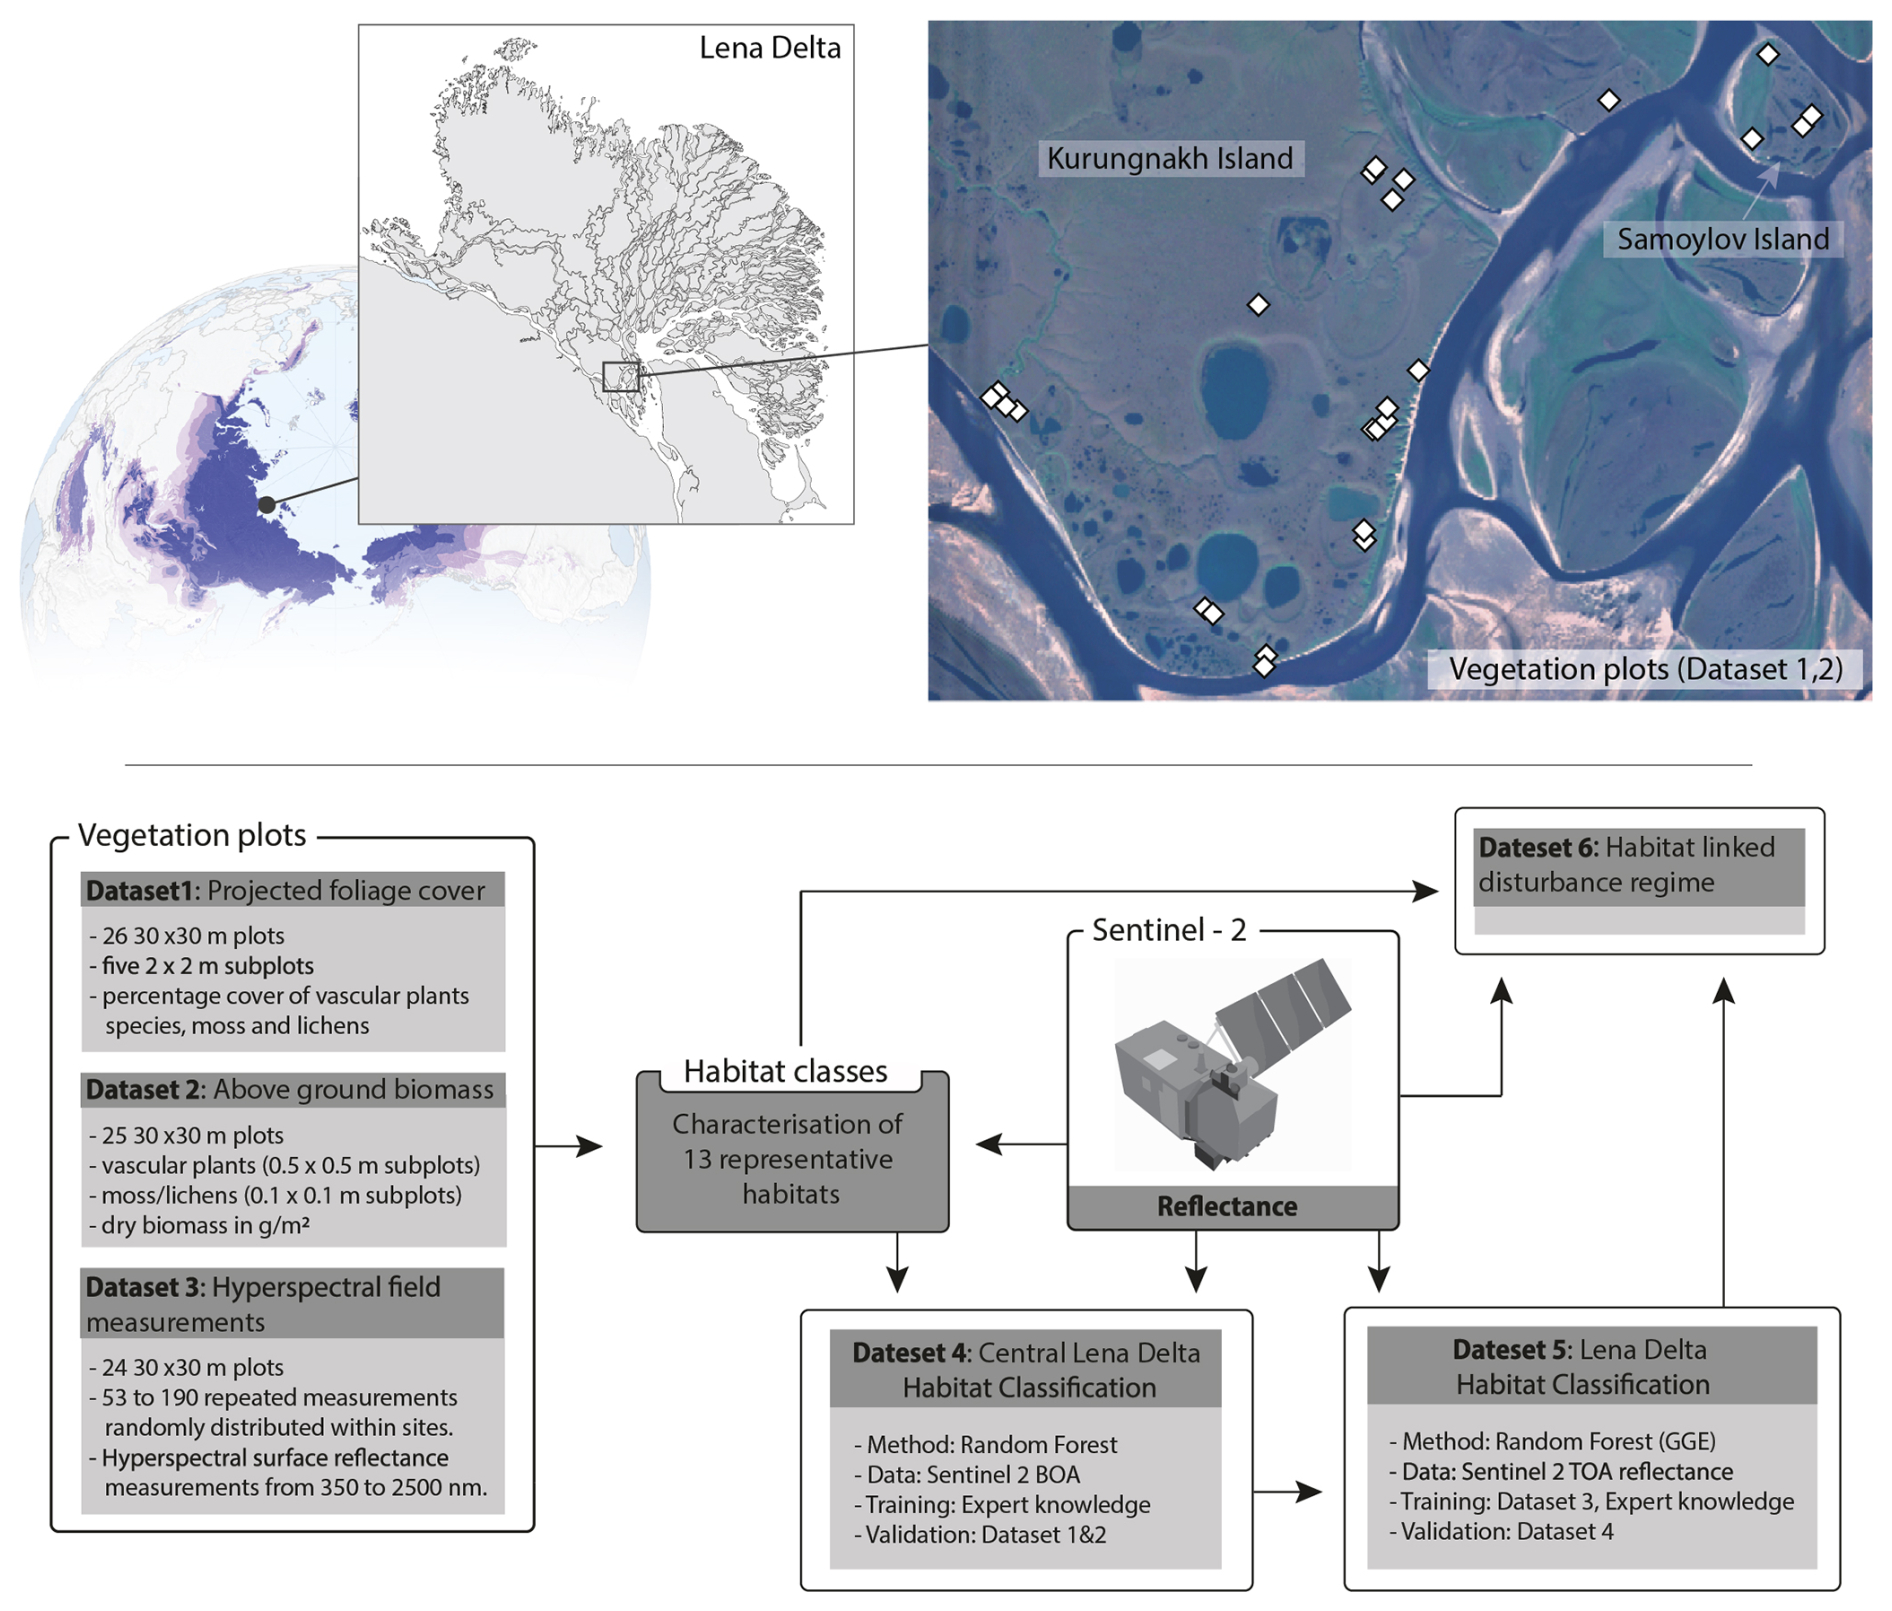
Figure 1Geographic location of the Lena Delta in the Russian High Arctic (72.91° N, 126.90° E) and a Sentinel-2 RGB image (August 2018, bands 4-3-2) of the central Lena Delta showing the areas of the 26 vegetation plots where foliage projective cover and aboveground biomass was determined. Pan-Arctic overview map shows permafrost extent; color scale indicates permafrost extent from continuous (dark purple) to isolated (light purple) (Obu et al., 2020). The gray-colored Lena Delta land map created with Sentinel-1 water mask from Juhls et al. (2021). Bottom: dataset characteristics and methodological links between the different datasets.
As part of past Russian–German expeditions to the Lena Delta, most research during the last 2 decades has been carried out on Samoylov and Kurungnakh islands in the central delta (Fig. 1). Samoylov Island (72°22′ N, 126°29′ E) covers an area of about 5 km2 and is representative of the first terrace together with an active floodplain (Boike et al., 2019, 2008). The vegetation and soil types are diverse at local scales due to high lateral variability of the polygonal microrelief consisting of drier polygon rims and moist to wet polygonal depressions and troughs (Nitzbon et al., 2020; Kienast and Tsherkasova, 2001). In contrast, Kurungnakh Island is mainly composed of Late Pleistocene yedoma deposits that belong to the third delta terrace (Grigoriev, 1993) with an elevation up to 55 m above sea level (m a.s.l.) (Morgenstern et al., 2013). Holocene cover deposits and peat-rich permafrost soils are distributed across the surface of the third Lena River terrace and especially concentrated in the deep thermokarst basins called “alases”. Alases are important landscape-forming features of the ice-rich yedoma permafrost zone, which are mainly caused by extensive melting of excess ground ice in the underlying permafrost (van Everdingen, 1998).
Several new datasets are presented for the Lena Delta that are spatially and thematically connected and support vegetation, habitat, and land cover applications for this region (Fig. 1).
Two datasets feature field-measured vegetation data, providing information on foliage projective cover (Dataset 1) and aboveground biomass (Dataset 2) recorded in the central Lena Delta in summer 2018 across 26 selected vegetation plot sites (Supplement, Tables S1, S2). The field plots of 30 × 30 m (900 m2) were chosen to be representative of typical vegetation communities (vascular plants, moss, and lichen cover) as largely homogenous sites representative of the surrounding area. In addition, a total of 28 in situ, canopy-level hyperspectral field measurements were acquired in 30 × 30 m plots with homogeneous vegetation or barren to partially vegetated areas (spectral reflectance field measurements; Dataset 3). Of the 28 hyperspectral measurements, 15 were conducted at the vegetation plot sites of Datasets 1 and 2; 3measurements were repeat measurements to capture vegetation senescence, and at 10 spectrometry plots we conducted hyperspectral field measurements without floristic inventories but with detailed plot documentation. Based on expert knowledge, we defined representative habitat classes and identified homogeneous regions within the central Lena Delta to train and apply a classifier using a Sentinel-2 satellite image from summer 2018 (Dataset 4). Due to the high reliability of the central Lena Delta vegetation classification and positive evaluation by field experts, we used this vegetation classification as a training dataset for a robust classifier that was subsequently applied to a Sentinel-2 image mosaic for the entire Lena Delta for 2018 to develop a new Lena Delta habitat map (Dataset 5).
Finally, using the habitat classes, probability maps for exposed sandbars and water distribution, and information from the in situ dataset (Datasets 1 and 2), we extrapolated a classification of disturbance regimes across the delta (Dataset 6) as an application example of the habitat classes.
3.1 Foliage projective cover (Dataset 1)
A detailed description of plant composition for the 26 vegetation plots of the 2018 expedition to the Lena Delta was compiled (see Supplement, Tables S1–S3). Prior to the fieldwork, the approximate site locations were defined for establishing representative vegetation plots based on field knowledge and evaluation of Landsat and Sentinel-2 satellite imagery. The aim was to cover representative vegetation communities of the central delta. There are vegetation communities with large area coverage that show high homogeneity within larger areas (tens of meters). Therefore, at each site location, we defined a 30 × 30 m square plot with a homogeneous or repetitive vegetation composition that was also representative of the wider land surface serving as an elementary sampling unit (ESU). ESUs according to the Committee on Earth Observing Satellites Working Group on Calibration and Validation (Duncanson et al., 2021) serve as spatial training and validation units representative of the land surface for quantitative and qualitative remote sensing operations. In the case of more patchy and heterogeneous vegetation structure, we selected 30 × 30 m squares embedded in a minimum of 50 × 50 m square of the same vegetation composition.
The detailed floristic composition was recorded around the plot center in four successive rings of 50 cm diameter. In addition, the vegetation plot was mapped in detail from above with one red–green–blue (RGB) and one red–green–near-infrared (RGNIR) MAPIR camera using telescope stick-based field photography. The projective vegetation cover was recorded in at least three subplots (2 m × 2 m) within the plot. If the vegetation cover was highly homogenous, three subplots were established. In the case of moisture differences, e.g., in polygonal tundra with dry rims and moist to wet depressions, we established higher numbers of subplots capturing moist as well as dry patches (see Figs. 2 and 3 describing the concept). We compiled the floristic composition to foliage projective cover by plant taxa on each 2 × 2 m subplot for the different canopy levels and extrapolated for the 30 m × 30 m plot. We used the RGB and NIR field photos to make an estimate on the share of moist and dry surface area to calculate an averaged projective vegetation cover. The ring survey data were not included in the plot average. The dataset of percentage foliage projective cover per vegetation plot is published in PANGAEA (Shevtsova et al., 2025, https://doi.org/10.1594/PANGAEA.935875).
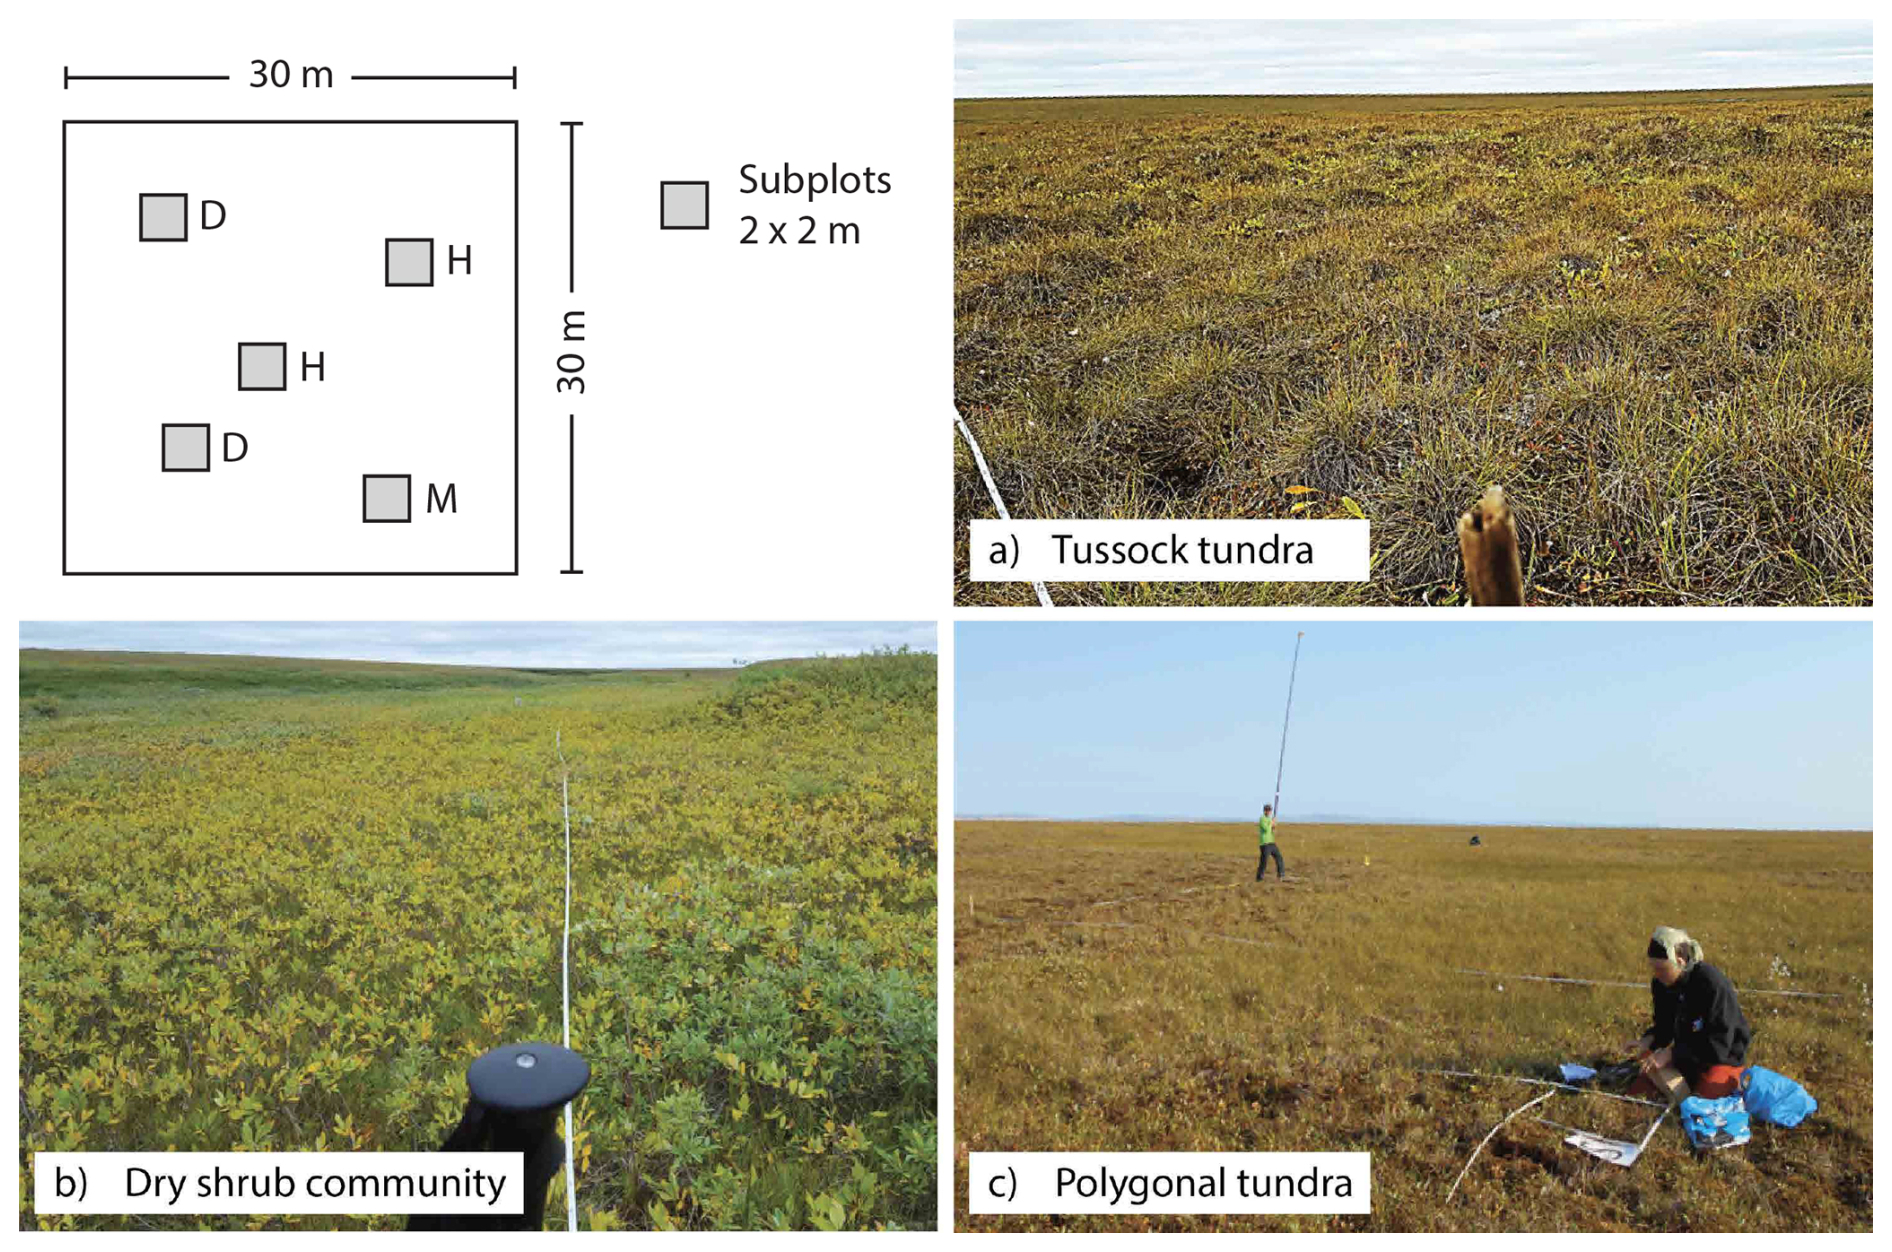
Figure 2Vegetation plots (30 × 30 m) were established in different vegetation types across the central Lena Delta. For subplots (2 × 2 m), the projective vegetation cover was recorded and labeled according to vegetation and moisture properties (H-type: homogeneous, M-type: moist, D-type: dry). Figures illustrate example plots in (a) tussock tundra (VP14), (b) dry shrub communities (VP05), and (c) polygonal tundra (VP13). Photos: AWI.
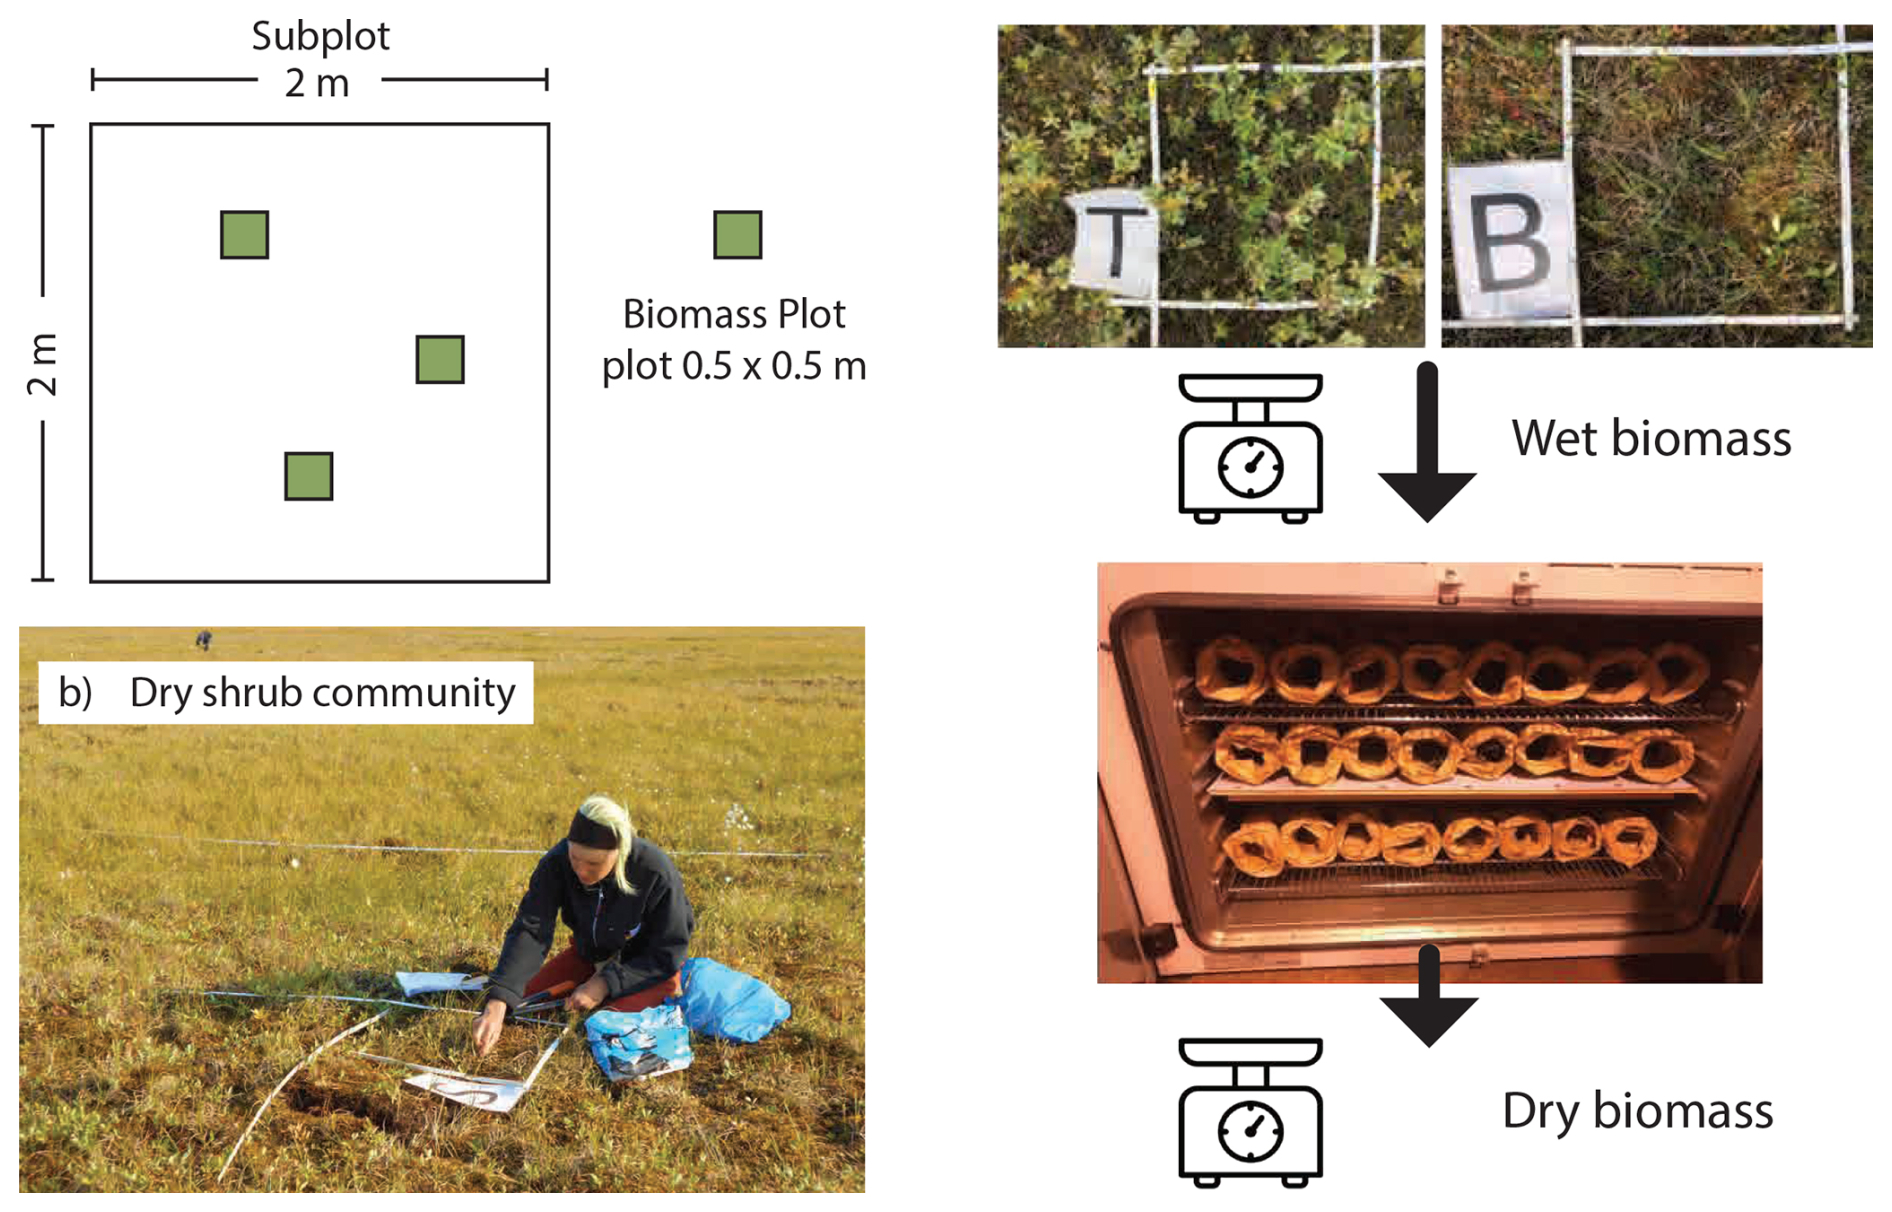
Figure 3Biomass was sampled in subplots of 0.5 × 0.5 m (and 0.1 × 0.1 m for moss and lichens) distributed within the 2 × 2 m subplots described in Fig. 2. Collected plants were weighted (wet biomass), dried in an oven, and again weighted (dry biomass). Photos: AWI.
3.2 Aboveground plant biomass (Dataset 2)
Aboveground biomass (ABG) was sampled in the field in 25 of the 26 vegetation plots in 2018 (see Tables S1–S3). Within each 2 × 2 m subplot, a 0.5 m × 0.5 m representative plot was selected for ABG sampling. ABG sampling for moss and lichens was conducted within 0.1 m × 0.1 m subplots inside the 0.5 m × 0.5 m subplots.
In total, 174 fresh ABG samples were collected and weighed in the field or subsequently at the Samoylov research station. ABG samples with a weight exceeding 15 g were subsampled. The plant samples were then dried for 2–4 d in a warm dry place and finally oven-dried for ca. 24 h at a temperature of 60 °C before re-weighing. All ABG assessments per plant community type were upscaled to the 30 m × 30 m plot in g m−2 using the foliage projective cover data. The dataset of ABG per vegetation plot has been published in PANGAEA (Shevtsova et al., 2024, https://doi.org/10.1594/PANGAEA.935923).
3.3 Hyperspectral field measurements (Dataset 3)
Hyperspectral field measurements were conducted in the central Lena Delta in August 2018 with the aim to collect surface reflectance spectra of different homogeneous land cover units across a variety of delta land surfaces and vegetation composition. In total, we collected 28 hyperspectral field measurements in homogeneous 30 × 30 m spectrometry plots (Table S5), with 15 of them equalling the vegetation plots across Samoylov and Kurungnakh islands (see Datasets 1 and 2 and Table S4), 3 as repeat measurements at the end of August to capture the change in spectral signature during senescence since the beginning of August, and the remaining 10 field-spectroscopy plots focusing on non-vegetated areas such as sandy parts of the floodplain. We conducted the field-spectroscopy measurements with a Spectral Evolution SR-2500 field spectrometer with a 1.5 m fiber optic cable. The instrument was calibrated to spectral radiance within a wavelength range of 350 to 2500 nm. Within the 30 × 30 m homogeneous spectrometry plots, we acquired about 100 individual measurements, randomly scattered across the plot. Before and after each survey we conducted reference measurements by measuring the back-reflected downwelling radiance from a Zenith Lite™ Diffuse Reflectance Target of 50 % reflectivity to normalize to surface reflectance percentages per wavelength. The averaged individual measurements of the reflectance of each spectrometry plot have been published in the PANGAEA data repository (Runge et al., 2022, https://doi.org/10.1594/PANGAEA.945982).
3.4 Central Lena Delta habitat classification (Dataset 4)
3.4.1 Habitat classes
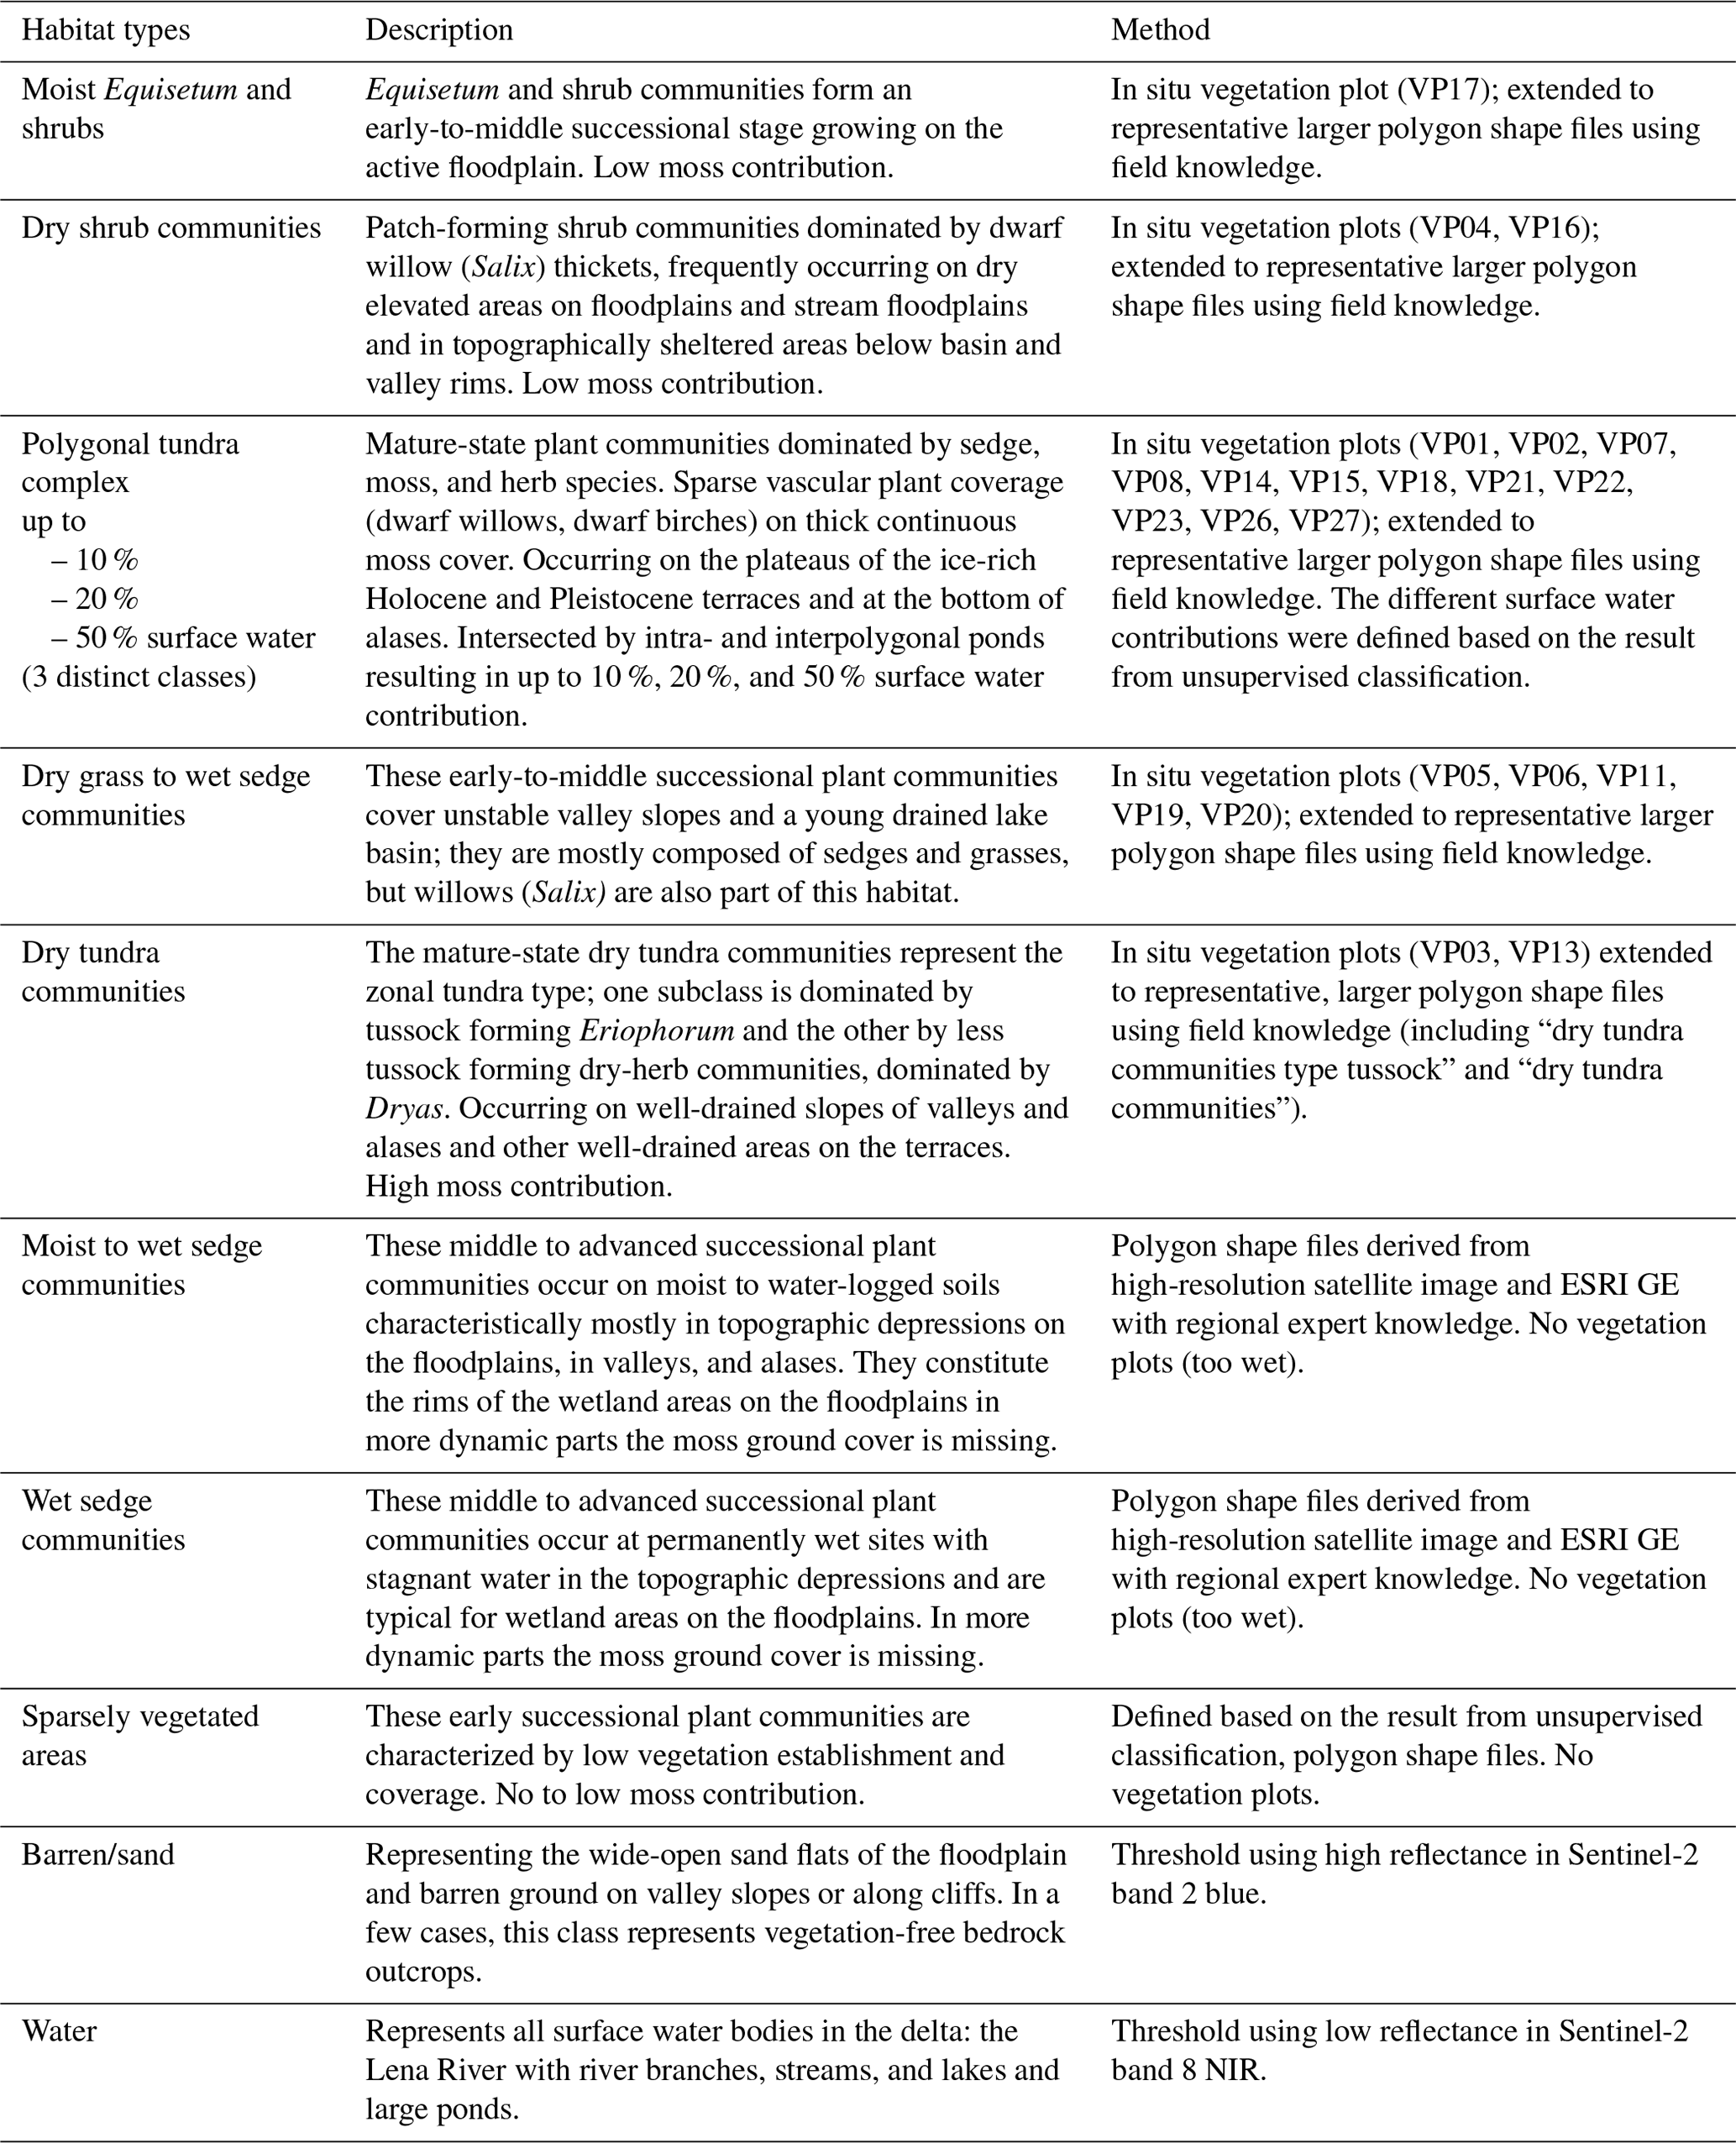
Based on the vegetation plots (Datasets 1 and 2) and from field knowledge, different habitat classes characterized by distinct plant communities, moisture regimes, and soil properties were defined. Non-vegetated areas (e.g., sand) and water were added as additional classes using band thresholds (Table 1). During an iterative process within a Sentinel-2-based supervised classification, additional habitat classes that were not covered by the vegetation plots (Datasets 1 and 2) were added. Firstly, the polygonal tundra complex could spectrally be separated into distinct classes related to different surface water abundance in the form of intra- and interpolygonal ponds. Therefore, we implemented three different polygonal tundra complex classes, with up to 10 %, 20 %, and 50 % surface water cover respectively. Secondly, one class of “sparsely vegetated” represents the areas of transition zones between vegetated and barren. Table 1 provides details on habitat class descriptions and established methods to distinguish habitats.
Table 1Habitat classes, descriptions, and methods used to characterize the distinct habitats. In situ vegetation plot numbers correspond to the vegetation plots of Datasets 1 and 2 (see also Tables S1, S2, S3).
3.4.2 Satellite data processing
The central Lena Delta habitat classification is based on one high-quality cloudless Sentinel-2 image from 6 August 2018, representing the late summer. The Sentinel-2 top-of-atmosphere (TOA) reflectance image data were processed by the German Space Agency (DLR, Bringfried Pflug, personal communication, 2019) to bottom-of-atmosphere (BOA) surface reflectance using the newest version of the atmospheric correction processor Sen2Cor, later released as ESA Sen2Cor in 2020. Atmospheric correction processing was performed with the default rural aerosol model. All spectral bands were resampled to the 10 m pixel resolution bands. The 60 m pixel resolution bands (B1, B9, B10) that support atmospheric correction, but are not optimal for land surface classification, were removed. We added the normalized difference vegetation index (NDVI; NIR–RED/NIR + RED) to the band collection.
3.4.3 Central delta habitat classification
Sentinel-2 pixels from the 30 × 30 m ESUs (Dataset 1; Shevtsova et al., 2025) and additional polygonal shapefiles (Fig. A3 in the Appendix) defined by expert knowledge led to a training dataset of 8626 labeled pixels for the habitat classification (labeled pixels are published in the Landgraf et al., 2022a, data collection). An independent test dataset of polygonal shapefiles with habitat annotation was delineated based on high-resolution satellite and drone images, S-2 NDVI and SWIR bands, and in areas that have been visited regularly during field expeditions (Fig. A4).
From the training dataset we randomly selected 4313 pixels to train the classifier. We tested several classifiers and different selected band combinations (spectral bands and NDVI). Water (transparent to turbid) and sandbanks were omitted in the classification processing by masking them as inactive using a band threshold; the water mask was based on the NIR 10 m band 8 (NIR < 0.02), and the sand mask was based on the blue 10 m band 2 (blue > 0.07; Table 1). The classification was tuned to depict vegetation composition and was qualitatively assessed well known to the classification developers. Best results for the habitat classification were obtained using a random forest classification with a band combination of all Sentinel-2 VIS, red edge, NIR, and SWIR bands and the NDVI. The chosen classifier was able to distinguish between relevant classes (Table 1) and could even identify patchy spots of specific habitat classes. In addition to the defined water and sand classes, the final central Lena Delta classification contains 10 habitat classes (Table 1). The here defined central Lena Delta covers an area of 644.9 km2 with a 55.2 % vegetation cover.
To assess the classification performance, we applied a cross-validation on a random selection of locations within the independent test dataset and used landscape descriptions at permafrost coring sites (Siewert et al., 2016a, b, c) (Fig. S6). We used 34 locations that we could relate to categories such as polygonal tundra, wetlands, and sandy areas. These broad land cover categories matched well (Table S8). For the evaluation, 100 random points per pre-defined habitat class were selected from the test dataset. Based on a confusion matrix, the overall classification accuracy was 94.00 % (class-based accuracy and statistics shown in Table A1 in the Appendix). More importantly, the accuracy was qualitatively tuned and evaluated based on ground-truthed knowledge of the development team. The published dataset of Landgraf et al. (2025, https://doi.pangaea.de/10.1594/PANGAEA.945057) provides the central Lena Delta habitat classification map, the ESUs, and the polygons used to train the classifier. The training dataset includes data from 23 of the 26 vegetation plots (Dataset 1). The dataset provides additional 69 ESUs defined with expert knowledge gathered during several field expeditions to the Lena Delta, labeled as pseudo-ESUs for potential future investigations.
3.5 Lena Delta habitat classification (Dataset 5)
3.5.1 Lena Delta habitat classes
In order to extend the habitat classification map to the entire Lena Delta (29 873.7 km2), we included all the habitat classes covering the central Lena Delta (Dataset 4; Table 1). In addition, and based on expert knowledge as well as extensive visual satellite image investigations, we added one habitat class that is not present in the central Lena Delta: the second terrace in the northwest of the Lena Delta is lithologically and geomorphologically different from the other two terraces present in the central delta and characterized by sandy substrates. In a hyperspectral CHRIS PROBA satellite-based geomorphological classification, Ulrich et al. (2009) described the second terrace featuring very dry elevated sandbanks, barren, or poorly vegetated areas with isolated lichens, moss, herbs, dwarf shrubs, or grasses (vegetation cover 0 %–60 %, growth height: max. 20 cm, average active layer depth of 1 m on the upland plain with old, vegetation-arrested sand dunes). Based on photos taken at few locations in the field during past expeditions (see Table S3), the habitat class shows well-drained areas dominated by sandy substrate and diverse, sparse vegetation cover; some areas are dominated by sedges, cotton grass, and mosses with rare occurrences of lichens and dwarf shrubs, while some areas are dominated by the latter. Schneider et al. (2009) defined the same class as “dry moss-, sedge- and dwarf-shrub-dominated tundra (DMSD)”. We selected 35 ESUs for this habitat class characterized by high SWIR reflectance (Sentinel-2 band 11) due to dry land surface conditions. The habitat class was named “dwarf shrub–herb communities” and was added as an additional habitat class to the training dataset.
3.5.2 Satellite data processing
The Lena Delta habitat classification was based on a Sentinel-2 mosaic (top-of-atmosphere (TOA) reflectance; Google Earth Engine Dataset) with images taken of the area between 1 June and 15 September 2018. The images (N=1685, distributed across 15 Sentinel-2 tiles) were filtered to discard images with cloud cover above 20 %. A cloud mask was applied to the remaining 262 images, masking pixels where the quality band “QA60” indicates clouds (band 10) or cirrus (band 11). All spectral bands with 20 m resolution were resampled to match the 10 m resolution bands. Next, NDVI was computed (see Sect. 3.4) for each image, and one high-quality mosaic of all images based on the maximum NDVI value per pixel was produced, representing a snapshot of the peak summer vegetation period. Using the median NIR band values across the 262 cloud-masked images, we classified water with a threshold of <0.07 reflectance. The remaining non-vegetated areas defined by a threshold of NDVI < 0.4 were classified as barren/sand. The water- and sand-masked image mosaics were then used in the classification pipeline with the following bands: B2 (blue), B3 (green), B4 (red), B5 (red edge 1), B6 (red edge 2), B7 (red edge 3), B8 (NIR), B11 (SWIR 1), B12 (SWIR 2), and NDVI.
3.5.3 Lena Delta habitat classification
From the central Lena Delta habitat classification (Dataset 4), we sampled 7500 random pixels to train a random forest classifier (smileRandomForest in Google Earth Engine). In addition, we added 35 pixels from the ESUs selected within the “dwarf shrub–herb communities” of the northwestern Lena Delta. Given the dominance of the “dwarf shrub–herb communities” on the second terrace (northeastern part of the Lena Delta), the confidence of selecting correct training pixels for this habitat was relatively high (see also Fig. S7). Unfortunately, no vegetation recording or monitoring schemes exist outside the central Lena Delta. The accuracy of the classification was quantified using the independently defined shapefiles within the central Lena Delta (same dataset used to quantify the accuracy of the central Lena Delta habitat classification; Fig. A4 and Table S1). Based on a confusion matrix, the overall classification accuracy was 85.06 % (class-based accuracy and statistics shown in Table A2). Similar to the validation of the central Lena Delta habitat classification, the results were carefully checked to make sure that large-scale patterns, e.g., differences between the three terraces, are accurately separated and that the highly repetitive structures within terraces are also recognized by the classification (see Figs. S6–S8).
Since the barren/sandy areas are highly dynamic with variable water levels mainly within (due to flooding in spring and decreasing river flow during the summer season) but also across years (discharge dynamics), we computed a sandbar probability map for the Lena Delta using cloud masked Sentinel-2 (TOA reflectance) images between 1 April and 15 October from 2015 to 2021 (6026 images). In each image, we labeled sandy pixels when they fulfilled the following threshold requirements: NDVI < 0.4 and NDWI > 0.095 (normalized difference water index) and NIR < 0.09 reflectance. Next, for each pixel in the Lena Delta, we computed the percentage of sandy pixels across all images, resulting in a sand probability map. The training dataset (random 7500 points, plus 35 points with label “dwarf shrubs–herb communities”), the habitat classification, and the sand probability map was published in the PANGAEA repository (Fig. 5; Lisovski et al., 2022, https://doi.org/10.1594/PANGAEA.946407).
3.6 Lena Delta disturbance regimes (Dataset 6)
The Lena Delta experiences different disturbance regimes, mapped and described in Dataset 6. Mainly annual flooding and local rapid thaw processes on the land surface of the terraces with ice-rich permafrost result in disturbance regimes forming distinct habitat classes (Table 2). The floodplains experience seasonal flooding as a regularly occurring disturbance in spring after ice breakup (the spring flood). Very high disturbance regimes due to the most intense scour, erosion, and sedimentation result in barren sandbanks or in early-stage plant communities equalling the “sparsely vegetated” habitat class. The classes “moist to wet sedge communities”, “wet sedge communities”, “moist Equisetum and shrubs”, “dry shrub communities”, and “dry grass to wet sedge communities” represent the middle to advanced successional stages on the floodplain within areas of high disturbance that are also described as shifting habitat class (Stanford et al., 2005; Driscoll and Hauer, 2019).
Table 2Habitat class and description of disturbance regimes and the component stand structure in the form of contributions of vascular plants and moss to total biomass.
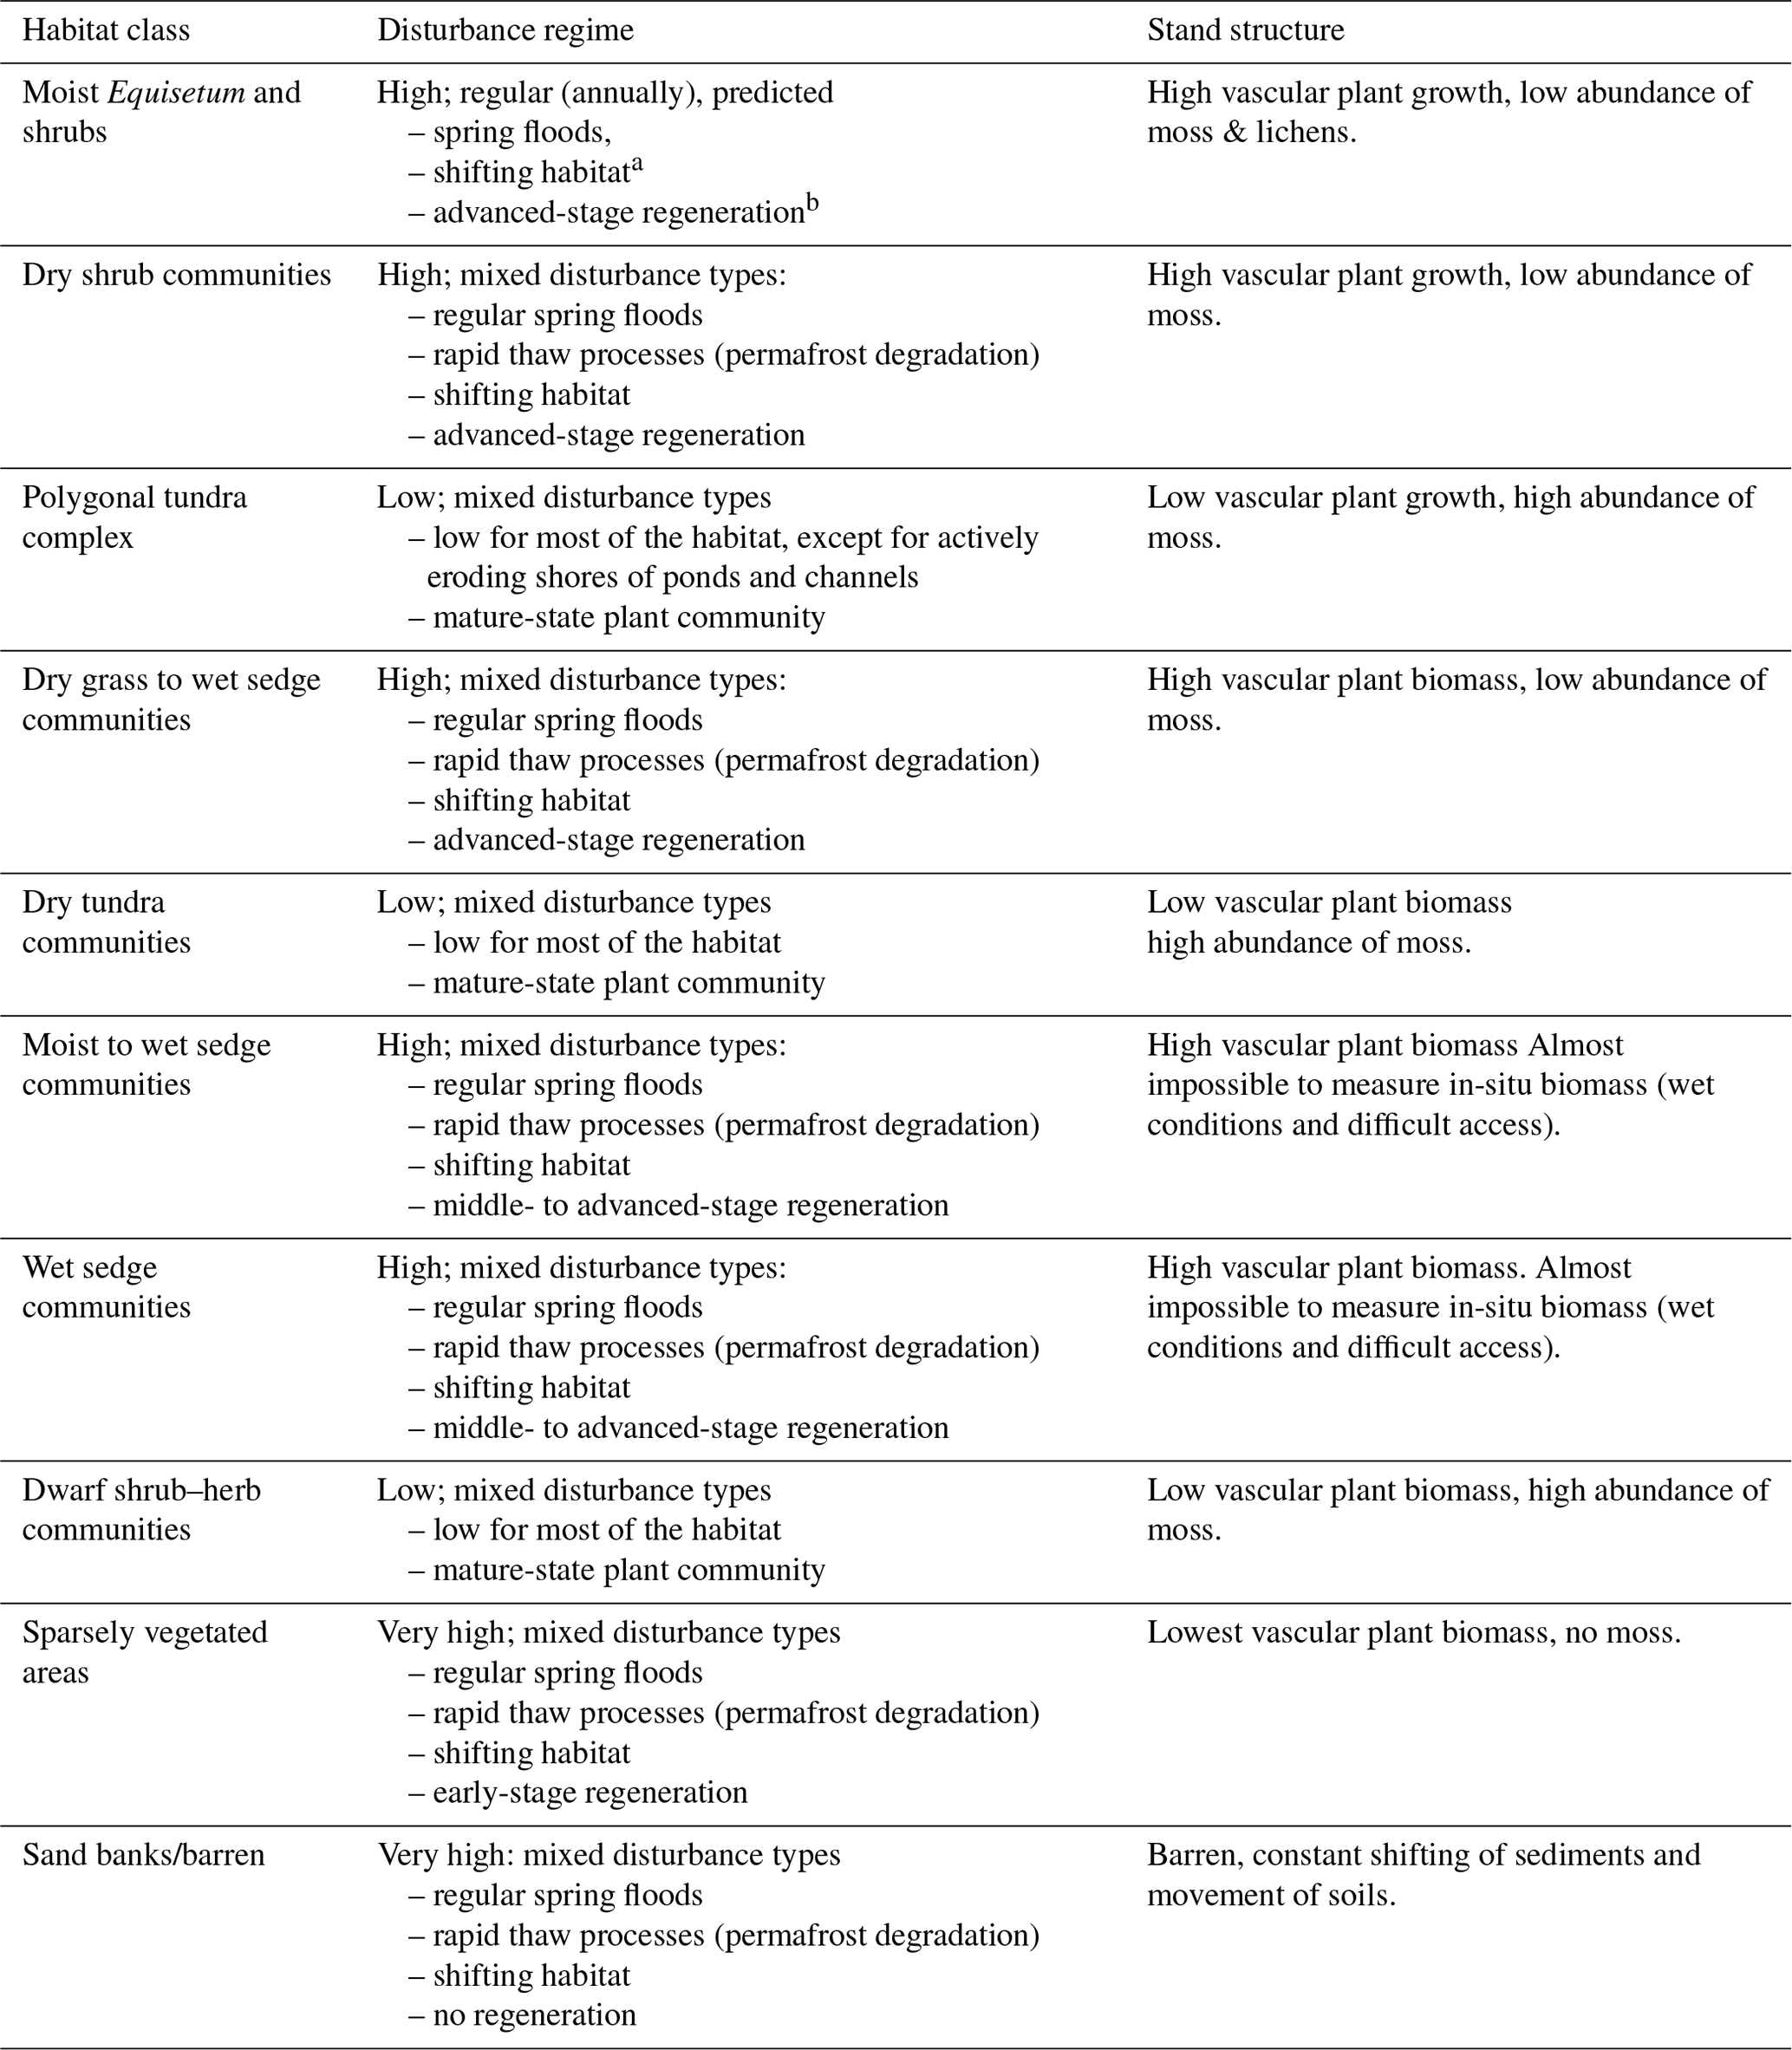
a Driscoll and Hauer (2019) and Stanford et al. (2005). b Lorang and Hauer (2006).
In contrast to the high-disturbance regimes on the floodplain, habitats on the first, second, and third delta terraces are less extensively disturbed (low disturbance). In these areas typical mature-state tundra plant communities are able to develop: “polygonal tundra complex”, “tussock tundra”, and “dwarf shrub–herb communities”. However, locally, high disturbance occurs through rapid thaw processes of ice-rich permafrost on the first and third delta terraces with habitats characterized by middle- to advanced-stage plant succession: “moist to wet sedge communities”, “wet sedge communities”, “dry shrub communities”, and “dry grass to wet sedge” communities. Very high disturbance due to intense rapid thaw processes occurs at eroding cliffs and lake margins, in steep valleys, and in actively developing gullies resulting in barren surfaces with rims of sparsely vegetated transition zones. Given the link between plant communities and flooding as well as rapid thaw processes, we characterized the disturbance regimes for each habitat class (Table 2) and provide mapped disturbance based on the habitat class of Dataset 5 and the corresponding disturbance regime for the entire Lena Delta (Fig. 6, Heim and Lisovski, 2023, https://doi.org/10.5281/zenodo.7575691).
We deliver a detailed description and associated data products of the most prominent habitat classes in the largest Arctic river delta: the Lena Delta. Supported by ecological field data of plant composition, hyperspectral field measurements from the same sites, and regional expert knowledge collected over decades, we develop a high-resolution Sentinel-2-based habitat map for the entire delta. The compiled datasets provide the necessary baseline for future investigations of the biochemical processes, ecological dynamics, and responses to global warming within the Arctic tundra system of the delta.
4.1 Habitat classes of the Lena Delta
Based on the floristic composition and biomass of the vegetation plots (Datasets 1, 2), the spectral properties from hyperspectral field measurements (Dataset 3) as well as expert knowledge, we defined 11 distinct habitat classes linked to different vegetation composition for the Lena Delta (Fig. 4). The selected Sentinel-2 spectral bands and the derived NDVI values allow a separation of the habitat classes into two distinct groups (the first separation level between habitat classes in Fig. 4a, 1st hierarchical level). Three habitat classes (“wet sedge communities”, “moist Equisetum and shrub communities”, and “dry grass to wet sedge communities”) formed in areas of high disturbance by rapid thaw processes and regular flooding that represent a distinct cluster with highest vegetation vitality (high NDVI). In contrast to this, the more stable and mature tundra communities (“polygonal tundra complex”, “dry (tussock) tundra”, and “dry dwarf shrub and herb communities”), and the other successional plant communities (“moist to wet sedge complex”, “dry low shrub communities”, and “sparsely vegetated”) are characterized by a lower NDVI range. The “dry dwarf shrub and herb communities” form a separate cluster with the least overlap with other habitat classes within the two-dimensional non-metric multidimensional scaling (NMDS) space (second hierarchical level; Figs. 3a; 4c) due to very low vegetation vitality and surface moisture (lowest NDVI, high red and SWIR reflectance). There are two remaining habitat classes on the third and fourth hierarchical level, which are successional plant communities, the “moist to wet sedge complex” and “dry low shrub communities”. The separation on the third and fourth hierarchical level is mainly driven by the higher NDVI of these successional plant community classes in comparison with the mature-state tundra plant communities with lower NDVI (Fig. 4a–b). The “dry grass to wet sedge communities” and the “sparsely vegetated area” habitat class (not covered by vegetation plots but added during the classification process) show the largest overlap with the other habitat classes due to a high variability in vegetation cover, biomass, and moisture. In general, the ordination method (Fig. 4b) shows that distinct plant communities and the associated habitat classes are mostly separated by a biomass gradient for which the NDVI is a good approximator. A further separation linked to potential spectral proxies for biomass exists with the far red edge and NIR bands (B6, 7, 8) but is less distinct than the NDVI axis. Together with the SWIR (B11, 12), the red (B4), and near red-edge (B5) bands and less strongly the blue and green bands (B2, 3), the results indicate a habitat class separation based on moisture, biomass, and vegetation color characteristics.
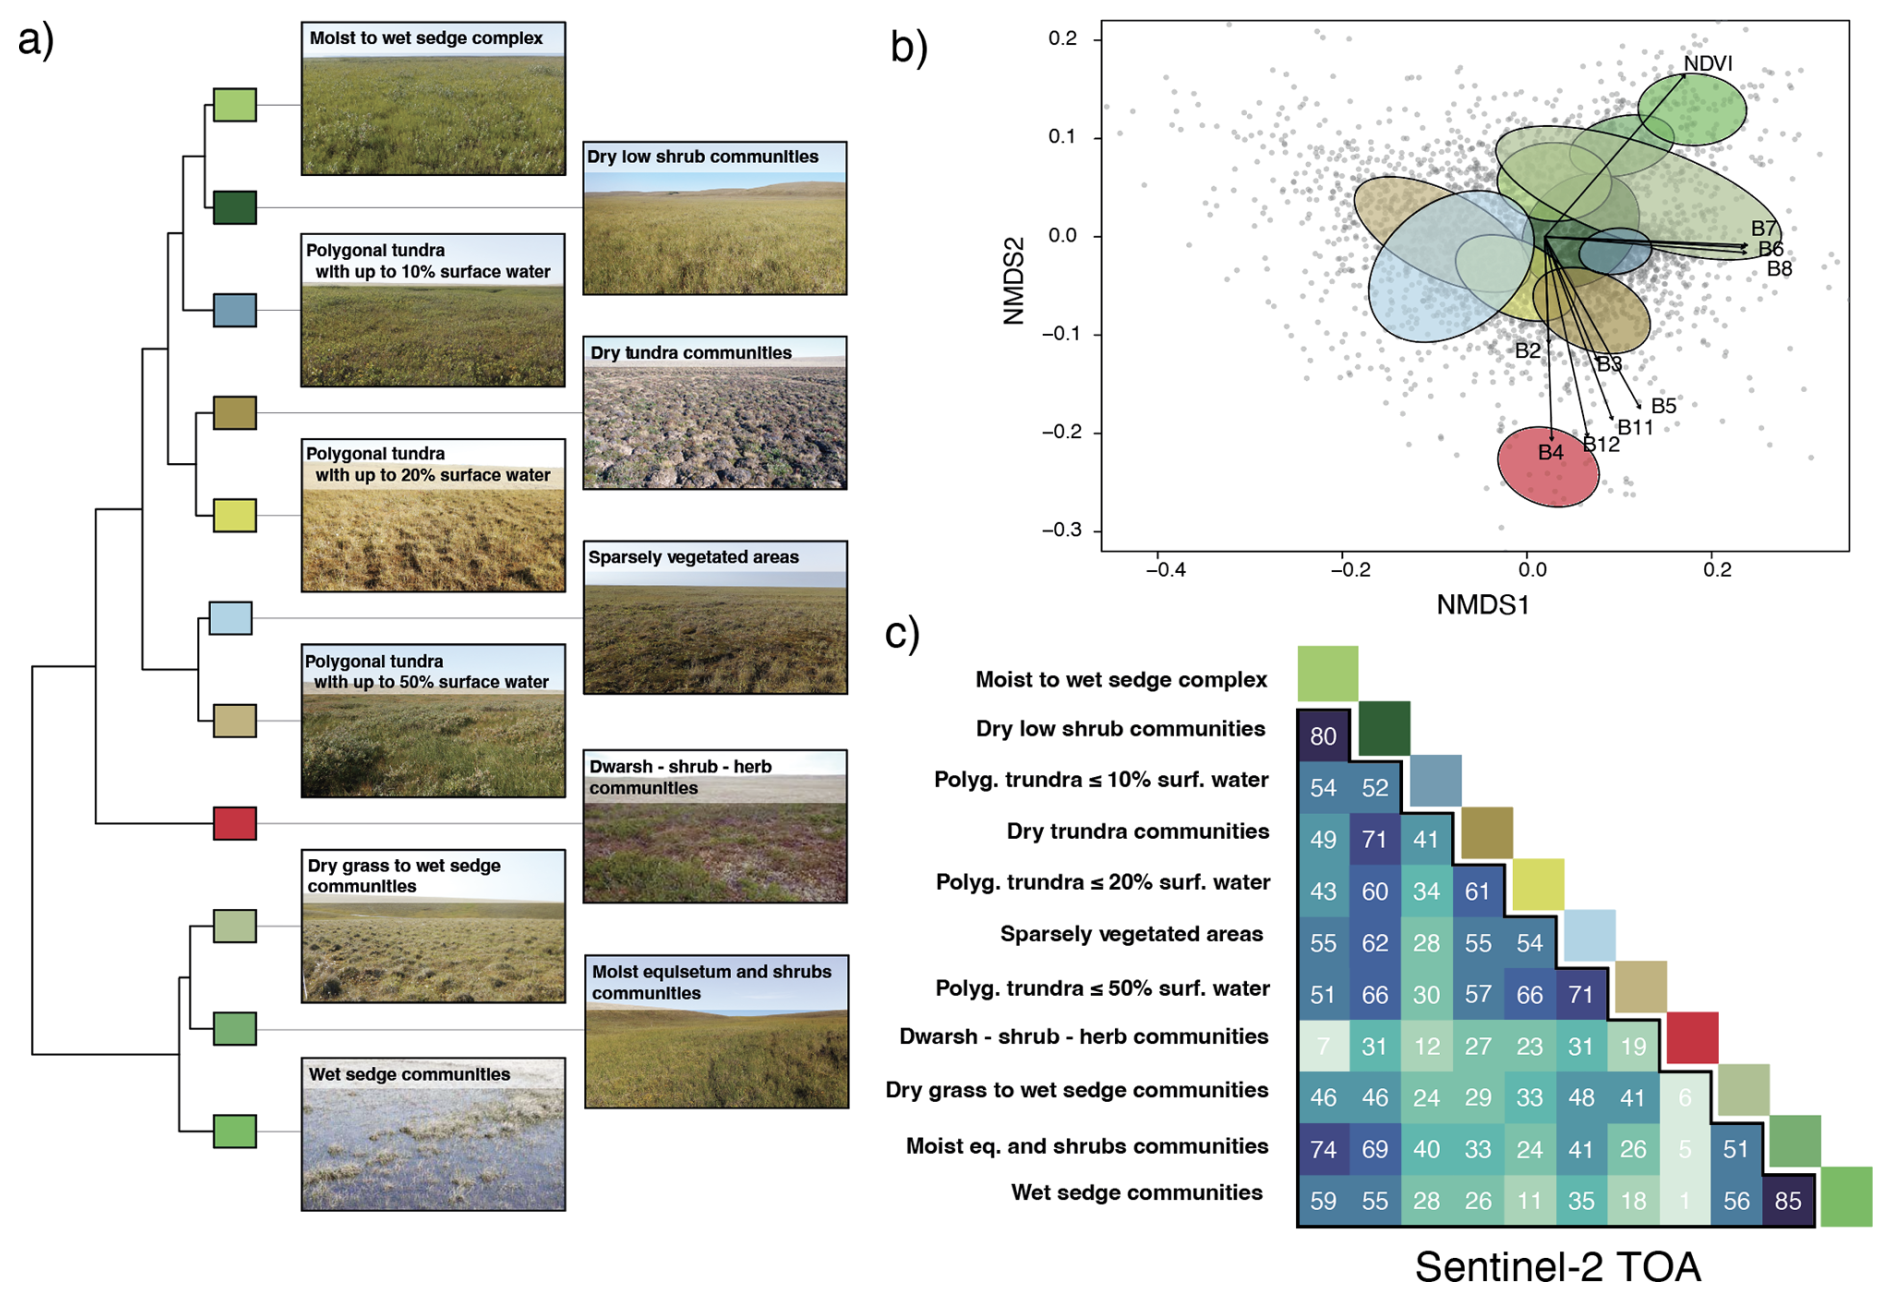
Figure 4Similarity in habitat classes based on Sentinel-2 spectral reflectance and NDVI values. The dendrogram in (a) indicates the multidimensional hierarchical similarity of the classes based on Sentinel-2 top-of-atmosphere reflectance (bands 2–8, 10–12, and NDVI). Panel (b) shows the location of the habitat classes within a two-dimensional NMDS space. The arrows with the Sentinel-2 bands and NDVI indicate the correlation of these variables across the two axes. The lower matrix of (c) depicts the calculated percentage overlap of 3500 pixels (gray dots in b) across the two NMDS axes of (b). Photos: AWI.
The vegetation plot selection was made in relation to the most typical habitats (e.g., Mueller-Bombois and Ellenberg, 1974). For 15 of the 26 vegetation plots, we collected and provided hyperspectral surface reflectance data (Runge et al., 2022). These measurements cover a variety of landscape units including yedoma uplands, floodplains (vegetated and non-vegetated), drained thermokarst lake basins (old and recently drained), and areas covered by low shrub layers. Comparing the hyperspectral surface reflectance with multispectral Sentinel-2 data, we found commonalities in the discrimination of habitat classes along moisture gradients. Unfortunately, the hyperspectral field measurements do not cover the biomass gradient. Plot measurements with the field spectrometer are conducted with the hand-held instrument held at shoulder height. Hence, it was not possible to acquire field spectroscopy measurements in disturbed patches with tall shrubs or very sloped terrain. This highlights the difficulty in deriving high-spectral-resolution surface reflectance measurements representative of fine-scale differences between Arctic tundra habitat classes if the plot properties become too challenging to measure.
In general, mature-state tundra plant communities have relatively similar spectral properties due to low vascular plant cover (e.g., Beamish et al., 2017). In addition, the tundra vegetation communities contain a wide range of accessory pigment composition (carotenoids and anthocyanins) that result in a very similar spectral response (Beamish et al., 2018). Only the highly disturbed communities such as wetlands or areas with tall shrubs are more spectrally distinct due to a high-NIR-reflectance plateau (Buchhorn et al., 2013). Since the hyperspectral field measurements provide a higher spatial resolution and thus also a measure of variability within areas of the same general habitat type, we consider the measurements valuable for applications that aim at analyzing ecological and biochemical processes within distinct habitats in more detail.
4.2 Sentinel-2-based habitat classification
Based on the identified habitat classes (Table 1), we applied a random forest classifier to map habitat classes in the central Lena Delta and subsequently in the entire Lena Delta. Both maps represent the summer season of 2018 for which we could use a sufficient number of satellite images with low cloud cover.
The Lena Delta habitat map shows the ice-rich first and third terraces mainly covered by (i) the “polygonal tundra complex” due to impeded drainage on the terrace plateaus and by (ii) drier tundra communities on well-drained areas due to older degraded permafrost forms (detailed description in Morgenstern et al., 2008, 2011). On the second terrace, the classified “dry dwarf shrub and herb communities” occur well separated from the moist habitat classes covering the floor of the alases. On the floodplains, the rich mosaic outlines a wide spectrum of very diverse classes, the dry versus moist and wet substrate habitats, in the active delta area.
Polygonal tundra is characterized by high spatial heterogeneity; at the decimeter to meter-scale plant composition and diversity is defined by the polygonal microrelief and water level (Whitaker and Woodwell, 1968; Forman and Godron, 1981; Zibulski et al., 2016; Nitzbon et al., 2020; Siewert and Olofsson, 2021). Therefore, within a single Sentinel-2 pixel, dry polygonal rims, moist slopes, wet patches, and surface water can all be present. The spatial resolution of Sentinel-2 cannot capture the meter scale but captures the heterogeneity between the different surface water contributions of the “polygonal tundra complex” on the first and third terrace. In the Lena Delta, the “polygonal tundra complex with up to 50 % surface water” represents the dominant habitat class with 25 % of the delta area (about 7434 km2). All other habitat classes represent 1 %–6 % of the delta area with “dwarf shrub–herb communities” and “moist to wet sedge complex” reaching 5.4 % and 5.9 %, respectively (Fig. 6). Based on the summer Sentinel-2 mosaic, the classes “water” and “sand” cover more than 40 % of the delta. However, those two classes are extremely variable within and across years, depending on the river water level during image acquisition time. To provide information on this variability, we calculated how often each pixel in the delta (cloud free Sentinel-2 pixels from 2015 to 2022) was classified as sand (threshold approach). This led to an additional sand probability layer with values between 0 %–100 %.
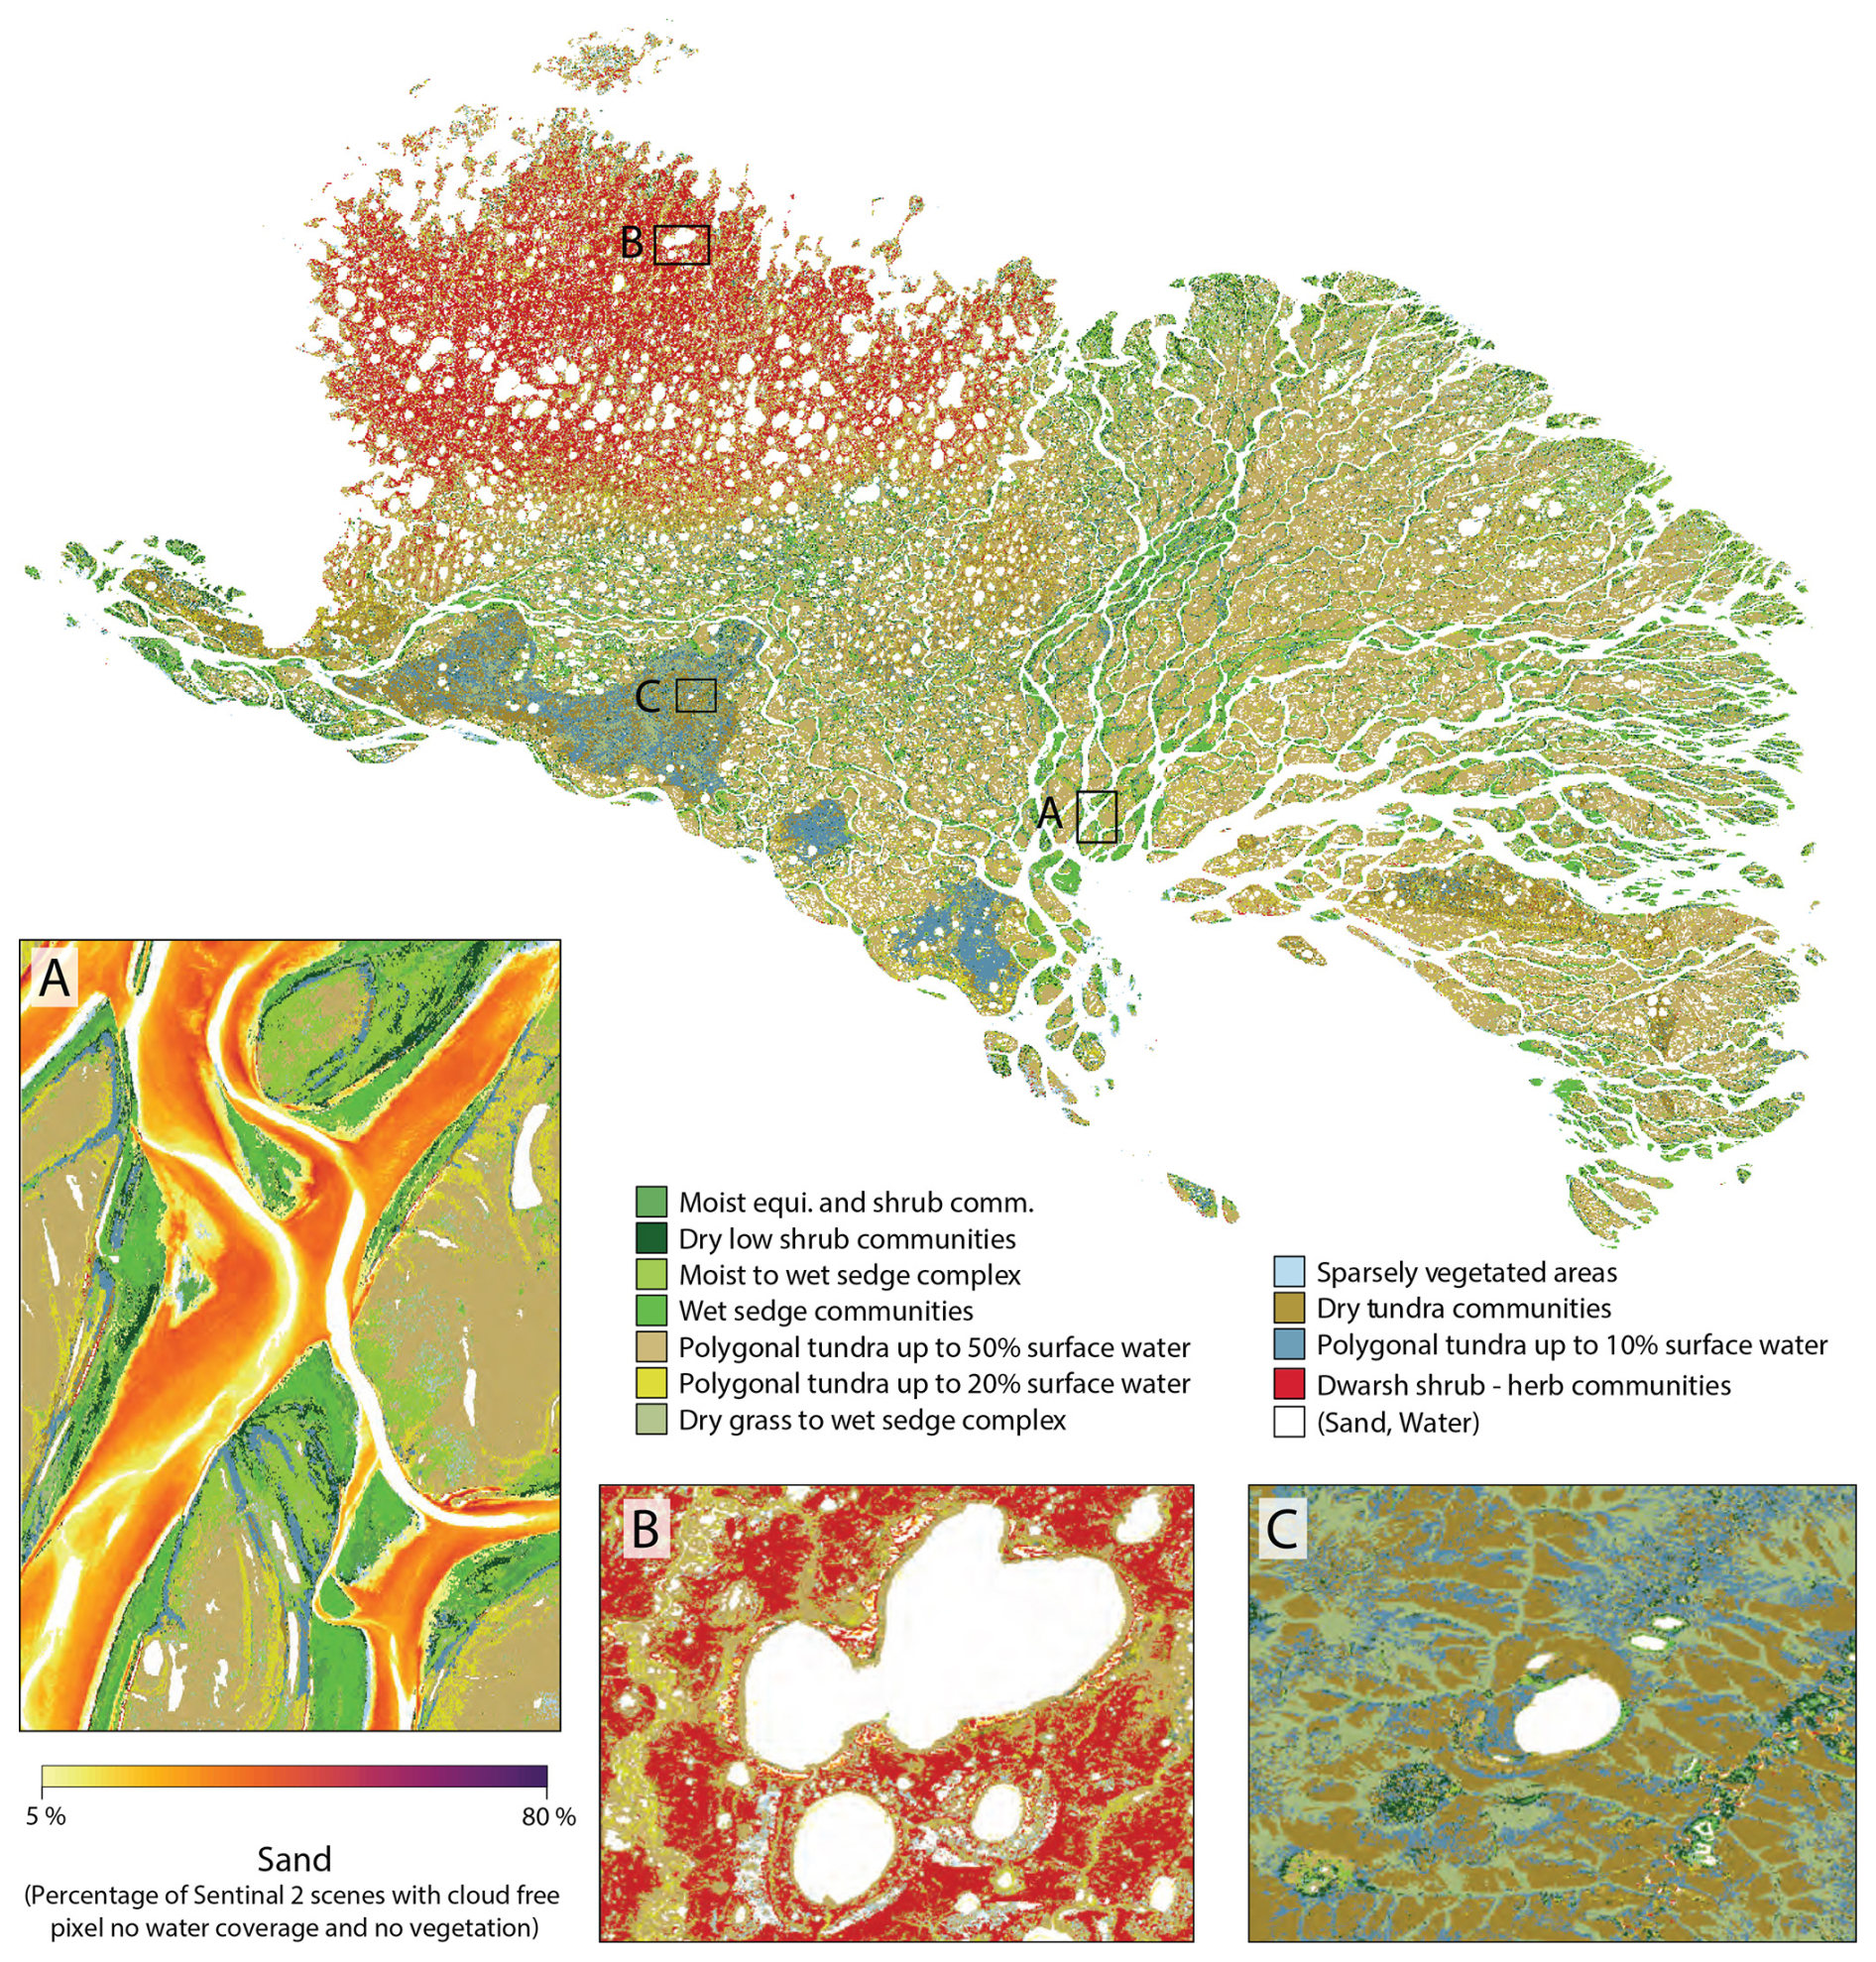
Figure 5Lena Delta habitat classes (Dataset 5). The entire Lena Delta on the left with three regional examples, showing (a) the seasonal sand probability and (b, c) regional examples of the habitat classes.
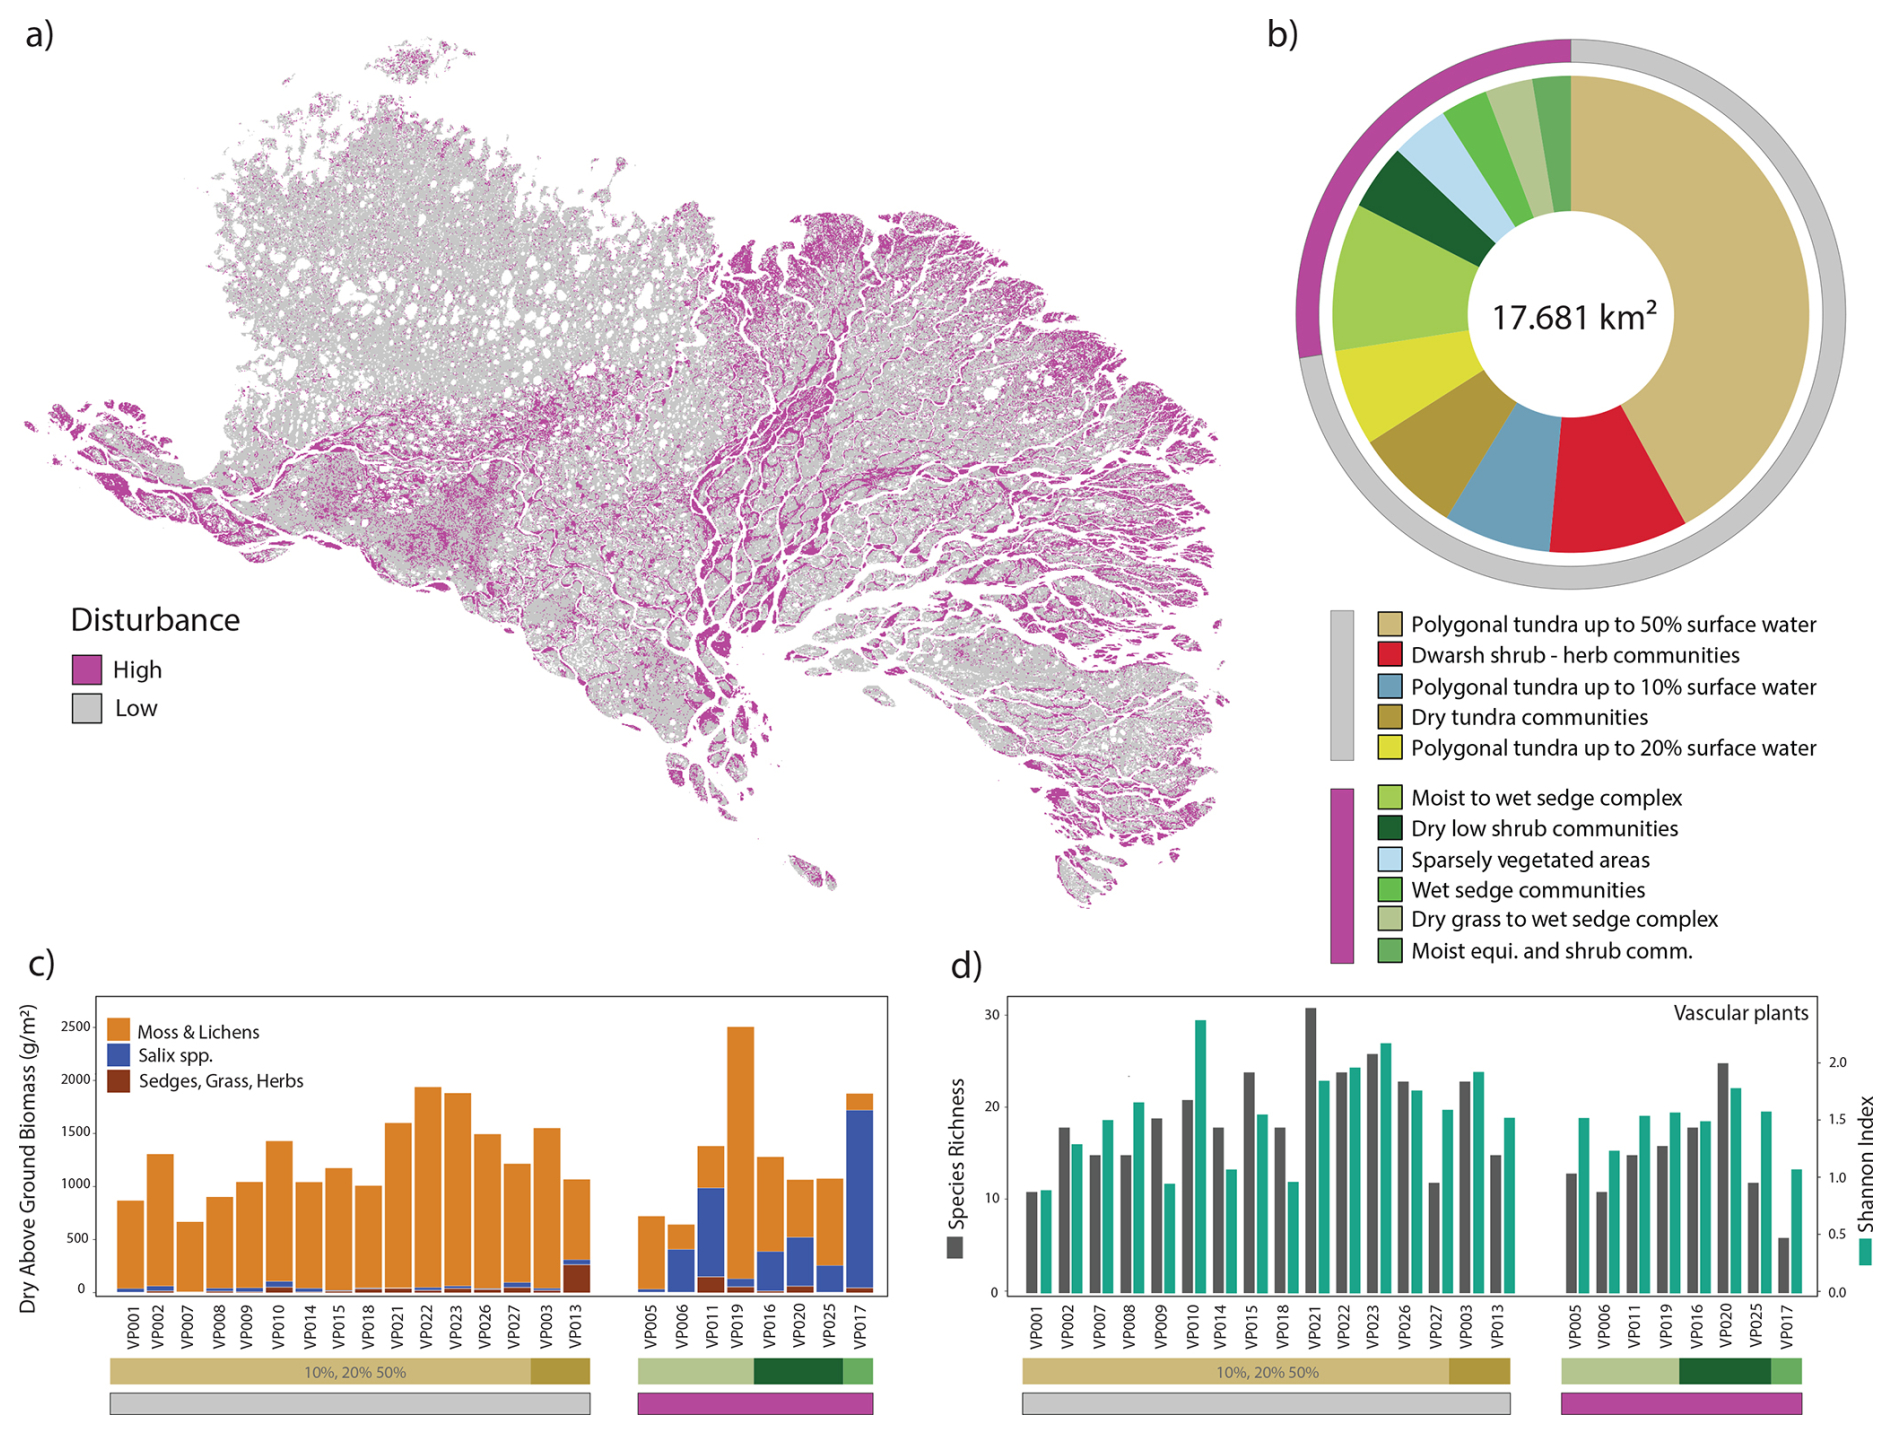
Figure 6Habitat-linked disturbance regimes across the Lena Delta. The map (a) includes all vegetated areas (excluding water and sand). The pie chart (b) shows the contribution of vegetated classes across the Lena Delta grouped by high- and low-disturbance regimes. The bottom panels show (c) the measured dry aboveground biomass (Dataset 2) and (d) the species richness and Shannon index (from Dataset 1) of the vegetation plots for different habitat classes and disturbance regimes.
Despite extensive research within the area, only a few classification products are available for the Lena Delta. The new Lena Delta classification is a high-resolution (Sentinel-2, 10 m) map that focuses on the delta-specific habitat classes and emphasizes the high level of heterogeneity across the delta. We compared the Lena Delta habitat classification to existing classifications: the first published Lena Delta-wide land cover classification targeted towards tundra environments and the upscaling of methane emissions with 30 m resolution (Schneider et al., 2009), the global ESA Climate Change Initiative CCI land cover classification with 300 m resolution (ESA Land Cover CCI project team and Defourny, 2019), and a circum-Arctic standardized ESA GlobPermafrost land cover map of the Lena Delta with 20 m resolution (Bartsch et al., 2019). We sampled the classification results with a regular point grid of more than 3 million points, which have an equal distance of 100 m to one another to compare the classification results. Figures and tables with more information on class comparisons can be found in the Supplement (Table 1, Figs. S3–S5). Overall, the classifications of the Lena Delta overlap well for “water” (water bodies (ESA Land Cover CCI project team and Defourny, 2019), shallow water (Schneider et al., 2009), water (different depths and sediment yields, Bartsch et al., 2019)) and “sand” (bare areas (ESA Land Cover CCI project team and Defourny, 2019), mainly non-vegetated areas (Schneider et al., 2009), sand, seasonally inundated and disturbed (Bartsch et al., 2019)) areas. Besides this, the mapped classes differ greatly from one another. For example, the dominant classes in the coarse ESA CCI land cover 2018 product (300 m) for the Lena Delta are “shrub or herbaceous cover”, “flooded”, “fresh/saline/brackish water”, “sparse vegetation (tree, shrub, herbaceous cover) (< 15 %)”, “mosaic tree and shrub (> 50 %)”, and “herbaceous cover (> 50 %)”.
These broad classes describe the major land cover in the Arctic delta but fail to depict the heterogeneity of habitats and plant communities not only because of its coarse spatial resolution but also because of the broad class descriptions. Furthermore, smaller areas are classified as “tree cover”, “needleleaved”, “evergreen/deciduous”, “closed to open (>15 %)”, and “mosaic tree and shrub (>50 %)/herbaceous cover (<50 %)”, which is an inaccurate depiction of the delta.
This habitat map and the land cover classification from Schneider et al. (2009) resemble each other more closely; however, this habitat map shows more differentiation in the classes and spatial resolution, 10 to 30 m, respectively. The only class description that is identical in both classifications, besides water and sand/mainly non-vegetated areas, is “dry tussock tundra”. However, there is only a small match between these classes in the point comparison, and most “dry tussock tundra” areas from the Schneider et al. (2009) classification fall into the PC_50 %, PC_20 %, “moist wet sedge complex”, and “dwarf shrub–herb communities”. The habitat map shows the mosaic of habitats on the floodplain with “moist Equisetum and shrubs on floodplain”, “dry low shrub community”, “moist to wet sedge”, and “wet sedge complex”, which match with “moist to dry dwarf shrub-dominated tundra” in the land cover classification of Schneider et al. (2009). Also, for the polygonal tundra complex, our habitat map shows more differentiation with three classes of up to 50 % 20 % , and10 % surface water contribution versus two classes in Schneider et al. (2009): “wet sedge and moss dominated tundra” and “moist grass and moss dominated tundra”. The areas covered by “PC_50 %” and “PC_20 %” match with “wet sedge- and moss-dominated tundra”, and “PC_20 %” and “PC_10 %” match with “moist grass and moss-dominated tundra”. The overall aim of both maps is to differentiate between dry to wet land cover habitats as these describe the heterogeneity in the delta well and determine factors related to methane emissions (see Schneider et al., 2009) and the different habitat classes.
The land cover classification from ESA GlobPermafrost differentiates between 21 classes which are associated with eight broader groups, such as sparse vegetation, shrub tundra, forest, grassland, floodplain, disturbed area, barren area, and water (Bartsch et al., 2019). With a spatial resolution of 20 m, the latter product is the closest to this habitat map. The major class “wet ecotopes” of ESA GlobPermafrost matches with our “PC_50 %” on the first terrace and the “moist to wet sedge complex” on the floodplains. On the floodplain, however, other classes show less agreement. The one ESA GlobPermafrost class “floodplain mostly fluvial” does not differentiate the floodplain classes further, in contrast to our habitat map differentiating between “moist to wet sedge complex”, “wet sedge complex”, “moist Equisetum and shrubs”, and “dry low shrub community” on floodplains. However, the ESA GlobPermafrost class “disturbed” (defined as forest fire scars, seasonal inundation, and landslide scars) can be found in “PC_50 %” predominantly, in “sand”, “PC_20 %”, and “sparsely vegetated areas” in our habitat map. This underlines the complex structure of match and mismatch between classifications.
The land cover map from Schneider et al. (2009) is based on two cloud-free Landsat images from June/July 2000 and 2001; the ESA CCI land cover 2018 map is based on summer images as well. Hence, the images used for this habitat classification were acquired at a similar time as for the ESA CCI product, and we do not expect differences based on changes on the ground due to this temporal concurrence. In the almost 20-year difference between Schneider et al. (2009) and this habitat map, we do expect changes in vegetation composition. Overall, it is challenging to obtain sufficient cloud-free images during the summer months to fully cover the entire Lena Delta for a classification project and to depict a specific phenological state. Therefore, we created a Sentinel-2 composite mosaic based on the maximum NDVI value per pixel from June to September. With this we ensure that we have the peak vegetation and phenology season represented as input for the habitat classification as much as possible and increase comparability to other classification studies despite a temporal mismatch.
The habitat map gives an accurate and detailed description of the Arctic Lena Delta that incorporates extensive field data and expert knowledge. The habitat map is superior to the ESA CCI land cover map (2018) in both spatial resolution and class description as it depicts the heterogeneous habitat distribution. The 20 m ESA GlobPermafrost classification matches the resolution of the habitat map closely, but due to its wider geographical application with circum-Arctic standardized classes it does not optimally represent Lena Delta-specific habitats, such as the widely distributed polygonal tundra complex. Furthermore, the habitat map is an update to Schneider et al. (2009), which was based on three Landsat images from 2000 and 2001 and shows further differentiation of habitats, specifically representing the floodplain mosaics of this Arctic delta.
4.3 Habitat-linked disturbance regimes
Parts of the Lena Delta are characterized by disturbances due to annual floods or rapid permafrost thaw processes leading to specific habitat classes. We provide habitat-linked disturbance regimes (describing the type and intensity of disturbances) across the delta. Our product (Dataset 6, Fig. 6a) shows that the largest part of the vegetated delta (excluding 12 439 km2 of “sand” and “water” classes) is impacted by low disturbance, resulting in mature-state plant communities on the terrace plateaus (Fig. 6b; 72 %, 12 806 km2). Specifically, the second terrace in the northwest of the delta, with low ice content, is least impacted by rapid thaw processes and not part of the active delta. In contrast, the habitats in the active delta are all linked to high disturbance (27 %, 4875 km2). The “moist to wet sedge complex” (10 % of the vegetated Lena Delta) is the largest class considered to be formed by high disturbance. This class is found in larger patch sizes on the riverine floodplains and smaller patches on the floor of thermo-erosional valleys. Overall, 27.5 % of the vegetated area of the Lena Delta experiences some level of high disturbance from either regular spring floods or from rapid thaw processes.
Species richness, relative abundance, and biomass characteristics are important habitat features that are influenced by landscape characteristics such as topography, water fluxes, soil types, and disturbance regimes (Forman and Godron, 1981; Naiman et al., 1986; Pickett et al., 1989; Montgomery, 1999). Grieg-Smith (1957), Whittaker and Woodwell (1968), and Forman and Godron (1981) described fragmentation of land surfaces due to disturbance (defined by type and intensities) and topography. In the Lena Delta, the terrace-related topography and active floodplain areas are major determinants of plant communities and habitat classes and are thus well reflected in the Lena Delta habitat map.
The high-disturbance regime on floodplains results in “shifting habitats” (Stanford et al., 2005; Driscoll and Hauer, 2019). The annual spring floods and rapid thaw processes result in areas of high disturbances, habitats of middle to advanced plant successional stages showing high vascular plant aboveground biomass (Fig. 6c) due to the higher nutrient availability, a deeper active layer, and more moisture (e.g., Myers-Smith et al., 2020). Within the low-disturbance habitat classes, a thick moss layer and a low vascular plant coverage characterize the tundra community assemblages representing mature state plant communities. Because high-disturbance patches are characterized by high vascular biomass, they can be well classified specifically in the NDVI, as well as NIR and red edge bands of optical medium-resolution sensors such as SENTINEL-2. Within the vegetation plots (Dataset 1), we did not find clear differences in species richness and in the Shannon diversity index between the disturbed and the undisturbed classes (Fig. 6d). Since most disturbed habitat classes such as the “moist to wet sedge” and the “wet sedge” and homogeneous patches of high shrubs (as part of the habitat class “dry grass to wet sedge complex”) were not sampled in the field due to conditions that were too challenging, they clearly represent habitats with low species richness. In extreme cases, disturbance can lead to barren and sparsely vegetated surfaces.
4.4 Classification accuracy and representativeness
The field data were acquired during a field trip in July–August 2018, primarily focusing on 30 m × 30 m homogeneous vegetation and land cover plots. Additionally, we relied on Sentinel-2 images for the different classifications that were also acquired in summer 2018, covering the same period as the field trip, and have a spatial resolution of 20 m. The temporal overlap of the fieldwork and the satellite image acquisitions ensures consistency across the different datasets and represents a close relationship between datasets and products obtained in the field (Dataset 1, 2, and 3) and the results derived from the satellite images that use the field data as input. As Sentinel-2 images have a small geolocation error, we could link our field plot locations directly with the satellite images. Furthermore, the sampling and measurement design of the plots with 30 m × 30 m ensured a reliable link to the satellite data with similar spatial resolution, as we followed the recommendations on the ESU. The RGB–NIR Sentinel-2 bands have a spatial resolution of 10 m and the red edge (NIR) and SWIR bands a spatial resolution of 20 m. Even if we downsampled the bands to 10 m, the spectral information is sustained. More information on datasets and their spatial and temporal resolutions is provided in Table S3.
The presented datasets are limited by the regional in situ observations and expert knowledge collected mainly in the central Lena Delta. The remoteness of the area and extremely difficult logistics to conduct research in the second terrace and the outer rims of the delta are major reasons for these limitations. However, the delta is relatively homogeneous in habitat classes that develop based on underlying geomorphology and the disturbance regime (annual flooding and permafrost thaw processes). Only one major habitat class is absent from the well-studied central Lena Delta and only occurs across the second terrace. For a formal evaluation of both habitat classification products, we defined an independent test dataset within the central Lena Delta. The comparisons show a relatively high accuracy for the central Lena Delta (94 %) and a lower accuracy for the entire Lena Delta classification (85 %). While this decrease in accuracy was expected, due to the large spatial extent of the Lena Delta, the limitation of independent evaluation restricted to the central Lena Delta should be noted. Particularly for the smaller patchy habitat types, the accuracy is likely overestimated. For the large-scale patterns and the dominant habitat types, we are confident that the classification results are reliable and accurate (see also visual evaluation in Figs. S7–S9).
In situ observations (Datasets 1–3) as well as mapping products (Datasets 4–6) represent conditions and vegetation composition of 2018. The timing of the summer 2018 expedition coincided with a relatively high number of cloud-free Sentinel-2 images necessary for a high-quality habitat classification. Overall, the described datasets are of appropriate quality to serve as a basis for additional studies and most importantly as a baseline to identify changes in the future.
Dataset 1 is from Shevtsova et al. (2025), https://doi.org/10.1594/PANGAEA.935875. The foliage projective cover of 26 vegetation sites in the central Lena Delta from 2018 is published for all major taxa estimated in percent, as tab-delimited text files.
Dataset 2 is from Shevtsova et al. (2024), https://doi.org/10.1594/PANGAEA.935923. Total aboveground biomass of 25 vegetation sites in the central Lena Delta from 2018 is published as dry mass per major taxa, as well as for “moss and lichen”, “litter”, and the remaining minor taxa (called “other plants”) and the total biomass in the units [g m−2], as tab-delimited text files.
Dataset 3 is from Runge et al. (2022), https://doi.org/10.1594/PANGAEA.945982. Hyperspectral field spectrometry of Arctic vegetation units in the central Lena Delta is published as an overview of the plot details and field spectrometer reflectance spectra in the unit [%] of 28 vegetation plots, as tab-delimited text files.
Dataset 4 is from Landgraf et al. (2022a, b, c). The Sentinel-2-derived central Lena Delta land cover (habitat) classification consists of three data publications:
- i.
Landgraf et al. (2025b), https://doi.org/10.1594/PANGAEA.945056, include a raster file with assigned land cover classes and an ESRI polygon shape file containing the 10 training classes representing the different vegetation compositions, as a GeoTIFF file. Both datasets are based on 2018 satellite images and informed by the in situ vegetation plots and expert knowledge. Datasets are in Universe Transverse Mercator (UTM) Zone 52 North projection.
- ii.
Landgraf et al. (2025d), https://doi.org/10.1594/PANGAEA.945054, include training elements representing different vegetation composition in the form of elementary sampling units (ESUs): 69 pseudo-ESUs set with expert knowledge from the field and from Lena Delta expedition field reports.
- iii.
Landgraf et al. (2025c), https://doi.org/10.1594/PANGAEA.945055, include training elements representing different vegetation composition in the form of elementary sampling units (ESUs): 23 true ESUs representing the LD18 vegetation plots.
Dataset 5 is from Lisovski et al. (2022), https://doi.org/10.1594/PANGAEA.946407. The Lena Delta habitat map (2018, Sentinel-2) contains (i) the Lena Delta habitat map (13 classes); (ii) the sand probability map, both as GeoTIFF files in WGS84 geographic projection; (iii) the habitat class description as a comma-delimited CSV table; and (iv) the training dataset (n=4278 classified pixels) in geographic decimal coordinates in a comma-delimited CSV table. The data collection also contains the Lena Delta region-of-interest (ROI) ESRI shapefile outlining the Lena Delta, including a coastal water buffer.
Dataset 6 is from Heim and Lisovski (2023), https://doi.org/10.5281/zenodo.7575691. The Lena Delta habitat disturbance regime map is published in the form of two GeoTIFF files (tiles) in WGS84 geographic projection.
Code developed in Google Earth Engine to derive habitat classes based on the central Lena Delta classification, as well as R code for figures, can be accessed from the following repository: Lisovski (2024, https://doi.org/10.5281/zenodo.11197641).
The described datasets provide coherent and complementary information of the major habitat classes in the Lena Delta in Arctic Siberia, the largest delta in the Arctic. Based on extensive knowledge collected during fieldwork that included habitat-related measurements of plant composition, biomass, and hyperspectral field measurements, we provide a validated and high-resolution habitat classification map of the delta. In addition, we linked ecologically important characteristics of disturbances in the delta to habitat classes, providing a baseline for future studies of Arctic change as well as a foundation for potential upscaling of related processes such as biodiversity, ecosystem functions, and biochemical dynamics such as greenhouse gas emissions. With this update of previous land cover and habitat-related mapping products of the Lena Delta, we strive to facilitate and promote future investigations leading to a better understanding of this highly sensitive Arctic delta system.
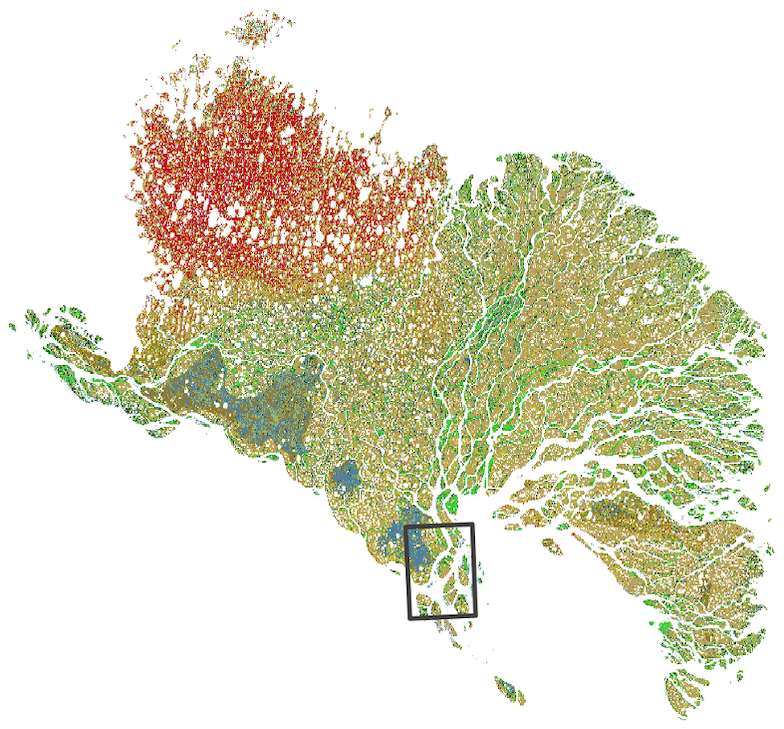
Figure A1Location of the central Lena Delta habitat classification (Dataset 4) in the Lena Delta (Datasets 5, 6).
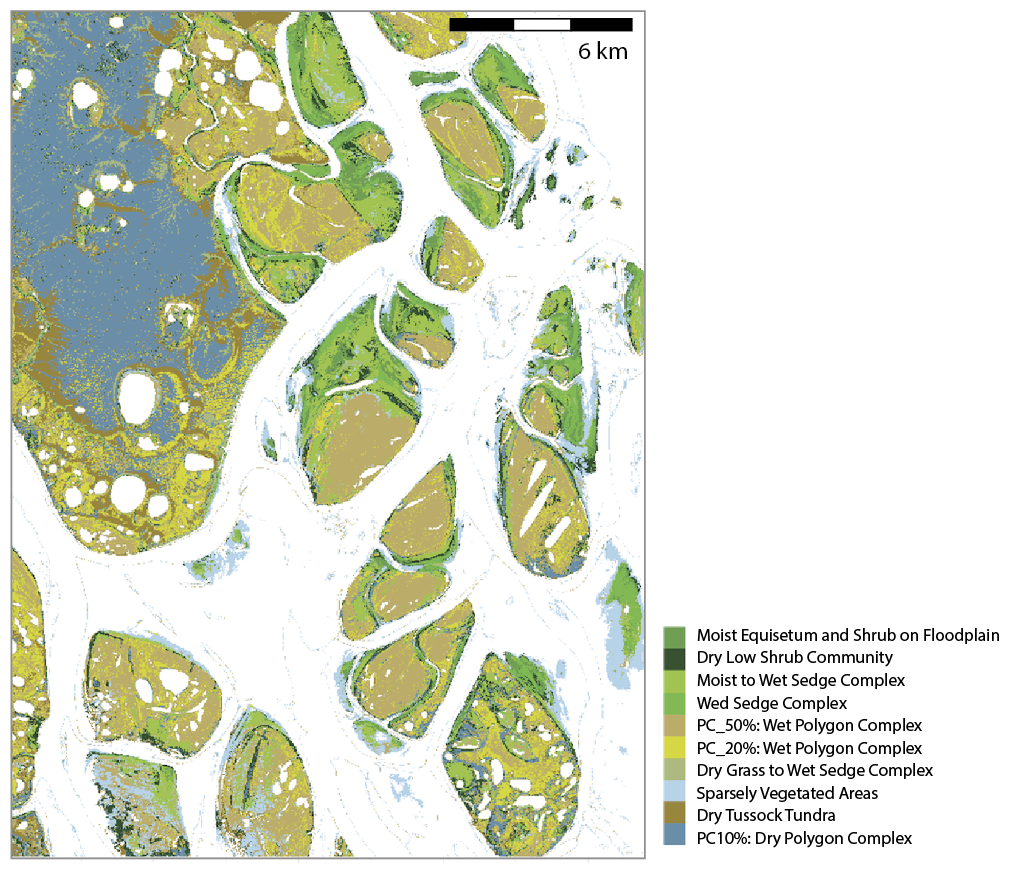
Figure A2Supervised habitat classification of the central Lena Delta based on a cloud-free Sentinel-2 August 2018 acquisition (Dataset 4). Numbers in the legend correspond to the labels in published Dataset 4 (Landgraf et al., 2025a).
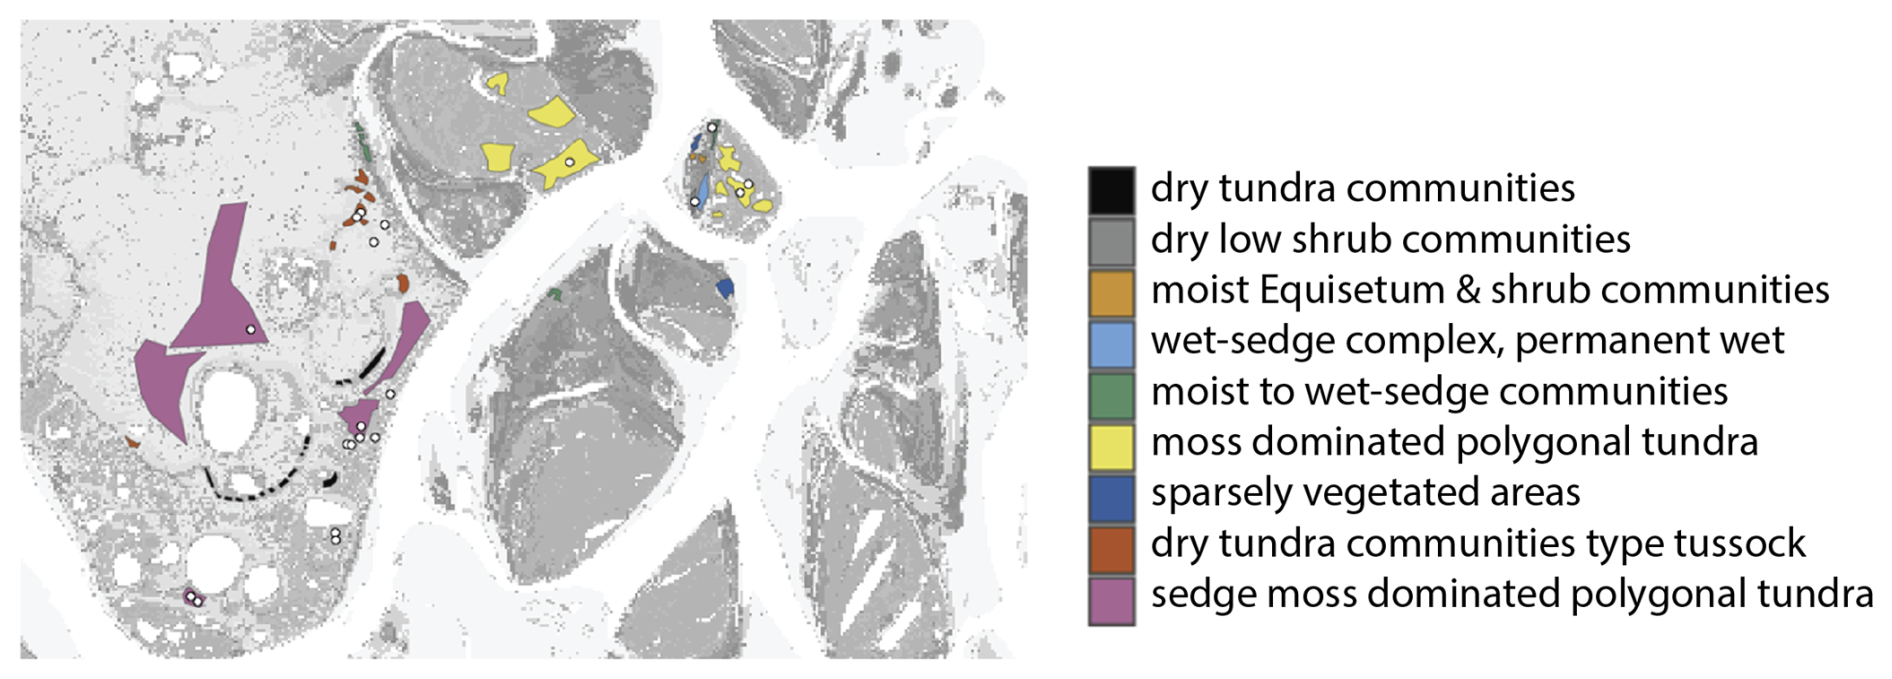
Figure A3The central Lena Delta with 30 × 30 m ESUs (white points, Dataset 1) and polygonal shapefiles defined by expert knowledge (published with Dataset 4). Together the ESUs and polygonal shapefiles served areas to sample 8626 training pixels for the central Lena Delta land cover/habitat classification (Dataset 4, Landgraf et al., 2025b).
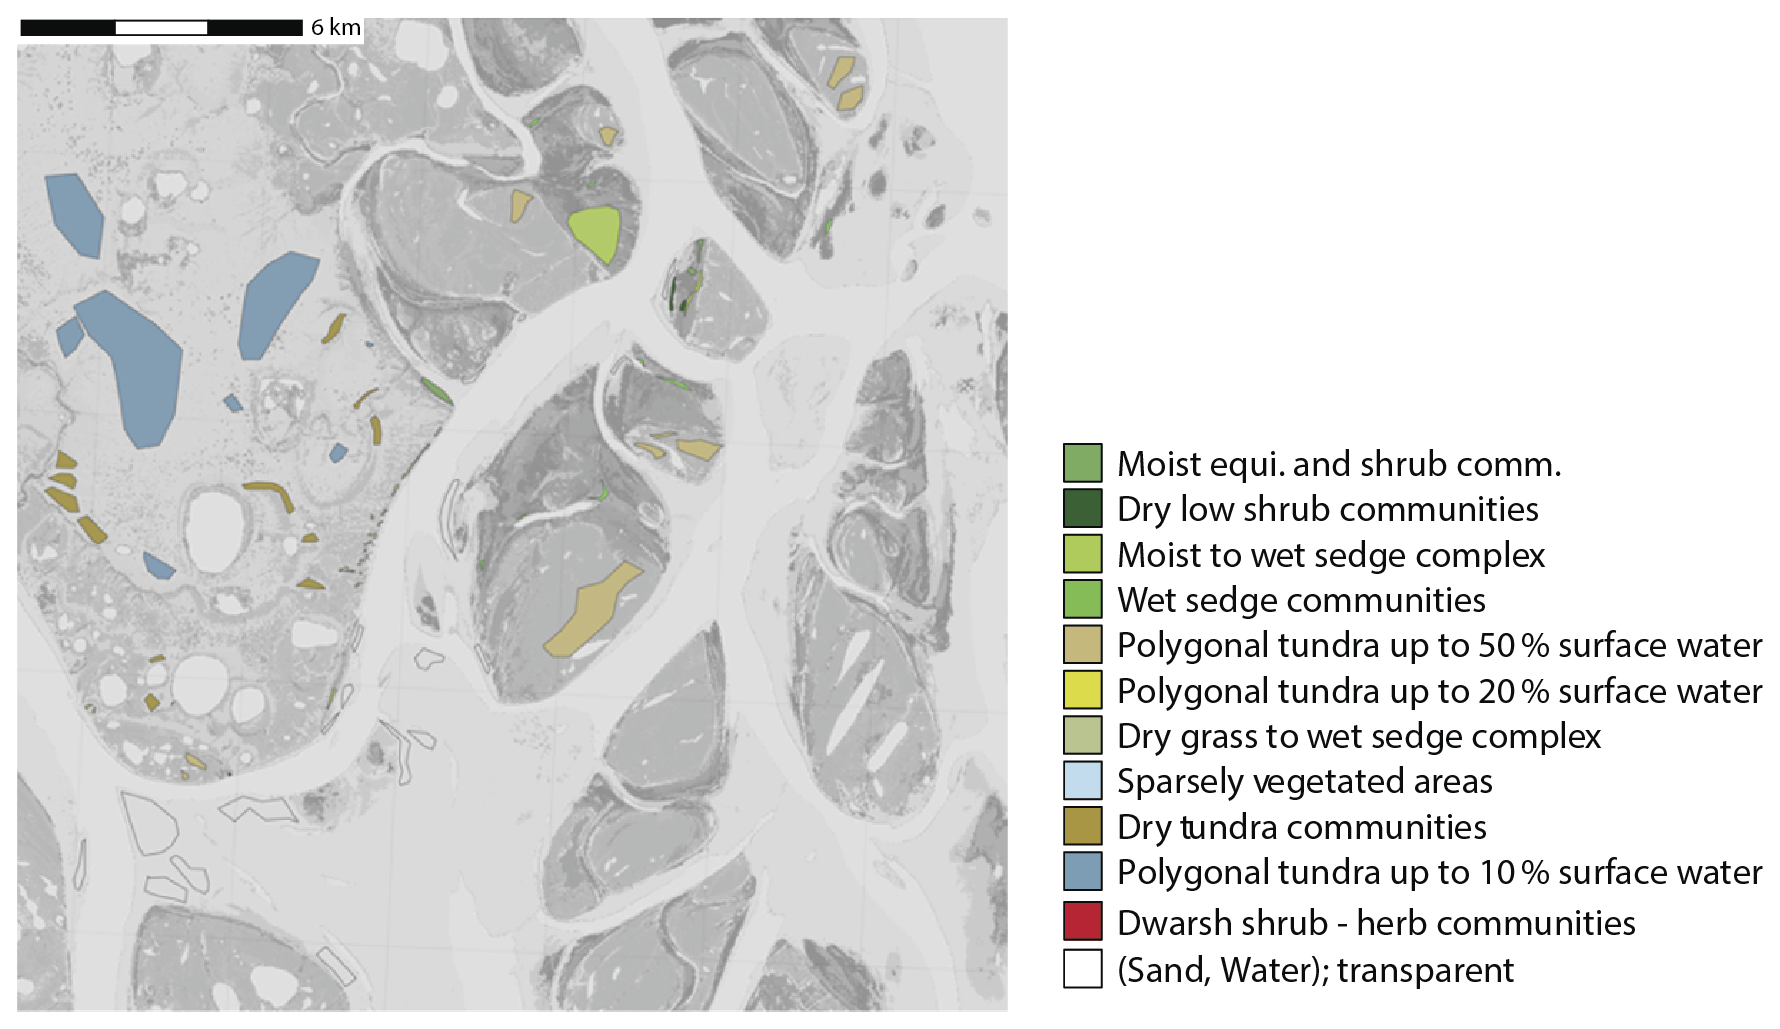
Figure A4Central Lena Delta with the additionally defined polygonal shapefiles as a test dataset for independent evaluation. The polygonal shapefiles were defined using high-resolution satellite and drone images and extensive knowledge from the field (Heim et al., 2025).
Table A1Confusion matrix and statistics of the central Lena Delta habitat classification with independently defined polygons (Fig. A4; Heim et al., 2025). Statistics are based on 100 random samples per class (1100 samples). Classes refer to 0 – moist Equisetum and shrub community, 1 – dry low shrub community, 2 – moist wet sedge community, 3 – wet sedge community, 4 – polygonal tundra (50 %), 6 – dry grass and wet sedge complex, 8 – dry tundra communities, 9 – polygonal tundra, and 10 – sand.
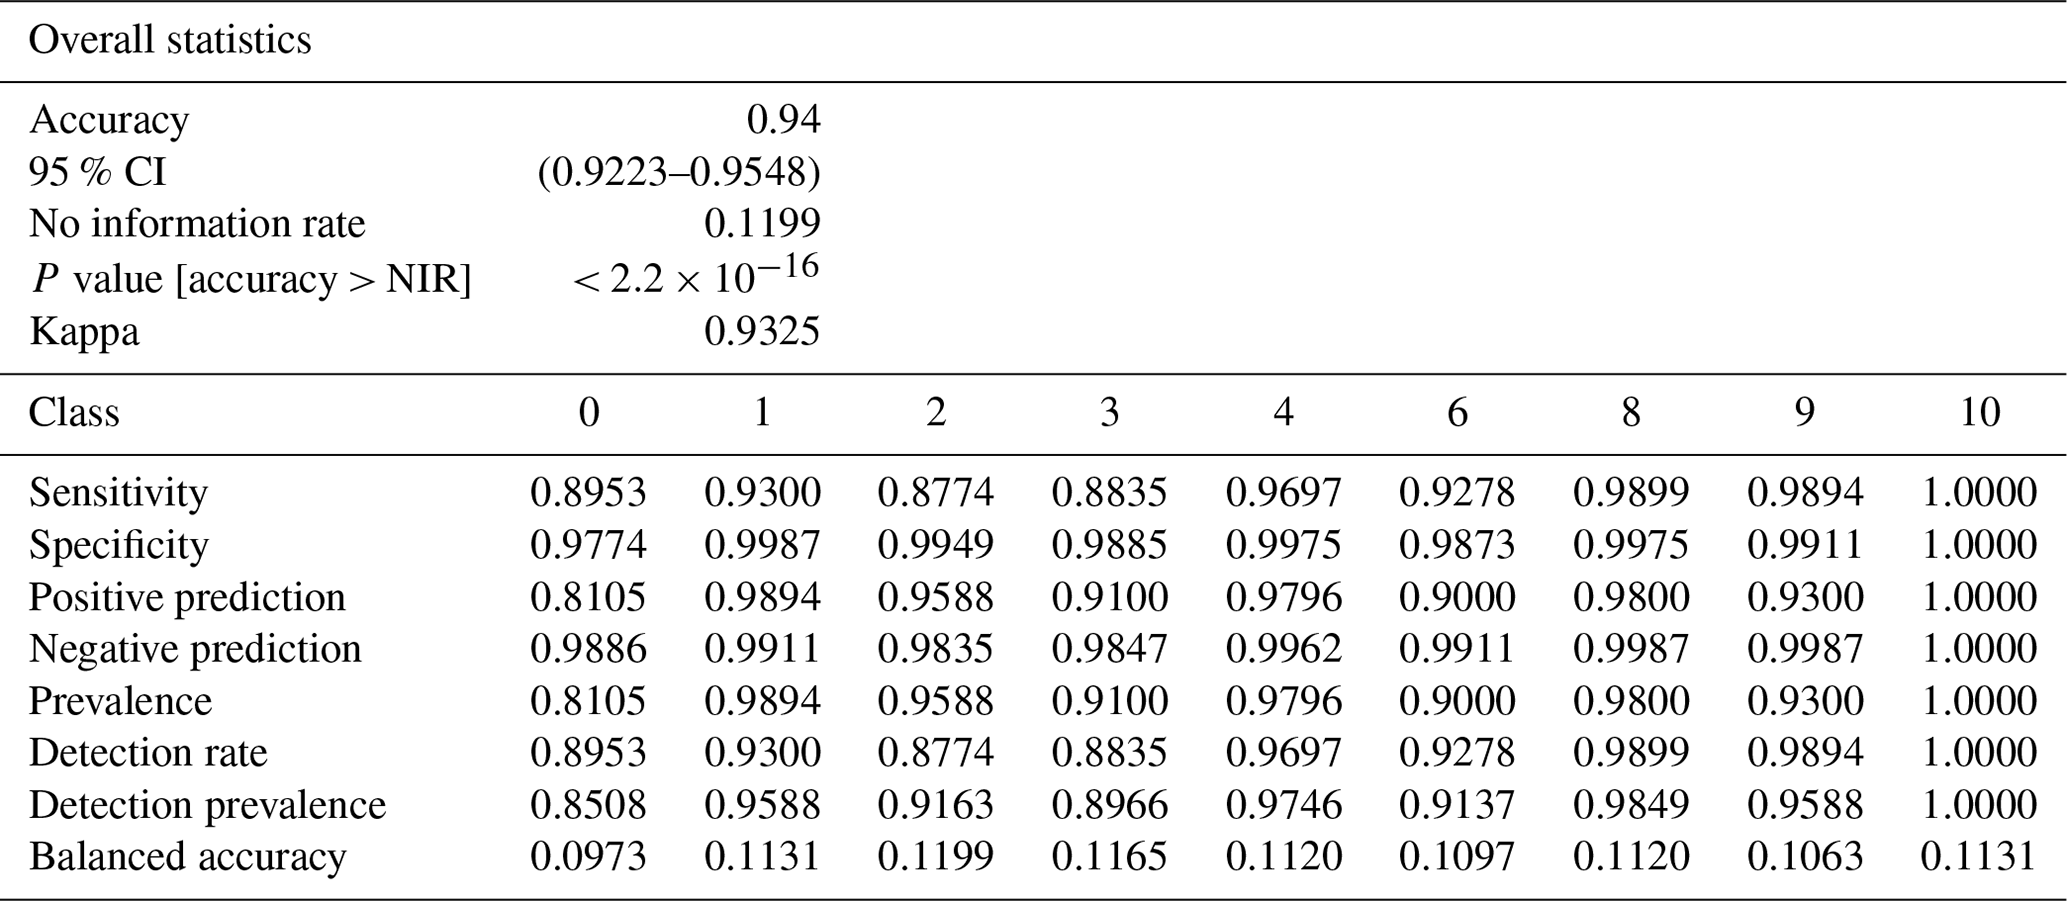
Table A2Confusion matrix and statistics of the entire Lena Delta habitat classification with independently defined polygons (Fig. A5). Note that polygons are from the central Lena Delta only, and evaluation statistics are only representative of a small spatial subset of the entire Lena Delta. Statistics are based on 100 random samples per class (1100 samples). Classes refer to 0 – moist Equisetum and shrub community, 1 – dry low shrub community, 2 – moist wet sedge community, 3 – wet sedge community, 4 – polygonal tundra (50 %), 6 – dry grass and wet sedge complex, 8 – dry tundra communities, 9 – polygonal tundra.
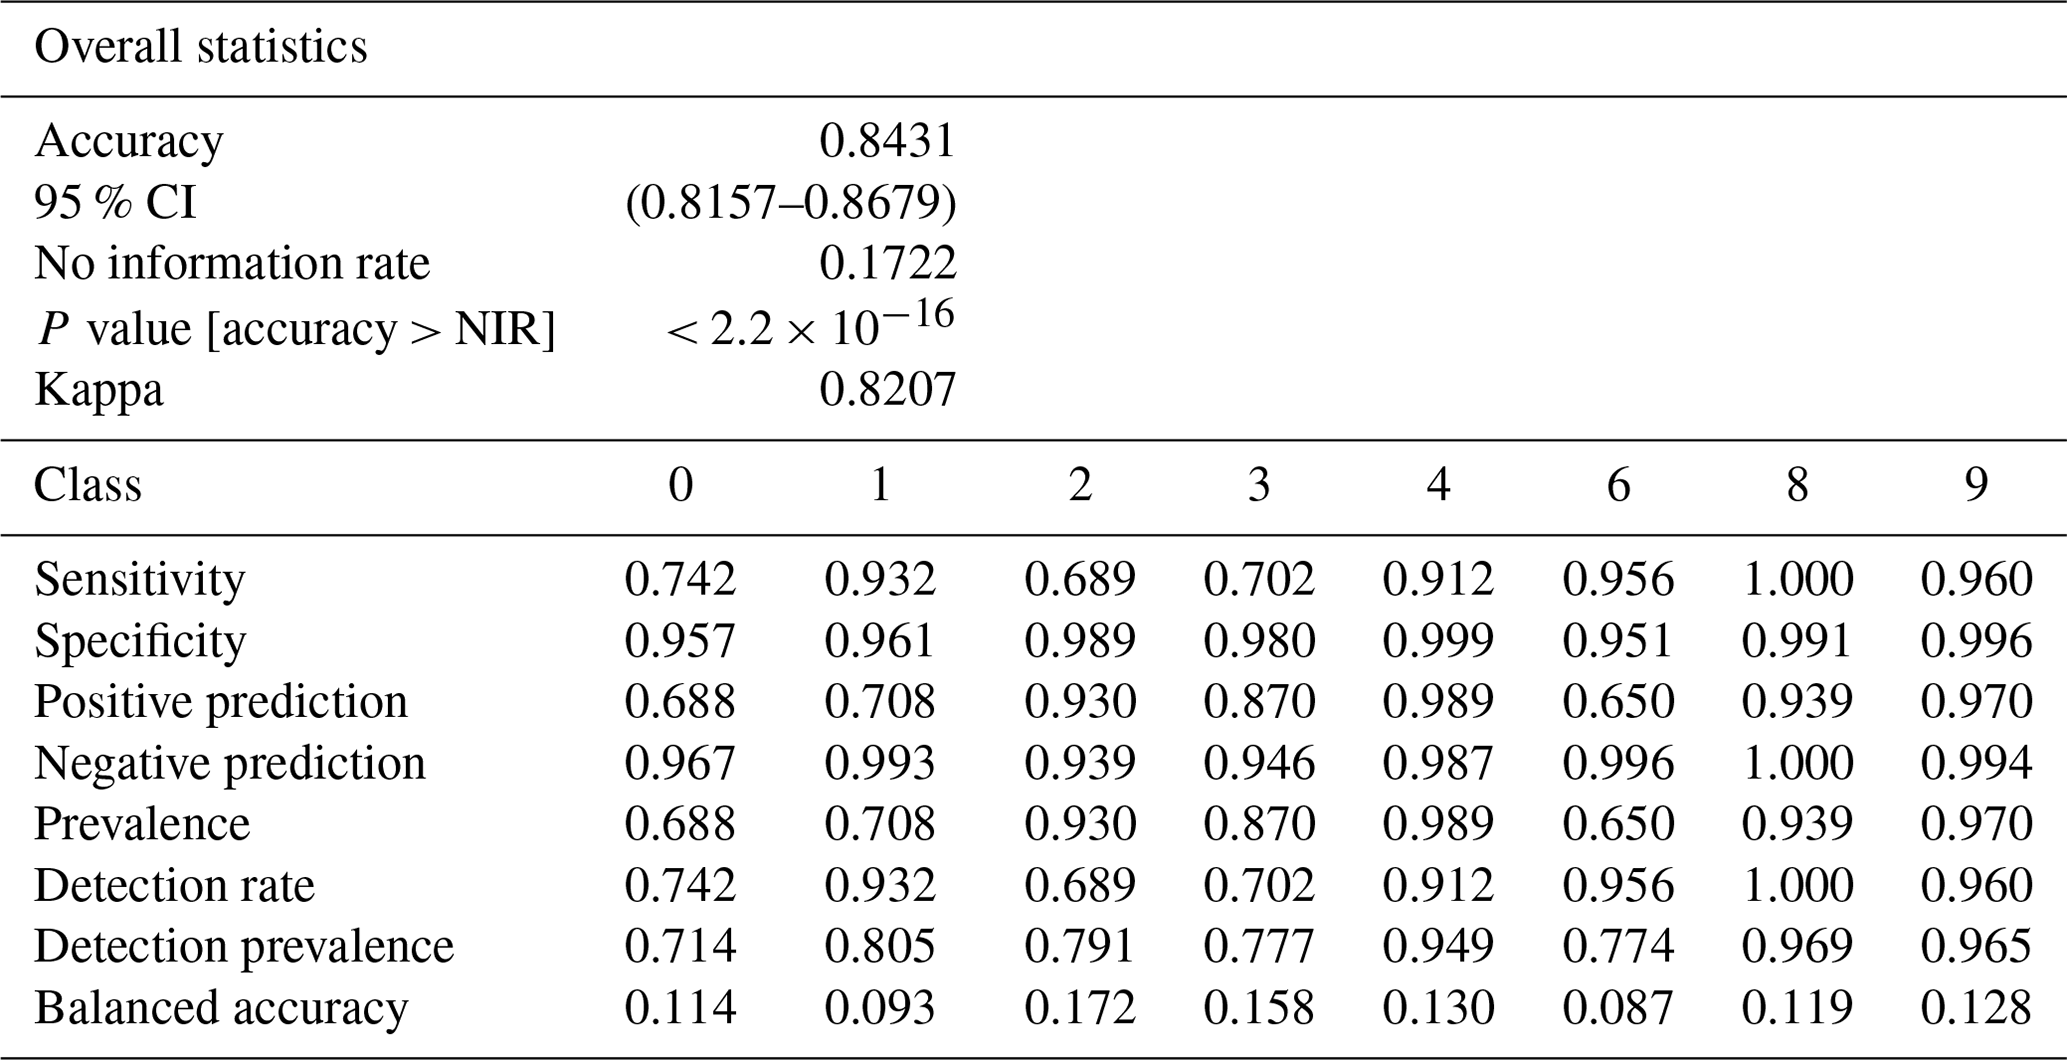
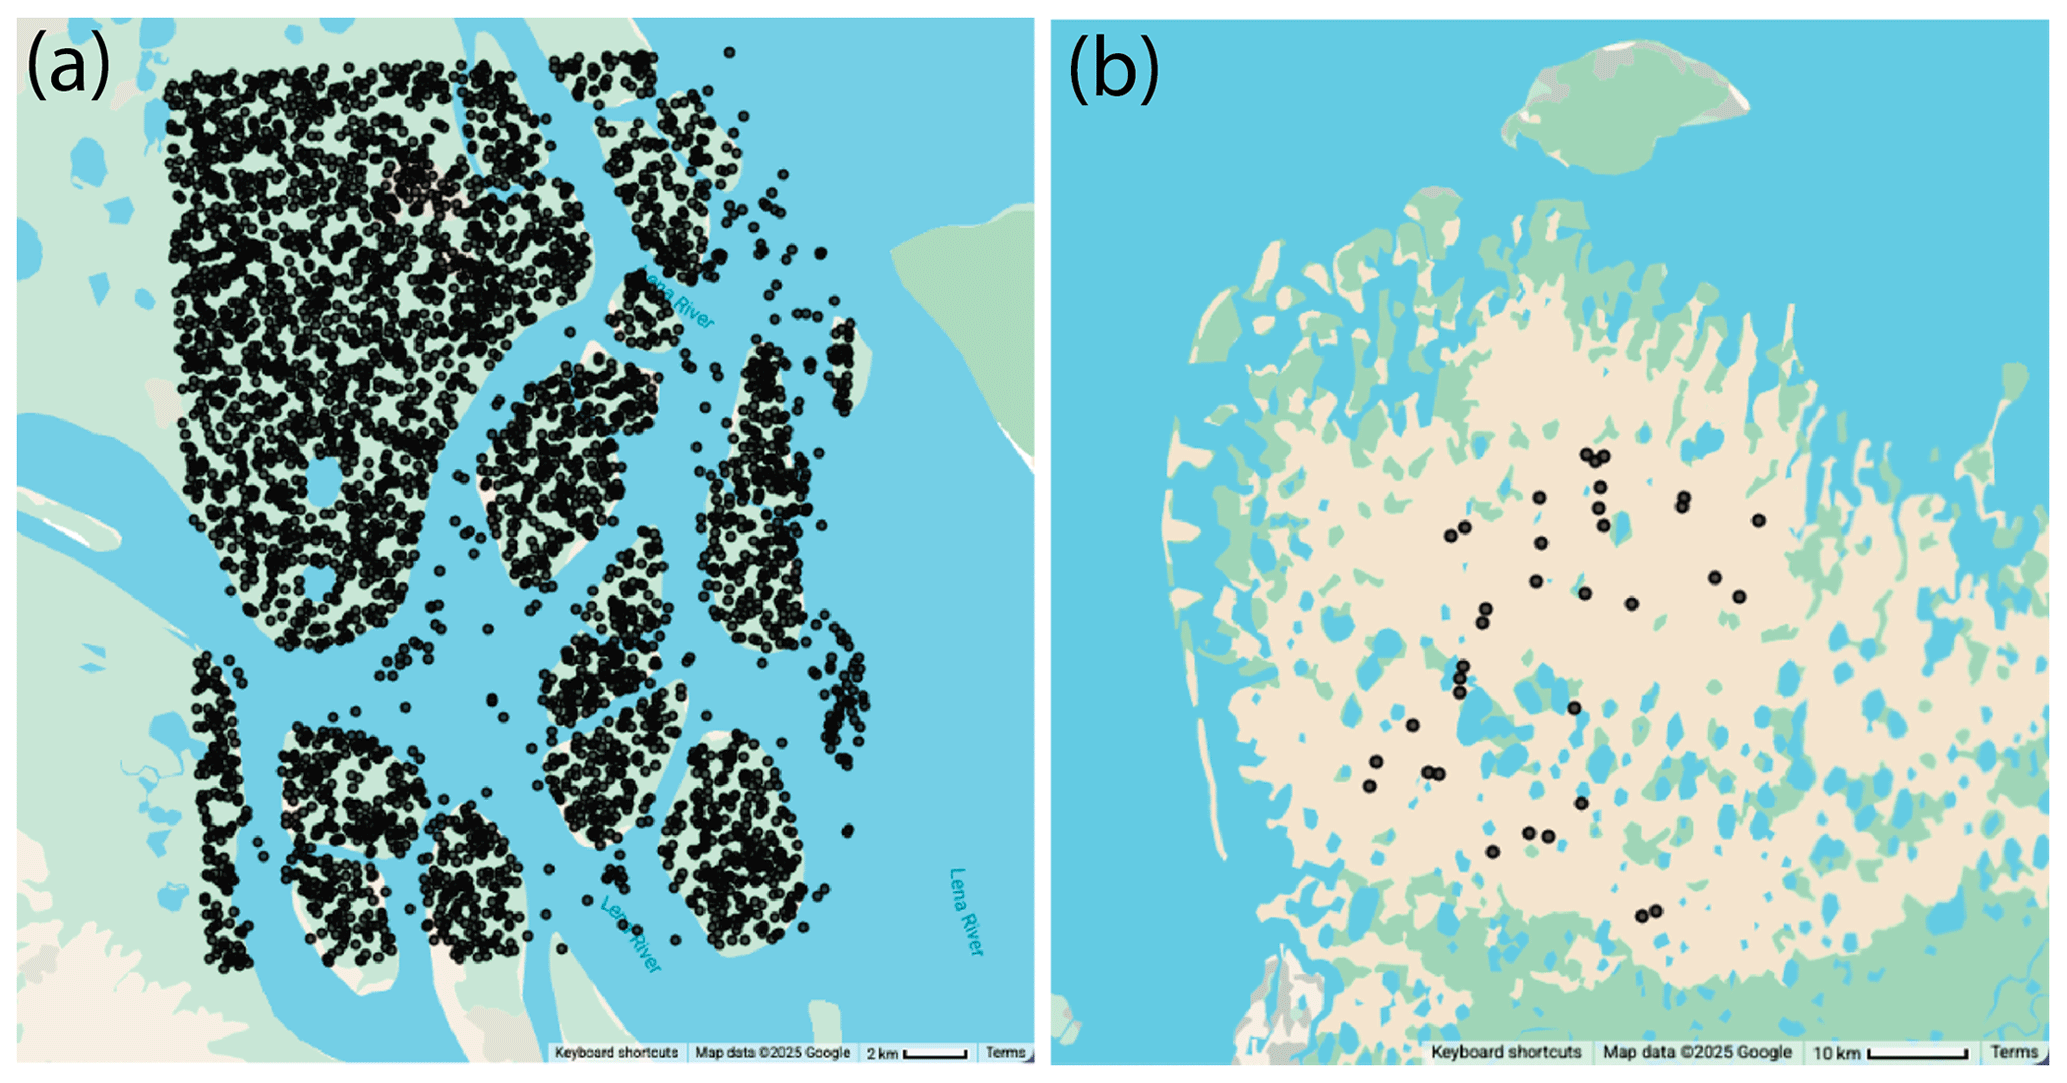
Figure A5Training pixels for the Lena Delta habitat classification (Dataset 5). (a) 7500 random pixel samples across the habitat classes from the central Lena Delta land cover/habitat map (Dataset 4). (b) 35 pixels (ESUS, Landgraf et al., 2025d) selected from expert knowledge for the “dwarf shrub–herb communities” that are missing in the central Lena Delta.
The supplement related to this article is available online at https://doi.org/10.5194/essd-17-1707-2025-supplement.
SL: conceptual framework, habitat classification, data analysis, writing. AR: conceptual framework, fieldwork, spectral field data collection, habitat classification, spectral data processing, data analysis, writing. IS: fieldwork, biomass and projective cover measurement in vegetation plots, habitat classification. RRO: habitat classification. NeL: habitat classification, spectral data processing. MF: fieldwork, spectral field data collection. NiL: habitat class definition, fieldwork. AM: project management, writing. CS: spectral data processing. AB: spectral data processing. UH: conceptual framework, project management. GG: conceptual framework, project management, habitat classification, writing. BH: conceptual framework, fieldwork, habitat classification, project management, writing.
At least one of the (co-)authors is a member of the editorial board of Earth System Science Data. The peer-review process was guided by an independent editor, and the authors also have no other competing interests to declare.
Publisher’s note: Copernicus Publications remains neutral with regard to jurisdictional claims made in the text, published maps, institutional affiliations, or any other geographical representation in this paper. While Copernicus Publications makes every effort to include appropriate place names, the final responsibility lies with the authors.
Fieldwork in the Lena River delta was conducted in the framework of the Russian–German LENA Expeditions based at Research Station Samoylov Island. We thank all colleagues and station staff involved in the organization and logistics for their great support.
Simeon Lisovski was funded by the Geo.X Network for Geosciences in Berlin and Brandenburg. This study was supported by BMBF KoPf (grant no. 03F0764B), KoPf Synthesis (grant no. 03F0834B), and AWI base funds. Alexandra Runge was partially funded by ESA GlobPermafrost and an ESA CCI postdoctoral fellowship. Birgit Heim was funded by HGF REKLIM.
The article processing charges for this open-access publication were covered by the Alfred-Wegener-Institut Helmholtz-Zentrum für Polar- und Meeresforschung.
This paper was edited by Hanqin Tian and reviewed by three anonymous referees.
ABoVE Science Definition Team: A Concise Experiment Plan for the Arctic-Boreal Vulnerability Experiment, ORNL DAAC, Oak Ridge, Tennessee, USA, https://doi.org/10.3334/ORNLDAAC/1617, 2014.
AMAP: Arctic Climate Change Update 2021: Key Trends and Impacts. Arctic Monitoring and Assessment Programme (AMAP), Tromsø, Norway, viii+148 pp., 2021.
Bartlett, K. B., Crill, P. M., Sass, R. L., Harriss, R. C., and Dise, N. B.: Methane Emissions from Tundra Environments in the Yukon-Kuskokwim Delta, Alaska, J. Geophys. Res.-Atmos., 97, 16645–16660, https://doi.org/10.1029/91jd00610, 1992.
Bartsch, A., Hofler, A., Kroisleitner, C., and Trofaier, A. M.: Land Cover Mapping in Northern High Latitude Permafrost Regions with Satellite Data: Achievements and Remaining Challenges, Remote Sensing, 8, 979, https://doi.org/10.3390/rs8120979, 2016.
Bartsch, A., Widhalm, B., Pointner, G., Ermokhina, K., Leibman, M., and Heim, B.: Landcover derived from Sentinel-1 and Sentinel-2 satellite data (2015–2018) for subarctic and arctic environments, PANGAEA [data set], https://doi.org/10.1594/PANGAEA.897916, 2019.
Bartsch, A., Widhalm, B., Leibman, M., Ermokhina, K., Kumpula, T., Skarin, A., Wilcox, E. J., Jones, B. M., Frost, G. V., Hofler, A., and Pointner, G.: Feasibility of tundra vegetation height retrieval from Sentinel-1 and Sentinel-2 data, Remote Sens. Environ., 237, 111515, https://doi.org/10.1016/j.rse.2019.111515, 2020.
Beamish, A., Raynolds, M. K., Epstein, H., Frost, G. V., Macander, M. J., Bergstedt, H., Bartsch, A., Kruse, S., Miles, V., Tanis, C. M., Heim, B., Fuchs, M., Chabrillat, S., Shevtsova, I., Verdonen, M., and Wagner, J.: Recent trends and remaining challenges for optical remote sensing of Arctic tundra vegetation: A review and outlook, Remote Sens. Environ., 246, 111872, https://doi.org/10.1016/j.rse.2020.111872, 2020.
Beamish, A. L., Coops, N., Chabrillat, S., and Heim, B.: A Phenological Approach to Spectral Differentiation of Low-Arctic Tundra Vegetation Communities, North Slope, Alaska, Remote Sensing, 9, 1200, https://doi.org/10.3390/rs9111200, 2017.
Beamish, A. L., Coops, N. C., Hermosilla, T., Chabrillat, S., and Heim, B.: Monitoring pigment-driven vegetation changes in a low-Arctic tundra ecosystem using digital cameras, Ecosphere, 9, e02123, https://doi.org/10.1002/ecs2.2123, 2018.
Berner, L. T., Massey, R., Jantz, P., Forbes, B. C., Macias-Fauria, M., Myers-Smith, I., Kumpula, T., Gauthier, G., Andreu-Hayles, L., Gaglioti, B. V., Burns, P., Zetterberg, P., D'Arrigo, R., and Goetz, S. J.: Summer warming explains widespread but not uniform greening in the Arctic tundra biome, Nat. Commun., 11, 4621, https://doi.org/10.1038/s41467-020-18479-5, 2020.
Biskaborn, B. K., Smith, S. L., Noetzli, J., Matthes, H., Vieira, G., Streletskiy, D. A., Schoeneich, P., Romanovsky, V. E., Lewkowicz, A. G., Abramov, A., Allard, M., Boike, J., Cable, W. L., Christiansen, H. H., Delaloye, R., Diekmann, B., Drozdov, D., Etzelmuller, B., Grosse, G., Guglielmin, M., Ingeman-Nielsen, T., Isaksen, K., Ishikawa, M., Johansson, M., Johannsson, H., Joo, A., Kaverin, D., Kholodov, A., Konstantinov, P., Kroger, T., Lambiel, C., Lanckman, J. P., Luo, D. L., Malkova, G., Meiklejohn, I., Moskalenko, N., Oliva, M., Phillips, M., Ramos, M., Sannel, A. B. K., Sergeev, D., Seybold, C., Skryabin, P., Vasiliev, A., Wu, Q. B., Yoshikawa, K., Zheleznyak, M., and Lantuit, H.: Permafrost is warming at a global scale, Nat. Commun., 10, 264, https://doi.org/10.1038/s41467-018-08240-4, 2019.
Boike, J., Wille, C., and Abnizova, A.: Climatology and summer energy and water balance of polygonal tundra in the Lena River Delta, Siberia, J. Geophys. Res.-Biogeo., 113, G03025, https://doi.org/10.1029/2007jg000540, 2008.
Boike, J., Nitzbon, J., Anders, K., Grigoriev, M., Bolshiyanov, D., Langer, M., Lange, S., Bornemann, N., Morgenstern, A., Schreiber, P., Wille, C., Chadburn, S., Gouttevin, I., Burke, E., and Kutzbach, L.: A 16-year record (2002–2017) of permafrost, active-layer, and meteorological conditions at the Samoylov Island Arctic permafrost research site, Lena River delta, northern Siberia: an opportunity to validate remote-sensing data and land surface, snow, and permafrost models, Earth Syst. Sci. Data, 11, 261–299, https://doi.org/10.5194/essd-11-261-2019, 2019.
Box, J. E., Colgan, W. T., Christensen, T. R., Schmidt, N. M., Lund, M., Parmentier, F. J. W., Brown, R., Bhatt, U. S., Euskirchen, E. S., Romanovsky, V. E., Walsh, J. E., Overland, J. E., Wang, M. Y., Corell, R. W., Meier, W. N., Wouters, B., Mernild, S., Mard, J., Pawlak, J., and Olsen, M. S.: Key indicators of Arctic climate change: 1971–2017, Environ. Res. Lett., 14, 045010, https://doi.org/10.1088/1748-9326/aafc1b, 2019.
Buchhorn, M., Walker, D. A., Heim, B., Raynolds, M. K., Epstein, H. E., and Schwieder, M.: Ground-Based Hyperspectral Characterization of Alaska Tundra Vegetation along Environmental Gradients, Remote Sensing, 5, 3971–4005, https://doi.org/10.3390/rs5083971, 2013.
Driscoll, K. P. and Hauer, F. R.: Seasonal flooding affects habitat and landscape dynamics of a gravel-bed river floodplain, Freshwater Sci., 38, 510–526, https://doi.org/10.1086/704826, 2019.
Drusch, M., Del Bello, U., Carlier, S., Colin, O., Fernandez, V., Gascon, F., Hoersch, B., Isola, C., Laberinti, P., Martimort, P., Meygret, A., Spoto, F., Sy, O., Marchese, F., Bargellini, P., and Sentinel-2: ESA's optical high-resolution mission for GMES operational services. Rem. Sens. Environ., 120, 25–36, https://doi.org/10.1016/j.rse.2011.11.026, 2012.
Duncanson, L., Armston, J., Disney, M., Avitabile, V., Barbier, N., Calders, K., Carter, S., Chave, J., Herold, M., MacBean, N., McRoberts, R., Minor, D., Paul, K., Réjou-Méchain, M., Roxburgh, S., Williams, M., Albinet, C., Baker, T., Bartholomeus, H., Bastin, J. F., Coomes, D., Crowther, T., Davies, S., de Bruin, S., De Kauwe, M., Domke, G., Dubayah, R., Falkowski, M., Fatoyinbo, L., Goetz, S., Jantz, P., Jonckheere, I., Jucker, T., Kay, H., Kellner, J., Labriere, N., Lucas, R., Mitchard, E., Morsdorf, F., Næsset, E., Park, T., Phillips, O. L., Ploton, P., Puliti, S., Quegan, S., Saatchi, S., Schaaf, C., Schepaschenko, D., Scipal, K., Stovall, A., Thiel, C., Wulder, M. A., Camacho, F., Nickeson, J., Román, M., and Margolis, H.: Aboveground Woody Biomass Product Validation Good Practices Protocol, Version 1.0, Land Product Validation Subgroup (WGCV/CEOS), https://doi.org/10.5067/doc/ceoswgcv/lpv/agb.001, 2021.
Endsley, K. A., Kimball, J. S., and Reichle, R. H.: Soil Respiration Phenology Improves Modeled Phase of Terrestrial net Ecosystem Exchange in Northern Hemisphere, J. Adv. Model. Earth Sy., 14, e2021MS002804, https://doi.org/10.1029/2021MS002804, 2022.
ESA: Sentinel-2 User Handbook, ESA Standard Document, 2015.
ESA Land Cover CCI project team and Defourny, P.: ESA Land Cover Climate Change Initiative (Land_Cover_cci): Global Land Cover Maps, Version 2.0.7, Centre for Environmental Data Analysis [data set], https://catalogue.ceda.ac.uk/uuid/b382ebe6679d44b8b0e68ea4ef4b701c (last access: May 2022), 2019.
Fedorova, I., Chetverova, A., Bolshiyanov, D., Makarov, A., Boike, J., Heim, B., Morgenstern, A., Overduin, P. P., Wegner, C., Kashina, V., Eulenburg, A., Dobrotina, E., and Sidorina, I.: Lena Delta hydrology and geochemistry: long-term hydrological data and recent field observations, Biogeosciences, 12, 345–363, https://doi.org/10.5194/bg-12-345-2015, 2015.
Forman, R. T. T. and Godron, M.: Patches and Structural Components for a Landscape Ecology, Bioscience, 31, 733–740, https://doi.org/10.2307/1308780, 1981.
Frost, G. V., Loehman, R. A., Saperstein, L. B., Macander, M. J., Nelson, P. R., Paradis, D. P., and Natali, S. M.: Multi-decadal patterns of vegetation succession after tundra fire on the Yukon-Kuskokwim Delta, Alaska, Environ. Res. Lett., 15, 025003, https://doi.org/10.1088/1748-9326/ab5f49, 2020.
Gilg, O., Sané, R., Solovieva, D. V., Pozdnyakov, V. I., Sabard, B., Tsanos, D., Zöckler, C., Lappo, E. G., Syroechkovski, J. E. E., and Eichhorn, G.: Birds and Mammals of the Lena Delta Nature Reserve, Siberia, Arctic, 53, 118–133, https://doi.org/10.14430/arctic842, 2000.
Grieg-Smith, P.: Quantitative Plant Ecology, Academic Press, New York, 1957.
Grigoriev, M. N.: Crio Morphogenesis in the Lena Delta, Permafrost Institute Press, Yakutsk, 1993.
Heim, B. and Lisovski, S.: Lena Delta habitat disturbance regimes (0.0), Zenodo [data set], https://doi.org/10.5281/zenodo.7575691, 2023.
Heim, B., Lisovski, S., and Runge, A.: Polygonal shapefiles as test dataset for the Central Lena Delta Classification (Landgraf et al. 2025), Zenodo [data set], https://doi.org/10.5281/zenodo.14731823, 2025.
Holl, D., Wille, C., Sachs, T., Schreiber, P., Runkle, B. R. K., Beckebanze, L., Langer, M., Boike, J., Pfeiffer, E.-M., Fedorova, I., Bolshianov, D. Y., Grigoriev, M. N., and Kutzbach, L.: A long-term (2002 to 2017) record of closed-path and open-path eddy covariance CO2 net ecosystem exchange fluxes from the Siberian Arctic, Earth Syst. Sci. Data, 11, 221–240, https://doi.org/10.5194/essd-11-221-2019, 2019.
Hu, F. S., Higuera, P. E., Duffy, P., Chipman, M. L., Rocha, A. V., Young, A. M., Kelly, R., and Dietze, M. C.: Arctic tundra fires: natural variability and responses to climate change, Front. Ecol. Environ., 13, 369-377, https://doi.org/10.1890/150063, 2015.
Hubberten, H.-W., Wagner, D., Pfeiffer, E.-M., Boike, J., and Gukov, A. Y.: The Russian-German research station samoylov, Lena delta – A key site for polar research in the Siberian arctic, Polarforschung, 2006.
Jorgenson, M. T.: Hierarchial organisation of ecosystems at multiple spatial scales on the Yukon-Kuskokwim Delta, Alaska, USA, Arct. Antarct. Alp. Res., 32, 221–239, https://doi.org/10.2307/1552521, 2000.
Juhls, B., Antonova, S., Angelopoulos, M., Bobrov, N., Grigoriev, M., Langer, M., Maksimov, G., Miesner, F., and Overduin, P. P.: Serpentine (Floating) Ice Channels and their Interaction with Riverbed Permafrost in the Lena River Delta, Russia, Front. Earth Sci., 9, 689941, https://doi.org/10.3389/feart.2021.689941, 2021.
Kienast, F. and Tsherkasova, J.: Comparative botanical recent-studies in the Lena River Delta [Field Report], Alfred Wegener Institute, Germany, 2001.
Landgraf, N., Shevtsova, I., Pflug, B., and Heim, B.: Sentinel-2 derived central Lena Delta land cover classification, PANGAEA [data set], https://doi.org/10.1594/PANGAEA.945057, 2025a.
Landgraf, N., Shevtsova, I., Pflug, B., and Heim, B.: Raster file with assigned land cover classes and ESRI polygon shape file training classes representing different vegetation composition, PANGAEA [dat aset], https://doi.org/10.1594/PANGAEA.945056, 2025b.
Landgraf, N., Shevtsova, I., Pflug, B., and Heim, B.: 23 true Elementary Sampling Units (ESUs) set in the Lena Delta representing the LD18 vegetation plots, PANGAEA [data set], https://doi.org/10.1594/PANGAEA.945055, 2025c.
Landgraf, N., Shevtsova, I., Pflug, B., and Heim, B.: 69 pseudo Elementary Sampling Units (ESUs) set in the Lena Delta derived with expert knowledge, PANGAEA [data set], https://doi.org/10.1594/PANGAEA.945054, 2025d.
Lantz, T. C., Kokelj, S. V., and Fraser, R. H.: Ecological recovery in an Arctic delta following widespread saline incursion, Ecol. Appl., 25, 172–185, https://doi.org/10.1890/14-0239.1, 2015.
Lisovski, S.: Code for “A new habitat map of the Lena Delta in Arctic Siberia based on field and remote sensing datasets” V0.1, Zenodo [code], https://doi.org/10.5281/zenodo.11197641, 2024.
Lisovski, S., Runge, A., Okoth, R. R., Shevtsova, I., and Heim, B.: Lena Delta Land Cover Classification (2018, Sentinel-2), PANGAEA [data set], https://doi.org/10.1594/PANGAEA.946407, 2022.
Lorang, M. S. and Hauer, F. R.: Fluvial geomorphic processes, in: Methods in stream ecology, edited by: Hauer, F. R. and Lamberti, G. A., Academic Press/Elsevier, San Diego, 145–168, 2006.
Macander, M. J., Nelson, P. R., Nawrocki, T. W., Frost, G. V., Orndahl, K. M., Palm, E. C., Wells, A. F., and Goetz, S. J.: Time-series maps reveal widespread change in plant functional type cover across Arctic and boreal Alaska and Yukon, Environ. Res. Lett., 17, 054042, https://doi.org/10.1088/1748-9326/ac6965, 2022.
Mauclet, E., Agnan, Y., Hirst, C., Monhonval, A., Pereira, B., Vandeuren, A., Villani, M., Ledman, J., Taylor, M., Jasinski, B. L., Schuur, E. A. G., and Opfergelt, S.: Changing sub-Arctic tundra vegetation upon permafrost degradation: impact on foliar mineral element cycling, Biogeosciences, 19, 2333–2351, https://doi.org/10.5194/bg-19-2333-2022, 2022.
Mekonnen, Z. A., Riley, W. J., Berner, L. T., Bouskill, N. J., Torn, M. S., Iwahana, G., Breen, A. L., Myers-Smith, I. H., Criado, M. G., Liu, Y. L., Euskirchen, E. S., Goetz, S. J., Mack, M. C., and Grant, R. F.: Arctic tundra shrubification: a review of mechanisms and impacts on ecosystem carbon balance, Environ. Res. Lett., 16, 053001, https://doi.org/10.1088/1748-9326/abf28b, 2021.
Montgomery, D. R.: Process domains and the river continuum, J. Am. Water Resour. As., 35, 397–410, https://doi.org/10.1111/j.1752-1688.1999.tb03598.x, 1999.
Morgenstern, A., Grosse, G., and Schirrmeister, L.: Genetic, morphological, and statistical characterization of lakes in the permafrost-dominated Lena Delta, in: Permafrost: proceedings of the 9th International Conference on Permafrost, 29 June–3 July 2008, Fairbanks, Alaska, edited by: Kane, D. L. and Hinkel, K. M., Institute of Northern Engineering, University of Alaska Fairbanks, 1239–1244, 2008.
Morgenstern, A., Grosse, G., Günther, F., Fedorova, I., and Schirrmeister, L.: Spatial analyses of thermokarst lakes and basins in Yedoma landscapes of the Lena Delta, The Cryosphere, 5, 849–867, https://doi.org/10.5194/tc-5-849-2011, 2011.
Morgenstern, A., Ulrich, M., Gunther, F., Roessler, S., Fedorova, I. V., Rudaya, N. A., Wetterich, S., Boike, J., and Schirrmeister, L.: Evolution of thermokarst in East Siberian ice-rich permafrost: A case study, Geomorphology, 201, 363–379, https://doi.org/10.1016/j.geomorph.2013.07.011, 2013.
Morgenstern, A., Overduin, P. P., Gunther, F., Stettner, S., Ramage, J., Schirrmeister, L., Grigoriev, M. N., and Grosse, G.: Thermo-erosional valleys in Siberian ice-rich permafrost, Permafrost Periglac., 32, 59–75, https://doi.org/10.1002/ppp.2087, 2021.
Mueller-Bombois, D. and Ellenberg, H.: Aims and methods of vegetation ecology, Wohn Wiley & Sons, New York, USA, 1974.
Myers-Smith, I. H., Kerby, J. T., Phoenix, G. K., Bjerke, J. W., Epstein, H. E., Assmann, J. J., John, C., Andreu-Hayles, L., Angers-Blondin, S., Beck, P. S. A., Berner, L. T., Bhatt, U. S., Bjorkman, A. D., Blok, D., Bryn, A., Christiansen, C. T., Cornelissen, J. H. C., Cunliffe, A. M., Elmendorf, S. C., Forbes, B. C., Goetz, S. J., Hollister, R. D., de Jong, R., Loranty, M. M., Macias-Fauria, M., Maseyk, K., Normand, S., Olofsson, J., Parker, T. C., Parmentier, F. J. W., Post, E., Schaepman-Strub, G., Stordal, F., Sullivan, P. F., Thomas, H. J. D., Tommervik, H., Treharne, R., Tweedie, C. E., Walker, D. A., Wilmking, M., and Wipf, S.: Complexity revealed in the greening of the Arctic, Nat. Clim. Change, 10, 106–117, https://doi.org/10.1038/s41558-019-0688-1, 2020.
Naiman, R. J., Melillo, J. M., and Hobbie, J. E.: Ecosystem Alteration of Boreal Forest Streams by Beaver (Castor-Canadensis), Ecology, 67, 1254–1269, https://doi.org/10.2307/1938681, 1986.
Nitzbon, J., Westermann, S., Langer, M., Martin, L. C. P., Strauss, J., Laboor, S., and Boike, J.: Fast response of cold ice-rich permafrost in northeast Siberia to a warming climate, Nat. Commun., 11, 2201, https://doi.org/10.1038/s41467-020-15725-8, 2020.
Nitze, I. and Grosse, G.: Detection of landscape dynamics in the Arctic Lena Delta with temporally dense Landsat time-series stacks, Remote Sens. Environ., 181, 27–41, https://doi.org/10.1016/j.rse.2016.03.038, 2016.
Obu, J., Westermann, S., Barboux, C., Bartsch, A., Delaloye, R., Grosse, G., Heim, B., Hugelius, G., Irrgang, A., Kääb, A. M., Kroisleitner, C., Matthes, H., Nitze, I., Pellet, C., Seifert, F. M., Strozzi, T., Wegmüller, U., Wieczorek, M., and Wiesmann, A.: ESA permafrost Climate Change Initiative (permafrost_cci): Permafrost extent for the Northern Hemisphere, v2.0, CEDA Archive [data set], https://doi.org/10.5285/28E889210F884B469D7168FDE4B4E54F, 2020.
Overeem, I., Nienhuis, J. H., and Piliouras, A.: Ice-dominated Arctic deltas, Nat. Rev. Earth Environ., 3, 225–240, https://doi.org/10.1038/s43017-022-00268-x, 2022.
Overland, J., Dunlea, E., Box, J. E., Corell, R., Forsius, M., Kattsov, V., Olseng, M. S., Pawlak, J., Reiersen, L. O., and Wang, M. Y.: The urgency of Arctic change, Polar Sci., 21, 6–13, https://doi.org/10.1016/j.polar.2018.11.008, 2019.
Pickett, S. T. A., Kolasa, J., Armesto, J. J., and Collins, S. L.: The Ecological Concept of Disturbance and Its Expression at Various Hierarchical Levels, Oikos, 54, 129–136, https://doi.org/10.2307/3565258, 1989.
Piliouras, A. and Rowland, J. C.: Arctic River Delta Morphologic Variability and Implications for Riverine Fluxes to the Coast, J. Geophys. Res.-Earth, 125, e2019JF005250, https://doi.org/10.1029/2019JF005250, 2020.
Pisaric, M. F. J., Thienpont, J. R., Kokelj, S. V., Nesbitt, H., Lantz, T. C., Solomon, S., and Smol, J. P.: Impacts of a recent storm surge on an Arctic delta ecosystem examined in the context of the last millennium, P. Natl. Acad. Sci. USA, 108, 8960–8965, https://doi.org/10.1073/pnas.1018527108, 2011.
Raynolds, M. K., Walker, D. A., Balser, A., Bay, C., Campbell, M., Cherosov, M. M., Daniels, F. J. A., Eidesen, P. B., Emiokhina, K. A., Frost, G. V., Jedrzejek, B., Jorgenson, M. T., Kennedy, B. E., Kholod, S. S., Lavrinenko, I. A., Lavrinenko, O. V., Magnusson, B., Matveyeva, N. V., Metusalemsson, S., Nilsen, L., Olthof, I., Pospelov, I. N., Pospelova, E. B., Pouliot, D., Razzhivin, V., Schaepman-Strub, G., Sibik, J., Telyatnikov, M. Y., and Troeva, E.: A raster version of the Circumpolar Arctic Vegetation Map (CAVM), Remote Sens. Environ., 232, 111297, https://doi.org/10.1016/j.rse.2019.111297, 2019.
Romanovskii, N. N. and Hubberten, H. W.: Results of permafrost modelling of the lowlands and shelf of the Laptev Sea region, Russia, Permafrost Periglac., 12, 191–202, https://doi.org/10.1002/ppp.387, 2001.
Rossger, N., Sachs, T., Wille, C., Boike, J., and Kutzbach, L.: Seasonal increase of methane emissions linked to warming in Siberian tundra, Nat. Clim. Change, 12, 1031, https://doi.org/10.1038/s41558-022-01512-4, 2022.
Runge, A., Fuchs, M., Shevtsova, I., Landgraf, N., Heim, B., Herzschuh, U., and Grosse, G.: Hyperspectral field spectrometry of Arctic vegetation units in the central Lena Delta, PANGAEA [data set], https://doi.org/10.1594/PANGAEA.945982, 2022.
Sachs, T., Wille, C., Boike, J., and Kutzbach, L.: Environmental controls on ecosystem-scale CH4 emission from polygonal tundra in the Lena River Delta, Siberia, J. Geophys. Res.-Biogeo., 113, G00a03, https://doi.org/10.1029/2007jg000505, 2008.
Schirrmeister, L., Grosse, G., Schwamborn, G., Andreev, A. A., Meyer, H., Kunitsky, V. V., Kuznetsova, T. V., Dorozhkina, M. V., Pavlova, E. Y., Bobrov, A. A., and Oezen, D.: Late Quaternary History of the Accumulation Plain North of the Chekanovsky Ridge (Lena Delta, Russia): A Multidisciplinary Approach, Polar Geogr., 27, 277–319, https://doi.org/10.1080/789610225, 2003.
Schirrmeister, L., Grosse, G., Schnelle, M., Fuchs, M., Krbetschek, M., Ulrich, M., Kunitsky, V., Grigoriev, M., Andreev, A., Kienast, F., Meyer, H., Babiy, O., Klimova, I., Bobrov, A., Wetterich, S., and Schwamborn, G.: Late Quaternary paleoenvironmental records from the western Lena Delta, Arctic Siberia, Palaeogeogr. Palaeocl., 299, 175–196, https://doi.org/10.1016/j.palaeo.2010.10.045, 2011.
Schneider, J., Grosse, G., and Wagner, D.: Land cover classification of tundra environments in the Arctic Lena Delta based on Landsat 7 ETM+ data and its application for upscaling of methane emissions, Remote Sens. Environ., 113, 380–391, https://doi.org/10.1016/j.rse.2008.10.013, 2009.
Schwamborn, G., Rachold, V., and Grigoriev, M. N.: Late Quaternary sedimentation history of the Lena Delta, Quaternary Int., 89, 119–134, https://doi.org/10.1016/S1040-6182(01)00084-2, 2002.
Schwamborn, G., Schirrmeister, L., Mohammadi, A., Meyer, H., Kartoziia, A., Maggioni, F., and Strauss, J.: Fluvial and permafrost history of the lower Lena River, north-eastern Siberia, over late Quaternary time, Sedimentology, 70, 235–258, https://doi.org/10.1111/sed.13037, 2023.
Serreze, M. C. and Barry, R. G.: Processes and impacts of Arctic amplification: A research synthesis, Global Planet. Change, 77, 85–96, https://doi.org/10.1016/j.gloplacha.2011.03.004, 2011.
Shevtsova, I., Heim, B., Runge, A., Fuchs, M., Melchert, J., and Herzschuh, U.: Total above-ground biomass of 25 vegetation sites of central Lena Delta from 2018, PANGAEA [data set], https://doi.org/10.1594/PANGAEA.935923, 2024.
Shevtsova, I., Laschinskiy, N., Heim, B., and Herzschuh, U.: Foliage projective cover of 26 vegetation sites of central Lena Delta from 2018, PANGAEA [data set], https://doi.org/10.1594/PANGAEA.935875, 2025.
Siewert, M. B. and Olofsson, J.: UAV reveals substantial but heterogeneous effects of herbivores on Arctic vegetation, Sci. Rep., 11, 19468, https://doi.org/10.1038/s41598-021-98497-5, 2021.
Siewert, B. M., Hugelius, G., Birgit, H., and Samuel F.: Soil organic carbon storage and soil properties for 50 soil profiles in the Lena River Delta including land form description and map, PANGAEA [data set publication series], https://doi.org/10.1594/PANGAEA.862961, 2016a.
Siewert, B. M., Hugelius, G., Birgit, H., and Samuel F.: Soil organic carbon (SOC) storage in the Lena River Delta, PANGAEA [data set], https://doi.org/10.1594/PANGAEA.862959, 2016b.
Siewert, B. M., Hugelius, G., Birgit, H., and Samuel F.: Landscape controls and vertical variability of soil organic carbon storage in permafrost-affected soils of the Lena River Delta, CATENA, 147, 725–741, https://doi.org/10.1016/j.catena.2016.07.048, 2016c.
Stanford, J. A., Lorang, M. S., and Hauer, F. R.: The shifting habitat mosaic of river ecosystems, SIL Proceedings, 1922–2010, 29, 123–136, https://doi.org/10.1080/03680770.2005.11901979, 2005.
Sweeney, C., Chatterjee, A., Wolter, S., McKain, K., Bogue, R., Conley, S., Newberger, T., Hu, L., Ott, L., Poulter, B., Schiferl, L., Weir, B., Zhang, Z., and Miller, C. E.: Using atmospheric trace gas vertical profiles to evaluate model fluxes: a case study of Arctic-CAP observations and GEOS simulations for the ABoVE domain, Atmos. Chem. Phys., 22, 6347–6364, https://doi.org/10.5194/acp-22-6347-2022, 2022.
Ulrich, M., Grosse, G., Chabrillat, S., and Schirrmeister, L.: Spectral characterization of periglacial surfaces and geomorphological units in the Arctic Lena Delta using field spectrometry and remote sensing, Remote Sens. Environ., 113, 1220–1235, https://doi.org/10.1016/j.rse.2009.02.009, 2009.
van Everdingen, R. O.: Multi-language glossary of permafrost and related ground-ice terms, Arctic Institute of North America University of Calgary, Calgary, Canada, 1998.
Veremeeva, A. and Gubin, S.: Modern Tundra Landscapes of the Kolyma Lowland and their Evolution in the Holocene, Permafrost Periglac., 20, 399–406, https://doi.org/10.1002/ppp.674, 2009.
Vulis, L., Tejedor, A., Zaliapin, I., Rowland, J. C., and Foufoula-Georgiou, E.: Climate Signatures on Lake And Wetland Size Distributions in Arctic Deltas, Geophys. Res. Lett., 48, e2021GL094437, https://doi.org/10.1029/2021GL094437, 2021.
Walker, H. J.: Arctic deltas, J. Coastal Res., 14, 718–738, 1998.
Whitaker, R. H. and Woodwell, G. M.: Dimension, and Production Relations of Trees and Shrubs in the Brookhaven Forest, New York, J. Ecol., 56, 1–25, https://doi.org/10.1038/2325, 1968.
Zibulski, R., Herzschuh, U., and Pestryakova, L. A.: Vegetation patterns along micro-relief and vegetation type transects in polygonal landscapes of the Siberian Arctic, J. Veg. Sci., 27, 377–386, https://doi.org/10.1111/jvs.12356, 2016.