the Creative Commons Attribution 4.0 License.
the Creative Commons Attribution 4.0 License.
 | 16 Apr 2025
Deep-Time Marine Sedimentary Element Database
Jiankang Lai
Daoliang Chu
Jacopo Dal Corso
Erik A. Sperling
Yuyang Wu
Xiaokang Liu
Lai Wei
Mingtao Li
Hanchen Song
Enhao Jia
Huyue Song
Wenchao Yu
Qingzhong Liang
Xinchuan Li
Geochemical data from ancient marine sediments are crucial for studying palaeo-environments, palaeo-climates, and elemental cycles. With increased accessibility to geochemical data, many databases have emerged. However, there remains a need for a more comprehensive database that focuses on deep-time marine sediment records. Here, we introduce the Deep-Time Marine Sedimentary Element Database (DM-SED). The DM-SED has been built upon the Sedimentary Geochemistry and Paleoenvironments Project (SGP) database with a new compilation of 34 874 data entries from 433 studies, totalling 63 627 entries. The DM-SED contains 2 522 255 discrete marine sedimentary data points, including major and trace elements and some stable isotopes. It includes 9207 entries from the Precambrian and 54 420 entries from the Phanerozoic, thus providing significant references for reconstructing deep-time Earth system evolution. The data files described in this paper are available at https://doi.org/10.5281/zenodo.14771859 (Lai et al., 2025).
- Article
(4387 KB) - Full-text XML
- BibTeX
- EndNote


Geochemical data from deep-time marine sediments are fundamental for reconstructing the evolution of the Earth system. By analysing the content of chemical elements in sediments and their isotopic compositions, we can reconstruct the past cycling of elements in Earth's surface systems and reveal the evolution of Earth's surface systems through time (Large et al., 2015; Reinhard et al., 2017; Farrell et al., 2021; Planavsky et al., 2023). For instance, total organic carbon (TOC), phosphorus (P), biogenic barium (Babio), copper (Cu), zinc (Zn), and nickel (Ni) enable the reconstruction of marine primary productivity and carbon cycle perturbations, thereby revealing mechanisms driving past climate fluctuations (Scott et al., 2013; Schoepfer et al., 2015; Shen et al., 2015; Schoepfer et al., 2016; Xiang et al., 2018; Jin et al., 2020; Tribovillard, 2021; Wang et al., 2022; Zhang et al., 2022; Li et al., 2023; Sweere et al., 2023; Zhao et al., 2023). Elements such as uranium (U), vanadium (V), and molybdenum (Mo) can reveal how marine redox conditions changed during critical periods in animal evolution, including mass extinctions and evolutionary radiations (Algeo and Liu, 2020; Schobben et al., 2020; Stockey et al., 2024). Oxygen isotopes (δ18O) from fossilized marine organisms can reveal oceanic palaeo-temperature changes (Veizer and Prokoph, 2015; Song et al., 2019; Grossman and Joachimski, 2020; Scotese et al., 2021; Judd et al., 2022). However, many geochemical studies have focused on high-resolution research of limited time intervals and/or regions, and there is little comprehensive exploration across large-scale geological time and globally.
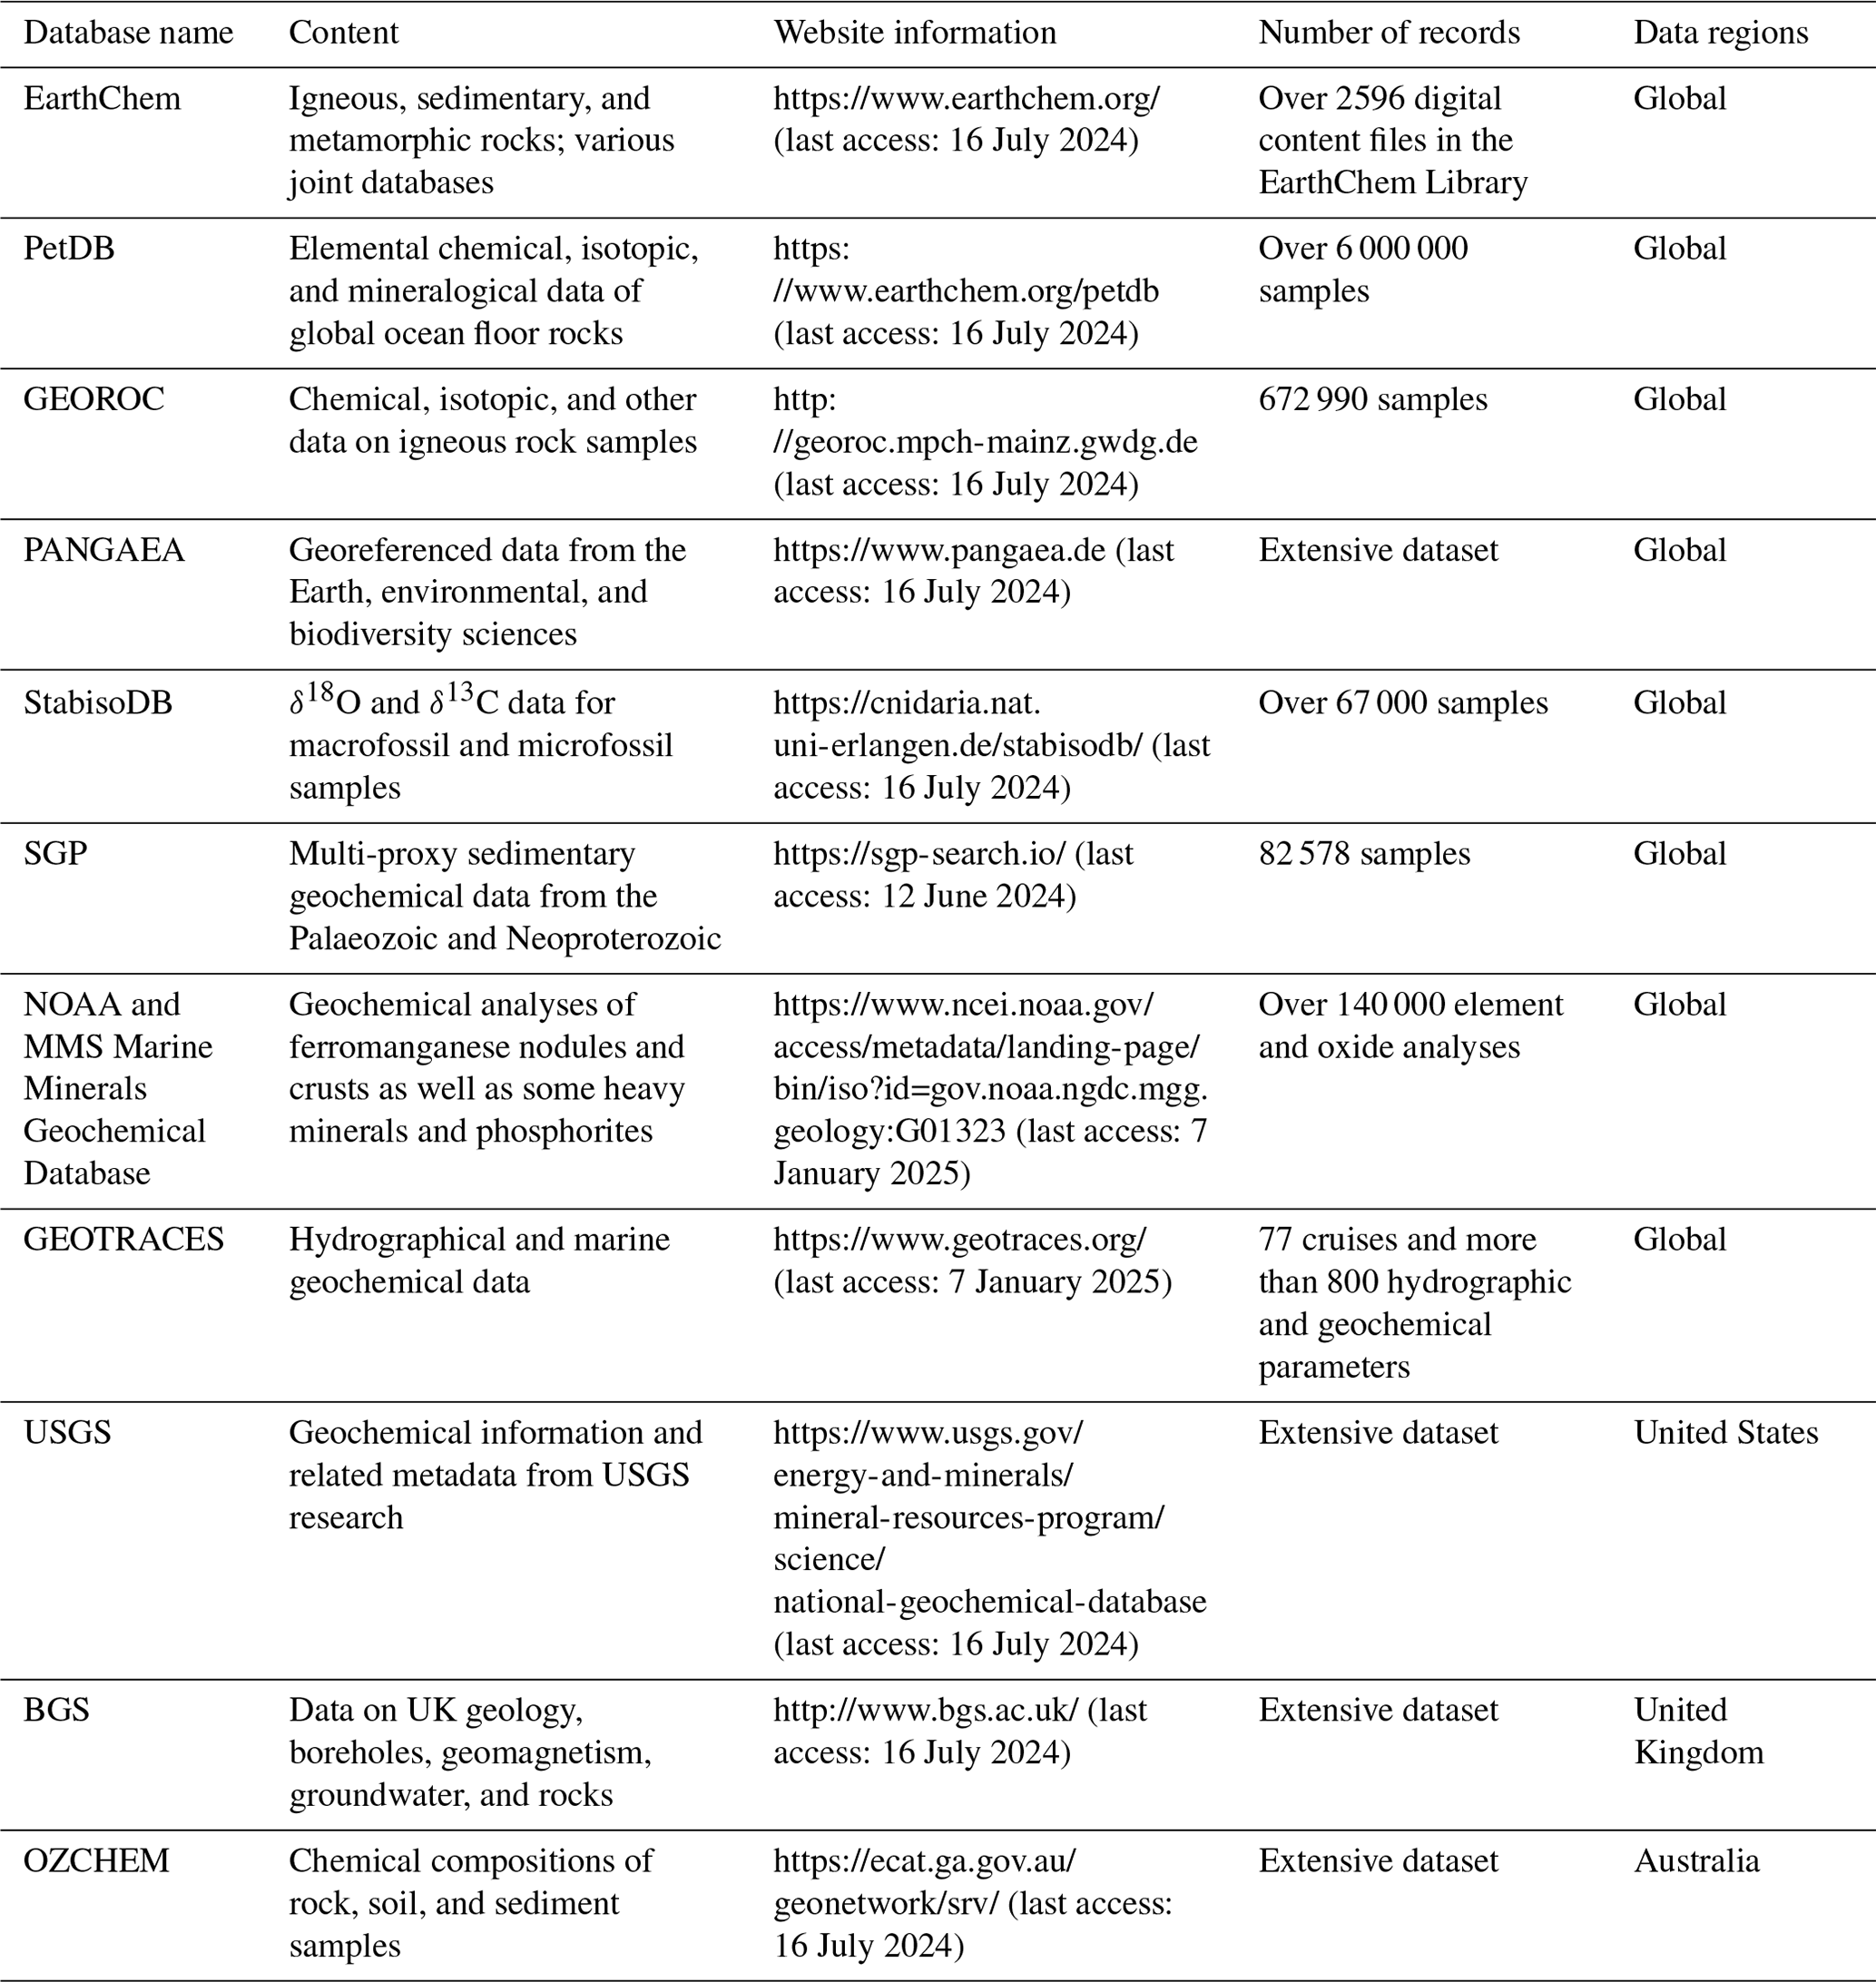
Fortunately, with more journals and institutions adopting strict data archiving rules and promoting adherence to FAIR (findability, accessibility, interoperability, and reusability) principles (Wilkinson et al., 2016; “FAIR Play in geoscience data”, 2019), a large amount of geochemical data has become accessible, and sample metadata records are more detailed. Several geochemical databases of varying scales and foci have emerged, such as the following:
-
EarthChem covers igneous, sedimentary, and metamorphic rocks and comprises numerous joint databases (https://www.earthchem.org/, last access: 16 July 2024).
-
The Petrological Database of the Ocean Floor (PetDB) includes elemental chemical, isotopic, and mineralogical data of global ocean floor igneous rocks, metamorphic rocks, minerals, and inclusions (https://www.earthchem.org/petdb, last access: 16 July 2024).
-
Geochemistry of Rocks of the Oceans and Continents (GEOROC) is a comprehensive compilation of chemical, isotopic, and other data on igneous rock samples, including whole-rock, glass, mineral, and inclusion analyses and metadata (http://georoc.mpch-mainz.gwdg.de, last access: 16 July 2024).
-
The Data Publisher for Earth & Environmental Science (PANGAEA) is used for archiving, publishing, and disseminating georeferenced data from the Earth, environmental, and biodiversity sciences and includes a large number of sediment core data (https://www.pangaea.de, last access: 16 July 2024).
-
The Stable Isotope Database for Earth System Research (StabisoDB) contains δ18O and δ13C data for more than 67 000 macrofossil and microfossil samples, including benthic and planktonic foraminifera, benthic and nektonic molluscs, brachiopods, fish teeth, and conodonts (https://cnidaria.nat.uni-erlangen.de/stabisodb/, last access: 16 July 2024).
-
The Sedimentary Geochemistry and Paleoenvironments Project (SGP) collects multi-proxy sedimentary geochemical data with an emphasis on Neoproterozoic–Palaeozoic shale data in its first data release (https://sgp-search.io/, last access: 12 June 2024).
-
The NOAA and MMS Marine Minerals Geochemical Database contains geochemical analyses and auxiliary information on present-day marine deposits of primarily ferromanganese nodules and crusts, as well as some data for heavy minerals and phosphorites (https://www.ncei.noaa.gov/access/metadata/landing-page/bin/iso?id=gov.noaa.ngdc.mgg.geology:G01323, last access: 7 January 2025).
-
The International Study of the Marine Biogeochemical Cycles of Trace Elements and Isotopes (GEOTRACES) provides hydrographical and marine geochemical data acquired over the past decade (https://www.geotraces.org/, last access: 7 January 2025).
Many other government initiatives also host databases:
-
The United States Geological Survey (USGS) National Geochemical Database is an archive of geochemical information and related metadata from USGS research (https://www.usgs.gov/energy-and-minerals/mineral-resources-program/science/national-geochemical-database, last access: 16 July 2024).
-
The British Geological Survey (BGS) provides data and information on UK geology, boreholes, geomagnetism, groundwater, and rocks (http://www.bgs.ac.uk/, last access: 16 July 2024).
-
The Australian National Whole Rock Geochemistry Database (OZCHEM) includes the chemical compositions of rock, soil, and sediment samples (https://ecat.ga.gov.au/geonetwork/srv/, last access: 16 July 2024).
Although some of these databases (Table 1) include data on ancient marine sediments, they have shortcomings such as limited spatial coverage, the lack of age data and coarse age resolution, the absence of recent publications, and missing information from the original publications. Thus, we propose the Deep-Time Marine Sedimentary Element Database (DM-SED), which focuses on the elemental content changes in marine sediments across geological history. The current version of the DM-SED contains 63 627 entries, enabling research on a series of scientific issues related to palaeo-environmental, palaeo-climatic, and elemental cycles in deep-time Earth history.
Table 1Overview of the different databases. Note: not all of the databases have a clear number of records.
The DM-SED version 0.0.1 is presented in table (.csv) format. Dynamic versions of the most recent release can be found on Zenodo (https://doi.org/10.5281/zenodo.14771859, Lai et al., 2025), and a static copy of version 0.0.1 is archived in the Geobiology database (http://geobiologydata.cug.edu.cn/, last access: 25 September 2024). In the following sections, we provide a brief overview of the database, information on the data sources and selection criteria, and a review of the definitions and decisions behind the metadata fields associated with each proxy measurement. We explore the spatial and temporal distribution trends of the compiled data and discuss future uses and limitations of the database.
The DM-SED aims to collect geochemical data from deep-time marine sediments. The database is primarily sourced from the SGP database and supplemented with 34 874 additional newly compiled entries. The SGP database contains a total of 82 578 entries, from which we selected 28 753 entries specifically related to marine sedimentary geochemical data, and is comprised of three parts. Two parts are from the U.S. Geological Survey (USGS), i.e. the National Geochemical Database (USGS NGDB, https://mrdata.usgs.gov/ngdb/rock, last access: 9 September 2024) and the Global Geochemical Database for Critical Metals in Black Shales project (USGS CMIBS; Granitto et al., 2017), with samples mainly from North America and Phanerozoic shales from various continents (Farrell et al., 2021). The third part comprises direct inputs by SGP members. The direct inputs in the Phase 1 SGP data release focused primarily on Neoproterozoic–Palaeozoic shales, although there are other lithologies and other time periods represented (Farrell et al., 2021). Our DM-SED, built upon the SGP, includes a new compilation of 34 874 entries from 433 studies, spanning approximately 3800 Myr and including entries from North America, Europe, Asia, Africa, South America, Oceania, the Pacific Ocean, and the Atlantic Ocean. This supplements the temporal and spatial distribution gaps in the SGP database, thereby creating a more comprehensive sedimentary marine geochemical database. The newly compiled literature spans the time range from 1965 to 2023, with the number of papers per decade gradually increasing (Fig. 1). It should be noted that the top of the DM-SED version 0.0.1 data is the new compilation, and the bottom contains data imported from SGP.
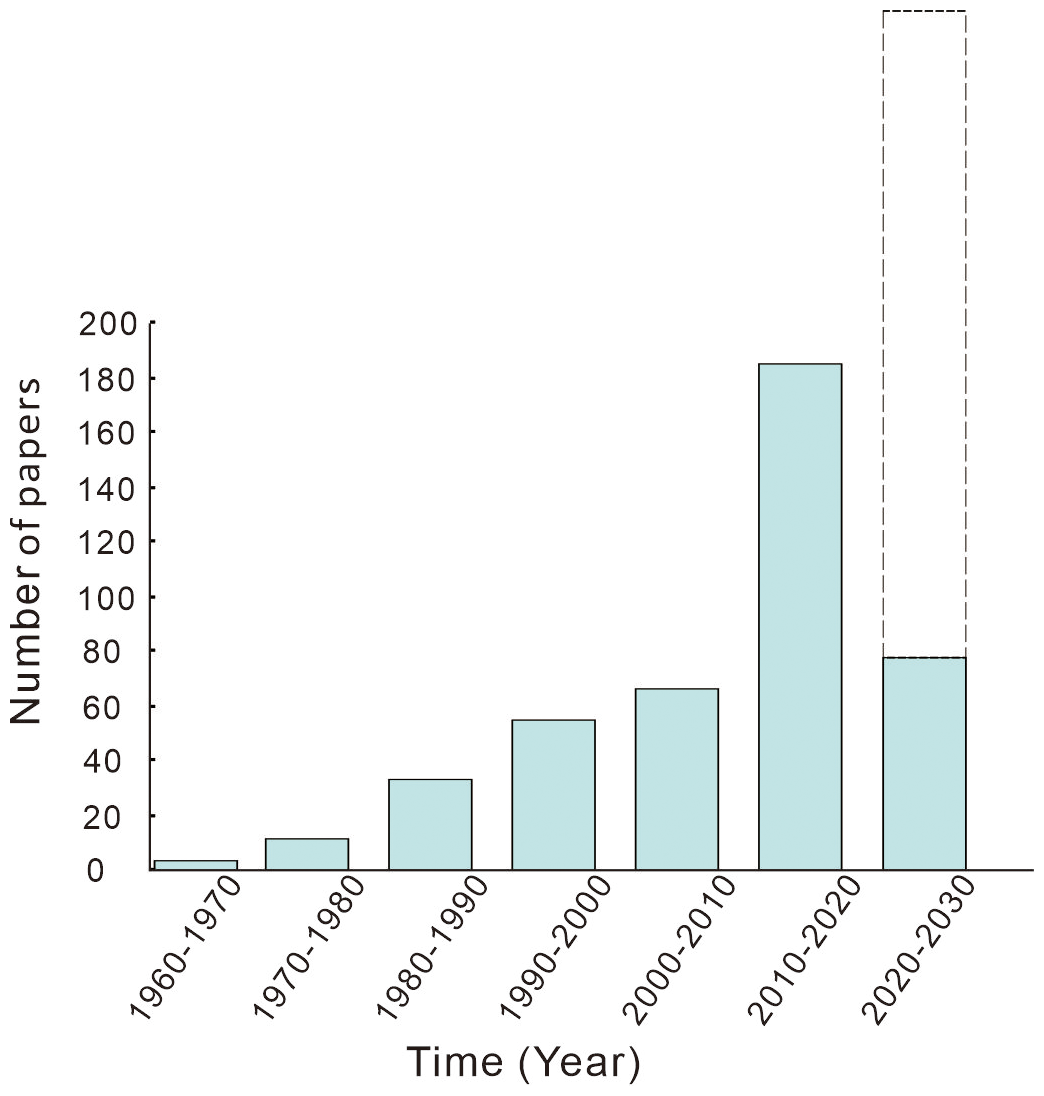
Figure 1The distribution of the publication years for the newly compiled literature (the dashed line denotes the predicted literature from 2023 to 2030).
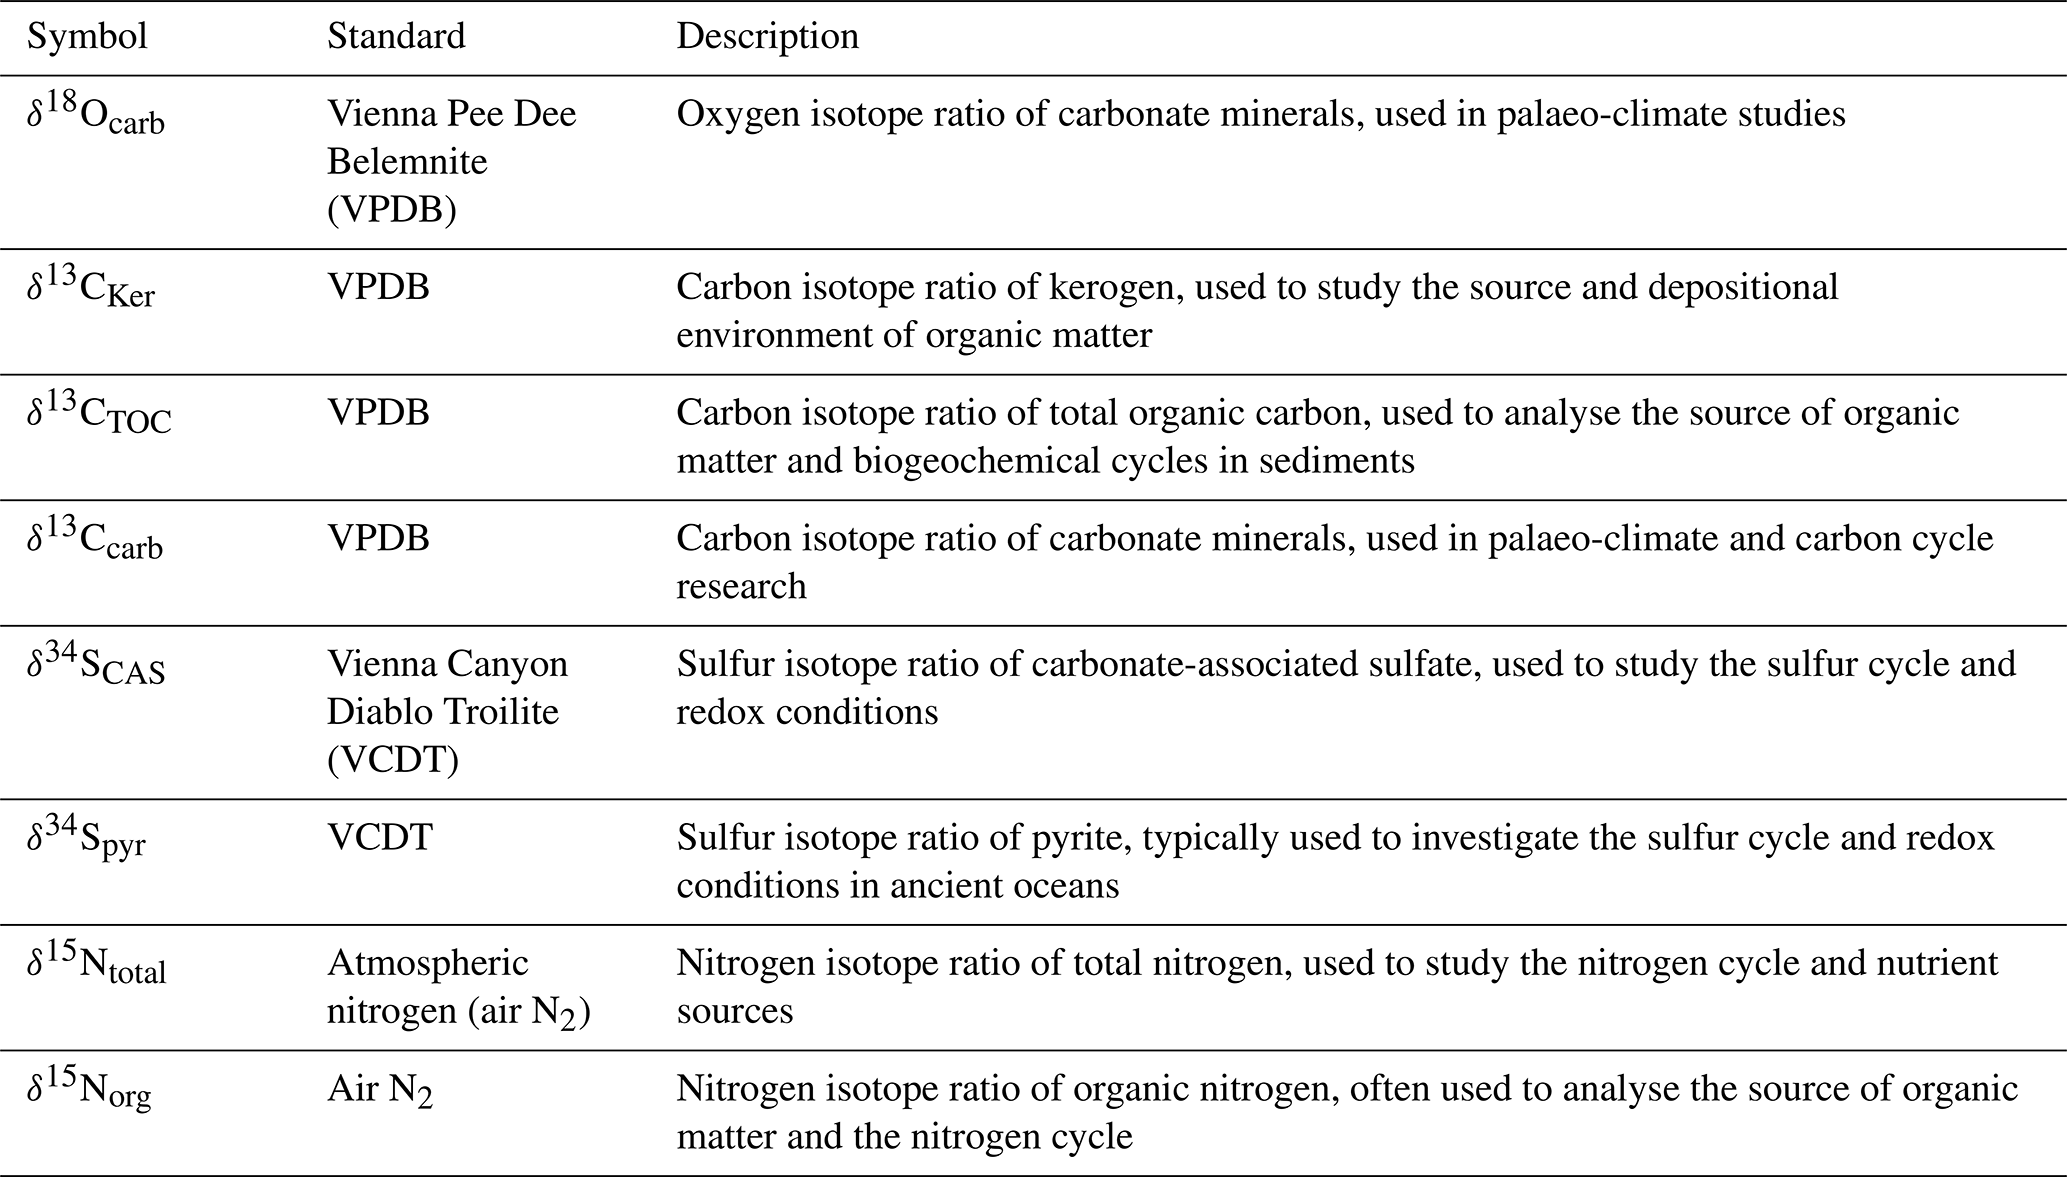
The DM-SED comprises 63 627 entries with 2 522 255 discrete data points (Table 2), each including the location (SampleID, SampleName, SiteName, Region, Elevation, SampleDepth, ModLat, ModLon, PalaeoLat, and PalaeoLon), age (Age, Period, Stage, and Biozone), stratigraphic information (LithName, LithType, Formation, and Facies), carbon element (total C, inorganic carbon Cinorg, and TOC; wt %), isotopic values (δ18Ocarb, δ13CKer, δ13CTOC, δ13Ccarb, δ34SCAS, δ34Spyr, δ15Ntotal, and δ15Norg; ‰), major elements (P, Al, Si, Ti, Fe, Ca, Mg, Na, K, S, and N; wt %), trace elements (Ag, Ar, As, B, Ba, Be, Bi, Br, Cd, Ce, Co, Cr, Cs, Cu, Dy, Er, Eu, Ga, Gd, Ge, Hf, Hg, Ho, In, La, Li, Lu, Mn, Mo, Nb, Nd, Ni, Pb, Pr, Rb, Re, Sb, Sc, Se, Sm, Sn, Sr, Ta, Tb, Te, Th, Tl, Tm, U, V, W, Y, Yb, Zn, and Zr; ppm), methodology (TOC methods, major element methods, and trace element methods), and data sources (Reference and Project). The specific names and descriptions of each field in the database are shown in Table 3. The standards and descriptions of the isotope ratios in the database are shown in Table 4.
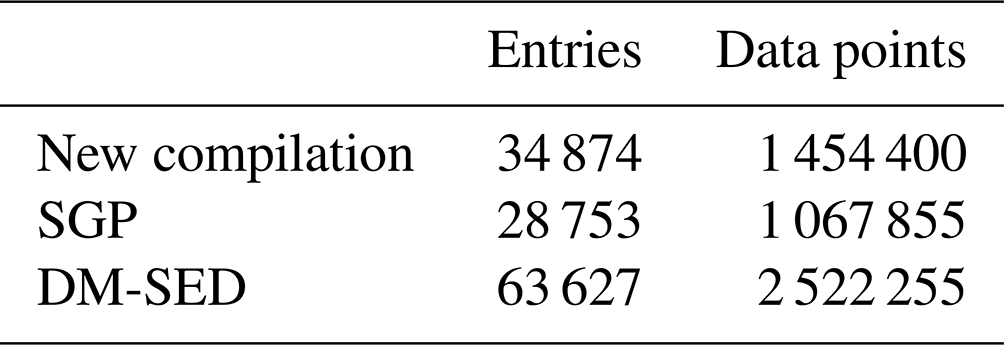
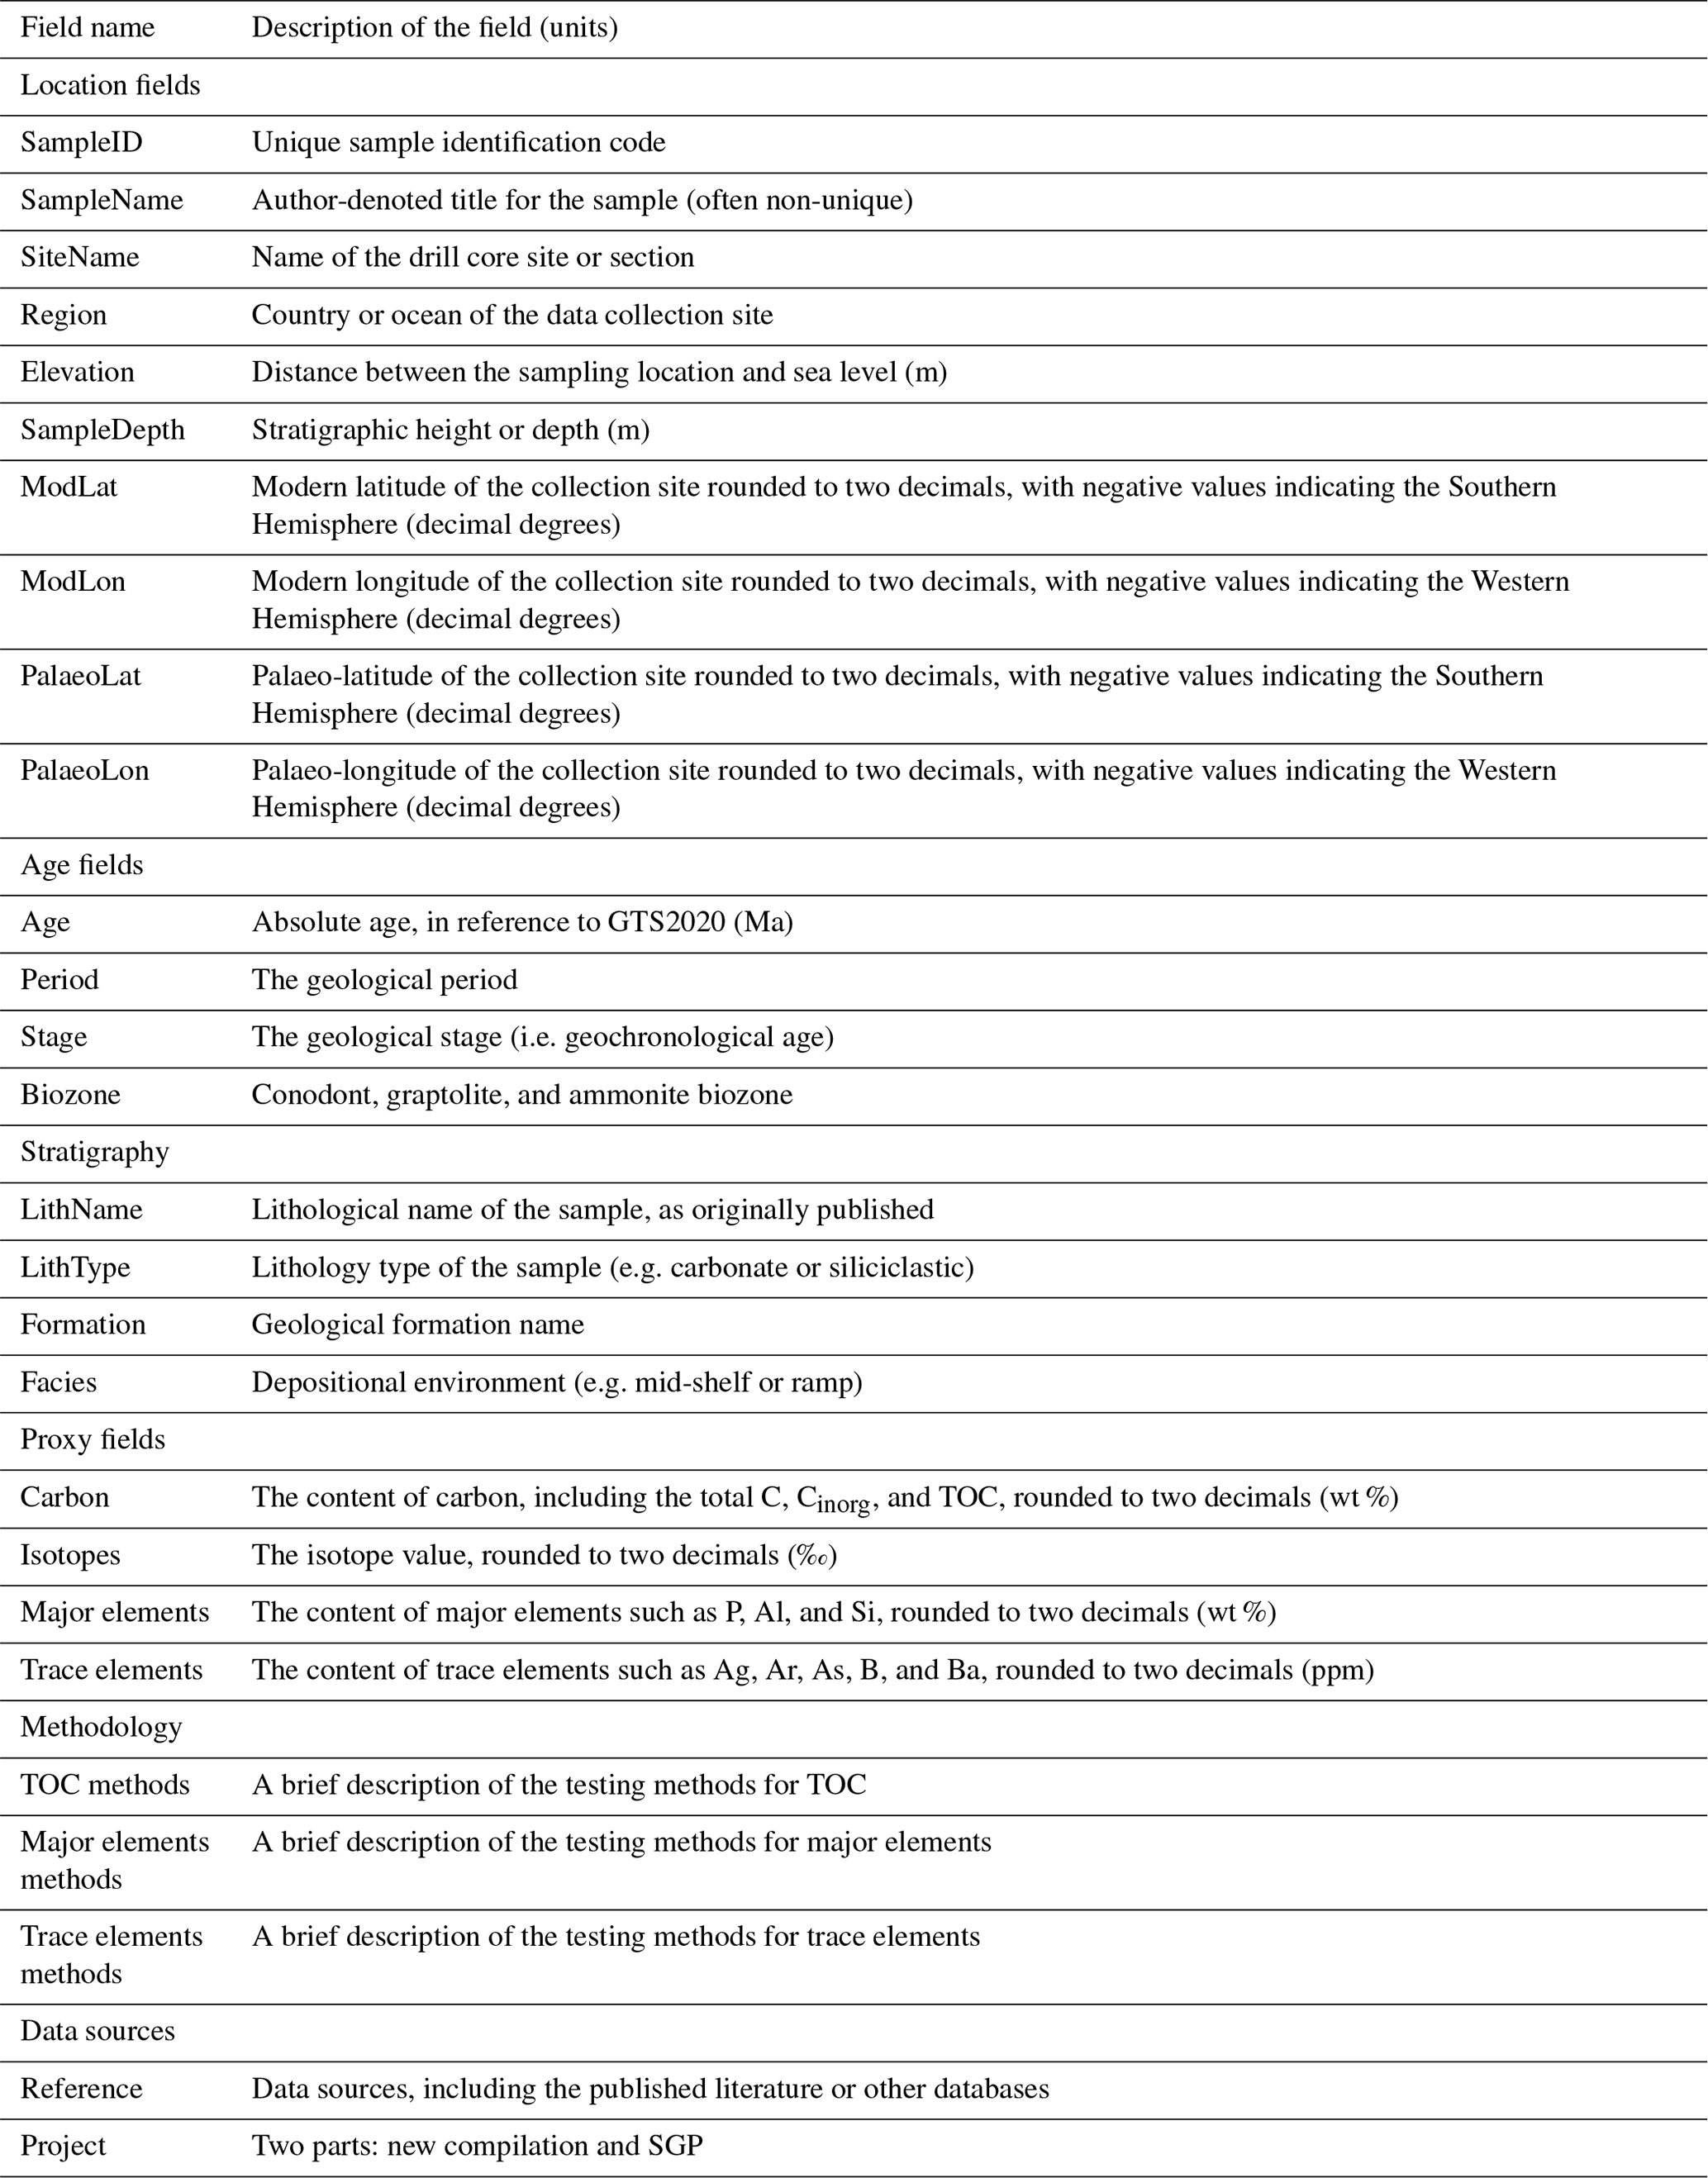
Table 4Standards and descriptions of isotope ratios in the DM-SED.
This section details the screening and processing criteria for sample location, age, lithology and facies, specific geochemical values, and data source information (Fig. 2).
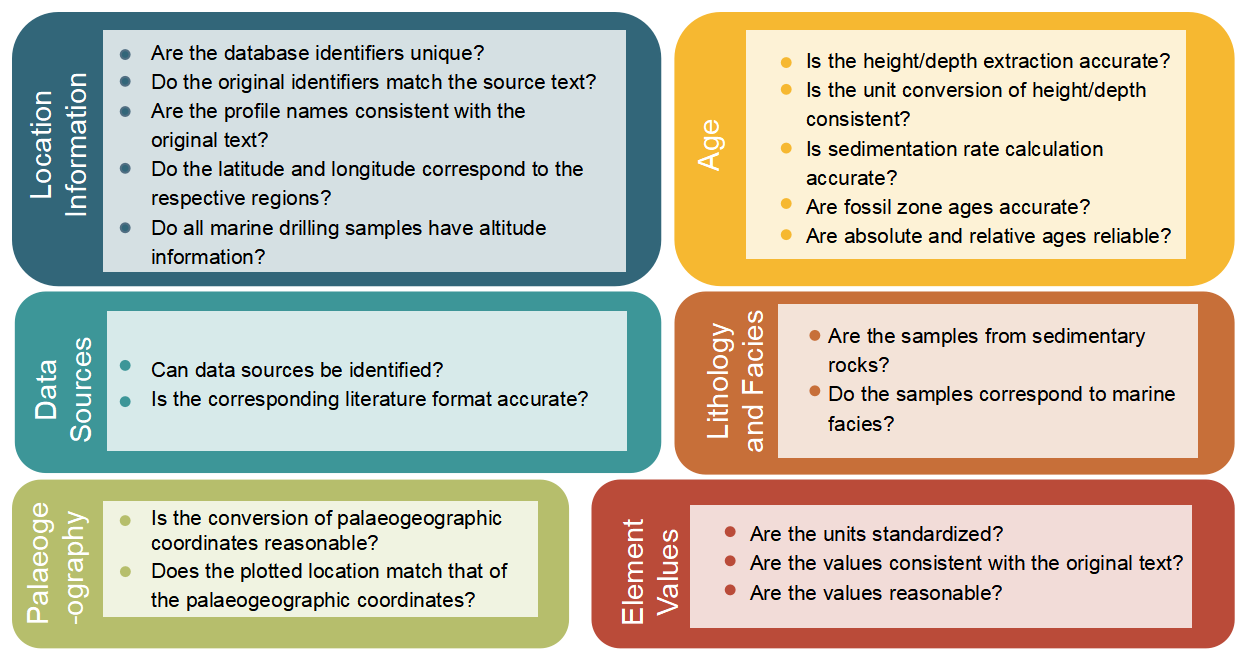
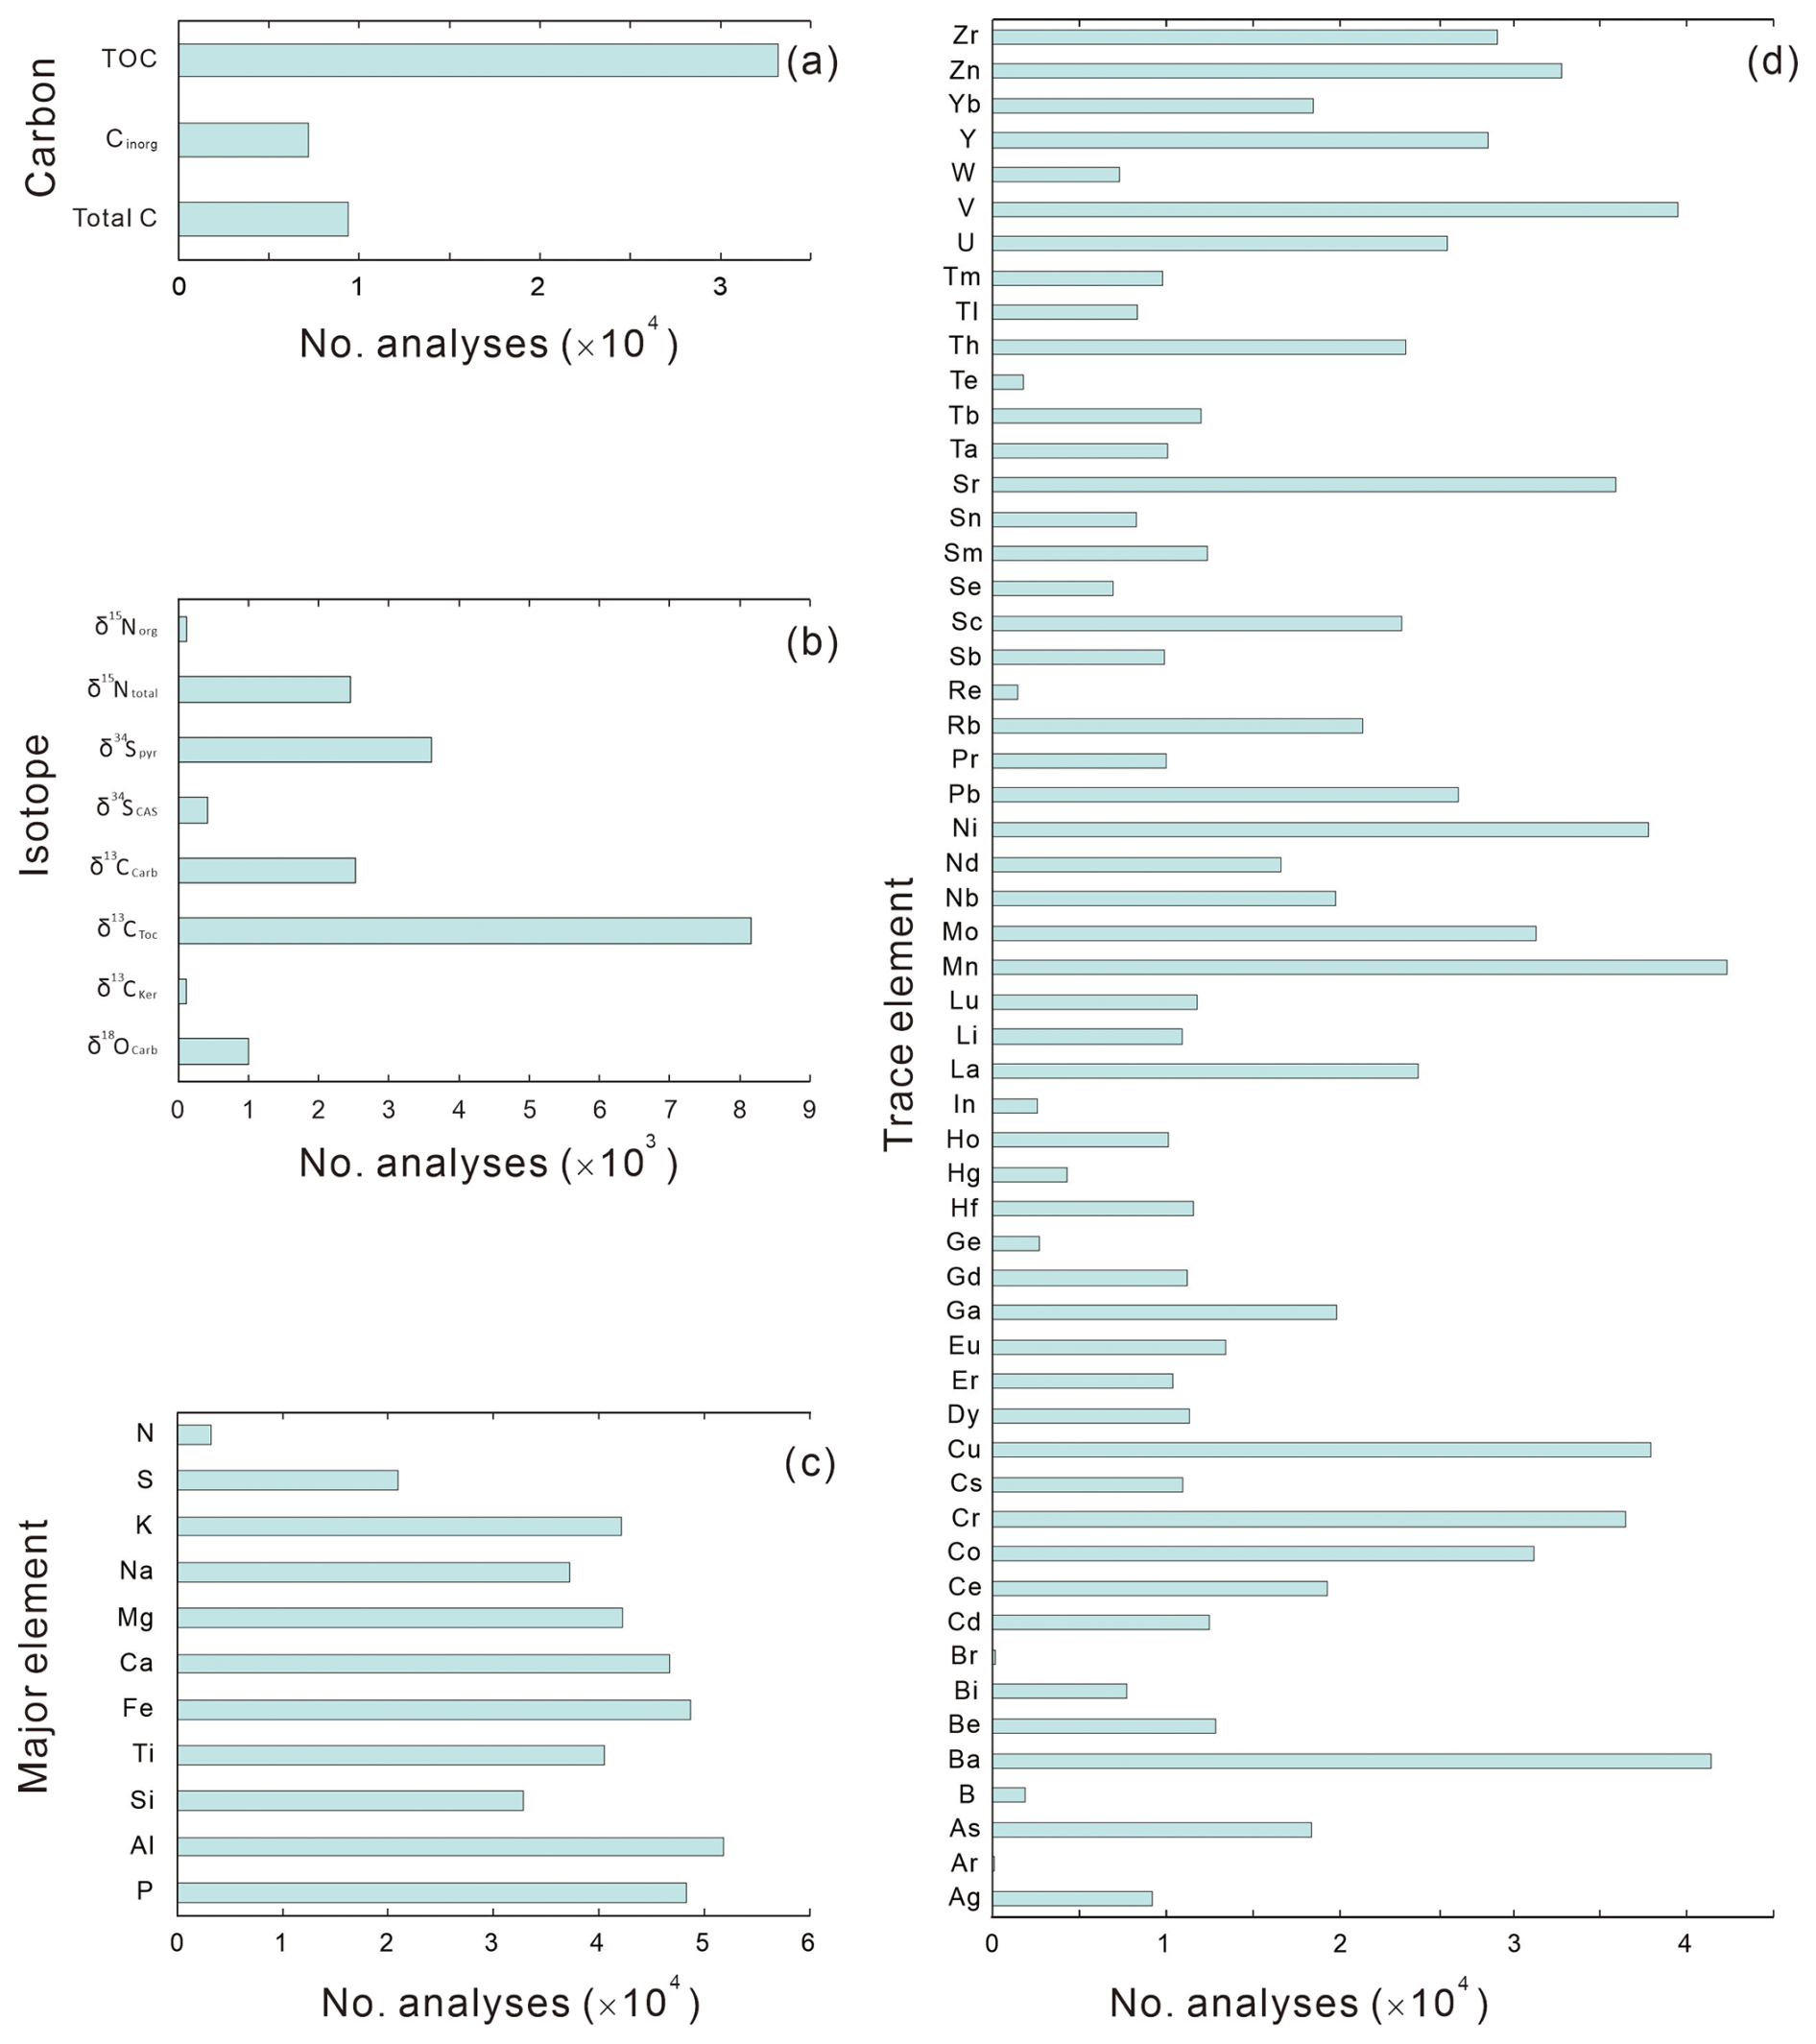
Figure 3Histogram distribution of the different subsets. (a) Carbon elements. (b) Isotopes. (c) Major elements. (d) Trace elements.
For sample location, the database includes SampleID, SampleName, SiteName, Region, Elevation, SampleDepth, ModLat, ModLon, PalaeoLat, and PalaeoLon. A unique SampleID is assigned to each sample in the DM-SED. The SampleName corresponds to the identifier given in each referenced publication, facilitating cross-referencing with the original data. The SiteName includes well name or outcrop information, representing the smallest unit of location information. The Region indicates the country or ocean area where the sample has been collected and represents a broader geographical range. The Elevation data are mainly related to samples from the Deep Sea Drilling Project (DSDP) and the Ocean Drilling Program (ODP) collected from post-Cretaceous sediments and indicate whether the samples originate from deep or shallow marine environments. The SampleDepth refers to the relative position (m) of the sample within the well or outcrop, which is crucial for calculating the sample age. In some publications, specific heights are not provided directly but are given as relative heights through figures. We extracted these heights manually using WebPlotDigitizer, rounding to two decimal places (Drevon et al., 2017). For publications in which heights are expressed in feet or centimetres, we converted the units to metres. Modern latitude and longitude (ModLat and ModLon) information forms the most precise location data. Although some publications provide exact coordinates, many offer only section names (i.e. the SiteName) and regions or merely a map marking the location of the section. For publications providing section names, we determined accurate coordinates by consulting other studies carried out in the same section. For those providing only a map marking the location of the section, we used Google Maps to estimate relative coordinates. To ensure consistency, we recorded sample coordinates in decimal degrees, rounded to two decimal places, with positive values indicating latitude north and longitude east and negative values indicating latitude south and longitude west. The coordinate reference system is WGS84 (World Geodetic System 1984). For palaeo-coordinates, we reconstructed palaeo-latitude and palaeo-longitude (PalaeoLat and PalaeoLon) using the sample age and modern coordinates, employing the PointTracker v7 rotation files from the PALEOMAP project, which are based on current geographic reference data and global tectonic history models (Scotese, 2008). It is important to note that we only generated palaeo-geographic locations for samples from the Phanerozoic, as the geological records from this time are more complete and abundant compared to those from the Precambrian, making the reconstruction of geographic features (such as ancient oceans, mountains, or plains) relatively more reliable and accurate (Scotese and Wright, 2018). We plotted the sample points on palaeo-geographic maps based on Scotese's data using QGIS 3.16 (Scotese and Wright, 2018).
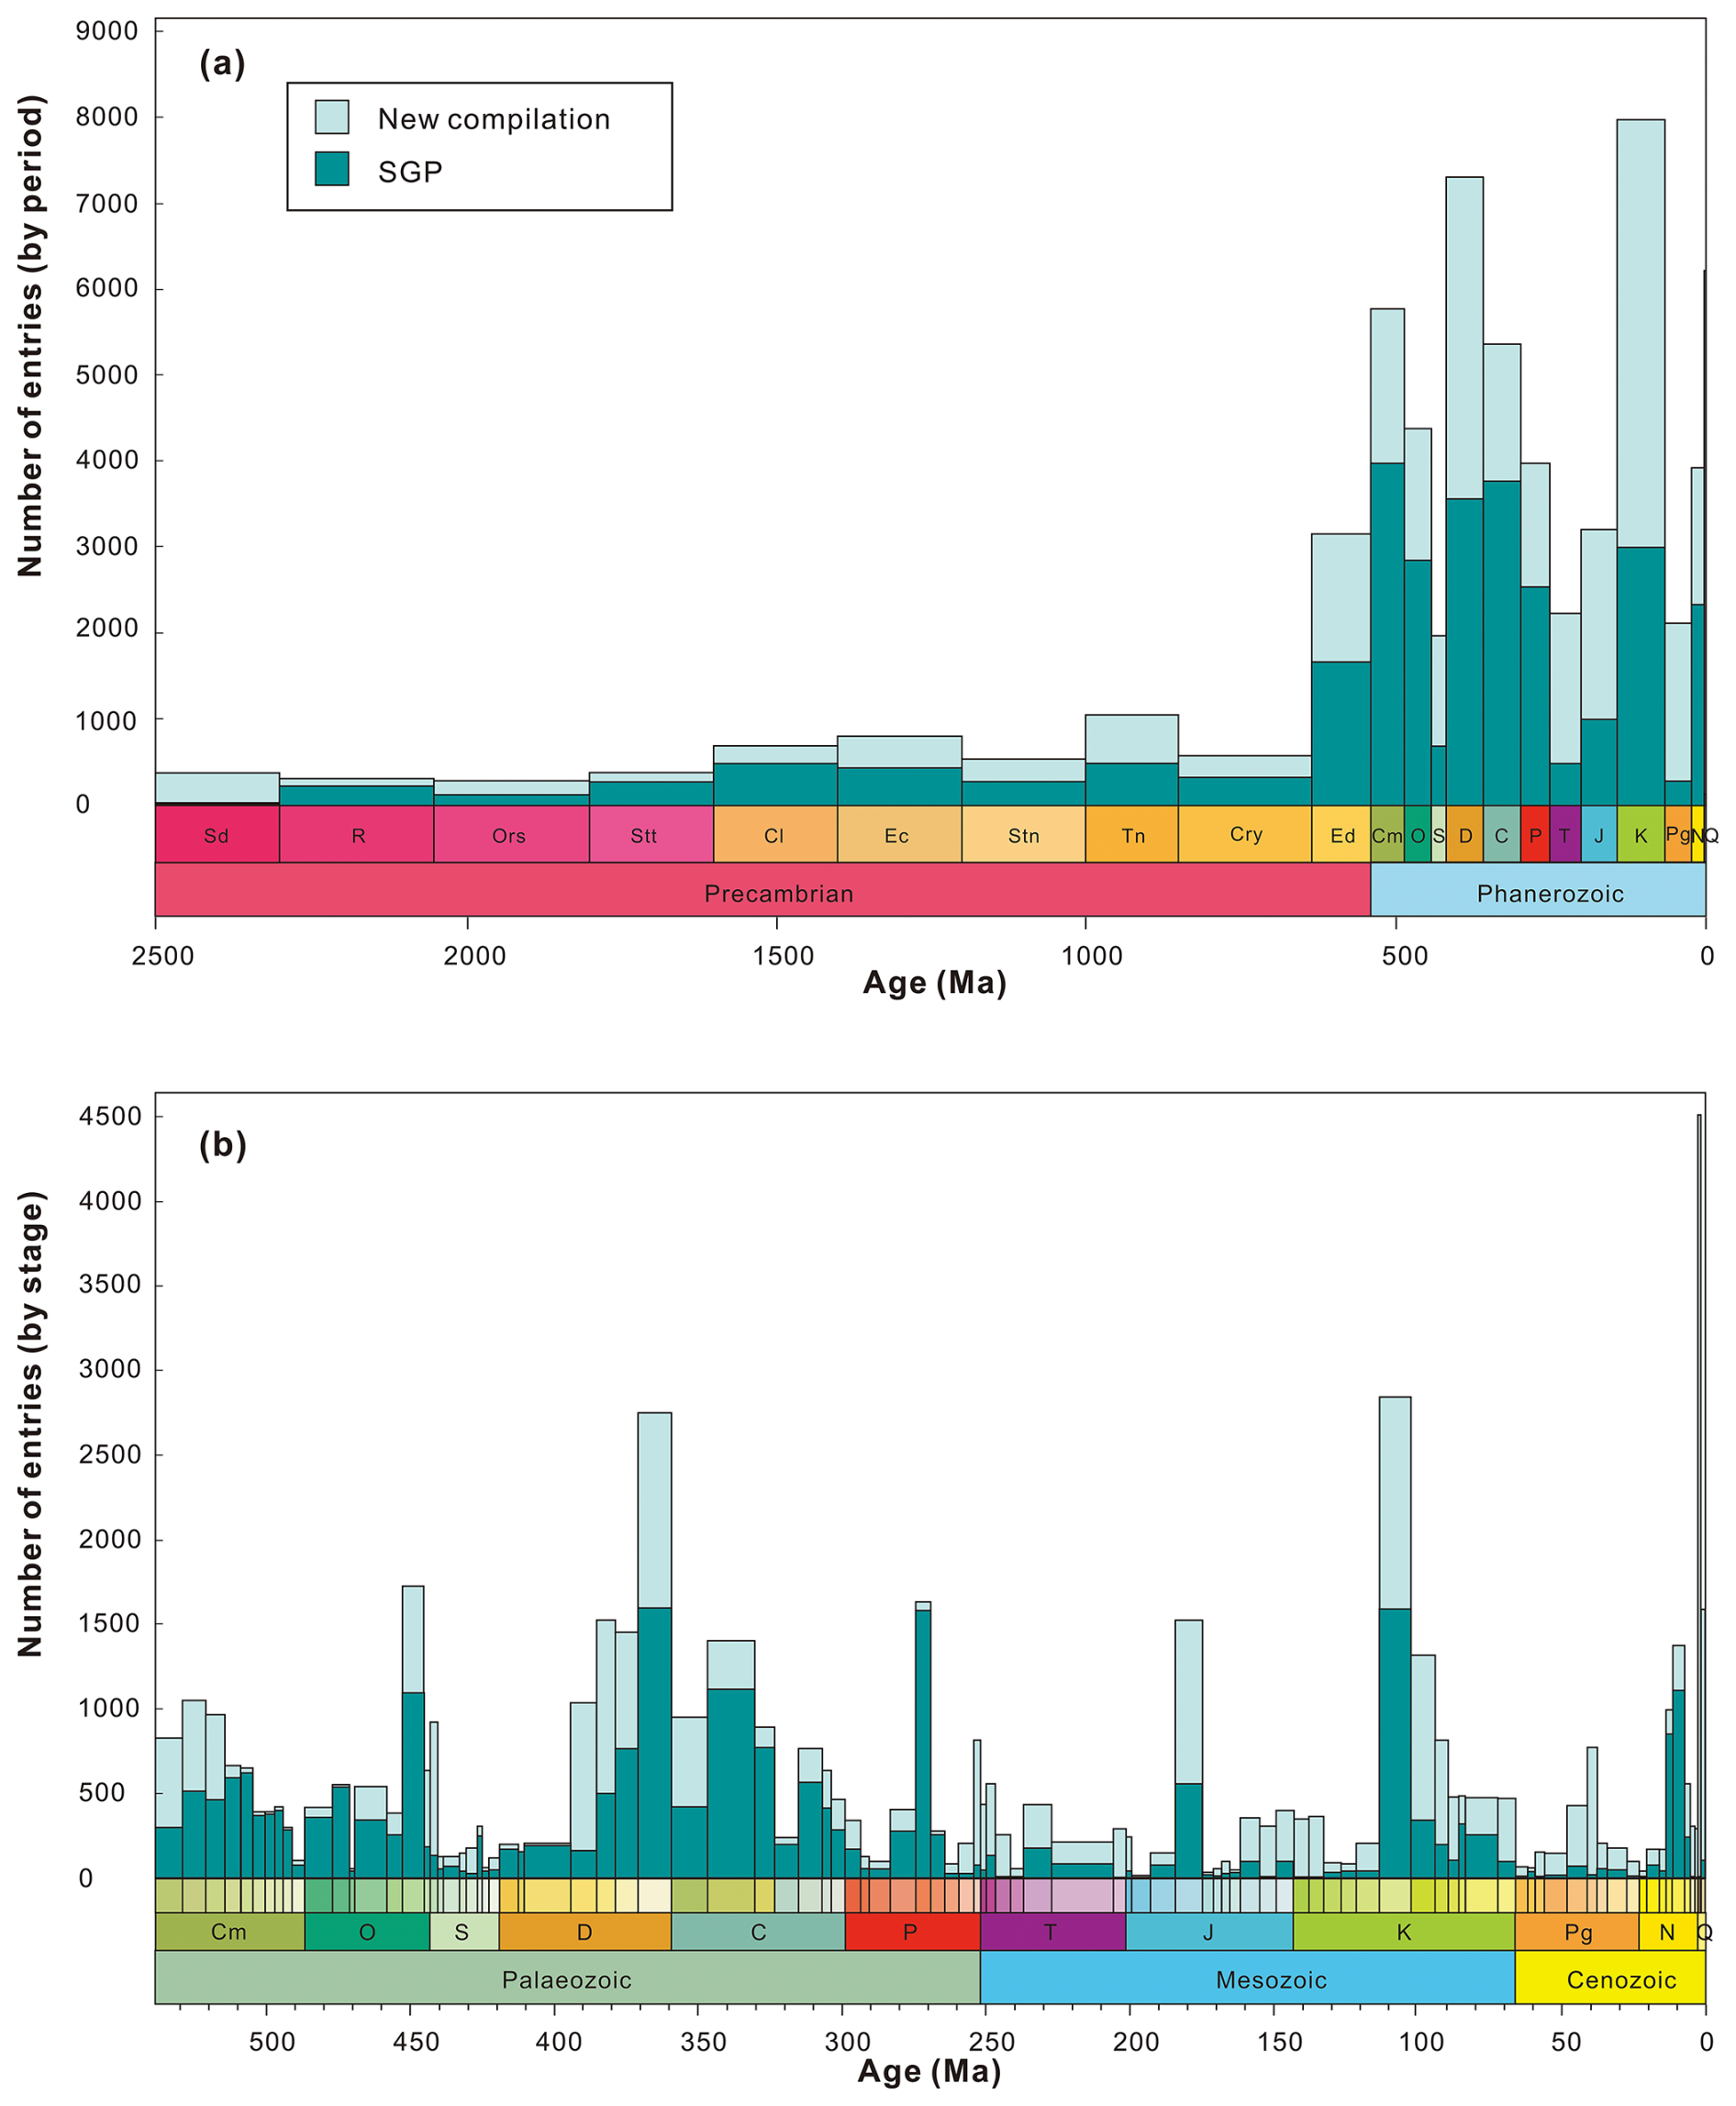
Figure 4The age distribution of samples in the database. (a) Age distribution of samples (excluding a small number of samples with ages > 2500 Ma from the figure, for a total of 1258 samples). (b) Age distribution of Phanerozoic samples at the stage level. Sd: Siderian; R: Rhyacian; Ors: Orosirian; Stt: Statherian; Cl: Calymmian; Ec: Ectasian; Stn: Stenian; Tn: Tonian; Cry: Cryogenian; Ed: Ediacaran; Cm: Cambrian; O: Ordovician; S: Silurian; D: Devonian; C: Carboniferous; P: Permian; T: Triassic; J: Jurassic; K: Cretaceous; Pg: Paleogene; N: Neogene; Q: Quaternary.
To assign specific ages to each sample in the database, we assumed a constant sedimentation rate within the same formation or group of section. If the original studies provided numerical ages for two or more samples, we calculated the precise age for each sample based on the sedimentation rate and assigned it accordingly. If absolute ages were not provided in the original literature, we assigned approximate ages based on corresponding fossil zones or the general age of the same lithostratigraphic unit in the same region (Farrell et al., 2021; Judd et al., 2022). For samples with completely missing height information in the original text, we assigned the same age to all samples within the section based on lithostratigraphic information. However, the primary age constraints for these samples (mainly from the USGS NGDB and USGS CMIBS) remain derived from SGP age calls. Once each sample had a specific age, we assigned it to a specific period and stage according to its age. We attempted to incorporate the most recent age models; however, due to the extensive size of the data compilation, it was not feasible to update all of them. All of the ages were based on the timescale provided by the Geologic Time Scale 2020 (GTS 2020; Gradstein et al., 2020). Although GTS 2020 is accurate, readers are advised to consult the incremental updates of the International Chronostratigraphic Chart (ICS) for the most accurate stratigraphic intervals.
For lithology and facies, the lithologies include shale, mudstone, sandstone, limestone, and dolostone. We classified these into two types of rocks: siliciclastic sedimentary rocks (88.7 %) and carbonate rocks (11.3 %). For the outcrop sections, the lithostratigraphic unit was generally available; however, for data from marine drilling sites, there was often no corresponding lithostratigraphic unit information. Regarding facies classification, before the Cretaceous, the primary depositional environment was marine settings on the continental crust, including specific facies such as inner shelves, outer shelves, and basins. However, after the Cretaceous, with most samples coming from the DSDP and ODP, shallow marine depositional environments still existed and were sampled, but deep-sea pelagic settings began to be sampled as well.
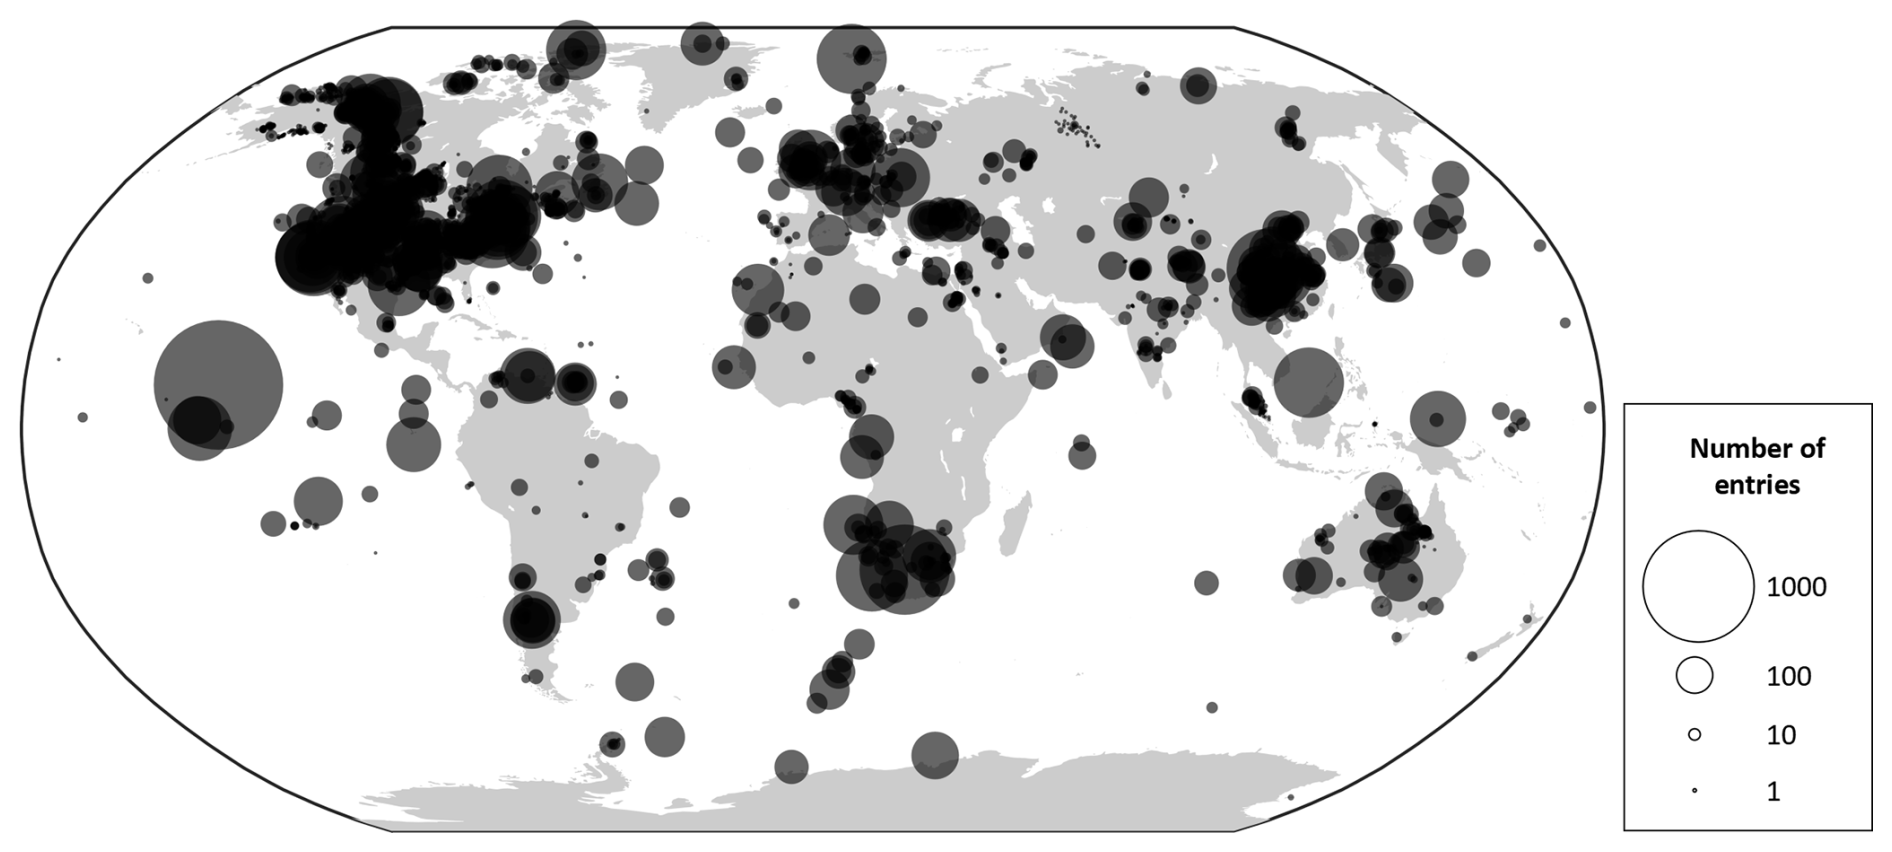
Figure 5Bubble chart of the modern geographical distribution and sample quantities in the database.
For specific geochemical values in the DM-SED, we standardized the units, converting oxides to elements, e.g. P (ppm) to P (wt %) or P2O5 (wt %) to P (wt %). If a sample was analysed multiple times, we averaged the value. For the literature before 2000, some data were preserved as images, requiring manual extraction of values, and some images were slightly blurry, potentially leading to minor human error. We excluded data that were beyond detection limits (e.g. the trace element content is too low and the value provided in the text represents the minimum detection limit) or unreasonable (e.g. negative values for major and trace elements).
For the geochemical methodology, we briefly documented the geochemical methodology based on the descriptions in the original text, focusing primarily on the testing methods and instrument models used for TOC, major elements, and trace elements. Methods for stable isotopes were not documented, as the testing methods vary for different isotopes and, due to the limited amount of isotope data, recording them holds little significance.
Regarding the data sources, we ensured that each corresponding reference was collected and listed in full citation format, including authors, title, publication date, journal, page numbers, and DOI. Most data in the SGP database came directly from the USGS NGDB and USGS CMIBS, without the corresponding literature sources, and so we marked them individually. The entire database for this project was divided into two parts: new compilation and SGP. We used keyword searches in Google Scholar to identify missing references and made efforts to target the literature for data-scarce regions (e.g. South America) and time intervals (e.g. the Silurian or Jurassic).
The elemental data content distribution for the entire database is shown in Fig. 3. Overall, major elements have the highest data quantity, followed by trace elements and carbon elements, with isotope data having the lowest quantity. Among the major elements, N has the fewest entries with 3164, whereas the other major elements all have more than 10 000 entries. Al has the highest quantity, with 51 906 records. Among the trace elements, Mn has the largest record (42 499 records), followed by Ba (41 471 records). Ar and Br have the fewest records, with 9 and 176, respectively. Other elements such as Ag, B, Bi, Ge, Hg, In, Re, Se, Sn, Te, Tl, Tm, and W have data quantities ranging from 1000 to 10 000. Elements such as As, Be, Cd, Ce, Co, Cr, Cs, Cu, Dy, Er, Eu, Ga, Gd, Hf, Ho, La, Li, Lu, Mo, Nb, Nd, Ni, Pb, Pr, Rb, Sb, Sc, Sm, Sr, Ta, Tb, Th, U, V, Y, Yb, Zn, and Zr all have more than 10 000 records each. For carbon elements, TOC has the largest record (32 906 entries), followed by total C (9386 entries), while Cinorg has the smallest record (7215 entries). Isotope data are overall less abundant, with none exceeding 10 000 entries; the most abundant data are from δ13CTOC with 8166 records, and the least abundant data are from δ13CKer with only 112 records.
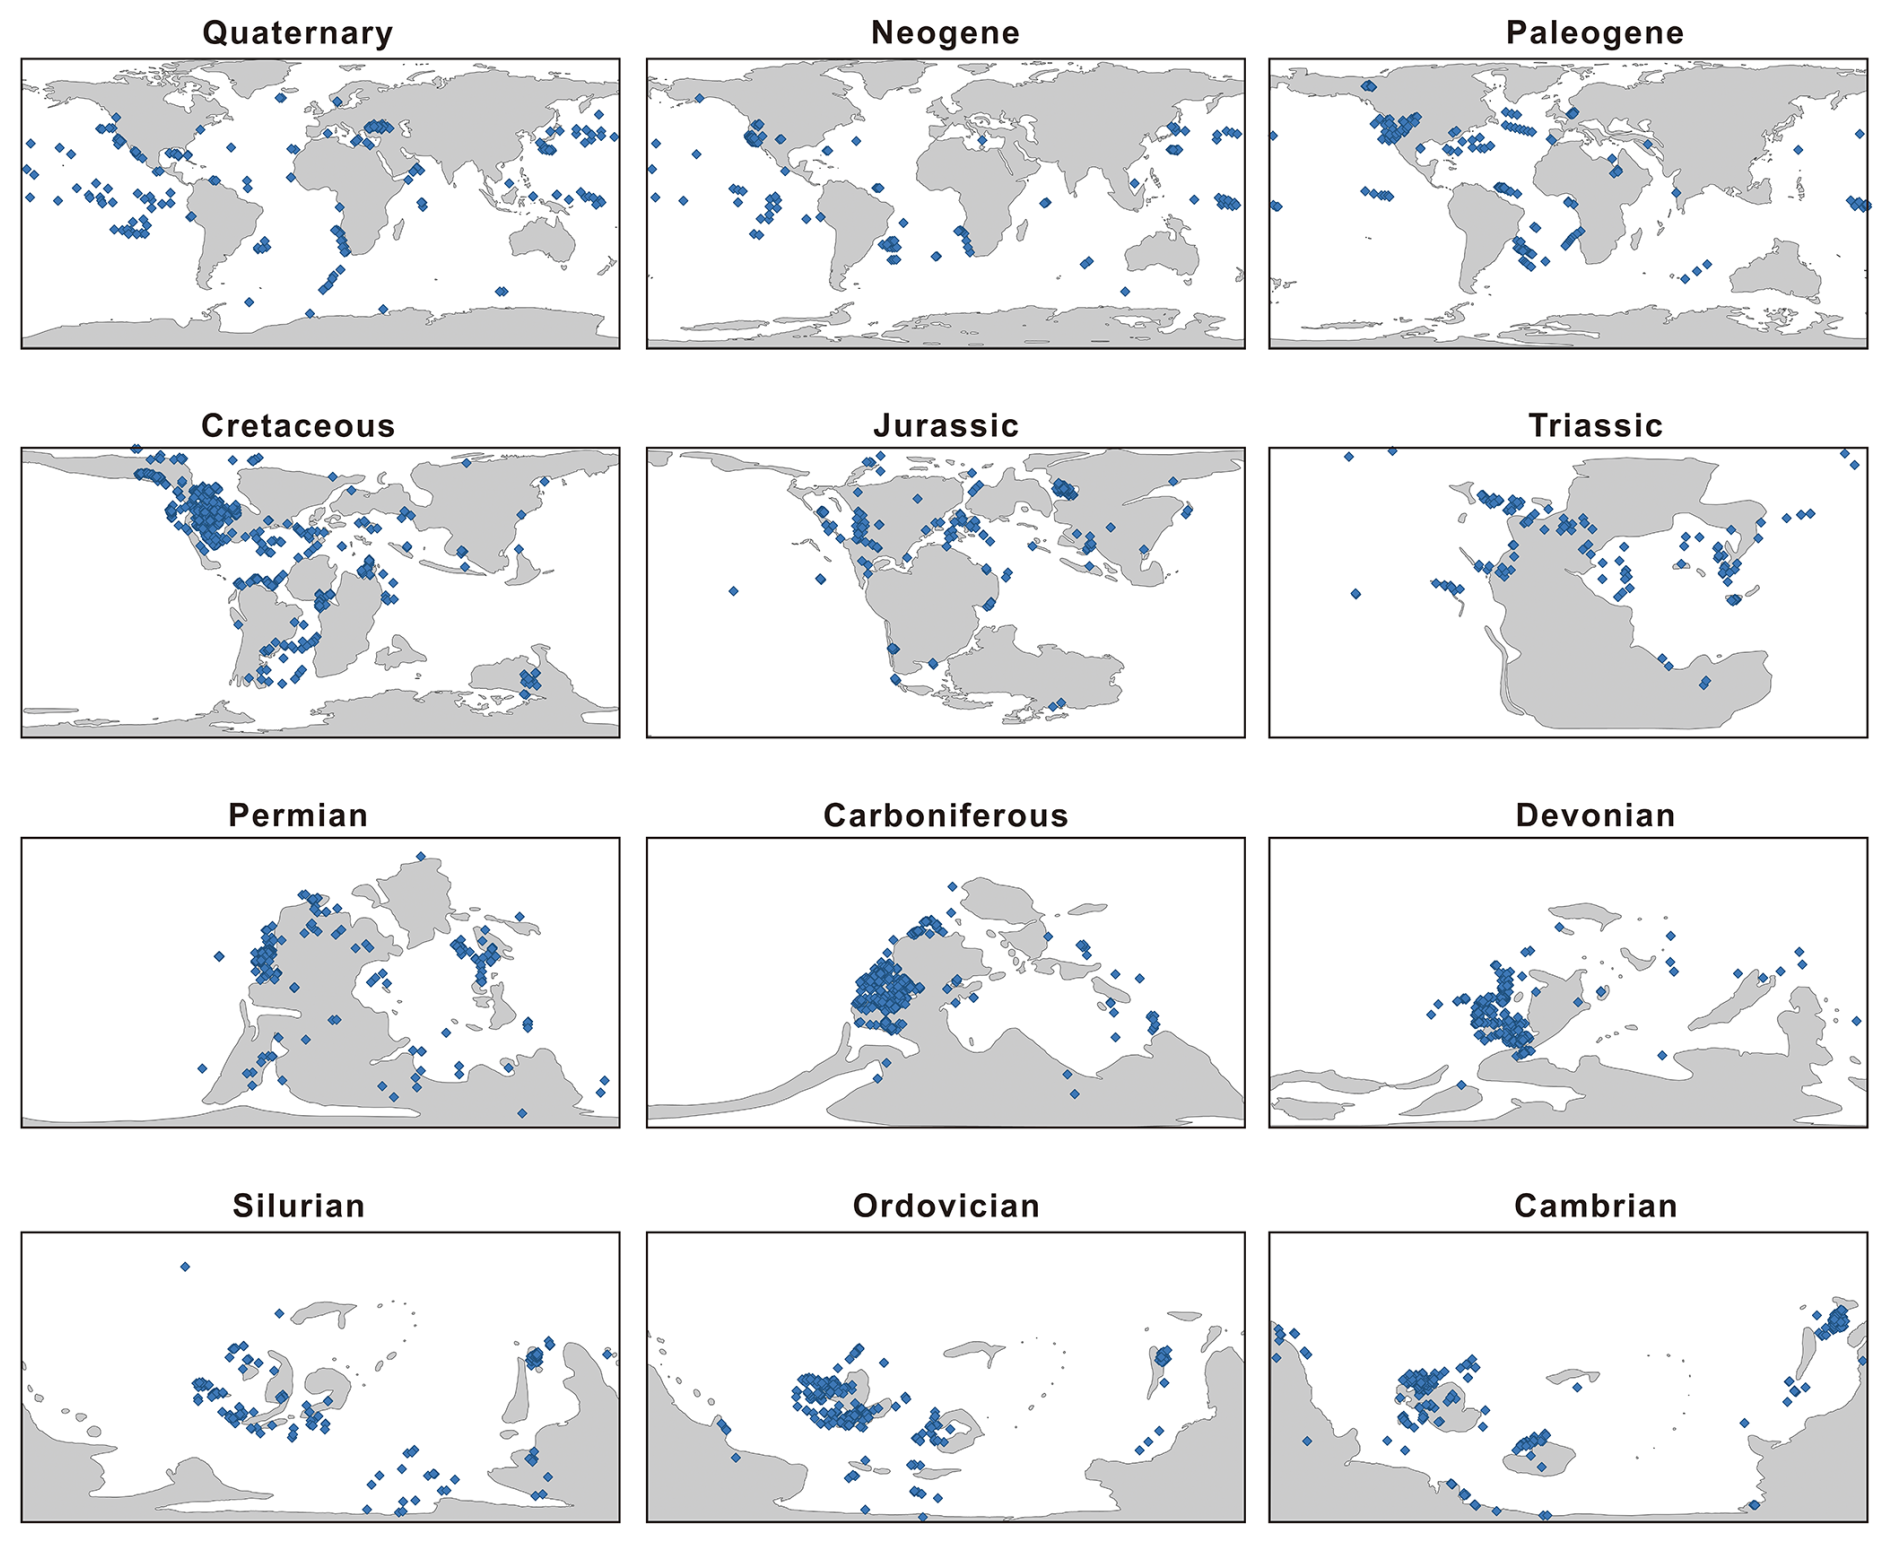
Figure 6The palaeo-geographic distribution of sample sites in the DM-SED.
The temporal trend of data density in the entire database, shown in Fig. 4a, indicates that the data are primarily distributed in the Phanerozoic, which accounts for 85 % of the entire database. Within the Phanerozoic, the Cenozoic accounts for 19 % of the database, the Mesozoic accounts for 21 %, and the Palaeozoic accounts for 45 %. Precambrian data account for only 15 % of the entire database. The SGP data are most concentrated in the Palaeozoic, in which they make up 27 % of the total database, with the newly compiled data contributing only 18 %. In other eras, the newly compiled data outnumber the SGP data: 4 % versus 15 % in the Cenozoic, 7 % versus 14 % in the Mesozoic, and 7 % versus 8 % in the Precambrian. This is mainly the case because the SGP data in the first phase were primarily from the Neoproterozoic and Palaeozoic (Farrell et al., 2021).
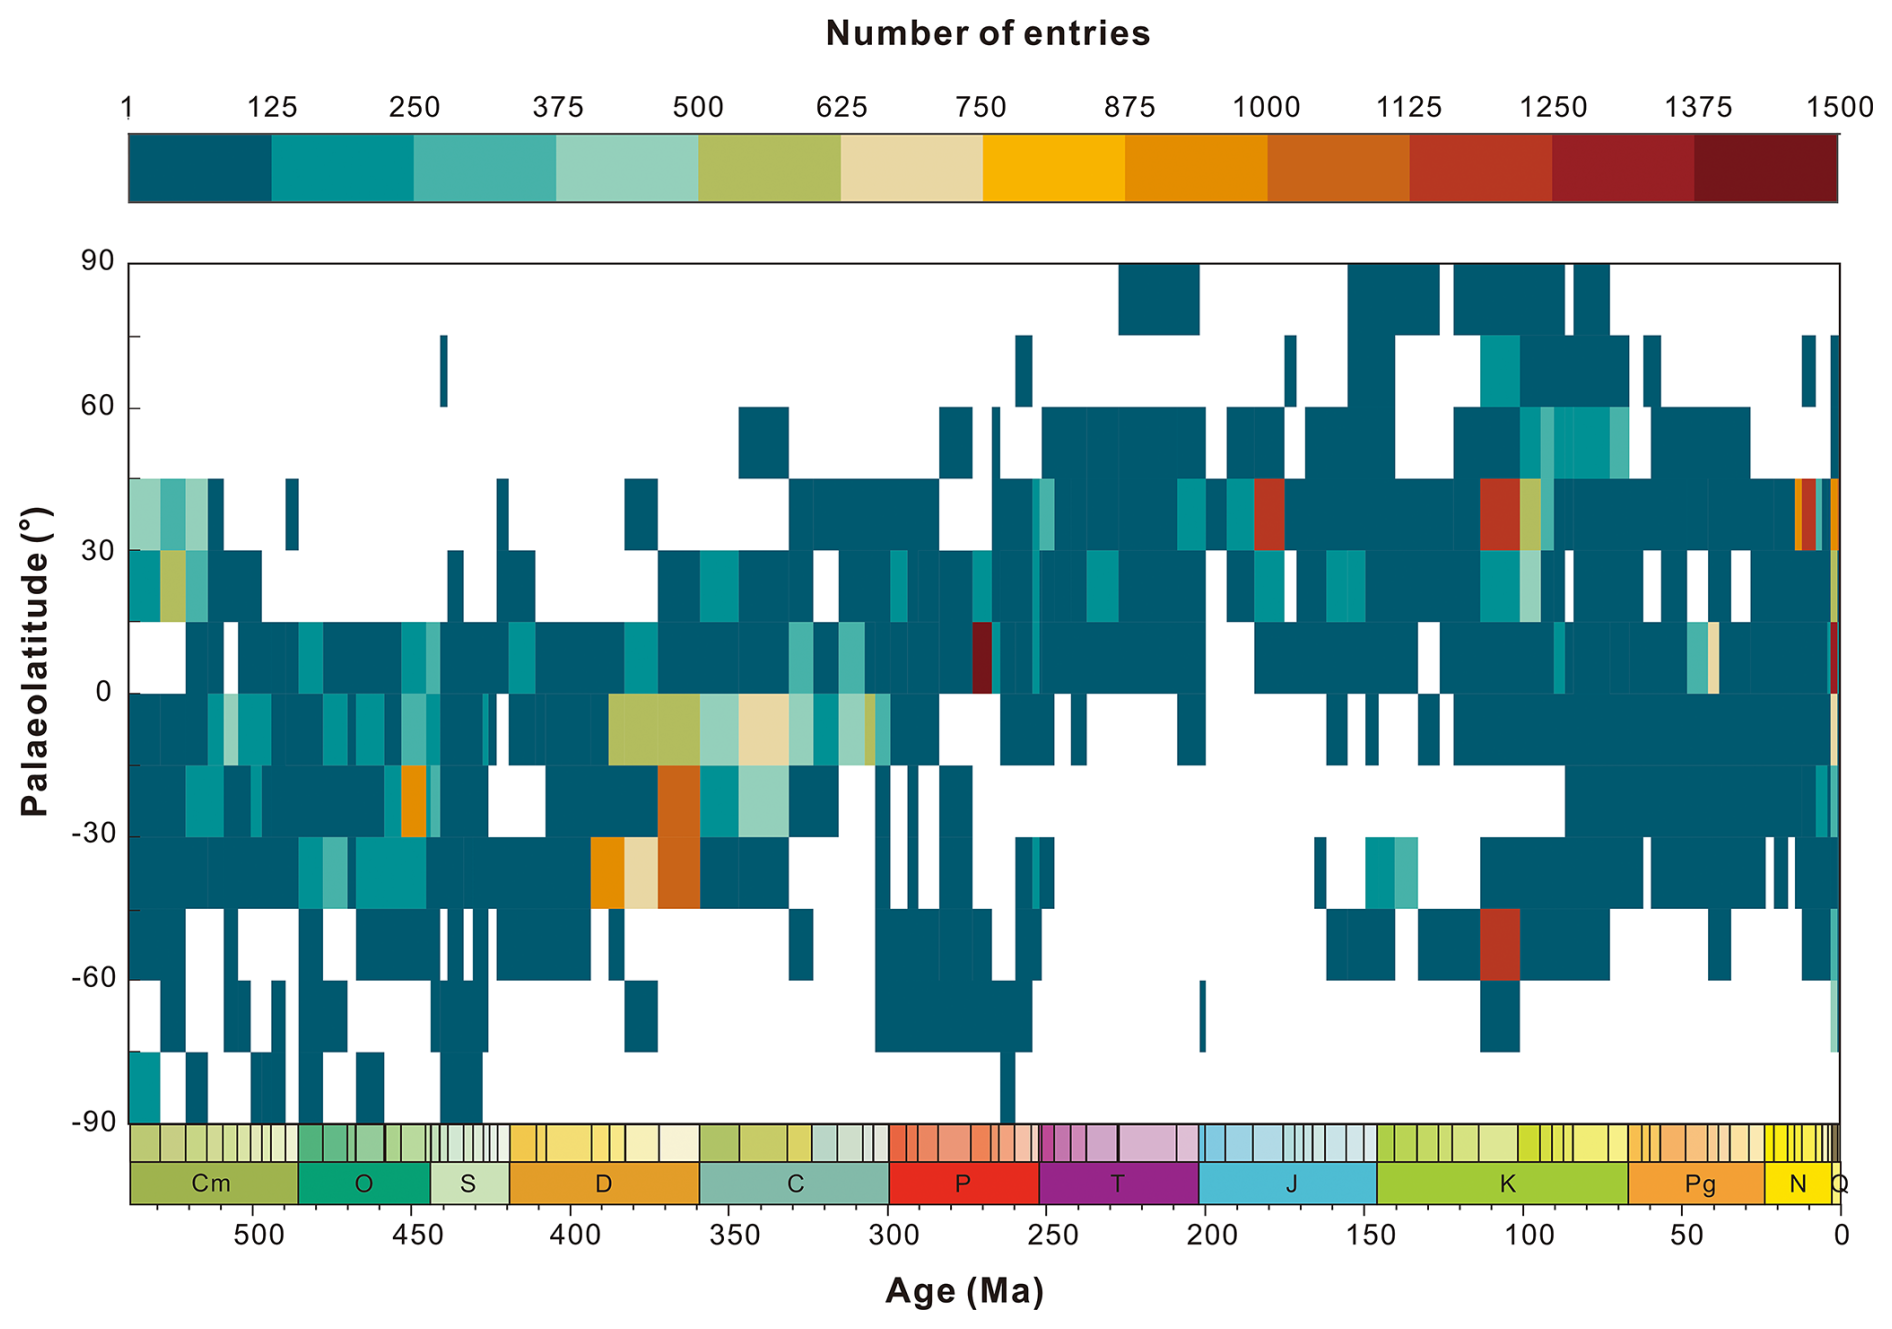
Figure 7The spatio-temporal distributions of sample quantities (categorized temporally by stage and spatially by palaeo-latitude intervals of 15°).
For the distribution of sample ages within the Phanerozoic, we divided the samples by stage, as shown in Fig. 4b. For the Quaternary, due to its short duration, the data were not subdivided by stage but were instead divided into the Holocene and Pleistocene series. The data distribution is not uniform, with the highest concentration in the Quaternary. These data mainly come from the DSDP and ODP, which are characterized by a high number of core samples and high resolution. There are fewer data for the Upper Permian, Lower Triassic, and Lower to Middle Jurassic, possibly because of the existence of Pangaea at that time, which reduced the area of continental margins and inhibited marine transgressions, resulting in fewer preserved marine environments in comparison to those of other geological periods (Mackenzie and Pigott, 1981; Walker et al., 2002). The distribution of sample quantities in other periods fluctuates, often corresponding to periods of significant research interest, such as the end-Ordovician, end-Devonian, end-Permian, Early Jurassic Toarcian, and Early Cretaceous Albian, which had peaks in sample numbers due to their association with major mass extinction events and oceanic anoxic events (Fan et al., 2020).
In terms of spatial trends, the spatial distribution of sampling points in the DM-SED is inherently uneven in both modern and palaeo-geographic locations. Modern locations are primarily concentrated in North America, Europe, South Africa, and China (Fig. 5). When modern coordinates are converted into palaeo-geographic coordinates and projected onto palaeo-geographic maps, Cambrian to Jurassic data come predominantly from continental margin environments, as subduction of the oceanic crust before the Cretaceous resulted in preservation of very few deep-sea environments (Fig. 6). Cambrian and Ordovician data are mainly distributed on the Laurentia, Baltica, and South China plates, with a few along the Gondwana margin. Silurian data mainly occur in Laurentia, South China, and eastern Gondwana. Devonian and Carboniferous data are primarily on the Laurussia plate, with sparse distribution in South China and Gondwana. Permian and Triassic data are mainly on the Laurussia and South China plates, with sparse distribution in Gondwana. Jurassic data are primarily on the North American and European shelves, with sparse distributions on the other plates. From the Cretaceous to the Quaternary, sample locations, dominated by data from the DSDP, ODP, and USGS NGDB projects, are mainly located in the deep oceans and North America.
When averaging all Phanerozoic data by stage and spatially averaging them into 15° palaeo-latitude bins (Fig. 7), Palaeozoic data records are mainly biased toward tropical regions. Cambrian data are concentrated between 15° S and 30° N, Ordovician to Carboniferous data are concentrated between 45° S and 15° N, and Permian data are concentrated between 0 and 30° N, with the data mainly fluctuating around the Equator. As continents migrated northward through the Mesozoic and into the Cenozoic, records began to show bias toward mid-latitudes in the Northern Hemisphere. From the Triassic to the Cretaceous, data are mainly concentrated between 0 and 60° N. Paleogene to Quaternary data are concentrated between 45° S and 45° N.
Version-controlled releases of the DM-SED can be found at Zenodo (https://doi.org/10.5281/zenodo.14771859, Lai et al., 2025). A static copy of the DM-SED version 0.0.1 is archived in the Geobiology database (http://geobiologydata.cug.edu.cn/, last access: 25 September 2024). We plan to supplement and improve the database continuously and hope to collaborate with existing compilation authors to assist in adding new content.
The software tools used in this study are available at the following links: WebPlotDigitizer can be downloaded from https://github.com/automeris-io/WebPlotDigitizer/releases (last access: 20 July 2024; https://doi.org/10.5281/zenodo.592175, Rohatgi and Steffen, 2018); the PointTracker v7 tool can be found at http://www.paleogis.com (last access: 20 July 2024; https://doi.org/10.13140/RG.2.1.2011.4162, Scotese, 2018); and QGIS 3.16 can be downloaded from https://qgis.org/project/overview/, QGIS Development Team, 2020).
The ultimate goal of the DM-SED is to provide the geoscience community with a valuable resource for knowledge and geographic information. By deriving meaningful conclusions from a large marine sediment geochemistry database, we aim to enhance our understanding of Earth's environmental changes over time and space. All entries in the DM-SED contain the sources of the original proxy values, ensuring traceability between the DM-SED and the original datasets from which the data were extracted.
However, our database has some limitations. The criteria for age determination, relying variously on fossil zones and lithostratigraphic unit information, are not entirely uniform. Some age determinations are still coarse, with samples from a single section all assigned the same age. Additionally, the data quantity for some elements is still low. There may be significant differences in methodological precision between the older and newer literature. Currently, these issues remain largely unresolved. Despite our best efforts to identify data from the literature and process quality control for each entry, the sheer volume of data in the DM-SED means that some errors or omissions are inevitable. Prompt corrections and continuous updates are expected to ensure the credibility of this database.
Finally, it is important to recognize that the DM-SED merely compiles these various datasets and cannot impose any requirements on their generation. When using the data (and where practicable), we recommend citing both the DM-SED and the original data sources to ensure proper attribution.
JKL: writing – original draft, visualization, data collection, investigation. HJS: writing – review and editing, supervision, investigation, funding acquisition. DLC: writing – review and editing, investigation. JDC: writing – review and editing, investigation. EAS: writing – review and editing, investigation. YYW: writing – review and editing, supervision, investigation, data collection. XKL: writing – review and editing, investigation. LW: writing – review and editing, data collection, investigation. MTL: writing – review and editing, investigation. HCS: writing – review and editing, investigation. YD: writing – review and editing, investigation. EHJ: writing – review and editing, investigation. YF: writing – review and editing, investigation. HYS: writing – review and editing, investigation. WCY: writing – review and editing, investigation. QZL: writing – review and editing, investigation. XCL: writing – review and editing, investigation. HY: writing – review and editing, investigation.
The contact author has declared that none of the authors has any competing interests.
Publisher’s note: Copernicus Publications remains neutral with regard to jurisdictional claims made in the text, published maps, institutional affiliations, or any other geographical representation in this paper. While Copernicus Publications makes every effort to include appropriate place names, the final responsibility lies with the authors.
This paper benefitted greatly from comments by Thierry Adatte and an anonymous reviewer. We also thank Jan Peter (research scientist, Geological Survey of Canada) for providing his literature data.
This study was supported by the National Natural Science Foundation of China (grant no. 42325202), the State Key R&D Project of China (grant no. 2023YFF0804000), the 111 Project (grant no. B08030), the Natural Science Foundation of Hubei (grant no. 2023AFA006), and the Graduate Student Project of the Hubei Research Center for Basic Disciplines of Earth Sciences (grant no. HRCES-202413). Erik A. Sperling is supported by the United States National Science Foundation (grant no. EAR-2143164).
This paper was edited by Alessio Rovere and reviewed by Thierry Adatte and one anonymous referee.
Algeo, T. J. and Liu, J.: A re-assessment of elemental proxies for paleoredox analysis, Chem. Geol., 540, 119549, https://doi.org/10.1016/j.chemgeo.2020.119549, 2020.
Drevon, D., Fursa, S. R., and Malcolm, A. L.: Intercoder Reliability and Validity of WebPlotDigitizer in Extracting Graphed Data, Behav. Modif., 41, 323–339, https://doi.org/10.1177/0145445516673998, 2017.
FAIR: FAIR Play in geoscience data, Nat. Geosci., 12, 961, https://doi.org/10.1038/s41561-019-0506-4, 2019.
Fan, J., Shen, S., Erwin, D. H., Sadler, P. M., MacLeod, N., Cheng, Q., Hou, X., Yang, J., Wang, X., Wang, Y., Zhang, H., Chen, X., Li, G., Zhang, Y., Shi, Y., Yuan, D., Chen, Q., Zhang, L., Li, C., and Zhao, Y.: A high-resolution summary of Cambrian to Early Triassic marine invertebrate biodiversity, Science, 367, 272–277, https://doi.org/10.1126/science.aax4953, 2020.
Farrell, U. C., Samawi, R., Anjanappa, S., Klykov, R., Adeboye, O. O., Agic, H., Ahm, A. C., Boag, T. H., Bowyer, F., Brocks, J. J., Brunoir, T. N., Canfield, D. E., Chen, X., Cheng, M., Clarkson, M. O., Cole, D. B., Cordie, D. R., Crockford, P. W., Cui, H., Dahl, T. W., Mouro, L. D., Dewing, K., Dornbos, S. Q., Drabon, N., Dumoulin, J. A., Emmings, J. F., Endriga, C. R., Fraser, T. A., Gaines, R. R., Gaschnig, R. M., Gibson, T. M., Gilleaudeau, G. J., Gill, B. C., Goldberg, K., Guilbaud, R., Halverson, G. P., Hammarlund, E. U., Hantsoo, K. G., Henderson, M. A., Hodgskiss, M. S. W., Horner, T. J., Husson, J. M., Johnson, B., Kabanov, P., Brenhin Keller, C., Kimmig, J., Kipp, M. A., Knoll, A. H., Kreitsmann, T., Kunzmann, M., Kurzweil, F., LeRoy, M. A., Li, C., Lipp, A. G., Loydell, D. K., Lu, X., Macdonald, F. A., Magnall, J. M., Mand, K., Mehra, A., Melchin, M. J., Miller, A. J., Mills, N. T., Mwinde, C. N., O'Connell, B., Och, L. M., Ossa Ossa, F., Pages, A., Paiste, K., Partin, C. A., Peters, S. E., Petrov, P., Playter, T. L., Plaza-Torres, S., Porter, S. M., Poulton, S. W., Pruss, S. B., Richoz, S., Ritzer, S. R., Rooney, A. D., Sahoo, S. K., Schoepfer, S. D., Sclafani, J. A., Shen, Y., Shorttle, O., Slotznick, S. P., Smith, E. F., Spinks, S., Stockey, R. G., Strauss, J. V., Stueken, E. E., Tecklenburg, S., Thomson, D., Tosca, N. J., Uhlein, G. J., Vizcaino, M. N., Wang, H., White, T., Wilby, P. R., Woltz, C. R., Wood, R. A., Xiang, L., Yurchenko, I. A., Zhang, T., Planavsky, N. J., Lau, K. V., Johnston, D. T., and Sperling, E. A.: The Sedimentary Geochemistry and Paleoenvironments Project, Geobiology, 19, 545–556, https://doi.org/10.1111/gbi.12462, 2021.
Gradstein, F. M., Ogg, J. G., Schmitz, M. D., and Ogg, G. M.: Geologic time scale 2020, Elsevier, ISBN 978-0-12-824360-2, 2020.
Granitto, M., Giles, S. A., and Kelley, K. D.: Global Geochemical Database for Critical Metals in Black Shales, U.S. Geological Survey data release [data set], https://doi.org/10.5066/F71G0K7X, 2017.
Grossman, E. L. and Joachimski, M. M.: Oxygen Isotope Stratigraphy, in: Geologic Time Scale 2020, 279–307, https://doi.org/10.1016/b978-0-12-824360-2.00010-3, 2020.
Jin, C., Li, C., Algeo, T. J., Wu, S., Cheng, M., Zhang, Z., and Shi, W.: Controls on organic matter accumulation on the early-Cambrian western Yangtze Platform, South China, Mar. Petrol. Geol., 111, 75–87, https://doi.org/10.1016/j.marpetgeo.2019.08.005, 2020.
Judd, E. J., Tierney, J. E., Huber, B. T., Wing, S. L., Lunt, D. J., Ford, H. L., Inglis, G. N., McClymont, E. L., O'Brien, C. L., Rattanasriampaipong, R., Si, W., Staitis, M. L., Thirumalai, K., Anagnostou, E., Cramwinckel, M. J., Dawson, R. R., Evans, D., Gray, W. R., Grossman, E. L., Henehan, M. J., Hupp, B. N., MacLeod, K. G., O'Connor, L. K., Sanchez Montes, M. L., Song, H., and Zhang, Y. G.: The PhanSST global database of Phanerozoic sea surface temperature proxy data, Sci. Data, 9, 753, https://doi.org/10.1038/s41597-022-01826-0, 2022.
Lai, J., Song, H., Chu, D., Dal Corso, J., Sperling, E. A., Wu, Y., Liu, X., Wei, L., Li, M., Song, H., Du, Y., Jia, E., Feng, Y., Song, H., Yu, W., Liang, Q., Li, X., and Yao, H.: Deep-Time Marine Sedimentary Element Database, Zenodo [data set], https://doi.org/10.5281/zenodo.14771859, 2025.
Large, R. R., Halpin, J. A., Lounejeva, E., Danyushevsky, L. V., Maslennikov, V. V., Gregory, D., Sack, P. J., Haines, P. W., Long, J. A., Makoundi, C., and Stepanov, A. S.: Cycles of nutrient trace elements in the Phanerozoic ocean, Gondwana Res., 28, 1282–1293, https://doi.org/10.1016/j.gr.2015.06.004, 2015.
Li, Z., Zhang, Y. G., Torres, M., and Mills, B. J. W.: Neogene burial of organic carbon in the global ocean, Nature, 613, 90–95, https://doi.org/10.1038/s41586-022-05413-6, 2023.
Mackenzie, F. T. and Pigott, J. D.: Tectonic controls of Phanerozoic sedimentary rock cycling, J. Geol. Soc., 138, 183–196, https://doi.org/10.1144/gsjgs.138.2.0183, 1981.
Planavsky, N. J., Asael, D., Rooney, A. D., Robbins, L. J., Gill, B. C., Dehler, C. M., Cole, D. B., Porter, S. M., Love, G. D., Konhauser, K. O., and Reinhard, C. T.: A sedimentary record of the evolution of the global marine phosphorus cycle, Geobiology, 21, 168–174, https://doi.org/10.1111/gbi.12536, 2023.
QGIS Development Team: QGIS Geographic Information System (Version 3.16), QGIS Association, https://qgis.org/project/overview/ (last access: 20 July 2024), 2020.
Reinhard, C. T., Planavsky, N. J., Gill, B. C., Ozaki, K., Robbins, L. J., Lyons, T. W., Fischer, W. W., Wang, C., Cole, D. B., and Konhauser, K. O.: Evolution of the global phosphorus cycle, Nature, 541, 386–389, https://doi.org/10.1038/nature20772, 2017.
Rohatgi, A., and Steffen, R. :ankitrohatgi/WebPlotDigitizer: Version 4.1 of WebPlotDigitizer, Zenodo [code], 10.5281/zenodo.592175, 2018.
Schobben, M., Foster, W. J., Sleveland, A. R. N., Zuchuat, V., Svensen, H. H., Planke, S., Bond, D. P. G., Marcelis, F., Newton, R. J., Wignall, P. B., and Poulton, S. W.: A nutrient control on marine anoxia during the end-Permian mass extinction, Nat. Geosci., 13, 640–646, https://doi.org/10.1038/s41561-020-0622-1, 2020.
Schoepfer, S. D., Shen, J., Wei, H., Tyson, R. V., Ingall, E., and Algeo, T. J.: Total organic carbon, organic phosphorus, and biogenic barium fluxes as proxies for paleomarine productivity, Earth-Sci. Rev., 149, 23–52, https://doi.org/10.1016/j.earscirev.2014.08.017, 2015.
Schoepfer, S. D., Algeo, T. J., Ward, P. D., Williford, K. H., and Haggart, J. W.: Testing the limits in a greenhouse ocean: Did low nitrogen availability limit marine productivity during the end-Triassic mass extinction?, Earth Planet. Sc. Lett., 451, 138–148, https://doi.org/10.1016/j.epsl.2016.06.050, 2016.
Scotese, C.: The PALEOMAP Project PaleoAtlas for ArcGIS, version 1, 2, 16–31, ResearchGate [data set], https://doi.org/10.13140/RG.2.1.2011.4162, 2008.
Scotese, C. R. and Wright, N.: PALEOMAP Paleodigital Elevation Models (PaleoDEMS) for the Phanerozoic PALEOMAP Project, Paleomap Proj, https://www.earthbyte.org/paleodem-resource-scotese-and-wright-2018/ (last access: 9 April 2025), 2018.
Scotese, C. R., Song, H., Mills, B. J. W., and van der Meer, D. G.: Phanerozoic paleotemperatures: The earth's changing climate during the last 540 million years, Earth-Sci. Rev., 215, 103503, https://doi.org/10.1016/j.earscirev.2021.103503, 2021.
Scott, C., Planavsky, N. J., Dupont, C. L., Kendall, B., Gill, B. C., Robbins, L. J., Husband, K. F., Arnold, G. L., Wing, B. A., Poulton, S. W., Bekker, A., Anbar, A. D., Konhauser, K. O., and Lyons, T. W.: Bioavailability of zinc in marine systems through time, Nat. Geosci., 6, 125–128, https://doi.org/10.1038/ngeo1679, 2013.
Shen, J., Schoepfer, S. D., Feng, Q., Zhou, L., Yu, J., Song, H., Wei, H., and Algeo, T. J.: Marine productivity changes during the end-Permian crisis and Early Triassic recovery, Earth-Sci. Rev., 149, 136–162, https://doi.org/10.1016/j.earscirev.2014.11.002, 2015.
Song, H., Wignall, P. B., Song, H., Dai, X., and Chu, D.: Seawater Temperature and Dissolved Oxygen over the Past 500 Million Years, J. Earth Sci., 30, 236–243, https://doi.org/10.1007/s12583-018-1002-2, 2019.
Stockey, R. G., Cole, D. B., Farrell, U. C., Agić, H., Boag, T. H., Brocks, J. J., Canfield, D. E., Cheng, M., Crockford, P. W., Cui, H., Dahl, T. W., Del Mouro, L., Dewing, K., Dornbos, S. Q., Emmings, J. F., Gaines, R. R., Gibson, T. M., Gill, B. C., Gilleaudeau, G. J., Goldberg, K., Guilbaud, R., Halverson, G., Hammarlund, E. U., Hantsoo, K., Henderson, M. A., Henderson, C. M., Hodgskiss, M. S. W., Jarrett, A. J. M., Johnston, D. T., Kabanov, P., Kimmig, J., Knoll, A. H., Kunzmann, M., LeRoy, M. A., Li, C., Loydell, D. K., Macdonald, F. A., Magnall, J. M., Mills, N. T., Och, L. M., O'Connell, B., Pagès, A., Peters, S. E., Porter, S. M., Poulton, S. W., Ritzer, S. R., Rooney, A. D., Schoepfer, S., Smith, E. F., Strauss, J. V., Uhlein, G. J., White, T., Wood, R. A., Woltz, C. R., Yurchenko, I., Planavsky, N. J., and Sperling, E. A.: Sustained increases in atmospheric oxygen and marine productivity in the Neoproterozoic and Palaeozoic eras, Nat. Geosci., 17, 667–674, https://doi.org/10.1038/s41561-024-01479-1, 2024.
Sweere, T. C., Dickson, A. J., and Vance, D.: Nickel and zinc micronutrient availability in Phanerozoic oceans, Geobiology, 21, 310–322, https://doi.org/10.1111/gbi.12541, 2023.
Tribovillard, N.: Re-assessing copper and nickel enrichments as paleo-productivity proxies, BSGF – Earth Sciences Bulletin, 192, 54, https://doi.org/10.1051/bsgf/2021047, 2021.
Veizer, J. and Prokoph, A.: Temperatures and oxygen isotopic composition of Phanerozoic oceans, Earth-Sci. Rev., 146, 92-104, https://doi.org/10.1016/j.earscirev.2015.03.008, 2015.
Walker, L. J., Wilkinson, B. H., and Ivany, L. C.: Continental drift and Phanerozoic carbonate accumulation in shallow-shelf and deep-marine settings, J. Geol., 110, 75–87, https://doi.org/10.1086/324318, 2002.
Wang, D., Liu, Y., Zhang, J., Lang, Y., Li, Z., Tong, Z., Xu, L., Su, Z., and Niu, J.: Controls on marine primary productivity variation and organic matter accumulation during the Late Ordovician – Early Silurian transition, Mar. Petrol. Geol., 142, 105742, https://doi.org/10.1016/j.marpetgeo.2022.105742, 2022.
Wilkinson, M. D., Dumontier, M., Aalbersberg, I. J., Appleton, G., Axton, M., Baak, A., Blomberg, N., Boiten, J. W., da Silva Santos, L. B., Bourne, P. E., Bouwman, J., Brookes, A. J., Clark, T., Crosas, M., Dillo, I., Dumon, O., Edmunds, S., Evelo, C. T., Finkers, R., Gonzalez-Beltran, A., Gray, A. J., Groth, P., Goble, C., Grethe, J. S., Heringa, J., t Hoen, P. A., Hooft, R., Kuhn, T., Kok, R., Kok, J., Lusher, S. J., Martone, M. E., Mons, A., Packer, A. L., Persson, B., Rocca-Serra, P., Roos, M., van Schaik, R., Sansone, S. A., Schultes, E., Sengstag, T., Slater, T., Strawn, G., Swertz, M. A., Thompson, M., van der Lei, J., van Mulligen, E., Velterop, J., Waagmeester, A., Wittenburg, P., Wolstencroft, K., Zhao, J., and Mons, B.: The FAIR Guiding Principles for scientific data management and stewardship, Sci. Data, 3, 160018, https://doi.org/10.1038/sdata.2016.18, 2016.
Xiang, L., Schoepfer, S. D., Zhang, H., Cao, C., and Shen, S.: Evolution of primary producers and productivity across the Ediacaran-Cambrian transition, Precambrian Res., 313, 68–77, https://doi.org/10.1016/j.precamres.2018.05.023, 2018.
Zhang, Q., Bendif, E. M., Zhou, Y., Nevado, B., Shafiee, R., and Rickaby, R. E. M.: Declining metal availability in the Mesozoic seawater reflected in phytoplankton succession, Nat. Geosci., 15, 932–941, https://doi.org/10.1038/s41561-022-01053-7, 2022.
Zhao, K., Zhu, G., Li, T., Chen, Z., and Li, S.: Fluctuations of continental chemical weathering control primary productivity and redox conditions during the Earliest Cambrian, Geol. J., 58, 3659–3672, https://doi.org/10.1002/gj.4778, 2023.