the Creative Commons Attribution 4.0 License.
the Creative Commons Attribution 4.0 License.
 | 14 Apr 2025
An in situ daily dataset for benchmarking temporal variability of groundwater recharge
Pragnaditya Malakar
Aatish Anshuman
Mukesh Kumar
Georgios Boumis
T. Prabhakar Clement
Arik Tashie
Hitesh Thakur
Nagaraj Bhat
Lokendra Rathore
Accurate estimate of groundwater recharge is crucial for prediction of groundwater table dynamics and dependent eco-hydrological processes. Despite their importance, benchmark data for groundwater recharge at fine (∼ daily) temporal resolution are lacking. We present a first-of-its-kind daily groundwater recharge per unit specific yield (RpSy) data over periods of 2–38 years at 485 groundwater monitoring wells in the US. The RpSy data for these locations are calculated from the daily groundwater table time series using the water table fluctuation (WTF) method. Although direct validation of the data is not possible since it is the first of its kind, we compare the RpSy data with the monthly USGS product to identify similarities and differences. The RpSy dataset may serve as a benchmark for validating the temporal consistency of recharge products and daily simulation results from land surface and integrated hydrologic models. The dataset is available at https://doi.org/10.5281/zenodo.13323242 (Malakar et al., 2024).
- Article
(7472 KB) - Full-text XML
-
Supplement
(1667 KB) - BibTeX
- EndNote


Groundwater is the largest distributed inland freshwater storage. It sustains human water consumption and acts as a buffer during droughts (Famiglietti, 2014; Seo et al., 2018; Taylor et al., 2013a). In the US, it is estimated that groundwater supplies approximately 60 % of irrigation and 40 % of the public water (Russo and Lall, 2017). Furthermore, more than 40 million people in the US, a majority of them in rural areas, rely on domestic boreholes for their drinking water demands (Alley et al., 1999; Wu et al., 2021). Alarmingly, mismanagement of freshwater resources, climate variability and change, rapid population growth, and changes in land use due to urbanization and agricultural expansion have put significant stress on groundwater resources. For example, recent studies have shown that the cumulative volume of groundwater in the US has decreased by almost 1000 km3 between 1900 and 2008 (Konikow, 2015). In certain locations, such as the Mississippi embayment section of the Gulf Coastal Plain, groundwater depletion has occurred at a high rate of 1.2 km3 yr−1 (Konikow, 2015).
To sustainably manage groundwater resources and to conduct more accurate aquifer vulnerability assessment, it is of critical importance that stakeholders and policy managers are informed of the present and future trends of groundwater recharge (GWR), a flux describing the volume of water infiltrating into an aquifer per unit area per unit time ([L T−1]). Despite the importance of GWR in controlling groundwater level (GWL) dynamics, its accurate estimation remains a challenge. This is in part because GWR is influenced by a range of variables, such as climate forcings, topography, hydrogeology, land cover, land-use patterns, pumping and antecedent groundwater/soil states (Berghuijs et al., 2022; Chen et al., 2020; Kumar and Duffy, 2015). Furthermore, GWR varies temporally at multiple temporal scales, ranging from event to inter-annual durations (Crosbie et al., 2005; Scanlon et al., 2006; Varni et al., 2013; Squeo et al., 2006; Valois et al., 2020). Depending on the dominant processes and their trends, GWR may show site-specific variations. For example, studies in both humid (Tashie et al., 2016) and arid (Thomas et al., 2016) settings showed that at the event scale, the intensity of extreme precipitation events changes the fraction of precipitation that contributes to recharge. Others showed that groundwater resources in east Africa are sustained by anomalously intense seasonal and monthly rainfall (Taylor et al., 2013b). Intense episodic precipitation has been observed to produce a large GWR in sub-Saharan Africa (Cuthbert et al., 2019). Analogous efforts from India indicate that in the southern part of the country, GWR is driven by high-intensity precipitation (Asoka et al., 2018), while higher recharge in the northern fertile Indus–Ganges–Brahmaputra aquifer is due to higher precipitation and pumping-induced GWR (Bhanja et al., 2019; Lapworth et al., 2015; Malakar et al., 2021a–c). Past evidence from the northern High Plains in the US indicates that antecedent soil moisture conditions indeed play a vital role in determining GWR in conjunction with extreme rainfall (Zhang et al., 2016). Given that antecedent soil moisture is also strongly affected by variations in meteorological forcing from daily to longer timescales (Ghannam et al., 2016), this can be expected of event recharge as well. Recharge is also likely to vary with seasonal, inter-annual and decadal variations in rainfall, temperature and vapor pressure deficit, which influence evapotranspiration (Liu et al., 2017, 2020; Milly and Dunne, 2016; Mueller and Seneviratne, 2014) and its partitioning (Raghav et al., 2022). An increase in temperature increases evaporative demand and decreases soil moisture (Raghav and Kumar, 2021), which could lead to a reduction in recharge (and aquifer replenishment) (Condon et al., 2020), consequently resulting in groundwater depletion (Singh and Borrok, 2019). In summary, GWR is an integrated response of a range of forcings, processes and local physiographic properties which are crucial for groundwater sustainability.
There has been a general call to action for improving recharge and baseflow processes in large-scale hydrologic models and land surface models (LSMs) for some time (e.g., Fan et al., 2019). The need to improve recharge estimates is further underscored by recent studies, such as that by Berghuijs et al. (2022), wherein, based on the global recharge dataset by Moeck et al. (2020), it was reported that LSMs tend to systematically underestimate recharge by a factor of about 2. Gnann et al. (2023) also demonstrated that theoretical and empirically based functional relationships between drivers of recharge and the recharge flux differ significantly across global water models. This underscores the alarming potential of divergent responses from models under future projected changes in drivers. An accurate dataset for GWR can not only assist with the assessment of changes in local hydrologic responses but can also help manage emerging threats to food and water security. Furthermore, it can help benchmark models used for estimating GWR.
Despite its importance, what is currently lacking in the scientific record is a continuous, ground-truthing dataset of GWR at monthly or as fine as daily resolution. Past efforts have mostly focused on obtaining coarser-time-resolution groundwater recharge. For example, base flow discharge (Hung Vu and Merkel, 2019; Meyboom, 1961) and isotopic or chemical tracers (Lapworth et al., 2015; McMahon et al., 2011; Scanlon et al., 2010) have been used to estimate recharge over monthly to decadal scales. These data have formed the basis for several studies that focused on mapping recharge rates at regional to global scales (Moeck et al., 2020). However, these data provide limited to no information related to event-scale or daily resolution variations in recharge (Tashie et al., 2016). While seepage meters (Scanlon et al., 2002), lysimeters (Gong et al., 2021; Xu and Chen, 2005) and heat tracers (Blasch et al., 2007; Healy, 2010) are capable of calculating recharge over a fine temporal resolution, they are expensive and complicated, leading to difficulty in the development of continuous datasets at a large number of locations (Tashie et al., 2016). A useful approach for estimating GWR at fine temporal resolution is based on the water budget method. However, this approach often does not account for the subsurface storage change and is impacted by uncertainties associated with water budget components such as ET and/or quick flow (Reitz et al., 2017a; Reitz and Sanford, 2019a). Furthermore, basin-scaled empirical relationships modeled for recharge estimation oftentimes do not capture finer-spatial-resolution variations (Gonzalez et al., 2023). An alternative promising option is to obtain GWR estimates using the water table fluctuation (WTF) method (Bhanja et al., 2019; Healy and Cook, 2002; Nimmo et al., 2015).
The WTF method based on the master recession curve (MRC) yields GWR at fine temporal resolution while only needing available well hydrograph data, meteorological data and specific yield (Boumis et al., 2022). Studies have highlighted its applicability for benchmarking recharge estimates from models (Crosbie et al., 2015) and for further understanding recharge variations and its implications on water resources in diverse hydroclimatic regions (Delin et al., 2007; Nimmo et al., 2015; Nimmo and Perkins, 2018; Tashie et al., 2016). One major challenge with the WTF method for estimating recharge is its reliance on specific yield data, which is not commonly accessible and involves a high level of uncertainty. In a study by Boumis et al. (2022), it was suggested that groundwater recharge may have been overestimated due to specific yield values obtained at locations where the water table is near the land surface. In a study by Crosbie et al. (2019), it was noted that improving estimates of specific yield is crucial for addressing the overestimation of recharge. To circumvent the challenge posed by uncertain specific yield on recharge estimation from the WTF method, here we instead generate a benchmark dataset that provides recharge per unit specific yield (also referred to as RpSy henceforth). We generate this dataset after performing detailed quality control to identify well locations that are suited for yielding high-fidelity long-term RpSy estimates. Finally, we compare the estimated RpSy with published monthly recharge estimates provided in other published studies (Reitz and Sanford, 2019a) and assess RpSy variations vis-à-vis its primary hydrometeorological influencers.
2.1 RpSy estimation using the WTF method
GWL fluctuations recorded at monitoring wells are used to estimate recharge based on the water table fluctuation (WTF) method (Healy and Cook, 2002; Healy, 2010). The general principle of the method is to use the water table rise and fall dynamics to compute recharge in a continuous fashion (Heppner and Nimmo, 2005). Quantitatively, GWR within a specific time interval (daily timescale is used in this study) is evaluated in m d−1 as the product of depth to water level rise occurring in a day (ΔH) and specific yield (Sy) (Fig. 1a):
Here, ΔH is the water table rise relative to the predicted water level in the absence of recharge. The water level in the absence of recharge is predicted based on the master recession curve (MRC) (Nimmo et al., 2015; Nimmo and Perkins, 2018), which captures the characteristic recession pattern, i.e., the relation between water table elevation (H) and its rate of decline () (Fig. 1b). It is to be noted that the WTF-based groundwater recharge incorporating MRC is not merely the difference in water table height between two time points. For instance, after a recharge event, the groundwater table may rise and then recede. Calculating recharge simply by taking the difference in water table height between the start of the recharge event and a point further along the recession period could yield a small or even negative recharge estimate. In our approach to calculating recharge using the WTF method, we determine the recharge by evaluating the difference in groundwater table height between the current and the next time step, adjusting for what the height at the current time step would be if it were receding according to the rate defined by the MRC. This variable, ΔH, is evaluated between two consecutive time steps (1 d in our case). Notably, the time step is much shorter than the duration of a recharge event. Accurate MRC calculation requires careful identification of the slope element – a short enough interval that can be considered pure recession. Because of the uncertainty inherent in defining a pure recession interval, we consider a range of slope element lengths equal to 4, 6, 8 and 10 d (Boumis et al., 2022). Similarly, multiple minimum interval durations, viz. 2, 4, 6 and 8 d, between precipitation and the start of recession are also considered. A daily precipitation amount smaller than 0.5 mm is considered negligible while deriving the MRC (Nimmo and Perkins, 2018). For any given site, the slope element and the minimum interval duration length that provides the maximum MRC correlation are used for ensuing analysis.
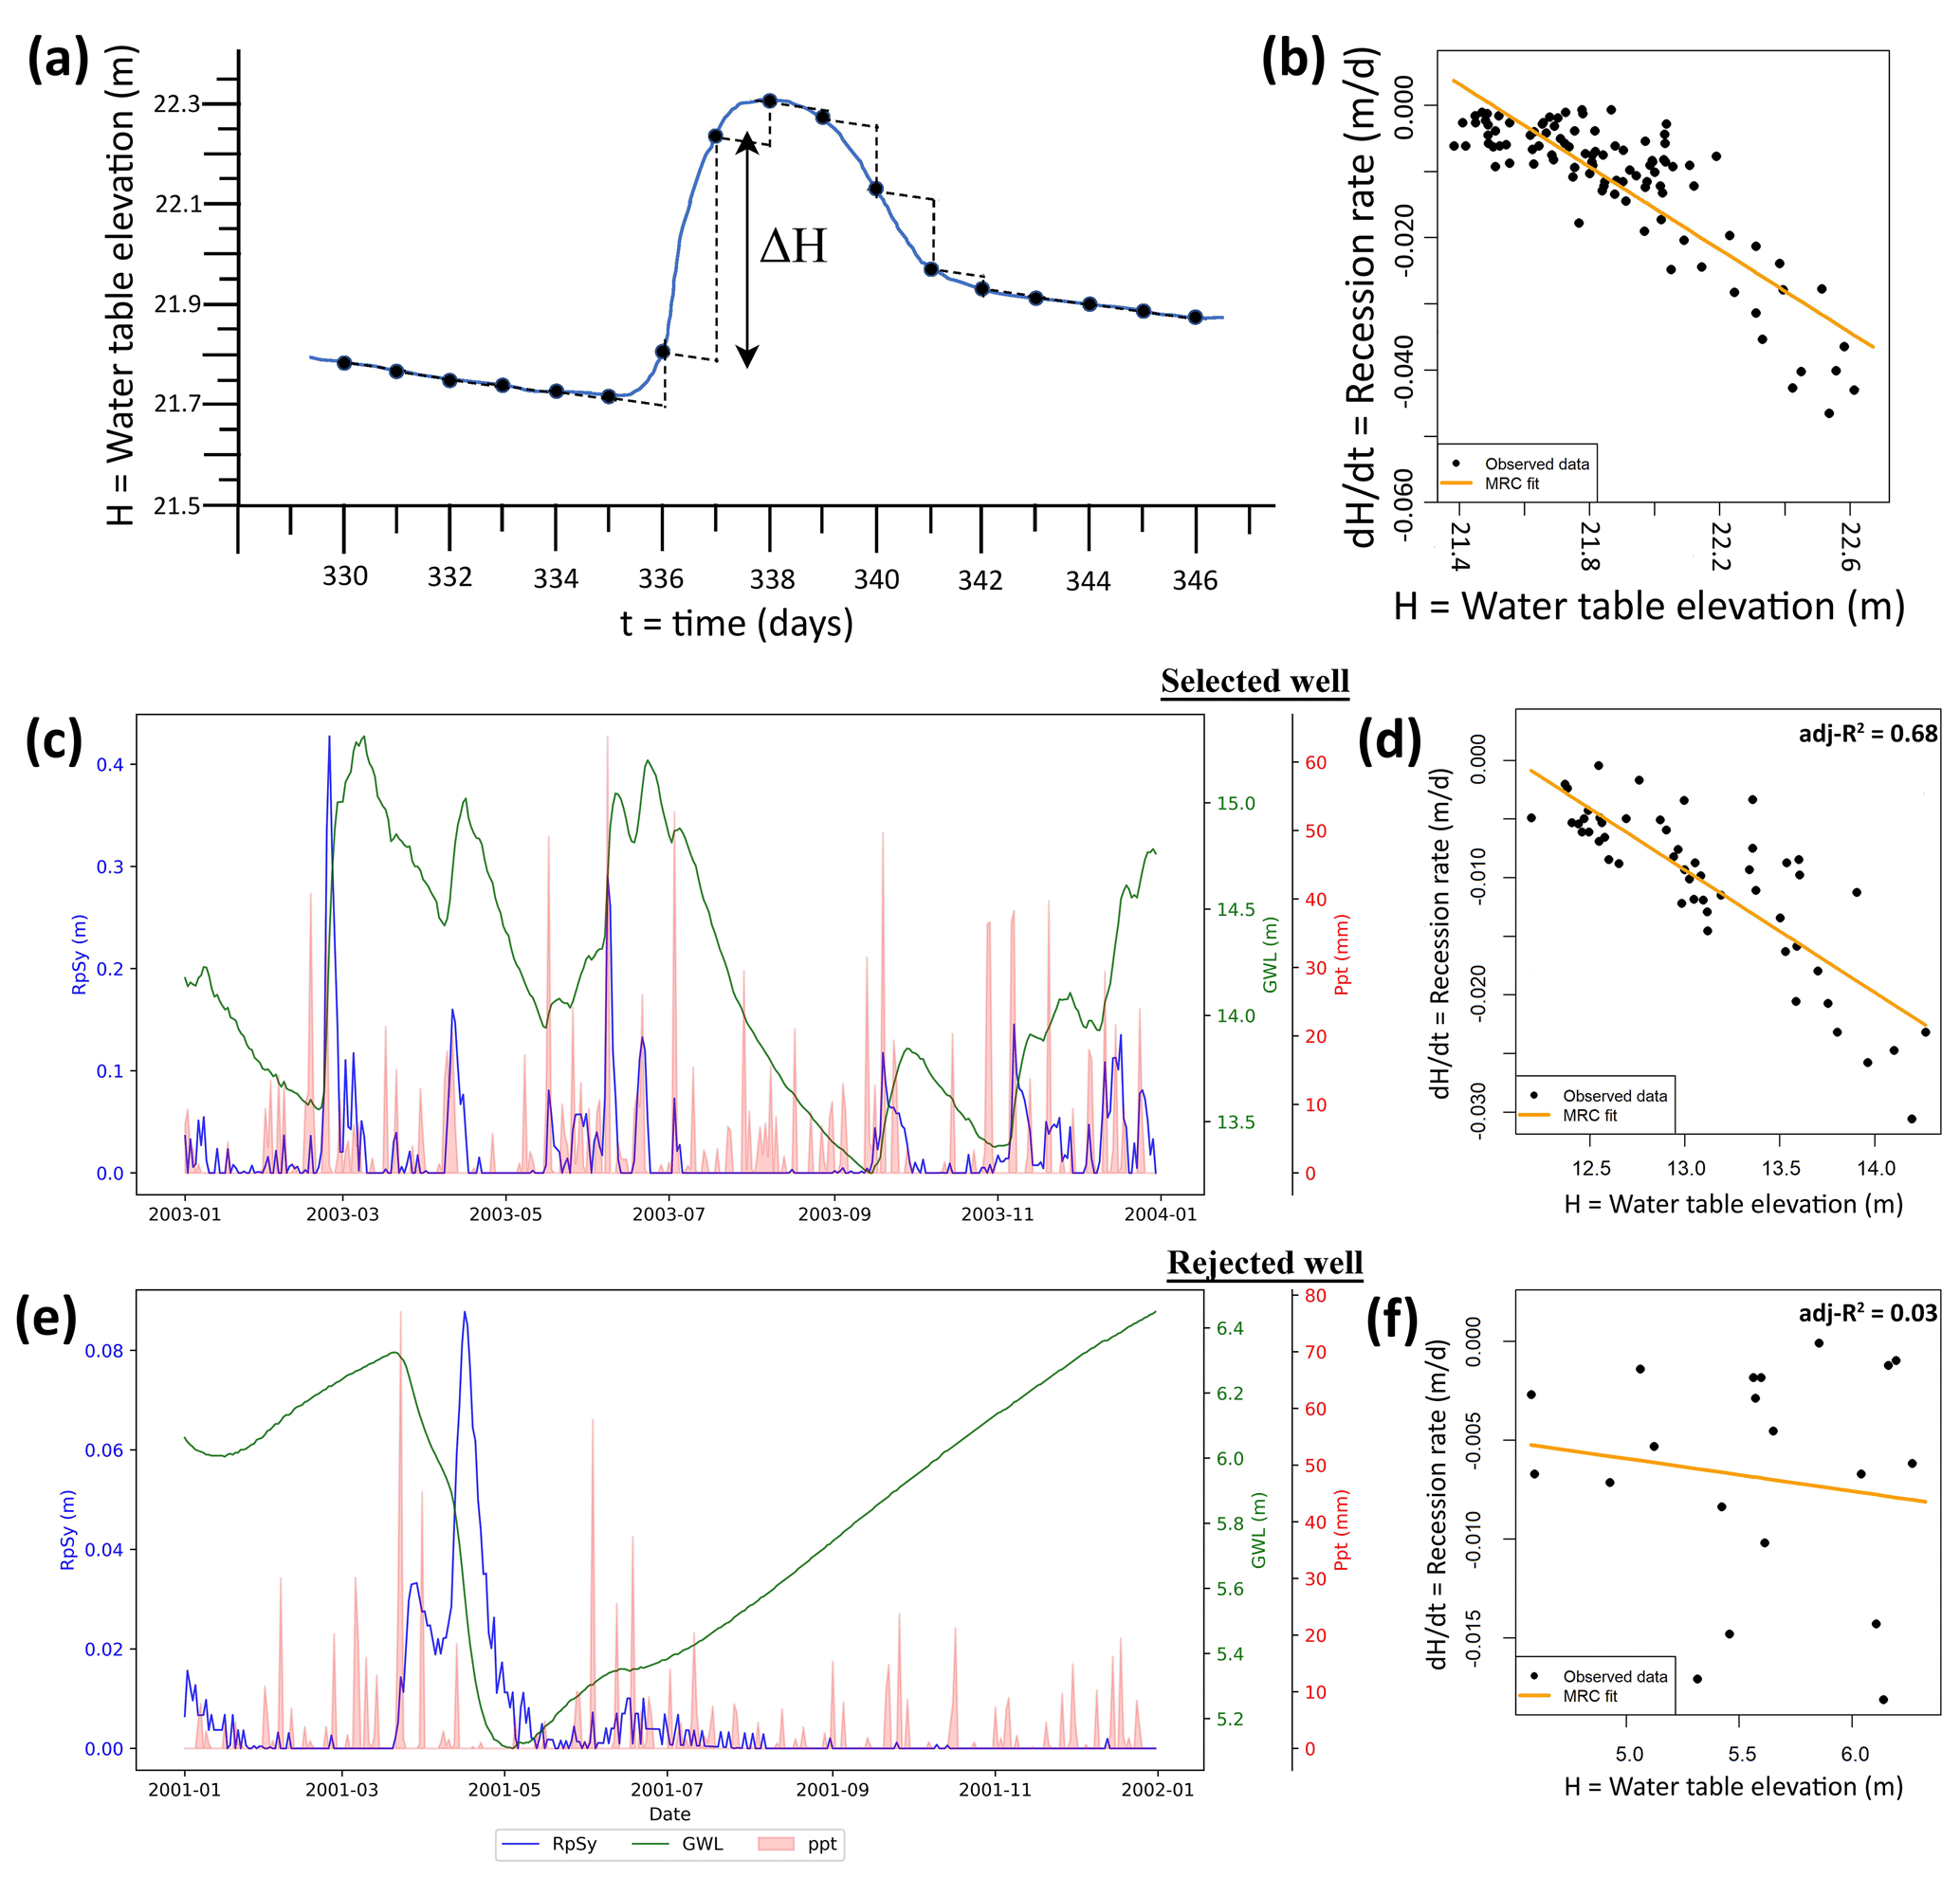
Figure 1(a) Schematic representation of ΔH evaluation in the WTF method, which is then used to obtain daily groundwater recharge using Eq. (1). (b) A typical vs. H plot used to derive the MRC. The hydrographs in (c) and (e) show daily groundwater level (GWL, in m), precipitation (Ppt, in mm) and estimated recharge per unit specific yield (RpSy, in m, discussed later) for a selected and a rejected well, respectively. Here, selection/rejection is based on representativeness of the MRC, which here is determined based on an adj-R2 value of 0.2. Panels (d) and (f) show the vs. H plot for the corresponding selected and rejected wells, respectively.
Although Sy is a primary constituent in GWR estimation using the WTF method (see Eq. 1), accurate estimates of Sy are unavailable across the US (Li and Rodell, 2015). The feasibility of obtaining Sy for a large number of locations, given the large spatial heterogeneity in its magnitude, is impractical. Hence, here we evaluate RpSy, instead of GWR, as a benchmarking product. RpSy is calculated as the ratio using Eq. (1).
2.2 Data sources and well selection criteria
Groundwater level (GWL) records for the last 4 decades (1983–2022) are retrieved from the US Geological Survey's (USGS) National Water Information System web interface (link: https://waterdata.usgs.gov/nwis/gw, last access: 15 January 2024). The data have a temporal resolution of 1 d and are based on observations at the monitoring wells. The following primary criteria are used to narrow down the stations:
- a.
Firstly, there are wells that have never and/or are not prone to going dry (Cunningham et al., 2007).
- b.
Secondly, there are wells with at least 2 years of continuous daily GWL observations with limited data gaps.
- c.
Finally, there exist groundwater wells that primarily reflect event-scale GWL changes in response to meteorological forcings. To select wells that likely experience an event GWR response to precipitation signals, i.e., where the WTF method is valid, we only select the top 75th percentile wells based on the maximum lag correlation coefficient between RpSy and precipitation time series. Selection of the 75th percentile as a threshold is subjective and is obtained after trial and error. The goal is to use a threshold that ensures that wells in the lower percentile of the maximum lag correlation coefficient correspond to GWR response that is not event-based. An example of a selected and a rejected observation well based on this selection criteria is illustrated in Fig. S1 in the Supplement.
Next, we further screened the data selected based on the above criteria to develop a subset of wells that met the following secondary criteria, including the following:
- i.
Well datasets with a characteristic functional relation between H and are needed to develop an MRC. To ensure this, an adj-R2 value of 0.2 for the MRC curve fit is used as a threshold. Only the wells with a correlation coefficient above this threshold are considered. It is important to note that sites with high adj-R2 values not only confirm the applicability of the WTF method but also help filter out sites with pumping impacts, which can cause variable recession rates. However, this threshold is not foolproof and cannot completely guarantee the absence of groundwater pumping effects.
- ii.
Finally, since MRC is expected to exhibit a negative slope, only such wells are used in the proceeding analyses.
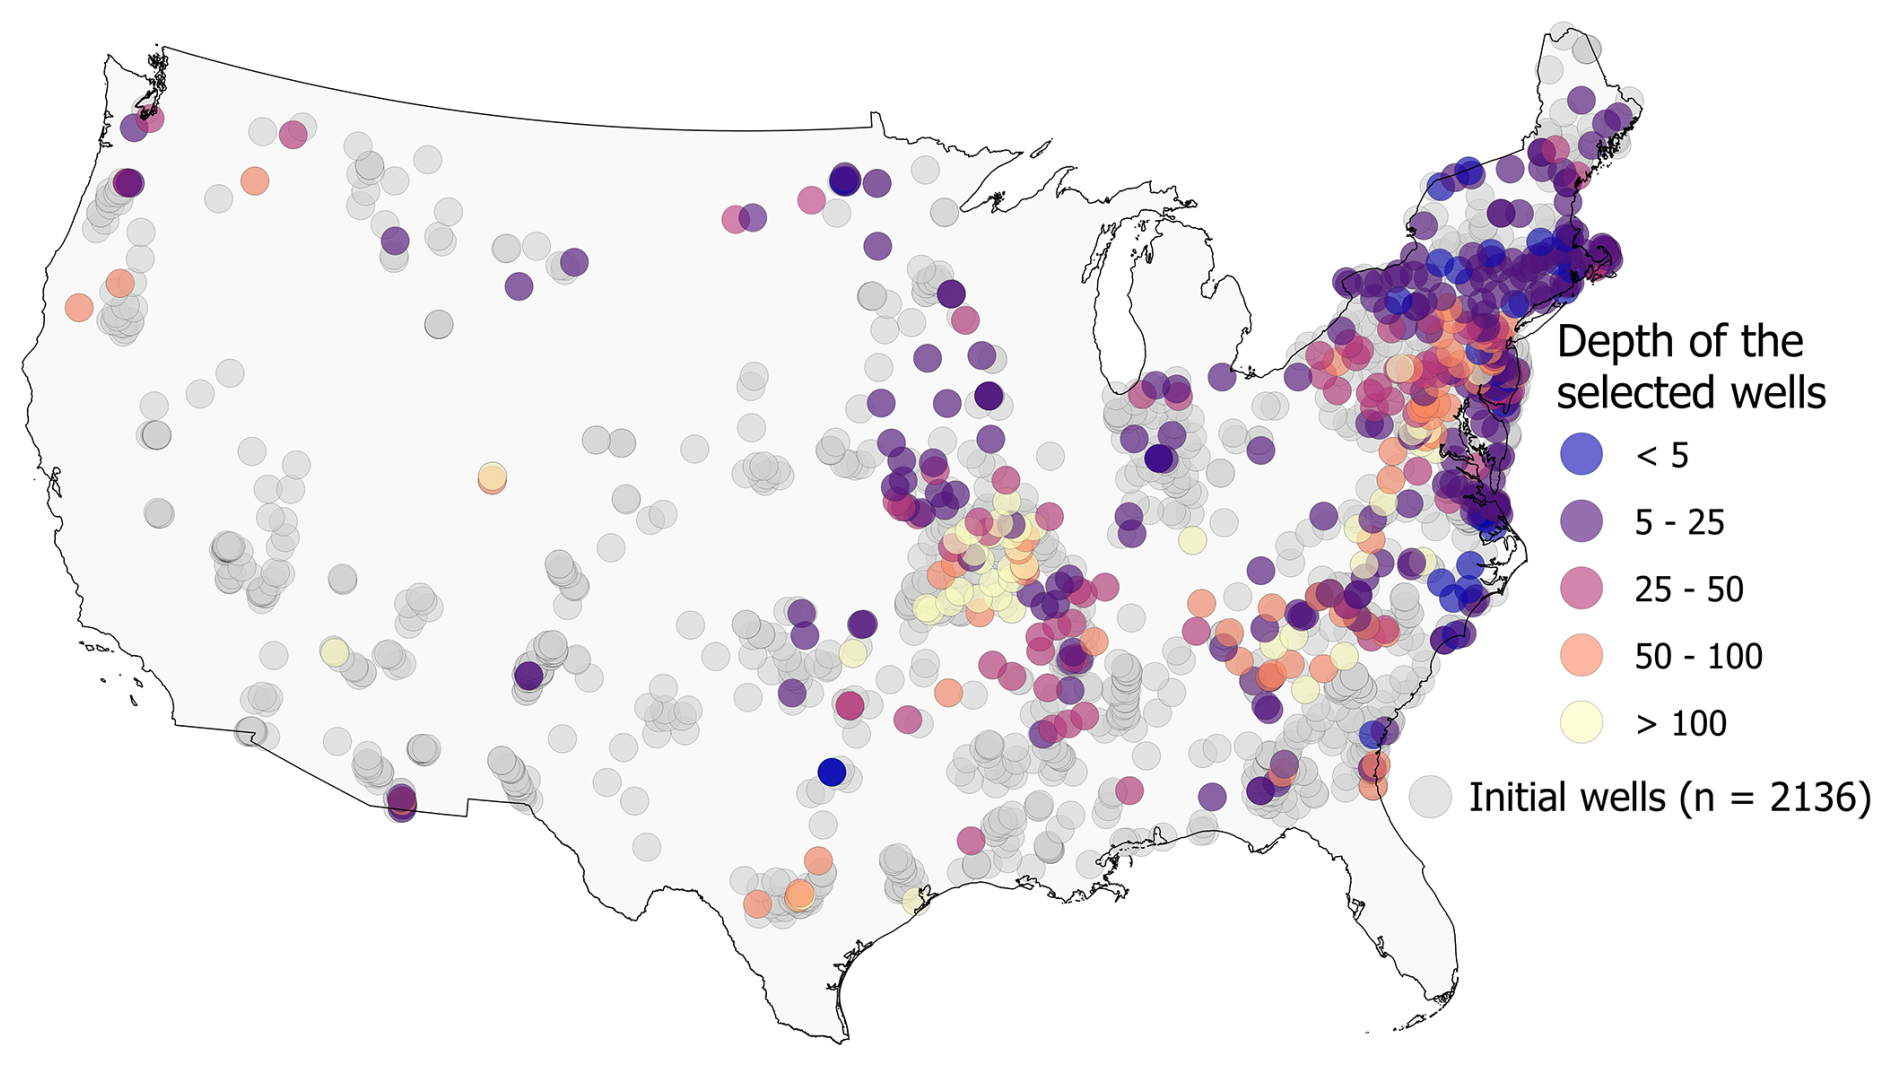
Figure 2Location of all the available observation wells with (> 2 years) daily data and the final selected wells (shown in color) with their screen depths in meters.
Examples of selected and rejected observation wells based on the secondary selection criteria are illustrated in Fig. 1. After the implementation of all these filtering and post-processing criteria, 485 daily observation wells out of 2136 are finally found suitable for our analysis (Fig. 2). Most selected wells fall within the eastern part of the US. Precipitation data from PRISM (Daly et al., 2008) are used to obtain the estimates of the MRC characteristics curve. The PRISM data have a temporal resolution of 1 d and a spatial resolution of 4 km. Evapotranspiration data that have been used in the technical validation (discussed later) are obtained from the Global Land Evaporation Amsterdam Model (GLEAM) (Martens et al., 2017; Miralles et al., 2011).
2.3 Influence of water table depth variations and nearby streams on RpSy
Although the RpSy dataset may not provide a direct estimate of recharge, it can still capture the temporal consistency of groundwater recharge. This is with the assumption that the specific yield (Sy) varies minimally in time, as has been considered in numerous groundwater studies (Maréchal et al., 2006; Gumuła-Kawęcka et al., 2022; Ala-Aho et al., 2015; Gehman et al., 2009; Varni et al., 2013). Under this assumption, temporal variations of recharge and RpSy time series are expected to be the same. However, several studies (Lv et al., 2021; Shah and Ross, 2009) have pointed out the temporally varying nature of specific yield depending on water table depth, time of drainage and other influencing factors, many of which indirectly affect water table variations and drainage rate. We perform additional analysis to evaluate the role of groundwater depth variations on Sy and, consequently, on RpSy. To this end, time-varying Sy is evaluated using the method derived in Crosbie et al. (2005), where a constant ultimate specific yield (Syu) is dynamically modified using the following equation:
Here, d is the groundwater depth. The van Genuchten drainage parameters, α and n, are obtained from POLARIS data (Chaney et al., 2019).
We also specifically identify wells where the likelihood of groundwater dynamics, and consequently recharge, being significantly affected by nearby streams is minimal. To this end, we filter out wells that are either farther than a threshold distance from big enough streams (bankfull width of>5 m) or have groundwater depth in it that is higher than the river level. The difference in groundwater and river elevations follows the procedure in Jasechko et al. (2021). Notably, Jasechko et al. (2021) considered threshold distances of 250 m and 1 km, though determining distance thresholds to demarcate the influence of streams on groundwater dynamics remains challenging. While using a threshold of 250 m and other criteria, 420 wells are selected (Sect. S1, Figs. S2 and S3, and Table S1 in the Supplement). Users may consider just these wells for benchmarking. Despite these efforts to ensure good-quality data, there is still a possibility that some contamination to recharge derived from the WTF method occurs at the selected sites.
Given that the presented dataset is the first of its kind in providing an observational data-based recharge equivalent at daily resolution, a direct validation is not possible. However, a comparison of the presented data series to recharge estimates from USGS is performed to understand the similarities and differences between these two products. Furthermore, to qualitatively test the physical plausibility of the results, the presented data are also assessed vis-à-vis the direct influencing variables, i.e., precipitation and evapotranspiration. But before performing the aforementioned evaluations, we first inter-compare the RpSy estimates using both constant and variable Sy (i.e., RpSyu). Results indicate a correlation higher than 0.8 between the two methods in 94 % of the sites (Fig. S4). Given the similarity of the two datasets (Figs. S4, S5 and Table S2) and considering that using the variable Sy requires soil drainage parameters (see Eq. 2), which are inherently uncertain (Gupta et al., 2022; Dai et al., 2019), we proceed with RpSy obtained from constant Sy for the subsequent analysis.
3.1 Comparison against USGS recharge estimates
We compare the long-term RpSy for selected observation wells against the USGS monthly recharge estimates (Reitz et al., 2017a; Reitz and Sanford, 2019a) available at 1 km×1 km resolution between October 2003 and December 2015 for the conterminous US. The USGS dataset has been developed through data analysis on water budget components from various sources, such as PRISM precipitation (Daly et al., 2008), SNODAS (Snow Data Assimilation System) snow water equivalent (National Snow and Ice Data Center, 2022), SSEBop-WB evapotranspiration (Reitz et al., 2017b), USGS groundwater-sourced irrigation map (Reitz et al., 2017a) and monthly surface runoff (Reitz and Sanford, 2019b). Figure 3 highlights the spatial variation of temporal correlations between RpSy and USGS recharge. A plot (Fig. S6) of temporal correlation between RpSyu and USGS recharge indicates similar spatial variations. The average spatial Pearson correlation between RpSy and USGS recharge at the observation wells is R=0.54, with of the wells having R>0.75. We find positive correlations in 95 % of all the selected wells, with the highest correlation of 0.99 and the lowest correlation of Higher correlations are generally observed in the moist northeastern US, while correlations are lower in the midwestern US. It is conjectured that the relatively poor performance at several wells in the midwestern states is attributable to the uniform distribution of county-scaled groundwater-sourced irrigation water use data in the assessment of USGS recharge (Reitz et al., 2017a). In contrast, wells selected for RpSy derivation are expected to not be influenced by irrigation. The disagreement also could be due to the scale mismatch between RpSy, which provides recharge equivalent estimates at a point scale (near the wells), and the gridded USGS product. Biases in precipitation and evapotranspiration data used in the USGS product can also contribute to this disagreement. An additional source of mismatch could be linked to the USGS product neglecting the change of storage in the water balance approach and the inherent uncertainties in their model structure (Reitz et al., 2017a). It is to be noted that RpSy essentially captures the recharge flux reaching the groundwater table, while the recharge estimate in the USGS product is the water flux leaking below the root zone. These two fluxes can be different, especially in settings where significant moisture deficit exists in the soil column between the root zone and the groundwater table.
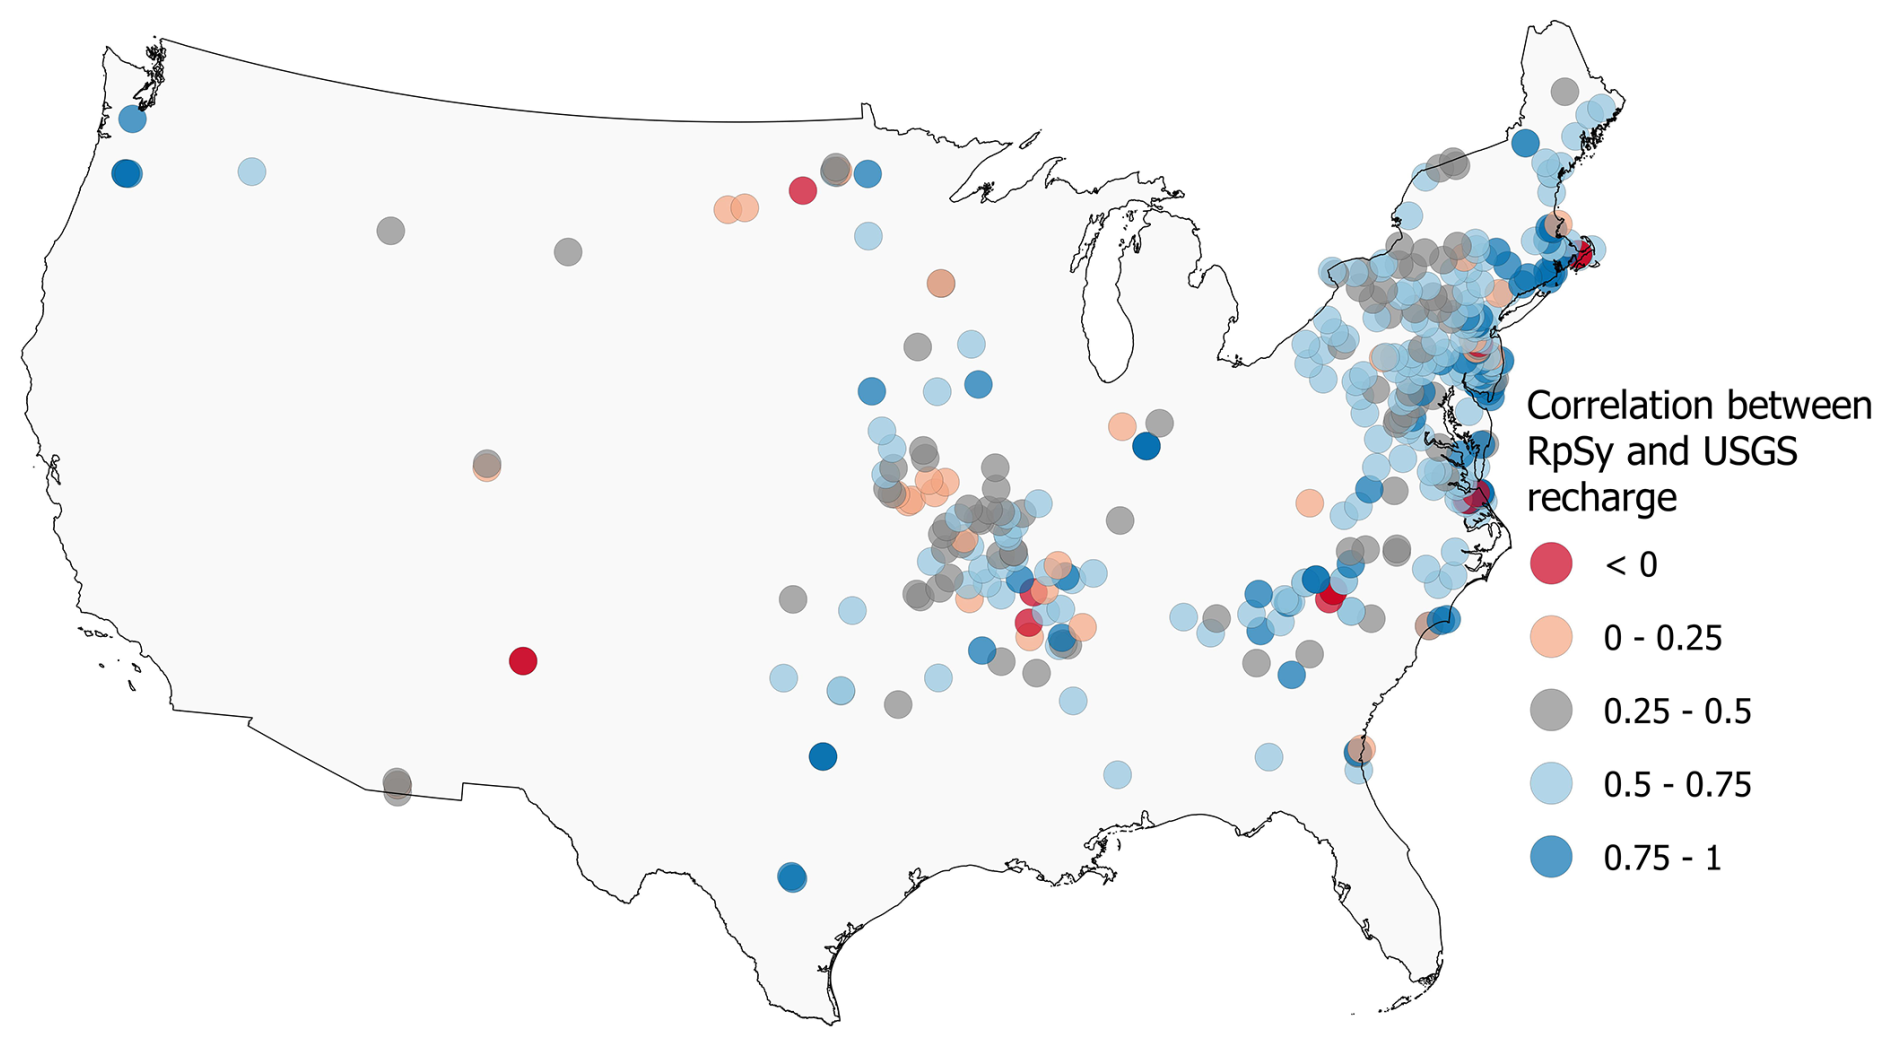
Figure 3Spatial variation of temporal correlation between RpSy (m) and USGS recharge (m).
To investigate the temporal agreement of the two products, we calculate the fraction of recharge in different months and seasons – i.e., colder months (October–March) and warmer months (April–September) – relative to the total recharge equivalent in the respective dataset. The temporal recharge fraction suggests that USGS and RpSy show larger fractions in cold months. The USGS product shows a higher recharge fraction in cold months than RpSy, resulting in a lower fraction in warm months. The lowest monthly fraction is observed around July for USGS recharge and in August for RpSy. The USGS recharge also seems to peak earlier (in December) than RpSy (in March) (Fig. 4).
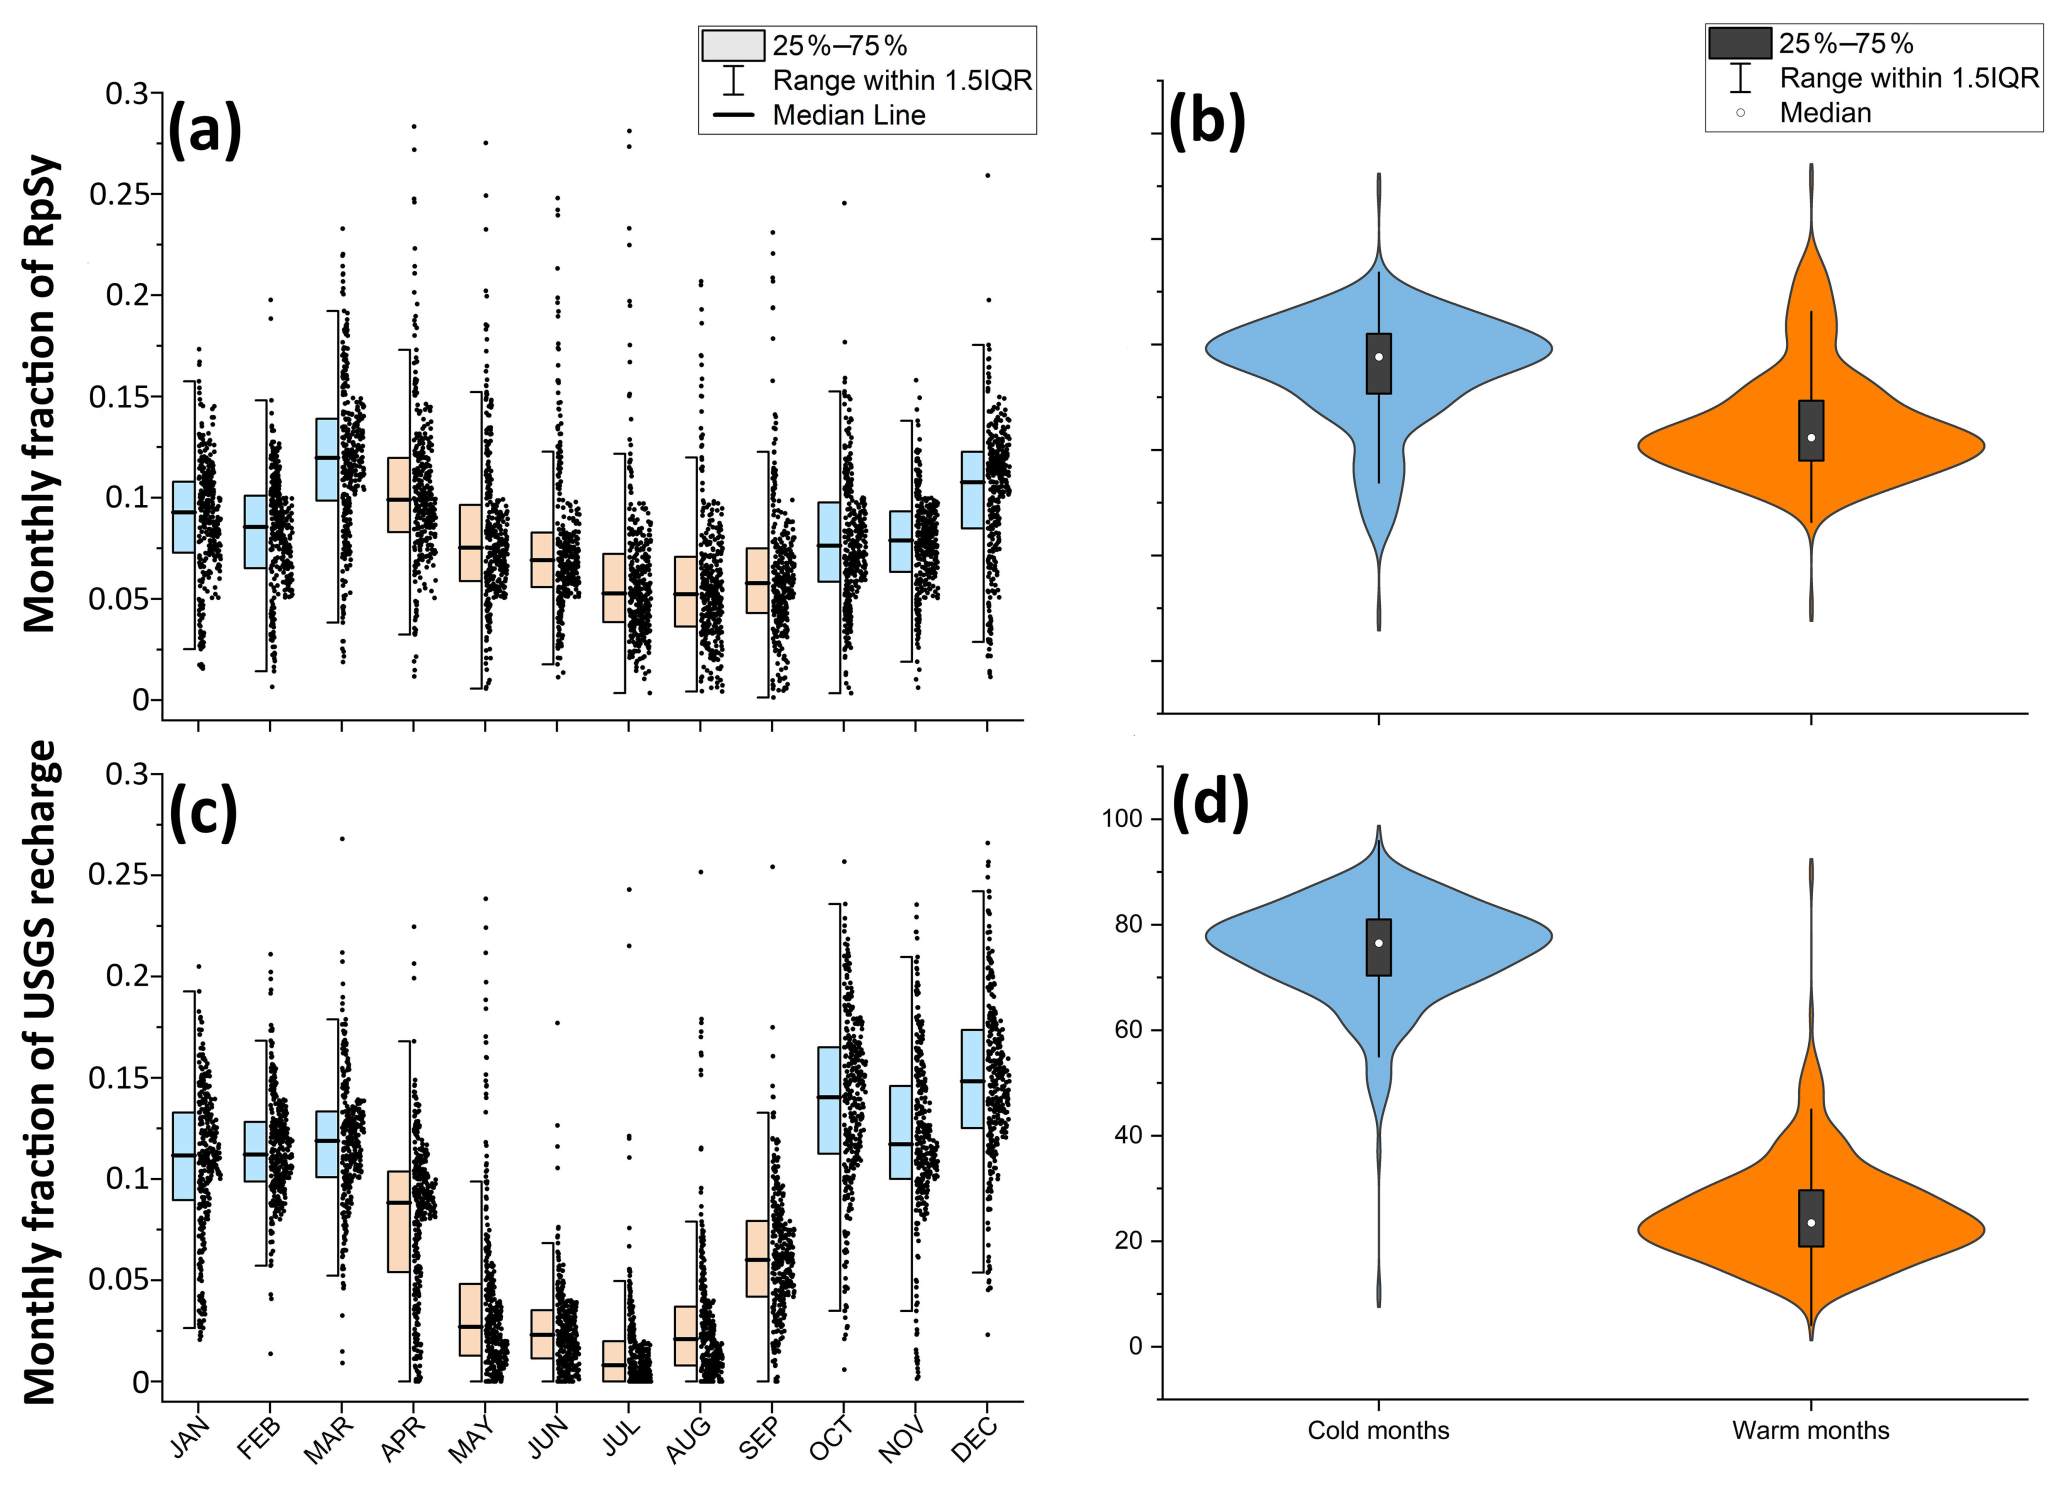
Figure 4Fraction of recharge in different months and seasons - i.e., cold season (October–March) and warm season (April–September) – relative to the total recharge(/equivalents) for recharge per unit specific yield (RpSy) (a, b) and USGS (c, d) recharge products. In this plot, USGS recharge data for the grids with RpSy estimates are used. IQR indicates the interquartile range.
3.2 RpSy variations with precipitation (Ppt) and evapotranspiration (ET)
Next, we assess the inter-annual and intra-annual variations (Table S3) in RpSy vis-à-vis Ppt and (Ppt-ET). Evaluation of inter-annual variations includes comparisons of normalized annual recharge fraction (normRpSy, henceforth) with normalized annual precipitation (normPpt, henceforth) or normalized annual precipitation minus evapotranspiration (normPpt-ET, henceforth). Here, the normalized variables (e.g., normRpSy) are calculated as the ratio of its annual magnitude for each year and the overall mean over all the data years. A plot of normRpSy and normPpt in Figs. 5a and S7a shows that the inter-annual variation in normRpSy is much larger than precipitation fractions. This points to the ratio of recharge to precipitation being generally much higher in wetter years than in drier years. In contrast, the inter-annual variation in normRpSy is relatively muted with respect to Ppt-ET, highlighting that the ratio of recharge to Ppt-ET is relatively smaller in wetter years than in drier years (Figs. 5b and S7b). A similar spatial plot (Fig. S8) showing the inter-annual variation of normalized annual recharge (normRpSyu), precipitation (normPpt) and Ppt-ET (normPpt-ET) is shown in the Supplement.
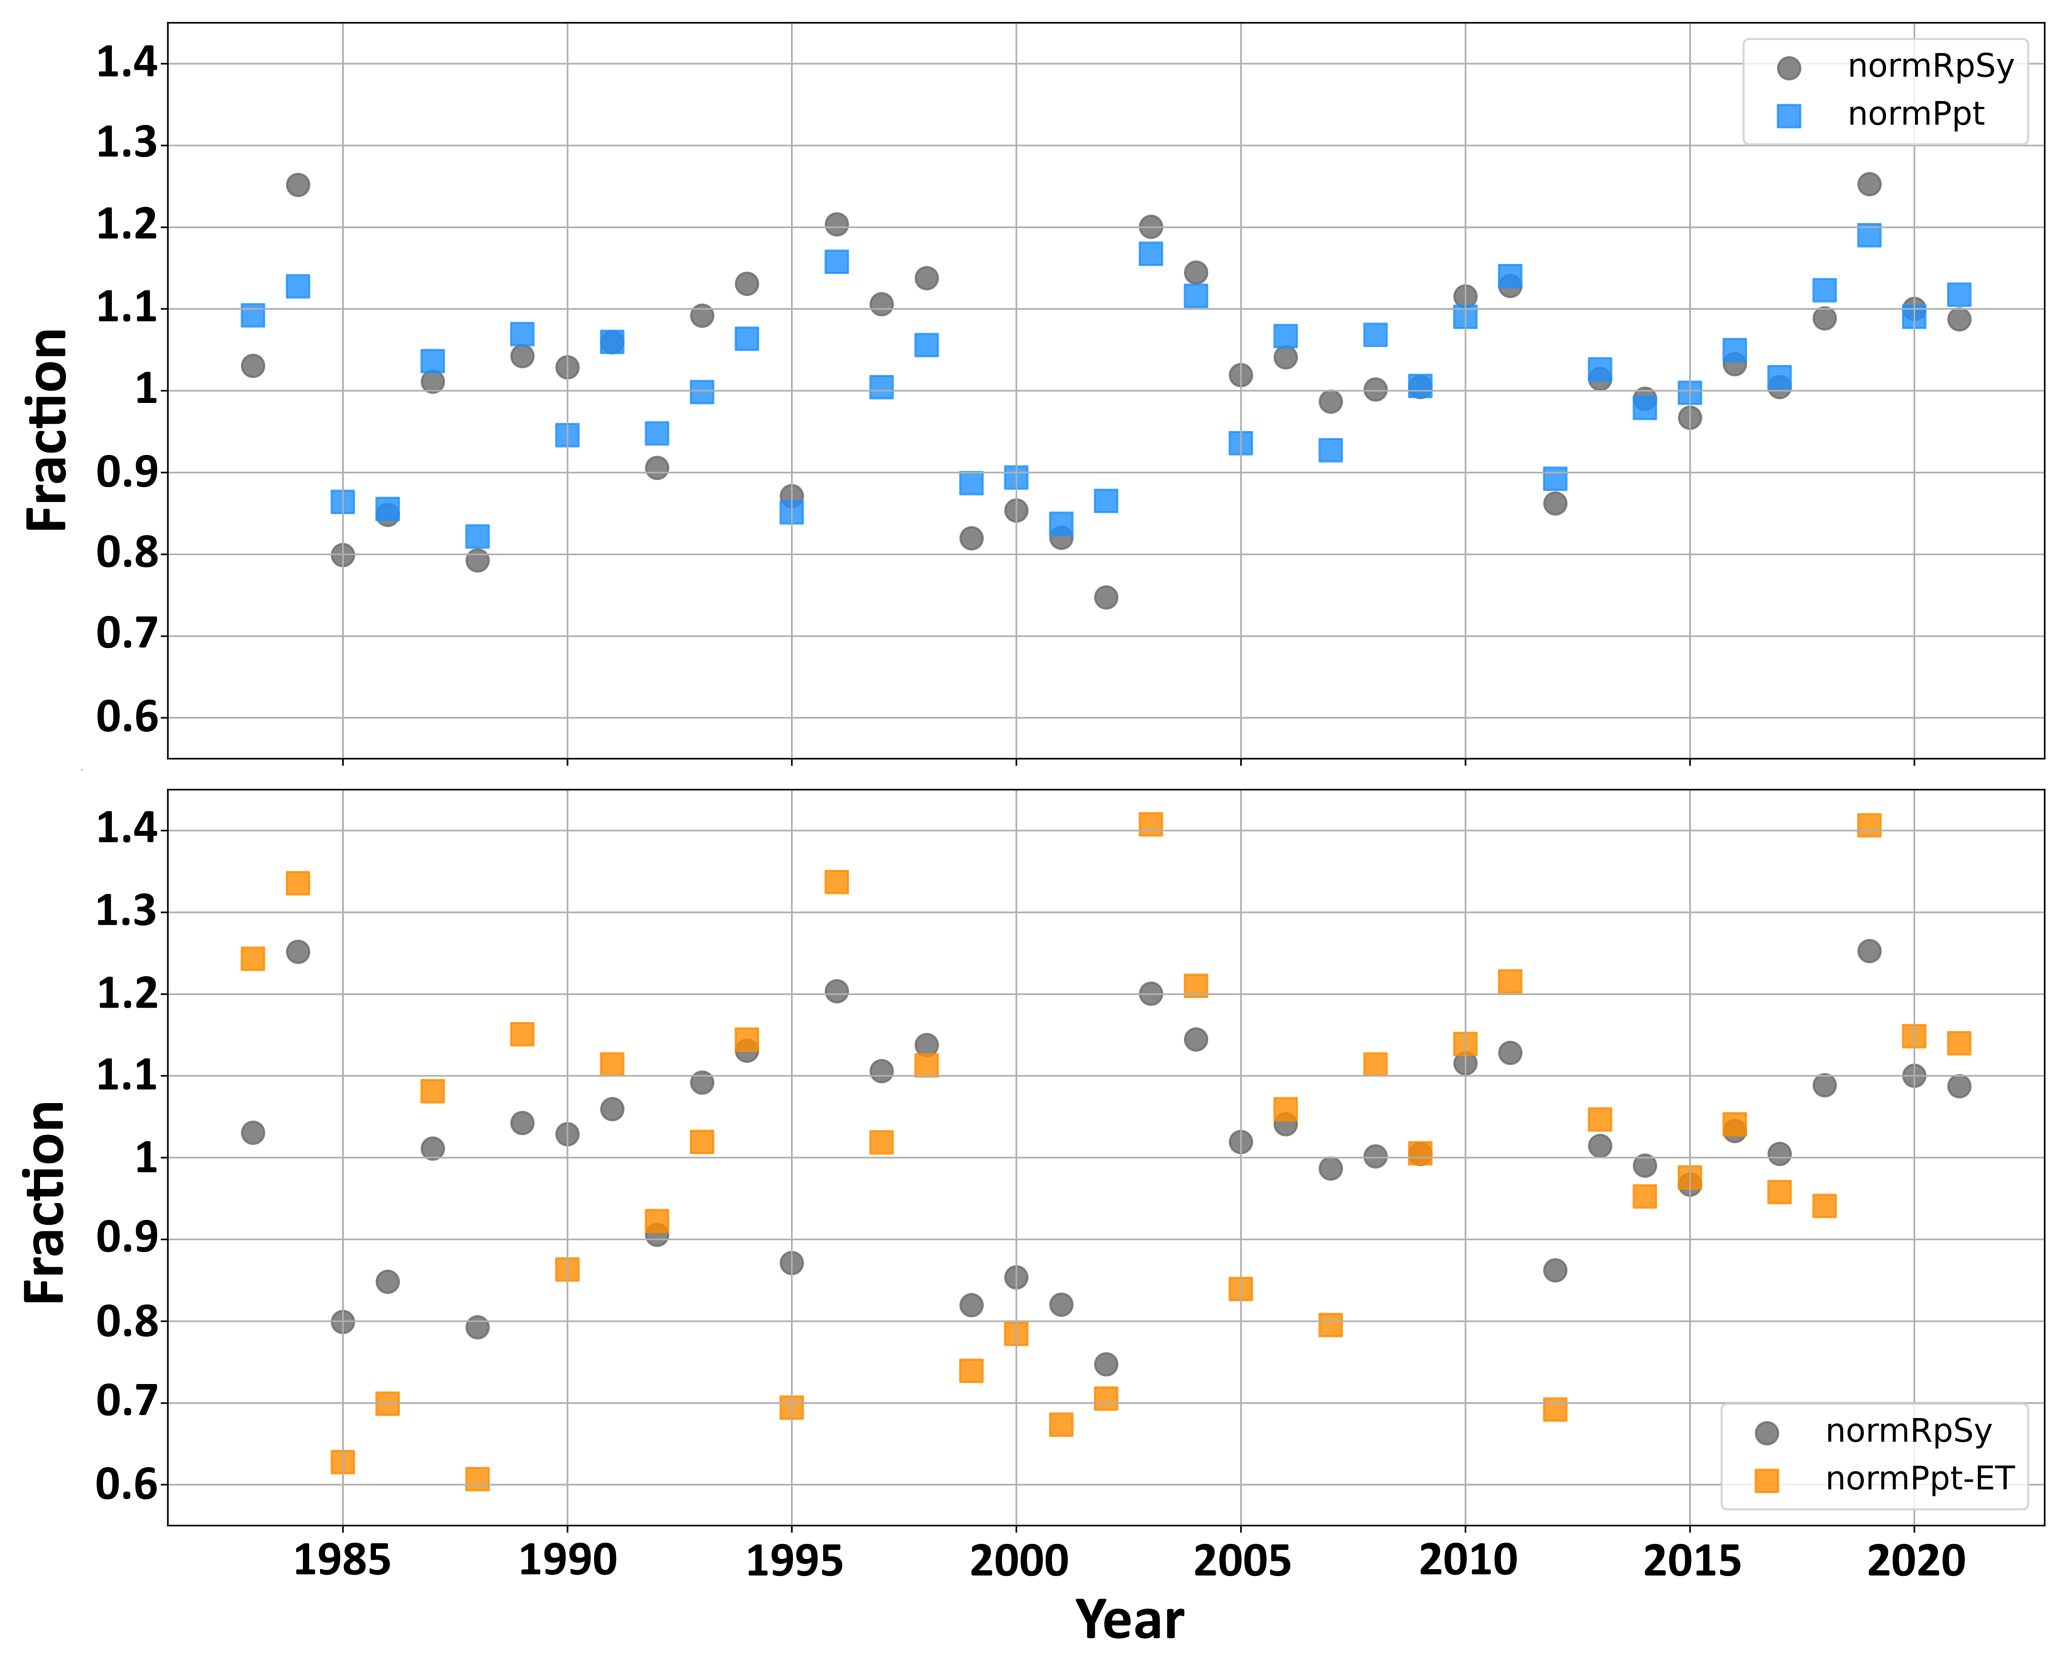
Figure 5Inter-annual variation of normalized annual recharge (normRpSy, shown using solid grey dots), precipitation (normPpt, blue squares) and Ppt-ET (normPpt-ET, orange squares).
To assess the intra-annual variation of RpSy vis-à-vis Ppt and Ppt-ET, we evaluate the centroidal date, defined as the day of the water year corresponding to the center of mass of the daily mean time series averaged over multiple water years (a water year ranges from 1 October to 30 September). The centroidal date is calculated by first obtaining the mean cumulative daily time series of the variables (i.e., RpSy, Ppt and Ppt-ET) across all considered water years and then identifying the date on which the cumulative value is half of the water year total. We find that the centroidal date for Ppt-ET < the centroidal date of RpSy < the centroidal date of Ppt (Figs. 6 and S9). The centroidal date of Ppt-ET comes earlier than the centroidal date of RpSy is likely due to a larger runoff ratio during the winter period. For example, for a shallow well in New Jersey, we notice that the centroidal date of Ppt-ET is on 4 February, which is relatively earlier than the centroidal date of RpSy and Ppt, which are on 24 March and 5 April, respectively (Fig. 6d). It is to be noted that an overestimation in ET (especially during winter) can lead to the Ppt-ET centroidal date being earlier as well. The centroidal date of RpSy comes before the centroidal date of Ppt is because of larger ET losses in summer.
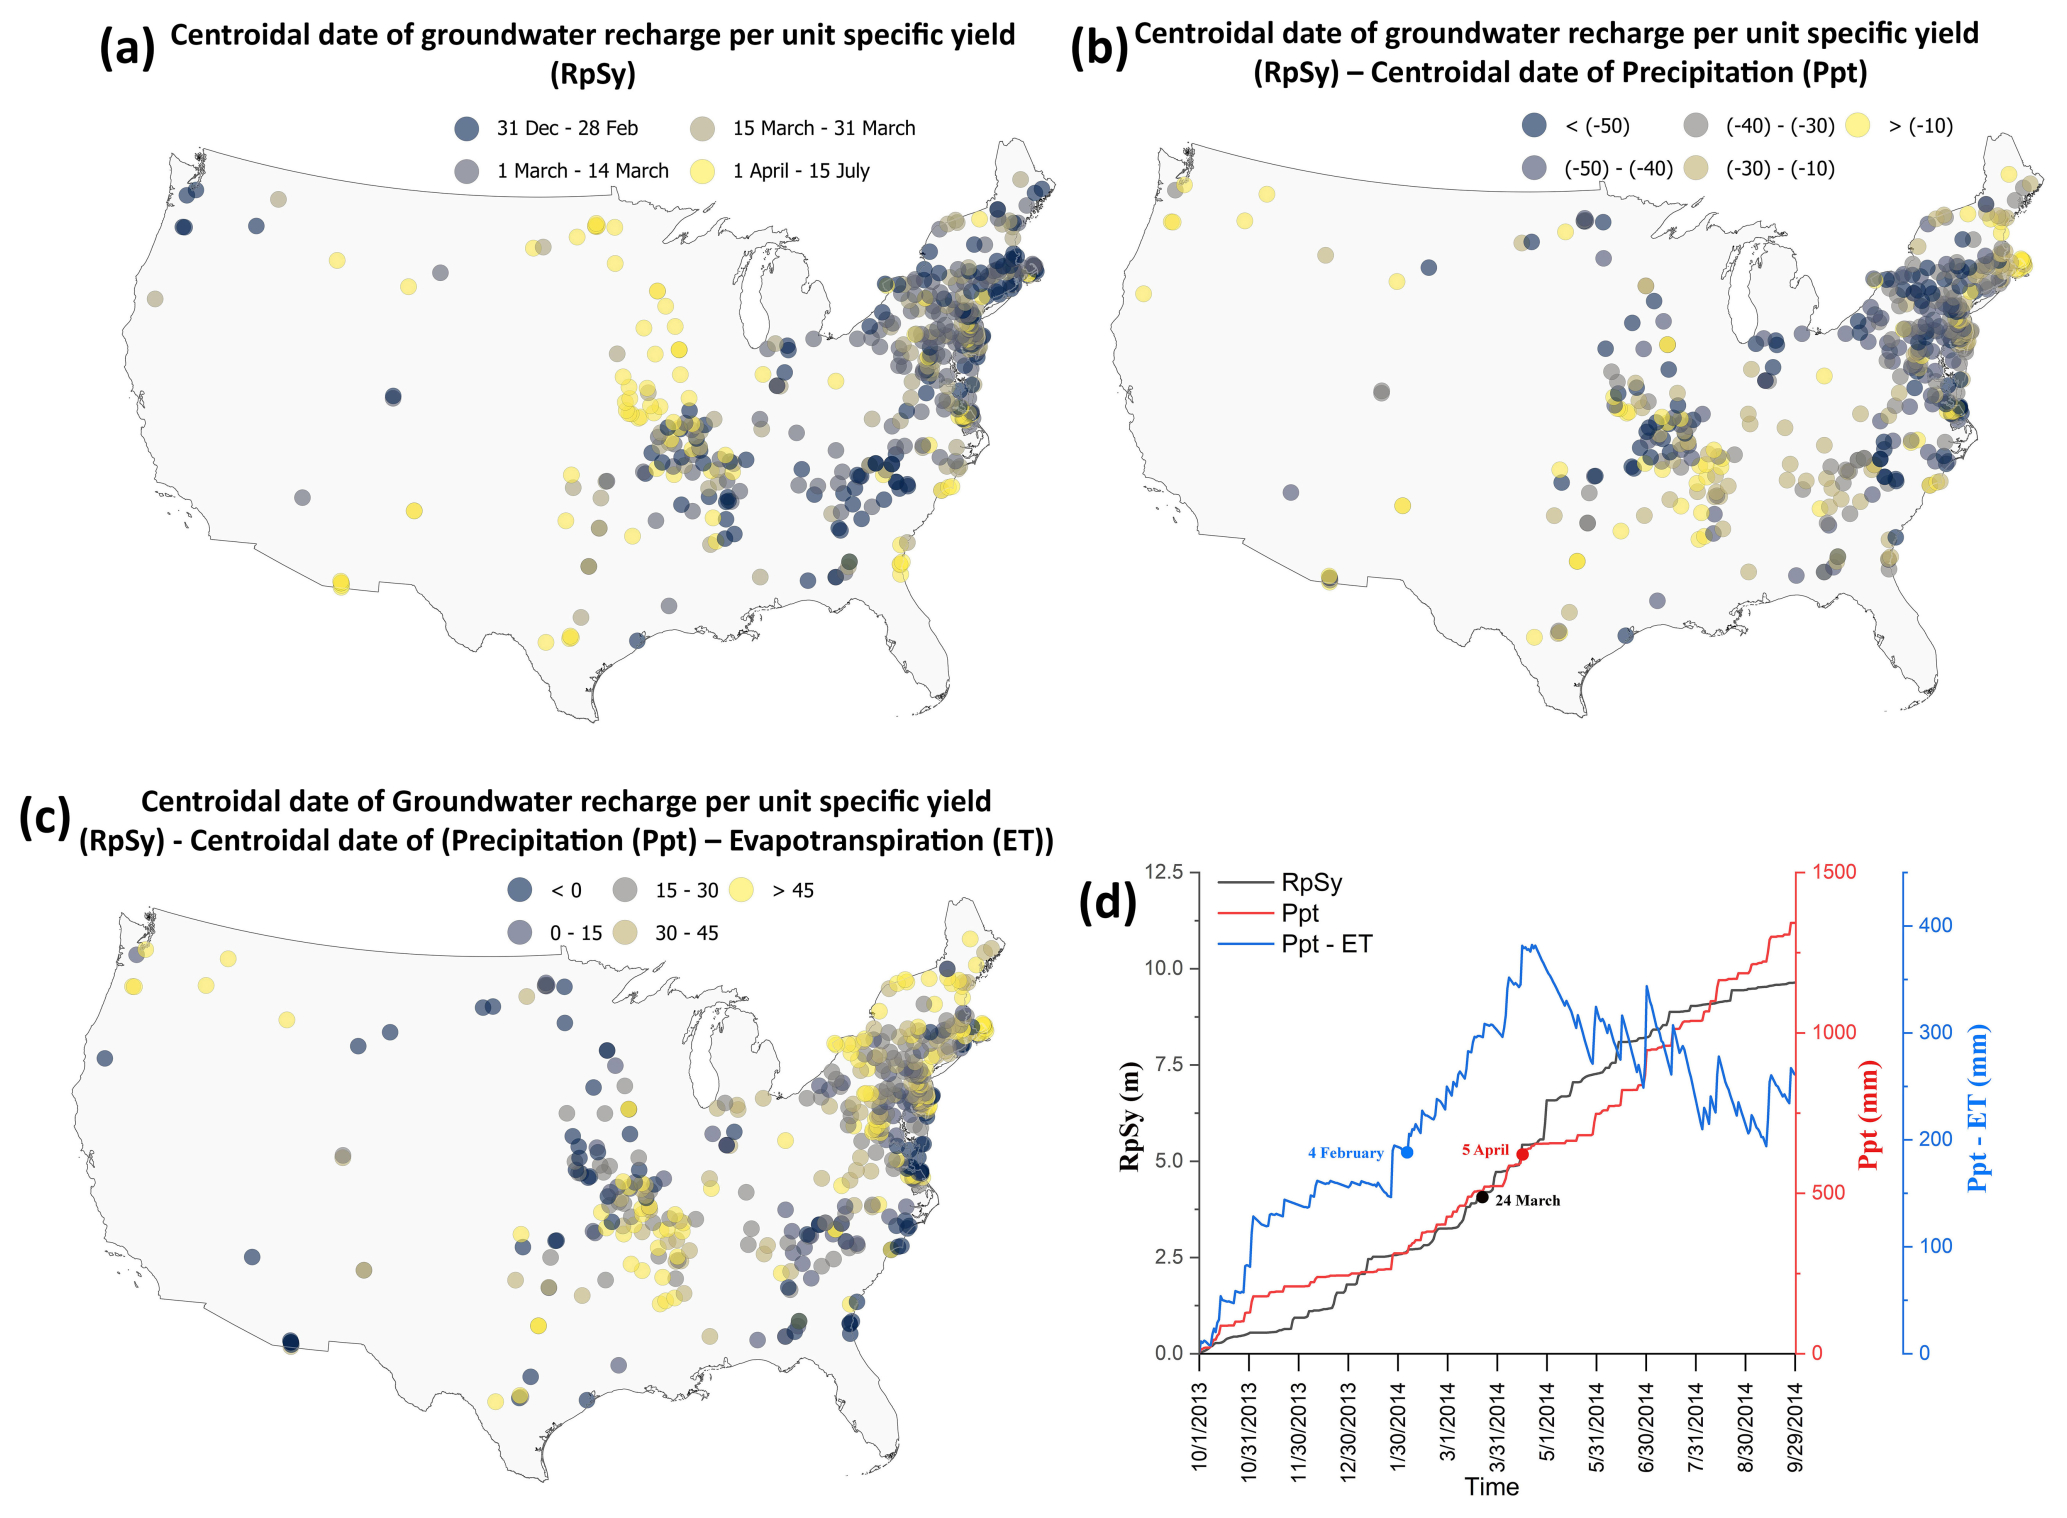
Figure 6Centroidal date for RpSy (a). Distance between centroidal date of RpSy and Ppt (b) and (Ppt-ET) (c). A negative (positive) value indicates a later (earlier) centroidal date for the variable with respect to that of RpSy. Day 1 is the start of the water year, i.e., 1 October. Also shown in (d) is a representative example of cumulative time series and corresponding estimated centroidal dates for a shallow well (well ID: 400232074213201) in New Jersey.
RpSy estimate from the WTF method can be affected by temporal variation in Sy. Although a sincere effort has been made to explicitly account for the influence of water table depth on Sy and consequently on RpSy (see Sect. 2.3), influences on Sy from other factors (Lv et al., 2021) remain unaccounted for. RpSy evaluation using the WTF method can also be influenced by several other factors, including stage variations in a nearby surface waterbody, barometric pressure shifts, abstraction, groundwater pumping in the vicinity and lateral flow contributions from uplands. As mentioned in Sect. 2.2, only sites with a good MRC curve fit are used. This ensures the applicability of the WTF method and helps filter out sites with significant pumping impacts. However, the method is not foolproof and cannot completely guarantee the absence of groundwater pumping effects. We also identify a smaller subset of sites where the contribution to recharge by nearby surface waterbodies is expected to be minimal, but the methodology cannot ensure zero contribution. Additionally, we quantify RpSyu or recharge per specific yield that considers a time-varying specific yield. In instances where specific yield fluctuates temporally due to precipitation-induced variations in groundwater table depth, RpSyu is expected to be more effective in capturing daily recharge fluctuations. This is particularly relevant in regions with a shallow groundwater table or in soils with fine textures, such as clayey soils, which have a large capillary fringe. In these conditions, the specific yield is significantly reduced. Part of the reason is that the capillary fringe retains water tightly, thereby reducing the freely drainable portion of water. Also, when the groundwater is shallow, the unsaturated zone above the capillary fringe is either minimal or absent. As a result, the soil's ability to release water is constrained. These conditions could be common in regions experiencing large fluctuations in water table depth, such as areas with large season precipitation, intensive irrigation, or heavy groundwater pumping. However, since RpSy and RpSyu are the first of their kind to provide observational data-based recharge equivalents at a daily resolution, direct validation is not feasible. The scale mismatch between RpSyu and USGS recharge data and inherent assumptions in the USGS product also preclude a direct one-to-one comparison.
Recharge estimate from WTF method may also be affected by the Lisse effect, which is characterized by a larger water level rise than expected for an infiltration amount due to trapped air in the unsaturated zone following a sudden high-intensity rain event (Crosbie et al., 2005; Cuthbert, 2010). Since the Lisse effect occurs under very specific conditions of intense rainfall, fine-textured soil and shallow groundwater table, it is expected to be less frequent. Irrespectively, as there is no sure shot method for detecting and eliminating the Lisse effect from groundwater levels without using additional data on subsurface moisture or potential, which are generally unavailable at most groundwater well sites, some influence of the Lisse effect may still be present in the derived RpSy data.
The final product we provide is continuous daily RpSy time series data estimated using the WTF method for all 485 observation wells (Fig. 2). Additionally, we also provide data of daily RpSy time series (RpSyu) while considering a groundwater-depth-dependent Sy. Furthermore, we also identify the observation wells that are less likely to be affected by water leakage from nearby streams based on the criteria outlined in Sect. 2.3. These data files, provided in the .csv format, consist of three columns for each observation well, with the first column listing the local time, while the second and third columns provide the RpSy and RpSyu time series, respectively. The file containing site information for all the selected wells has four columns that detail the USGS ID of the groundwater well and its latitude (lat), longitude (long) and screen depth (depth) (Fig. S10). We also provide the van Genuchten drainage parameters (i.e., α and n) used to derive RpSyu and the nearest stream attributes used to evaluate nearby streams' impact on each observation well. The data file can be opened in most text editors and spreadsheets. The data can be found online at Zenodo: https://doi.org/10.5281/zenodo.13323242 (Malakar et al., 2024).
We performed all steps, including data processing, MRC analysis and RpSy calculations in R and RpSyu and nearest-stream-attribute calculations in Python. All the codes, along with sample input datasets, can be found at the following link: https://doi.org/10.5281/zenodo.13323242 (Malakar et al., 2024).
The study presents a novel benchmark dataset of groundwater recharge per unit specific yield (RpSy) at daily temporal resolution. The estimates are based on WTF and MRC methods and only require readily available precipitation and GWL data to obtain the recharge equivalents. The output data (i.e., RpSy) are available for download from the Zenodo platform (Malakar et al., 2024). The datasets for continuous daily RpSy, well locations and time are provided for end-user use. Given that the presented dataset is the first of its kind in providing an observational-data-based recharge equivalent at daily resolution, a direct validation is not possible. However, a comparison of the presented data series to recharge estimates from the USGS is performed. To qualitatively assess the physical plausibility of the results, the presented data are also studied vis-à-vis the direct influencing variables, i.e., precipitation and evapotranspiration. While there is no available dataset that demonstrates the actual recharge time series at daily resolution, a comparison of the presented data series to monthly recharge estimates from USGS is performed for users of the data. Further analyses highlight that the RpSy product shows physically plausible temporal variations vis-à-vis the variations in Ppt and ET at both inter- and intra-annual scales.
While the RpSy data do not offer direct recharge estimates, they still capture the variations and changes in groundwater recharge over time at daily to coarser temporal resolution. Hence, despite the limitations, uncertainty and associated caveats discussed in Sects. 2 and 4, the RpSy dataset can be used to validate temporal consistency of recharge estimates derived from empirical methods (Reitz et al., 2017a; Reitz and Sanford, 2019a), physically based land surface models (Anurag and Ng, 2022; Li et al., 2021; Niraula et al., 2017), or integrated hydrologic models (Kumar and Duffy, 2015; Kollet and Maxwell, 2006; Kumar et al., 2009; Therrien et al., 2010). The RpSy dataset can be utilized for analyzing the timing, frequency and duration of recharge events. Since RpSy provides fluctuations at a daily scale, researchers can use the temporal patterns to assess whether the abovementioned models have the ability to accurately simulate groundwater recharge variability. The match or mismatch between the temporal alignment of RpSy-based recharge and model-based recharge outputs can provide an assessment of the model's capability to replicate the event-based response to hydroclimatic forcings. Furthermore, the data may also be used to validate the functional relationship between recharge and associated factors as represented in land surface and global hydrologic models. Gnann et al. (2023) demonstrated that theoretical and empirically based functional relationships for recharge differ significantly from global water models. Even when a model produces highly accurate predictions, it may still poorly simulate the strength of functional process couplings. In other words, it may produce the right results for the wrong reasons. Such models are likely to underperform during periods when the forcing characteristics are different than those in the training data. The derived benchmark RpSy data, along with forcing variables, can be used to validate the functional relationships represented in models of recharge using one of the several diagnostic methods, such as information theory (Ruddell et al., 2019), causality mapping (Barnett and Seth, 2014; Runge et al., 2019; Runge, 2018) and convergence cross mapping (Ye et al., 2015). The RpSy data may also be used to temporally downscale long-term recharge estimates from observations, thus facilitating the generation of recharge inputs for groundwater models (Kim et al., 2008). In circumstances where high-confidence specific yield values are available and/or obtainable from field measurements, hydrogeological surveys, or the literature, RpSy data can be converted into recharge estimates (). In these cases, a direct comparison can be made between the magnitude of modeled recharge and RpSy-based recharge. Additionally, the data may be used for an improved understanding of the role of different forcing and antecedent hydrologic conditions on groundwater recharge, thus helping to manage groundwater aquifers under water-stress conditions.
The supplement related to this article is available online at https://doi.org/10.5194/essd-17-1515-2025-supplement.
MK conceived the study and provided project administration and supervision. MK and TPC acquired funding to support the project. PM compiled the data, developed relevant codes for analyses and visualizations and generated the results. AA developed and implemented code to obtain a modified RpSy that accounts for the influence of water table depth on Sy. AA also identified the gauging stations with a smaller likelihood of influence on groundwater dynamics from nearby streams. PM and MK designed the methodology, performed data analyses and drafted the manuscript. TPC and AT provided thoughtful inputs. All authors edited the manuscript and helped improve it.
The contact author has declared that none of the authors has any competing interests.
Publisher's note: Copernicus Publications remains neutral with regard to jurisdictional claims made in the text, published maps, institutional affiliations, or any other geographical representation in this paper. While Copernicus Publications makes every effort to include appropriate place names, the final responsibility lies with the authors.
Groundwater level (GWL) records for the last 4 decades (1983–2022) are retrieved from the US Geological Survey's (USGS's) National Water Information System web interface (https://waterdata.usgs.gov/nwis/gw, last access: 15 January 2024). Daily Precipitation data from PRISM (Daly et al., 2008; https://prism.oregonstate.edu/, last access: 15 January 2024) are used. Evapotranspiration data are obtained from the Global Land Evaporation Amsterdam Model (GLEAM) (Martens et al., 2017; Miralles et al., 2011; data link: https://www.gleam.eu/, last access: 15 January 2024).
This research has been supported by the Office of Experimental Program to Stimulate Competitive Research, Office of Integrative Activities (grant-no. NSF OIA-2019561) and the National Oceanic and Atmospheric Administration (grant no. NOAA NA22NWS4320003).
This paper was edited by Di Tian and reviewed by Soumendra Bhanja and two anonymous referees.
Ala-aho, P., Rossi, P. M., and Kløve, B.: Estimation of temporal and spatial variations in groundwater recharge in unconfined sand aquifers using Scots pine inventories, Hydrol. Earth Syst. Sci., 19, 1961–1976, https://doi.org/10.5194/hess-19-1961-2015, 2015
Alley, W. M., Reilly, T. E., and Franke, O. L.: Sustainability of ground-water resources, US Department of the Interior, US Geological Survey, 1186, Denver, Colorado, USA, 1999.
Anurag, H. and Ng, G. H. C.: Assessing future climate change impacts on groundwater recharge in Minnesota, J. Hydrol., 612, 128112, https://doi.org/10.1016/J.JHYDROL.2022.128112, 2022.
Asoka, A., Wada, Y., Fishman, R., and Mishra, V.: Strong linkage between precipitation intensity and monsoon season groundwater recharge in India, Geophys. Res. Lett., 45, 5536–5544, https://doi.org/10.1029/2018GL078466, 2018.
Barnett, L. and Seth, A. K.: The MVGC multivariate Granger causality toolbox: A new approach to Granger-causal inference, J. Neurosci. Meth., 223, 50–68, https://doi.org/10.1016/j.jneumeth.2013.10.018, 2014.
Berghuijs, W. R., Luijendijk, E., Moeck, C., van der Velde, Y., and Allen, S. T.: Global Recharge Data Set Indicates Strengthened Groundwater Connection to Surface Fluxes, Geophys. Res. Lett., 49, e2022GL099010, https://doi.org/10.1029/2022GL099010, 2022.
Bhanja, S. N., Mukherjee, A., Rangarajan, R., Scanlon, B. R., Malakar, P., and Verma, S.: Long-term groundwater recharge rates across India by in situ measurements, Hydrol. Earth Syst. Sci., 23, 711–722, https://doi.org/10.5194/hess-23-711-2019, 2019.
Blasch, K. W., Constantz, J., and Stonestrom, D. A.: Thermal Methods for Investigating Groundwater Recharge, Prof. Pap., USGS, https://doi.org/10.3133/PP17031, 2007.
Boumis, G., Kumar, M., Nimmo, J. R., and Clement, T. P.: Influence of Shallow Groundwater Evapotranspiration on Recharge Estimation Using the Water Table Fluctuation Method, Water Resour. Res., 58, e2022WR032073, https://doi.org/10.1029/2022WR032073, 2022.
Chaney, N. W., Minasny, B., Herman, J. D., Nauman, T. W., Brungard, C. W., Morgan, C. L. S., McBratney, A. B., Wood, E. F., and Yimam, Y.: POLARIS Soil Properties: 30 m Probabilistic Maps of Soil Properties Over the Contiguous United States, Water Resour. Res., 55, 2916–2938, https://doi.org/10.1029/2018WR022797, 2019.
Chen, X., Kumar, M., deB Richter, D., and Mau, Y.: Impact of gully incision on hillslope hydrology, Hydrol. Process., 34, 3848–3866, https://doi.org/10.1002/HYP.13845, 2020.
Condon, L. E., Atchley, A. L., and Maxwell, R. M.: Evapotranspiration depletes groundwater under warming over the contiguous United States, Nat. Commun., 11, 1–8, https://doi.org/10.1038/s41467-020-14688-0, 2020.
Crosbie, R. S., Binning, P., and Kalma, J. D.: A time series approach to inferring groundwater recharge using the water table fluctuation method, Water Resour. Res., 41, 1–9, https://doi.org/10.1029/2004WR003077, 2005.
Crosbie, R. S., Davies, P., Harrington, N., and Lamontagne, S.: Ground truthing groundwater-recharge estimates derived from remotely sensed evapotranspiration: a case in South Australia, Hydrogeol. J., 23, 335–350, https://doi.org/10.1007/s10040-014-1200-7, 2015.
Crosbie, R. S., Doble, R. C., Turnadge, C., and Taylor, A. R.: Constraining the Magnitude and Uncertainty of Specific Yield for Use in the Water Table Fluctuation Method of Estimating Recharge, Water Resour. Res., 55, 7343–7361, https://doi.org/10.1029/2019WR025285, 2019.
Cunningham, W. L., Geiger, L. H., and Karavatis, G. A.: US Geological Survey Groundwater Climate Response Network, US Department of the Interior, US Geological Survey Fact Sheet 2007–3003, 4, https://doi.org/10.3133/fs20073003, 2007.
Cuthbert, M. O.: An improved time series approach for estimating groundwater recharge from groundwater level fluctuations, Water Resour. Res., 46, 9515, https://doi.org/10.1029/2009WR008572, 2010.
Cuthbert, M. O., Taylor, R. G., Favreau, G., Todd, M. C., Shamsudduha, M., Villholth, K. G., MacDonald, A. M., Scanlon, B. R., Kotchoni, D. O. V., Vouillamoz, J. M., Lawson, F. M. A., Adjomayi, P. A., Kashaigili, J., Seddon, D., Sorensen, J. P. R., Ebrahim, G. Y., Owor, M., Nyenje, P. M., Nazoumou, Y., Goni, I., Ousmane, B. I., Sibanda, T., Ascott, M. J., Macdonald, D. M. J., Agyekum, W., Koussoubé, Y., Wanke, H., Kim, H., Wada, Y., Lo, M. H., Oki, T., and Kukuric, N.: Observed controls on resilience of groundwater to climate variability in sub-Saharan Africa, Nature, 572, 230–234, https://doi.org/10.1038/s41586-019-1441-7, 2019.
Dai, Y., Xin, Q., Wei, N., Zhang, Y., Shangguan, W., Yuan, H., Zhang, S., Liu, S., and Lu, X.: A Global High-Resolution Data Set of Soil Hydraulic and Thermal Properties for Land Surface Modeling, J. Adv. Model. Earth Sy., 11, 2996–3023, https://doi.org/10.1029/2019MS001784, 2019.
Daly, C., Halbleib, M., Smith, J. I., Gibson, W. P., Doggett, M. K., Taylor, G. H., Curtis, J., and Pasteris, P. P.: Physiographically sensitive mapping of climatological temperature and precipitation across the conterminous United States, Int. J. Climatol., 28, 2031–2064, https://doi.org/10.1002/JOC.1688, 2008.
Delin, G. N., Healy, R. W., Lorenz, D. L., and Nimmo, J. R.: Comparison of local- to regional-scale estimates of groundwater recharge in Minnesota, USA, J. Hydrol., 334, 231–249, https://doi.org/10.1016/J.JHYDROL.2006.10.010, 2007.
Famiglietti, J. S.: The global groundwater crisis, Nat. Clim. Change, 4, 945–948, https://doi.org/10.1038/nclimate2425, 2014.
Fan, Y., Clark, M., Lawrence, D. M., Swenson, S., Band, L. E., Brantley, S. L., Brooks, P. D., Dietrich, W. E., Flores, A., Grant, G., Kirchner, J. W., Mackay, D. S., McDonnell, J. J., Milly, P. C. D., Sullivan, P. L., Tague, C., Ajami, H., Chaney, N., Hartmann, A., Hazenberg, P., McNamara, J., Pelletier, J., Perket, J., Rouholahnejad-Freund, E., Wagener, T., Zeng, X., Beighley, E., Buzan, J., Huang, M., Livneh, B., Mohanty, B. P., Nijssen, B., Safeeq, M., Shen, C., van Verseveld, W., Volk, J., and Yamazaki, D.: Hillslope Hydrology in Global Change Research and Earth System Modeling, Water Resour. Res., 55, 1737–1772, https://doi.org/10.1029/2018WR023903, 2019.
Gehman, C. L., Harry, D. L., Sanford, W. E., Stednick, J. D., and Beckman, N. A.: Estimating specific yield and storage change in an unconfined aquifer using temporal gravity surveys, Water Resour. Res., 45, W00D21, https://doi.org/10.1029/2007WR006096, 2009.
Ghannam, K., Nakai, T., Paschalis, A., Oishi, C. A., Kotani, A., Igarashi, Y., Kumagai, T., and Katul, G. G.: Persistence and memory timescales in root-zone soil moisture dynamics, Water Resour. Res., 52, 1427–1445, https://doi.org/10.1002/2015WR017983, 2016.
Gnann, S., Reinecke, R., Stein, L., Wada, Y., Thiery, W., Müller Schmied, H., Satoh, Y., Pokhrel, Y., Ostberg, S., Koutroulis, A., Hanasaki, N., Grillakis, M., Gosling, S. N., Burek, P., Bierkens, M. F. P., and Wagener, T.: Functional relationships reveal differences in the water cycle representation of global water models, Nat. Water 112, 1079–1090, https://doi.org/10.1038/s44221-023-00160-y, 2023.
Gong, C., Zhang, Z., Wang, W., Duan, L., and Wang, Z.: An assessment of different methods to determine specific yield for estimating groundwater recharge using lysimeters, Sci. Total Environ., 788, 147799, https://doi.org/10.1016/J.SCITOTENV.2021.147799, 2021.
Gonzalez, M. O., Preetha, P., Kumar, M., and Clement, T. P.: Comparison of Data-Driven Groundwater Recharge Estimates with a Process-Based Model for a River Basin in the Southeastern USA, J. Hydrol. Eng., 28, 04023019, https://doi.org/10.1061/JHYEFF.HEENG-5882, 2023.
Gumuła-Kawęcka, A., Jaworska-Szulc, B., Szymkiewicz, A., Gorczewska-Langner, W., Pruszkowska-Caceres, M., Angulo-Jaramillo, R., and Šimůnek, J.: Estimation of groundwater recharge in a shallow sandy aquifer using unsaturated zone modeling and water table fluctuation method, J. Hydrol., 605, 127283, https://doi.org/10.1016/j.jhydrol.2021.127283, 2022.
Gupta, S., Papritz, A., Lehmann, P., Hengl, T., Bonetti, S., and Or, D.: Global Soil Hydraulic Properties dataset based on legacy site observations and robust parameterization, Sci. Data, 9, 444, https://doi.org/10.1038/s41597-022-01481-5, 2022.
Healy, R. W.: Estimating groundwater recharge, Cambridge University Press, 245 pp., https://doi.org/10.1017/CBO9780511780745, 2010.
Healy, R. W. and Cook, P. G.: Using groundwater levels to estimate recharge, Hydrogeol. J., 101, 91–109, https://doi.org/10.1007/S10040-001-0178-0, 2002.
Heppner, C. S. and Nimmo, J. R.: A Computer Program for Predicting Recharge with a Master Recession Curve, US Geol. Surv. Sci. Invest. Rep. 2005-5172, US Geological Survey, p. 8, https://pubs.er.usgs.gov/publication/sir2005517 (last access: 3 April 2025), 2005.
Hung Vu, V. and Merkel, B. J.: Estimating groundwater recharge for Hanoi, Vietnam, Sci. Total Environ., 651, 1047–1057, https://doi.org/10.1016/J.SCITOTENV.2018.09.225, 2019.
Jasechko, S., Seybold, H., Perrone, D., Fan, Y., and Kirchner, J. W.: Widespread potential loss of streamflow into underlying aquifers across the USA, Nature, 591, 391–395, https://doi.org/10.1038/s41586-021-03311-x, 2021.
Kim, N. W., Chung, I. M., Won, Y. S., and Arnold, J. G.: Development and application of the integrated SWAT–MODFLOW model, J. Hydrol., 356, 1–16, https://doi.org/10.1016/J.JHYDROL.2008.02.024, 2008.
Kollet, S. J. and Maxwell, R. M.: Integrated surface-groundwater flow modeling: A free-surface overland flow boundary condition in a parallel groundwater flow model, Adv. Water Resour., 29, 945–958, https://doi.org/10.1016/j.advwatres.2005.08.006, 2006.
Konikow, L. F.: Long-Term Groundwater Depletion in the United States, Groundwater, 53, 2–9, https://doi.org/10.1111/gwat.12306, 2015.
Kumar, M. and Duffy, C. J.: Exploring the Role of Domain Partitioning on Efficiency of Parallel Distributed Hydrologic Model Simulations, J. Hydrogeol. Hydrol. Eng., 12, 2, https://doi.org/10.4172/2325-9647.1000119, 2015.
Kumar, M., Duffy, C. J., and Salvage, K. M.: A Second-Order Accurate, Finite Volume-Based, Integrated Hydrologic Modeling (FIHM) Framework for Simulation of Surface and Subsurface Flow, Vadose Zone J., 8, 873–890, https://doi.org/10.2136/vzj2009.0014, 2009.
Lapworth, D. J., MacDonald, A. M., Krishan, G., Rao, M. S., Gooddy, D. C., and Darling, W. G.: Groundwater recharge and age-depth profiles of intensively exploited groundwater resources in northwest India, Geophys. Res. Lett., 42, 7554–7562, https://doi.org/10.1002/2015GL065798, 2015.
Li, B. and Rodell, M.: Evaluation of a model-based groundwater drought indicator in the conterminous U. S., J. Hydrol., 526, 78–88, https://doi.org/10.1016/J.JHYDROL.2014.09.027, 2015.
Li, B., Rodell, M., Peters-Lidard, C., Erlingis, J., Kumar, S., and Mocko, D.: Groundwater recharge estimated by land surface models: An evaluation in the conterminous United States, J. Hydrometeorol., 22, 499–522, https://doi.org/10.1175/JHM-D-20-0130.1, 2021.
Liu, Y., Parolari, A. J., Kumar, M., Huang, C. W., Katul, G. G., and Porporato, A.: Increasing atmospheric humidity and CO2 concentration alleviate forest mortality risk, P. Natl. Acad. Sci. USA, 114, 9918–9923, https://doi.org/10.1073/pnas.1704811114, 2017.
Liu, Y., Kumar, M., Katul, G. G., Feng, X., and Konings, A. G.: Plant hydraulics accentuates the effect of atmospheric moisture stress on transpiration, Nat. Clim. Change, 107, 10, 691–695, https://doi.org/10.1038/s41558-020-0781-5, 2020.
Lv, M., Xu, Z., Yang, Z. L., Lu, H., and Lv, M.: A Comprehensive Review of Specific Yield in Land Surface and Groundwater Studies, J. Adv. Model. Earth Sy., 13, e2020MS00227, https://doi.org/10.1029/2020MS002270, 2021.
Malakar, P., Mukherjee, A., Bhanja, S. N., Ganguly, A. R., Ray, R. K., Zahid, A., Sarkar, S., Saha, D., and Chattopadhyay, S.: Three decades of depth-dependent groundwater response to climate variability and human regime in the transboundary Indus-Ganges-Brahmaputra-Meghna mega river basin aquifers, Adv. Water Resour., 149, 103856, https://doi.org/10.1016/J.ADVWATRES.2021.103856, 2021a.
Malakar, P., Mukherjee, A., Bhanja, S. N., Ray, R. K., Sarkar, S., and Zahid, A.: Machine-learning-based regional-scale groundwater level prediction using GRACE, Hydrogeol. J., 29, 1027–1042, https://doi.org/10.1007/s10040-021-02306-2, 2021b.
Malakar, P., Mukherjee, A., Bhanja, S. N., Sarkar, S., Saha, D., and Ray, R. K.: Deep Learning-Based Forecasting of Groundwater Level Trends in India: Implications for Crop Production and Drinking Water Supply, ACS ES&T Eng., 1, 965–977, https://doi.org/10.1021/ACSESTENGG.0C00238, 2021c.
Malakar, P., Anshuman, A., Boumis, G., Kumar, M., Clement, P., Tashie, A., Thakur, H., and Rathore, L.: An in-situ daily dataset for benchmarking temporal variability of groundwater recharge, Zenodo [code and data set], https://doi.org/10.5281/zenodo.13323242, 2024.
Maréchal, J. C., Dewandel, B., Ahmed, S., Galeazzi, L., and Zaidi, F. K.: Combined estimation of specific yield and natural recharge in a semi-arid groundwater basin with irrigated agriculture, J. Hydrol., 329, 281–293, https://doi.org/10.1016/j.jhydrol.2006.02.022, 2006.
Martens, B., Miralles, D. G., Lievens, H., van der Schalie, R., de Jeu, R. A. M., Fernández-Prieto, D., Beck, H. E., Dorigo, W. A., and Verhoest, N. E. C.: GLEAM v3: satellite-based land evaporation and root-zone soil moisture, Geosci. Model Dev., 10, 1903–1925, https://doi.org/10.5194/gmd-10-1903-2017, 2017.
McMahon, P. B., Plummer, L. N., Böhlke, J. K., Shapiro, S. D., and Hinkle, S. R.: A comparison of recharge rates in aquifers of the United States based on groundwater-age data, Hydrogeol. J., 19, 779–800, https://doi.org/10.1007/s10040-011-0722-5, 2011.
Meyboom, P.: Estimating groundwater recharge from stream hydrographs, J. Geophys. Res., 66, 1203–1214, https://doi.org/10.1029/JZ066I004P01203, 1961.
Milly, P. C. D. and Dunne, K. A.: Potential evapotranspiration and continental drying, Nat. Clim. Change, 6, 946–949, https://doi.org/10.1038/nclimate3046, 2016.
Miralles, D. G., Holmes, T. R. H., De Jeu, R. A. M., Gash, J. H., Meesters, A. G. C. A., and Dolman, A. J.: Global land-surface evaporation estimated from satellite-based observations, Hydrol. Earth Syst. Sci., 15, 453–469, https://doi.org/10.5194/hess-15-453-2011, 2011.
Moeck, C., Grech-Cumbo, N., Podgorski, J., Bretzler, A., Gurdak, J. J., Berg, M., and Schirmer, M.: A global-scale dataset of direct natural groundwater recharge rates: A review of variables, processes and relationships, Sci. Total Environ., 717, https://doi.org/10.1016/j.scitotenv.2020.137042, 2020.
Mueller, B. and Seneviratne, S. I.: Systematic land climate and evapotranspiration biases in CMIP5 simulations, Geophys. Res. Lett., 41, 128–134, https://doi.org/10.1002/2013GL058055, 2014.
National Snow and Ice Data Center: Snow Data Assimilation System (SNODAS) Data Products at NSIDC, Version 1, National Snow and Ice Data Center, https://nsidc.org/data/G02158/versions/1 (last access: 15 January 2024), 2022.
Nimmo, J. R. and Perkins, K. S.: Episodic Master Recession Evaluation of Groundwater and Streamflow Hydrographs for Water-Resource Estimation, Vadose Zone J., 17, 180050, https://doi.org/10.2136/vzj2018.03.0050, 2018.
Nimmo, J. R., Horowitz, C., and Mitchell, L.: Discrete-storm water-table fluctuation method to estimate episodic recharge, Groundwater, 53, 282–292, https://doi.org/10.1111/gwat.12177, 2015.
Niraula, R., Meixner, T., Ajami, H., Rodell, M., Gochis, D., and Castro, C. L.: Comparing potential recharge estimates from three Land Surface Models across the western US, J. Hydrol., 545, 410–423, https://doi.org/10.1016/j.jhydrol.2016.12.028, 2017.
Raghav, P. and Kumar, M.: Retrieving gap-free daily root zone soil moisture using surface flux equilibrium theory, Environ. Res. Lett., 16, 104007, https://doi.org/10.1088/1748-9326/AC2441, 2021.
Raghav, P., Wagle, P., Kumar, M., Banerjee, T., and Neel, J. P. S.: Vegetation Index-Based Partitioning of Evapotranspiration Is Deficient in Grazed Systems, Water Resour. Res., 58, e2022WR032067, https://doi.org/10.1029/2022WR032067, 2022.
Reitz, M. and Sanford, W.: Modern monthly effective recharge maps for the conterminous US, 2003–2015, USGS Science Data Catalog, https://data.usgs.gov/datacatalog/data/USGS:5cd0a1b1e4b09b8c0b79a51c (last access: 15 January 2024), 2019a.
Reitz, M. and Sanford, W. E.: Estimating quick-flow runoff at the monthly timescale for the conterminous United States, J. Hydrol., 573, 841–854, https://doi.org/10.1016/j.jhydrol.2019.04.010, 2019b.
Reitz, M., Sanford, W. E., Senay, G. B., and Cazenas, J.: Annual Estimates of Recharge, Quick-Flow Runoff, and Evapotranspiration for the Contiguous U. S. Using Empirical Regression Equations, J. Am. Water Resour. As., 53, 961–983, https://doi.org/10.1111/1752-1688.12546, 2017a.
Reitz, M., Senay, G. B., and Sanford, W. E.: Combining remote sensing and water-balance evapotranspiration estimates for the conterminous United States, Remote Sens.-Basel, 9, https://doi.org/10.3390/rs9121181, 2017b.
Ruddell, B. L., Drewry, D. T., and Nearing, G. S.: Information Theory for Model Diagnostics: Structural Error is Indicated by Trade-Off Between Functional and Predictive Performance, Water Resour. Res., 55, 6534–6554, https://doi.org/10.1029/2018WR023692, 2019.
Runge, J.: Causal network reconstruction from time series: From theoretical assumptions to practical estimation, Chaos, 28, 075310, https://doi.org/10.1063/1.5025050, 2018.
Runge, J., Bathiany, S., Bollt, E., Camps-Valls, G., Coumou, D., Deyle, E., Glymour, C., Kretschmer, M., Mahecha, M. D., Muñoz-Marí, J., van Nes, E. H., Peters, J., Quax, R., Reichstein, M., Scheffer, M., Schölkopf, B., Spirtes, P., Sugihara, G., Sun, J., Zhang, K., and Zscheischler, J.: Inferring causation from time series in Earth system sciences, Nat. Commun., 101, 1–13, https://doi.org/10.1038/s41467-019-10105-3, 2019.
Russo, T. A. and Lall, U.: Depletion and response of deep groundwater to climate-induced pumping variability, Nat. Geosci., 10, 105–108, https://doi.org/10.1038/ngeo2883, 2017.
Scanlon, B. R., Healy, R. W., and Cook, P. G.: Choosing appropriate techniques for quantifying groundwater recharge, Hydrogeol. J., 101, 18–39, https://doi.org/10.1007/S10040-001-0176-2, 2002.
Scanlon, B. R., Keese, K. E., Flint, A. L., Flint, L. E., Gaye, C. B., Edmunds, W. M., and Simmers, I.: Global synthesis of groundwater recharge in semiarid and arid regions, Hydrol. Process., 20, 3335–3370, https://doi.org/10.1002/hyp.6335, 2006.
Scanlon, B. R., Mukherjee, A., Gates, J., Reedy, R. C., and Sinha, A. K.: Groundwater recharge in natural dune systems and agricultural ecosystems in the Thar Desert region, Rajasthan, India, Hydrogeol. J., 18, 959–972, https://doi.org/10.1007/s10040-009-0555-7, 2010.
Seo, S. B., Mahinthakumar, G., Sankarasubramanian, A., and Kumar, M.: Conjunctive Management of Surface Water and Groundwater Resources under Drought Conditions Using a Fully Coupled Hydrological Model, J. Water Res. Pl., 144, 04018060, https://doi.org/10.1061/(ASCE)WR.1943-5452.0000978, 2018.
Shah, N. and Ross, M.: Variability in Specific Yield under Shallow Water Table Conditions, J. Hydrol. Eng., 14, 1290–1298, https://doi.org/10.1061/(asce)he.1943-5584.0000121, 2009.
Singh, N. K. and Borrok, D. M.: A Granger causality analysis of groundwater patterns over a half-century, Sci. Rep.-UK, 91, 1–8, https://doi.org/10.1038/s41598-019-49278-8, 2019.
Squeo, F. A., Aravena, R., Aguirre, E., Pollastri, A., Jorquera, C. B., and Ehleringer, J. R.: Groundwater dynamics in a coastal aquifer in north-central Chile: Implications for groundwater recharge in an arid ecosystem, J. Arid Environ., 67, 240–254, https://doi.org/10.1016/j.jaridenv.2006.02.012, 2006.
Tashie, A. M., Mirus, B. B., and Pavelsky, T. M.: Identifying long-term empirical relationships between storm characteristics and episodic groundwater recharge, Water Resour. Res., 52, 21–35, https://doi.org/10.1002/2015WR017876, 2016.
Taylor, R. G., Scanlon, B., Döll, P., Rodell, M., Van Beek, R., Wada, Y., Longuevergne, L., Leblanc, M., Famiglietti, J. S., Edmunds, M., Konikow, L., Green, T. R., Chen, J., Taniguchi, M., Bierkens, M. F. P., Macdonald, A., Fan, Y., Maxwell, R. M., Yechieli, Y., Gurdak, J. J., Allen, D. M., Shamsudduha, M., Hiscock, K., Yeh, P. J. F., Holman, I., and Treidel, H.: Ground water and climate change, Nat. Clim. Change, 3, 322–329, https://doi.org/10.1038/nclimate1744, 2013a.
Taylor, R. G., Todd, M. C., Kongola, L., Maurice, L., Nahozya, E., Sanga, H., and Macdonald, A. M.: Evidence of the dependence of groundwater resources on extreme rainfall in East Africa, Nat. Clim. Change, 3, 374–378, https://doi.org/10.1038/nclimate1731, 2013b.
Therrien, R., McLaren, R. G. G., Sudicky, E. A. A., and Panday, S. M. M.: HydroGeoSphere: a three-dimensional numerical model describing fully-integrated subsurface and surface flow and solute transport, Groundw. Simulations Group, Univ. Waterloo, Waterloo, 322 pp., https://www.ggl.ulaval.ca/fileadmin/ggl/documents/rtherrien/hydrogeosphere.pdf (last access: 15 January 2024), 2010.
Thomas, B. F., Behrangi, A., and Famiglietti, J. S.: Precipitation intensity effects on groundwater recharge in the southwestern United States, Water-Sui., 8, 90, https://doi.org/10.3390/w8030090, 2016.
Valois, R., MacDonell, S., Núñez Cobo, J. H., and Maureira-Cortés, H.: Groundwater level trends and recharge event characterization using historical observed data in semi-arid Chile, Hydrolog. Sci. J., 65, 597–609, https://doi.org/10.1080/02626667.2020.1711912, 2020.
Varni, M., Comas, R., Weinzettel, P., and Dietrich, S.: Application of the water table fluctuation method to characterize groundwater recharge in the Pampa plain, Argentina, Hydrol. Sci. J., 58, 1445–1455, https://doi.org/10.1080/02626667.2013.833663, 2013.
Wu, J., Cao, M., Tong, D., Finkelstein, Z., and Hoek, E. M. V.: A critical review of point-of-use drinking water treatment in the United States, npj Clean Water, 4, 40, https://doi.org/10.1038/s41545-021-00128-z, 2021.
Xu, C. Y. and Chen, D.: Comparison of seven models for estimation of evapotranspiration and groundwater recharge using lysimeter measurement data in Germany, Hydrol. Process., 19, 3717–3734, https://doi.org/10.1002/HYP.5853, 2005.
Ye, H., Deyle, E. R., Gilarranz, L. J., and Sugihara, G.: Distinguishing time-delayed causal interactions using convergent cross mapping, Sci. Rep.-UK, 5, 14750, https://doi.org/10.1038/srep14750, 2015.
Zhang, J., Felzer, B. S., and Troy, T. J.: Extreme precipitation drives groundwater recharge: the Northern High Plains Aquifer, central United States, 1950–2010, Hydrol. Process., 30, 2533–2545, https://doi.org/10.1002/hyp.10809, 2016.