the Creative Commons Attribution 4.0 License.
the Creative Commons Attribution 4.0 License.
 | 11 Apr 2025
MDG625: a daily high-resolution meteorological dataset derived by a geopotential-guided attention network in Asia (1940–2023)
Zijiang Song
Zhixiang Cheng
Yuying Li
Shanshan Yu
Xiaowen Zhang
Min Liu
The long-term and reliable meteorological reanalysis dataset with high spatial–temporal resolution is crucial for various hydrological and meteorological applications, especially in regions or periods with scarce in situ observations and with limited open-access data. Based on the fifth-generation reanalysis dataset (ERA5, produced by the European Centre for Medium-Range Weather Forecasts, 0.25°×0.25°, since 1940) and CLDAS (China Meteorological Administration Land Data Assimilation System, 0.0625°×0.0625°, since 2008), we propose a novel downscaling method Geopotential-guided Attention Network (GeoAN), leveraging the high spatial resolution of CLDAS and the extended historical coverage of ERA5, and produce the daily multi-variable (2 m temperature, surface pressure, and 10 m wind speed) meteorological dataset MDG625. MDG625 (0.0625° Meteorological Dataset derived by GeoAN) covers most of Asia from 0.125° S to 64.875° N and 60.125 to 160.125° E, and contains data starting in 1940. Compared with other downscaling methods, GeoAN shows better performance with R2 (2 m temperature, surface pressure, and 10 m wind speed reach 0.990, 0.998, and 0.781, respectively). MDG625 demonstrates superior continuity and consistency from both spatial and temporal perspectives. We anticipate that the GeoAN method and this dataset, MDG625, will aid in climate studies of Asia and will contribute to improving the accuracy of reanalysis products from the 1940s. The MDG625 dataset (Song et al., 2024) is presented at https://doi.org/10.57760/sciencedb.17408, and the code can be found at https://github.com/songzijiang/GeoAN (last access: 8 April 2025).
- Article
(7570 KB) - Full-text XML
- BibTeX
- EndNote


As temperatures rise and extremes become more frequent, weather-related data analysis is becoming increasingly important (Berrang-Ford et al., 2011; Dietz et al., 2020; Taylor et al., 2013; Karl and Trenberth, 2003). Spatial resolution is crucial for geographic datasets. However, the distribution of in situ stations is too sparse to produce a high-quality reanalysis dataset, especially for past decades. For getting a higher-resolution reanalysis dataset, downscaling is widely used in geoprocessing (Atkinson, 2013), especially in climate-related fields (Wang et al., 2021; Vogel et al., 2023; Tefera et al., 2024; Sun et al., 2024). The meteorological reanalysis dataset, which is obtained from in situ and remote sensing measurements, is important for agriculture, extreme weather forecasts, etc. The higher resolution of these data can better guide life and production. He et al. (2020) produced a meteorological dataset with a spatial resolution of 0.1° starting in 1979 in China. In that paper, the China Meteorological Forcing Dataset was created by fusing remote sensing products, reanalysis datasets, and in situ station data. The most significant contribution of this work was using a larger number of stations to improve the dataset. A long-term gridded daily meteorological dataset for northwestern North America was proposed by Werner et al. (2019). The authors produced a dataset for training statistical downscaling schemes in Canada. Similarly, Bonanno et al. (2019) proposed the high-resolution meteorological dataset named MERIDA in Italian. MERIDA was produced by dynamical downscaling from the fifth-generation reanalysis (ERA5) dataset for the global climate and weather using the Weather Research and Forecasting model (WRF). The resolution of the image is fundamentally limited by the optical constraints of the imaging components, and high-resolution reanalysis data are expensive to produce. Moreover, obtaining detailed historical data at high resolution poses a significant challenge, especially since historical observations are limited in number. High-quality and high-resolution data are necessary for various studies, and to resolve the contradiction, low-resolution (LR) data products to downscale into high-resolution (HR, also called ground truth) are widely used (Hu et al., 2023; Zhong et al., 2023). The mainly used downscaling methods are categorized into statistical downscaling and dynamical downscaling. While the existing downscaling methods could produce high-resolution results, the results are unsatisfactory, and these methods are unable to reconstruct the missing details and use information from long historical samples (Murphy, 1999). Meteorological data exhibit a high degree of historical similarity, and long-term historical records can effectively guide the generation of downscaled data. Dynamical downscaling methods are usually based on regional climate models (RCMs) with the initial fields produced by global climate models (GCMs). Although RCMs offer higher resolution than GCMs, the comprehension ability to accurately represent the real world is not enough. It leads to a considerable bias (Teutschbein and Seibert, 2012). The method experiences challenges in developing precise simulation equations, which often struggle to capture the complexity of natural systems. Looking from another perspective, the computational cost of RCMs is huge, and it is an obstacle to producing a wider range of results for each calculation (Giorgi and Gutowski Jr, 2015; Di Luca et al., 2015). Compared with dynamical downscaling, statistical downscaling uses the mapping relationship between a high resolution and a low resolution from historical datasets to produce future datasets. The computational cost and bias of statistical downscaling are lower than dynamical downscaling methods.
Deep learning is a statistical method used to build the bridge between input and output. Since Vaswani et al. (2017) proposed the transformer network, the ability of deep learning to harvest shadow information has gained a step. After that, the transformer block is widely used in diverse tasks, including super resolution (SR) (Liang et al., 2021; Zhang et al., 2022; Song and Zhong, 2022). Liang et al. (2021) proposed SwinIR and achieved impressive results in the SR task and is considered the benchmark for the SR task. The core algorithm of SwinIR is using no overlap windows to split the input feature to calculate the attention relationship inner each window and shift the windows by the step of the half-width of the windows. Song and Zhong (2022) proposed a novel network to harvest long-range information from global instead of inner windows. The experimental results on SR benchmarks (Bevilacqua et al., 2012; Martin et al., 2001; Huang et al., 2015; Matsui et al., 2017) show this strategy, such as peak signal-to-noise ratio (PSNR) and structural similarity index (SSIM), can achieve better results. Super-resolution tasks share similarities with geographic downscaling tasks. Applying deep-learning-based super-resolution techniques to downscale geographical data can successfully overcome issues associated with traditional downscaling approaches, such as high bias, regional sensitivity, and high computational expenses. Deep learning techniques employ multiple layers to link low-resolution inputs with high-resolution outputs while demonstrating robustness to sensitivity issues. After training, the computational expense remains minimal during deployment. The deep learning approach can easily accommodate a wide range of applications. Shen et al. (2023) proposed a near-surface air temperature downscaling network SNCA-CLDASSD. In their framework, Shen et al. (2023) used two attention blocks designed to downscale the input through a technique known as cross-attention, which is based on principles of Light-CLDASSD. However, only near-surface air temperature is considered in this work, and the network was built on CLDAS (China Meteorological Administration Land Data Assimilation System), which does not support multi-year data coverage. Liu et al. (2023) used the terrain to guide the deep learning network for the downscaling task called the terrain-guided attention network (TGAN) in southwest China. TGAN used a digital elevation model (DEM) to build high-resolution temperature results (at 2 m). The application of TGAN started in 2018, and it is not applicable in historical situations. Zhong et al. (2023) proposed a transformer-based learning method Uformer, which directly adds topography data to achieve high-resolution meteorological variables in Inner Mongolia province, China. Although topography data can help rebuild the high resolution, directly adding to the low-resolution input causes the loss of topographic characteristics. The current advanced deep learning techniques for meteorological downscaling predominantly employ attention-based architectures. Nevertheless, current approaches concentrate on just one or two meteorological variables. Variables are interconnected, and deep learning can process multiple variables simultaneously. Calculating several variables at once not only reduces computational demands but also boosts model effectiveness. Most crucially, no existing models can analyze extensive historical data covering various variables over a long period.
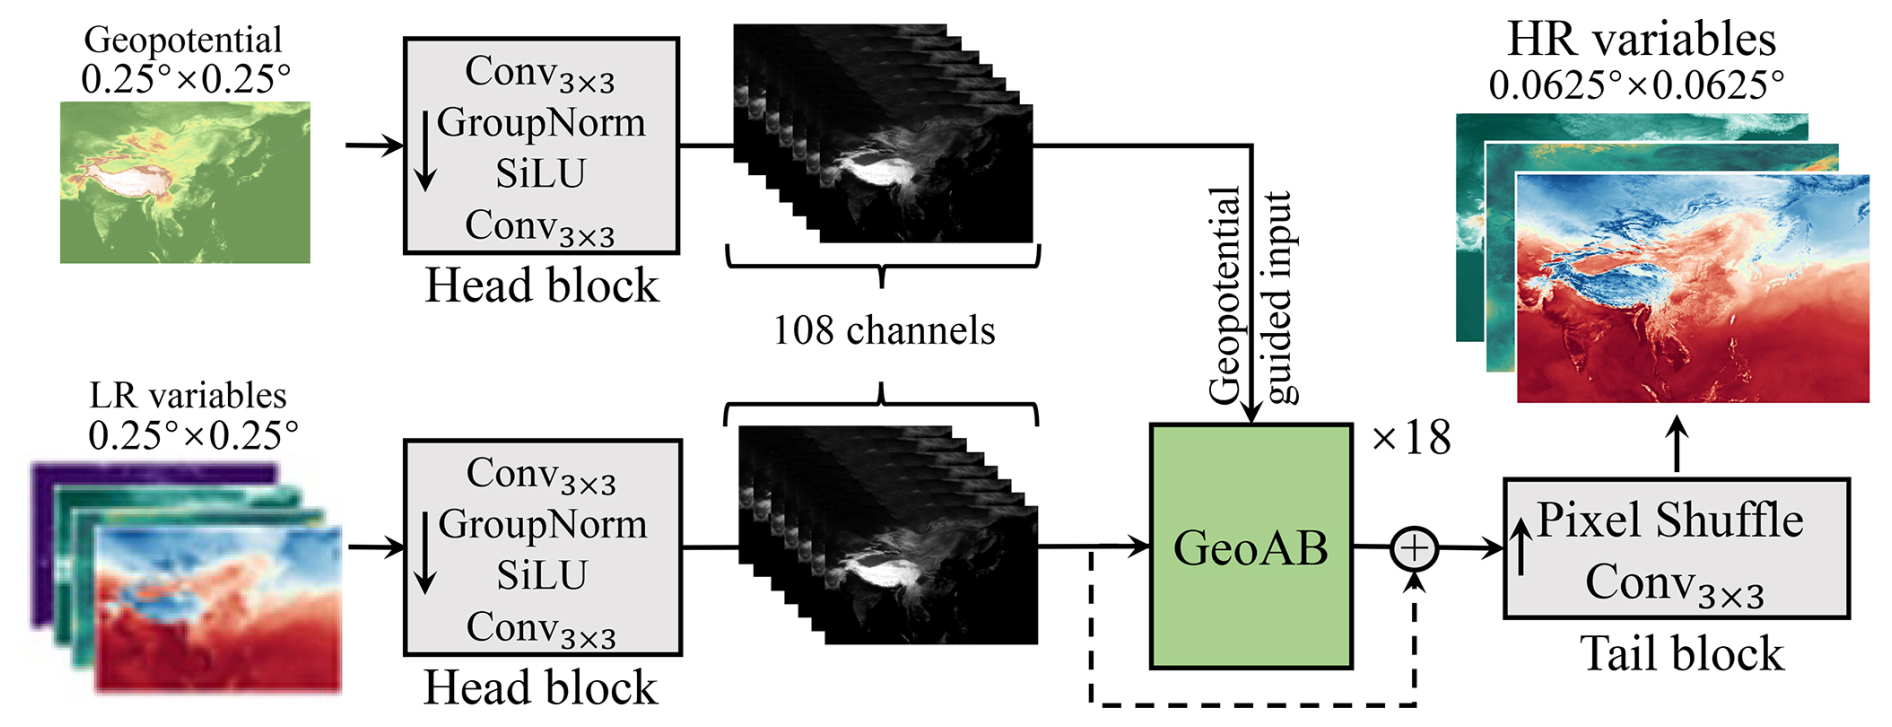
Figure 1Sketch of the GeoAN. LR and HR stand for low-resolution and high-resolution, respectively. The head block contains one group norm, one activation function, and two convolutions, which are abbreviated as Conv3×3, meaning the kernel size is 3×3. The sigmoid linear unit (SiLU) is adopted as the activation function. The results of the two head blocks in the diagram have the same number of channels (108). GeoAB, which is repeated 18 times, constricted by the hardware and the data amount, is the attention block for extracting deep information using geopotential. The pixel shuffle operation is performed after the convolution in the tail block to produce the high-resolution variables. Note that the order of execution in each grey block (i.e., head and tail blocks) is along the arrows in the box.
In this paper, we propose a novel attention-based network called the Geopotential-guided Attention Network (GeoAN), designed for downscaling meteorological variables such as temperature at 2 m (T2m), surface pressure (PRS), and wind speed at 10 m (WS10m) from a coarser resolution of 0.25° to a finer resolution of to 0.0625°. The architecture of GeoAN is illustrated in Fig. 1. The proposed GeoAN is guided by the geopotential, which makes the model learn information in a targeted manner instead of unguided or random learning processes. The low-resolution input of the variables is sourced from ERA5, provided by the European Centre for Medium-Range Weather Forecasts (ECMWF), with data ranging from 1940 to the present. The target data for the downscaling algorithm are derived from CLDAS (Sun et al., 2020; Shi et al., 2011), which provides high-quality, high-resolution daily data. However, CLDAS data are only available for the years after 2008, creating a gap in historical records. To address this limitation, we employed deep learning networks to establish a robust mapping relationship between ERA5 and CLDAS datasets. By training the GeoAN model on the part overlapping period (2020 onward), we generated a consistent and accurate historical meteorological dataset extending back to 1940. This newly created dataset, referred to as MDG625, effectively fills the gap in CLDAS data prior to 2008 while also enhancing the spatial resolution of ERA5 data. The development of MDG625 is particularly valuable for various applications, including climate change studies and the analysis of extreme weather events. The increased spatial and temporal resolution provided by MDG625 allows researchers to perform more detailed analyses, offering insights into long-term climate trends and high-resolution weather patterns that were previously challenging.
2.1 Data
The study area spans most of Asia (latitudes from 0.125° S to 64.875° N and longitudes from 60.125 to 160.125° E), including China, Japan, and India. ERA5 is the fifth-generation ECMWF reanalysis, provided by the ECMWF and widely used (Muñoz-Sabater et al., 2021; Hersbach et al., 2020; Jiang et al., 2021; Olauson, 2018; Cucchi et al., 2020) for the global climate and weather. ECMWF is a premier international organization, considered advanced in numerical weather prediction (NWP) models. The variables of PRS and T2m used in this study are directly sourced from the ERA5 dataset, while WS10m is calculated from U and V components of the wind at 10 m. CLDAS, which uses multigrid variational analysis and multi-source precipitation fusion, is a reanalysis product provided by the China Meteorological Administration (CMA). The high-resolution data in CLDAS appear to be more accurate and reliable compared to other datasets. In this paper, ERA5 is used as the low-resolution (LR) image, and CLDAS is treated as the high-resolution (HR, i.e., ground truth) image to train the proposed model. The output from the downscaling network is called super-resolution (SR) images.
There are four meteorological variables, namely, temperature at 2 m, pressure at the surface, wind speed at 10 m, and daily total precipitation (TP), that are considered in GeoAN. Considering it is hard to process the downscaling of TP, only three other variables are produced by GeoAN in MDG625. The period of the dataset used to train the network spans from 2020 to 2022, while the validation dataset covers the entire year of 2023. It is important to mention that all times are referenced in coordinated universal time (UTC). The spatial resolutions of ERA5 and CLDAS are 0.25 and 0.0625°, respectively. The temporal resolution of these two datasets is calculated to 1 d, which is calculated by the mean of PRS (hPa), T2m (K), and WS10m (m s−1) and the sum of TP (mm) over the whole day, respectively, using the corresponding hourly data. The region is defined by CLDAS boundaries, i.e., latitudes from 0.125° S to 64.875° N, and the range of longitudes is from 60.125 to 160.125° E. However, since the grid systems of ERA5 and CLDAS do not align perfectly, the spatial extent of ERA5 is slightly broader, covering latitudes from 0.25° S to 65° N and longitudes from 60 to 160.25° E.
2.2 Geopotential-guided attention network
Geopotential (m2 s−2) is the gravitational potential energy of a unit mass. Geopotential can reflect the elevation, latitude, pressure, etc. The value of geopotential used in this paper is obtained from the ERA5 dataset. Using geopotential to guide the attention calculation for downscaling can gain geographic semantic information, which is lacking in common deep learning networks.
As shown in Fig. 2, geopotential-guided attention is realized by the Geopotential-guided Attention Block (GeoAB), which is the core unit of GeoAN. The window attention (WA), shifted window attention (SWA), and long rang attention (LRA) are constructed based on Song and Zhong (2022) and Song et al. (2022). The concepts of query, key, and value were used in transformer block (Vaswani et al., 2017) to excavate the effects of attention. Unlike the original design where the query is derived from input features, our approach generates it from geopotential. However, the key and value remain sourced from input features, which is consistent with the traditional method. For ease of understanding, normalization, residual operation, and other detailed parts are not listed in the formulas incidentally. The formulas are defined as follows, where Ft and Gt denote the deep features of meteorological variables and geopotential at the tth loop, respectively:
where ℱ(⋅) and 𝒜(⋅) denoted the forward and attention parts, respectively. It is important to note that none of the forward components share their parameters. Additionally, both the WA and the SWA were upgraded from Swin Transformer (Liu et al., 2021) to Swin Transformer V2 (Liu et al., 2022), comparing with Song and Zhong (2022). The network architecture is described in Fig. 1. Based on prior experience, GeoAB is executed 18 times to gather more geographic data, as shown in Eqs. (1) and (2) and Fig. 2, and the definition of the network architecture is described as follows:
where LR, G, and SR denote low-resolution, geopotential, and produced high-resolution variables, respectively. ℋ(⋅), 𝒯(⋅), and GeoAB denote the head block, tail block, and GeoAB block, respectively. The GeoAB block is repeated k times.
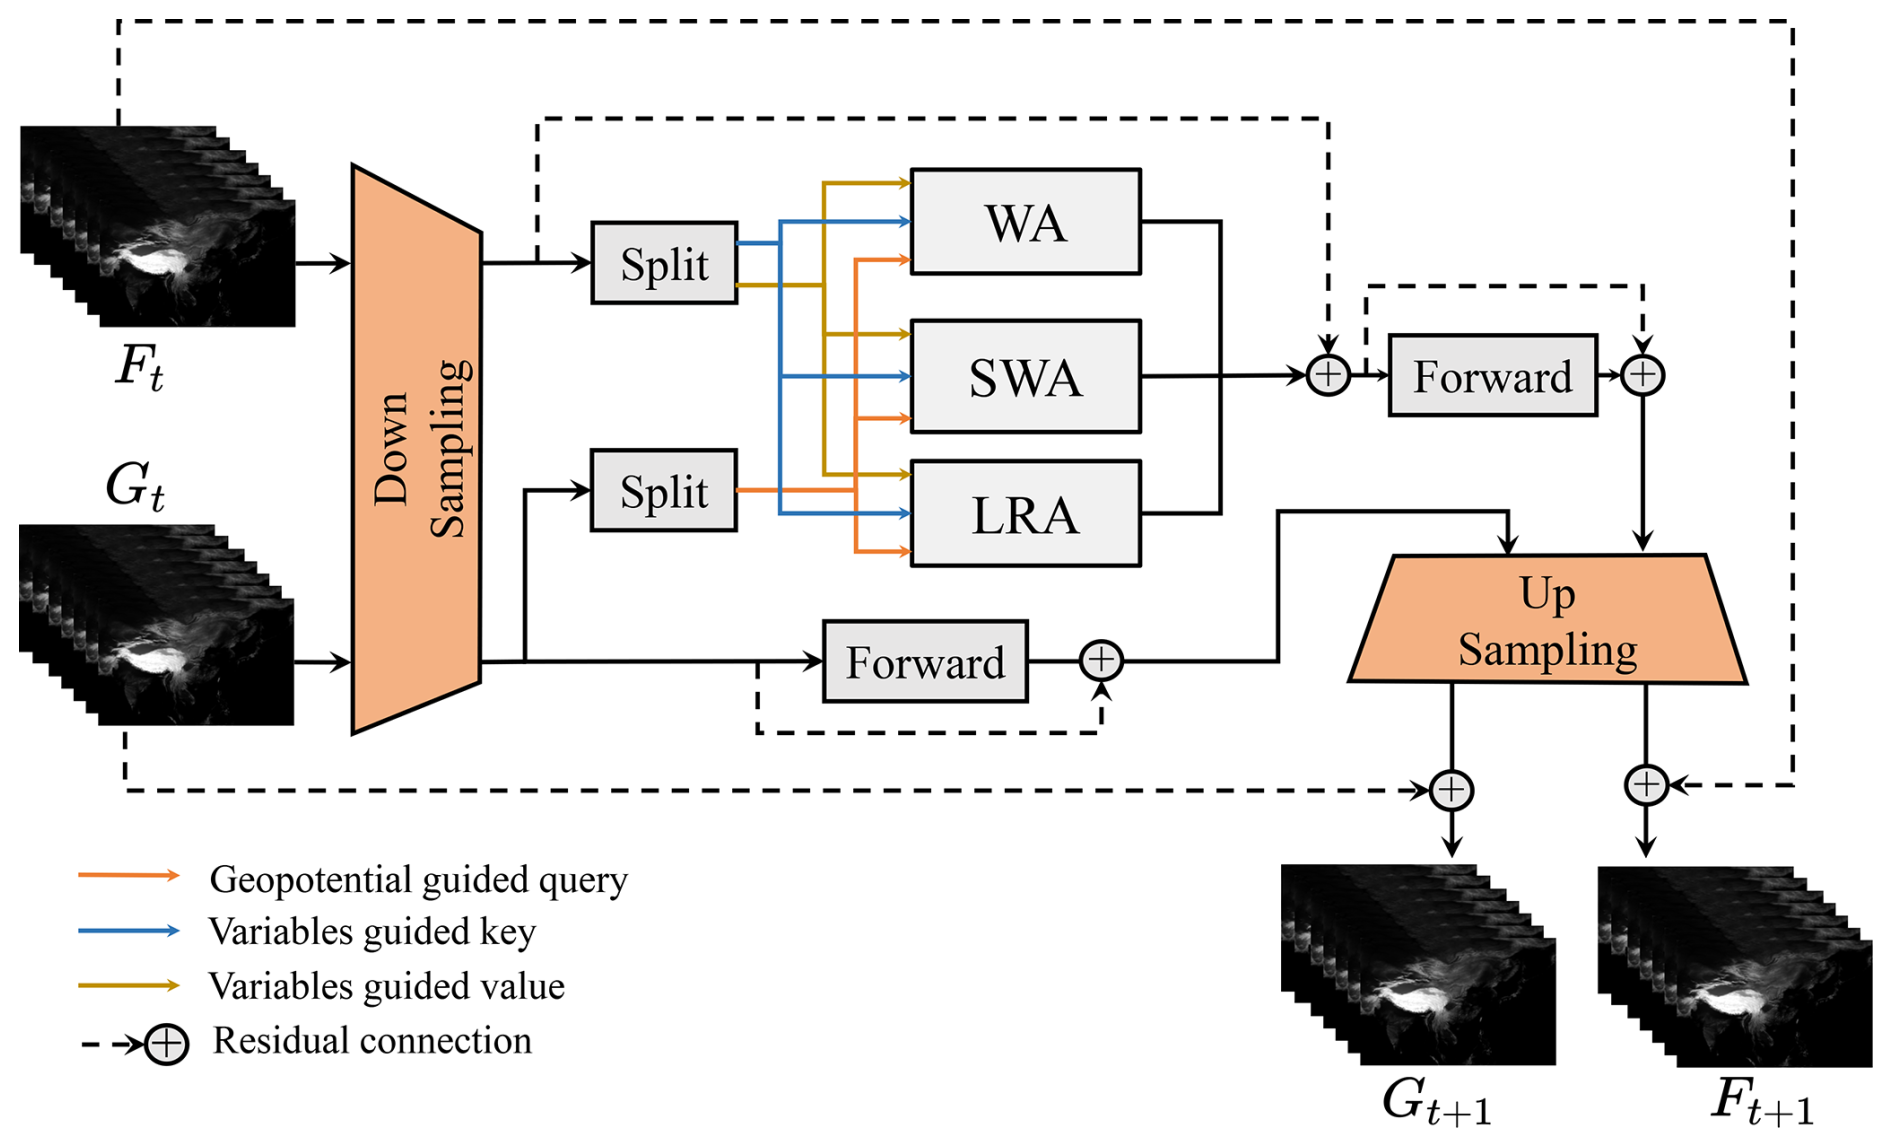
Figure 2Sketch of the GeoAB, which is repeated 18 times in GeoAN. GeoAB is the attention block for extracting deep information. The query information of GeoAN is harvested from the geopotential and the key and value are made from variable features. To make the loops, the outputs of the tth GeoAB, i.e., Ft+1 and Gt+1, are treated as the input of the (t+1)th GeoAB.
The batch size of the training step was five, which is an unbalanced GPU distribution for three NVIDIA RTX 6000 Ada Generation (48G) cards, considering the GPU memory limitation. There was 6 d of high-resolution data missing from 2020 to 2022. Therefore, the training set consisted of 1090 LR and SR pairs, which is derived from adding together 366, 365, and 365 and subtracting 6. The learning rate was set to 10−4 and reduced by half at epochs 20, 40, 60, 80, 90 and 95. The network was trained for 100 epochs starting with the pre-trained models. Considering differences among the lines of latitude, the latitude-weighted loss was chosen to be the loss function, and the distortion of geographical coordinates with changes in latitude is fully taken into account (Bi et al., 2023; Rasp et al., 2020). The loss function is defined as follows:
where H, W, and C are 1040, 1600, and 4, respectively (1040 and 1600 represent the pixel counts along latitude and longitude, and 4 represents WS10m, T2m, PRS, and TP). HR and SR is the value at position (i, j) of channel c in HR variables and SR variables. The ai is latitude weight, defined as
where θi is the latitude of the ith line in the map of the variables in the form of . For calculation purposes, the latitudes range is offset to 0–65° N (i.e., ) replacing 0.125° S–64.875° N.
3.1 Quantitative comparison
This section details experiments to evaluate the performance of GeoAN. For comparison, the classic algorithm bilinear interpolation, widely used in downscaling, is included. Additionally, two deep learning methods, U-net (Ronneberger et al., 2015) and SwinIR (Liang et al., 2021), were employed for comparative analysis. The source code for both networks was obtained from their perspective GitHub repositories. To ensure a fair comparison, the U-net architecture was modified for the downscaling task, resulting in a customized version referred to as U-net Evolution (U-net Evol.). The original U-net implementation is available at https://github.com/milesial/Pytorch-UNet (last access: 19 April 2024), while the SwinIR code can be accessed at https://github.com/JingyunLiang/SwinIR (last access: 19 April 2024). To maintain consistency, all deep learning models were configured with equivalent parameters or computational complexity, and they were trained for 100 epochs using identical hyperparameters under the same environmental conditions.
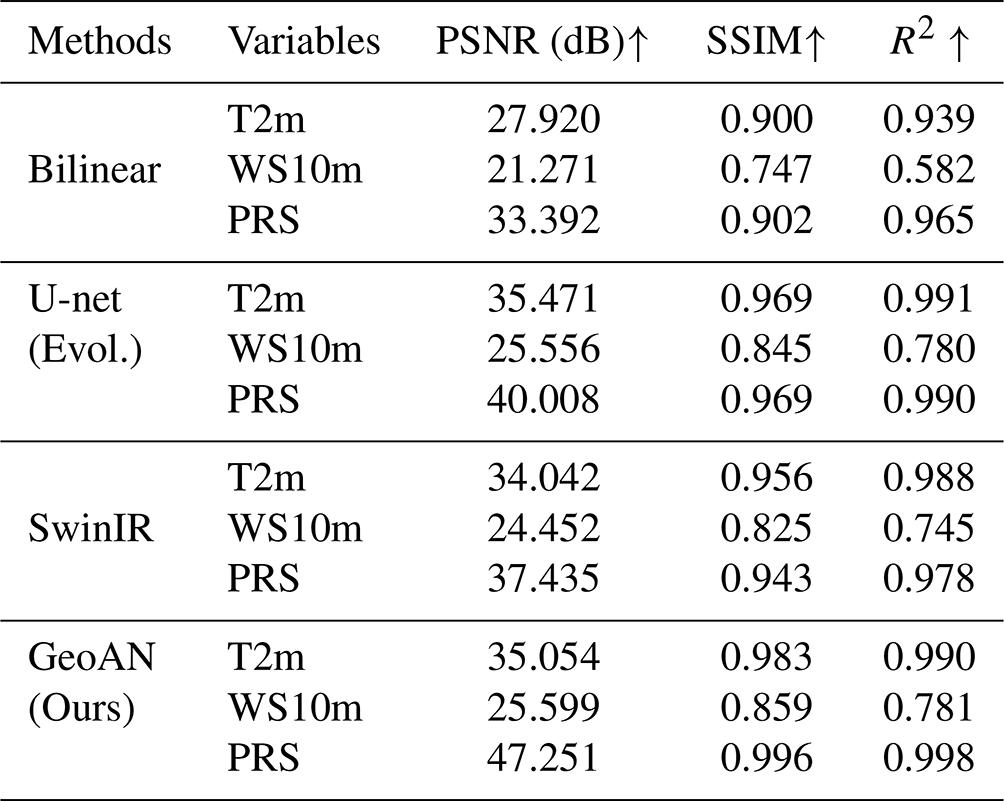
As shown in Table 1, PSNR (peak signal-to-noise ratio), SSIM (structural similarity index), and R2 (coefficient of determination) are considered to evaluate the performance of the methods. PSNR and SSIM are the most commonly used metrics for measuring super-resolution algorithms. Compared to RMSE (root mean squared error), R2, or other numerical metrics only calculating the individual value of each pixel, a more holistic and detailed assessment is considered in PSNR and SSIM. A PSNR greater than 25 dB is acceptable, and one greater than 30 dB is considered a good result. In most metrics, GeoAN produces better results than others; however, in the T2m comparison, U-net (Evol.) got a higher result, and further analyses about this part are discussed in the Appendix. It is important to note that SwinIR's results are worse than those of U-net (Evol.). This discrepancy can likely be attributed to the limited training process, which consisted of only 100 epochs in these experiments due to GPU constraints. This training process may be insufficient for attention-based models like SwinIR or GeoAN to reach their full potential. However, in this situation, GeoAN could outperform the other methods.
Table 1A comparison between our proposed GeoAN and other downscaling methods. Bigger values stand for better performance, and values in bold indicate the best performance in each metric. Considering the suitability of the downscaling task, PSNR, SSIM, and R2 are chosen. All results are produced by the same environment and super parameters.
3.2 Visual comparison
Although GeoAN achieved superior performance in most cases in Table 1, a qualitative assessment is also necessary for a direct evaluation. Visual results of PRS, T2m, and WS10m are shown in Figs. 3–5, respectively. We compare the first of each two months in 2023 (i.e., January, March, May, July, September, and November) and choose one day to display for each variable. As shown in the figures, GeoAN can achieve the best results among all the compared algorithms. For extracting details in particular, GeoAN displays excellent performance. Thanks to geopotential-based attention guidance and training with historical data, the neural network captures sufficient geographical semantics. Even distorted parts can be effectively reconstructed through GeoAN.
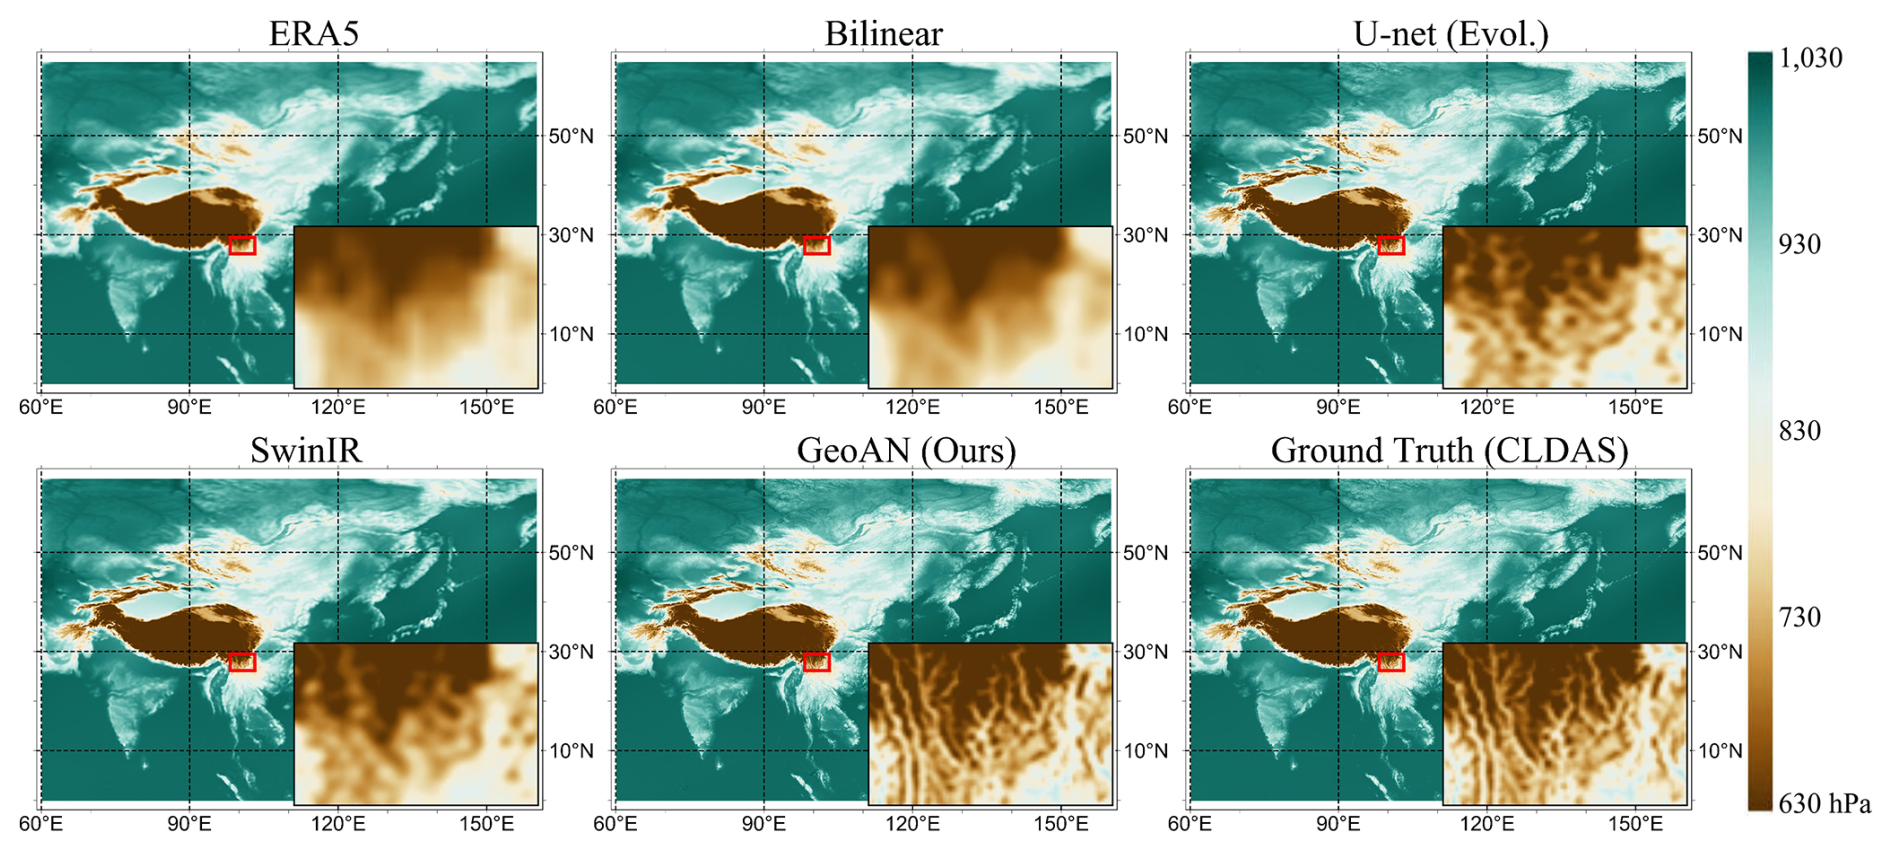
Figure 3Pressure visual results of GeoAN and other downscaling algorithms on 1 November 2023. Ground Truth denotes the target high-resolution data (i.e., CLDAS), and ERA5 is the original low-resolution data. GeoAN is the deep learning method we propose in this paper. The picture in the lower-right corner of each subgraph is the detailed picture of the target area (i.e., red rectangle), respectively.
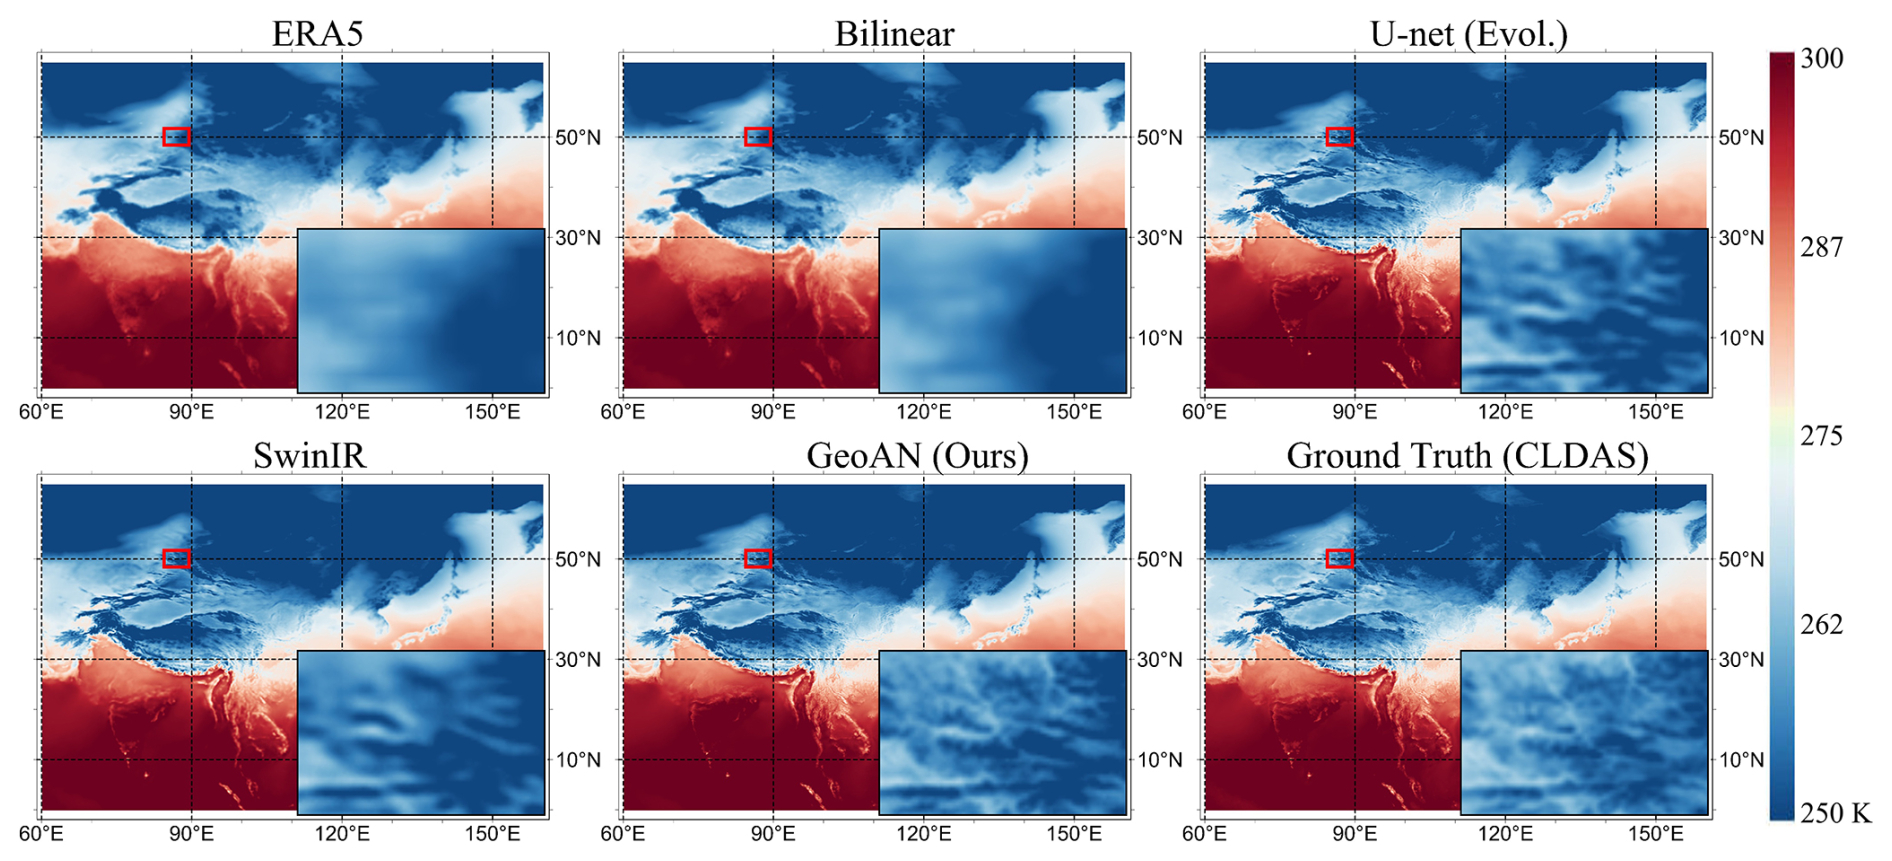
Figure 4Temperature visual results of GeoAN and other downscaling algorithms on 1 January 2023.
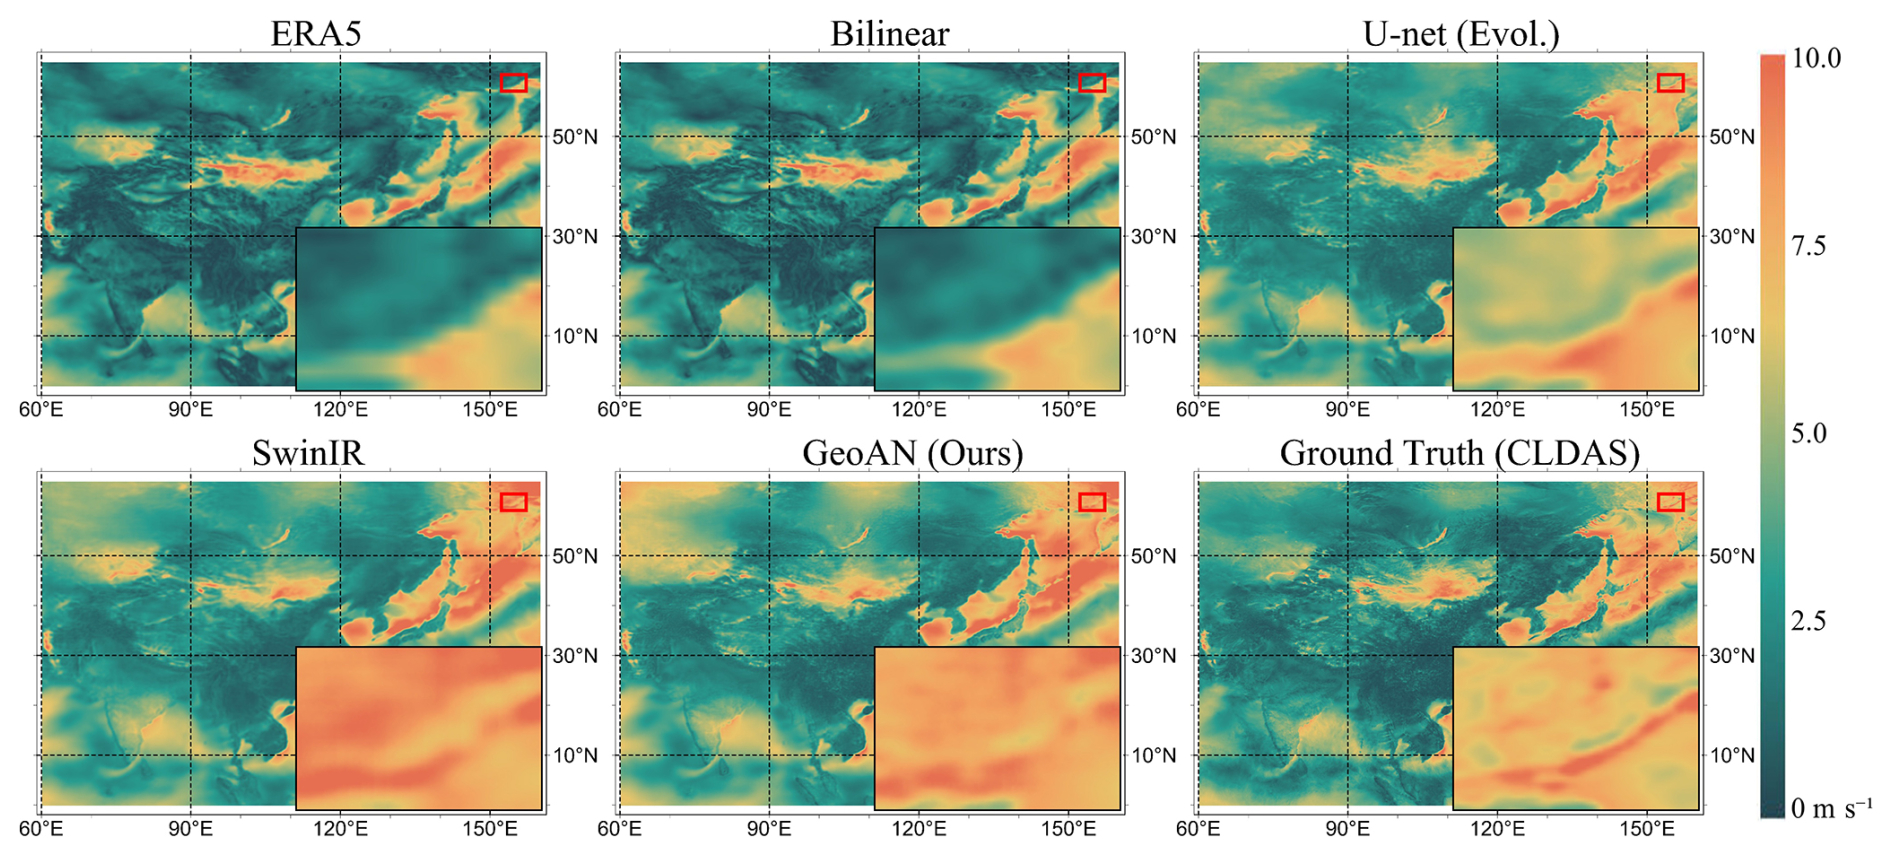
Figure 5Wind speed visual results of GeoAN and other downscaling algorithms on 1 November 2023.
4.1 Historical meteorological data
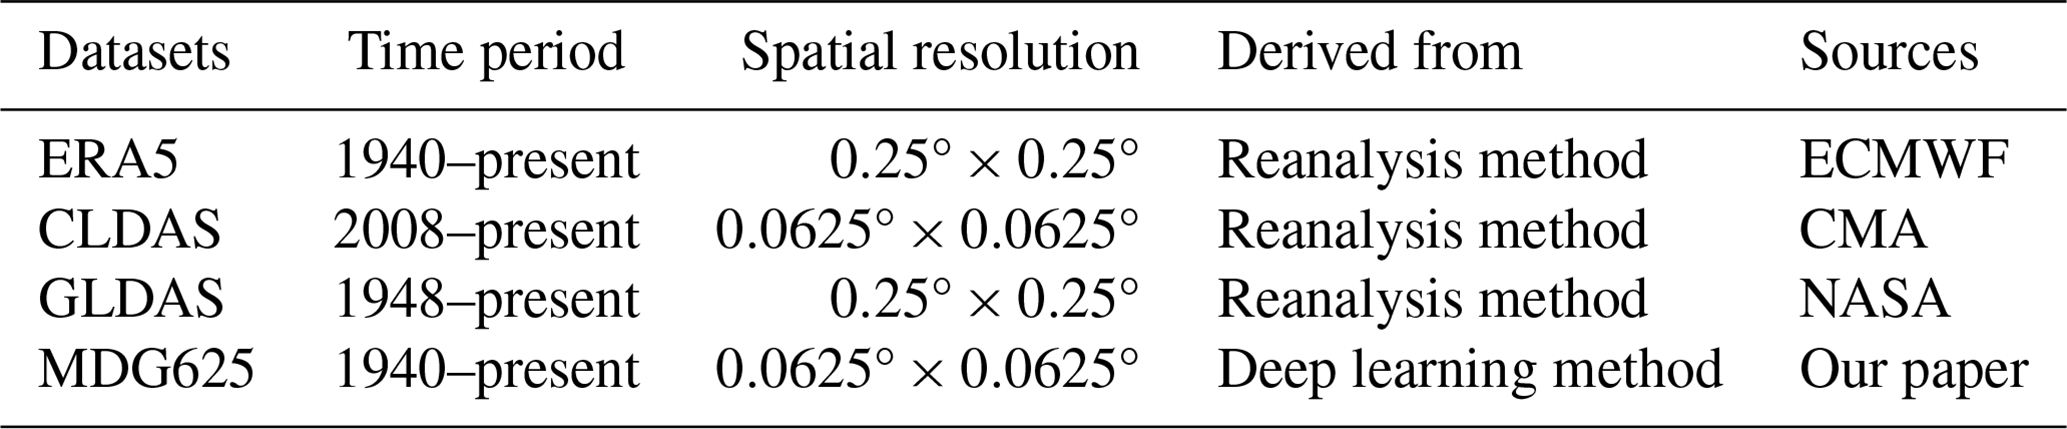
The CLDAS has been in operation from 2008 up to today. Its development depends on observational data, which were limited in China prior to the 2000s (Tie et al., 2022). As high-resolution historical meteorological data are difficult to obtain, we employed our developed model, GeoAN, which is guided by geopotential, to generate a dataset known as MDG625 (Meteorological Dataset with 0.0625° resolution created by GeoAN) for the study area beginning in 1940. MDG625 is valuable for historical meteorological studies in relevant areas. The comparison between similar datasets is in Table 2. The resolution of ERA5 and GLDAS (Global Land Data Assimilation System) is too low for various regional studies. The CLDAS dataset from CMA lacks sufficient temporal coverage for long-term studies. The key distinction between MDG625 and other models is its reliance on deep learning rather than traditional numerical methods.
Note that there are 2 d in ERA5 with anomalies: 29 November 1965 and 6 July 2008. The first day of MDG625 is 1 January 1940, and the index of this day is assigned an index value of 0. The index of each day represents the number of days elapsed since 1 January 1940. Additionally, a more extensive spatial dataset can be generated by GeoAN; however, considering the pattern used in training steps, only the data in the study area are provided in MDG625.
4.2 Error distribution
Considering the period of CLDAS and the fact that the data from 2020 to 2022 are used in the training stage, the results of the error distribution are calculated in 2023. The RMSE of the 2 m temperature, surface pressure, and 10 m wind speed is 1.40 K, 2.76 hPa, and 0.89 m s−1, respectively. To further evaluate the quality of MDG625 from a temporal and spatial perspective, the error distributions of the variables (PRS, T2m, and WS10m) are analyzed in Figs. 6 and 7. As illustrated in Fig. 6, the variables of T2m in winter do not meet expectations, while other variables demonstrate satisfactory performance. However, although in the worst month of T2m (i.e., January), the difference to the ground truth is approximately only 3 K, which is deemed acceptable. The average RMSE of T2m is around 1 K for the whole year. For PRS and WS10m, the performance is stable and good throughout the whole year. This could be due to seasonal fluctuations in temperature, which challenges a statistical model's ability to produce accurate results when no additional season or date information is provided. One thing to note is that there are 9 d missing in CLDAS by the time of the program run. The RMSE of the missing data is calculated by the mean of the nearest data that are not missing before and after the missing date.
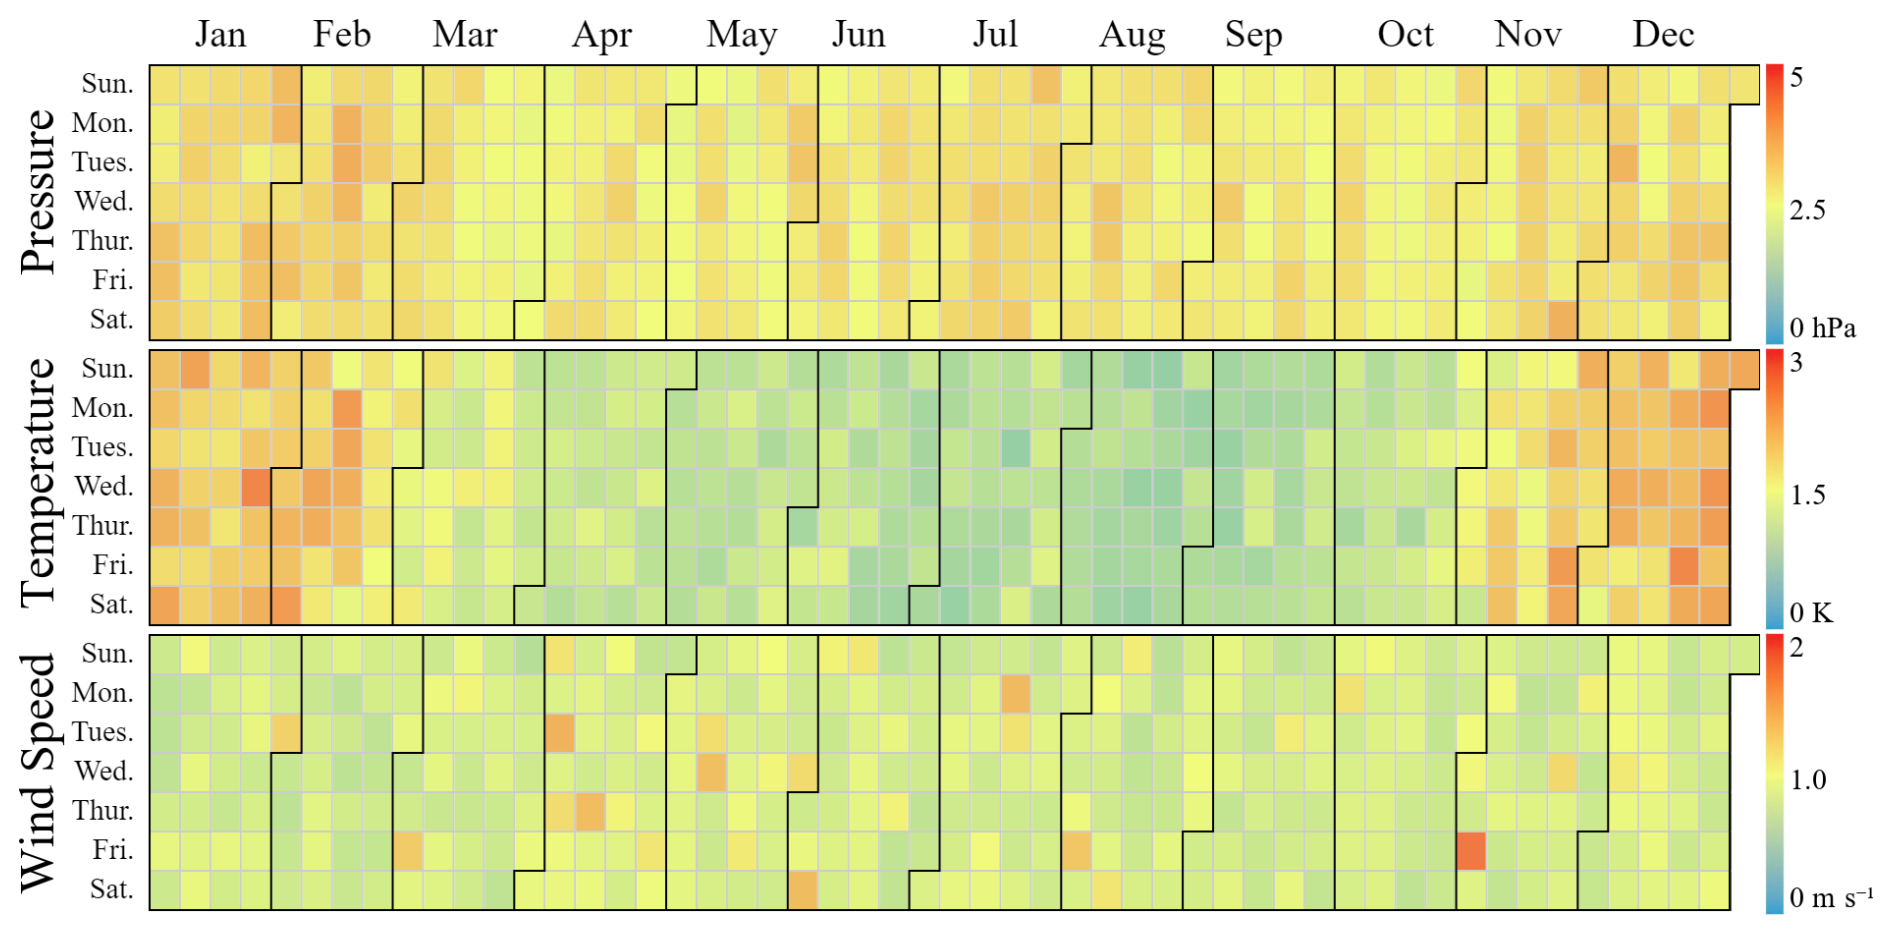
Figure 6The daily average RMSE of MDG625 in 2023. From top to bottom are pressure (hPa), temperature (K) at 2 m, and wind speed (m s−1) at 10 m, respectively. The RMSE on a single day is calculated from the daily pixels.
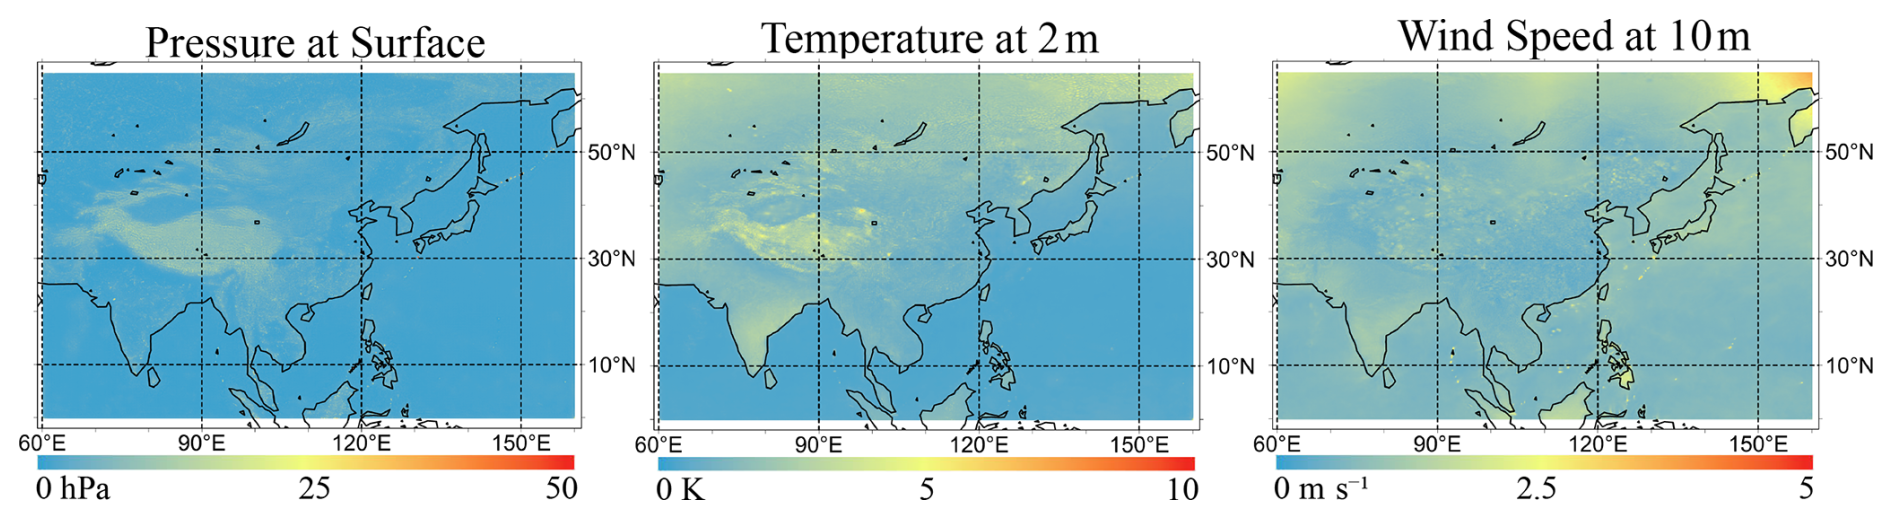
Figure 7The RMSE map of three meteorological variables (PRS, T2m, and WS10m) between MDG625 and the ground truth. The RMSE is calculated from the whole year daily in 2023. Blue represents a smaller error and red represents the bad results.
In terms of the spatial distribution, it is as shown in Fig. 7. PRS and T2m show better results in marine areas than in the mainland. In contrast, WS10m results on the mainland are better. For T2m, the results of the mainland are worse than the marine results, which may be caused by the specific heat capacity of water being higher than the land (e.g., soil and sand). Temperature variations over the oceans are lower in magnitude than over the continents, and the deep learning method is better at learning the patterns of small changes. Regardless of which variables are considered, the outcomes in coastal plain regions (e.g., such as parts of China's eastern seaboard) tend to be more favorable compared to other areas. Finally, despite some areas showing less-than-satisfactory outcomes, the error levels remain within an acceptable range, enabling the dataset to be effectively utilized for diverse analyses.
4.3 Limitations
Although the proposed GeoAN demonstrated satisfactory accuracy in spatial downscaling and the resulting MDG625 is valuable for a wide range of applications, this work still has several limitations. Firstly, as we were constrained by the computational resources and GPU memory limitations, we could not employ a larger model or experiment with a more extensive set of training samples. The generated MDG625 dataset (0.0625° daily meteorological dataset derived by GeoAN) currently covers most of Asia. Higher spatiotemporal resolutions (e.g., hourly) with broader geographical coverage could be explored using the proposed GeoAN framework in future research as the development of a global high-resolution historical meteorological dataset would be highly valuable. Additionally, precipitation poses a considerable challenge for statistical models, particularly in extreme cases (Zou et al., 2024; Sachindra et al., 2018; Xu et al., 2015). The MDG625 dataset includes three meteorological variables (PRS, T2m, and WS10m) but lacks precipitation data. This exclusion is mainly attributed to the low correlation of total precipitation (TP) between the ERA5 and CLDAS datasets, which causes the GeoAN model to face significant challenges in accurately reconstructing the spatial structure of precipitation. Addressing this limitation remains a critical area for future improvement. Inspired by the work of Zou et al. (2024), more interpretable and comprehensible algorithms could be integrated into the GeoAN framework in the future. Furthermore, comparative studies with other models could be conducted to further evaluate and benchmark the performance of our approach.
The ERA5 data of ECMWF can be found at https://doi.org/10.24381/cds.adbb2d47 (Hersbach et al., 2023). The high-resolution data, CLDAS, are provided by CMA at https://data.cma.cn (last access: 19 April 2024). An education and research account is required to acquire the CLDAS data, and this requirement is set by the CMA. The code and the generated dataset, MDG625 (Song et al., 2024), can be found on the GitHub repository (https://github.com/songzijiang/GeoAN and https://doi.org/10.5281/zenodo.15175242, Song, 2025) and the ScienceDB repository (https://doi.org/10.57760/sciencedb.17408, Song et al., 2024). Considering CLDAS is not public and GeoAN was trained using CLDAS, the data of MDG625 for 2017–2023 are not offered in the repository.
Given the scarcity of long-term, high-resolution historical meteorological data in Asia, the MDG625 dataset (a daily meteorological dataset with a resolution of 0.0625° containing three variables, 2 m temperature, surface pressure, and 10 m wind speed) provides a valuable solution. This dataset was produced using a deep geographic coupling attention network called the Geopotential-guided Attention Network (GeoAN), which operates within an acceptable error margin. The GeoAN can directly learn geopotential relationships which are closely related to meteorological variables. This downscaling strategy enhances the network’s ability to effectively capture geographic information, producing reliable results. Experimental results have demonstrated the superior performance of the GeoAN framework, and the generated MDG625 dataset is expected to significantly contribute to climate studies in Asia. Additionally, our study can potentially improve the accuracy of reanalysis products from the 1940s onward. In future work, we plan to integrate remote sensing data and gauged precipitation to explore the precipitation downscaling methods using alternative geographic principles and related variables. These findings highlight the potential of deep learning methods coupled with geographic mechanisms to address various geographic challenges.
Shown in Table 1, U-net (Evol.) outperforms GeoAN in T2m on PSNR and R2. To understand these results, we analyze the error distributions of temporal and spatial T2m in Figs. 6 and 7. During the summer season, the results of GeoAN have a similar performance to U-net (Evol.) in terms of PSNR and R2, as shown in Fig. A1. The higher the altitude, the higher the observed error in GeoAN (refer to Fig. 7). Furthermore, both high-altitude and winter conditions result in lower temperatures, leading us to conclude that GeoAN performs poorly in cold regions and during colder periods. To verify whether PSNR and R2 react to the real performance in cold environments, we carried out an annual comparison in 2023 at high-altitude areas, and the specific results are shown in Fig. A2. In comparison, the texture of GeoAN is clearer than U-net (Evol.), and the temperature values in each pixel of these two methods are close, with the difference being almost negligible. However, the improvement in sharpness GeoAN brings is discernible to the naked eye. As shown in Fig. 6, the largest RMSE between the ground truth and GeoAN in winter is around 3 K. The average RMSE of T2m is 1.40 K, and considering the RMSE between CLDAS and in situ stations is 1.8 K, the bias in GeoAN could totally be accepted.
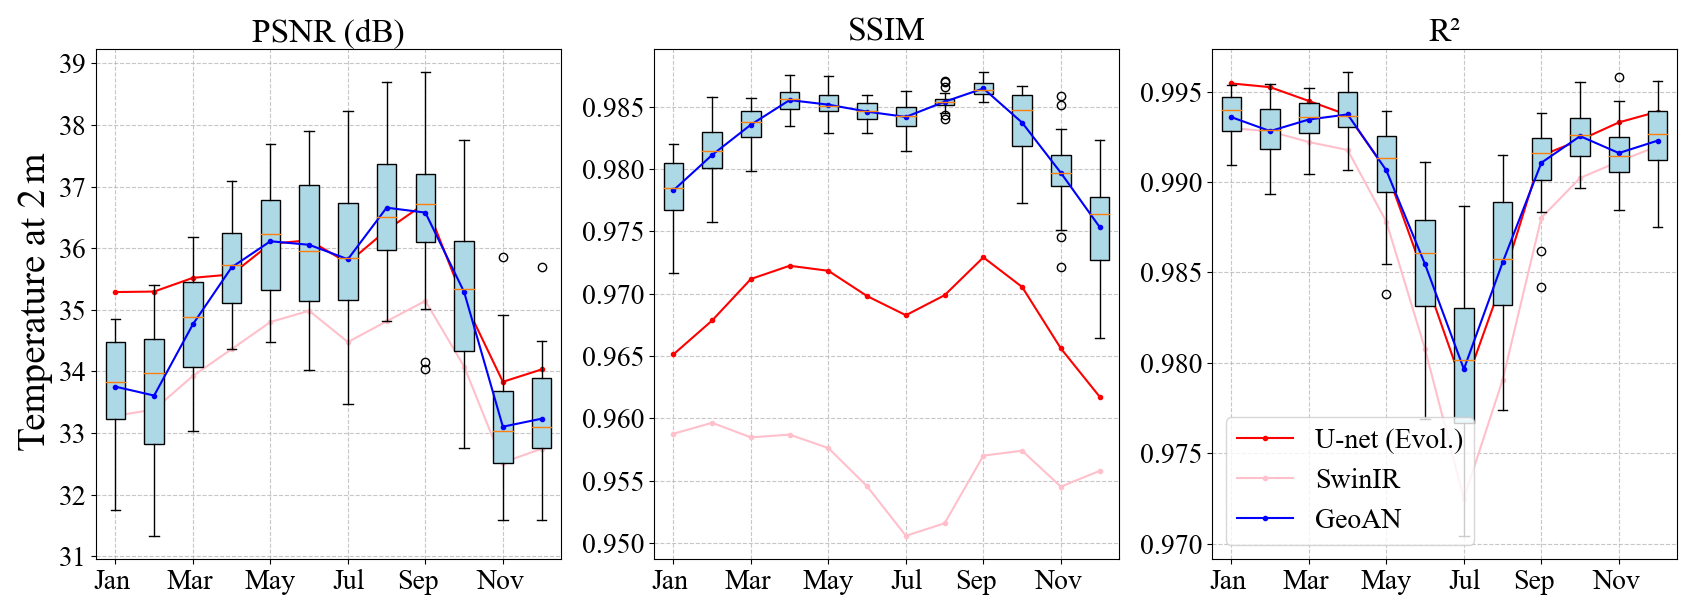
Figure A1The monthly average statistic of GeoAN in 2023 compared with other methods on temperature (K) at 2 m. The box plot is the distribution of GeoAN in each month.
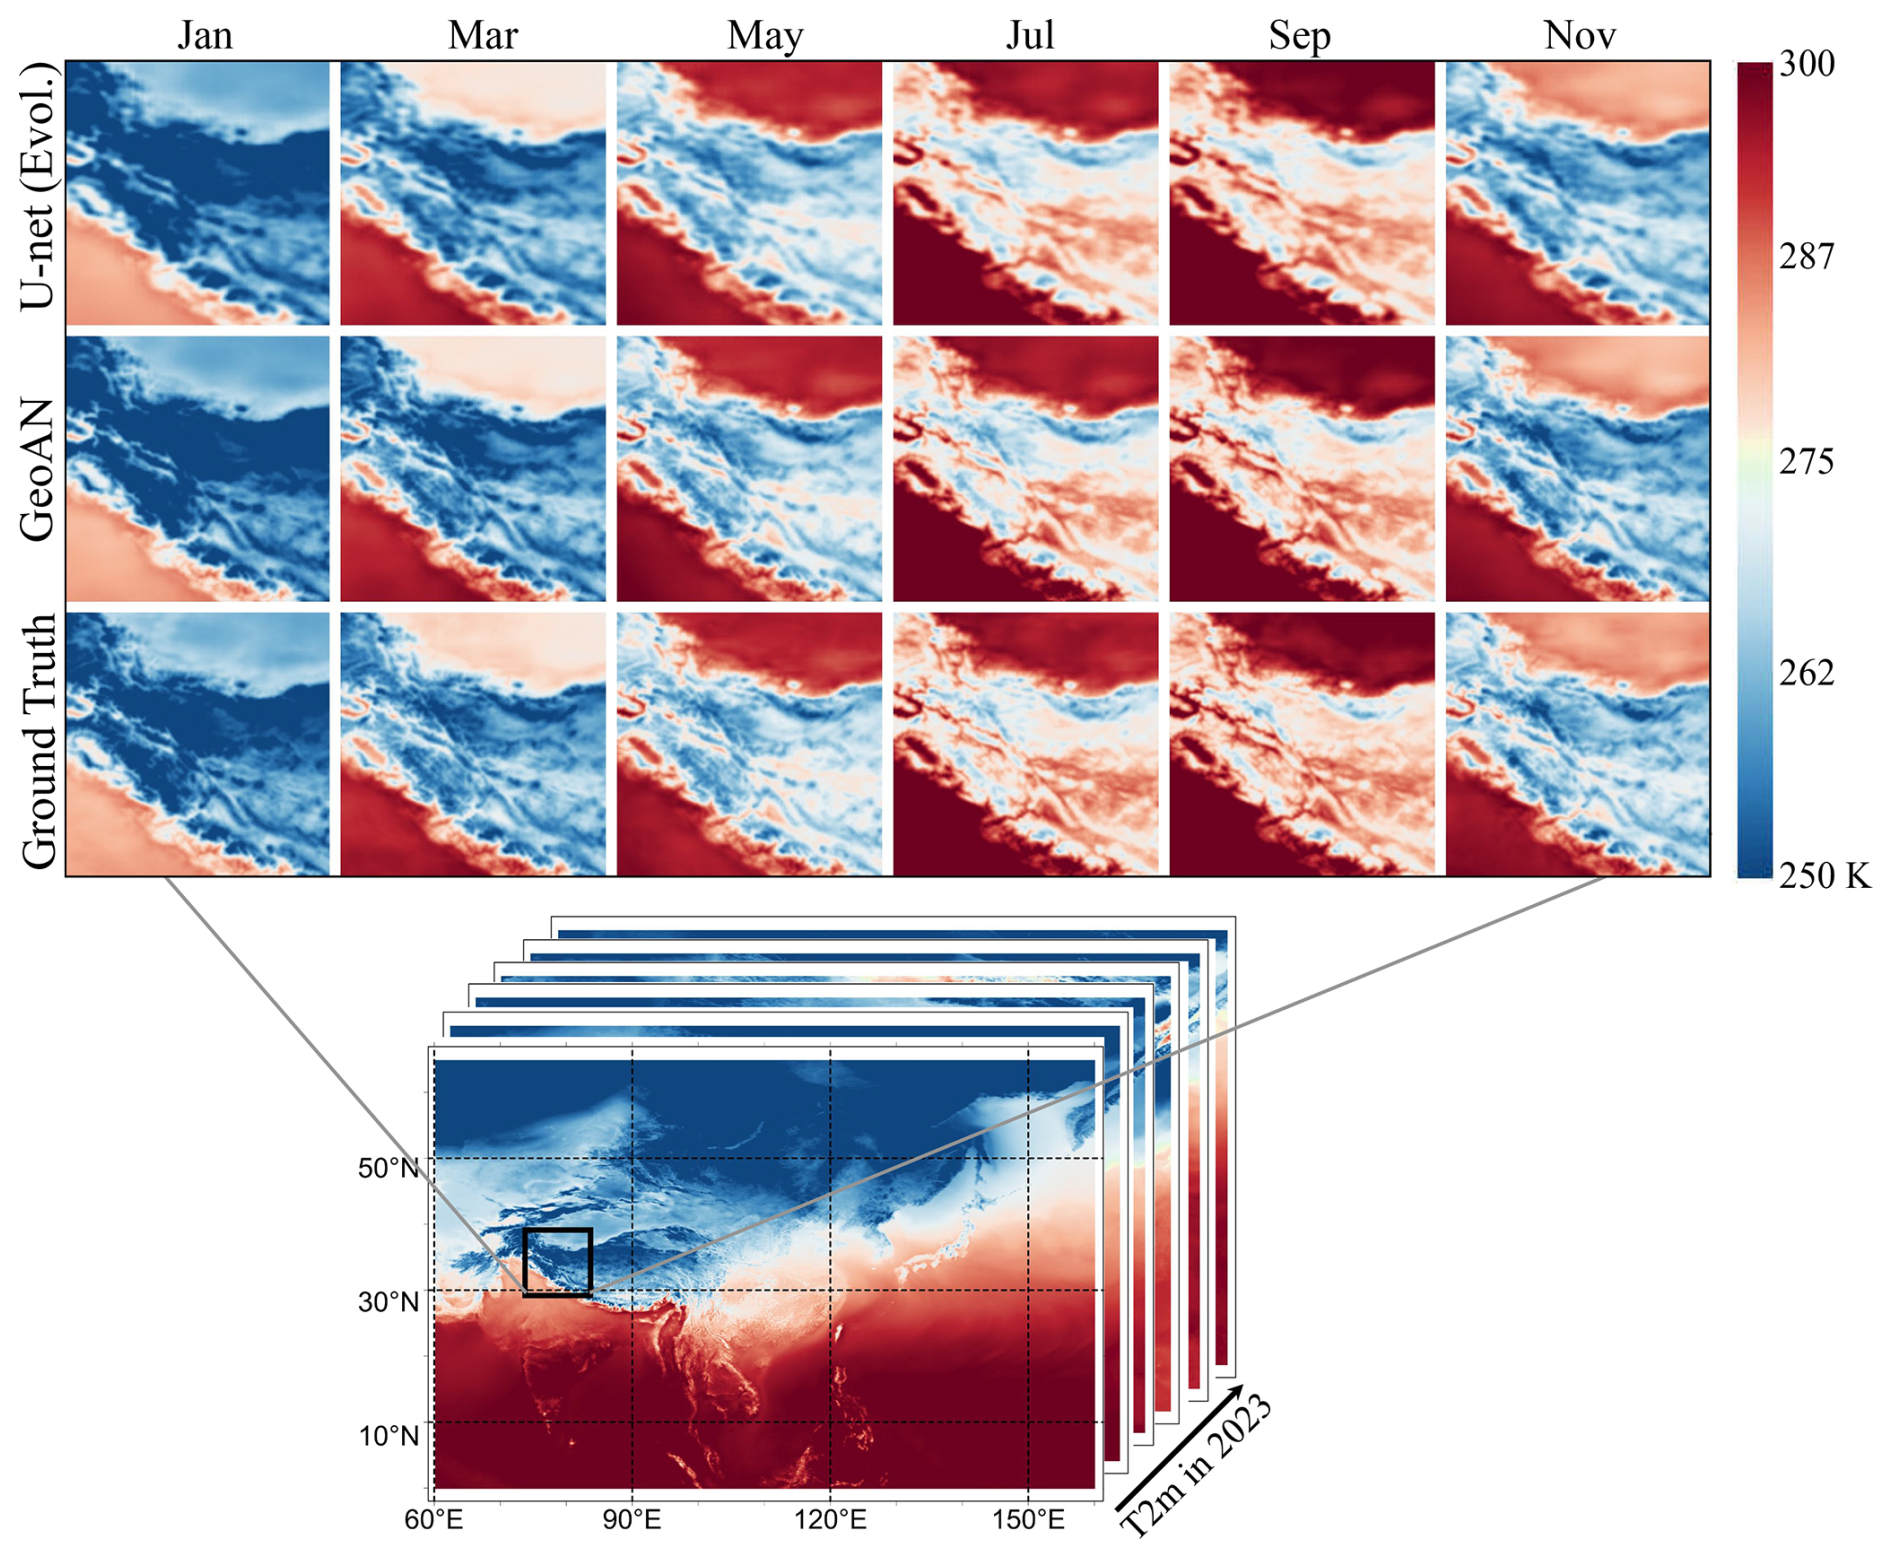
Figure A2Temperature at 2 m comparison between U-net (Evol.), GeoAN, and ground truth at high-altitude areas (Himalayas areas) in 2023. Only the results of the first day of odd-numbered months are shown for convenient observation.
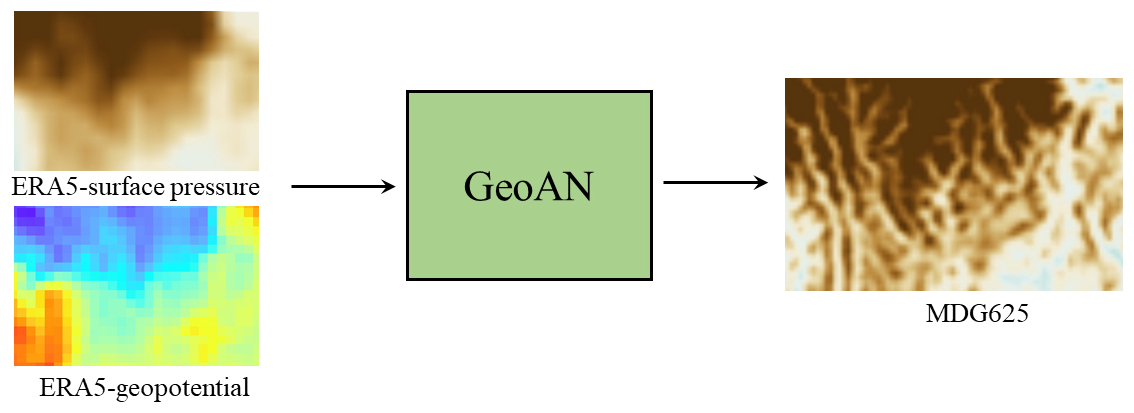
The PSNR of GeoAN on PRS achieves an impressive 47.251 dB on the testing dataset. The leading performance compared with other methods of PRS is larger than other variables, and we find the PRS of GeoAN in mountainous areas outperforms others. GeoAN can produce the details that are not included in the input data, as shown in Fig. 3. Considering the primal input data, ERA5 lack the details, as shown in Fig. B1, but it is reasonable to infer that deep learning methods can help learn detailed information from the distribution of the ground truth in the training stage. The smaller the range of change in the variables, the better the results are. During the training phase, adequate information about the spatial structure is furnished for GeoAN. Additionally, the low-resolution ERA5 input for each test case provides the value corresponding to each grid point. The ability of GeoAN to generate detailed features stems from these factors. Additionally, our statistics reveal that changes in pressure are significantly smaller compared to other variables, which likely explains why pressure metrics outperform others. The annual variation range in temperature surpasses that of pressure; therefore, the PSNR value for T2m is inferior compared to PRS. Consequently, the poor performance of WS10m can be explained by its erratic fluctuations, as the training dataset lacks adequate information for models to accurately reconstruct its detailed characteristics.
SZJ and YLN designed the research. SZJ and CZX performed the experiments and wrote the code. SZJ wrote the manuscript. LYY, YSS, and ZXW conducted data analysis. LM and YLN provided the resources. LM and YLN supervised and reviewed the manuscript.
The contact author has declared that none of the authors has any competing interests.
The MDG625 are produced by GeoAN, which is trained by ERA5 and CLDAS. To download and use the algorithms and datasets associated with this paper, please follow the relevant restrictions and requirements. The license of GeoAN is Apache-2.0 and of MDG625 is CC-BY 4.0.
Publisher’s note: Copernicus Publications remains neutral with regard to jurisdictional claims made in the text, published maps, institutional affiliations, or any other geographical representation in this paper. While Copernicus Publications makes every effort to include appropriate place names, the final responsibility lies with the authors.
We thank the China Meteorological Administration and European Centre for Medium-Range Weather Forecasts for the provided datasets. We thank all reviewers, editors, and others who helped with this paper.
This research has been supported by the National Natural Science Foundation of China (grant nos. W2412140, 42230505, and 42206148) and the International Research Center of Big Data for Sustainable Development Goals (grant no. CBAS2022GSP07).
This paper was edited by Graciela Raga and reviewed by two anonymous referees.
Atkinson, P. M.: Downscaling in remote sensing, Int. J. Appl. Earth Obs. Geoinf., 22, 106–114, https://doi.org/10.1016/j.jag.2012.04.012, 2013. a
Berrang-Ford, L., Ford, J. D., and Paterson, J.: Are we adapting to climate change?, Global Environ. Change, 21, https://doi.org/10.1016/j.gloenvcha.2010.09.012, 25–33, 2011. a
Bevilacqua, M., Roumy, A., Guillemot, C., and Alberi-Morel, M. L.: Low-complexity single-image super-resolution based on nonnegative neighbor embedding, in: The British Machine Vision Conference, 3–7 September 2012, Surrey, UK, 1–10, https://doi.org/10.5244/C.26.135, 2012. a
Bi, K., Xie, L., Zhang, H., Chen, X., Gu, X., and Tian, Q.: Accurate medium-range global weather forecasting with 3D neural networks, Nature, 619, 533–538, https://doi.org/10.1038/s41586-023-06185-3, 2023. a
Bonanno, R., Lacavalla, M., and Sperati, S.: A new high-resolution meteorological reanalysis Italian dataset: MERIDA, Q. J. Roy. Meteorol. Soc., 145, 1756–1779, https://doi.org/10.1002/qj.3530, 2019. a
Cucchi, M., Weedon, G. P., Amici, A., Bellouin, N., Lange, S., Müller Schmied, H., Hersbach, H., and Buontempo, C.: WFDE5: bias-adjusted ERA5 reanalysis data for impact studies, Earth Syst. Sci. Data, 12, 2097–2120, https://doi.org/10.5194/essd-12-2097-2020, 2020. a
Dietz, T., Shwom, R. L., and Whitley, C. T.: Climate change and society, Annu. Rev. Sociol., 46, 135–158, https://doi.org/10.1146/annurev-soc-121919-054614, 2020. a
Di Luca, A., de Elía, R., and Laprise, R.: Challenges in the quest for added value of regional climate dynamical downscaling, Curr. Clim. Change Rep., 1, 10–21, https://doi.org/10.1007/s40641-015-0003-9, 2015. a
Giorgi, F. and Gutowski Jr, W. J.: Regional dynamical downscaling and the CORDEX initiative, Annua. Rev. Environ. Resour., 40, 467–490, https://doi.org/10.1146/annurev-environ-102014-021217, 2015. a
He, J., Yang, K., Tang, W., Lu, H., Qin, J., Chen, Y., and Li, X.: The first high-resolution meteorological forcing dataset for land process studies over China, Sci. Data, 7, 25, https://doi.org/10.1038/s41597-020-0369-y, 2020. a
Hersbach, H., Bell, B., Berrisford, P., Hirahara, S., Horányi, A., Muñoz-Sabater, J., Nicolas, J., Peubey, C., Radu, R., Schepers, D., Simmons, A., Soci, C., Abdalla, S., Abellan, X., Balsamo, G., Bechtold, P., Biavati, G., Bidlot, J., Bonavita, M., Chiara, G., Dahlgren, P., Dee, D., Diamantakis, M., Dragani, R., Flemming, J., Forbes R., Fuentes, M., Geer, A., Haimberger, L., Healy, S., Hogan, R. J., Hólm, E., Janisková, M., Keeley, S., Laloyaux, P., Lopez P., Lupu C., Radnoti G., Rosnay, P., Rozum, I., Vamborg, F., Villaume, S., and Thépaut, J.-N.: The ERA5 global reanalysis, Q. J. Roy. Meteorol. Soc., 146, 1999–2049, https://doi.org/10.1002/qj.3803, 2020. a
Hersbach, H., Bell, B., Berrisford, P., Biavati, G., Horányi, A., Muñoz Sabater, J., Nicolas, J., Peubey, C., Radu, R., Rozum, I., Schepers, D., Simmons, A., Soci, C., and Dee, D.: ERA5 hourly data on single levels from 1940 to present, Copernicus Climate Change Service (C3S) Climate Data Store (CDS) [data set], https://doi.org/10.24381/cds.adbb2d47, 2023. a
Hu, Y., Tang, R., Jiang, X., Li, Z.-L., Jiang, Y., Liu, M., Gao, C., and Zhou, X.: A physical method for downscaling land surface temperatures using surface energy balance theory, Remote Sens. Environ., 286, 113421, https://doi.org/10.1016/j.rse.2022.113421, 2023. a
Huang, J.-B., Singh, A., and Ahuja, N.: Single image super-resolution from transformed self-exemplars, in: Proceedings of the IEEE Conference on Computer Vision and Pattern Recognition, 7–12 June 2015, Boston, MA, USA, 5197–5206, https://doi.org/10.1109/CVPR.2015.7299156, 2015. a
Jiang, Q., Li, W., Fan, Z., He, X., Sun, W., Chen, S., Wen, J., Gao, J., and Wang, J.: Evaluation of the ERA5 reanalysis precipitation dataset over Chinese Mainland, J. Hydrol., 595, 125660, https://doi.org/10.1016/j.jhydrol.2020.125660, 2021. a
Karl, T. R. and Trenberth, K. E.: Modern global climate change, Science, 302, 1719–1723, https://doi.org/10.1126/science.1090228, 2003. a
Liang, J., Cao, J., Sun, G., Zhang, K., Van Gool, L., and Timofte, R.: Swinir: Image restoration using swin transformer, in: Proceedings of the IEEE/CVF International Conference on Computer Vision, 11–17 October 2021, Montreal, BC, Canada, 1833–1844, https://doi.org/10.1109/ICCVW54120.2021.00210, 2021. a, b, c
Liu, G., Zhang, R., Hang, R., Ge, L., Shi, C., and Liu, Q.: Statistical downscaling of temperature distributions in southwest China by using terrain-guided attention network, IEEE J. Select. Top. Appl. Earth Obs. Remote Sens., 16, 1678–1690, https://doi.org/10.1109/JSTARS.2023.3239109, 2023. a
Liu, Z., Lin, Y., Cao, Y., Hu, H., Wei, Y., Zhang, Z., Lin, S., and Guo, B.: Swin transformer: Hierarchical vision transformer using shifted windows, in: Proceedings of the IEEE/CVF International Conference on Computer Vision, 10–17 October 2021, Montreal, QC, Canada, 10012–10022, https://doi.org/10.1109/ICCV48922.2021.00986, 2021. a
Liu, Z., Hu, H., Lin, Y., Yao, Z., Xie, Z., Wei, Y., Ning, J., Cao, Y., Zhang, Z., Dong, L., Wei, F., and Guo, B.: Swin transformer v2: Scaling up capacity and resolution, in: Proceedings of the IEEE Conference on Computer Vision and Pattern Recognition, 18–24 June 2022, New Orleans, LA, USA, 12009–12019, https://doi.org/10.1109/CVPR52688.2022.01170, 2022. a
Martin, D., Fowlkes, C., Tal, D., and Malik, J.: A database of human segmented natural images and its application to evaluating segmentation algorithms and measuring ecological statistics, in: vol. 2, IEEE Proceedings of the IEEE/CVF International Conference on Computer Vision, 7–14 July 2001, Vancouver, BC, Canada, 416–423, https://doi.org/10.1109/ICCV.2001.937655, 2001. a
Matsui, Y., Ito, K., Aramaki, Y., Fujimoto, A., Ogawa, T., Yamasaki, T., and Aizawa, K.: Sketch-based manga retrieval using manga109 dataset, Multimed. Tools Appl., 76, 21811–21838, https://doi.org/10.1007/s11042-016-4020-z, 2017. a
Muñoz-Sabater, J., Dutra, E., Agustí-Panareda, A., Albergel, C., Arduini, G., Balsamo, G., Boussetta, S., Choulga, M., Harrigan, S., Hersbach, H., Martens, B., Miralles, D. G., Piles, M., Rodríguez-Fernández, N. J., Zsoter, E., Buontempo, C., and Thépaut, J.-N.: ERA5-Land: a state-of-the-art global reanalysis dataset for land applications, Earth Syst. Sci. Data, 13, 4349–4383, https://doi.org/10.5194/essd-13-4349-2021, 2021. a
Murphy, J.: An evaluation of statistical and dynamical techniques for downscaling local climate, J. Climate, 12, 2256–2284, https://doi.org/10.1175/1520-0442(1999)012<2256:AEOSAD>2.0.CO;2, 1999. a
Olauson, J.: ERA5: The new champion of wind power modelling?, Renew. Energy, 126, 322–331, https://doi.org/10.1016/j.renene.2018.03.056, 2018. a
Rasp, S., Dueben, P. D., Scher, S., Weyn, J. A., Mouatadid, S., and Thuerey, N.: WeatherBench: a benchmark data set for data-driven weather forecasting, J. Adv. Model. Earth Syst., 12, e2020MS002203, https://doi.org/10.1029/2020MS002203, 2020. a
Ronneberger, O., Fischer, P., and Brox, T.: U-net: Convolutional networks for biomedical image segmentation, in: Medical Image Computing and Computer-Assisted Intervention, Springer, 234–241, https://doi.org/10.1007/978-3-319-24574-4_28, 2015. a
Sachindra, D., Ahmed, K., Rashid, M. M., Shahid, S., and Perera, B.: Statistical downscaling of precipitation using machine learning techniques, Atmos. Res., 212, 240–258, https://doi.org/10.1016/j.atmosres.2018.05.022, 2018. a
Shen, Z., Shi, C., Shen, R., Tie, R., and Ge, L.: Spatial Downscaling of Near-Surface Air Temperature Based on Deep Learning Cross-Attention Mechanism, Remote Sens., 15, 5084, https://doi.org/10.3390/rs15215084, 2023. a, b
Shi, C., Xie, Z., Qian, H., Liang, M., and Yang, X.: China land soil moisture EnKF data assimilation based on satellite remote sensing data, Sci. China Earth Sci., 54, 1430–1440, https://doi.org/10.1007/s11430-010-4160-3, 2011. a
Song, Z.: songzijiang/GeoAN: Initial version, Zenodo [code], https://doi.org/10.5281/zenodo.15175242, 2025. a
Song, Z. and Zhong, B.: A Lightweight Local-Global Attention Network for Single Image Super-Resolution, in: Proceedings of the Asian Conference on Computer Vision, 4–8 December 2022, Macao, China, 4395–4410, https://doi.org/10.1007/978-3-031-26351-4_37, 2022. a, b, c, d
Song, Z., Zhong, B., Ji, J., and Ma, K.-K.: A direction-decoupled non-local attention network for single image super-resolution, IEEE Sig. Process. Lett., 29, 2218–2222, https://doi.org/10.1109/LSP.2022.3217440, 2022. a
Song, Z., Cheng, Z., Li, Y., Yu, S., Zhang, X., Yuan, L., and Liu, M.: MDG625: Meteorological Dataset with 0.0625° resolution produced by GeoAN, Science Data Bank [data set], https://doi.org/10.57760/sciencedb.17408, 2024. a, b, c
Sun, S., Shi, C., Pan, Y., Bai, L., Xu, B., Zhang, T., Han, S., and Jiang, L.: Applicability assessment of the 1998–2018 CLDAS multi-source precipitation fusion dataset over China, J. Meteorol. Res., 34, 879–892, https://doi.org/10.1007/s13351-020-9101-2, 2020. a
Sun, Y., Deng, K., Ren, K., Liu, J., Deng, C., and Jin, Y.: Deep learning in statistical downscaling for deriving high spatial resolution gridded meteorological data: A systematic review, ISPRS J. Photogram. Remote Sens., 208, 14–38, https://doi.org/10.1016/j.isprsjprs.2023.12.011, 2024. a
Taylor, R. G., Scanlon, B., Döll, P., Rodell, M., Van Beek, R., Wada, Y., Longuevergne, L., Leblanc, M., Famiglietti, J. S., Edmunds, M., Konikow, L., Green, T. R., Chen, J., Taniguchi, M., Bierkens, M. F. P., MacDonald, A., Fan, Y., Maxwell, R. M., Yechieli, Y., Gurdak, J. J., Allen, D. M., Shamsudduha, M., Hiscock, K., Yeh, P. J.-F., Holman, I., and Treidel, H.: Ground water and climate change, Nat. Clim. Change, 3, 322–329, https://doi.org/10.1038/nclimate1744, 2013. a
Tefera, G. W., Ray, R. L., and Wootten, A. M.: Evaluation of statistical downscaling techniques and projection of climate extremes in central Texas, USA, Weather Clim. Ext., 43, 100637, https://doi.org/10.1016/j.wace.2023.100637, 2024. a
Teutschbein, C. and Seibert, J.: Bias correction of regional climate model simulations for hydrological climate-change impact studies: Review and evaluation of different methods, J. Hhydrol., 456, 12–29, https://doi.org/10.1016/j.jhydrol.2012.05.052, 2012. a
Tie, R., Shi, C., Wan, G., Hu, X., Kang, L., and Ge, L.: CLDASSD: Reconstructing fine textures of the temperature field using super-resolution technology, Adv. Atmos. Sci., 39, 117–130, https://doi.org/10.1007/s00376-021-0438-y, 2022. a
Vaswani, A., Shazeer, N., Parmar, N., Uszkoreit, J., Jones, L., Gomez, A. N., Kaiser, Ł., and Polosukhin, I.: Attention is all you need, in: Vol. 30, Advances in Neural Information Processing Systems, ISBN 978-1-5108-6096-4, https://proceedings.neurips.cc/paper_files/paper/2017/file/3f5ee243547dee91fbd053c1c4a845aa-Paper.pdf (last access: 9 April 2025), 2017. a, b
Vogel, E., Johnson, F., Marshall, L., Bende-Michl, U., Wilson, L., Peter, J. R., Wasko, C., Srikanthan, S., Sharples, W., Dowdy, A., Hope, P., Khan, Z., Mehrotra, R., Sharma, A., Matic, V., Oke, A., Turner, M., Thomas, S., Donnelly, C., and Duong, C. V.: An evaluation framework for downscaling and bias correction in climate change impact studies, J. Hydrol., 622, 129693, https://doi.org/10.1016/j.jhydrol.2023.129693, 2023. a
Wang, F., Tian, D., Lowe, L., Kalin, L., and Lehrter, J.: Deep learning for daily precipitation and temperature downscaling, Water Resour. Res., 57, e2020WR029308, https://doi.org/10.1029/2020WR029308, 2021. a
Werner, A., Schnorbus, M., Shrestha, R., Cannon, A., Zwiers, F., Dayon, G., and Anslow, F.: A long-term, temporally consistent, gridded daily meteorological dataset for northwestern North America, Sci. Data, 6, 1–16, https://doi.org/10.1038/sdata.2018.299, 2019. a
Xu, S., Wu, C., Wang, L., Gonsamo, A., Shen, Y., and Niu, Z.: A new satellite-based monthly precipitation downscaling algorithm with non-stationary relationship between precipitation and land surface characteristics, Remote Sens. Environ., 162, 119–140, https://doi.org/10.1016/j.rse.2015.02.024, 2015. a
Zhang, X., Zeng, H., Guo, S., and Zhang, L.: Efficient Long-Range Attention Network for Image Super-resolution, in: European Conference on Computer Vision, 23–27 October 2022, Tel Aviv, Israel, https://doi.org/10.1007/978-3-031-19790-1_39, 2022. a
Zhong, X., Du, F., Chen, L., Wang, Z., and Li, H.: Investigating transformer-based models for spatial downscaling and correcting biases of near-surface temperature and wind-speed forecasts, Q. J. Roy. Meteorol. Soc., 150, 275–289, https://doi.org/10.1002/qj.4596, 2023. a, b
Zou, W., Hu, G., Wiersma, P., Yin, S., Xiao, Y., Mariethoz, G., and Peleg, N.: Multiple-point geostatistics-based spatial downscaling of heavy rainfall fields, J. Hydrol., 632, 130899, https://doi.org/10.1016/j.jhydrol.2024.130899, 2024. a, b
- Abstract
- Introduction
- Data and methods
- Performance
- Produced dataset
- Code and data availability
- Conclusions and discussions
- Appendix A: T2m comparison against U-net (Evol.)
- Appendix B: Discussion on how GeoAN restore the missing details
- Author contributions
- Competing interests
- Disclaimer
- Acknowledgements
- Financial support
- Review statement
- References