the Creative Commons Attribution 4.0 License.
the Creative Commons Attribution 4.0 License.
Lena River biogeochemistry captured by a 4.5-year high-frequency sampling program
Anne Morgenstern
Jens Hölemann
Antje Eulenburg
Birgit Heim
Frederieke Miesner
Hendrik Grotheer
Gesine Mollenhauer
Hanno Meyer
Ephraim Erkens
Felica Yara Gehde
Sofia Antonova
Sergey Chalov
Maria Tereshina
Oxana Erina
Evgeniya Fingert
Ekaterina Abramova
Tina Sanders
Liudmila Lebedeva
Nikolai Torgovkin
Georgii Maksimov
Vasily Povazhnyi
Rafael Gonçalves-Araujo
Urban Wünsch
Antonina Chetverova
Sophie Opfergelt
Pier Paul Overduin
The Siberian Arctic is warming rapidly, causing permafrost to thaw and altering the biogeochemistry of aquatic environments, with cascading effects on the coastal and shelf ecosystems of the Arctic Ocean. The Lena River, one of the largest Arctic rivers, drains a catchment dominated by permafrost. Baseline discharge biogeochemistry data are necessary to understand present and future changes in land-to-ocean fluxes. Here, we present a high-frequency 4.5-year-long dataset from a sampling program of the Lena River's biogeochemistry, spanning April 2018 to August 2022. The dataset comprises 587 sampling events and measurements of various parameters, including water temperature, electrical conductivity, stable oxygen and hydrogen isotopes, dissolved organic carbon concentration and 14C, colored and fluorescent dissolved organic matter, dissolved inorganic and total nutrients, and dissolved elemental and ion concentrations. Sampling consistency and continuity and data quality were ensured through simple sampling protocols, real-time communication, and collaboration with local and international partners. The data are available as a collection of datasets separated by parameter groups and periods at https://doi.org/10.1594/PANGAEA.913197 (Juhls et al., 2020b). To our knowledge, this dataset provides an unprecedented temporal resolution of an Arctic river's biogeochemistry. This makes it a unique baseline on which future environmental changes, including changes in river hydrology, at temporal scales from precipitation event to seasonal to interannual can be detected.
- Article
(11549 KB) - Full-text XML
- BibTeX
- EndNote
River-borne organic material and nutrients influence biogeochemical processes in Arctic estuaries; coastal waters; shelf seas; and, on a larger scale, the entire Arctic Ocean. The Arctic is warming nearly 4 times faster than the rest of the world (Rantanen et al., 2022), changing ecosystems, the intensity of geomorphic processes and aquatic biogeochemistry within river catchments. These changes are reflected in the flux of matter borne by rivers to the sea. For example, as air temperatures rise, permafrost thaws (Biskaborn et al., 2019), mobilizing and releasing organic matter and nutrients into the aquatic system (Mann et al., 2022; Vonk et al., 2019), changing hydrological pathways (Rawlins and Karmalkar, 2024) and the nature of the organic material transported (Starr et al., 2024). There is no paleo-historical analogue for these changes; therefore, establishing a baseline of current fluxes and understanding how the system is changing are necessary to anticipate the scope and consequence of future impacts of climate warming and permafrost thaw. The Lena River is the second-largest Arctic river by total annual discharge, and its catchment is one of the most rapidly changing in the Arctic (Tananaev and Lotsari, 2022). The consequences of rapid warming are evident in the Lena River's hydrology. Total annual discharge is increasing (Shiklomanov et al., 2020; Tananaev et al., 2016), and the hydrological regime is shifting towards an earlier freshet and later freeze-up (Gelfan et al., 2017; Yang et al., 2002). The seasonal variability in water sources supplying the Lena River is also changing as a result. For example, winter under-ice flow has been increasing for almost the entire past century (Liu et al., 2022). Such changes inevitably affect the river's biogeochemistry (Juhls et al., 2020a). The timings of river ice melt and freeze-up are undergoing significant alterations (Shiklomanov and Lammers, 2014), shifting water–atmosphere heat and mass transfer as the ice-free season lengthens. These changes are reflections of synoptic shifts in climate, which also affect the catchment and the ecosystem function of the river. Shifts in the Lena River biogeochemistry will lead to further changes in the region's climate dynamics and to currently unknown impacts on coastal ecosystems. The Lena River plays a crucial role in the global carbon cycle, transporting large amounts of organic matter from the terrestrial environment to the Arctic Ocean (e.g., Raymond et al., 2007; Semiletov et al., 2011). The Lena River also transports nutrients to shallow shelf and coastal regions, where they are important for the primary production of associated ecosystems (Terhaar et al., 2021). Riverine dissolved inorganic carbon (DIC) and dissolved organic carbon (DOC) fluxes drive outgassing of greenhouse gases in the river plume (Bertin et al., 2023), providing one example of a feedback mechanism between changing riverine fluxes and the climate system. Rivers act not only as conveyor belts but also transform the material they transport and represent important habitats. Food and transportation security are two of the important ecosystem services the Lena River provides to northern communities. To understand the changes underway; their impacts on the river system; and, in turn, their impacts on the global climate, a baseline of observations that includes biogeochemistry is required. It is a prerequisite for deriving improved insights into linkages between land and ocean and between river system and climate that will allow for better constraint of the future impacts of continued warming. The majority of studies that investigate recent Arctic fluvial biogeochemistry trends (Holmes et al., 2012; Raymond et al., 2007; Tank et al., 2023; Wild et al., 2019) are based on the series of pan-Arctic river sampling programs: PARTNERS (2003–2007), Student Partners (2004–2009), and ArcticGRO (since 2009). They systematically cover the six largest Arctic rivers with respect to their discharge, including the Lena River. These programs have produced data over more than 2 decades, providing approximately seven samples per year from each river to cover seasonal changes. Other studies investigate Lena River biogeochemistry, with datasets from distinct field campaigns at specific locations or along transects (Cauwet and Sidorov, 1996; Hölemann et al., 2005), and its transport of sediment (Fedorova et al., 2015; Ogneva et al., 2023; Rachold et al., 1996), carbon (Juhls et al., 2020a; Kutscher et al., 2017; Winterfeld et al., 2015), and nutrients (Lara et al., 1998; Sanders et al., 2022). Most of these studies focus on a select set of parameters for specific research questions and include only the summer or the open-water period. Especially the shoulder seasons, with the freshet in spring and the freeze-up in fall, are mostly unstudied. Poor temporal resolution and coverage of sampling has had to be bridged with models that relate discharge with biogeochemical concentrations (e.g., Holmes et al., 2012; Raymond et al., 2007; Tank et al., 2023). The necessity to use these relationships, which are often weak, can be obviated through higher-frequency sampling. Juhls et al. (2020a) compare the effect of calculating annual fluxes using datasets of varying sampling frequency. Higher sampling frequency can improve annual flux estimates, as does dedicated sampling over the whole hydrological cycle. Arctic rivers are typically characterized by a nival hydrological regime; thus, the strong seasonality and high variability in the summer water balance may mandate high-frequency data collection, especially during the highly dynamic shoulder seasons (freshet and freeze-up). Even more importantly, the assumption of correlations between biogeochemical parameters and river discharge may mask emerging catchment or river processes that are not tied to discharge. A relevant example of this is shifts in hydrologic pathways due to climate change and permafrost thaw (Prokushkin et al., 2019), which may affect organic matter (OM) quality but not discharge (Frey and Smith, 2005). In addition, higher-frequency or even continuous in situ measurements (e.g., Castro-Morales et al., 2022) will create new opportunities to validate remotely sensed data (El Kassar et al., 2023) or model results (e.g., Rawlins and Karmalkar, 2024) and to potentially upscale data spatially. The biogeochemistry of a river is impacted by the environmental processes of its entire upstream catchment and may therefore reflect changes across a range of scales (Holmes et al., 2012). In order to record future changes in the Lena River biogeochemistry that are related to climate warming, it is crucial to compare new data with a baseline. Understanding the impact of climate shifts requires a high-quality, high-frequency dataset to assess current conditions and predict future trends. In this study, we present biogeochemical data collected from water sampled in the central Lena River delta over more than 4 years, along with detailed descriptions of the sampling, processing, and analytical methods for each parameter.
The Lena River stretches from the Baikal Mountains to the Laptev Sea, where it forms the largest Arctic Delta. The Lena River has a total length of about 4294 km and an average annual discharge of 689.1 km3 yr−1 (Mann et al., 2022). More than 90 % of its catchment (2.61 × 10⁶ km2) is underlain by continuous or discontinuous permafrost (Obu et al., 2019). The two major tributaries to the Lena are the Vilyuy River, from the west, and the Aldan River, from the east (Fig. 1a).
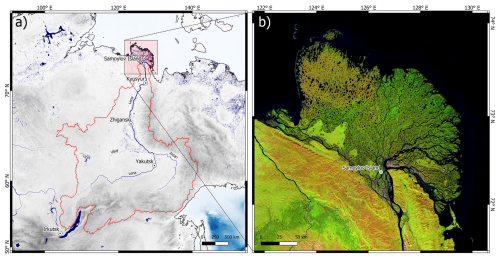
Figure 1(a) Overview of the Lena River watershed, delineated by the red line. Gray colors show the topography, while blue colors show rivers, lakes, and seas. (b) Satellite image (Landsat-5, 7, and 8 imagery courtesy of the US Geological Survey, multiyear mosaic, edited in Google Earth Engine) of the Lena River delta with the sampling location on Samoylov Island.
The Lena River catchment is one of the coldest regions on Earth, with average air temperatures below −30 °C from December to February in most years. Mean air temperatures are only above 0 °C for 5 months of the year (May to September). The catchment climate is characterized by a dry winter, and most of the annual precipitation occurs during the summer months (Fig. 2). During the period covered by the sampling program in this study, the mean monthly air temperature was mostly above the long-term average (1950–2022). The precipitation for these years was mostly higher than the long-term average (1950–2022) during the winter months but very variable during the summer months, including record-low (in August 2020 and October 2022) and record-high (in March 2020 and August 2022) monthly precipitation.
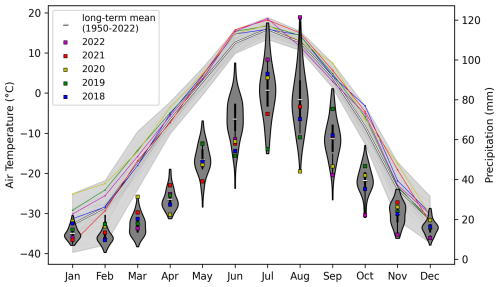
Figure 2ERA5-Land monthly mean air temperature and total precipitation for the Lena River catchment. Lines show the air temperatures, with the light-gray area indicating the minimum–maximum range of all years from 1950 to 2022. Precipitation is shown by violins, with the width of the violin indicating the occurrence frequency within the years from 1950 to 2022. The years 2018 to 2022 are highlighted using color-coded lines (temperature) and squares in the violins (precipitation). Data source: ERA5. Credit: Copernicus Climate Change Service/ECMWF.
The Lena River is characterized by a nival hydrological regime with a strong discharge peak during the snowmelt and river ice breakup between the end of May and the beginning of June, a variable discharge in summer, and low base flow discharge in winter (Figs. 3, 4a). Daily discharge is monitored by the Russian Federal Service for Hydrometeorology and Environmental Monitoring (Roshydromet). All 4 years covered by the sampling program described in this study showed higher-than-average winter discharge but ranged from record-low to record-high summer discharge. While 2018 was the year with the fourth-highest annual discharge on record (1936 to 2022), 2019 was one of the driest years (ninth on record).
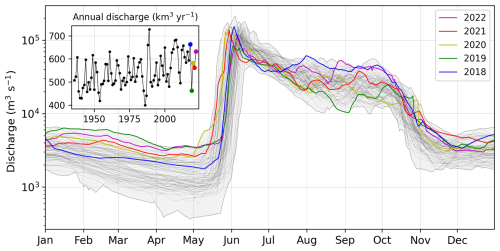
Figure 3Discharge of the Lena River for all years from 1937 to 2022 (thin black lines) measured at Kyusyur. The years 2018 to 2022 are highlighted using different colors. The gray area shows the absolute minimum and maximum for each day from 1937 to 2022. The inset figure (top left) shows the annual discharge fluxes.
The dataset is derived from a high-frequency sampling program at the Research Station Samoylov Island in the central Lena River delta (Fig. 1b), which has been a permanently staffed research station since 2013. The sampling program relied on the support of non-scientific station staff and was, thus, designed to be as robust and time efficient as possible under all seasonal conditions. The exact location of sampling was the Olenekskaya Channel, southwest of Samoylov Island. The sampling location is also directly connected and close to the main channel of Lena River (∼ 7 km upstream). Only surface samples were taken, and most samples were taken from the center of the channel from a boat (in summer) or through an ice hole (in winter). No stratification can be observed in the Lena River (Fig. A1), suggesting homogeneously distributed dissolved water chemistry across the water column. During ice breakup and ice freeze-up, samples were taken from the shore for safety reasons during unstable river ice conditions. The sampling started on 20 April 2018 and lasted until 16 August 2022. Throughout the first year of sampling (18 April 2018 to 6 April 2019), a sample was taken every 4 d. Between 10 May and 14 June each following year, a sample was taken every day; between 15 June and 31 October, a sample was taken every 2 d; and between 1 November and 9 May, a sample was taken once a week. For each sampling event, 1 L of surface water was taken in a Nalgene plastic bottle prerinsed with river water, and the temperature was measured directly in the river using a handheld conductivity meter. The water sample was then immediately subsampled, filtered, and conserved in the laboratory of the research station. Additionally, the time of sampling, exact location (center of channel or shore), and weather and river conditions were noted. Except for the in situ temperature measurement, all biogeochemical analyses were done after storage and transport to laboratories in Russia, Germany, and Denmark. As a result, some samples were stored for up to 6 months before analysis. After initial processing, samples were stored in refrigerators (+4 °C) and freezers (−18 °C) at the Research Station Samoylov Island until transport via Tiksi to Yakutsk, from where they were shipped to the individual labs. Dates separating sample sets (with distinct transport and analysis dates) are indicated by the dashed lines in the individual figures for each parameter. The dataset contains data from 587 sampling dates. This sampling program focuses on biogeochemical parameters, which allow for a simple processing protocol; thus, sampling and processing can be carried out by a non-scientist after initial training. It includes biogeochemical parameters mostly in the dissolved phase and excludes parameters measured on particles; this is due to the fact that, in contrast to dissolved concentrations, particulate concentrations in the river channel at Samoylov Island might not be representative of the main Lena River due to their strong heterogeneity (Chalov and Prokopeva, 2021). During the first days of the spring freshet, which are accompanied by ice jams and pooling of snow and ice meltwater, representative sampling of Lena River water is challenging, if not impossible. Consequently, the samples during these periods can show biogeochemical signatures of dilution and need to be interpreted with caution. In addition to the data sampled at Samoylov Island, we present data from the ArcticGRO program (The Arctic Great Rivers Observatory, 2024) for all parameters that were measured by both programs (temperature; DOC; colored dissolved organic matter – CDOM; total dissolved nitrogen – TDN; silicon; ammonium; nitrate; barium; calcium; potassium; magnesium; sodium; strontium; sulfate; chloride; and fluoride). The periods of ice cover on the Lena River were visually estimated using daily MODIS imagery (https://worldview.earthdata.nasa.gov/, last access: 12 July 2024) and are shown by the white (ice-covered) and gray (ice-free) backgrounds in the individual figures for each parameter. Table 1 provides an overview of the sample processing and analysis methodology for each biogeochemical parameter and each set of samples.
Table 1Overview of sample processing and analysis for each group of parameters for each set of samples.

3.1 River water temperature and electrical conductivity
For all sampling events (no. 001 to no. 612), the temperature of the river water was measured during sampling directly in the river at about 20 cm water depth using a handheld WTW Cond 340I conductivity meter (accuracy ±0.5 %). The electrical conductivity (EC) of sample nos. 079 to 487 (6 April 2019 to 23 August 2021) was measured on frozen samples that were thawed (24 h at room temperature) after transport to the hydrochemistry laboratory at the AWI in Potsdam, Germany, using a WTW Multilab 540 conductivity meter (accuracy ±0.5 %). The EC of the first year (sample nos. 001 to 078; 20 April 2018 to 6 April 2019) was measured on unfrozen samples. Before each series of EC measurements, the conductivity meter was calibrated (cell constant was set for a 25 °C reference temperature) using a standard solution with 1413 µS cm−1. Between samples, the conductivity meter was cleaned with Milli-Q water and wiped dry. The EC for the last year (sample nos. 488 to 611; 6 August 2021 to 14 August 2022) was measured on filtered samples (0.45 µm cellulose acetate) at the Lomonosov Moscow State University (MSU) in Moscow using a Milwaukee EC59 PRO conductivity meter (accuracy ±2 %). The river water temperature ranged between −0.3 and 20.2 °C (Fig. 4b). During the ice-covered period, the river water temperature was very stable between −0.3 and 0.2 °C. After ice breakup, the river water temperature increased from ∼ 0 to above 15 °C within about 2 weeks. Between August and September, the river water temperature started to drop until it reached 0 °C in mid-October.
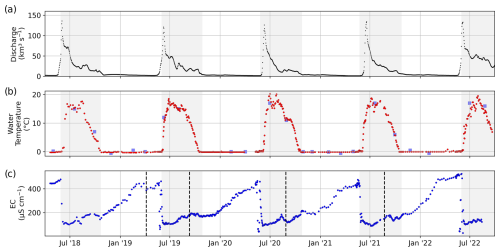
Figure 4Time series of (a) discharge measured at Kyusyur and (b) river water temperature and (c) EC. Gray areas indicate the ice-free periods. Dashed black lines separate sample sets and indicate a change in the measurement protocol and method (see Table 1). For comparison, we added temperature data sampled by the ArcticGRO program (blue squares in panel b).
The EC ranged between 29 and 526 µS cm−1 (Fig. 4c). The highest EC values were observed at the end of the winter, right before ice breakup and the freshet of the river. In 2018, 2019, 2020, and 2022, the peak of the spring flood coincided with the lowest annual EC. Only in 2021 was the EC lower in the first days of July compared with right after ice breakup at the beginning of June. In late winter in 2022, the EC was higher compared with previous years, whereas the lowest EC value during the freshet was similar to previous years. The EC was measured in five series (separated by dashed black lines in Fig. 4c). The data show no offsets between those series. Note that a small number of samples exhibiting exceptionally low EC levels before the spring freshet could potentially be influenced by the pooling of meltwater from snow and ice during ice-jamming events. For sample nos. 202 to 287 (13 September 2019 to 2 May 2020), we compared the EC from two sets of samples that were (1) frozen right after sampling, filtered only after transport, and thawed before analysis and (2) filtered right after sampling and transported unfrozen (cooled at +4 °C) (Fig. B1).
3.2 Stable isotopes of water
Water samples for stable isotopes were filled immediately after sampling (untreated) into 10 mL high-density polyethylene (HDPE) vials, sealed tightly, and stored in the dark at 4 °C. After transport, measurements for sample nos. 001 to 487 (20 April 2018 to 23 August 2021) were conducted in five sample series (see Table 1) at the ISOLAB stable isotope facility at Alfred Wegener Institute (AWI) in Potsdam using a Finnigan MAT Delta-S mass spectrometer equipped with equilibration units for the online determination of the hydrogen and oxygen isotopic composition. The measurement accuracy for hydrogen and oxygen isotopes was better than ±0.8 % and ±0.1 %, respectively (Meyer et al., 2000). Analysis of sample nos. 488 to 605 (26 August 2021 to 2 August 2022) was conducted at the Melnikov Permafrost Institute (MPI) in Yakutsk using a PICARRO L2140-i isotopic water liquid analyzer for the online determination of the hydrogen and oxygen isotopic composition in water samples using a cavity ring-down spectrometer (CRDS). The PICARRO L2130-i CRDS uses a laser with an effective path length of up to 20 km to quantify spectral features of gas-phase molecules by repeatedly scanning the absorption lines of HO, HO, and HD16O in a temperature- and pressure-controlled optical cavity. The PICARRO L2140-i isotopic water liquid analyzer simultaneously measures isotopic ratios of and in liquid water, providing both δ18O and δD data from one aliquot. Samples from 2 mL glass vials are automatically injected into a temperature-controlled and temperature-stabilized vaporizer unit (A0211) held at high temperature, and the vapor is sent to the analyzer. At least three standards are used for quality control; these are selected according to the expected isotopic composition of the samples. For a single CRDS stable isotope measurement, about 2 µL of water is injected. This process is repeated six times, resulting in both final dD and d18O values, which refer to the per mil difference with respect to Vienna Standard Mean Ocean Water (VSMOW). These values are corrected for drift and memory effects. The precision of long-term standard measurements for the H and O isotope composition is better than ±0.8 ‰ and ±0.10 ‰, respectively. The data are reported as δD and δ18O values, which are the per mil difference from standard VSMOW. The deuterium excess (d-excess) is calculated as follows:
Both δD and δ18O were at their lowest during the beginning of the ice-free season and increased over its course. Late-summer and early-fall variability due to rainfall events precedes the formation of ice. Once the ice cover starts to form, the isotope signature decreases gradually over the fall and winter until dilution with snowmelt at breakup restarts the annual cycle. Similar to the EC, a small number of samples during initial breakup had much lower values (<−25 ‰ δ18O and <−180 ‰ δD) and might have been influenced by the pooling of meltwater from snow and ice during ice-jamming events. The stable isotopes shown in Fig. 5 have been measured in seven sets (separated by dashed vertical lines) and in two different labs (see Table 1). There are no apparent offsets between sample sets. The d-excess of the sample set that was measured at the MPI (sample nos. 488 to 612) shows less noise compared with previous sets.
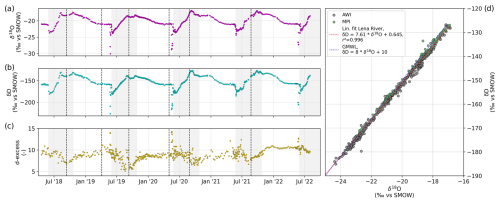
Figure 5Time series of (a) δ18O, (b) δD, and (c) d-excess. The scatterplot in panel (d) shows the relationship between δ18O and δD for the Lena River, where samples measured at the Alfred Wegener Institute are indicated by a black outline and samples measured at the Melnikov Permafrost Institute are shown using a green outline. The linear regression is shown by the solid red line; the dashed blue line shows the Global Meteoric Water Line after Craig (1961).
3.3 Dissolved organic carbon concentrations and absorption of colored dissolved organic matter
For dissolved organic carbon (DOC), the sample water was filtered right after sampling through a 0.45 µm cellulose acetate filter that had been prerinsed with 20 mL of sample. DOC samples were filled into a prerinsed 20 mL glass vial, acidified with 25 µL HCl Suprapur (10 M), and stored in the dark at 4 °C. After transport, DOC sample nos. 001 to 487 were analyzed at the hydrochemistry laboratory at AWI Potsdam. DOC concentrations were analyzed using high-temperature catalytic oxidation (TOC-VCPH, Shimadzu). Three replicate measurements of each sample were averaged. After every 10 samples, a blank (Milli-Q water) and a standard were measured. Eight different commercially available certified standards covered a range between 0.49 mg L−1 (DWNSVW-15) and 100 mg L−1 (Std. US-QC). The results of standards provided an accuracy no worse than ±5 %. DOC concentrations for sample nos. 488 to 612 (26 August 2021 to 16 August 2022) were analyzed at Lomonosov Moscow State University (MSU) using high-temperature catalytic oxidation (TOPAZ NC, Informanalitika LLC, Russia). Three replicate measurements of each sample were averaged, and three standards (5, 15, and 100 mg L−1) as well as blanks (Milli-Q water) were used to ensure high measurement accuracy. For the period from 10 September 2021 to 31 July 2022, total carbon and inorganic carbon concentrations were measured on unfiltered samples (Fig. C2). For the absorption of colored dissolved organic matter (aCDOM(λ)), the samples were filtered right after sampling through a 0.45 µm cellulose acetate filter that had been rinsed with 20 mL of sample water. aCDOM(λ) samples were collected into prerinsed 50 mL amber glass bottles that were stored in the dark at 4 °C until analysis. After transport, aCDOM(λ) values for sample nos. 001 to 039 (20 April 2018 to 13 September 2018) and sample nos. 079 to 201 (11 April 2019 to 11 September 2019) were measured at the Otto Schmidt Laboratory for Polar and Marine Research (OSL) in St Petersburg, Russia, using a double-beam SPECORD 200 spectrophotometer (Analytik Jena). Sample nos. 043 to 078 (29 September 2018 to 6 April 2019) and sample nos. 202 to 478 (13 September 2019 to 23 August 2021) were measured at the German Research Center for Geosciences (GFZ) in Potsdam, Germany, using a double-beam LAMBDA 950 UV–Vis spectrophotometer (PerkinElmer). Sample nos. 488 to 612 (26 August 2021 to 16 August 2022) were measured at MSU, Russia, using a PE-5400-UV spectrophotometer (ECROS LLC). The absorbance (A) was measured between 200 and 800 nm in 1 nm steps using a 1, 2, or 5 cm cuvette, depending on the expected concentration of dissolved organic matter. Napierian absorption (a) was calculated from the resulting absorbance measurements as follows:
where l is the path length (length of the cuvette in meters). Every 5–10 samples, the reference sample (Milli-Q water) was exchanged and a blank was measured to avoid artifacts from instrument drift.

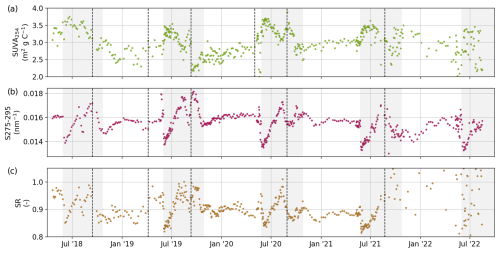
Figure 6Time series of (a) DOC and (b) aCDOM(254). Dashed black lines separate sample sets and indicate a possible change in the measurement protocol and method (see Table 1). (c) The relationship between aCDOM(254) and DOC, with the dashed black line showing the linear fit of all data. The outline color of the circles indicates the lab where samples were measured. For comparison, we show data sampled by the ArcticGRO program (blue squares).
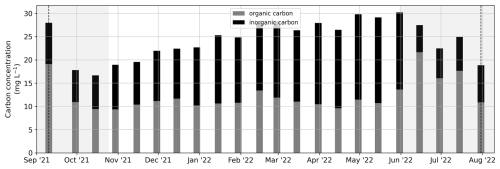
The DOC concentration ranged between 3.1 and 19.8 mg L−1 (Fig. 6a). aCDOM(254) ranged between 16.4 and 150.9 m−1 (Fig. 6b). Low DOC concentrations and aCDOM(254) occurred either in the late winter or in periods of low discharge during summer. The highest annual DOC and aCDOM(254) values occurred during the spring freshet, when discharge was the highest. aCDOM(254) and DOC showed a very strong linear relationship (r2=0.92). The samples measured at MSU showed a significantly lower r2 value (0.85) compared with the samples measured at GFZ (r2=95) or OSL (r2=0.98). Note that, while we only show aCDOM at the 254 nm wavelength, the dataset in Juhls et al. (2020b) contains all wavelengths between 200 and 800 nm. DOC and aCDOM(254) values generally agree with data from ArcticGRO sampled several hundreds of kilometers further upstream; however, ArcticGRO shows a generally lower DOC-to-aCDOM(254) ratio compared with our data. Based on DOC and aCDOM(λ), we calculated three optical indices as indicators of the chemical composition and molecular structure of the organic matter: specific ultraviolet absorbance at 254 nm (SUVA254), the spectral slopes of aCDOM(λ) between 275 and 295 nm (S275–295), and the slope ratio (SR). These three indices are reported to correlate with the aromaticity and molecular weight of bulk DOC (Helms et al., 2008; Weishaar et al., 2003). The change in S275–295 has been reported to be a good indicator of the photodegradation of DOM (Fichot et al., 2013; Fichot and Benner, 2012; Helms et al., 2008). SUVA254 (m2 g C−1) was calculated by dividing the decadal absorption (m−1) at 254 nm by the DOC concentration (mg L−1). The SUVA254 ranged between 1.41 and 3.89 mg L−1, with the highest values after the freshet and the lowest values during winter and low-discharge periods in summer. S275–295 was determined by fitting the data for the wavelength ranges from 275 to 295 nm to the exponential function (Helms et al., 2008), as follows:
where aCDOM(λ0) is the absorption coefficient at reference wavelength λ0 and S is the spectral slope of aCDOM(λ) for the chosen wavelength range. S275–295 ranged between 0.0130 and 0.0182 nm−1. The SR was calculated by dividing the spectral slope from 275 to 295 nm by the spectral slope between 350 and 400 nm. The SR ranged between 0.814 and 1.36, not including the last set of samples (from 26 August 2021). This set, measured with the PE-5400-UV spectrophotometer at the MSU, shows noisy results for longer wavelengths visible in the S350-400 that is used to calculate SR. Consequently, SR data for that sample series are not recommended for use. The results for the S275–295 of this sample series, however, are comparable with previous sample series.
3.4 Fluorescent dissolved organic matter
Fluorescence measurements were carried out at the Technical University of Denmark on a HORIBA Aqualog optical spectrometer with a 1 cm quartz cuvette (Suprasil grade, HELMA GmbH) using the same sample as for aCDOM(λ). Fluorescence emission was recorded between 220 and 620 nm (increment of ∼ 3.3 nm) at excitation wavelengths between 240 and 600 nm (increment of 3 nm). The accuracy of the optical components and the immaculacy of cuvettes were validated daily (Wünsch et al., 2015). Fluorescence excitation–emission matrix (EEM) data were processed in MATLAB (MathWorks Inc.) using the drEEM toolbox (v0.6.3; Murphy et al., 2013). Inner-filter effects were compensated for using an absorbance-based method (Kothawala et al., 2013), and the fluorescence counts were converted into Raman units (RU) using the water blank's (sealed reference cuvette) Raman emission band at 350 nm. Raman and Rayleigh scatter were removed from each EEM without interpolation.
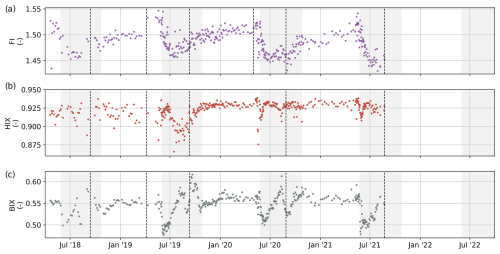
Figure 8(a) Time series of the fluorescence index (FI), (b) humification index (HIX), and (c) biological index (BIX). Dashed black lines separate sample sets and indicate a possible change in the measurement protocol and method (see Table 1).
Fluorescence-derived DOM optical indices are proxies for the character of DOM with respect to its degree of humification and biological degradation, therefore providing insights into the DOM's source (Fig. 8). The fluorescence index (FI) was determined as the ratio between the emission intensities at 470/520 nm for an excitation wavelength of 370 nm (Maie et al., 2006). FI values generally ranged between 1.2 and 2, indicating a terrestrial or microbial DOM origin, respectively (D'Andrilli et al., 2022; McKnight et al., 2001). The FI values for our samples ranged between 1.43 and 1.54 (median 1.48), with the highest values observed just before the ice-free period, decreasing drastically after ice breakup. The humification index (HIX) estimates the degree of humification of DOM (Zsolnay, 2003; Zsolnay et al., 1999). We calculated it, as modified by Ohno (2002), as the ratio of the areas of two spectral wavelength regions in the emission spectra for an excitation at 254 nm and obtained it as follows:
where H is the area between 435 and 480 nm in the emission spectra and L is the area in the emission spectra between 300 and 345 nm. An increase in the degree of aromaticity (humification) will be associated with higher HIX values. HIX values ranged from 0.78 to 0.93 (median 0.92), showing relatively steady values during the ice-covered season and decreasing values at the beginning of the ice-free season. The biological index (BIX) is a proxy used to assess the biological modification of DOM. The BIX is obtained by calculating the ratio of the emission at 380 and 430 nm, excited at 310 nm (Huguet et al., 2009):
High BIX values correspond to an autochthonous DOM origin, i.e., freshly released DOM, whereas low BIX values indicate allochthonous DOM (Huguet et al., 2009). BIX values varied between 0.48 and 0.61 (median 0.54) during the sampling period. Values presented low variability during the ice-covered periods, a subsequent rapid decrease at the beginning of the ice-free season, and a rapid increase that reached the highest values. The underlying fluorescence phenomena were distinguished using parallel factor analysis (PARAFAC) with the N-way toolbox algorithms (Andersson and Bro, 2000). Prior to modeling, excitation scans shorter than 250 and longer than 450 nm and emission scans shorter than 312 and longer than 600 nm were deleted to reduce computation time. EEMs were normalized via division by the 1.2th root of their standard deviation to give samples with different overall fluorescence a similar leverage. Models with two to eight components were explored. All models were constrained to fit components with positive scores and loadings (i.e., nonnegativity). Models were initialized with random numbers, and the best model (with the lowest model error) out of 50 solutions was selected. A maximum of 2500 iterations was allowed, and a relative change in fit of 10−6 was chosen as the convergence criterion. Ultimately, the seven-component model was chosen as the most appropriate approximation, and its loadings were validated using the split-half approach. Seven fluorescent DOM components (Fmax) were isolated with PARAFAC (Fig. 9a). Overall, all components presented the same temporal patterns: relatively steady values during the ice-covered season, a subsequent decrease just before the ice breakup, and a rapid increase that quickly reached the highest values shortly after ice breakup (Fig. 9b). Components 1 and 2 (C1 and C2, respectively) showed fluorescence peaks in the UV range, which are generally associated with autochthonous DOM such as protein-like compounds (Coble, 2007). The fluorescence intensities of C1 and C2 varied from 0.04 to 0.54 RU and from 0.03 to 0.3 RU, respectively. C3 to C7 showed a fluorescence peak in the visible wavelength range (>400 nm), which is generally associated with terrestrial humic-like compounds (Coble, 2007). C3 and C4 showed the highest fluorescence intensities, varying from 0.18 to 1.38 RU and from to 0.08 RU to 2.03 RU, respectively. C5 and C6, ranged from 0.30 to 2.8 RU and from 0.06 to 0.62 RU, respectively, whereas C7 values ranged between 0.12 and 1.05 RU.
3.5 DOC radiocarbon
Samples for DOC Δ14C analysis were taken biweekly from 30 September 2019 to 15 July 2021. For each sample, an acid-washed 250 mL HDPE bottle was rinsed two times with river water before filling it with the sample in order to preempt contamination from sources such as outboard motor exhaust or dust particles. Water was collected upstream of the boat and operator to ensure the utmost sample integrity. After sample collection, each bottle was promptly sealed and kept frozen at a temperature of −20 °C during subsequent transportation and storage. The radiocarbon content of DOC was analyzed using a miniature carbon dating system (MICADAS) at the Alfred Wegener Institute in Bremerhaven, Germany, and methods described in Mollenhauer et al. (2021). In the laboratory, water samples were thawed and filtered over 0.75 µm glass-fiber filters (GF/F, Whatman). Dissolved organic matter (DOM) was concentrated by evaporation of water using a rotary evaporator. Concentrated DOM was transferred into silver liquid cups (70 µL, Elementar part no. 200010387), dried completely on a hot plate, and subsequently stored in a dessicator kept at 40 °C. After drying, the silver cups were folded into small packages and combusted in an elemental analyzer (EA, Elementar vario ISOTOPE), coupled to an Ionplus gas interface system (GIS; Wacker et al., 2013), allowing the transfer of CO2 directly into the hybrid ion source of the MICADAS. Samples were analyzed as gas for a 12 min measurement cycle; data were evaluated using the BATS software package (Wacker et al., 2010) and normalized against oxalic acid II standard gas (CO2 produced from Oxalic Acid II, NIST SRM4990C) and blank-corrected against 14C-free CO2. Secondary blank correction was performed using process blank determination according to the method of Sun et al. (2020), and errors were propagated following Wacker et al. (2010). Results are reported as 14C conventional radiocarbon ages (years BP) (Stuiver and Polach, 1977).

Figure 10(a) The Δ14C of DOC and 2 times the standard deviation (2σ) shown as error bars. (b) The corresponding age and the 2σ shown as error bars. Dashed black lines indicate the start and end date of the set of samples that were analyzed.
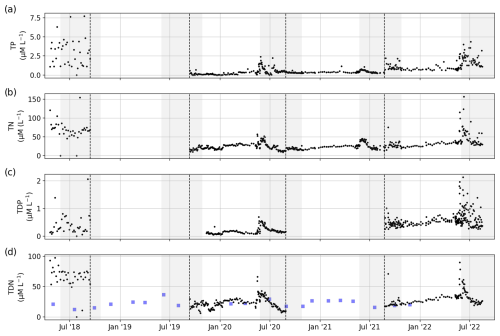
Figure 11Concentrations of (a) total phosphorus, (b) total nitrogen, (c) total dissolved phosphorus, and (d) total dissolved nitrogen. Dashed black lines separate sample sets and indicate a possible change in the measurement protocol and method (see Table 1). For comparison, we added data sampled by the ArcticGRO program (blue squares).
No clear seasonal patterns were identified in the radiocarbon contents of DOC, with Δ14C values ranging between −25 ‰ and 115 ‰ (Fig. 10a) and corresponding conventional radiocarbon ages between −945 and 138 years (Fig. 10b). The lack of clear seasonal differences may be due to the lower number of samples and the reduced sampling period.
3.6 Nutrients
Samples for dissolved inorganic nutrient (ammonium – NH4; nitrite – NO2; nitrate – NO3; phosphate – PO4; and silicate – Si) analysis as well as for total dissolved nitrogen and total dissolved phosphorus (TDN and TDP, respectively) were filtered through a 0.45 µm cellulose acetate filter that had been rinsed with 20 mL of sample water. Nutrient, TDN, and TDP samples were filled into prerinsed 20 mL polyethylene (PE) bottles and stored frozen at −18 °C until analysis. For TN and TP (total nitrogen and total phosphorus, respectively), unfiltered samples were filled into prerinsed 20 mL PE bottles and stored frozen at −20 °C until analysis. TN, TDN, TP, and TDP for sample nos. 001 to 039 (20 April 2018 to 13 September 2018) and dissolved inorganic nutrients for sample nos. 001 to 201 (20 April 2018 to 11 September 2019) were measured at the Otto Schmidt Laboratory in St Petersburg, Russia. Dissolved inorganic nutrients were analyzed on an automated continuous-flow system (San, Skalar, Netherlands) using standard colorimetric techniques (Aminot et al., 2009). For the determination of TN, TDN, TP, and TDP, the persulfate oxidation method (Knapp et al., 2005) was used. The first step was the oxidation of total dissolved nitrogen (TDN, the sum of nitrate, nitrite, ammonium, and dissolved organic nitrogen –DON) to nitrate and TDP to phosphate. Therefore, 24 mL of the sample plus 2 mL of persulfate oxidizing reagent (POR) was added to a Teflon bottle. The POR contained American Chemical Society (ACS)-grade sodium hydroxide, certified ACS-grade boric acid, and certified ACS-grade potassium persulfate, which was recrystallized three times (Hansen and Koroleff, 2007). The digestion was performed by autoclaving at 121 °C. In the same digestion, the total phosphorus was also measured. The reagent blank was below 0.1 µM. Environmental matrix reference materials (Environment and Climate Change Canada) were used as tracking standards in every batch of samples. TN and TP for samples from no. 201 to no. 362 and dissolved inorganic nutrients for sample nos. 202 to 487 were measured at the Helmholtz-Zentrum Hereon in Geesthacht, Germany. Nutrient concentrations were analyzed in duplicate using an automated continuous-flow system (AA3, Seal Analytical, Germany) and standard colorimetric techniques (Hansen and Koroleff, 2007). Detection limits were 1 µM for nitrate and silicate or 0.5 µM for nitrite, ammonium, and phosphate. For the determination of TDN and TDP, we used the same method as described above for the previous samples. For digestion, a microwave (CEM, Mars 5) was used. The reagent blank was always <2 µM. As a reference, internal standards of ammonium sulfate and urea were used. In the same digestion, total phosphorus was measured. The reagent blank was below 0.1 µM. For the analysis of TDN and TDP, we used the same method as was used for unfiltered water samples (total). The results for the standards provided an accuracy of better than ±10 %. TN, TDN, TP, and TDP for sample nos. 488 to 612 were measured at the MSU, Russia, using a PE-5400UV spectrophotometer (ECROS LLC). Frozen samples were concurrently thawed at room temperature in bulks of 10–20 samples and processed the same day as soon as they reached the appropriate temperature. Concentrations of inorganic phosphorus (orthophosphate) in filtered and unfiltered samples were determined photometrically using the Murphy–Riley method (molybdenum blue reaction of orthophosphate with ammonium molybdate and antimony potassium tartrate in sulfuric acid, reduced by ascorbic acid, measured at a wavelength of 885 nm in a 5 cm cuvette). The approved detection range of the specific method used was 0.005–0.100 mg L−1 of orthophosphate (or 0.0016–0.033 mg P L−1), and the standard error at p=0.05 was 0.0001 + 0.08 × X, where X is the determined concentration (in mg P L−1). To account for turbidity, two measurements of optical density were made: (1) without ascorbic acid and (2) with ascorbic acid. Total phosphorus concentrations were determined after persulfate digestion (samples heated in an autoclave at 121 °C for 1 h with ammonium persulfate added) using the same method as for inorganic phosphorus. TN concentrations were determined by alkaline persulfate digestion (samples autoclaved at 120 °C for 90 min with potassium persulfate and sodium hydroxide and then measured in a 1 cm quartz cuvette at a 207 nm wavelength after adding sulfuric acid). The approved detection range of the specific method used was 0.1–6.0 mg N L−1, and the standard error at p=0.05 was 0.04 + 0.077 × X, where X is the determined concentration (in mg N L−1). Calibration coefficients for the spectrophotometer were obtained by running the described procedures on solutions diluted from a standard 0.5 g L−1 solution of phosphate ion and a 0.5 g L−1 solution of TN.
TN, TDN, TP, and TDP showed peaks during the freshet in June and decreasing concentrations throughout the summer. The difference in noisiness of the data between the four available sample sets indicate the varying quality of the analysis.
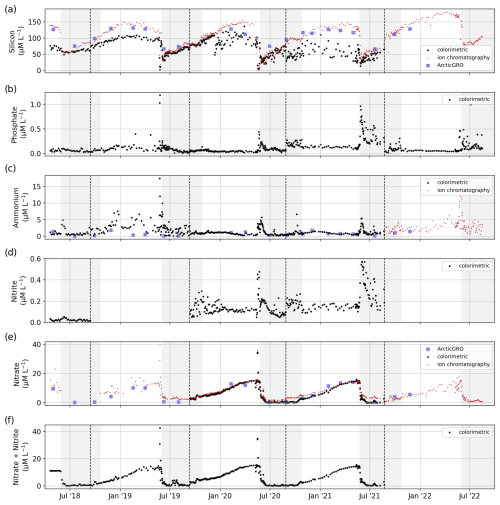
Figure 12Concentrations of dissolved inorganic nutrients: (a) Si, (b) PO4, (c) NH4, (d) NO2, (e) NO3, and (f) NO2 + NO3 determined by colorimetric/photometric methods (black) and by ion chromatography (red). Dashed black lines separate sample sets and indicate a possible change in the measurement protocol and method (see Table 1). For comparison, we added data sampled by the ArcticGRO program (blue squares).
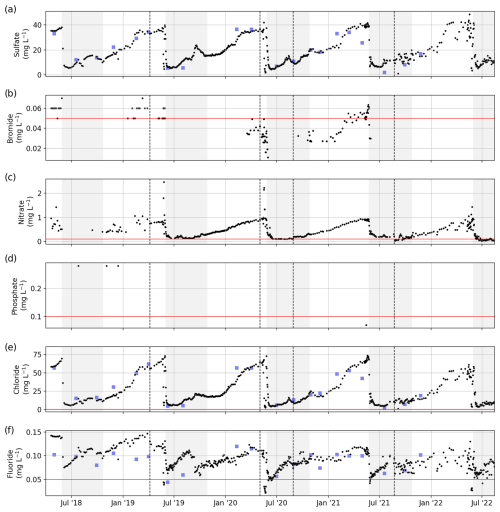
Figure 13Concentrations of major ions: (a) Si, (b) Br, (c) NO3, (d) PO4, (e) Cl, and (f) F. The horizontal red line shows the detection limit. Dashed black lines separate sample sets and indicate a possible change in the measurement protocol and method (see Table 1). For comparison, we added data sampled by the ArcticGRO program (blue squares).
PO4, NH4, and NO2 showed annual peak concentrations during the freshet in June, whereas NO3 showed a gradual increase during the winter and a sudden decrease during the freshet. Si concentrations increased from the freshet until the middle or end of winter. A comparison of TDN, Si, NH4, and NO3 with data from ArcticGRO reveals a good agreement between the datasets.
3.7 Dissolved elemental and ion concentrations
Sample nos. 079 to 487 (6 April 2019 to 23 August 2021), which were analyzed for concentrations of major dissolved elements and ions, were frozen (untreated) directly after sampling. After transport, samples were thawed (24 h at room temperature) in the hydrochemistry laboratory at AWI in Potsdam, Germany. They were then filtered using a syringe-mounted 0.45 µm cellulose acetate filter and kept cool and dark until analysis. Samples for the first year (sample nos. 001 to 078; 20 April 2018 to 6 April 2019) were filtered right after sampling and transported under cool and dark conditions. Sample nos. 079 to 487 were frozen right after sampling and thawed and filtered after transport prior to analysis. Concentrations of major ions (sulfate – SO4; bromide – Br; nitrate – NO3; phosphate – PO4; chloride – Cl; and fluoride – F) were determined using ion chromatography (ICS 2100, Thermo Fisher Scientific; Weiss, 2001). A blank (Milli-Q water) and a standard were measured every 10 samples. A commercially available certified standard at two different dilutions (1:5 and 1:10) was used to determine measurement accuracy and the detection limits (Table 1). For analysis of the total dissolved elemental concentration (aluminum – Al; barium – Ba; calcium – Ca; iron – Fe; potassium – K; magnesium – Mg; manganese – Mn; sodium – Na; phosphorus – P; silicon – Si; and strontium – Sr), sample nos. 001 to 078 were filtered right after sampling and cooled. Sample nos. 079 to 487 were frozen right after sampling, thawed after transport, and filtered prior to analysis. Then, samples were acidified with 65 % HNO3 (65 % Suprapur) and were measured with inductively coupled plasma optical emission spectroscopy (ICP-OES; PerkinElmer Optima 8300DV; Boss and Fredeen, 1997). For sample nos. 202 to 287 (13 September 2019 to 2 May 2020), we compared elemental and ion concentrations from two sets of samples that were (1) frozen right after sampling and thawed and filtered only after transport and (2) filtered right after sampling and transported unfrozen (cooled at +4 °C). Comparing the results of the two sets shows that sample processing differences affect elemental and ion concentrations in ways that introduce systematic biases (Figs. B2, B3). These biases differ in magnitude and direction depending on the parameter, but freezing results in lower concentrations for most parameters. Sample nos. 488 to 612 (26 August 2019 to 16 August 2021) were treated identically to sample nos. 079 to 487, but they were measured at the MSU. Concentrations of major dissolved elements and ions were measured using ion chromatography with a Concise ICSep AN2 column for major ions (Cl, SO4, F, and NO3) and a Shodex IC YS-50 column for total dissolved elemental concentration (Na, K, Mg, Ca, Si, and NH4). Most dissolved elemental and ion concentrations (SO4, NO3, Ba, Cl, F, Ca, K, Mg, Na, Si, and Sr) increased during the winter (similar to EC; Fig. 4) and decreased sharply during the freshet (Figs. 13, 14). Fe and Mn showed a strong peak and their annual maximum during the freshet. Al and P did not indicate clear seasonal patterns. The different protocols (transport of samples cooled vs. transport of samples frozen) between samples < no. 077 and > no. 077 resulted in visible offsets between the sample sets (i.e., F, Al, Mn, …). The differences between unfrozen and frozen samples across different sample sets seem similar to those shown in Appendix B (comparing frozen and unfrozen samples of the same sample set).
In addition, we compared some of the dissolved elemental and ion concentrations with those measured by the ArcticGRO program, which shows generally good agreement. Some stronger differences might be related to the earlier arrival of changing seasons at the ArcticGRO sampling location further south.
In addition, for sample nos. 001 to 078, the germanium (Ge) concentration and Si isotope composition (δ30Si) were measured (Fig. C1). Heavy metals (Pb, Cr, V, Co, Ni, Cu, and Zn) were measured for sample nos. 202 to 487. Concentrations for these parameters and for all samples were below the detection limit, with the exception of some Zn concentrations between 20 and 196 µg L−1.
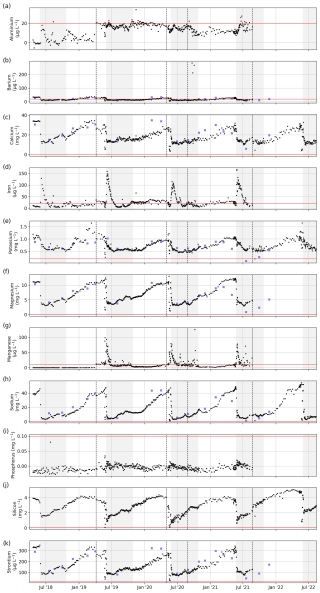
Figure 14Concentrations of total dissolved elemental concentrations: (a) Al, (b) Ba, (c) Ca, (d) Fe, (e) K, (f) Mg, (g) Mn, (h) Na, (i) P, (j) Si, and (k) Sr. The horizontal red line shows the detection limit. Dashed black lines separate sample sets and indicate a possible change in the measurement protocol and method (see Table 1). For comparison, we added data sampled by the ArcticGRO program (blue squares).
The raw data and all related metadata are stored at the Alfred Wegener Institute (AWI), Germany. Final aligned and cleaned datasets are available on PANGAEA: https://doi.org/10.1594/PANGAEA.913197 (Juhls et al., 2020b). Detailed metadata are available with digital object identifiers (DOIs), including the principal investigator's contact information. The remaining sample volumes of analyzed samples are archived at the AWI in Potsdam, Germany. For specific questions, please contact the principal investigator associated with the parameter. In addition, the data from this collection can be explored via an interactive dashboard at https://lena-monitoring.awi.de/ (last access: 10 October 2024).
The dataset presented here is the result of comprehensive, year-round, high-frequency monitoring of the biogeochemistry of the Lena River, covering nearly 4.5 years. The data collection includes a wide range of biogeochemical parameters, maintaining consistency for most parameters with respect to coverage and data quality. This consistency is achieved through the involvement and committed engagement of local partners, simple sampling and sample handling protocols, and effective real-time communication between sampling personnel and scientists. To the best of our knowledge, this data collection represents the most extensive and detailed coverage of an Arctic river's biogeochemistry to date. The high-frequency nature of this dataset is particularly significant, allowing for the observation of biogeochemical changes occurring on a weekly or shorter timescale and justifying interpolation between sampling dates. High-frequency sampling eliminates the need for gap-filling, e.g., using load models, which ignore flux processes that are independent of discharge. Studies based on this dataset show improved estimates of the loads supplied from terrestrial sources into the Arctic Ocean in terms of both magnitude and timing (Juhls et al., 2020a; Sanders et al., 2022). Specifically the continuous and frequent sampling during the winter season improves the understanding of freezing processes (Lütjen et al., 2024) and the role of the ice-covered period for the biogeochemical processing of nutrients in the Lena River prior to their delivery to the Arctic Ocean (Opfergelt et al., 2024). Furthermore, these data serve as a valuable resource for satellite data validation, as demonstrated by El Kassar et al. (2023). Other potential applications of this dataset include enhancing climate and Earth system models and supporting policy decisions regarding Arctic environments. This dataset establishes a baseline to monitor future environmental changes across various timescales, from precipitation events to seasonal and interannual variations as well as to detect future changes in river hydrology. Given the current geopolitical situation limiting international access to the Russian Arctic, such robust, long-term datasets will be of great importance to monitor and understand ongoing environmental changes. Using this dataset as a baseline, it should be the goal to repeat such sampling in the future, either as ongoing monitoring or a repeated intense 4-year period. Future studies could utilize insights from this high-frequency sampling effort to determine the optimal sampling frequency needed to address specific scientific questions. Further, to improve inter-lab comparability, we recommend designated tests to measure splits of samples for the same parameters but in different labs and or using different protocols or instruments. Overall, the breadth and quality of this dataset provide an invaluable foundation for future research and monitoring efforts in the rapidly changing Arctic region.
The temperature and electrical conductivity of the entire Lena River water column was measured in different years and seasons (August of 2016 and March–April and August of 2019) at a number of locations in different channels within the Lena River delta. These profiles show a well-mixed and unstratified water column (Fig. A1).
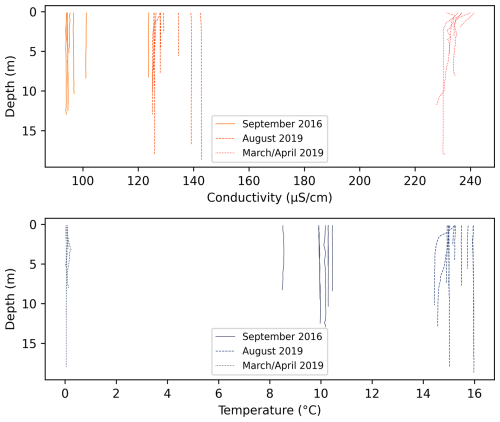
Figure A1Conductivity–temperature–depth profiles within channels of the Lena River across different years and seasons (https://doi.org/10.1594/PANGAEA.933182, Fuchs et al., 2021 and Overduin et al., 2017).
For a set of samples covering the period from 13 September 2019 to 2 May 2020, we measured the electrical conductivity (Fig. B1), major ion concentrations (Fig. B2), and dissolved elemental concentrations (Fig. B3), as described in Table 1 but with two different protocols to assess the impact of sample processing on the dissolved elemental and ion concentrations. While some dissolved elemental and ion concentrations show minor differences when comparing the results of the different protocols, others show large differences or even seasonal differences. For many dissolved elemental and ion concentrations, frozen samples show lower concentrations compared with unfrozen samples.

Figure B1Comparison of the electrical conductivity of two sample sets that were processed with two different protocols. One set was frozen right after sampling and then thawed and filtered after storage and transport (green), whereas the other set was filtered right after sampling and stored and transported unfrozen/cooled (blue). The analysis method for both sets is identical (see Table 1).
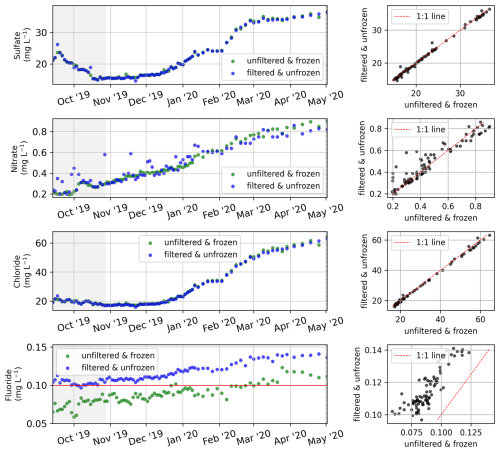
Figure B2Comparison of the major ion concentrations of two sample sets that were processed with two different protocols. One set was frozen right after sampling and then thawed and filtered after storage and transport (green), whereas the other set was filtered right after sampling and stored and transported unfrozen/cooled (blue). The analysis method for both sets is identical (see Table 1).
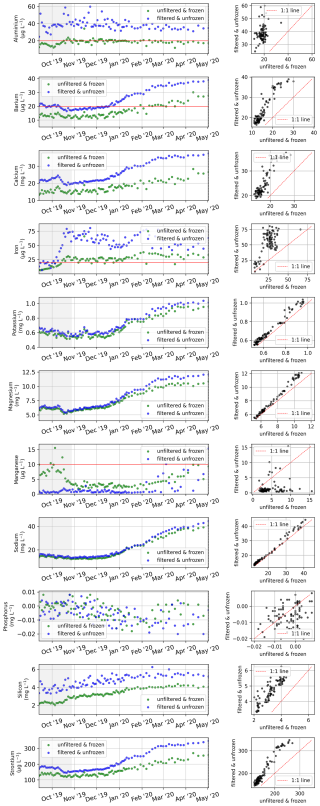
Figure B3Comparison of the total dissolved elemental concentrations of two sample sets that were processed with two different protocols. One set was frozen right after sampling and then thawed and filtered after storage and transport (green), whereas the other set was filtered right after sampling and stored and transported unfrozen/cooled (blue). The analysis method for both sets is identical (see Table 1).
In addition to the parameters shown in the main body of the text, some sample sets or rest volumes of samples were used to measure additional parameters, although not for the entire sampling program period. The germanium (Ge) concentration for sample nos. 001 to 077 (20 April 2018 to 28 March 2019) was determined on rest volumes of the samples for total dissolved elemental concentration by ICP mass spectrometry (ICP-MS; iCAP Q Thermo Fisher Scientific, Earth and Life Institute, UCLouvain, Belgium). The detection limit for Ge is 0.04 nM, and the analytical precision of the measurement is ±8 % for Ge concentrations <0.013 nM and ±4 % for Ge concentrations >0.013 nM. The silicon isotope composition (δ30Si) was analyzed using a high-resolution multicollector inductively coupled plasma mass spectrometer (MC-ICP-MS; Neptune Plus™, Thermo Fisher Scientific, Earth and Life Institute, UCLouvain, Belgium) in wet-plasma mode after Si separation using a two-stage column chemistry procedure with an anion exchange resin (Bio-Rad AG MP-1) followed by a cation exchange resin (Bio-Rad AG50W-X12). The instrumental mass bias was corrected using the sample–standard bracketing technique and external Mg doping. The δ30Si compositions are expressed in relative deviations of the ratio from the NBS-28 reference standard using δ notation (‰) as follows: δ30Si = [()sample()NBS-28 −1] × 1000. Each single δ value represents one sample run and two bracketing standards. The δ30Si values are reported as the mean of isotopic analyses from multiple analytical sessions at least in duplicate. The long-term precision and accuracy is ±0.08 ‰ (SD).
Organic and inorganic carbon concentrations were measured on unfiltered samples for the period from 10 September 2021 to 31 July 2022 (Fig. C2) at the Lomonosov Moscow State University (MSU) in Moscow, Russia, using high-temperature catalytic oxidation (TOPAZ NC, manufactured by Informanalitika LLC, Russia). Analyses for the determination of the total carbon concentration are based on ISO 8245 for the determination of the sum of organically and inorganically bound carbon, including elemental carbon, based on the infrared spectrometry of CO2 after thermocatalytic oxidation of all carbon species. Analyses for the determination of the inorganic carbon concentration are based on ISO 8245 for the determination of the sum of elemental carbon, carbonates and bicarbonates, carbon dioxide and monoxide, cyanide, cyanate, and thiocyanate via the infrared spectrometry of CO2 after oxidation with phosphoric acid.
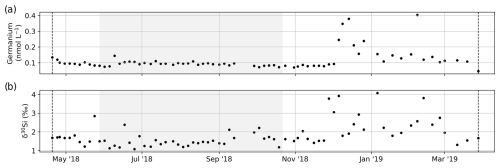
Figure C1The (a) germanium concentration and (b) dissolved Si isotope composition. Dashed black lines indicate the start and end date of the set of samples that were analyzed.
The research was conceived and coordinated by BJ, AM, and PPO, with initial support from JH and BH. AE was responsible for the preparation of consumables and the laboratory analysis of DOC and ions at AWI Potsdam. SA managed program communication and logistics between Russia and Germany. EE, FYG, and FM created the data dashboard, processed the data, and ensured quality control. SC, MT, and OE conducted DOC, CDOM, ion, and nutrient measurements at MSU. Stable oxygen and hydrogen isotope analyses were performed by HM at AWI Potsdam and NT at MPI Yakutsk. Sample and consumables transport in Russia were overseen by GeoM, LL, EF, and VP. Sampling was supported by EA, LL, and AC. Nutrient measurements were carried out by TS at Hereon. DOC radiocarbon measurements were performed by HG and GesM at AWI Bremerhaven. CDOM and nutrient measurements at OSL were conducted by VP, AC, and JH. Ge and Si isotope measurements were carried out by SO. BJ piloted the creation of figures and tables. BJ wrote the main content of the paper, with further contributions and suggestions from all co-authors.
At least one of the (co-)authors is a member of the editorial board of Earth System Science Data. The peer-review process was guided by an independent editor, and the authors also have no other competing interests to declare.
Publisher's note: Copernicus Publications remains neutral with regard to jurisdictional claims made in the text, published maps, institutional affiliations, or any other geographical representation in this paper. While Copernicus Publications makes every effort to include appropriate place names, the final responsibility lies with the authors.
We would like to express our sincere gratitude to the staff of the Research Station Samoylov Island (Fedor Sellyakhov, Sergey Volkov, Andrey Astapov, and Viktor Zykov) for their central role and expertise in carrying out in situ measurements, water sampling, logistics, and communications. We are grateful to Mikaela Weiner and Andreas Marent at AWI for their work on stable oxygen and hydrogen isotopes. Our appreciation goes to Volkmar Assmann and Waldemar Schneider for their logistical support in Russia through AWI. Special thanks to Pia Esterl, Martha Lütjen, Henrike Walther, Juan Sebastian Valencia Velasquez, and Caroline Herff at AWI for their contributions to sample processing, analysis, and data processing. We acknowledge the administrative and logistical support provided by Mikhail N. Grigoriev at MPI, Yakutsk, Russia, and Luidmila Pestryakova at the North-Eastern Federal University in Yakutsk, Russia. We are thankful to Colin Stedmon, Signe Melbye Andersen, and Anders Dalhoff Bruhn Jensen at DTU for their assistance with FDOM measurements. Finally, we extend our gratitude to Elizabeth Bonk, Silla M. Thomsen, and Torben Gentz for their laboratory support during MICADAS measurements at AWI. We also extend our thanks to Mathias Bochow and Carsten Neumann at GFZ for their support with CDOM measurements.
Bennet Juhls was supported by the EU Horizon 2020 program (Nunataryuk; grant no. 773421); the European Space Agency (ESA), as part of a Climate Change Initiative (CCI) fellowship (ESA ESRIN; grant no. 4000l3376l/2l/I-NB); and the BNP Paribas Foundation Climate & Biodiversity Initiative (FLO CHAR project). Funding for the MICADAS radiocarbon laboratory was provided through AWI institutional core funding, and Hendrik Grotheer was funded by the MARUM Cluster of Excellence “The Oceans Floor – Earth's Uncharted Interface” project (DFG project no. 390741603). Funding was provided to Sophie Opfergelt by the European Research Council (ERC) under the European Union's Horizon 2020 Research and Innovation program (WeThaw grant no. 714617) and by the Fonds de la Recherche Scientifique (FNRS; grant no. FC69480). Liudmila Lebedeva, Nikolai Torgovkin, and Georgii Maksimov were funded by the Melnikov Permafrost Institute SB RAS (project nos. 122012400106-7 and 122011800064-9). Sergey Chalov has been supported by the Kazan Federal University Strategic Academic Leadership Program (“PRIORITY-2030”) and the Ministry of Science and Higher Education of Russian Federation (grant no. 075-15-2024-614). Vasily Povazhnyi was supported by the Federal scientific and technological program in the field of environmental development of the Russian Federation for 2021–2030 (grant no. 169-03-2024-072). We acknowledge support from the open-access publication fund of Alfred-Wegener-Institut Helmholtz-Zentrum für Polar- und Meeresforschung. Publisher’s note: the article processing charges for this publication were not paid by a Russian or Belarusian institution.
The article processing charges for this open-access publication were covered by the Alfred-Wegener-Institut Helmholtz-Zentrum für Polar- und Meeresforschung.
This paper was edited by Yuanzhi Yao and reviewed by O.S. Pokrovsky and one anonymous referee.
Aminot, A., Kérouel, R., and Coverly, S. C.: Nutrients in seawater using segmented flow analysis, in: Practical guidelines for the analysis of seawater, edited by: Wurl, O., CRC Press, 155–190, 2009.
Andersson, C. A. and Bro, R.: The N-way Toolbox for MATLAB, Chemom. Intell. Lab. Syst., 52, 1–4, https://doi.org/10.1016/S0169-7439(00)00071-X, 2000.
Bertin, C., Carroll, D., Menemenlis, D., Dutkiewicz, S., Zhang, H., Matsuoka, A., Tank, S., Manizza, M., Miller, C. E., Babin, M., Mangin, A., and Le Fouest, V.: Biogeochemical River Runoff Drives Intense Coastal Arctic Ocean CO2 Outgassing, Geophys. Res. Lett., 50, e2022GL102377, https://doi.org/10.1029/2022GL102377, 2023.
Biskaborn, B. K., Smith, S. L., Noetzli, J., Matthes, H., Vieira, G., Streletskiy, D. A., Schoeneich, P., Romanovsky, V. E., Lewkowicz, A. G., Abramov, A., Allard, M., Boike, J., Cable, W. L., Christiansen, H. H., Delaloye, R., Diekmann, B., Drozdov, D., Etzelmüller, B., Grosse, G., Guglielmin, M., Ingeman-Nielsen, T., Isaksen, K., Ishikawa, M., Johansson, M., Johannsson, H., Joo, A., Kaverin, D., Kholodov, A., Konstantinov, P., Kröger, T., Lambiel, C., Lanckman, J. P., Luo, D., Malkova, G., Meiklejohn, I., Moskalenko, N., Oliva, M., Phillips, M., Ramos, M., Sannel, A. B. K., Sergeev, D., Seybold, C., Skryabin, P., Vasiliev, A., Wu, Q., Yoshikawa, K., Zheleznyak, M., and Lantuit, H.: Permafrost is warming at a global scale, Nat. Commun., 10, 264, https://doi.org/10.1038/s41467-018-08240-4, 2019.
Boss, C. B. and Fredeen, K. J.: Concepts, Instrumentation and Techniques in Inductively Coupled Plasma Optical Emission Spectrometry, 3rd Edn., PerkinElmer, Inc., USA, 1997.
Castro-Morales, K., Canning, A., Arzberger, S., Overholt, W. A., Küsel, K., Kolle, O., Göckede, M., Zimov, N., and Körtzinger, A.: Highest methane concentrations in an Arctic river linked to local terrestrial inputs, Biogeosciences, 19, 5059–5077, https://doi.org/10.5194/bg-19-5059-2022, 2022.
Cauwet, G. and Sidorov, I.: The biogeochemistry of Lena River: organic carbon and nutrients distribution, Mar. Chem., 53, 211–227, https://doi.org/10.1016/0304-4203(95)00090-9, 1996.
Chalov, S. R. and Prokopeva, K. N.: Assessment of Suspended Sediment Budget of the Lena River Delta Based on the Remote Sensing Dataset, Izv. – Atmos. Ocean Phys., 57, 1051–1060, https://doi.org/10.1134/S0001433821090450, 2021.
Coble, P. G.: Marine Optical Biogeochemistry: The Chemistry of Ocean Color, Chem. Rev., 107, 402–418, https://doi.org/10.1021/cr050350, 2007.
Craig, H.: Isotopic variations in meteoric waters, Science, 133, 1702–1703, https://doi.org/10.1126/science.133.3465.1702, 1961.
D'Andrilli, J., Silverman, V., Buckley, S., and Rosario-Ortiz, F. L.: Inferring Ecosystem Function from Dissolved Organic Matter Optical Properties: A Critical Review, Environ. Sci. Technol., 56, 11146–11161, https://doi.org/10.1021/ACS.EST.2C04240, 2022.
El Kassar, J., Juhls, B., Hieronymi, M., Preusker, R., Morgenstern, A., Fischer, J., and Overduin, P. P.: Optical remote sensing (Sentinel-3 OLCI) used to monitor dissolved organic carbon in the Lena River, Russia, Front. Mar. Sci., 10, https://doi.org/10.3389/FMARS.2023.1082109, 2023.
Fedorova, I., Chetverova, A., Bolshiyanov, D., Makarov, A., Boike, J., Heim, B., Morgenstern, A., Overduin, P. P., Wegner, C., Kashina, V., Eulenburg, A., Dobrotina, E., and Sidorina, I.: Lena Delta hydrology and geochemistry: long-term hydrological data and recent field observations, Biogeosciences, 12, 345–363, https://doi.org/10.5194/bg-12-345-2015, 2015.
Fichot, C. G. and Benner, R.: The spectral slope coefficient of chromophoric dissolved organic matter (S275–295) as a tracer of terrigenous dissolved organic carbon in river-influenced ocean margins, Limnol. Oceanogr., 57, 1453–1466, https://doi.org/10.4319/lo.2012.57.5.1453, 2012.
Fichot, C. G., Kaiser, K., Hooker, S. B., Amon, R. M. W., Babin, M., Bélanger, S., Walker, S. A., and Benner, R.: Pan-Arctic distributions of continental runoff in the Arctic Ocean, Sci. Rep., 3, 1053, https://doi.org/10.1038/srep01053, 2013.
Frey, K. E. and Smith, L. C.: Amplified carbon release from vast West Siberian peatlands by 2100, Geophys. Res. Lett., 32, L09401, https://doi.org/10.1029/2004GL022025, 2005.
Fuchs, M., Palmtag, J., Ogneva, O., Sanders, T., Aksenov, A., Polyakov, V. I., and Strauss, J.: CTD cast locations in the Lena Delta region, PANGAEA [data set], https://doi.org/10.1594/PANGAEA.933182, 2021.
Gelfan, A., Gustafsson, D., Motovilov, Y., Arheimer, B., Kalugin, A., Krylenko, I., and Lavrenov, A.: Climate change impact on the water regime of two great Arctic rivers: modeling and uncertainty issues, Climatic Change, 141, 499–515, https://doi.org/10.1007/S10584-016-1710-5, 2017.
Hansen, H. P. and Koroleff, F.: Determination of nutrients, in: Methods of Seawater Analysis, edited by: Grasshoff, K., Kremling, K., and Ehrhardt, M., 159–228, https://doi.org/10.1002/9783527613984.CH10, 2007.
Helms, J. R., Stubbins, A., Ritchie, J. D., Minor, E. C., Kieber, D. J., and Mopper, K.: Absorption spectral slopes and slope ratios as indicators of molecular weight, source, and photobleaching of chromophoric dissolved organic matter, Limnol. Oceanogr., 53, 955–969, https://doi.org/10.4319/lo.2008.53.3.0955, 2008.
Hölemann, J. A., Schirmacher, M., and Prange, A.: Seasonal variability of trace metals in the Lena River and the southeastern Laptev Sea: Impact of the spring freshet, Glob. Planet. Change, 48, 112–125, https://doi.org/10.1016/J.GLOPLACHA.2004.12.008, 2005.
Holmes, R. M., McClelland, J. W., Peterson, B. J., Tank, S. E., Bulygina, E., Eglinton, T. I., Gordeev, V. V., Gurtovaya, T. Y., Raymond, P. A., Repeta, D. J., Staples, R., Striegl, R. G., Zhulidov, A. V., and Zimov, S. A.: Seasonal and Annual Fluxes of Nutrients and Organic Matter from Large Rivers to the Arctic Ocean and Surrounding Seas, Estuar. Coast., 35, 369–382, https://doi.org/10.1007/s12237-011-9386-6, 2012.
Huguet, A., Vacher, L., Relexans, S., Saubusse, S., Froidefond, J. M., and Parlanti, E.: Properties of fluorescent dissolved organic matter in the Gironde Estuary, Org. Geochem., 40, 706–719, https://doi.org/10.1016/j.orggeochem.2009.03.002, 2009.
Juhls, B., Stedmon, C. A., Morgenstern, A., Meyer, H., Hölemann, J., Heim, B., Povazhnyi, V., and Overduin, P. P.: Identifying Drivers of Seasonality in Lena River Biogeochemistry and Dissolved Organic Matter Fluxes, Front. Environ. Sci., 8, 53, https://doi.org/10.3389/FENVS.2020.00053, 2020a.
Juhls, B., Morgenstern, A., Chetverova, A., Eulenburg, A., Hölemann, J., Povazhnyi, V., and Overduin, P. P.: Lena River surface water monitoring near the Samoylov Island Research Station, PANGAEA [data set], https://doi.org/10.1594/PANGAEA.913197, 2020b.
Knapp, A. N., Sigman, D. M., and Lipschultz, F.: N isotopic composition of dissolved organic nitrogen and nitrate at the Bermuda Atlantic Time-series Study site, Global Biogeochem. Cycles, 19, GB1018, https://doi.org/10.1029/2004GB002320, 2005.
Kothawala, D. N., Murphy, K. R., Stedmon, C. A., Weyhenmeyer, G. A., and Tranvik, L. J.: Inner filter correction of dissolved organic matter fluorescence, Limnol. Oceanogr. Methods, 11, 616–630, https://doi.org/10.4319/LOM.2013.11.616, 2013.
Kutscher, L., Mörth, C. M., Porcelli, D., Hirst, C., Maximov, T. C., Petrov, R. E., and Andersson, P. S.: Spatial variation in concentration and sources of organic carbon in the Lena River, Siberia, J. Geophys. Res.-Biogeo., 122, 1999–2016, https://doi.org/10.1002/2017JG003858, 2017.
Lara, R. J., Rachold, V., Kattner, G., Hubberten, H. W., Guggenberger, G., Skoog, A., and Thomas, D. N.: Dissolved organic matter and nutrients in the Lena River, Siberian Arctic: Characteristics and distribution, Mar. Chem., 59, 301–309, https://doi.org/10.1016/S0304-4203(97)00076-5, 1998.
Liu, S., Wang, P., Yu, J., Wang, T., Cai, H., Huang, Q., Pozdniakov, S. P., Zhang, Y., and Kazak, E. S.: Mechanisms behind the uneven increases in early, mid- and late winter streamflow across four Arctic river basins, J. Hydrol., 606, 127425, https://doi.org/10.1016/J.JHYDROL.2021.127425, 2022.
Lütjen, M., Overduin, P. P., Juhls, B., Boike, J., Morgenstern, A., and Meyer, H.: Drivers of winter ice formation on Arctic water bodies in the Lena Delta, Siberia, Arctic, Antarct. Alp. Res., 56, 2350546, https://doi.org/10.1080/15230430.2024.2350546, 2024.
Maie, N., Parish, K. J., Watanabe, A., Knicker, H., Benner, R., Abe, T., Kaiser, K., and Jaffé, R.: Chemical characteristics of dissolved organic nitrogen in an oligotrophic subtropical coastal ecosystem, Geochim. Cosmochim. Ac., 70, 4491–4506, https://doi.org/10.1016/J.GCA.2006.06.1554, 2006.
Mann, P. J., Strauss, J., Palmtag, J., Dowdy, K., Ogneva, O., Fuchs, M., Bedington, M., Torres, R., Polimene, L., Overduin, P., Mollenhauer, G., Grosse, G., Rachold, V., Sobczak, W. V., Spencer, R. G. M., and Juhls, B.: Degrading permafrost river catchments and their impact on Arctic Ocean nearshore processes, Ambio, 51, 439–455, https://doi.org/10.1007/S13280-021-01666-Z, 2022.
McKnight, D. M., Boyer, E. W., Westerhoff, P. K., Doran, P. T., Kulbe, T., and Andersen, D. T.: Spectrofluorometric characterization of dissolved organic matter for indication of precursor organic material and aromaticity, Limnol. Oceanogr., 46, 38–48, https://doi.org/10.4319/lo.2001.46.1.0038, 2001.
Meyer, H., Schönicke, L., Wand, U., Hubberten, H. W., and Friedrichsen, H.: Isotope studies of hydrogen and oxygen in ground ice – Experiences with the equilibration technique, Isotopes Environ. Health Stud., 36, 133–149, https://doi.org/10.1080/10256010008032939, 2000.
Mollenhauer, G., Grotheer, H., Gentz, T., Bonk, E., and Hefter, J.: Standard operation procedures and performance of the MICADAS radiocarbon laboratory at Alfred Wegener Institute (AWI), Germany, Nucl. Instruments Methods Phys. Res. Sect. B Beam Interact. with Mater. Atoms, 496, 45–51, https://doi.org/10.1016/J.NIMB.2021.03.016, 2021.
Murphy, K. R., Stedmon, C. A., Graeber, D., and Bro, R.: Fluorescence spectroscopy and multi-way techniques. PARAFAC, Anal. Methods-UK, 5, 6557–6566, https://doi.org/10.1039/c3ay41160e, 2013.
Obu, J., Westermann, S., Bartsch, A., Berdnikov, N., Christiansen, H. H., Dashtseren, A., Delaloye, R., Elberling, B., Etzelmüller, B., Kholodov, A., Khomutov, A., Kääb, A., Leibman, M. O., Lewkowicz, A. G., Panda, S. K., Romanovsky, V., Way, R. G., Westergaard-Nielsen, A., Wu, T., Yamkhin, J., and Zou, D.: Northern Hemisphere permafrost map based on TTOP modelling for 2000–2016 at 1 km2 scale, https://doi.org/10.1016/j.earscirev.2019.04.023, 2019.
Ogneva, O., Mollenhauer, G., Juhls, B., Sanders, T., Palmtag, J., Fuchs, M., Grotheer, H., Mann, P. J., and Strauss, J.: Particulate organic matter in the Lena River and its delta: from the permafrost catchment to the Arctic Ocean, Biogeosciences, 20, 1423–1441, https://doi.org/10.5194/bg-20-1423-2023, 2023.
Ohno, T.: Fluorescence inner-filtering correction for determining the humification index of dissolved organic matter, Environ. Sci. Technol., 36, 742–746, https://doi.org/10.1021/es0155276, 2002.
Opfergelt, S., Gaspard, F., Hirst, C., Monin, L., Bennet, J., Morgenstern, A., Michael, A., and Overduin, P. P.: Frazil ice changes winter biogeochemical processes in Arctic rivers, Comm. Earth Env., 5, 738, https://doi.org/10.1038/s43247-024-01884-9, 2024.
Overduin, P. P., Blender, F., Bolshiyanov, D., Grigoriev, M., Morgenstern, A., and Meyer, H.: Russian-German Cooperation: Expeditions to Siberia in 2016, in: Berichte zur Polar- und Meeresforschung = Reports on polar and marine research, vol. 709, Alfred-Wegener-Institut, Helmholtz-Zentrum für Polar- und Meeresforschung, https://doi.org/10.2312/BzPM_0709_2017, 2017.
Prokushkin, A. S., Korets, M. A., Panov, A. V., Prokushkina, M. P., Tokareva, I. V., Vorobyev, S. N., and Pokrovsky, O. S.: Carbon and nutrients in the Yenisei River tributaries draining the Western Siberia Peatlands, IOP Conf. Ser. Earth Environ. Sci., 232, 012010, https://doi.org/10.1088/1755-1315/232/1/012010, 2019.
Rachold, V., Alabyan, A., Hubberten, H.-W., Korotaev, V. N., and Zaitsev, A. A.: Sediment transport to the Laptev Sea-hydrology and geochemistry of the Lena River, Polar Res., 15, 183–196, https://doi.org/10.3402/polar.v15i2.6646, 1996.
Rantanen, M., Karpechko, A. Y., Lipponen, A., Nordling, K., Hyvärinen, O., Ruosteenoja, K., Vihma, T., and Laaksonen, A.: The Arctic has warmed nearly four times faster than the globe since 1979, Commun. Earth Environ. 2022 31, 168, https://doi.org/10.1038/s43247-022-00498-3, 2022.
Rawlins, M. A. and Karmalkar, A. V.: Regime shifts in Arctic terrestrial hydrology manifested from impacts of climate warming, The Cryosphere, 18, 1033–1052, https://doi.org/10.5194/tc-18-1033-2024, 2024.
Raymond, P. A., McClelland, J. W., Holmes, R. M., Zhulidov, A. V., Mull, K., Peterson, B. J., Striegl, R. G., Aiken, G. R., and Gurtovaya, T. Y.: Flux and age of dissolved organic carbon exported to the Arctic Ocean: A carbon isotopic study of the five largest arctic rivers, Global Biogeochem. Cy., 21, GB4011, https://doi.org/10.1029/2007GB002934, 2007.
Sanders, T., Fiencke, C., Fuchs, M., Haugk, C., Juhls, B., Mollenhauer, G., Ogneva, O., Overduin, P., Palmtag, J., Povazhniy, V., Strauss, J., Tuerena, R., Zell, N., and Dähnke, K.: Seasonal nitrogen fluxes of the Lena River Delta, Ambio, 51, 423–438, https://doi.org/10.1007/S13280-021-01665-0, 2022.
Semiletov, I. P., Pipko, I. I., Shakhova, N. E., Dudarev, O. V., Pugach, S. P., Charkin, A. N., McRoy, C. P., Kosmach, D., and Gustafsson, Ö.: Carbon transport by the Lena River from its headwaters to the Arctic Ocean, with emphasis on fluvial input of terrestrial particulate organic carbon vs. carbon transport by coastal erosion, Biogeosciences, 8, 2407–2426, https://doi.org/10.5194/bg-8-2407-2011, 2011.
Shiklomanov, A., Déry, S., Tretiakov, M., Yang, D., Magritsky, D., Georgiadi, A., and Tang, W.: River freshwater flux to the Arctic ocean, Arct. Hydrol. Permafr. Ecosyst., 703–738, https://doi.org/10.1007/978-3-030-50930-9_24, 2020.
Shiklomanov, A. I. and Lammers, R. B.: River ice responses to a warming Arctic – Recent evidence from Russian rivers, Environ. Res. Lett., 9, 035008, https://doi.org/10.1088/1748-9326/9/3/035008, 2014.
Starr, S. F., Frey, K. E., Smith, L. C., Kellerman, A. M., McKenna, A. M., and Spencer, R. G. M.: Peatlands Versus Permafrost: Landscape Features as Drivers of Dissolved Organic Matter Composition in West Siberian Rivers, J. Geophys. Res.-Biogeo., 129, e2023JG007797, https://doi.org/10.1029/2023JG007797, 2024.
Stuiver, M. and Polach, H. A.: Discussion Reporting of 14C Data, Radiocarbon, 19, 355–363, https://doi.org/10.1017/S0033822200003672, 1977.
Sun, S., Meyer, V. D., Dolman, A. M., Winterfeld, M., Hefter, J., Dummann, W., McIntyre, C., Montluçon, D. B., Haghipour, N., Wacker, L., Gentz, T., Van Der Voort, T. S., Eglinton, T. I., and Mollenhauer, G.: 14C Blank Assessment in Small-Scale Compound-Specific Radiocarbon Analysis of Lipid Biomarkers and Lignin Phenols, Radiocarbon, 62, 207–218, https://doi.org/10.1017/RDC.2019.108, 2020.
Tananaev, N. and Lotsari, E.: Defrosting northern catchments: Fluvial effects of permafrost degradation, Earth-Science Rev., 228, 103996, https://doi.org/10.1016/J.EARSCIREV.2022.103996, 2022.
Tananaev, N. I., Makarieva, O. M., and Lebedeva, L. S.: Trends in annual and extreme flows in the Lena River basin, Northern Eurasia, Geophys. Res. Lett., 43, 10764–10772, https://doi.org/10.1002/2016GL070796, 2016.
Tank, S. E., McClelland, J. W., Spencer, R. G. M., Shiklomanov, A. I., Suslova, A., Moatar, F., Amon, R. M. W., Cooper, L. W., Elias, G., Gordeev, V. V., Guay, C., Gurtovaya, T. Y., Kosmenko, L. S., Mutter, E. A., Peterson, B. J., Peucker-Ehrenbrink, B., Raymond, P. A., Schuster, P. F., Scott, L., Staples, R., Striegl, R. G., Tretiakov, M., Zhulidov, A. V., Zimov, N., Zimov, S., and Holmes, R. M.: Recent trends in the chemistry of major northern rivers signal widespread Arctic change, Nat. Geosci., 169, 789–796, https://doi.org/10.1038/s41561-023-01247-7, 2023.
Terhaar, J., Lauerwald, R., Regnier, P., Gruber, N., and Bopp, L.: Around one third of current Arctic Ocean primary production sustained by rivers and coastal erosion, Nat. Commun., 121, 169, https://doi.org/10.1038/s41467-020-20470-z, 2021.
The Arctic Great Rivers Observatory: Water Quality Dataset, Version 20241020, The Arctic Great Rivers Observatory [data set], https://www.arcticgreatrivers.org/data, last access: 2024.
Vonk, J. E., Tank, S. E., and Walvoord, M. A.: Integrating hydrology and biogeochemistry across frozen landscapes, 10, 5377, https://doi.org/10.1038/s41467-019-13361-5, 2019.
Wacker, L., Christl, M., and Synal, H. A.: Bats: A new tool for AMS data reduction, Nucl. Instrum. Meth. B,, 268, 976–979, https://doi.org/10.1016/j.nimb.2009.10.078, 2010.
Wacker, L., Fahrni, S. M., Hajdas, I., Molnar, M., Synal, H. A., Szidat, S., and Zhang, Y. L.: A versatile gas interface for routine radiocarbon analysis with a gas ion source, Nucl. Instrum. Meth. B, 294, 315–319, https://doi.org/10.1016/J.NIMB.2012.02.009, 2013.
Weishaar, J. L., Aiken, G. R., Bergamaschi, B. A., Fram, M. S., Roger, F., and Mopper, K.: Evaluation of Specific Ultraviolet Absorbance as an Indicator of the Chemical Composition and Reactivity of Dissolved Organic Carbon, 37, 4702–4708, https://doi.org/10.1021/ES030360X, 2003.
Weiss, J.: Ionenchromatographie, Wiley, https://doi.org/10.1002/9783527625031, 2001.
Wild, B., Andersson, A., Bröder, L., Vonk, J., Hugelius, G., McClelland, J. W., Song, W., Raymond, P. A., and Gustafsson, Ö.: Rivers across the Siberian Arctic unearth the patterns of carbon release from thawing permafrost, Proc. Natl. Acad. Sci. USA, 116, 10280–10285, https://doi.org/10.1073/pnas.1811797116, 2019.
Winterfeld, M., Laepple, T., and Mollenhauer, G.: Characterization of particulate organic matter in the Lena River delta and adjacent nearshore zone, NE Siberia – Part I: Radiocarbon inventories, Biogeosciences, 12, 3769–3788, https://doi.org/10.5194/bg-12-3769-2015, 2015.
Wünsch, U. J., Murphy, K. R., and Stedmon, C. A.: Fluorescence quantum yields of natural organic matter and organic compounds: Implications for the fluorescence-based interpretation of organic matter composition, Front. Mar. Sci., 2, 98, https://doi.org/10.3389/FMARS.2015.00098, 2015.
Yang, D., Kane, D. L., Hinzman, L. D., Zhang, X., Zhang, T., and Ye, H.: Siberian Lena River hydrologic regime and recent change, J. Geophys. Res. Atmos., 107, ACL 14-1–ACL 14-10, https://doi.org/10.1029/2002JD002542, 2002.
Zsolnay, Á.: Dissolved organic matter: artefacts, definitions, and functions, Geoderma, 113, 187–209, https://doi.org/10.1016/S0016-7061(02)00361-0, 2003.
Zsolnay, A., Baigar, E., Jimenez, M., Steinweg, B., and Saccomandi, F.: Differentiating with fluorescence spectroscopy the sources of dissolved organic matter in soils subjected to drying, Chemosphere, 38, 45–50, https://doi.org/10.1016/S0045-6535(98)00166-0, 1999.


