the Creative Commons Attribution 4.0 License.
the Creative Commons Attribution 4.0 License.
 | 05 Feb 2024
A 12-year-long (2010–2021) hydrological and biogeochemical dataset in the Sicily Channel (Mediterranean Sea)
Francesco Placenti
Katrin Schroeder
Mireno Borghini
Gabriella Cerrati
Angela Cuttitta
Vincenzo Tancredi
Carmelo Buscaino
Bernardo Patti
The dataset presented here consists of 273 conductivity–temperature–depth (CTD) stations, as well as 2034 sampled data points in the water column, where dissolved inorganic nutrients have been measured, that were collected during 12 summer oceanographic cruises (BANSIC series) in the Sicily Channel (central Mediterranean Sea) between 2010 and 2021. The quality of the CTD dataset is ensured by regular sensor calibrations and an accurate control process adopted during the acquisition, processing, and post-processing phases. The quality of the biogeochemical dataset is ensured by the adoption of best-practice analytical and sampling methods. This data collection fills a gap of information in the Sicily Channel, i.e., a key area where complex water mass exchange processes involve the transfer of physical and biogeochemical properties between the eastern and western Mediterranean. The available dataset will be useful to evaluate the long-term variability on a wide spatial scale, supporting studies on the evolution of the Mediterranean circulation and its peculiar biogeochemistry, as well as on the physical and biogeochemical modeling of this area. The data are available in Zenodo (https://doi.org/10.5281/zenodo.8125006, Placenti et al., 2023).
- Article
(3880 KB) - Full-text XML
- BibTeX
- EndNote


The thermohaline circulation in the Mediterranean Sea (MS) is anti-estuarine and driven by the negative freshwater budget and the net heat loss over the whole basin. The Mediterranean thermohaline circulation drives the transport of water masses and biogeochemical elements in the different basins (eastern and western) and, via the Strait of Gibraltar, controls exchanges with the Atlantic Ocean (The MerMex Group, 2011).
The Sicily Channel (SC), due to its particular bathymetric structure and geographic position, also plays a key role in modulating the eastward transport of fresher and superficial Atlantic Water (AW) and the underlying westward transport of salty Intermediate Water (IW), which forms in the eastern Mediterranean and is called Levantine Intermediate Water (LIW) or Cretan Intermediate Water (CIW), depending on the specific formation location (Levantine or Cretan Sea) (Schroeder et al., 2017). From its formation area IW spreads westward into the Ionian Sea (IS), with a significant flow northward towards the Adriatic Sea, where it constitutes an important preconditioning agent for the formation of the Adriatic Deep Water (which forms the bulk of the eastern Mediterranean deep water, e.g., Gačić et al., 2013). When reaching the western Mediterranean, in particular its northern part, the IW also preconditions the water column there and makes it prone to the formation of western Mediterranean deep water (e.g., Roether et al., 1996). Although the area of the SC is limited to the east and west by two relatively shallow sills (max depths of 350 and 550 m, respectively), in its central part the bottom depth can reach 1700 m. It is in this deep central trench where, e.g., Gasparini et al. (2005) and others studied the evolution of the upper part of the eastern Mediterranean deep water (or transitional eastern Mediterranean deep water) over time, being able to cross the SC and reach the Tyrrhenian Sea along with the IW flow. Several authors, analyzing long time series of temperature and salinity of the deeper waters of the SC, have highlighted a general positive trend albeit characterized by phases of accelerations and multiannual peaks and fluctuations (Gasparini et al., 2005; Gačić et al., 2013; Bonanno et al., 2014; Ben Ismail et al., 2014; Schroeder et al., 2017; Placenti et al., 2022). Furthermore, these trends are significantly faster than those reported for the global ocean intermediate layer (Borghini et al., 2014; Schroeder et al., 2017). In fact, the semi-enclosed nature of the MS, together with its smaller inertia due to the relative short residence time of its water masses, makes it more sensitive to natural variations in fluxes (between, e.g., the air and sea, freshwater and the sea) and water flows, identifying it as a “hotspot” for climate change. Consequently, MS is expected to experience environmental impacts that are considerably greater than those in many other places around the world (The MerMex Group, 2011). As regards the peaks, trends, and multiannual fluctuations of temperature and salinity observed in the deeper water of the SC, they are probably ascribable to different processes acting at different spatial and temporal scales, such as the passage of the signature of the Eastern Mediterranean Transient (EMT) (Gasparini et al., 2005), the alternation of circulation phases (cyclonic–anticyclonic) of the Northern Ionian Gyre (NIG) (Gačić et al., 2013; Bonanno et al., 2014; Placenti et al., 2022) and the effects related to warming of the eastern Mediterranean (Schroeder et al., 2017, 2019).
The anti-estuarine circulation, jointly with the superposition of different timescales of variability, intense wintertime atmospheric forcings, NIG reversals, and EMT, also acts on the distribution of biogeochemical elements (e.g., inorganic nutrients) and productivity of the MS. The very low productivity of the MS is therefore mainly linked to both the anti-estuarine circulation (Krom et al., 2010) and the chemical speciation of dissolved P and N. They in fact reflect a switch from less bioavailable chemical forms of P and N entering the Mediterranean Sea to more bioavailable forms leaving it (Powley et al., 2017). Moreover, the export of nutrients through the IW causes the deep waters of the eastern Mediterranean Sea to be more nutrient-depleted than deep water in all other parts of the global ocean (Krom et al., 2005). Another peculiarity still debated is the higher molar NO3:PO4 ratio in the deeper water of the MS compared to the “classical” world ocean Redfield ratio (Redfield et al., 1963), indicating a general P-limited regime, which becomes stronger along a west-to-east gradient (Belgacem et al., 2020). In this context, the aim of this paper is to compile a large dataset of hydrological (temperature, salinity, and pressure) and biogeochemical (nitrate, phosphate, and silicate) properties from in situ data collected between 2010 and 2021 in the SC, filling a gap of information in a key area of the MS, where the exchange between the two basins takes place. The available dataset is a valuable tool in support of the evaluation of the long-term variability and evolution of the Mediterranean circulation and water masses, and it also provides a useful contribution for the implementation of models aimed at describing the physical–chemical processes occurring in this area. The dataset could also be integrated into the recently published climatology of dissolved inorganic nutrients (Belgacem et al., 2020) to expand its geographic domain.
The hydrological and biogeochemical data collection was carried out as part of an ichthyoplankton monitoring and research program implemented by the Italian National Research Council (CNR). This program was set up with the primary purpose of monitoring the spatiotemporal distribution of the early life stages of European anchovy (Engraulis encrasicolus) in the SC and of studying its relationship with the environmental variables, in support of the sustainable exploitation of the population by local fisheries. In this context, since 1998 ichthyoplankton oceanographic surveys based on a common sampling grid have been annually carried out during the summer period in the SC within FAO geographic subareas (GSAs) 13, 15, and 16. Since 2010, in addition to the mesozooplankton sampling, water sampling for the quantification of macro-nutrients has been included in the survey work plan in order to better characterize the biogeochemical characteristics of the water column and study the relationships with the biotic component.
The dataset presented here results from this sampling effort and assembles information from 12 summer oceanographic cruises conducted on board different research vessels from 2010 to 2021 (R/V Urania from 2010 to 2014; R/V Minerva Uno from 2015 to 2017; R/V G. Dallaporta from 2018 to 2021). Data were integrated into a dataset consisting of 273 CTD nutrient stations and 2034 data points. The stations are arranged along inshore–offshore transects approximately sub-perpendicular to the Sicilian coast, aiming at characterizing the oceanographic and biogeochemical features in a key area for the understanding of the complex exchange processes between the eastern and western basins (Fig. 1).
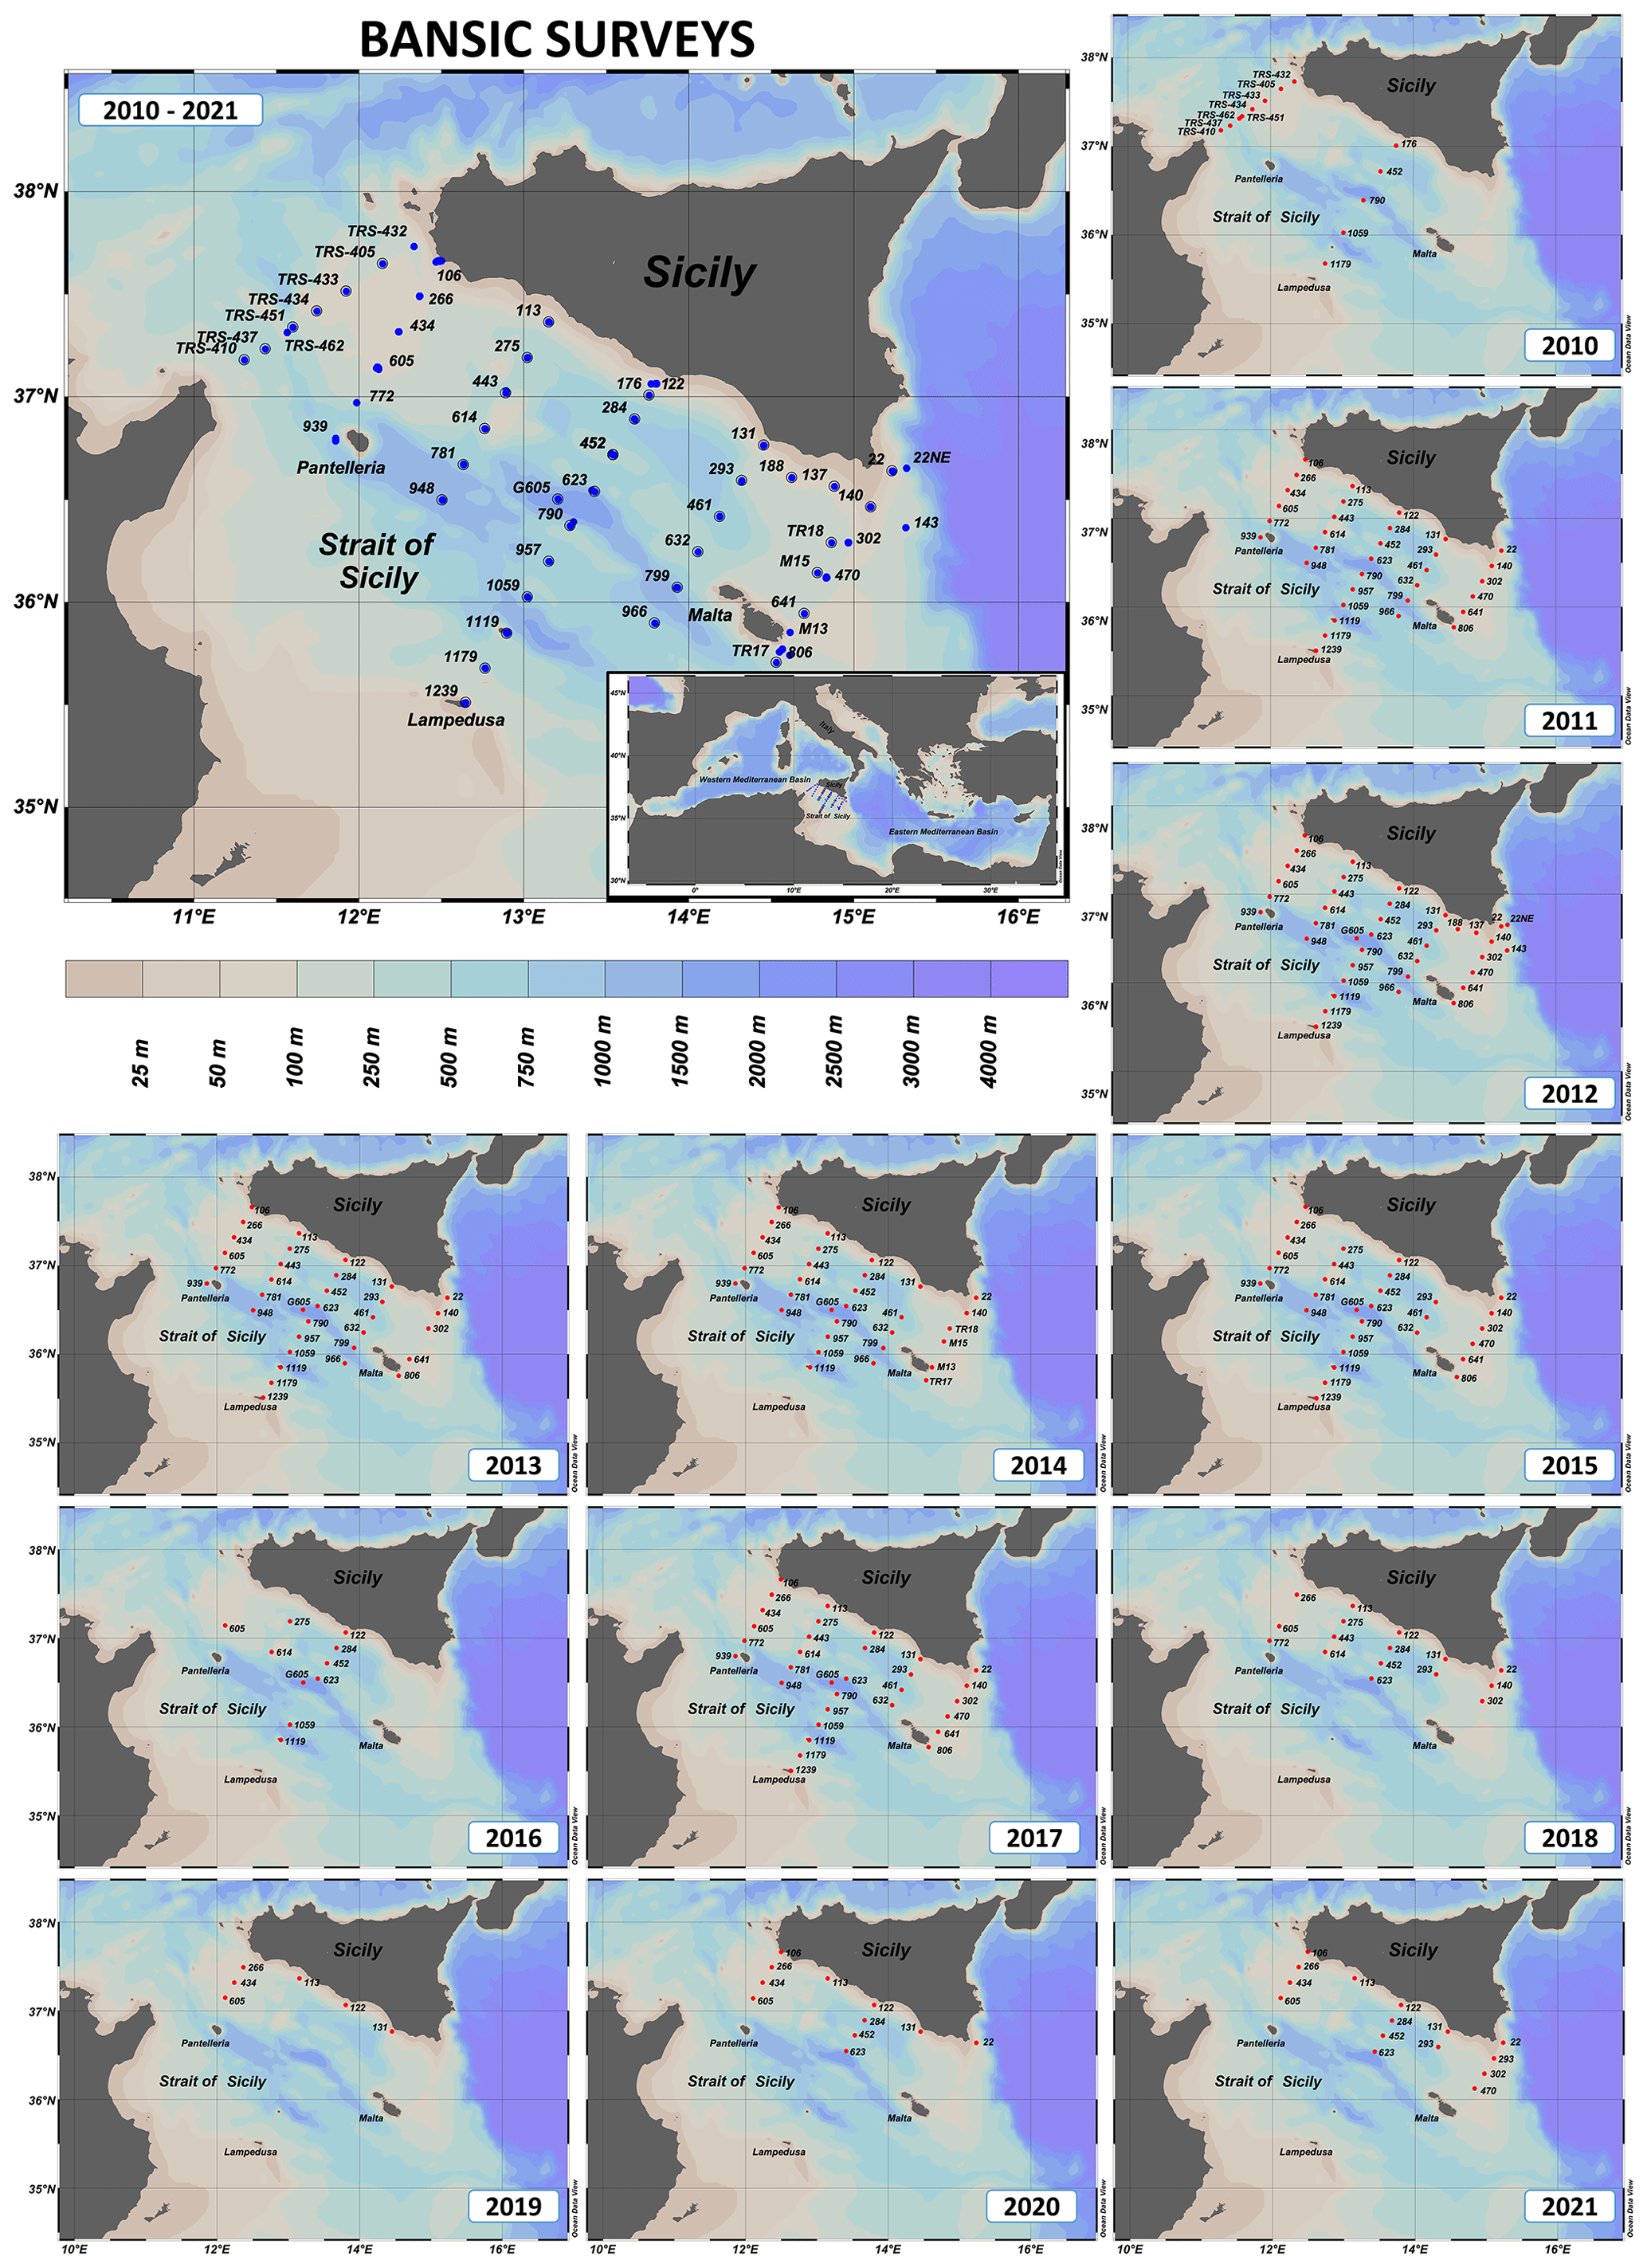
Figure 1Station map of the BANSIC cruises, carried out in the Sicily Channel or Strait of Sicily from 2010 to 2021: CTD and nutrient stations are indicated by blue (in the general map) and red circles (in the yearly maps). The maps were created using Ocean Data View software (Schlitzer, 2021).
2.1 Hydrological data acquisition
At all stations, pressure, salinity, and temperature were measured with a CTD (conductivity, temperature, and depth) probe (Sea-Bird Scientific) model SBE 911plus and a General Oceanics rosette with 24 Niskin bottles of 12 L capacity. Temperature measurements were performed with an SBE-3/F thermometer with a resolution of 0.00015 ∘C per bit at −1 or 0.00018 ∘C per bit at 31 ∘C and accuracy of ±0.001 ∘C. The conductivity measurements were performed with an SBE-4C sensor with a resolution of 0.00004 S m−1 and accuracy of 0.0003 S m−1, while for the salinity the accuracy is 0.002. The vertical profiles of all parameters were obtained by sampling the signals at 24 Hz, with the CTD and rosette going down at a speed of 1 m s−1. The rosette is equipped with a sonar altimeter which intercepted the bottom 100–70 m before getting to it. The altimeter is used just for safety to prevent the rosette from touching the bottom.
2.2 Inorganic nutrient data collection
Seawater samples for dissolved inorganic nutrient analysis were collected from the surface to the bottom by means of Niskin bottles. In particular, during the CTD upcast, a variable number of water samples, at selected standard depth, have been considered (surface–25 m–50 m–75 m–100 m–150 m–200 m–300 m–400 m–500 m–600 m–700 m–800 m–900 m–1000 m–bottom) with slight modifications in the upper layer where significant hydrological variability is typical. All materials used for water sampling on board were conditioned earlier with 10 % HCl and rinsed three times with ultrapure water. Unfiltered samples were stored on board at −20 ∘C.
2.3 Analytical methods for inorganic nutrients
For all cruises, nutrient determination (nitrate, silicate, and phosphate) was carried out following standard colorimetric methods of seawater analysis, defined by Grasshoff et al. (1999) and Hansen and Koroleff (1999) adapted to an automated system. Specifically, the determination of phosphate is based on the colorimetric method, in which a blue color is formed by the reaction of phosphate, the molybdate ion, and the antimony ion, followed by reduction with ascorbic acid. The reduced blue phospho-molybdenum complex is read at 880 nm. Inorganic nitrate is reduced to nitrite at pH 8 in a copperized cadmium reduction coil that reacts with an aromatic amine, leading to the final formation of the azo dye measured at 550 nm. Then, the nitrite that is separately determined must be subtracted from the total amount measured to get the nitrate concentration only. The determination of soluble silicates is based on the reduction of a silico-molybdate complex in acid solution to molybdenum blue by ascorbic acid, and the absorbance is measured at 820 nm.
All the analyses of dissolved inorganic nutrients were carried out immediately after each oceanographic cruise in the nutrient laboratory of the Institute for the Study of Anthropic Impacts and Sustainability in the Marine Environment (CNR-IAS) in Capo Granitola using the same analytical instrument and the same scientific staff. The concentration (µmol L−1) of nitrate, silicate, and phosphate was measured by means of a Sial auto-analyzer: QUAATRO. The detection limits for nitrates, silicates, and phosphates were 0.02, 0.01, and 0.006 µmol L−1, respectively. Despite the use of the same analytical methods, instruments, and scientific staff supporting the repeatability and comparison of the measurements, in order to further validate the analytical data, selected seawater samples (sampled in duplicate) were sent to the nutrient laboratory of the Research Center (ENEA) of Santa Teresa (La Spezia), taking advantage of their participation in the framework of the European intercalibration program QUASIMEME (Quality Assurance of Information for Marine Environmental Monitoring in Europe).
The differences in concentrations for all parameters analyzed (nitrates, phosphates, and silicates) ranged from 3 % to 20 %. The differences were greater (10 %–20 %) for concentration values close to the instrumental detection limit and smaller (<10 %) at high concentrations. This range of differences is perfectly acceptable considering that ENEA uses a previous-generation auto-analyzer and that the scientific staff was different. However, we would like to point out that, in both nutrient laboratories, the chemical analyses were carried out using both the same analytical methods and the same types of reagents.
2.4 Quality check of hydrological and nutrient data
The temperature and salinity of the CTD have been regularly calibrated. During two cruises, redundant temperature and salinity sensors were also used. When they were available, the secondary sensors were used to assess the stability of the primary ones.
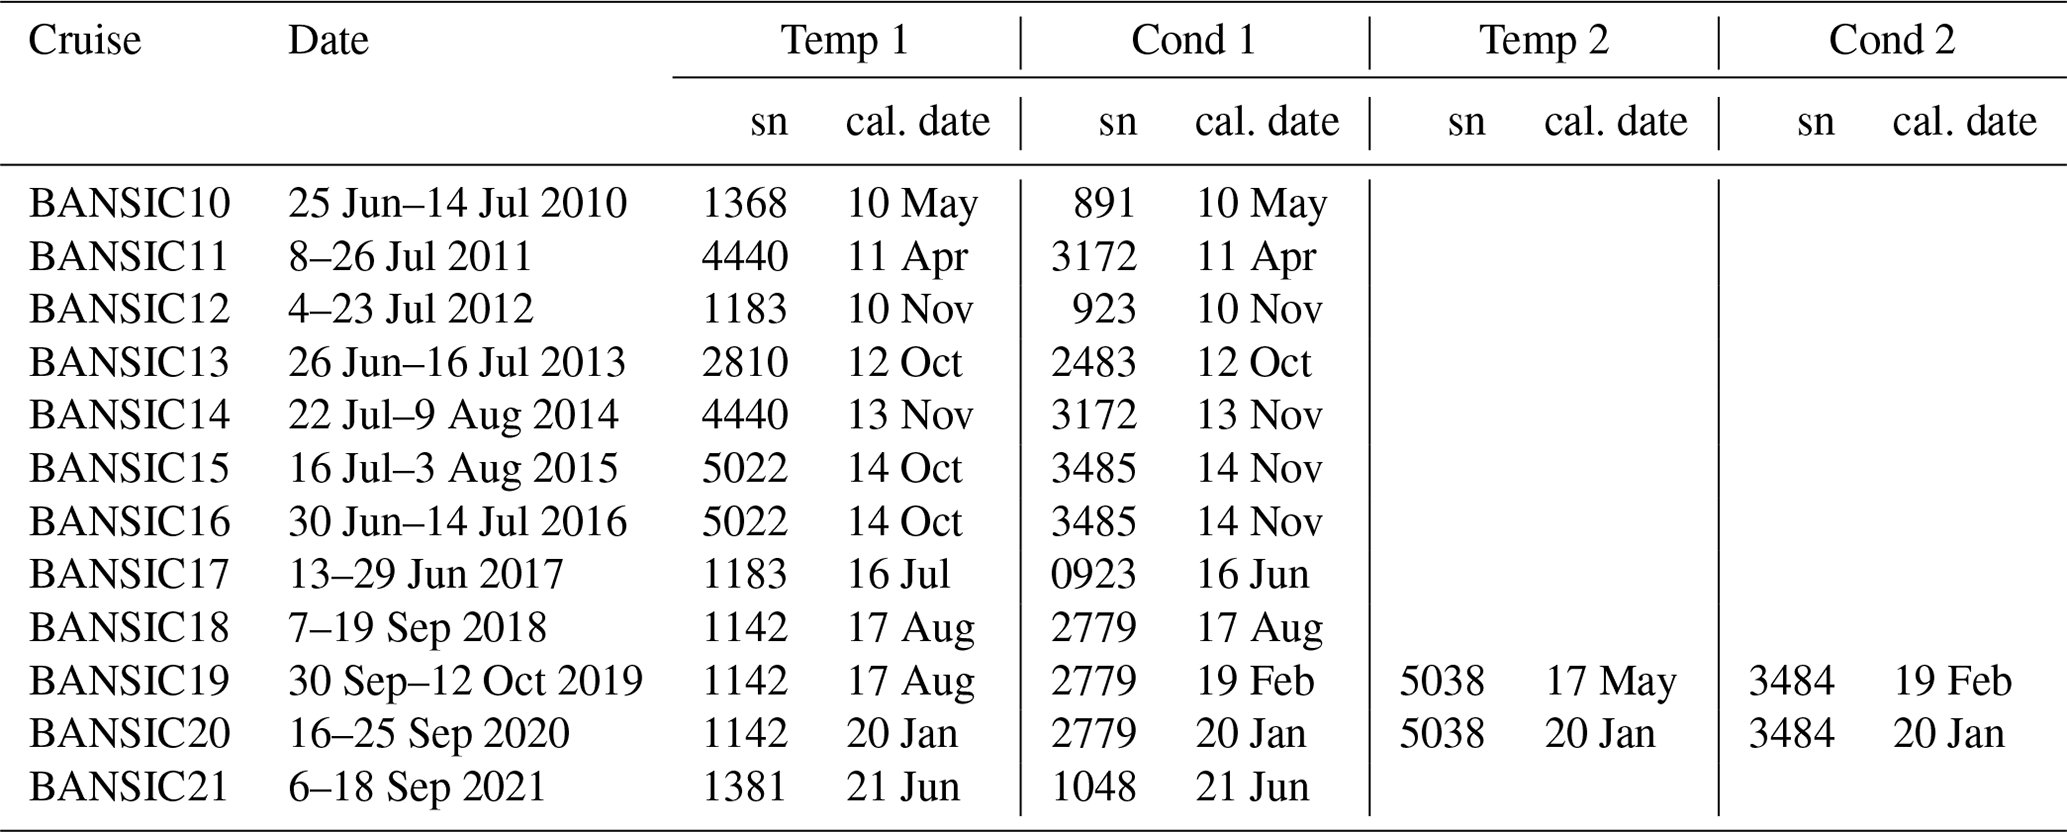
The temperature and salinity sensors calibrations have been performed before each cruise by CNR technicians at the NATO Centre for Underwater Research (NURC, now Centre for Maritime Research and Experimentation, CMRE) in La Spezia (Italy) until 2016. Between 2017 and 2018 sensors were send to the manufacturer, while since 2019 the calibration is done at the new CNR-ISMAR calibration laboratory in La Spezia (Italy). Table 1 shows a summary of all sensors, their serial numbers and their calibration dates.
Table 1Calibration dates and serial numbers of the CTD sensors used during oceanographic cruises.
After their acquisition, CTD data were pre-processed by the SBE Data Processing™ software in order to (i) convert the raw data (.hex) to engineering units and store them in a text file (.cnv), (ii) run a low-pass filter on the data and smooth high-frequency data, (iii) align parameter data in time relative to pressure (to ensure that calculations of salinity and other parameters are made using measurements from the same parcel of water), (iv) remove conductivity cell thermal mass effects from the measured conductivity, (v) compute derived variables, and (vi) average data using averaging intervals based on depth range, then split the file into an upcast and a downcast file.
Following the recommendations of the SeaDataNet QC guidelines (SeaDataNet, 2010), the subsequent procedure to assess data quality was based on the following list.
-
Check header details (vessel, cruise number, station numbers, date/time, latitude/longitude – start and end, instrument number and type, station depth, cast – up or down, data type/no. of data points)
-
Plot station positions to check not on land
-
Check ship speed between stations to look for incorrect position or date/time
-
Automatic range checking of each parameter
-
Check units of parameters supplied
-
Check pressure increasing
-
Check no data points below bottom depth
-
Plot profiles (individually, in groups, etc.)
-
Check for spikes
-
Check for vertical stability/inversions
-
Plot temperature vs. salinity
After the data acquisition, a post-processing control has been applied to the hydrological and nutrient data acquired in the single survey as follows. After an initial visual inspection aimed at removing any spike from the data profiles, an automatic control was carried out in the R environment in order to identify potential outliers. In particular, taking into account three layers (0–150, 151–500, and >500 m), potential outliers have been defined as values falling outside the range of the mean ±3 standard deviation calculated in the relevant layer. Then, each potential outlier has been visually double-checked within the recorded profiles in order to be validated or eliminated from the dataset.
Finally, with the aim of evaluating the consistency of the dataset collected in the 2010–2021 annual surveys and performing a comparative control of the occurring patterns among years, the mean value and the coefficient of variation (CV), i.e., a normalized measure of the dispersion given by the ratio of the standard deviation to the mean, of hydrological and nutrient parameters were calculated separately for each survey and for every identified water mass (Table 2). In this context, based on the annual θ S diagrams (as a whole reported in Fig. 2h), three water masses were identified in the study area and are schematized below: a surface layer approximately 150 m thick that is variable over the years and occupied mainly by AW, an intermediate layer (200–500 m) mainly occupied by IW, and a deeper layer (>500 m) occupied by the upper part of the Deep Water (DW).
An analysis was conducted in order to characterize the spatial–temporal trends emerging in the dataset and compare them with the state of the art concerning the study area. In this framework, the vertical distribution pattern of inorganic nutrients in the water column of the SC highlights low concentration values and high variability (Fig. 2; Table 2).
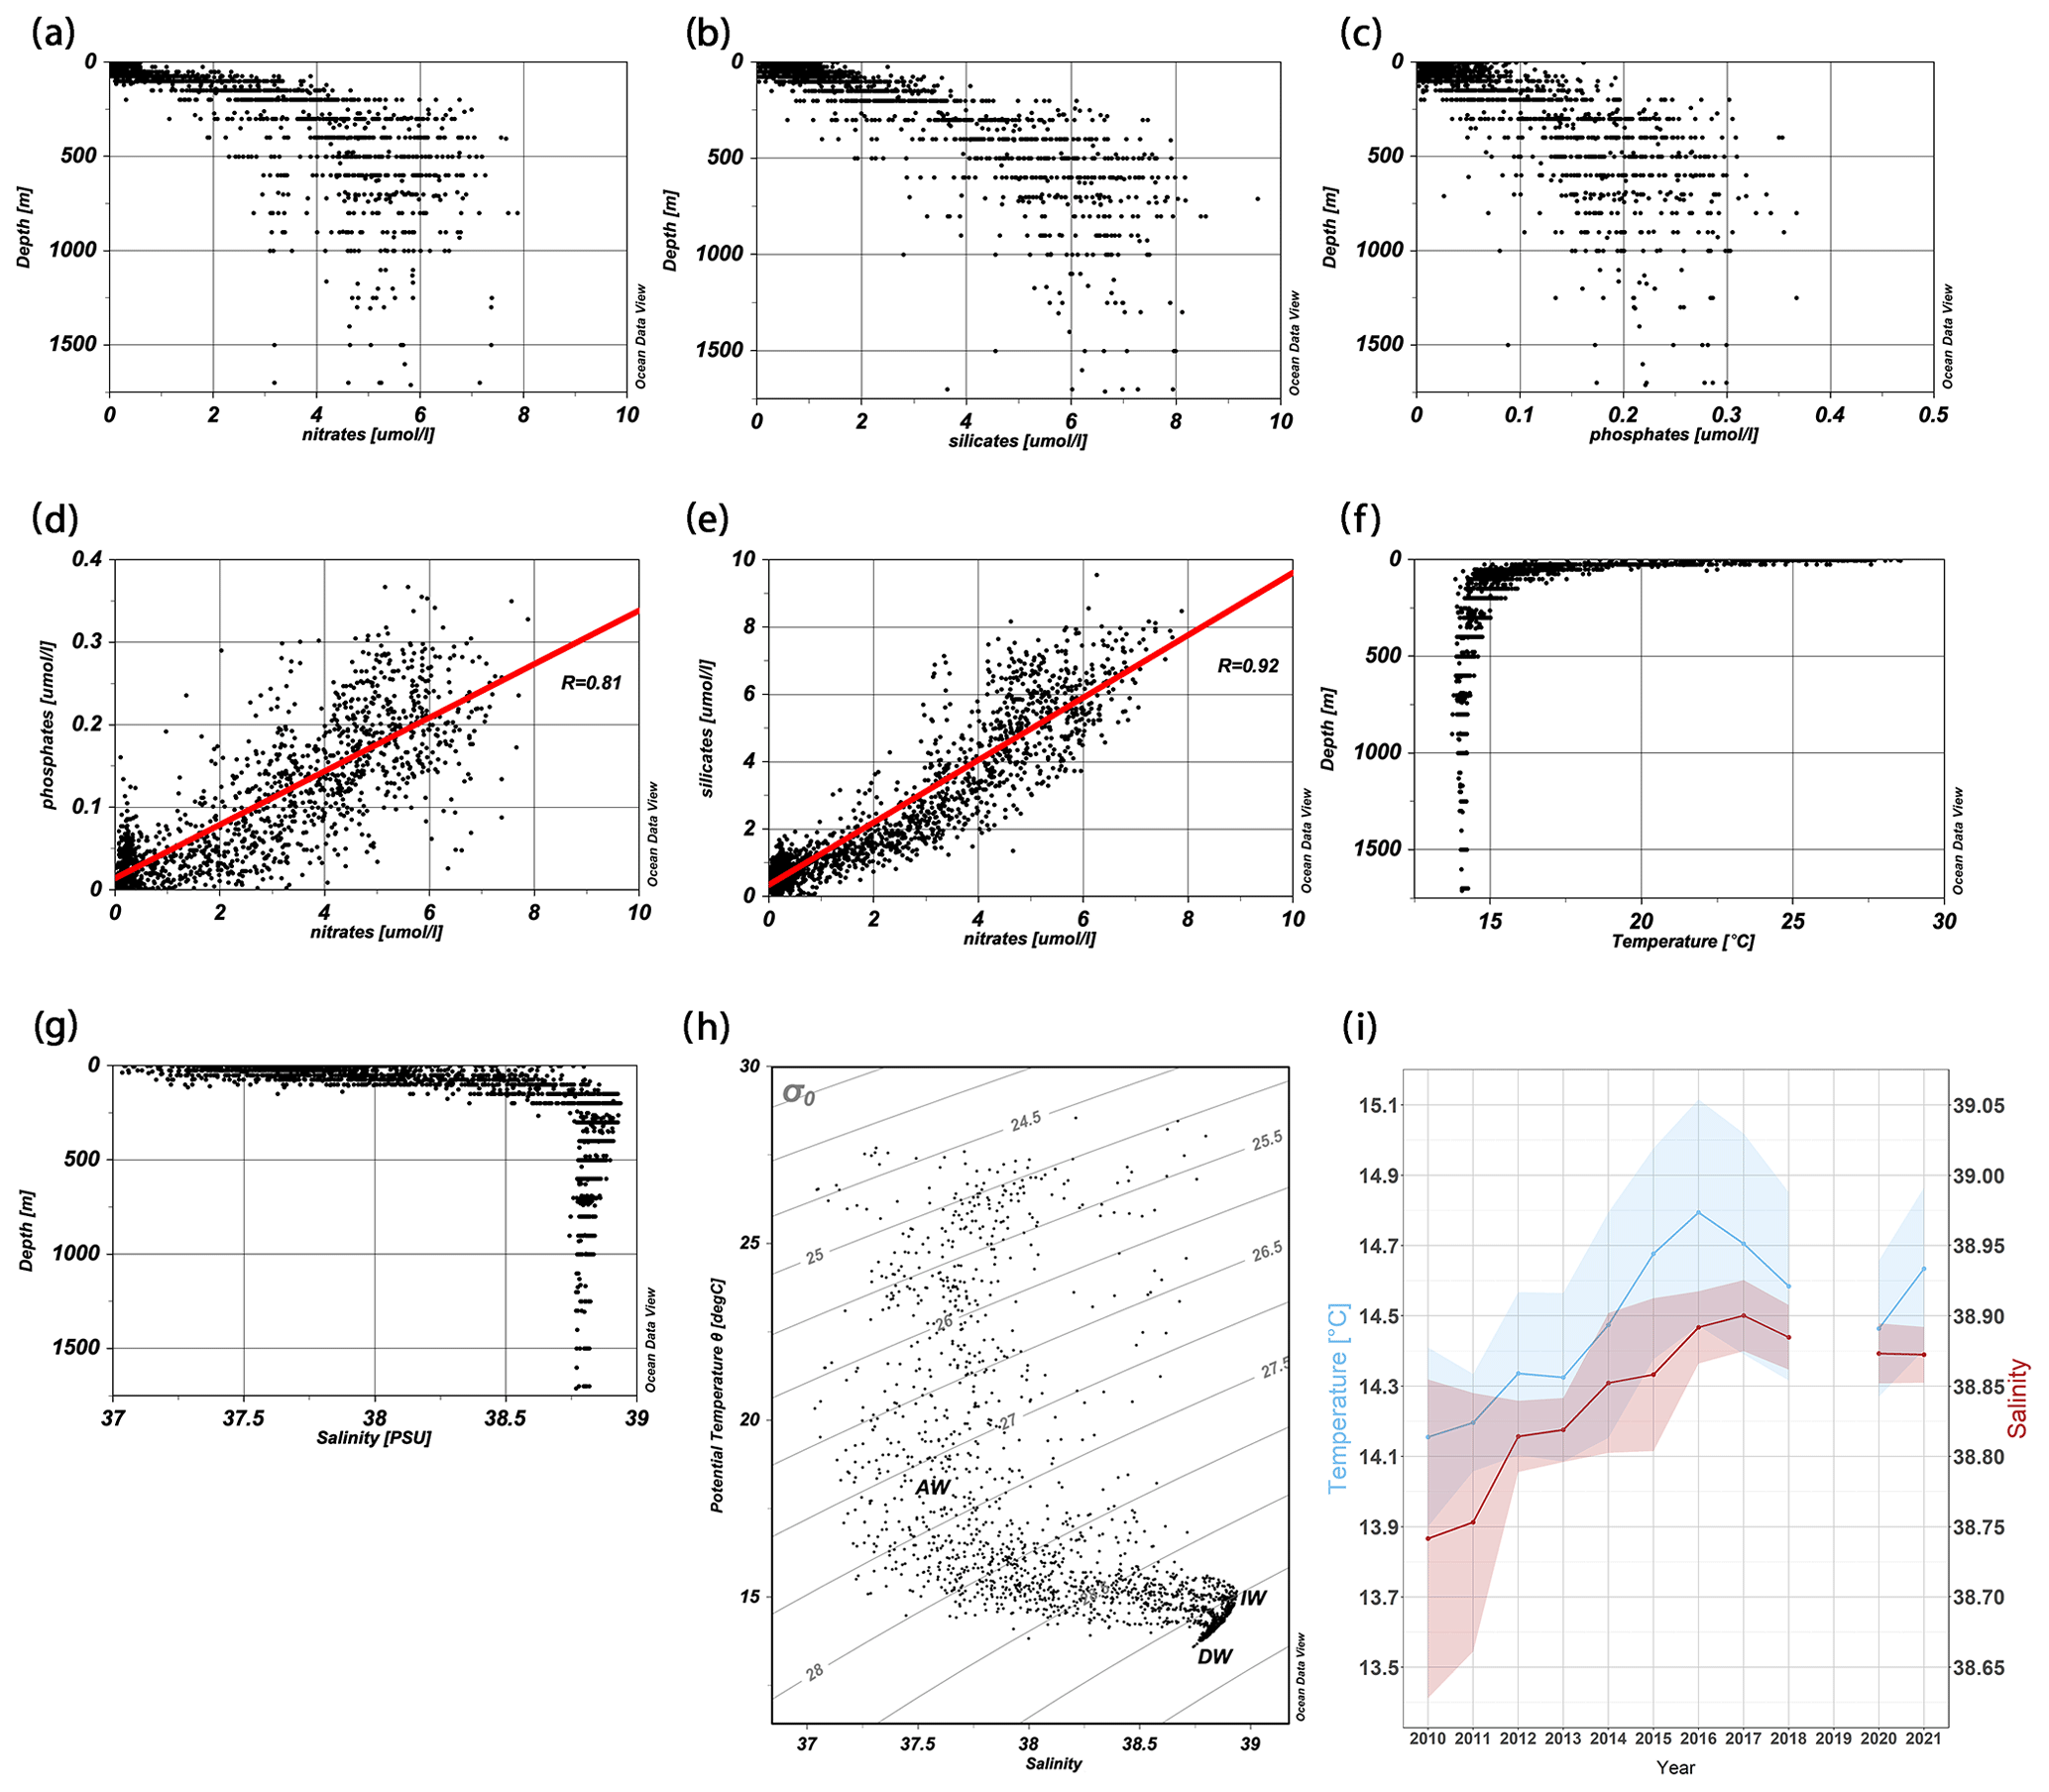
Figure 2Plots of data on nutrient concentrations at selected standard depths along the water column for (a) nitrates, (b) silicates, (c) phosphates, (d) N:P, and (e) N:Si diagrams as well as related linear regression lines (in red). (f) Plots of hydrological data at selected standard depths along the water column for temperature and (g) salinity, as well as a (h) potential temperature vs. salinity diagram related to the 2010–2021 period (AW for Atlantic Water, IW for Intermediate Water, and DW for upper Deep Water). (i) Time series of annual average values (2010–2021) of temperature (blue line) and salinity (red line) related to the water sampling depths in the IW (200–500 m). The related colored areas represent the standard deviations.
In surface waters the concentration values of inorganic nutrients are close to the instrumental detection limits due to the typical consumption of phytoplankton during the summer period occurring in this layer. This usually results in considerably lower values compared to patterns observed in the underlying layers (Table 2). Moreover, the depth layer 0–150 m is characterized by a higher CV due to the pronounced dynamism of the exchange processes affecting the marine ecosystem in this upper part of the water column as well as the interaction with terrestrial sources of nutrients. Specifically, the lowest mean nitrate concentration value of 0.302 µmol L−1 was measured in the BANSIC19 survey, characterized by a quite low number of water samples collected from continental shelf stations only (no data from the intermediate layer are available from 2019 survey), while the highest concentration value of 1.027 µmol L−1 was measured in the BANSIC14 survey (Table 2). Regarding the phosphates the lowest mean concentration value was 0.030 µmol L−1 (BANSIC12) and the highest one 0.064 µmol L−1 (BANSIC13), while for silicates the mean concentration values ranged from a minimum of 0.608 µmol L−1 (BANSIC15) to a maximum of 1.173 µmol L−1 (BANSIC10) (Table 2). The lower sampling effort carried out in BANSIC19 also corresponds to a lower variation of nitrates and phosphates compared to the other surveys, while the silicates showed more homogeneous patterns among surveys. Specifically, in the superficial layer CV varied between 0.762 (BANSIC19) and 1.566 (BANSIC20) for nitrates, between 0.471 (BANSIC19) and 1.333 (BANSIC21) for phosphates, and finally between 0.433 (BANSIC20) and 0.83 (BANSIC15) for silicates.
The inorganic nutrients are continuously consumed by phytoplankton at the sea surface and regenerated in the mesopelagic layer by bacteria, increasing the nutrient concentrations in the deeper water masses over time (e.g., Belgacem et al., 2020). In this way, the intermediate waters of the SC are characterized by higher nutrient concentration values than the overlying layer and lower variability (Fig. 2a–c and Table 2). Specifically, mean concentration values in the intermediate waters ranged from 2.976 µmol L−1 in BANSIC15 to 5.4 µmol L−1 in BANSIC11 for nitrates, from 2.589 µmol L−1 (BANSIC15) to 4.86 µmol L−1 (BANSIC11) for silicates, and from 0.095 µmol L−1 in BANSIC18 to 0.204 µmol L−1 in 2021 for phosphates (Table 2).
Regarding the dispersion of the values in this layer, nitrate CV ranged between 0.068 (BANSIC20) and 0.402 (BANSIC15), phosphate CV ranged between 0.171 (BANSIC20) and 0.585 (BANSIC16), and silicate CV ranged between 0.161 (BANSIC20) and 0.528 (BANSIC15) (Table 2).
In the trench of the SC, the deep layer (see section >500 m to the bottom, Table 2) is characterized by mean concentration values more homogeneous over years than in the above layers. There, the lowest mean concentration values for nitrates and silicates (4.13 and 4.701 µmol L−1) were measured in BANSIC15, while the lowest value for phosphates (0.097 µmol L−1) was measured during BANSIC10. The highest mean values of nitrates (5.861 µmol L−1), phosphates (0.241 µmol L−1), and silicates (6.474 µmol L−1) were respectively measured during BANSIC11, BANSIC17–21, and BANSIC13. Similarly, the deep layer is characterized by the lowest variability in nutrient concentrations. Indeed, the nitrate CV varied between 0.0058 (BANSIC10) and 0.299 (BANSIC21), between 0.07 (BANSIC20) and 0.339 (BANSIC10) for the phosphates, and between 0.029 (BANSIC20) and 0.277 (BANSIC15) for the silicates.
The molar ratios of nitrate : phosphate (N:P) and silicate : nitrate (Si:N) in the whole water column of the SC show high correlation coefficients (R=0.81 and 0.92, respectively) (Fig. 2d, e). Specifically, in the surface layer (0–150 m) the mean values of N:P and Si:N over the period 2010–2021 are equal to 18 and 1.4, respectively, which become 31 and 0.9 in the intermediate layer (200–500 m) and 29 and 1.1 in the deep layer (500 m–bottom), in agreement with Ribera D'Alcalà et al. (2003) and with Placenti et al. (2013, 2022). Observed N:P values are higher than the classical Redfield ratio (16:1). The high N:P ratio can result from either a decrease in phosphate or an increase in nitrate; however, the reason for this anomaly is still unclear (e.g., Schroeder et al., 2010). Among the various hypotheses, we agree about the possible role of external inputs, together with very limited denitrification (Krom et al., 2010; Huertas et al., 2012; Van Cappellen et al., 2014), in explaining the very high observed NO3:PO4 ratios in the deeper water (Powley et al., 2017).
Table 2Average values of concentrations and coefficients of variation (CVs) for both physical (temperature and salinity) and chemical (nitrates, phosphates, and silicates) parameters in the 12 oceanographic surveys carried out yearly over the period 2010–2021 reported in this paper, by depth layer (superficial 0–150 m, intermediate 200–500 m, and deep >500 m–bottom).
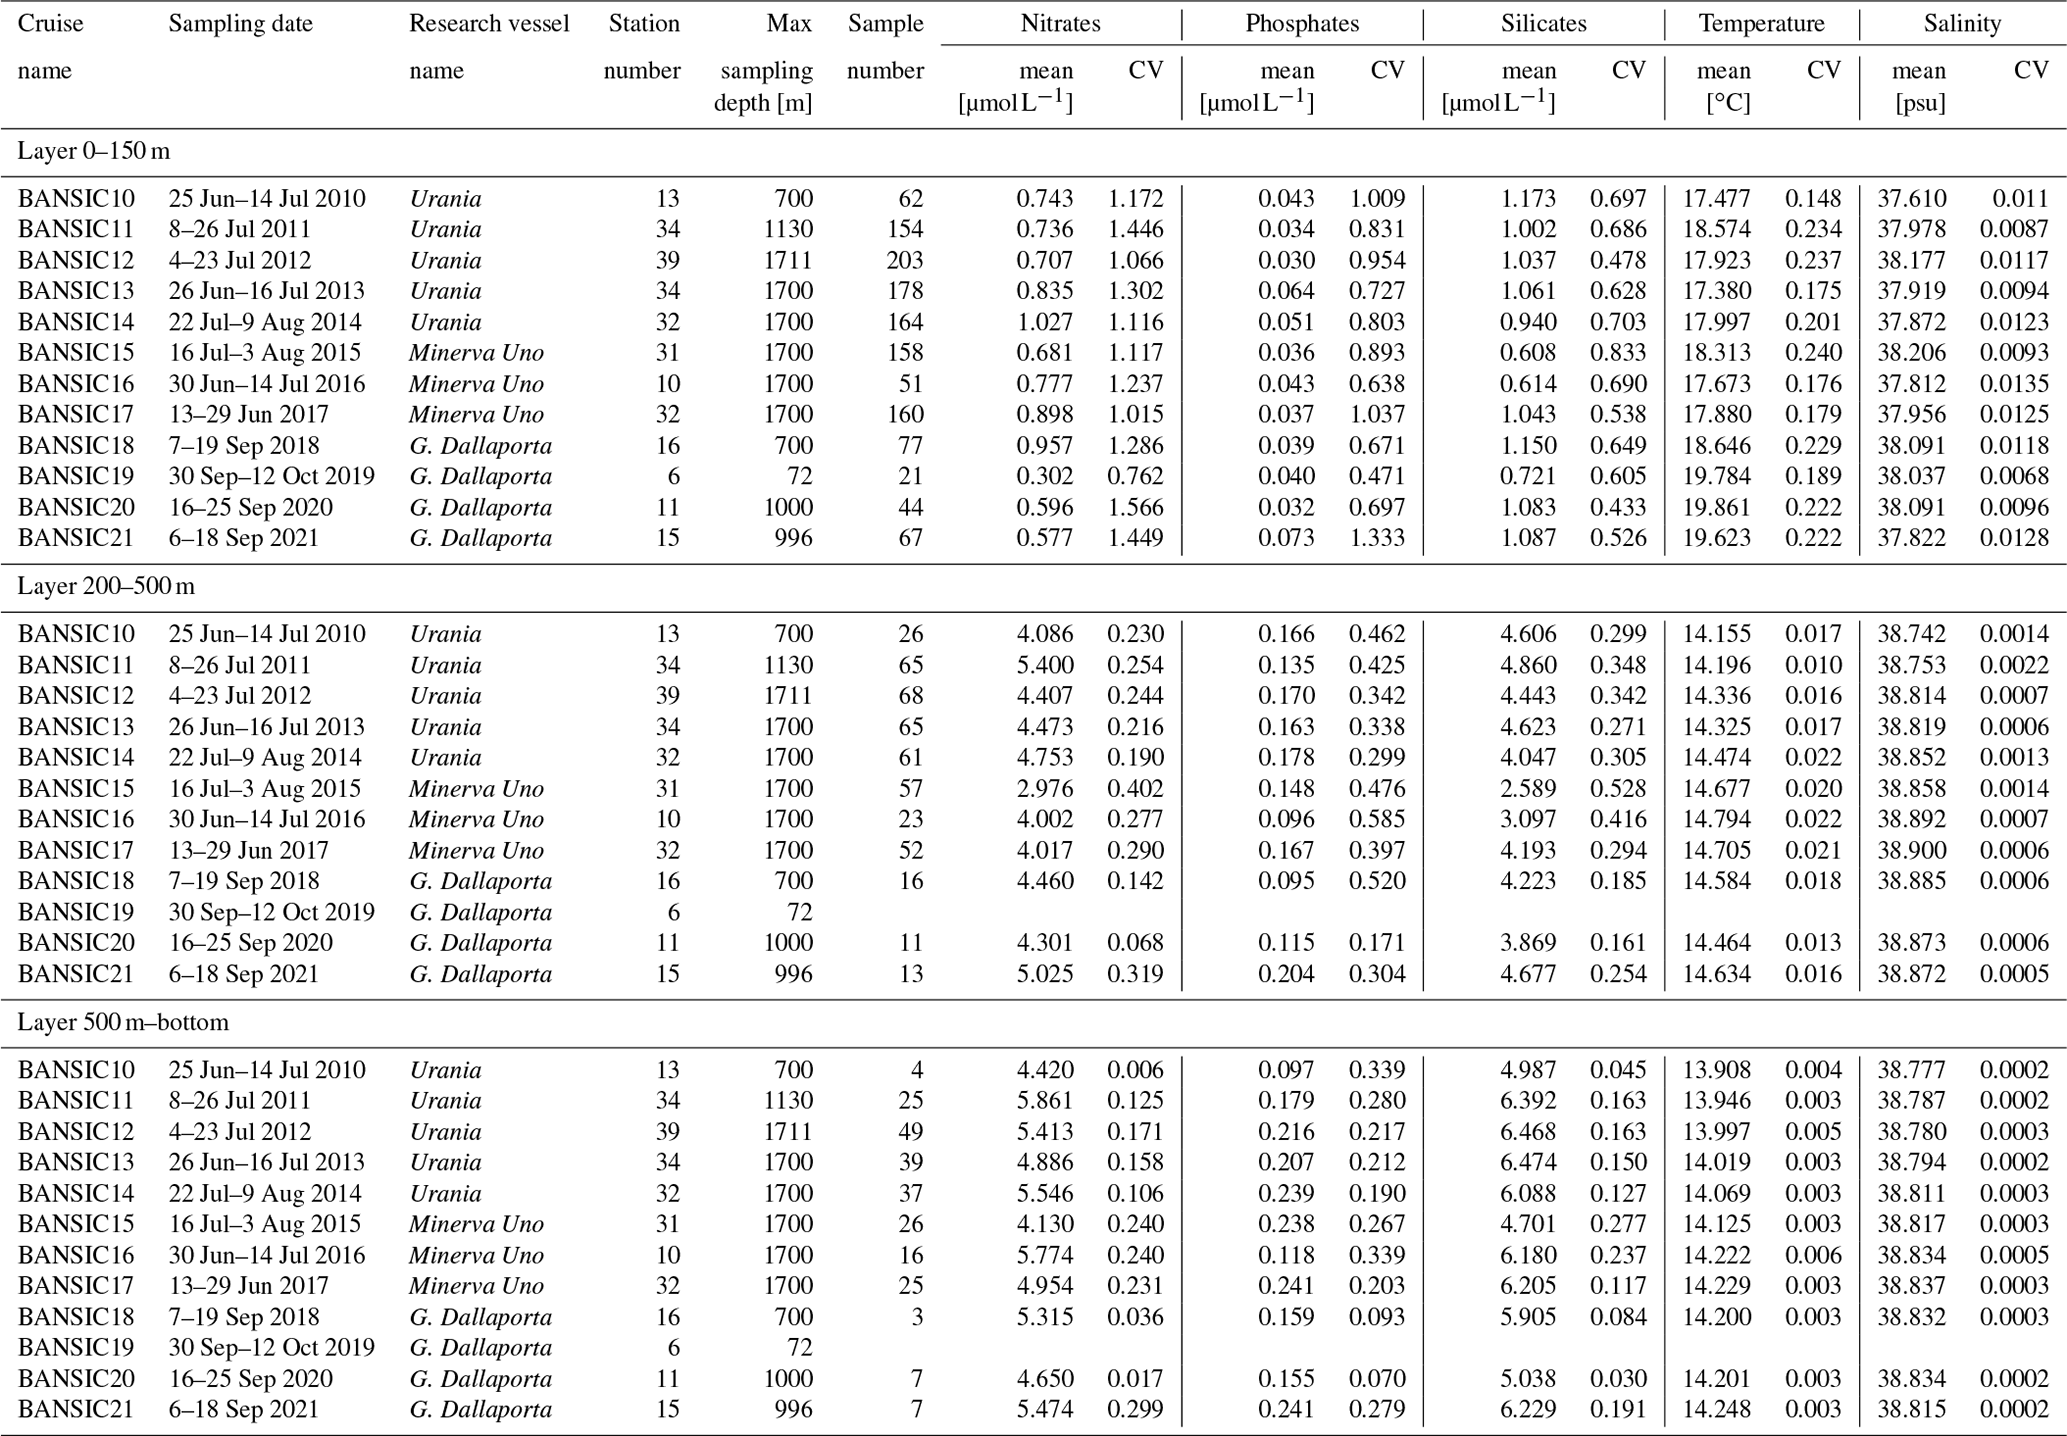
As far as the hydrological properties of the water masses in the study area, it is worth noting that over the (summer) period 2010–2021 in the surface layer the average temperature varied in the range 17.380–19.861 ∘C, with a general increasing trend peaking in 2020. Similarly, the salinity showed increasing values in the range 37.610–38.206 with a peak of in 2015 (Table 2). This layer is characterized by strong interannual and spatial variability as it is subject to continuous interaction with the atmosphere, as also highlighted by 1 or 2 orders of magnitude higher CV values of physical parameters in the superficial layer compared to the deeper layers (Fig. 2f, g; Table 2). Indeed, in the upper layer the CV of temperature varied between 0.148 (BANSIC10) and 0.240 (BANSIC15), and the CV of salinity ranged between 0.007 (BANSIC19) and 0.014 (BANSIC16).
Instead, the deeper water masses, with their lower variability in heat and salt content, turn out to be much more suitable for monitoring any changes over long periods. In the IW layer the CV of temperature ranged between 0.010 (BANSIC11) and 0.022 (BANSIC14 and BANSIC16), while the CV of salinity ranged between 0.0005 (BANSIC21) and 0.0022 (BANSIC11) (Table 2). Values of temperature in our time series (2010–2021) show an increase in average values of about 0.5 ∘C (14.155–14.634 ∘C), with a peak of 14.794 in 2017 (Table 2). Similarly, the corresponding increase in salinity was about 1.15 psu (37.742–38.885) with a peak of 38.900 psu reached in 2018 (Table 2). Similar trends have also been highlighted in the same area by Schroeder et al. (2017) and related to the increase in drying processes affecting the surface waters from which the IW originates. Within the time series (2010–2021) two patterns can be distinguished: the first (2010–2016) is characterized by an average annual increase in temperature () of about 0.1 ∘C yr−1 and the second (2017–2020) by an annual decrease in temperature of 0.08 ∘C yr−1 (Fig. 2i; Table 2). Finally, in 2021 a slight rise in temperature occurred (Fig. 2i; Table 2). Similarly, the salinity patterns show an average annual increase () of 0.022 over the period 2010–2016 and an annual decrease of 0.007 afterwards (2017–2021) (Fig. 2i; Table 2). A recent study advanced hypotheses on a possible link between the temperature and salinity positive trends over the period 2010–2016 and the anticyclonic phase of the NIG over the years 2006–2010, while the negative trends over the period 2017–2021 have been connected to the cyclonic phase of the NIG during the years 2011–2016 (Placenti et al., 2022).
Conversely, the nitrate and silicate mean annual concentrations show a slight decrease up to 2015–2016 and then slight increase until 2021 (Table 2), in agreement with the state of the art regarding the SC (Placenti et al., 2022).
The DW is characterized by very low values in CV of both temperature and salinity (between 0.003–0.006 and 0.002–0.005, respectively) with very slight differences across the yearly surveys (Table 2). Moreover, the average annual temperature and salinity slightly increased from 2010 until 2017 (13.908–14.299 ∘C and 38.777–38.837) and then slightly decreased until 2020 (Table 2). On the contrary, the patterns of nitrates and silicates would appear to be characterized by a slight decrease (5.861–4.130 and 6.392–4.701 µmol L−1) between 2011 and 2015 and by a slight discontinuous increase afterwards until 2021 (Table 2).
The final product is available from Zenodo and can be accessed in full open-access form at https://doi.org/10.5281/zenodo.8125006 (Placenti et al., 2023).
The dataset described here has the advantage of having been collected within the same monitoring program implemented in an important area of the Mediterranean Sea. Over time, the data have been collected consistently by the same technicians and researchers, who have been able to apply a rigorous quality check during both field and laboratory activities. This made it possible to minimize any biases deriving from the different experience of the personnel and from the use of different types of instrumentation and protocols. The spatial and temporal variability that characterizes this dataset therefore reliably reflects the effect of environmental processes that occurred in the marine environment, making this dataset usable for different fields of application. In support of this, the analysis of the mean values and of the variability of the parameters along the water column as well as among different surveys showed agreement with the patterns commonly recognized in the marine environment and highlighted in other datasets collected in different areas of the Mediterranean Sea. Moreover, the analysis shown in this paper is highly consistent with the trends evidenced in the literature concerning the Sicily Channel. In this framework, the availability of this dataset to the scientific community fills an important gap in field observations of a crucial area, the Sicily Channel, where exchanges between the western and eastern Mediterranean basin take place, providing support for studies aimed at describing ongoing processes and realizing reliable projections regarding the effects of these processes in the near future.
FP wrote the paper and analyzed the dataset. MT wrote the paper and prepared the figures. VT and CB participated in the fieldwork and laboratory analyses. KS wrote the paper and improved the quality check of the oceanographic data. GC, AC, and BP coordinated the fieldwork and the laboratory analyses and supervised the writing of the text. MB managed the technical aspects related to the oceanographic instrumentation for the acquisition of the hydrological parameters and helped with specific technical aspects of the paper. All authors contributed to the article and approved the submitted version.
The contact author has declared that none of the authors has any competing interests.
Publisher's note: Copernicus Publications remains neutral with regard to jurisdictional claims made in the text, published maps, institutional affiliations, or any other geographical representation in this paper. While Copernicus Publications makes every effort to include appropriate place names, the final responsibility lies with the authors.
Masters of the Urania, Minerva Uno, and G. Dallaporta as well as all their crew are thanked for their work in supporting the sampling activities during the oceanographic cruises. We are grateful to Carmelo Bennici, Girolama Biondo, Gaspare Buffa, Ignazio Fontana, Giovanni Giacalone, Luigi Giaramita, Marianna Musco, Carlo Patti, and Giorgio Tranchida for their valuable technical support and the sampling collection during the oceanographic surveys.
This study was mainly supported by the Italian National Research Council (CNR) through the USPO office and by the FAO regional project MedSudMed “Assessment and Monitoring of the Fishery Resources and the Ecosystems in the Straits of Sicily”, co-funded by the Italian Ministry MIPAAF through the Directorate General for Maritime Affairs and Fisheries of the European Commission (DG MARE). Other national research programs supported this study including project SSD-PESCA, coordinated by the Ministry of the Education, University and Research (MIUR) and founded by the Ministry of Economic Development (MISE), and the Flagship Project RITMARE – Italian Research for the Sea, coordinated by the Italian National Research Council and funded by MIUR.
This paper was edited by Giuseppe M. R. Manzella and reviewed by Manuel Vargas-Yáñez and one anonymous referee.
Belgacem, M., Chiggiato, J., Borghini, M., Pavoni, B., Cerrati, G., Acri, F., Cozzi, S., Ribotti, A., Álvarez, M., Lauvset, S. K., and Schroeder, K.: Dissolved inorganic nutrients in the western Mediterranean Sea (2004–2017), Earth Syst. Sci. Data, 12, 1985–2011, https://doi.org/10.5194/essd-12-1985-2020, 2020.
Ben Ismail, S., Schroeder, K., Sammari, C., Gasparini, G. P., Borghini, M., and Aleya, L.: Interannual variability of water mass properties in the Tunisia-Sicily Channel, J. Mar. Syst., 135, 14–28, 2014.
Bonanno, A., Placenti, F., Basilone, G., Mifsud, R., Genovese, S., Patti, B., Di Bitetto, M., Aronica, S., Barra, M., Giacalone, G., Ferreri, R., Fontana, I., Buscaino, G., Tranchida, G., Quinci, E., and Mazzola, S.: Variability of water mass properties in the Strait of Sicily in summer period of 1998–2013, Ocean Sci., 10, 759–770, https://doi.org/10.5194/os-10-759-2014, 2014.
Borghini, M., Bryden, H., Schroeder, K., Sparnocchia, S., and Vetrano, A.: The Mediterranean is becoming saltier, Ocean Sci., 10, 693–700, https://doi.org/10.5194/os-10-693-2014, 2014.
Gačić, M., Schroeder, K., Civitarese, G., Cosoli, S., Vetrano, A., and Eusebi Borzelli, G. L.: Salinity in the Sicily Channel corroborates the role of the Adriatic–Ionian Bimodal Oscillating System (BiOS) in shaping the decadal variability of the Mediterranean overturning circulation, Ocean Sci., 9, 83–90, https://doi.org/10.5194/os-9-83-2013, 2013.
Gasparini, G. P., Ortona, A., Budillon, G., Astraldi, M., and Sansone, E.: The effect of the Eastern Mediterranean Transient on the hydrographic characteristics in the Strait of Sicily and in the Tyrrhenian Sea, Deep-Sea Res. Pt. I, 52, 915–935, 2005.
Grasshoff, K., Kremling, K., and Ehrhardt, M.: Methods of seawater analysis, 3rd edn., Weinheim Press, WILEY-VCH, 203–273, 1999.
Hansen, H. P. and Koroleff, F.: Determination of nutrients, Methods of Seawater Analysis, 10, 159–228, 1999.
Huertas, I. E., Rios, A. F., Garcia-Lafuente, J., Navarro, G., Makaoui, A., Sanchez-Roman, A., Rodriguez-Galvez, S., Orbi, A., Ruiz, J., and Perez, F. F.: Atlantic forcing of the Mediterranean oligotrophy, Glob. Biogeochem. Cycles, 26, GB2022, https://doi.org/10.1029/2011GB004167, 2012.
Krom, M. D., Woodward, E. M. S., Herut, B., Kress, N., Carbo, P., Mantoura, R. F. C., Spyres, G., Thingstad, T. F., Wassmann, P., Wexels Riser, C., Kitidis, V., Law, C. S., and Zodiatis, G.: Nutrient cycling in the south east Levantine basin of the Eastern Mediterranean: results from a phosphorus starved system, Deep-Sea Res. Pt. II, 52, 2879–2896, 2005.
Krom, M. D., Emeis, K. C., and Van Cappellen, P.: Why is the eastern Mediterranean phosphorus limited?, Prog. Oceanogr., 85, 236–244, https://doi.org/10.1016/j.pocean.2010.03.003, 2010.
Placenti, F., Schroeder, K., Bonanno, A., Zgozi, S., Sprovieri, M., Borghini, M, Rumolo, P., Cerrati, G., Bonomo, S., Genovese, S., Basilone, G., Haddoud, D. A., Patti, B., El Turki, A., Hamza, M., and Mazzola, S.: Water masses and nutrient distribution in the Gulf of Syrte and between Sicily and Libya, J. Marine Sys., 121–122, 36–46, 2013, https://doi.org/10.1016/j.jmarsys.2013.03.012, 2013.
Placenti, F., Torri, M., Pessini, F., Patti, B., Tancredi, V., Cuttitta, A., Giaramita, L., Tranchida, G., and Sorgente, R.: Hydrological and biogeochemical patterns in the Sicily Channel: new insights from the last decade (2010–2020), Front. Mar. Sci., 9, 733540, https://doi.org/10.3389/fmars.2022.733540, 2022.
Placenti, F., Torri, M., Borghini, M., Cerrati, G., Cuttitta, A., Tancredi, V., Buscaino, C., and Patti, B.: New hydrological-biogeochemical dataset (2010–2021) in the Strait of Sicily, Zenodo [data set], https://doi.org/10.5281/zenodo.8125006, 2023.
Powley, H. R., Krom, M. D., and Van Cappellen, P.: Understanding the unique biogeochemistry of the Mediterranean Sea: insights from a coupled phosphorus and nitrogen model, Glob. Biogeochem. Cycles, 31, 1010–1031, https://doi.org/10.1002/2017GB005648, 2017.
Redfield, A. C., Ketchum, B. H., and Richards, F. A.: The influence of organisms on the composition of sea water, in: The Sea, edited by: Hill, M. N., vol. 2, Interscience, New York, 224–228, 1963.
Ribera D'Alcalà, M., Civitarese, G., Conversano, F., and Lavezza, R.: Nutrient ratios and fluxes hint at overlooked processes in the Mediterranean Sea, J. Geophys. Res., 108, 8106, https://doi.org/10.1029/2002JC001650, 2003.
Roether, W., Manca, B. B., Klein, B., Bregant, D., Georgopoulos, D., Beitzel, V., Kovacević, V., and Luchetta, A.: Recent changes in eastern mediterranean deep waters, Science, 271, 333–335, https://doi.org/10.1126/science, 1996.
Schlitzer, R.: Ocean Data View, http://odv.awi.de (last access: May 2022), 2021.
Schroeder, K., Gasparini, G. P., Borghini, M., Cerrati, G., and Delfanti, R.: Biogeochemical tracers and fluxes in the Western Mediterranean Sea, spring 2005, J. Mar. Syst., 80, 8–24, https://doi.org/10.1016/j.jmarsys.2009.08.002, 2010.
Schroeder, K., Chiggiato, J., Josey, S. A., Borghini, M., Aracri, S., and Sparnocchia, S.: Rapid response to climate change in a marginal sea, Sci. Rep.-UK, 7, 4065, https://doi.org/10.1038/s41598-017-04455-5, 2017.
Schroeder, K., Chiggiato, J., Ben Ismail, S., Borghini, M., Patti, B., and Sparnocchia, S.: Mediterranean deep and intermediate water mass properties, in: Copernicus Marine Service Ocean State Report, Issue 3, J. Oper. Oceanogr., 12, sup1, s26–s30, https://doi.org/10.1080/1755876X.2019.1633075, 2019.
SeaDataNet: Data Quality Control Procedures, 6th Framework of EC DG Research, Version 2.0, May 2010, https://www.seadatanet.org/Standards/Data-Quality-Control (last access: May 2023), 2010.
The MerMex group: Marine ecosystems' responses to climatic and anthropogenic forcings in the Mediterranean, Prog. Oceanogr., 91, 97–166, https://doi.org/10.1016/j.pocean.2011.02.003, 2011.
Van Cappellen, P., Powley, H. R., Emeis, K.-C., and Krom, M. D.: A biogeochemical model for phosphorus and nitrogen cycling in the eastern Mediterranean Sea (EMS), Part 1. Model development, initial conditions and sensitivity analyses, J. Mar. Syst., 139, 460–471, 2014.