the Creative Commons Attribution 4.0 License.
the Creative Commons Attribution 4.0 License.
Water vapor Raman lidar observations from multiple sites in the framework of WaLiNeAs
Patrick Chazette
Julien Totems
Jérémy Lagarrigue
Laurent Forges
Cyrille Flamant
During the Water Vapor Lidar Network Assimilation (WaLiNeAs) campaign, eight lidars specifically designed to measure water vapor mixing ratio (WVMR) profiles were deployed on the western Mediterranean coast. The main objectives were to investigate the water vapor content during case studies of heavy-precipitation events in the coastal western Mediterranean and assess the impact of high spatiotemporal WVMR data on numerical weather prediction forecasts by means of state-of-the-art assimilation techniques. Given the increasing occurrence of extreme events due to climate change, WaLiNeAs is the first program in Europe to provide network-like, simultaneous and continuous water vapor profile measurements over a period of 3–4 months. This paper focuses on the WVMR profiling datasets obtained from three of the lidars run by the French part of the WaLiNeAs team. These three lidars were deployed in the cities of Coursan, Le Grau-du-Roi and Cannes. This measurement setup enabled monitoring of the water vapor content of the lower troposphere over periods of 3 months in fall and winter 2022, with some interruptions, and 4 months in summer 2023. The lidars measured the WVMR profiles from the surface up to approximately 6–10 km at nighttime and 1–2 km during daytime. They had a vertical resolution of 100 m and a time resolution between 15 and 30 min, and they were selected to meet the needs of weather forecasting with an uncertainty lower than 0.4 g kg−1. The paper presents details about the instruments, the experimental strategy and the datasets provided. The final dataset (https://doi.org/10.25326/537; Chazette et al., 2023) is divided into two sub-datasets: the first with a time resolution of 15 min, which contains a total of 26 423 WVMR vertical profiles, and the second with a time resolution of 30 min to improve the signal-to-noise ratio and signal altitude range.
- Article
(9292 KB) - Full-text XML
- BibTeX
- EndNote
The Mediterranean basin has been identified as a hotspot of climate change for the years to come, as its population is expected to increase to 500 million inhabitants within the next 15 years (Giorgi and Lionello, 2008; Ruti et al., 2016). In the context of global warming, this area has increasingly been subjected to heavy-precipitation events (HPEs) that produce flash floods and landslides during fall (e.g., Ricard et al., 2012). The scientific community has noted that the frequency of HPEs has increased alarmingly over the last 30 years (e.g., Flamant et al., 2021). Fall HPEs occur when the temperature difference between the sea surface and the atmosphere is greatest, after western Mediterranean waters have warmed all summer. Such temperature conditions favor water evaporation, which brings latent energy into the atmosphere, leading to deep convection processes and formation of mesoscale convective systems (MCSs) (e.g., Ducrocq et al., 2008; Duffourg et al., 2016; Chazette et al., 2016). The water vapor mixing ratio (WVMR) is therefore a crucial parameter for studying the energy balance of the troposphere (e.g., Held and Soden, 2000; IPCC, 2022).
Saharan air masses, absorbing moisture from the Mediterranean Sea and air masses for the Atlantic Ocean, are advected over the western Mediterranean Sea and reach the coast of southern France, which leads to HPEs (Duffourg and Ducrocq, 2011). It has already been established experimentally that, before HPEs, the atmosphere is moister, with an increase in the water vapor content in the first kilometers above ground level (Flamant et al., 2021). For instance, Chazette et al. (2016) used data acquired by a ground-based lidar in the Balearic Islands along with satellite data to study the formation of MCSs which impacted the Cevennes–Vivarais area as they led to HPEs. They also highlighted the fact that these MCSs were formed over the Mediterranean basin and were moistened as they passed over the sea, which leads to a progressive increase in the water vapor content up to 5 km in the free troposphere.
Due to global warming, the intensity of HPEs is increasing, threatening human lives and leading to important economic and environmental costs (IPCC, 2022). Therefore, the monitoring and forecasting of these events, which are two fundamental components of a decision-making tool for local governments, are major but challenging objectives for meteorologists. Indeed, current measurement methods lack the temporal and vertical resolutions to correctly study the water vapor content initiating deep convection in the lower troposphere (Flamant et al., 2021), where the spatiotemporal variability of the moisture field is greatest.
In response to these climatic threats, the international scientific community implemented the 10-year Hydrological Cycle Experiment in the Mediterranean program (HyMeX; Drobinski et al., 2014). This program deployed a suite of instruments within the special observing period to measure meteorological parameters over the western Mediterranean area at the surface and in the lower troposphere (Ducrocq et al., 2014; Duffourg et al., 2018). As part of the instrumental setup, two Raman lidar systems (Chazette et al., 2014a; Di Girolamo et al., 2020) were dedicated to measuring atmospheric water vapor profiles. These instruments provided the constraints needed, not only to validate airborne and drifting balloon measurements (Chazette et al., 2016) but also to test the impact of their assimilation on the Application of Research to Operations at Mesoscale (AROME) model (Seity et al., 2011; Fourrié et al., 2019). The Raman lidar system used over the Balearic Islands also provided an opportunity for a validation campaign of the Infrared Atmospheric Sounding Interferometer (IASI) on board the MetOp (Meteorological Operational satellite) platform (Chazette et al., 2014a), a key component of assimilation in numerical weather prediction models (Hilton et al., 2009; Guidard et al., 2011).
Improving the forecasting of HPEs over the western Mediterranean basin by using what was learned during HyMeX was the main motivation for the new French initiative Water Vapor Lidar Network Assimilation (WaLiNeAs; Flamant et al., 2021). The main field campaign associated with WaLiNeAs took place between October 2022 and January 2023. It was followed by a second campaign at the Météo-France site in Toulouse from June to September 2023. That campaign also presented an opportunity to validate the calibration of HORUS-2 lidar and to sample heavy rainstorms and the severe heatwave of August 2023, which affected all of southern Europe.
The goal of this paper is to provide an overview of the Raman water vapor lidar measurements performed by French ground-based stations during WaLiNeAs and the complementary campaign carried out in Toulouse. The lidar profiles are now available to the international scientific community in the AERIS database (https://doi.org/10.25326/537; Chazette et al., 2023). This represents a total of 26 423 lidar profiles, averaged over 15 min with a vertical resolution of 100 m. The experimental strategy is presented in Sect. 2, along with the main objectives of the campaign, the site locations, the descriptions of the instruments used and the operating time periods. Section 3 describes the data processing methodology and the algorithms for the assessment of uncertainties, computed with an end-to-end approach. Section 4 presents the results of the data processing after applying the methodology described in Sect. 3. Section 5 details the final database structure and the procedure for the reader to access the database, and it defines the flags for data quality. A conclusion is presented in Sect. 7.
2.1 Main objective
The main objective of the WaLiNeAs campaign is to improve the prediction of HPEs and the understanding of the initial conditions that generate these events by assimilating WVMR lidar datasets into mesoscale models, as represented in Fig. 1. Data acquired during the WaLiNeAs campaign in fall and winter 2022–2023 will be assimilated into mesoscale models such as the AROME mesoscale model at the horizontal resolution of 1.3 km developed by Météo-France (Fourrié et al., 2019). Similar studies have been conducted for air quality using lidar measurements of aerosols. They showed a significant improvement in the forecasts over about 48 h (Wang et al., 2013, 2014).
The lidar data acquired during WaLiNeAs will serve as constraints for the model to improve the precision of precipitation event forecasting. Current means of measurement providing data in the AROME mesoscale model have limited temporal and vertical resolutions. As discussed in Chazette et al. (2014a), IASI satellite data offer a vertical resolution on the order of 1 km in the lower troposphere, and the weighting functions of the spectral channels use a peak of over 2 km above ground level (a.g.l.). Consequently, they lack the necessary vertical precision to accurately measure water vapor in the altitude range of the atmospheric boundary layer, which contains the majority of the water vapor content. This limitation can potentially result in errors and inaccuracies when predicting both the intensities and locations of HPEs. Radiosoundings are resolved well for altitude, but the measurements are too punctual, with an average sampling frequency of two radiosoundings per day. Ground-based weather stations provide continuous data over time, but each of their measurements is given for a precise point in space and altitude, and moreover the correlation between ground-level measurements and the atmosphere above is frequently low (Chazette et al., 2017). On the other hand, Raman water vapor lidar data provide continuous, high-resolution water vapor profiles in altitude at specific, localized points but cannot capture broader spatial variations (e.g., Whiteman et al., 1992; Ansmann et al., 1992; Mattis et al., 2002; Reichardt et al., 2012). Thus, during WaLiNeAs, ground-based water vapor Raman lidars measured the WVMR up to 1.5–2.5 km during daytime and over 6 km during nighttime, with a vertical resolution of 100 m, as discussed in Sect. 2.3. These performances let us sample the majority of the water vapor content in the troposphere with sufficient resolution to identify the various processes that may lead to HPEs.
The water vapor lidar data acquired during the WaLiNeAs and Toulouse campaigns are also available from the AERIS database (https://doi.org/10.25326/537; Chazette et al., 2023). This database will also serve future case studies involving intercomparisons and validations with other measuring methods from aircraft or satellites as well as with mesoscale models (Fig. 1).
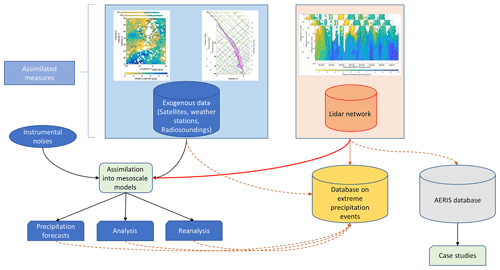
Figure 1Flowchart of the use of lidar data acquired during the WaLiNeAs campaign. Lidar vertical profiles acquired using the lidar network (orange cylindrical box) have been added to the AERIS database represented by the grey cylindrical box. These data will therefore serve directly for the case studies shown as a green box in the bottom right. The primary goal of lidar measurements is to be assimilated into mesoscale meteorological models (green box on the left), which already assimilate other data from exogenous measurements, as shown by the blue box in the top left. Together, instrument measurements, lidar data and model outputs form a complete database of HPEs, as represented by the yellow cylindrical box.
2.2 Experimental strategy
2.2.1 Meteorological context
Duffourg and Ducrocq (2011) highlight that humid air masses have various remote origins before reaching France. On average, 2 d before an event, the majority of humid air masses reaching France come with the southerly flow from Africa, which may bring water vapor from the tropical Atlantic (Winschall et al., 2012), and the westerly flow originating from the Atlantic Ocean in connection with extratropical cyclones (Dettinger, 2011; Flaounas et al., 2014; Pfahl et al., 2014). Note that Duffourg and Ducrocq (2011) also point to a contribution from the eastern Mediterranean area.
Once the precipitating system reaches the western Mediterranean region, it may follow two main paths before reaching France's Mediterranean coasts: one along the southern Spanish coast before reaching the Balearic Islands, heading northward and northeastward, and one from Tunisia after passing over Sardinia, heading northward and northwestward. The Mediterranean Sea acts as a heat and moisture source, and the coastal orography (i.e., the Massif Central, the Pyrenees and the Alps) induces mesoscale convergence and lift of moist air (Ricard et al., 2012). The interaction between the synoptic conditions, topography and mesoscale features determines the location and intensity of the precipitation. Lastly, the shape and position of the mountain ranges may enhance rainfall in very specific areas, leading to destructive floods.
2.2.2 Experimental setup
To study HPEs over the western Mediterranean area within the framework of WaLiNeAs, eight lidar sites managed by the Spanish, French, Italian and German research teams (Flamant et al., 2021) were set up on the Mediterranean coasts of France and Spain. Their coordinated efforts made it possible to track air masses bringing water vapor content towards southern France. A ninth site was also set up to complete the validation of lidar measurements near the Météo-France radiosonde station in Toulouse (southwestern France). The locations of the sites involved during the WaLiNeAs campaign are shown in Fig. 2, with the different air masses impacting them in the western Mediterranean basin (inspired by Flamant et al., 2021; Fig. 5). The coastal lidar sites were chosen to study the moisture in the lower troposphere upstream of the mountainous areas whose windward sides have been most impacted by HPEs during recent decades, i.e., Languedoc-Roussillon, Cévennes–Vivarais, the southern Alps and Corsica (Ricard et al., 2012; Ducrocq et al., 2014; Duffourg et al., 2016, 2018).
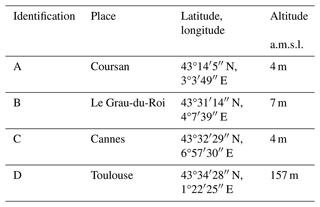
Four lidar sites (Table 1) were run by the French team during the two seasons. The longest one was during fall 2022, when three sites were set up on the Mediterranean coast: Coursan, Le Grau-du-Roi and Cannes. Coursan is located upstream of the Languedoc-Roussillon region. Low-level flows bringing precipitating systems are oriented easterly, usually due to a low-pressure area between the Balearic Islands and Corsica. This region is surrounded by the Pyrenees and Massif Central mountain ranges, which create a venturi effect, bringing strong winds and humidity overland and potentially leading to rainfall. Le Grau-du-Roi is located upstream from the Rhône valley and the Cevennes mountains. These regions are also subjected to a southerly flow, veering slightly west near the coast, and are among those most impacted by HPEs in the Mediterranean basin. The orographic situation is similar to the one for Coursan, as the Rhône valley is surrounded by the Massif Central and the Alps. Finally, Cannes is located in the foothills of the Maritime Alps, a region which is also impacted by HPEs due to the Alpine topography. During fall, this region is also subjected to southerly or southwesterly flow, which can bring elevated dust plumes originating from the Sahara. These three sites were followed by an additional one in Toulouse so as to validate the calibration process. The campaign offers an opportunity to sample extreme weather events in southwestern France. Toulouse is located in the Midi-Pyrénées region, which is also considered a climatic hotspot for the years to come, as the intense heatwaves and violent storms occurring during summer cause significant environmental and economic damages and threaten human lives. Frequently, at the end of summer and fall, tropical air masses are advected over the western Mediterranean Sea and bring important amounts of moisture over southern France, sometimes crossing the Pyrenees. Air masses are thus subjected to the foehn effect, warming them in the leeward of the mountains. In addition, Toulouse lies in the path of Atlantic air masses and autan winds blowing from the southeast, which can generate storms and HPEs over the Midi-Pyrénées region.
Looking back over the campaign, the first part of the WaLiNeAs field campaign during fall and winter 2022–2023 was characterized by two distinct periods. A fairly wet period between October and mid-November corresponded to the period of HPEs (Flamant et al., 2021). However, no HPE took place during this period. This was followed by a dry period from mid-November to mid-January 2023, during which the atmospheric water vapor content was very low, with values below 10 g kg−1 in the lower troposphere. In Toulouse, summer 2023 was marked by two significant meteorological situations. The first occurred in June 2023. It was characterized by thunderstorms and heavy rainfall with cumulative rainfall water of 131.9 mm near Toulouse, which is a record for the last 10 years (https://www.infoclimat.fr/climatologie-mensuelle/07630/juin/2022/toulouse-blagnac.html, last access: 10 August 2024). The second was in August 2023, when a record heatwave hit the whole of southern France and the Mediterranean basin. and July and September 2023 were within seasonal norms. The four French lidar sites were equipped with (i) the H2O Raman Ultraviolet Sounder second generation (HORUS-2) at Coursan and Toulouse, (ii) the H2O Raman Ultraviolet Sounder first generation (HORUS-1) at Le Grau-du-Roi and (iii) the Water Vapor and Aerosol Lidar (WALI) at Cannes. The sites are indicated by a red cross in Fig. 2 and their geographical coordinates are given in Table 1, together with the altitude of the site above mean sea level (a.m.s.l.). The other lidar sites managed by the different European teams are also shown in Fig. 2 but as yellow crosses. Note that the lidar instruments deployed across all the sites are described by Flamant et al. (2021). WALI (Chazette et al., 2014; Totems et al., 2021) is embedded at the Mobile Atmospheric Station (MAS) (e.g., Raut and Chazette, 2009) shown in Fig. 3a. The HORUS lidars have been developed for the purpose of the WaLiNeAs campaign at the Laboratoire des Sciences du Climat et de l'Environnement (LSCE). As a new generation of compact and autonomous systems (Fig. 3b), they were conceived specifically to measure the water vapor content in the lower troposphere.
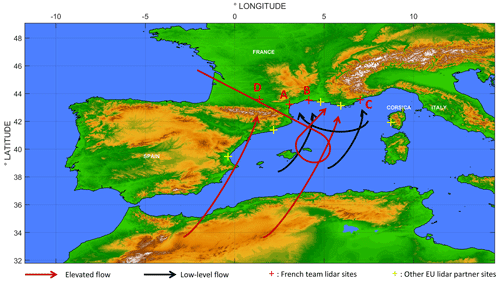
Figure 2Map of the WaLiNeAs campaign lidar sites and the main flow patterns at the low levels (black arrows) and altitudes (between 2 and 4 km, brown arrows) described in Flamant et al. (2021). The red crosses represent the French team's lidar sites and the yellow crosses those of the other European teams. See Table 1 for the letter signification.
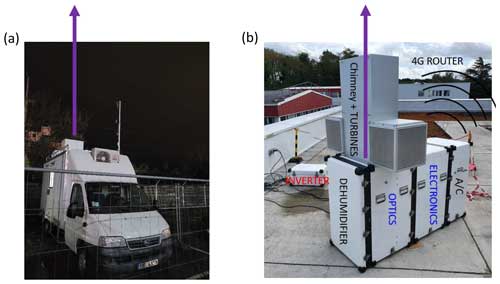
Figure 3Picture of (a) the MAS truck station containing WALI and (b) HORUS-1 or HORUS-2 composed of several enclosures containing the air conditioning (“A/C”), electronic components (“ELECTRONICS”), optical components (“OPTICS”) and dehumidifier. HORUS has a chimney to limit the sky background and avoid direct sunlight as well as turbines to keep the emission window clean. HORUS is connected to an inverter to prevent power outages, and a 4G router is present to access the lidar remotely. Lidar emission beams are represented by the purple arrows.
2.3 Lidar characteristics
The main characteristics of WALI, HORUS-1 and HORUS-2, the three lidars deployed during the WaLiNeAs campaign, are summarized in Table 2. HORUS is composed of three modules to create a compact and autonomous instrument (Fig. 3b). The electronics module supplies power to the other two modules and contains all the electronics and the optical spectral analyzers, which consist of two rack-mounted fiber-optic polychromators. The optics module contains the laser transmitter and the two reception telescopes. Each receiving telescope acquires a N2 Raman channel and a H2O Raman channel, respectively, to improve the signal-to-noise ratio as twice as many photons are received. An air-conditioning (AC) module maintains the internal temperature of the lidar, which is crucial for correct functioning of the laser and the optical detection. Above the optics module, turbines produce an intense air mass flow to remove water and any particles that could have been deposited on the lidar windows during precipitation events. It is important to note that rain does not prevent the lidar from acquiring data, although the range of the lidar is reduced. The chimney prevents direct sunlight from entering the lidar, limiting damage due to focused light as well as the impact of the sky background on the signals. Indeed, during daytime, the sky background does not represent a usable part of the signal and thus limits the range of the lidar for measuring water vapor. HORUS is inverter-powered to prevent power cuts from affecting the campaign. Finally, a 4G router is embedded in each lidar to control it remotely. Inside this field-proof enclosure, the optical architecture of HORUS is almost identical to that of WALI (Totems et al., 2021) and is presented in Fig. 4a. WALI was developed at LSCE (Chazette et al., 2014b) to simultaneously study the aerosol content in the atmosphere, with elastic reception channels, temperature (measured but not logged in the database) and water vapor profiles and rotational and vibrational Raman channels, respectively. A schematic representation of the WALI system components is given in Fig. 4b. This is embedded in the MAS truck (Raut and Chazette, 2009), offering a mobile temperature-controlled work environment. Unlike HORUS, the WALI laser has an injector (seeder input in Fig. 4b) to stabilize the wavelength, which is essential for good temperature measurement (Totems et al., 2021).
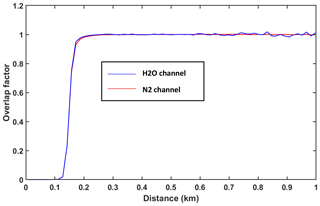
The three lidar systems use pulsed frequency-tripled (3ω) Nd:YAG lasers manufactured by Lumibird Quantel, with an emission wavelength of 354.7 nm. Laser beam expanders allowed us to meet eye safety standards (EN 60825-1) at the chimney exit. The UV pulse energy is 30 and 100 mJ for the HORUS lidars and WALI, respectively, whereas the pulse repetition rate is 20 Hz for WALI and HORUS-1 and 100 Hz for HORUS-2, enabling a better vertical range. The reception systems are 150 mm Newtonian telescopes, feeding filter-based spectral analyzers (called polychromators in Fig. 4) via an optical fiber. The acquisition system, employing PXI (PCI eXtensions for Instrumentation) technology, incorporates 12-bit digitizers manufactured by National Instrument® (https://www.ni.com/, last access: 7 February 2023). These digitizers operate at a speed of 200 MHz, allowing for post-digitization photon counting. Full overlap, which represents the overlap between the transmitted beam and the reception field of view, is reached 200 m above the lidar, as shown in Fig. 5. Table 2 provides an overview of the system's key characteristics for each lidar.
Table 2Characteristics of the three lidars during the WaLiNeAs campaign.
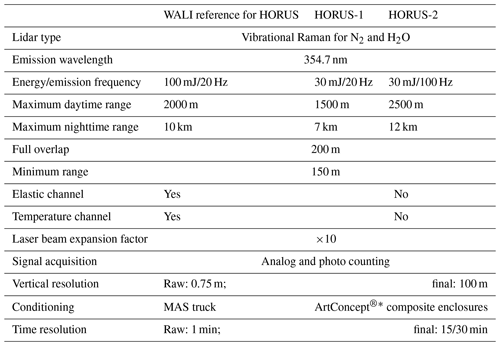
∗ https://www.art-concept.fr/ (last access: 7 February 2023).
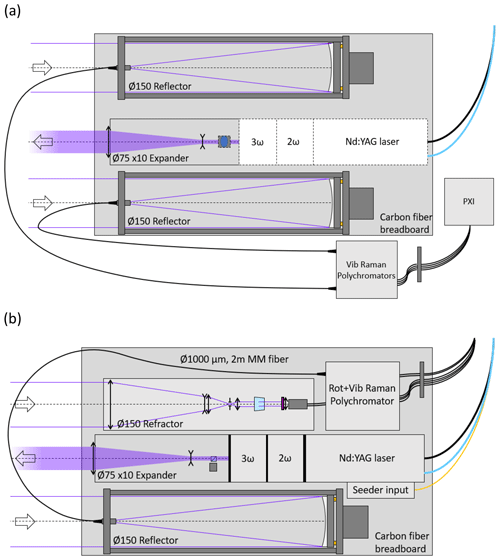
Figure 4Diagrams of the emission and reception components. These diagrams are inspired by Fig. 2 in Totems et al. (2021) on WALI. (a) For HORUS, the laser is shown in light grey to indicate the fact that it is on the other side of the optical table. The laser is cooled by water, which is fed through the pipes shown in blue and black. It is equipped with a periscope (represented by a blue oval) that carries the beam to the other side of the table before reaching the beam expander. Receiving telescopes feed the signal into fibers directly connected to the Raman polychromators, enabling the signal to be processed by the PXI. (b) For WALI, all the components are present on the same side of the optical table. The blue cube letting the laser beam emission through represents a dichroic plate before the beam expander. The Raman vibrational telescope is the same as HORUS, and the rotational Raman reception system is described in Totems et al. (2021). WALI contains an injector represented by the yellow fiber to stabilize the emission wavelength, which is important for measuring temperature.
2.4 Lidar-operating time periods
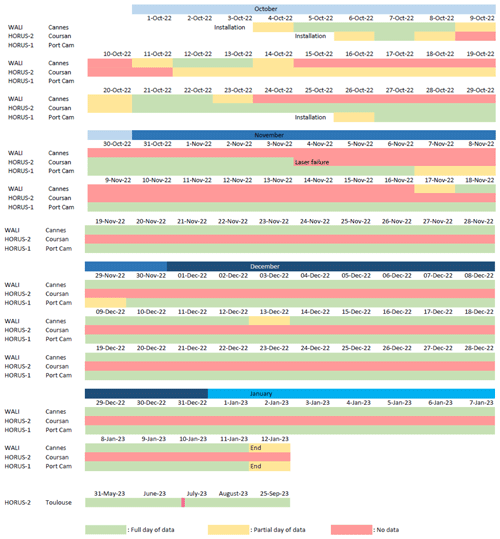
The periods during which the three French lidars were operational are summarized in Fig. 6. Both WALI and HORUS-1 acquired around 2 months of data. WALI acquired data between 4 October 2022 and 12 January 2023. The lidar stopped several times over October and November due to power drops which were not compensable by the inverter. It was then necessary to reboot the lidar manually on-site until a remote-controlled power distribution unit was installed after mid-December, allowing us to restart the lidar remotely if necessary. A short downtime in mid-December was necessary for routine maintenance of the laser.
HORUS-1 acquired data continuously between 26 October 2022 and 12 January 2023. The lidar was briefly switched off for standard maintenance at the beginning of November and December, respectively.
During the WaLiNeAs campaign, HORUS-2 acquired data between 6 October 2022 and 4 November 2022. Unfortunately, the lidar was unable to acquire data after a manufacturing defect induced a laser failure. Due to other laser failures probably caused by the same manufacturing defect, the lidar was also down several times during the month of October. After laser repair, HORUS-2 was redeployed in Toulouse between 31 May 2023 and 25 September 2023. The lidar was only off once during that period, between the evening of 31 June 2023 and the morning of 3 July 2023, after a thunderstorm caused a power outage at the Météo-France site. The lidar was also briefly stopped on 25 July 2023 for maintenance. The performances of HORUS-2 were of high quality, allowing us to measure water vapor content up to 2.5 km during daytime and up to the tropopause during nighttime. Of the three lidars, HORUS-2 is the most efficient field lidar for measuring the water vapor content in the troposphere.
This section describes the method followed to invert the data from the raw lidar signals to the WVMR profiles. It also describes the method used to study the lidar instrumental error budget with an end-to-end model.
3.1 Basic Raman lidar equation
Vibrational Raman lidars acquire signals corresponding to the dinitrogen and water vapor backscattering in the atmosphere. Raw lidar profiles are expressed in millivolt (mV) and sampled at a rate of 200 MHz that refers to analog and photon-counting detections. As described in Totems et al. (2021), these profiles are then corrected from both sky background radiance and detection solid angle. During the acquisition process, the lidar profiles are sampled with a raw resolution of 0.75 m along the line of sight. A temporal averaging of 1000 profiles for WALI and HORUS-1 and over 5000 profiles for HORUS-2 translates into approximately one recording every minute over the campaign.
Typically, the lidars directly acquire the range-corrected Raman signal Si from ground level zG at the altitude a.m.s.l. z of channel i (N2 or H2O) and wavelength λi (386.6 nm for the dinitrogen channel and 407.5 nm for the water vapor channel) following the equation
Ki is the instrumental constant of channel i, which is a function of the lidar components, such as the laser emission energy, the transmission of reception optics and the quantum efficiency of the photodetector. gi is the photodetector gain, which depends on the level of high voltage (HV) applied to it. Oi represents the overlap factor. βi(z) is the volume backscattering coefficient defined as a function of the density profile Ni of gas i and the associated differential cross section taken under backscatter conditions ():
Spectral dependences for air molecules and aerosols are characterized by parameters ηi,m and ηi,a, respectively, according to the relationships
where A is the Ångström exponent of aerosol, while αm and αa are the molecular and aerosol extinction coefficients at 354.67 nm. The molecular extinction coefficient is determined following Nicolet (1984) using radiosoundings and climatological databases (Chazette et al., 2012a).
3.2 Inversion and atmospheric correction
3.2.1 WVMR retrieval
We aim to assess the WVMR (rH) vertical profile, which is defined as the water vapor mass (mH) per dry air mass (ma), expressed (g kg−1) at altitude z:
This can also be written as
where Ni and Mi are the density profile and the molar mass coefficient for molecule i and rN is the dinitrogen mixing ratio.
By calculating the ratio of the two channels H and N from Eq. (1) and using Eq. (2), we can then calculate rH from the lidar profiles according to the relationship
where K0 is the calibration coefficient calculated for a reference HV of 940 V. The variables Cm and Ca are associated with atmospheric transmission corrections for molecules and aerosols, respectively. The H and N channels are corrected for the detection gains gH and gN, respectively. The WVMR is calculated on a time average (〈 〉) of M profiles for each altitude z with a vertical resolution of 100 m. This procedure is well established, as presented in Totems et al. (2021) or Chazette et al. (2014b).
3.2.2 Molecular and aerosol transmission corrections
The method for retrieving the WVMR by Raman lidar measurement requires a correction of the atmospheric transmission at the wavelengths used. Molecular transmission is a function of air density and therefore of temperature and pressure, which are usually derived from climatological thermodynamic profiles or radiosoundings when available. The corrective multiplicative term Cm is given by Chazette et al. (2014b):
Similar to the corrective multiplicative term of molecular transmission, the corrective multiplicative term Ca for aerosol transmission is written as follows (Chazette et al., 2014b):
3.3 Calibration of the lidar-derived WVMR
The purpose of the calibration process is to find the constant K0 in Eq. (6). Usually, this constant is found by comparing the lidar-derived WVMR with coincident radiosounding profiles. Other methods such as using a microwave radiometer have also been used (Foth et al., 2015). During WaLiNeAs, because of the presence of no-fly zones, no radiosoundings were available close to the lidar sites. Hence, we use ground-based weather stations (PTU VAISALA® 303; https://www.vaisala.com/, last access: 7 February 2023) calibrated just before the campaign by the VAISALA company to perform the lidar calibration in terms of the WVMR. For the meteorological probe, the absolute uncertainties in pressure, temperature and relative humidity are 0.25 hPa, 0.2 °C and 1 %, respectively. This leads to an error of 0.2 g kg−1 for the WVMR assessment. The weather stations were close to the lidars at ∼2 m from the ground level, just above the lidars. To retrieve K0, we compared the WVMR derived from the meteorological probes with the one derived from the Raman lidar between 200 and 400 m, where the overlap factor is 1. Such a comparison is reliable when the vertical gradient of rH is close to 0, indicating a well-mixed lower troposphere. It is worth noting that, to calibrate the dual-telescope HORUS lidars, two distinct constant values must be employed for each of the two channels. This approach involves performing a cross-calibration between the two telescopes (denoted hereafter as T1 and T2) while maintaining a constant ratio between the calibration constants associated with each of them. The results associated with the calibration process are presented in Sect. 4.1.
3.4 Error budget calculation
As discussed in Chazette et al. (2012b, 2014b), the determination of the WVMR is affected by uncertainties stemming from three primary sources:
-
the shot noise and the natural variability of the atmosphere, which are characterized by the signal-to-noise ratio (SNRλ) of the lidar system;
-
bias due to calibration issues usually associated with in situ measurements coincident with lidar profiles (Sect. 3.3); and
-
bias due to contributions by molecular and aerosol (Sect. 3.2.2) components in the atmosphere.
To first order and considering all sources of uncertainty to be independent, the total relative uncertainty εH in the WVMR (rH) is given by the following equation (Chazette et al., 2014b):
where the relative bias associated with correctly estimating the optical thicknesses and Angström coefficients of molecules and aerosols is given by εm and εa. is the relative bias due to the calibration constant K0, εO is the relative bias due to the overlap factors and εHV is the uncertainty resulting from the HV variations.
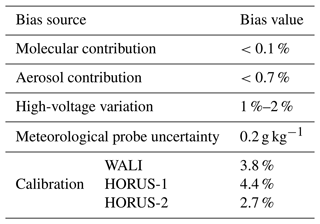
To avoid saturating the photomultipliers, HV mainly varies during daytime. The uncertainty related to HV variations is thus caused by the atmospheric variability during HV changes. The relative uncertainty resulting from the HV variation has been tested in the laboratory. Its contribution is ∼1 %–2 % and may be higher with a HV below 700 V (∼3 %–4 %). Note that, below 600 V, the photomultipliers may have a nonlinear response. The relative bias in the overlap factor is negligible, as full overlap is reached above 200 m. In addition, a ratio between the two detection channels is calculated to obtain the WVMR, which strongly limits overlap effects because the backscatter signals due to N2 and H2O follow the same optical path in the lidar architecture.
To simulate the contribution of shot noise, we employed a Monte Carlo approach similar to the one used by Royer et al. (2011) and Chazette et al. (2014b). The schematic representation of the method is shown in Fig. 7. First, we need to select reference WVMR vertical profiles (rH, ref) that are representative of the observations. To achieve this, lidar measurements averaged at 15 min are inverted to provide this reference dataset, which is then used as input to the end-to-end model. In a second step, we apply Eq. (1) to simulate the vertical lidar signals for each channel, relying on atmospheric parameters that also act as inputs to the model (Fig. 8). The molecular contribution is simulated using a climatological model as in Chazette (2003). The lidar instrumental constant is obtained by isolating a low-noise part of the actual signal, typically between 1000 and 1500 m, and fitting it with the simulated signal.
We generated a total of n=400 noise instances for each channel to ensure a normal noise distribution with at least 1 standard deviation. The noise level, represented by the standard deviation of the noise, is scaled based on real lidar profiles Si averaged over a 15 min duration. Subsequently, we multiply the ratio of the two simulated channels by the calibration coefficient K0 to recover rH, which is then compared to rH, ref. Finally, we evaluate the error budget by calculating both the mean bias (MB) and the root mean square deviation (RMSD) according to the following relationships:
and
Different bias sources and their impacts are described in Totems et al. (2021). They are not considered here, as they are negligible compared to shot noise. The other sources of error due to calibration and atmospheric transmission are computed in Sect. 4.3 using the measurements performed during the field experiment.
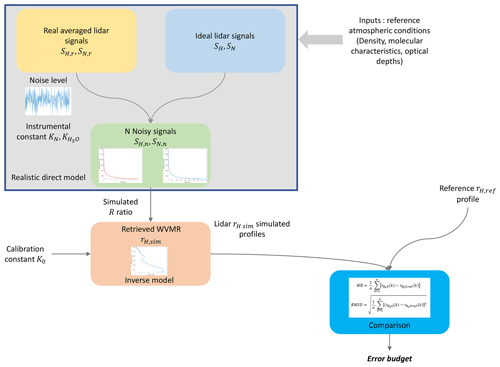
Figure 7Diagram of the direct inverse algorithm methodology for water vapor Raman lidar. The grey box includes several colored boxes to describe the direct lidar model. Ideal lidar signals (SH and SN) are generated from the lidar equation considering atmospheric parameters (blue box) and compared to real lidar signals (SH,r and SN,r) acquired with lidars (yellow box) to estimate noise levels and system constants ( and KN). This creates a certain number of noisy signals (SH,n and SN,n) representing the lidar signals (green box). From water vapor and dinitrogen lidar signals, we estimate the WVMR (rH,sim) using the R of the two channels and applying the calibration constant K0. This operation is the inverse model (orange box). The simulated WVMR is then compared to the reference WVMR (rH, ref) to estimate the error budget (blue box).
4.1 Calibration
This section shows the results of the method described in Sect. 3.3. For each lidar, Fig. 8a–c show examples of periods during which the lidar-derived WVMR corresponds to the weather-station-derived WVMR. Each lidar was calibrated during the periods highlighted in Fig. 8a–c. Lidar measurements were extracted at 200 m a.m.s.l. The standard deviation in the data due to both instrumental noise and atmospheric variability is also indicated by red-colored areas. When time evolutions are close together, this corresponds to periods when dynamical vertical mixing homogenizes the lower troposphere. For these periods, the scatterplots between the in situ and remote sensing measurements are shown in Fig. 8d–f for each lidar site during the WaLiNeAs campaign. These scatterplots show a good correlation between the lidar and the weather station WVMR when the atmosphere is well-mixed, with the determination coefficients exceeding 0.90. The relative gap between the lidar and weather station measurements is on average 4.4 % for HORUS-1, 2.7 % for HORUS-2 and 3.8 % for WALI. The calibration constants found for each lidar are 108 for WALI, 112 for HORUS-1 (T1) and 205 for HORUS-2 (T1). The T1 T2 ratios for HORUS-1 and HORUS-2 are 1.436 and 1.092, respectively.
Figure 9 shows the scatterplots between the two N2 Raman and H2O Raman channels for each HORUS lidar. All the scatterplots highlight a linear relationship between T1 and T2 with a determination coefficient (R2) of 0.99. This linear relationship allows a cross-calibration between the two telescopes as the ratio of the calibration constants of T1 and T2 is constant.
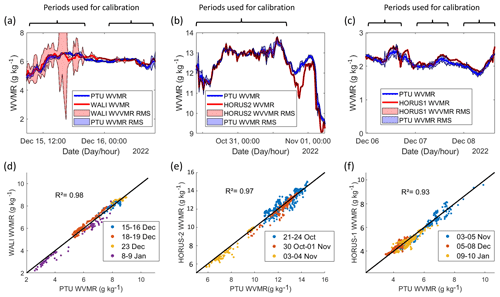
Figure 8Examples of time series during which lidars and ground-based weather station WVMRs were almost the same are given in panels (a) for WALI, (b) for HORUS-2 and (c) for HORUS-1. Root mean square deviations (RMSDs) in WVMRs are represented by the blue- and red-shaded areas. Scatterplots between the weather station and lidar WVMRs for periods during which WVMR values correspond to each other are shown in panels (d) for WALI, (e) for HORUS-2 and (f) for HORUS-1. The different periods are represented by dots of different colors. Determination coefficients R2 are plotted in panels (d), (e) and (f) to show the correlations between lidar and weather station observations. The temporal resolution was 15 min, and the lidar profiles were around 200 m a.m.s.l.
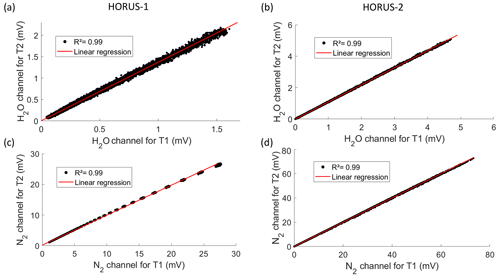
Figure 9Dinitrogen (N2) and water vapor (H2O) Raman channel scatterplots between the two telescopes (T1 and T2) for the (a, c) HORUS-1 and (b, d) HORUS-2 lidars. For HORUS-1, data were taken on 5 January 2023 between 200 and 1000 m in altitude (a.g.l.) and between 00:00 and 06:45 UTC. For HORUS-2, data were taken on 24 October 2022 between 200 and 1000 m a.g.l. and between 00:00 and 06:45 UTC. Initial signals corrected for gain and sky background with a time resolution of approximately 1 min and a vertical resolution of 15 m were used. The regression lines (red lines) and coefficients of determination (R2) are plotted in each figure.
4.2 Examples of WVMR temporal series
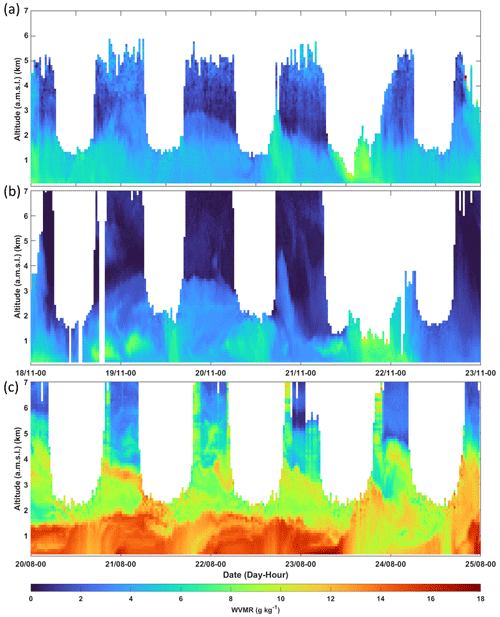
Examples of WVMR temporal series of the vertical profiles for each lidar are given in Fig. 10. These profiles were obtained after processing the raw lidar signals as described in Sect. 3 with a vertical resolution of 100 m and a temporal resolution of 30 min.
HORUS-1 and WALI operated simultaneously for several days during the campaign. This allows us to compare their sampling of the water vapor column. WVMRs retrieved from HORUS-1 (Fig. 10a) and WALI (Fig. 10b) contain similarities due to the geographical locations of the lidar sites (Fig. 2). However, HORUS-1 was in the Rhône delta, in the Camargue region, and sampled air masses that are influenced by the mistral wind flowing down the Rhône valley. These can recirculate over the Mediterranean Sea to reach the Bay of Cannes. During daytime, both sites are subject to sea breezes, which can travel dozens of kilometers inland along the Rhône delta and even along the Durance River. In the case of the Cannes site, this breeze will help to carry humid air masses aloft over the mountains bordering the coast. It is worth noting that there is a significant contrast between day and night in the lower layers, below 2 km a.m.s.l., linked to the breeze cycle. Note that the range limitation of the lidar profiles during the night of 21–22 November 2022 corresponds to the presence of clouds.
Figure 10c shows the evolution of the WVMR vertical profiles over Toulouse from 20 to 25 August 2023. That period appears very humid, with rH values often exceeding 10 g kg−1 in the planetary boundary layer (PBL). Such values could be encountered at tropical latitudes (Flamant et al., 2024). It should be noted that the period studied corresponds to heatwave conditions, with daytime temperatures reaching 43 °C at the Toulouse site. This shows the value of this dataset for studying not only extreme precipitation, but also extreme temperatures. These two types of extreme meteorological situations are among the main threats posed by climate change (IPCC, 2022).
4.3 Errors in the lidar-derived WVMR profiles
4.3.1 Shot noise contribution
To estimate the shot noise contribution to lidar measurement, we apply the Monte Carlo approach explained in Sect. 3.4. To characterize this uncertainty properly, we first need to estimate the SNR. This is made easier during nighttime, when the photon-counting mode is activated. As explained in Measures (1984), the standard deviation (Eq. 9) is then equal to the square root of the returned lidar signal. Using the Monte Carlo approach, the SNR has been estimated for each lidar with profiles averaged over 15 min and a vertical resolution of 100 m as detailed in Sect. 4. Given the lidar characteristics in Table 2, 15 min represents totals of 90 000 laser shots averaged for HORUS-2 and 18 000 for WALI and HORUS-1. The SNR is thus proportional to the square root of the total number of shots. During daytime we also assessed the shot noise contribution to the error by estimating the SNR, which also takes solar luminance into account as in Measures (1984). Moreover, unlike the night detection scheme, the day detection is performed in analog mode, and we must account for the statistical variation in the detector gains.
Given that the signal level of the N2 Raman channel is about 50 times higher than that of the H2O Raman channel, we can consider the uncertainty in the WVMR to be inversely proportional to the SNR of the H2O Raman channel. This rough approximation assumes that signal noise is dominant over other noise sources, which is indeed the case. The evolution of the error εH (g kg−1) as a function of the water vapor channel SNRH is then linear on a logarithmic scale, as shown in Fig. 11a, and can be used to directly determine which SNRH corresponds to the relative uncertainty εH.
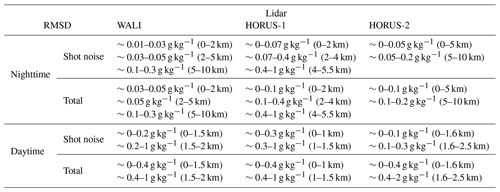
The uncertainty in the WVMR due to the shot noise is plotted during nighttime in Fig. 11b, d, f and daytime in Fig. 11c, e, g, with the reference water vapor profile used in the model represented as black solid lines. These profiles are derived from measurements taken in contrasting periods: on 20 November 2022 (00:00 UTC for the nighttime profile and 10:00 UTC for the daytime profile) for WALI and HORUS-1 and during the day of 2 August 2023 (00:00 UTC for the nighttime profile and 08:00 UTC for the daytime profile) for HORUS-2. As expected, the RMSD values are higher for HORUS-1 due to its lower laser emission energy. The values of the signal noise contribution to the total error are shown in Table 4 for each lidar system.
Note that calculation of the standard deviation of vertical WVMR profiles over a time interval includes both signal noise and natural atmospheric variability. It is worth noting that atmospheric variability is a natural process and not a form of noise derived from the instrument. This natural variability is strongly influenced by the thermal stability of the troposphere due to convection and air mass advection. Generally, it varies more during daytime, but this may depend on the geographical location.
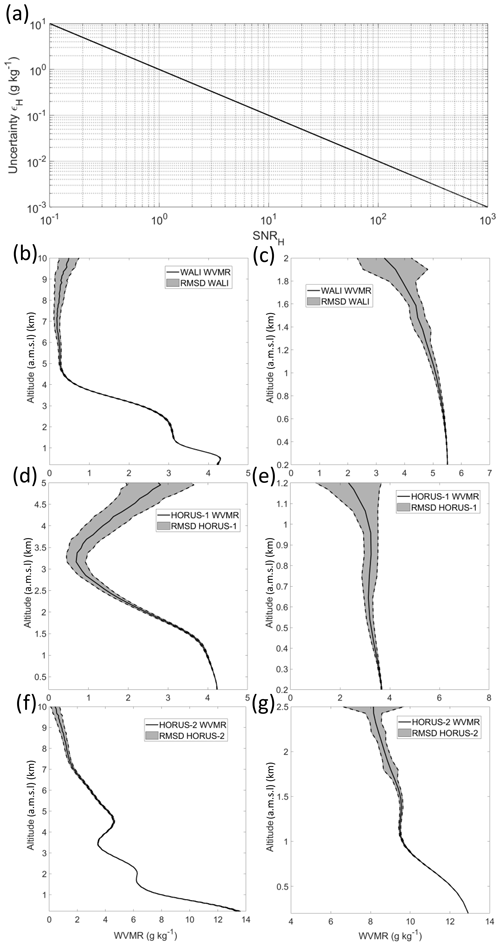
Figure 11The uncertainty variation (εH) as a function of the water vapor channel SNRH is plotted in panel (a). Lidar WVMR profiles as a function of altitude are plotted as solid black lines, and their associated RMSDs are represented by the grey-shaded area during nighttime for (b) WALI, (d) HORUS-2 and (f) HORUS-1 and during daytime for (c) WALI, (e) HORUS-1 and (g) HORUS-2. HORUS-1 and WALI nighttime profiles were taken on the night of 20 November 2022 at 00:00 UTC over Le Grau-du-Roi and Cannes, respectively. Daytime profiles were taken during the day of 20 November 2022 at 10:00 UTC. The HORUS-2 nighttime profile was taken on the night of 2 August 2023 at 00:00 UTC over Toulouse. The daytime profile was taken during the day of 2 August 2023 at 08:00 UTC. The vertical resolution of these profiles is 100 m, and each profile was averaged over 15 min.
4.3.2 Relevance of the calibration
To calibrate the lidars, we used a ground-based weather station as described in Sect. 3.3. To ensure that the calibration is consistent with a conventional radiosonde calibration approach, we were able to compare HORUS-1 and HORUS-2 vertical profiles with specific radiosoundings. In Fig. 12a, a cross-comparison is performed between HORUS-1 and radiosounding measurements from Nîmes, 45 km north-northeast of the lidar's location. In the profiles shown in Fig. 12a, we are limited in altitude by the lidars' SNR, impacted by the presence of clouds above 4.5 km a.g.l. The cross-comparison carried out on the radiosounding at 23:15 UTC shows similar behavior against the altitude, with a mean difference of 0.58 g kg−1 in the entire profile. This is slightly higher than what we would have expected from the previous uncertainty study (Sect. 4.3.1), which suggested a mean difference of 0.15 g kg−1. This could be explained by the natural variability of the atmosphere between the two sites used for the comparison and the fact that the radiosonde drifts over several tens of kilometers between the ground and 4.5 km altitude. This drift implies that the water vapor field may have been different from what would be expected if the radiosonde had ascended in a straight line. This problem represents one of the limitations of radiosondes for lidar calibration. Its impact is very difficult to quantify. As shown in Fig. 12b, the differences between radiosounding and lidar data for HORUS-1 are significantly higher than those for HORUS-2. Indeed, lidar measurements obtained during the Toulouse campaign were compared with a spatiotemporal coincident radiosounding performed by Météo-France on 2 August 2023 at 00:00 UTC. The two types of measurements match between ground level and 10 km a.g.l., close to the tropopause. The cross-comparison gives differences of 0.48 g kg−1 below 3 km a.g.l. and 0.28 g kg−1 above. Note that the standard deviation for the radiosounding WVMR was estimated according to Di Girolamo et al. (2020) and reported in Fig. 12a–b in the blue area. VAISALA® (https://www.vaisala.com/fr/, last access: 13 February 2023) manufacturer information on the uncertainty affecting radiosounding humidity measurements and translated into WVMR is specified to not exceed 0.20–0.25 g kg−1 for temperatures higher than −40 °C.
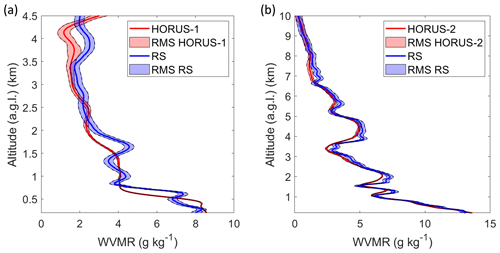
Figure 12Cross-comparison of the WVMR profiles derived from (a) HORUS-1 and a radiosonde (RS) during the night of 12 November 2022 (23:15 UTC). The lidar site was located in Le Grau-du-Roi and the radiosonde in Nîmes. (b) HORUS-2 and a RS during the night of 8 February 2023 (00:00 UTC) over the Météo-France site at Toulouse. The lidars and RS WVMR profiles are plotted in the red and blue lines, respectively. The vertical resolution of the profiles is 15 m. The colored area gives the standard deviation around the mean value.
4.3.3 Molecule and aerosol contributions
The molecule and aerosol contributions to the uncertainty are low compared to the other error sources. The molecular contribution was corrected in the final datasets using the outputs of the European Centre for Medium-Range Weather Forecasts (ECMWF) fifth-generation reanalysis (http://www.ecmwf.int/, last access: 5 January 2024) ERA5. The residual WVMR uncertainty is less than 0.01 g kg−1.
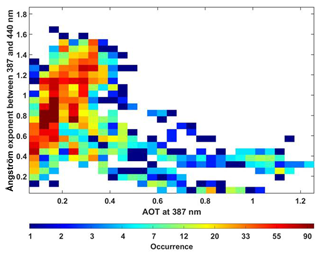
The aerosol contribution remains low though higher than that linked to molecular transmission. The three lidars were set up near the sea (Fig. 2) during the first part of the WaLiNeAs campaign without major pollution or biomass burning aerosol events. The aerosol optical thickness (AOT) is lower than 0.15 at 355 nm, except during two Saharan dust events in October 2022 (AERONET – AErosol RObotic NETwork – site of Toulon; https://aeronet.gsfc.nasa.gov/, last access: 5 January 2024). The majority of the aerosols present in the atmosphere are of marine origin with an Ångström exponent of ∼1 in the UV spectral domain. Applying Eq. (8), the aerosol correction then changes rH by only 0.7 % compared to around 5 % for the molecular transmission if it is not corrected. In the case of desert aerosol events mixed with marine aerosols, the Ångström exponent is ∼0.9 and lower, so even with an AOT on the order of 0.35, they induce a relative bias in rH of less than 1.6 % (less than 0.1 g kg−1 in the dust layer). During the experiment over Toulouse, the AERONET station located at the Météo-France site (https://aeronet.gsfc.nasa.gov/, last access: 5 January 2024) highlights high AOT or Ångström exponent values. Figure 13 shows the bi-dimensional histogram of the AOT at 387 nm and the Ångström exponent between 387 and 440 nm, enabling us to identify which types of aerosols were present in the atmospheric column. The most probable cases make aerosol contributions to the lidar signal that are equal to 0.6 % in the case of polluted dust aerosols (AOT = 0.15 and A=0.8), 2.3 % in the case of dust aerosols (AOT = 1.2 and A=0.4) and 2.1 % in the case of pollution aerosols (AOT = 0.3 and A=1.5). The impact of the last two cases may be considered, but it should be noted that the temporal occurrence of these cases is less than 5 % and induced an uncertainty in the WVMR that is lower than 0.12 g kg−1.
4.3.4 Error source synthesis
For all three lidars, the contributions of the main bias and uncertainty sources are shown in Tables 3 and 4, respectively. The bias that has the greatest impact on the signal is that of calibration, which mainly depends on both the HV variations and the uncertainty linked to the meteorological probe. As expected, the higher RMSDs are encountered during daytime and limit the altitude range of the lidars. The higher the energy per laser shot, the better the precision is. It is also worth noting that the RMSDs may vary based on the presence of more or less moist air masses in the lower or middle troposphere and are higher during daytime. However, they can be mitigated by extending the integration time to create a database of mean profiles.
Table 4Typical RMSDs due to (i) the shot noise and (ii) the shot noise and the atmospheric variability (“Total”) during both nighttime and daytime. Uncertainties are given for different altitude ranges and for each lidar (WALI, HORUS-1 and HORUS-2), accounting for the specific meteorology of each ground-based station during WaLiNeAs. The vertical and temporal resolutions of the lidar profiles considered are 100 m and 15 min, respectively.
5.1 Data format
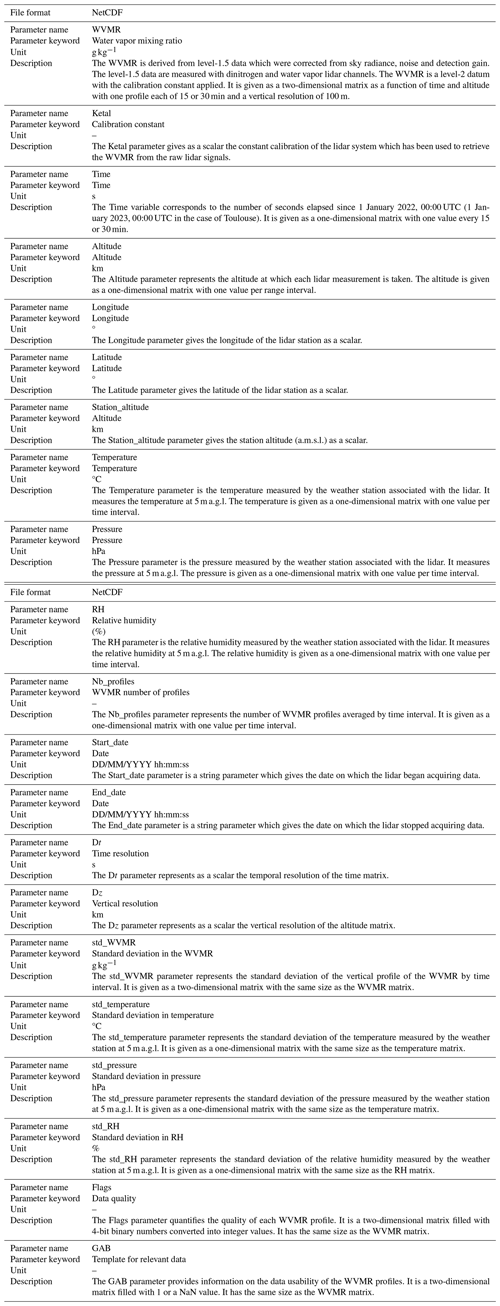
For each lidar site, lidar and weather station data are available in the AERIS database as NetCDF files (version 4) at https://metclim-lidars.aeris-data.fr/ (last access: 6 January 2024). For each site, two NetCDF files have been created, corresponding to time resolutions of 30 and 15 min. The vertical resolution of the WVMR profiles is 100 m for all the lidar profiles. The daily lidar data availabilities are given in Fig. 6, and the measurement configurations of each lidar are described in Table 1. Additional general information is given in Table 5, and Appendix A describes the parameters available in each NetCDF file. The datasets published in the AERIS database (https://doi.org/10.25326/537; Chazette et al., 2023) are freely available. The digital object identifier (DOI) for all the data is https://doi.org/10.25326/537 (Chazette et al., 2023). The typical sizes for the different NetCDF files are between 3.5 and 20 MB for files with a time resolution of 30 min and between 7 and 40 MB for files with a time resolution of 15 min.
5.2 Data quality
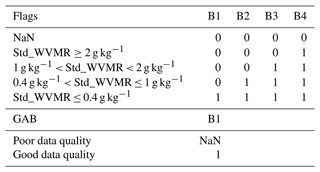
The WVMR products include the two binary quality indicators Flags and GAB in the dataset to provide information on data relevance and quality. The first quality indicator (Flags) is coded with “1” and “0” over 4 bits. This indicator is defined in Table 6. For each altitude of the WMVR profiles, Flags indicates in which range the RMSD of the WVMR lies. The different ranges, defined in Table 6, provide information on the statistical precision of the measurement. The minimum threshold is set to 0.4 g kg−1 to fulfill the World Meteorological Organization (WMO) requirements for atmospheric water vapor measurement accuracy. In order to simplify its rereading by users, the indicator is converted into decimal numbers in NetCDF files. Before being used, it must be converted back to binary. For example, the decimal number 15 corresponds to the binary number “1111”. The GAB parameter takes a value of either 1 or NaN (not a number) for each altitude level of the WVMR temporal evolution. The value 1 indicates data with a good signal, little noise and little error, while the value NaN accounts for noisy signals with a high error value constituting a poor quality signal. The threshold for poor-quality data has been set empirically when the SNR for the water vapor channel is less than 1 and the RMSD for the WVMR is greater than 0.5.
The data are freely available from https://doi.org/10.25326/537 (Chazette et al., 2023).
The WaLiNeAs project aimed to predict extreme precipitation events by measuring WVMRs at high spatiotemporal resolution in the lower troposphere using the Raman lidar technology and by investigating the impact of its variability on numerical weather prediction model forecasts. It is the only instrument currently available to achieve the required vertical and temporal resolutions to improve meteorological forecasting performed by the new generation of mesoscale models such as AROME. As part of the main WaLiNeAs field measurement campaign, the three lidars which constituted the French component of the project continuously measured WVMR profiles over southern France during fall and winter 2022–2023, i.e., the seasons most propitious to HPEs in the western Mediterranean. A second campaign was conducted near Toulouse, France, between June and September 2023, during which the WVMR variability associated with summer storms was documented with a single lidar system. All the data have been processed to retrieve the vertical profiles of the WVMR. The uncertainties have been quantified for various measurement configurations, during nighttime and daytime, as well as for different meteorological situations. They agree with the recommendations given by the WMO, with an absolute accuracy of the WVMR of less than 0.4 g kg−1. On cloudless nights, the 15 and 30 min averages provided the accuracy required to constrain mesoscale modeling between the ground and the tropopause (∼10 km). During the day, the range was greatly reduced, and the lidar used provided access to altitudes higher than 2 km a.g.l. The final datasets include WVMR profiles and parameters measured by the in situ weather stations associated with each lidar. Data quality assessment parameters are also provided. All the datasets are available as NetCDF files and can be freely downloaded from the AERIS database (https://doi.org/10.25326/537; Chazette et al., 2023). Vertical lidar profiles allowed measurement of the water vapor content in the atmosphere with sufficient spatiotemporal resolution to study the different processes that can occur in the air column, mainly in the PBL. Lidar-derived WVMR vertical profiles also allowed us to identify and study the initial conditions that can lead to extreme precipitation events. Given the temporal (15 and 30 min) and vertical (100 m) resolutions of the lidar profiles, the assimilation of lidar data into mesoscale models such as AROME will improve the models' accuracy in predicting which areas will be affected by extreme weather phenomena. Indeed, ground-based lidar measurements fill a gap in observations of the lower troposphere between the ground and ∼2 km altitude. They will also allow the study and understanding of different weather phenomena, such as dust events, heatwaves or HPEs when different atmospheric processes occur in the atmosphere, resulting in a high atmospheric water vapor content.
FL took part in the field campaigns in fall 2022 and summer 2023, calibrated the data, wrote the paper and participated in the creation of the database. PC coordinated the two field campaigns, wrote the paper and created the database. JT and JL took part in the field campaigns in fall 2022. CF coordinated the WaLiNeAs project and took part in the field campaigns in fall 2022. All the authors contributed to the preparation of the campaigns and the proofreading of the paper.
The contact author has declared that none of the authors has any competing interests.
Publisher's note: Copernicus Publications remains neutral with regard to jurisdictional claims made in the text, published maps, institutional affiliations, or any other geographical representation in this paper. While Copernicus Publications makes every effort to include appropriate place names, the final responsibility lies with the authors.
We gratefully acknowledge the local authorities of the Port Camargue harbor master's office, Thales-Alenia-Space, the town of Coursan and the Météo-France center in Toulouse.
This research has been supported by the Agence Nationale de la Recherche via the WaLiNeAs project (grant no. ANR-20-CE04-0001). It was also supported by the French Institut National de l'Univers (INSU) of the Centre National de la Recherche Scientifique (CNRS) and the Commissariat à l'Énergie Atomique et aux Énergies Alternatives (CEA).
This paper was edited by Graciela Raga and reviewed by two anonymous referees.
Ansmann, A., Riebesell, M., Wandinger, U., Weitkamp, C., Voss, E., Lahmann, W., and Michaelis, W.: Combined raman elastic-backscatter LIDAR for vertical profiling of moisture, aerosol extinction, backscatter, and LIDAR ratio, Appl. Phys. B, 55, 18–28, https://doi.org/10.1007/BF00348608, 1992.
Chazette, P.: The monsoon aerosol extinction properties at Goa during INDOEX as measured with lidar, J. Geophys. Res.-Atmos., 108, 4187, https://doi.org/10.1029/2002jd002074, 2003.
Chazette, P., Bocquet, M., Royer, P., Winiarek, V., Raut, J. C., Labazuy, P., Gouhier, M., Lardier, M., and Cariou, J. P.: Eyjafjallajökull ash concentrations derived from both lidar and modeling, J. Geophys. Res.-Atmos., 117, D00U14, https://doi.org/10.1029/2011JD015755, 2012a.
Chazette, P., Dabas, A., Sanak, J., Lardier, M., and Royer, P.: French airborne lidar measurements for Eyjafjallajökull ash plume survey, Atmos. Chem. Phys., 12, 7059–7072, https://doi.org/10.5194/acp-12-7059-2012, 2012b.
Chazette, P., Marnas, F., and Totems, J.: The mobile Water vapor Aerosol Raman LIdar and its implication in the framework of the HyMeX and ChArMEx programs: application to a dust transport process, Atmos. Meas. Tech., 7, 1629–1647, https://doi.org/10.5194/amt-7-1629-2014, 2014a.
Chazette, P., Marnas, F., Totems, J., and Shang, X.: Comparison of IASI water vapor retrieval with H2O-Raman lidar in the framework of the Mediterranean HyMeX and ChArMEx programs, Atmos. Chem. Phys., 14, 9583–9596, https://doi.org/10.5194/acp-14-9583-2014, 2014b.
Chazette, P., Flamant, C., Raut, J. C., Totems, J., and Shang, X.: Tropical moisture enriched storm tracks over the Mediterranean and their link with intense rainfall in the Cevennes-Vivarais area during HyMeX, Q. J. Roy. Meteor. Soc., 142, 320–334, https://doi.org/10.1002/qj.2674, 2016.
Chazette, P., Totems, J., and Shang, X.: Atmospheric aerosol variability above the Paris Area during the 2015 heat wave – Comparison with the 2003 and 2006 heat waves, Atmos. Environ., 170, 216–233, https://doi.org/10.1016/j.atmosenv.2017.09.055, 2017.
Chazette, P., Laly, F., Totems, J., and Lagarrigue, J.: WaLiNeAs France, Aeris [data set], https://doi.org/10.25326/537, 2023.
Dettinger, M.: Climate change, atmospheric rivers, and floods in California – a multimodel analysis of storm frequency and magnitude changes, J. Am. Water Resour. Assoc., 47, 514–523, https://doi.org/10.1111/j.1752-1688.2011.00546.x, 2011.
Di Girolamo, P., De Rosa, B., Flamant, C., Summa, D., Bousquet, O., Chazette, P., Totems, J., and Cacciani, M.: Water vapor mixing ratio and temperature inter-comparison results in the framework of the Hydrological Cycle in the Mediterranean Experiment—Special Observation Period 1, B. Atmos. Sci. Technol., 1, 113–153, https://doi.org/10.1007/s42865-020-00008-3, 2020.
Drobinski, P., Ducrocq, V., Alpert, P., Anagnostou, E., Béranger, K., Borga, M., Braud, I., Chanzy, A., Davolio, S., Delrieu, G., Estournel, C., Filali Boubrahmi, N., Font, J., Grubišić, V., Gualdi, S., Homar, V., Ivančan-Picek, B., Kottmeier, C., Kotroni, V., Lagouvardos, K., Lionello, P., Llasat, M. C., Ludwig, W., Lutoff, C., Mariotti, A., Richard, E., Romero, R., Rotunno, R., Roussot, O., Ruin, I., Somot, S., Taupier-Letage, I., Tintor, J., Uijlenhoet, R., and Wernli, H.: HYMEX: A 10-year multidisciplinary program on the mediterranean water cycle, B. Am. Meteorol. Soc., 95, 1063–1082, https://doi.org/10.1175/BAMS-D-12-00242.1, 2014.
Ducrocq, V., Nuissier, O., Ricard, D., Lebeaupin, C., and Thouvenin, T.: A numerical study of three catastrophic precipitating events over southern France. II: Mesoscale triggering and stationarity factors, Q. J. Roy. Meteor. Soc., 134, 131–145, https://doi.org/10.1002/qj.199, 2008.
Ducrocq, V., Braud, I., Davolio, S., Ferretti, R., Flamant, C., Jansa, A., Kalthoff, N., Richard, E., Taupier-Letage, I., Ayral, P. A., Belamari, S., Berne, A., Borga, M., Boudevillain, B., Bock, O., Boichard, J. L., Bouin, M. N., Bousquet, O., Bouvier, C., Chiggiato, J., Cimini, D., Corsmeier, U., Coppola, L., Cocquerez, P., Defer, E., Delanoë, J., Di Girolamo, P., Doerenbecher, A., Drobinski, P., Dufournet, Y., Fourrié, N., Gourley, J. J., Labatut, L., Lambert, D., Le Coz, J., Marzano, F. S., Molinié, G., Montani, A., Nord, G., Nuret, M., Ramage, K., Rison, W., Roussot, O., Said, F., Schwarzenboeck, A., Testor, P., Van Baelen, J., Vincendon, B., Aran, M., and Tamayo, J.: HyMeX-SOP1: The field campaign dedicated to heavy precipitation and flash flooding in the northwestern mediterranean, B. Am. Meteorol. Soc., 95, 1083–1100, https://doi.org/10.1175/BAMS-D-12-00244.1, 2014.
Duffourg, F. and Ducrocq, V.: Origin of the moisture feeding the Heavy Precipitating Systems over Southeastern France, Nat. Hazards Earth Syst. Sci., 11, 1163–1178, https://doi.org/10.5194/nhess-11-1163-2011, 2011.
Duffourg, F., Nuissier, O., Ducrocq, V., Flamant, C., Chazette, P., Delanoë, J., Doerenbecher, A., Fourrié, N., Di Girolamo, P., Lac, C., Legain, D., Martinet, M., Saïd, F., and Bock, O.: Offshore deep convection initiation and maintenance during the HyMeX IOP 16a heavy precipitation event, Q. J. Roy. Meteor. Soc., 142, 259–274, https://doi.org/10.1002/qj.2725, 2016.
Duffourg, F., Lee, K. O., Ducrocq, V., Flamant, C., Chazette, P., and Di Girolamo, P.: Role of moisture patterns in the backbuilding formation of HyMeX IOP13 heavy precipitation systems, Q. J. Roy. Meteor. Soc., 144, 291–303, https://doi.org/10.1002/qj.3201, 2018.
Flamant, C., Chazette, P., Caumont, O., Di Girolamo, P., Behrendt, A., Sicard, M., Totems, J., Lange, D., Fourrié, N., Brousseau, P., Augros, C., Baron, A., Cacciani, M., Comerón, A., De Rosa, B., Ducrocq, V., Genau, P., Labatut, L., Muñoz-Porcar, C., Rodríguez-Gómez, A., Summa, D., Thundathil, R., and Wulfmeyer, V.: A network of water vapor Raman lidars for improving heavy precipitation forecasting in southern France: introducing the WaLiNeAs initiative, B. Atmos. Sci. Technol., 2, 10, https://doi.org/10.1007/s42865-021-00037-6, 2021.
Flamant, C., Chaboureau, J. P., Delanoë, J., Gaetani, M., Jamet, C., Lavaysse, C., Bock, O., Borne, M., Cazenave, Q., Coutris, P., Cuesta, J., Menut, L., Aubry, C., Benedetti, A., Bosser, P., Bounissou, S., Caudoux, C., Collomb, H., Donal, T., Febvre, G., Fehr, T., Fink, A. H., Formenti, P., Araujo, N. G., Knippertz, P., Lecuyer, E., Andrade, M. N., Langué, C. G. N., Jonville, T., Schwarzenboeck, A., and Takeishi, A.: Cyclogenesis in the Tropical Atlantic First Scientific Highlights from the Clouds–Atmospheric Dynamics–Dust Interactions in West Africa (CADDIWA) Field Campaign, B. Am. Meteorol. Soc., 105, E387–E417, https://doi.org/10.1175/BAMS-D-23-0230.1, 2024.
Flaounas, E., Kotroni, V., Lagouvardos, K., and Flaounas, I.: CycloTRACK (v1.0) – tracking winter extratropical cyclones based on relative vorticity: sensitivity to data filtering and other relevant parameters, Geosci. Model Dev., 7, 1841–1853, https://doi.org/10.5194/gmd-7-1841-2014, 2014.
Foth, A., Baars, H., Di Girolamo, P., and Pospichal, B.: Water vapour profiles from Raman lidar automatically calibrated by microwave radiometer data during HOPE, Atmos. Chem. Phys., 15, 7753–7763, https://doi.org/10.5194/acp-15-7753-2015, 2015.
Fourrié, N., Nuret, M., Brousseau, P., Caumont, O., Doerenbecher, A., Wattrelot, E., Moll, P., Bénichou, H., Puech, D., Bock, O., Bosser, P., Chazette, P., Flamant, C., Di Girolamo, P., Richard, E., and Saïd, F.: The AROME-WMED reanalyses of the first special observation period of the Hydrological cycle in the Mediterranean experiment (HyMeX), Geosci. Model Dev., 12, 2657–2678, https://doi.org/10.5194/gmd-12-2657-2019, 2019.
Giorgi, F. and Lionello, P.: Climate change projections for the Mediterranean region, Glob. Planet. Change, 63, 90–104, https://doi.org/10.1016/j.gloplacha.2007.09.005, 2008.
Guidard, V., Fourrié, N., Brousseau, P., and Rabier, F.: Impact of IASI assimilation at global and convective scales and challenges for the assimilation of cloudy scenes, Q. J. Roy. Meteor. Soc., 137, 1975–1987, https://doi.org/10.1002/qj.928, 2011.
Held, I. M. and Soden, B. J.: Water vapor feedback and global warming, Annu. Rev. Energ. Environ., 25, 441–475, https://doi.org/10.1146/annurev.energy.25.1.441, 2000.
Hilton, F., Atkinson, N. C., English, S. J., and Eyre, J. R.: Assimilation of IASI at the Met Office and assessment of its impact through observing system experiments, Q. J. Roy. Meteor. Soc., 135, 495–505, https://doi.org/10.1002/qj.379, 2009.
IPCC: Climate Change 2022: Impacts, Adaptation, and Vulnerability. Contribution of Working Group II to the Sixth Assessment Report of the Intergovernmental Panel on Climate Change, edited by: Pörtner, H.-O., Roberts, D. C., Tignor, M., Poloczanska, E. S., Mintenbeck, K., Alegría, A., Craig, M., Langsdorf, S., Löschke, S., Möller, V., Okem, A., and Rama, B., Cambridge University Press, Cambridge, UK and New York, NY, USA, 3056 pp., https://doi.org/10.1017/9781009325844, 2022.
Mattis, I., Ansmann, A., Müller, D., Wandinger, U., and Althausen, D.: Dual-wavelength Raman lidar observations of the extinction-to-backscatter ratio of Saharan dust, Geophys. Res. Lett., 29, 20-1–20-4, https://doi.org/10.1029/2002gl014721, 2002.
Measures, R. M.: Laser remote sensing fundamentals and applications, EOS, 66, 686–686, https://doi.org/10.1029/eo066i040p00686-05, 1984.
Nicolet, M.: On the molecular scattering in the terrestrial atmosphere: An empirical formula for its calculation in the homosphere, Planet. Space Sci., 32, 1467–1468, https://doi.org/10.1016/0032-0633(84)90089-8, 1984.
Pfahl, S., Madonna, E., Boettcher, M., Joos, H., and Wernli, H.: Warm conveyor belts in the ERA-Interim Dataset (1979–2010). Part II: Moisture origin and relevance for precipitation, J. Climate, 27, 27–40, https://doi.org/10.1175/JCLI-D-13-00223.1, 2014.
Raut, J.-C. and Chazette, P.: Assessment of vertically-resolved PM10 from mobile lidar observations, Atmos. Chem. Phys., 9, 8617–8638, https://doi.org/10.5194/acp-9-8617-2009, 2009.
Reichardt, J., Wandinger, U., Klein, V., Mattis, I., Hilber, B., and Begbie, R.: RAMSES: German meteorological service autonomous Raman Iidar for water vapor, temperature, aerosol, and cloud measurements, Appl. Optics, 51, 8111–8131, https://doi.org/10.1364/AO.51.008111, 2012.
Ricard, D., Ducrocq, V., and Auger, L.: A climatology of the mesoscale environment associated with heavily precipitating events over a northwestern Mediterranean area, J. Appl. Meteorol. Climatol., 51, 468–488, https://doi.org/10.1175/JAMC-D-11-017.1, 2012.
Royer, P., Chazette, P., Lardier, M., and Sauvage, L.: Aerosol content survey by mini N2-Raman lidar: Application to local and long-range transport aerosols, Atmos. Environ., 45, 7487–7495, https://doi.org/10.1016/j.atmosenv.2010.11.001, 2011.
Ruti, P. M., Somot, S., Giorgi, F., Dubois, C., Flaounas, E., Obermann, A., Dell'Aquila, A., Pisacane, G., Harzallah, A., Lombardi, E., Ahrens, B., Akhtar, N., Alias, A., Arsouze, T., Aznar, R., Bastin, S., Bartholy, J., Béranger, K., Beuvier, J., Bouffies-Cloché, S., Brauch, J., Cabos, W., Calmanti, S., Calvet, J. C., Carillo, A., Conte, D., Coppola, E., Djurdjevic, V., Drobinski, P., Elizalde-Arellano, A., Gaertner, M., Galàn, P., Gallardo, C., Gualdi, S., Goncalves, M., Jorba, O., Jordà, G., L'Heveder, B., Lebeaupin-Brossier, C., Li, L., Liguori, G., Lionello, P., Maciàs, D., Nabat, P., Önol, B., Raikovic, B., Ramage, K., Sevault, F., Sannino, G., Struglia, M. V., Sanna, A., Torma, C., and Vervatis, V.: Med-CORDEX initiative for Mediterranean climate studies, B. Am. Meteorol. Soc., 97, 1187–1208, https://doi.org/10.1175/BAMS-D-14-00176.1, 2016.
Seity, Y., Malardel, S., Hello, G., Bénard, P., Bouttier, F., Lac, C., and Masson, V.: The AROME-France convective-scale operational model, Mon. Weather Rev., 139, 976–991, https://doi.org/10.1175/2010MWR3425.1, 2011.
Totems, J., Chazette, P., and Baron, A.: Mitigation of bias sources for atmospheric temperature and humidity in the mobile Raman Weather and Aerosol Lidar (WALI), Atmos. Meas. Tech., 14, 7525–7544, https://doi.org/10.5194/amt-14-7525-2021, 2021.
Wang, Y., Sartelet, K. N., Bocquet, M., and Chazette, P.: Assimilation of ground versus lidar observations for PM10 forecasting, Atmos. Chem. Phys., 13, 269–283, https://doi.org/10.5194/acp-13-269-2013, 2013.
Wang, Y., Sartelet, K. N., Bocquet, M., Chazette, P., Sicard, M., D'Amico, G., Léon, J. F., Alados-Arboledas, L., Amodeo, A., Augustin, P., Bach, J., Belegante, L., Binietoglou, I., Bush, X., Comerón, A., Delbarre, H., García-Vízcaino, D., Guerrero-Rascado, J. L., Hervo, M., Iarlori, M., Kokkalis, P., Lange, D., Molero, F., Montoux, N., Muñoz, A., Muñoz, C., Nicolae, D., Papayannis, A., Pappalardo, G., Preissler, J., Rizi, V., Rocadenbosch, F., Sellegri, K., Wagner, F., and Dulac, F.: Assimilation of lidar signals: application to aerosol forecasting in the western Mediterranean basin, Atmos. Chem. Phys., 14, 12031–12053, https://doi.org/10.5194/acp-14-12031-2014, 2014.
Whiteman, D. N., Melfi, S. H., and Ferrare, R. A.: Raman lidar system for the measurement of water vapor and aerosols in the Earth's atmosphere, Appl. Optics, 31, 3068–3082, https://doi.org/10.1364/ao.31.003068, 1992.
Winschall, A., Pfahl, S., Sodemann, H., and Wernli, H.: Impact of North Atlantic evaporation hot spots on southern Alpine heavy precipitation events, Q. J. Roy. Meteor. Soc., 138, 1245–1258, https://doi.org/10.1002/qj.987, 2012.


