the Creative Commons Attribution 4.0 License.
the Creative Commons Attribution 4.0 License.
Coastal Atmosphere and Sea Time Series (CoASTS) and Bio-Optical mapping of Marine Properties (BiOMaP): the CoASTS-BiOMaP dataset
Giuseppe Zibordi
Jean-François Berthon
The Coastal Atmosphere and Sea Time Series (CoASTS) and Bio-Optical mapping of Marine Properties (BiOMaP) programs produced bio-optical data supporting satellite ocean color applications for more than 2 decades. Specifically, relying on the Acqua Alta Oceanographic Tower (AAOT) in the northern Adriatic Sea, from 1995 till 2016 CoASTS produced time series of marine water apparent and inherent optical properties, in addition to the concentration of major optically significant water constituents. Almost concurrently, from 2000 till 2022 BiOMaP produced equivalent spatially distributed measurements across major European seas. Both CoASTS and BiOMaP applied standardized instruments, measurement methods, quality control schemes and processing codes to ensure temporal and spatial consistency in data products. This work presents the CoASTS and BiOMaP near-surface data product, named CoASTS-BiOMaP, which is of relevance to ocean color bio-optical modeling and validation activities. The data are available at https://doi.org/10.1594/PANGAEA.971945 (Zibordi and Berthon, 2024).
- Article
(9665 KB) - Full-text XML
- BibTeX
- EndNote
The validation of primary (i.e., radiometric) and derived (e.g., phytoplankton pigment concentrations) satellite data products, together with the development of bio-optical algorithms linking radiometric data to the inherent optical properties or the concentration of natural water optically significant constituents, requires accurate and comprehensive in situ bio-optical measurements (e.g., see Werdell and Bailey, 2005). Anticipating this need for the Sea-viewing Wide Field-of-view Sensor (SeaWiFS) ocean color mission, during the 1990s several measurement programs were established to gather bio-optical data representative of world marine waters. Of these, the Coastal Atmosphere and Sea Time Series (CoASTS) and Bio-Optical mapping of Marine Properties (BiOMaP) measurement programs, implemented by the Marine Optical Laboratory (Belward et al., 2022) of the Joint Research Center (JRC) in collaboration with a number of European institutions, produced comprehensive in situ bio-optical measurements of relevance for satellite ocean color applications. While CoASTS benefited from the Acqua Alta Oceanographic Tower (AAOT) in the northern Adriatic Sea to generate time series data at a fixed coastal site (Berthon et al., 2002; Zibordi et al., 2002), BiOMaP relied on oceanographic ships to collect spatially distributed measurements across various European seas (Berthon et al., 2008; Zibordi et al., 2011). Both CoASTS and BiOMaP endorsed standardization of instruments, measurement methods, quality control schemes and processing codes to enforce consistency in temporally and spatially distributed data products. It is still recognized that some of the measurement methods primarily implemented for optically complex coastal waters may not guarantee the desirable high accuracy in oligotrophic clear waters.
Overall, CoASTS and BiOMaP data extend over a period exceeding 2 decades and constitute a unique dataset for bio-optical investigations across a variety of water types with potential application to climate change studies. The objective of this work is to introduce the CoASTS- and BiOMaP-derived data products relevant for satellite ocean color applications. Specifically, the near-surface data products with spectral values restricted to key ocean color center wavelengths are presented, together with a description of the measurement and data reduction methods.
CoASTS and BiOMaP were conceived as complementary programs: CoASTS focused on the generation of time series of reference data from a fixed coastal site showing significant seasonal cycles and moderate bio-optical complexity (Berthon et al., 2002); conversely, BiOMaP covered a variety of marine regions exhibiting very diverse bio-optical regimes but with limited temporal representativity (Berthon et al., 2008).
The use of an oceanographic tower as a logistical platform for comprehensive optical and bio-geochemical measurements, when compared to oceanographic ships, does not allow for spatially extended observations. However, it offers the unique opportunity of a very stable measurement platform, enabling easy control of the deployment geometry of optical instruments with respect to the structure. Specifically, regardless of the sea state, the use of the AAOT as a measurement platform made possible the deployment of optical sensors relying on tower–sensor–Sun geometry favoring the application of corrections for the minimization of potential superstructure perturbations in radiometric data (Zibordi et al., 1999; Doyle and Zibordi, 2002).
CoASTS measurements are representative of marine frontal regions exhibiting occurrence of waters with optical properties largely determined by phytoplankton and its degradation components (i.e., Case-1 waters), as well as optically complex waters characterized by moderate concentrations of sediments and colored dissolved organic matter (CDOM), with their bio-optical variability determined by the impact of local currents, seasonal changes in biological regimes and river discharge (Berthon et al., 2002).
CoASTS measurements took place with monthly occurrence from 1995. However, from 2001 to the end of the measurement program in 2016, the frequency of the field measurements was reduced to one every 2–3 months. Each comprehensive data collection – called a station – included in-water optical and hydrographic profiles, seawater samples at different depths (i.e., near surface, 8 and 14 m), meteorological data and visual observations of cloud cover and sea state. CoASTS comprises 176 field campaigns, leading to 883 measurement stations. Still, only CoASTS campaigns and stations from December 1998 onward (i.e., 125 and 617, respectively) fulfilled the requirement of measurement standardization.
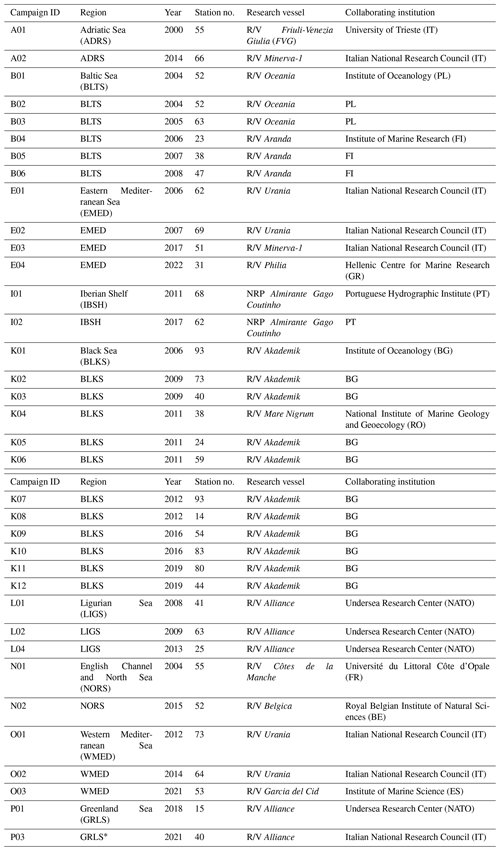
Spatially distributed measurements are most possible using oceanographic ships. Because of this, BiOMaP measurements were taken by relying on research vessels across a variety of bio-optical regions (see Berthon et al., 2008): the Baltic Sea exhibiting waters dominated by a high concentration of CDOM; the Adriatic Sea, Black Sea, North Sea (including the English Channel), Ligurian Sea, Iberian Shelf and Greenland Sea characterized by a variety of optically complex waters determined by diverse concentrations of CDOM and suspended particulate matter (SPM); and finally the eastern and western Mediterranean oligotrophic and mesotrophic seas with optical properties largely determined by phytoplankton and its degradation components.
BiOMaP, encompassing 36 bio-optical oceanographic campaigns and 1915 measurement stations, started in 2000 and ended in 2022. It is mentioned that some measurements from 33 BiOMaP stations performed in the Black Sea in 2011 were included in an independent dataset constructed to support the validation of satellite data products (Valente et al., 2016).
As already anticipated, measurement consistency between the CoASTS and BiOMaP programs was achieved by using identical field and laboratory instrumentation and applying the same consolidated methods, quality control schemes and processing codes. Consequently, the BiOMaP measurements from each station exhibit equivalence to those of CoASTS, except when restricting the collection of water samples near the surface. Finally, superstructure perturbations in the BiOMaP radiometric data were avoided by operating optical radiometers on free-fall profilers deployed at some distance from the ships (IOCCG, 2019a).
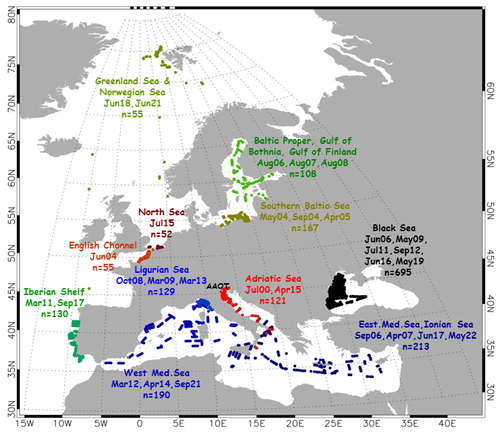
Figure 1 shows the temporal evolution of the CoASTS measurement campaigns and the number of stations per campaign (see also Table 1). The latter largely benefited from the sea state conditions, allowing access to the tower. Figure 2 shows the overall distribution of the BiOMaP stations across the various European seas (see also Table 2).

Figure 1CoASTS measurement campaigns (176 total, 125 since December 1998) and stations (883 total, 617 since December 1998) completed between 1995 and 2016.
Table 1The CoASTS measurement program: campaign identifiers, marine regions, years, number of stations, research platforms and collaborating institutions.

CoASTS and BiOMaP core data comprise in situ and laboratory measurements performed on samples prepared in the field. The first ones include the following:
- a.
multispectral profiles of upwelling nadir radiance Lu(z,λ), downward irradiance Ed(z,λ) and upward irradiance Eu(z,λ), where z indicates the depth and λ the center wavelength of each spectral band;
- b.
multispectral above-water downward irradiance Es(t,λ) acquired during in-water profiling (where t is the time corresponding to the depth z) and diffuse sky irradiance Ei(t,λ) acquired at the end of each station with an irradiance sensor operated in conjunction with a rotating shadow band;
- c.
multispectral profiles of beam attenuation c(z,λ), absorption a(z,λ) and backscattering bb(z,λ) coefficients, commonly restricted to the first 25 m in depth for BiOMaP and 15 m for CoASTS;
- d.
profiles of water temperature Tw(z) and salinity Sw(z), also restricted to the first 25 m in depth for BiOMaP and 15 m for CoASTS; and
- e.
meteorological data including wind speed Ws in addition to cloud cover Cc and sea state Ss observations.
The laboratory measurements performed on field samples, complementary to the in situ ones, are
- f.
the spectral in vivo particulate absorption coefficients aph(z,λ) for the pigmented particles and adt(z,λ) for the nonpigmented particles,
- g.
the spectral CDOM absorption coefficient ays(z,λ),
- h.
the phytoplankton pigment concentrations, and
- i.
the suspended particulate matter concentration.
The information on the measurement methods and data reduction is summarized in the following subsections.
4.1 Radiometric products
CoASTS in-water radiometric measurements of Lu(z,λ), Ed(z,λ) and Eu(z,λ) were performed with the Wire-Stabilized Profiling Environmental Radiometer (WiSPER) using Satlantic (Halifax, Canada) OCR/OCI-200 multispectral radiometer series. Concurrently, above-water Es(t,λ) and Ei(t,λ) measurements were also collected with OCI-200 radiometers. In the case of BiOMaP, the equivalent measurements were performed using miniPRO and microPRO Satlantic custom-designed free-fall profilers equipped with OCR/OCI-200 or OCR-507 multispectral radiometers. All radiometric quantities were measured with a 6 Hz acquisition rate at spectral bands relevant for ocean color applications with a 10 nm bandwidth and nominal center wavelengths at 412, 443, 490, 510, 555, 665 and 683 nm. WiSPER data were gathered with a deployment speed of 0.1 m s−1. Conversely, the deployment speed of the free-fall systems generally varied in the range of approximately 0.3–0.4 m s−1. Collection of in-water radiometric measurements with a low tilt and as close as possible to the surface was always attempted to ensure the best retrieval of subsurface radiometric values through the extrapolation of profile data.
Regular absolute radiometric calibration of field optical radiometers was performed at the JRC Marine Optical Laboratory using 1000 W FEL lamps traceable to the National Institute of Standards and Technology (NIST) or the National Physical Laboratory (NPL). While CoASTS radiometers were recalibrated on a 6-monthly basis, BiOMaP radiometers were calibrated before and after each oceanographic campaign. Regular inter-calibrations between the JRC Marine Optical Laboratory and the National Aeronautics and Space Administration (NASA) performed in the framework of the Ocean Color component of the Aerosol Robotic Network (AERONET-OC) ensured continuous verification of the accuracy of the calibration process (Zibordi et al., 2021).
The data preprocessing included (i) the application of absolute calibration coefficients and immersion factors for in-water radiometers (Zibordi et al., 2004; Zibordi, 2006) and (ii) the removal of in-water and in-air data exhibiting tilts higher than 5° (this was confidently established from 2009 for BiOMaP Es(t,λ) and Ei(t,λ)). Limited to BiOMaP, the combination of successive profile data typically collected within a 5 min interval (multi-cast profiles) increased the number of measurements per unit depth and consequently improved the precision of the extrapolated values. The in-air irradiance data were corrected for the non-cosine response of the collectors (see Zibordi and Bulgarelli, 2007). Additional corrections for non-ideal sensor performance, such as out-of-band responses or temperature dependence, were not implemented, being considered minor for the multispectral instruments applied.
In agreement with consolidated protocols (e.g., see IOCCG, 2019a), the impacts of illumination changes on the profile data were minimized through normalization of each radiometric quantity with respect to the above-water downward irradiance Es(t,λ) simultaneous to the in-water measurements. Specifically, the normalization aimed to produce radiometric quantities as if they were taken at the same time t0 at each depth z, where t0 was chosen to coincide with the beginning of the acquisition sequence during each cast or multi-cast.
The subsurface quantities , and were then determined at depth z0= 0 (identified as 0−) as the exponentials of the intercepts resulting from the least-squares linear regressions of ln ℑ(z,λ) and z within the extrapolation interval z0−z1, where ℑ(z,λ) indicates Lu(z,λ), Ed(z,λ) or Eu(z,λ) normalized with respect to Es(t,λ) at matching times. The extrapolation interval was chosen on a profile-by-profile basis with the aid of absorption and scattering profile data to identify the depths z0 and z1, which are generally between 0.3 and 5 m and best satisfy the requirement of linear decay with depth of the log-transformed radiometric values. The application of linear extrapolations to log-transformed data to determine subsurface radiometric values, as an alternative to the use of nonlinear exponential extrapolations (see D'Alimonte et al., 2013), was suggested by the objective of ensuring consistency with the existing radiometric datasets.
Extreme outliers in the z0–z1 depth interval generally due to major wave focusing and shadowing effects were excluded from the extrapolation process by removing points exhibiting distances greater than 3σ from the linear regression line, where σ is the standard deviation of the differences between the data points and the regression line. This filtering process is mostly effective in the presence of a relatively small number of points in the extrapolation layer. The application of a very slow deployment speed in the case of CoASTS radiometric data and the application of the multi-cast method for BiOMaP data ensured the availability of hundreds of measurements in each selected extrapolation interval. This restricts the application of the 3σ filter to a few extreme values without significantly impacting the precision of the extrapolated data.
The and data products were corrected for self-shading and potential bottom perturbations (Zibordi et al., 2002). Additionally, limited to CoASTS data collected in the vicinity of the AAOT, corrections were applied for perturbations due to the deployment structure (Doyle and Zibordi, 2002; Doyle et al., 2003). BiOMaP data, generally collected at distances from the ship of approximately 15–30 m, did not require corrections for the perturbations by the deployment structure.
In addition to , and , further retrieved data products are the slopes of the regression fits Kℑ(λ) (i.e., KL(λ), Ku(λ) and Kd(λ)) in the extrapolation interval, i.e., the diffuse attenuation coefficients. These Kℑ(λ) values, and particularly Kd(λ), may exhibit underestimated values due to the impact of wave focusing in the near-surface water layer. This effect is expected to be more pronounced for radiometric profiles collected in clear waters under clear-sky conditions.
The derived radiometric data products are then the remote sensing reflectance Rrs(λ)
and the normalized water-leaving radiance Lwn(λ):
where Es(λ) refers to the value measured at time t0, E0(λ) is the extra-atmospheric solar irradiance (Thuillier et al., 2003) at the mean Sun–Earth distance, and Lw(λ) is the water-leaving radiance, i.e., the radiance leaving the sea quantified just above the surface through the extrapolation process and given by
where the factor 0.544 accounts for the radiance reduction across the water surface due to the change in the refractive index at the air–water interface, as determined by assuming that the refractive index of seawater is independent of the wavelength (Austin, 1974). It is acknowledged that the values of Lw(λ) determined with Eq. (3) assuming a flat sea surface exhibit differences well within ±1 % with respect to the values computed by accounting for the spectral dependence of the water refractive index in the spectral range of interest (Voss and Flora, 2017). Finally, another derived quantity is the Q factor at nadir Qn(0 determined by the ratio of to spectrally fitted to a quadratic function in the 412–555 nm interval to minimize the impact of calibration and extrapolation uncertainties. The ratio of the fitted Qn(0 to provides a basic approach to evaluating the relative consistency of the and spectral values (e.g., any appreciable bias affecting a single spectral value leads to a spectral inconsistency in ).
The quantities Rrs(λ) and Lwn(λ), due to the normalization with respect to Es(λ), benefit from the first correction for changes in illumination conditions with Sun zenith, Sun–Earth distance and atmospheric transmittance (Mueller and Austin, 1995). The additional correction performed through the application of the factors to Lwn(λ) and analogously to Rrs(λ) accounts for in-water bidirectional effects and leads to the determination of the final LWN(λ) and RRS(λ) data products. The factors are a function of the water inherent optical properties (IOPs, absorption and backscattering coefficients), the atmospheric optical properties conveniently expressed through the aerosol optical depth τa and the Sun zenith angle θ0. These correction factors were determined by applying the tabulated values proposed by Morel et al. (2002) for Case-1 waters, with the IOPs expressed solely as a function of the total chlorophyll a concentration (Chl a) as determined from water samples for each measurement station. It is acknowledged that this correction may be affected by large uncertainties when applied to optically complex waters. Still, the inclusion of both Lw(λ) and Es(λ), together with the spectral values of the water IOPs, would allow any potential user of the CoASTS-BiOMaP dataset to implement alternative solutions for the determination of LWN(λ) and RRS(λ).
An estimate of the uncertainties for CoASTS and BiOMaP LWN and (similarly) RRS data was attempted and discussed in various publications (Zibordi and Voss, 2010; Zibordi et al., 2011), accounting for the major uncertainties characterizing (i) absolute calibration coefficients and immersion factors, (ii) correction factors for shading perturbations, (iii) correction factors for in-water bidirectional effects, (iv) the determination of Es(λ), (v) the quantification of E0(λ) when ignoring actual bandwidths, (vi) the extrapolation process for the computation of subsurface data and (vii) finally environmental effects as a result of wave perturbations and changes in illumination conditions and seawater optical properties during profiling. In the specific case of moderate optically complex waters such as those characterizing CoASTS measurements, the uncertainties affecting LWN and RRS are expected to approach 5 % in the blue–green spectral region and 7 % in the red spectral region. In agreement with analyses performed for alternative in situ radiometric methods (Gergely and Zibordi, 2013), the above relative uncertainties may become significantly larger in the blue spectral region for data products from marine regions characterized by high water absorption such as the Baltic Sea.
Quality indices for radiometric products were determined during data processing with a view to supporting an evaluation of their accuracy. These include (i) the ratio of Qn values determined at depths 0− and 1 m at the 412 nm center wavelength, whose significant deviation from 1 suggests issues with the extrapolation of subsurface values; (ii) the coefficient of variation CV_Es(412) of in-air downward irradiance for the extrapolation interval, whose high value indicates significant perturbations by ship movement or changes in illumination conditions during profiling; (iii) the diffuse-to-direct ratio of above-water downward irradiance Rd(412), whose high value indicates poor illumination conditions that are likely due to high Sun zeniths or cloudiness; (iv) the index , whose significant deviation from 1 indicates inconsistency between in-air and in-water measurements of the downward irradiance; and finally (v) the index Ki(490) determined by the difference between Kd(490) and the corresponding value for pure water Kw(490) set to 0.0212 m−1 (Smith and Baker, 1981), whose negative value identifies radiometric data products (mostly related to clear waters and clear-sky conditions) significantly challenged by wave perturbations.
4.2 Absorption and attenuation from profile data
The beam attenuation and the absorption coefficients, excluding the contribution of pure seawater, were determined from measurements performed using AC9 instruments from WET Labs Inc. (Philomath, Oregon) with a 25 cm path length and nine spectral bands 10 nm wide at the 412, 440, 488, 510, 555, 630, 650, 676 and 715 nm center wavelengths. The values of and , in agreement with the scheme proposed by the instrument manufacturer (Wet Labs, 2009), were corrected for the effects of differences in temperature Tw and salinity Sw between the field measurements and laboratory calibrations. These corrections were performed using the Tw(z) and Sw(z) profile data simultaneously recorded with the AC9 ones.
AC9 absorption coefficients need correction for the incomplete reflective surfaces of the absorption measurement tube, which prevents the collection of all of the scattered light and naturally leads to an overestimate of . This correction was performed by removing a variable percentage of the scattering coefficient estimated from the difference between and at each λ, assuming that the absorption coefficient of particulate and dissolved material is zero at the reference wavelength λ0=715 nm and the shape of the volume-scattering function is spectrally independent (Zaneveld et al., 1992). Recent investigations showed that this correction method may lead to significant underestimates of . Still, it was used in the CoASTS-BiOMaP data processing because alternative promising correction methods such as that proposed by Roettgers et al. (2013) may not be universally applicable (Stockley et al., 2017). Nevertheless, the potential for applying alternative scattering corrections is allowed by including in the dataset the absorption value at 715 nm, , which is not corrected for the scattering offset ( would be zero when corrected).
The correction for the finite acceptance angle of the detector, which would need additional field measurements of the volume-scattering phase function (Boss et al., 2009) not included in the CoASTS and BiOMaP core data, could not be implemented.
In addition to regular instrument calibration and maintenance by the manufacturer, systematic AC9 pure water offsets were determined during each CoASTS campaign and at the beginning and end of each BiOMaP campaign, in agreement with best practices for field operation. This offset accounts for any instrument response change while the AC9s are operated in their actual deployment configuration. The absorption and scattering offsets between the reference manufacturer calibrations and those performed in the field were applied as correction values. In the presence of appreciable offsets between successive field calibrations performed during the same campaign, differences were linearly interpolated over time.
Automated quality control was applied to each data record to verify the spectral and spatial (i.e., vertical) consistency, aiming to identify those measurements affected by perturbations caused by bubbles or large particles flowing into the AC9 measurement chambers (i.e., mostly individual spikes independently affecting or measurements, especially in the surface layer). Specifically, and spectra exhibiting pronounced differences with respect to those characterizing the mean of profile spectra determined through a spectral consistency test, or pronounced changes with respect to depth at any λ identified through a spatial consistency test, were removed. The statistical parameters characterizing such a filtering process were tuned for profile data typical of individual campaigns in view of minimizing the potential for removing valid measurements.
The quality-controlled and data were successively binned at 1 m resolution and retained when the depth db assigned to the center of the bin determined from the mean of the actual depths of individual measurements satisfied the condition db=dn ± 0.25⋅di, where dn is the nominal depth of the center of the bin and di is the bin width. The ct−w(λ) and at−w(λ) values included in the CoASTS-BiOMaP dataset are the binned values tentatively corresponding to an average depth of 1 m.
A minimum uncertainty of 0.005 m−1 is assumed to affect AC9 measurements (Twardowski et al., 2001). Still, Stockley et al. (2017) showed that these values are largely underestimated, especially in highly scattering waters in the blue–green spectral bands.
4.3 Backscattering from profile data
In situ vertical profiles of backscattering coefficients bb(z,λ) were determined using measurements performed with HydroScat-6 instruments from HOBI Labs Inc. (Tanque Verde, Arizona) in six bands 10 nm wide at the 442, 488, 510, 555, 620 and 676 (or 671) nm center wavelengths. The values of bb(z,λ) were derived by applying the conversion factor χ=1.08 to measurements of the volume-scattering function performed at the sole scattering angle ψ=140° (Maffione and Dana, 1997). The derived backscattering values were successively corrected for water scattering and absorption by applying the factor
where a(z,λ) and b(z,λ) (with ) were obtained from the AC9 measurements by adding the pure water absorption and scattering coefficients, respectively, while the instrument-specific spectral factors ke(λ) were those determined by the manufacturer during the initial calibration. Salinity corrections were applied by considering the freshwater bbw from Morel (1974) for the Black Sea and Baltic Sea measurements and the saltwater bbw from Morel (1974) for the other measurements. This solution with respect to the use of actual salinity values may lead to misestimations of bbb that generally do not exceed 2 % at 443 nm for the Baltic Sea and Black Sea.
The accuracy of the applied Eq. (4) was questioned by Doxaran et al. (2016). However, their newly derived relationship was determined from the bb(z,550) values in the 0–2.5 m−1 range, while the CoASTS and BiOMaP bb(z,555) values are lower than 0.1 m−1, with not exceeding 1.0 m−1. In this interval, the equation proposed by Doxaran et al. (2016) does not appear to closely fit the plotted data (see their Fig. 5b). Because of this, still acknowledging their work, the processing equations originally proposed by Maffione and Dana (1997) for HydroScat-6 were applied.
Equivalent to the AC9 measurements, automated quality control was also applied to bb(z,λ) data to remove measurements exhibiting poor spectral and spatial (i.e., vertical) consistency (i.e., mostly individual spikes affecting bb(z,λ) at a single λ). By tuning the parameters defining the filtering process, spectra of bb(z,λ) exhibiting extreme differences with respect to the mean of the profile spectra, or very high changes with depth at any λ, were removed. Quality-controlled bb(z,λ) data were also binned at 1 m resolution adopting the same criteria applied for a(z,λ) and c(z,λ). The bb(z,λ) values included in the CoASTS-BiOMaP dataset are the binned values tentatively corresponding to an average depth of 1 m.
The quality index defined by the difference between bb(z,488) and the corresponding value bbw(488) is included in the dataset to identify those measurements mostly collected in very clear waters that are challenged by measurement uncertainties. The values of bbw(488), set equal to 0.001603 m−1 or alternatively 0.001233 m−1 for the sole Black Sea and Baltic Sea data, were determined from those provided in Morel (1974) and fitted according to Twardowski et al. (2007).
Annual factory calibrations performed at HOBI Labs Inc. were complemented by pre-field laboratory verifications performed at the JRC Marine Optical Laboratory. These laboratory verifications aimed to correct for HydroScat-6 response changes between factory calibrations.
Whitmire et al. (2007) estimated minimum uncertainties of 0.0007 m−1 for measurements of bbp(z,λ) (i.e., bb(z,λ) minus the backscattering of pure seawater) performed with HydroScat-6 instruments. Still, also in this case, the actual uncertainties are expected to be much larger.
4.4 Absorption of particulate matter determined from discrete water samples
In vivo absorption coefficients ap(z,λ) of aquatic particles from water samples at discrete depths z were determined using the (T–R) method proposed by Tassan and Ferrari (1995). This method was shown to be appropriate for any particle type, including highly backscattering mineral particles or highly absorbing sediments. The method was implemented on a Perkin Elmer Lambda-19 and, from 2004, on a Lambda-950 dual-beam spectrometer equipped with integrating spheres.
Samples of particles were collected by filtering water volumes on Whatman GF/F glass-fiber filters with a nominal pore size of 0.7 µm. Samples from the field were preserved in liquid nitrogen until laboratory analysis. The absorption coefficient ap(z,λ) of the equivalent particle suspension in the 400–750 nm spectral range with 1 nm resolution was determined from
where Vw(z) is the volume of filtered water, Fa the filter clearance area and As(z,λ) the equivalent particle suspension absorbance obtained with the T–R method.
The pigmented aph(z,λ) and nonpigmented adp(z,λ) fractions of the particulate absorption coefficient ap(z,λ) were obtained by bleaching the sample using a solution of sodium hypochlorite (NaClO). The solution acts rapidly on pigment molecules and slowly on detritus, making possible a selective analysis of the two absorption components. A description of the bleaching technique is presented in Tassan and Ferrari (1995) and Ferrari and Tassan (1999).
Focused studies on the accuracy of the T–R method include Tassan and Ferrari (1995) and Tassan et al. (2000). Still, comprehensive uncertainty estimates for aph(z,λ) and adp(z,λ) are not available. Nevertheless, dedicated analysis addressed the repeatability of in vivo particulate absorption measurements performed with the T–R method (see Zibordi et al., 2002). These investigated (i) repeated analysis of the same sample (i.e., each sample analyzed twice) and (ii) analysis of duplicate samples (i.e., duplicates obtained from the same water volume). The results for repeated analysis of the same samples showed mean absolute percentage differences of 2.9 ± 2.3 % at 443 nm with a mean ± 0.042 m−1, increasing up to 7.4 ± 6.0 % at 555 nm with a mean ± 0.011 m−1. These differences are attributed to (i) method sensitivity and (ii) variations in the mechanical repositioning of the sample in front of the aperture of the integrating sphere combined with spatial inhomogeneities of the particle distribution on the filter.
The analysis of duplicate samples showed mean absolute percentage differences of 8.9 ± 5.9 % at 443 nm with mean ± 0.049 m−1 and 9.8 ± 7.0 % at 555 nm with mean ± 0.012 m−1. The former differences, increased by a few percent with respect to those given for the repeated analysis of samples, are justified by (i) unavoidable differences in replicates due to inhomogeneity affecting the particle distributions on filters and (ii) inhomogeneity in the distribution of particles in the water volumes used to produce the samples. It is mentioned that an intrinsic error in the estimate of the actual particle absorption coefficients results from the application of GF/F filters with a nominal pore size of 0.7 µm. In fact, these filters do not allow bacteria and the fraction of mineral particles with diameters lower than 0.7 µm to be accounted for. However, the absorption of these small mineral particles is generally negligible compared to the total absorption, while the absorption of bacteria is almost 10 times lower than that of algal cells and 5–10 times lower than that of cyanobacteria (Morel and Ahn, 1990). The aph(z,λ) and adp(z,λ) measurements included in the CoASTS-BiOMaP dataset refer to water samples collected at approximately 1 m depth.
4.5 Absorption of CDOM determined from discrete water samples
The absorption coefficient ays(z,λ) of CDOM at depth z was determined by applying the method detailed, from Ferrari et al. (1996) using a Perkin Elmer Lambda-12 and from a 2010 Lambda-35 dual-beam spectrometer. Samples were prepared by filtering water volumes on Millipore 0.22 µm pore size cellulose filters and adding a solution of 10 gL−1 of NaN3 to the filtered water to prevent bacteria growth (typically, 1 mL of the solution was added to 100 mL of filtered water).
CDOM samples were preserved at approximately 4 °C in an amber glass bottle until laboratory analysis. The spectrometric measurements, generally carried out within a few days from the completion of the measurement campaign, were performed at 1 nm resolution in the 350–750 nm spectral region. Measurements were performed by placing a 10 cm quartz cuvette containing pure Milli-Q water in the optical path of the reference beam and a 10 cm quartz cuvette containing the CDOM sample in the optical path of the sample beam. It is acknowledged that the 10 cm path length systematically applied for the analysis of CoASTS and BiOMaP field samples naturally challenges the accuracy of measurements characterized by low CDOM absorption, such as those from the eastern Mediterranean Sea (EMED).
The spectral absorption coefficient ays(z,λ) was computed from the measured absorbance Ays(z,λ) resulting from the difference between the sample absorbance and the reference absorbance (Ferrari et al., 1996) as
where Lc is the path length of the cuvette.
Assuming that CDOM does not absorb in the red spectral region, and following community recommendations (see Sect. III in IOOCG, 2019b), the absorption coefficients are corrected for the background offset by subtracting from ays(z,λ) the mean of ays(z,λi) spectral values for λi in the 670–680 nm interval.
Comprehensive uncertainty values are also unavailable for ays(z,λ). Still, the repeatability of ays(z,λ) measurements (see Zibordi et al., 2002) was also investigated by (i) repeated analysis of the same samples and (ii) analysis of duplicate samples. The repeated analysis of the same samples showed average absolute percentage differences varying as a function of the absorption value from 10.1 ± 7.3 % at 412 nm with mean ± 0.037 m−1 to 24.2 ± 19.8 % at 555 nm with mean ± 0.005 m−1. These differences are mostly ascribed to the precision of the method. The analysis of the duplicate samples showed expected augmented average absolute percentage differences when compared to repeated analysis of samples varying from 12.1 ± 6.3 % at 412 nm with mean ± 0.038 m−1 to 30.3 ± 23.8 % at 555 nm with mean ± 0.005 m−1. The latter increased values are largely justified by the differences between the samples.
It should finally be mentioned that the use of 0.22 µm pore size filters to produce CDOM samples, when the 0.7 µm pore size filters are applied for the quantification of particle absorption coefficients, suggests that the overall absorption budget cannot be resolved fully. In fact, as already anticipated, bacteria and very small mineral particles with sizes between 0.2 and 0.7 µm are not included in the absorption analysis. Still, this missing contribution to the overall absorption budget is expected to be minor.
As per aph(z,λ) and adp(z,λ), the ays(z,λ) measurements included in the CoASTS-BiOMaP dataset also refer to water samples collected at approximately 1 m depth.
4.6 Pigment concentration
Phytoplankton pigment concentrations were determined using high-performance liquid chromatography (HPLC) with the method proposed by Van Heukelem and Thomas (2001). Exceptions are the samples collected before 2000, for which the method proposed by Jeffrey et al. (1997) was applied.
The analyses were performed on samples of particulate matter retained on GF/F filters with a nominal pore size of 0.7 µ m: this choice is justified by the diameter of living phytoplankton cells generally higher than 1 µm (Stramski and Kiefer, 1991). After filtration, samples were preserved in liquid nitrogen until laboratory analysis.
Following Van Heukelem and Thomas (2001), the samples were transferred to vials with 3 mL 95 % acetone and vitamin E as internal standards. The samples were then disrupted using a vortex mixer, sonicated on ice, extracted at 4 °C for 20 h, and mixed again. The samples were successively filtered through a 0.2 µm Teflon syringe filter into HPLC vials and placed on the cooling rack of the HPLC system. Buffer and sample were injected into the HPLC (Shimadzu LC-10A or, alternatively, HP-1100 systems) at a ratio of using a pre-treatment program and mixing in the loop before injection.
The list of pigments analyzed systematically at the JRC Marine Optical Laboratory or alternatively at DHI A/S (Hørsholm, Denmark) includes chlorophyll a (resulting from the sum of divinyl and monovinyl chlorophyll a), chlorophyll b, chlorophyll c1+c2, chlorophyllide a, fucoxanthin, diadinoxanthin, β-carotene, zeaxanthin, alloxanthin, 19'-butanoyloxyfucoxanthin, 19'-hexanoyloxyfucoxanthin and diatoxanthin.
Various intercomparisons of HPLC methods performed in the framework of the SeaWiFS HPLC Analysis Round-Robin Experiments (SeaHARRE) organized by NASA with JRC participation demonstrated the capability of various laboratories to achieve differences lower than 6 % in the determination of total chlorophyll-a concentrations (i.e., the sum of chlorophyll a and chlorophyllide a), lower than the 25 % for the other ancillary pigments characterizing marine waters (Hooker et al., 2010). The analysis of CoASTS and BiOMaP shows chlorophyll-a values always higher than 0.03 µg L−1. This may suggest some quantification limit for the methodology applied to determine the pigment concentrations.
Consistent with aph(z,λ), adp(z,λ) and ays(z,λ), measurements of Chl a(z) were performed on water samples collected at approximately 1 m depth.
4.7 Suspended particulate matter concentration
The concentration of SPM was obtained from the net weight of the particulate material collected on filters following the method detailed in Van der Linde (1998) as an evolution of that proposed by Strickland and Parsons (1972). Samples were produced by filtering volumes of water on GF/F filters with a 0.7 µm nominal pore size previously baked at 450 °C for 1 h, prewashed, dried for 1 h at 75 °C and finally preweighted on an electro-balance. After water filtration, the filters (i.e., filtration area and border) were washed with distilled water and stored at −18 °C for successive laboratory analysis. Before final weighting, the filters were dried at 75 °C for 1 h and then temporarily stored in a desiccator.
The concentration of SPM was calculated from
where Wf(z) is the weight of the filter after filtration, Ws(z) is the weight of the filter before filtration, V(z) is the volume of the filtered water, and wb is a correction term introduced to account for variations in the weight of the filter sample due to changes in the environmental conditions between the two weighting steps. The values of wb were determined from blank filters (i.e., GF/F filters completely conditioned, not used for water filtration, but exposed to the same processes of the sample filters: transportation to the measurement site and back, storage in the freezer, and drying). The wb values applied in Eq. (7) are the differences between the average final weight of blank filters and their original average weight.
SPM values included in the CoASTS-BiOMaP dataset are generally obtained from the average of duplicate samples. In the case of large differences between the duplicates (i.e., tentatively exceeding 20 %), the SPM value from one of the two samples is used prior to investigating the surface and integrity of the samples and verifying the consistency of their values with AC9 measurements from close stations.
The use of GF/F filters with a 0.7 µm nominal pore size for SPM analysis leads to an underestimate of the total suspended matter due to the loss of particles with diameters lower than 0.7 µm. However, it is recognized that the filter rinsing for salt removal and filter conditioning after filtration before final weighting can induce errors much larger than the masses of particles with diameters lower than 0.7 µm.
An analysis of measurement repeatability performed with duplicate samples showed a mean percentage difference equal to 13.9 ± 13.4 % with mean SPM(z) = 0.86 ± 0.40 mg L−1. The largest differences between duplicate samples (i.e., larger than 30 %) were observed with values of SPM(z) lower than approximately 0.5 mg L−1. This is explained by the intrinsic uncertainty affecting sample preparation (i.e., water sample inhomogeneity and filter rinsing).
As for the other quantities determined from the analysis of the water samples, the SPM values included in the CoASTS-BiOMaP dataset also refer to the samples collected at approximately 1 m depth.
4.8 Salinity and temperature
Profiles of salinity Sw(z) and temperature Tw(z) measurement were performed with SBE 19-plus conductivity–temperature–depth (CTD) sensors from Sea-Bird Scientific (Bellevue, Washington). These devices were calibrated by the manufacturer on an approximately 2-year basis. Uncertainties are tentatively expected to be within 0.01 ‰ for salinity and 0.01 °C for temperature.
Equivalent to the , and bb(z,λ) profiles, automated quality control was also applied to the Sw(z) and Tw(z) data to remove measurement artifacts. By trimming filtering parameters to individual campaigns, values of Sw(z) and Tw(z) exhibiting extreme changes with respect to depth were removed. Quality-controlled Sw(z) and Tw(z) data were binned at 1 m resolution, adopting the same criteria already applied for , and bb(z,λ). The values associated with the first bin, tentatively representing the 1 m depth, are included in the CoASTS-BiOMaP dataset.
4.9 Meteorological and environmental observations
Among the meteorological quantities and observations recorded during each measurement station, the wind speed Ws, sea state Ss and cloud cover Cc are included in the dataset.
CoASTS-BiOMaP data are accessible at https://doi.org/10.1594/PANGAEA.971945 (Zibordi and Berthon, 2024) in tabular form and include the near-surface data products from CoASTS and BiOMaP measurements of relevance for the validation of satellite ocean color data and the development of bio-optical algorithms (note that, for simplicity of notation, the depth dependence is hereafter omitted). All of the spectral data products are restricted to the nominal center wavelengths 412, 443, 490, 510, 555 and 665 nm, unless separately specified. CoASTS data products are only provided from December 1998, when full standardization of measurements and processing was put into place. In addition, station data were excluded from CoASTS-BiOMaP when the LWN(λ) or Kd(λ) radiometric products did not satisfy the basic quality control criteria by exhibiting spectra with unexplained shapes or amplitudes. Furthermore, the poor quality of data products other than radiometric ones implied their exclusion from the dataset.
Table 3 provides a comprehensive list of the quantities included in the CoASTS-BiOMaP dataset: each one is identified by a convenient symbol, a brief description and its physical units. A summary of the average values of the major bio-optical and hydrographic quantities determined for the various marine regions is provided in Table 4. These are the diffuse attenuation coefficient Kd at 490 nm, the water absorption coefficient (from discrete sample analysis, pure water contribution excluded) at−w at 490 nm, the backscattering coefficient (water contribution included) bb at 488 nm, the concentrations of the total Chl a and SPM, and the salinity Sw. All the quantities exhibit ample differences across the various marine regions. Notably, the variations in Kd(490) exceed 1 order of magnitude between EMED and Baltic Sea (BLTS) waters (i.e., Kd(490) varies from 0.037 to 0.494 m−1).
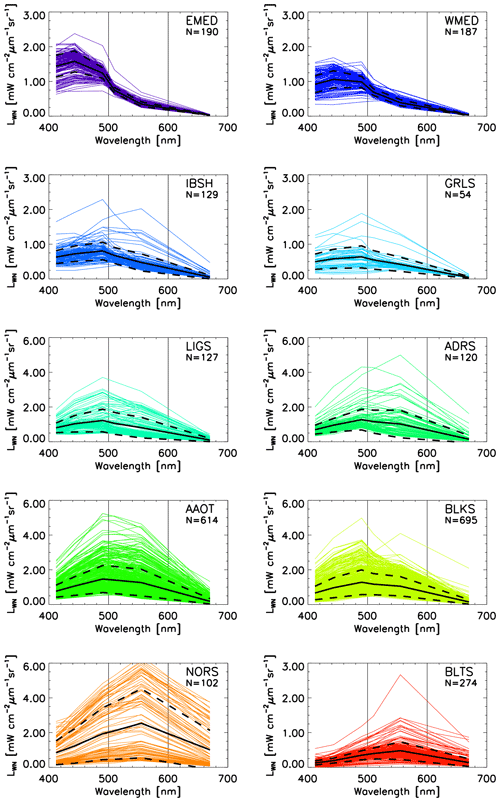
Figure 3Spectra of LWN(λ) for the CoASTS and BiOMaP geographic regions (see Tables 1 and 2 for the abbreviations). N indicates the number of spectra. The continuous black lines indicate the mean values, while the dashed lines indicate the ±1 standard deviation. For convenience, the spectra are plotted (mW cm−2 µm−1 sr−1).
Table 3The CoASTS-BiOMaP dataset: quantities identified by symbols, descriptions of the quantities and the related units.
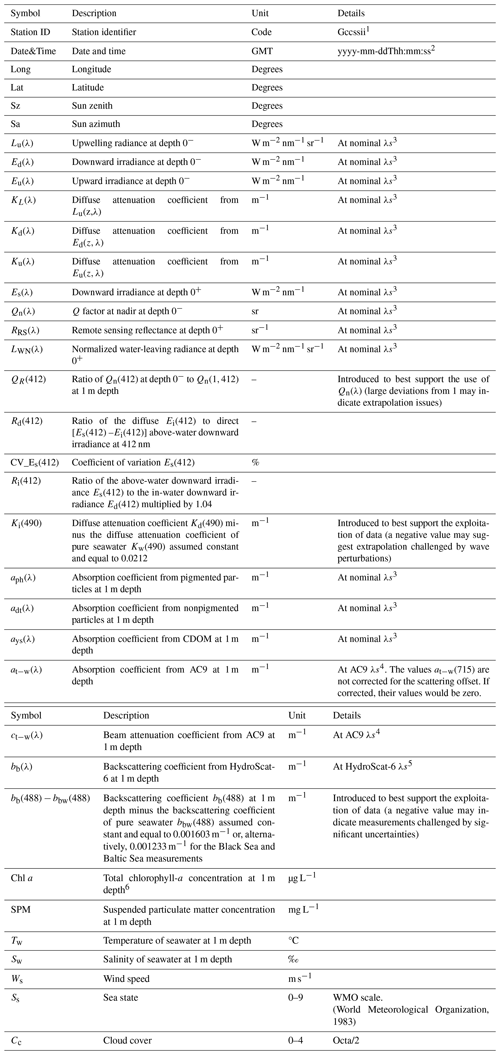
1 G indicates the site or geographic region (V and W for the AAOT, A for the Adriatic Sea, B for the Baltic Sea, E for the Eastern Mediterranean Sea, K for the Black Sea, L for the Ligurian Sea, N for the North Sea, O for the Western Mediterranean Sea, I for the Iberian Shelf and P for the Greenland Sea), while cc indicates the campaign number for the specific region, ss the station number and ii the cast number. 2 The letters yyyy indicate the year, mm the month, dd the day, hh the hour, mm the minutes, and ss the seconds. 3 The nominal center wavelengths for the radiometric data products are 412, 443, 490, 510, 555 and 665 nm. 4 The center wavelengths for the AC9 data products are 412, 440, 488, 510, 555, 630, 650, 676 and 715 nm. 5 The center wavelengths for the HydroScat-6 data products are 442, 488, 510, 555, 620 and 676 (or 671) nm. 6 The total chlorophyll-a concentration indicates the sum of chlorophyllide-a and monovinyl and divinyl chlorophyll-a.
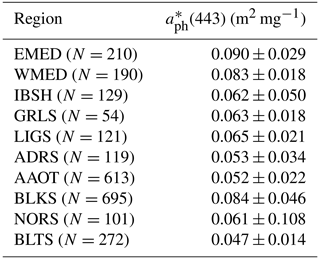
Table 4Mean ± standard deviations of quantities describing the bio-optical and hydrographic characteristics of the CoASTS and BiOMaP marine regions: the diffuse attenuation coefficient Kd at 490 nm; the seawater absorption coefficient (excluding the pure water contribution) at−w determined from discrete sample analysis at 490 nm; the backscattering coefficient (including the pure water contribution) bb at 488 nm; the concentrations of the total Chl a and SPM; and finally the salinity Sw.

Table 5Spectral values of Qn(λ) (sr) at the 412, 443, 490, 510, 555 and 670 nm center wavelengths for the CoASTS and BiOMaP marine regions, determined from in-water radiometric profiles with cloud cover .
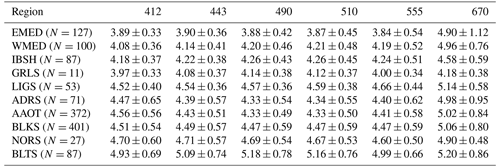
Figure 3 displays the BiOMaP and CoASTS LWN(λ) spectra for the different marine regions. These spectra clearly indicate diverse bio-optical features for the different regions. They range from the highly oligotrophic EMED showing maximum values in the blue region to the optically complex BLTS dominated by the presence of high concentrations of CDOM as expressed by low values of LWN in the blue spectral region. Between these, there are marine regions exhibiting diverse bio-optical complexity due to different concentrations of optically significant constituents. Notably, some spectra from the North Sea (NORS) indicate the presence of relatively high concentrations of sediments, while spectra from the Black Sea (BLKS) and northern Adriatic Sea (AAOT) suggest bio-optical conditions determined by the presence of various concentrations of SPM and CDOM determining LWN maxima at the 510 or 555 nm center wavelengths.
Table 5 provides the mean spectral values and related standard deviations of Qn(λ) for the various marine regions as determined from radiometric profiles performed under near-clear-sky conditions determined by Cc ≤ . These naturally exhibit some spectral dependence, varying with water type. For instance, Qn(λ) from EMED exhibits spectrally almost constant mean values approaching 4 sr in the 412–555 nm interval and approximately 5 sr at 665 nm. Conversely, regions such as the northern Adriatic Sea (AAOT) exhibit mean values approaching 4.5 sr, with some spectral dependence in the 412–555 nm region, and a mean value of 5 sr at 665 nm.
Figure 4 displays the aph(λ) spectra for the CoASTS and BiOMaP regions. The increases in the values of the mean aph(443) from 0.007 m−1 for EMED to 0.191 m−1 and 0.220 m−1 for BLTS and NORS, respectively, are notable. The peculiar spectra shown by the North Sea stations off the Belgian coast exhibiting aph values higher at 412 nm than at 443 nm (see the panel for the NORS data in Fig. 4) are explained by high concentrations of pheophytin leading to an increase in the absorption coefficient toward 412 nm.
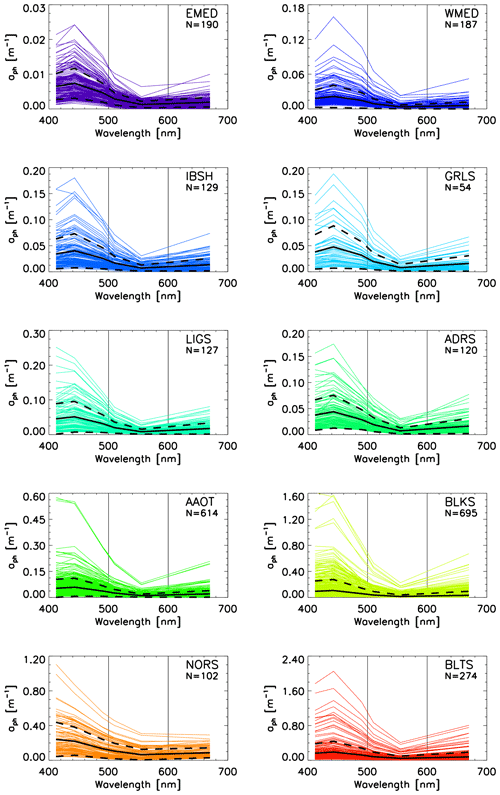
Figure 4Spectra of aph(λ) for the CoASTS and BiOMaP marine regions. N indicates the number of spectra. The continuous black lines indicate the mean values, while the dashed lines indicate the ±1 standard deviation.
Figure 5 displays the comparison of the near-surface absorption coefficients (pure water excluded) determined from AC9 measurements at the center wavelength of 443 nm, at−w(AC9), and the equivalent absorption coefficients determined from water samples, at−w(sample) = . The results suggest an increasing underestimate of at−w(AC9) and larger data scattering with a decrease in absorption. This is highlighted by the scatterplots of data from EMED exhibiting an underestimate exceeding 70 %, with values of at−w(samples) generally lower than 0.1 m−1. Conversely, BLTS shows outstanding agreement between the compared quantities, with absorption values in the range 0.2–1.2 m−1. These mean differences between at−w(AC9) and at−w(samples) absorption values could be explained by an incomplete correction of the perturbing effects due to the finite acceptance angle of the detector, the not fully reflective surface of the AC9 absorption chamber (i.e., the two short 25 cm path-length tubes) and the non-negligible absorption of particles at the reference wavelength λ0=715 nm applied for scattering corrections.
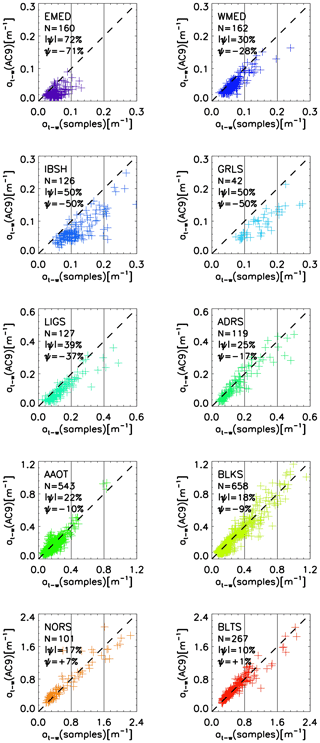
Figure 5Scatterplot of the AC9-derived at−w(AC9) and laboratory measurements taken on water samples at−w(samples) of the water absorption coefficient (water excluded) determined at the 443 nm center wavelength for the diverse CoASTS and BiOMaP marine regions. N indicates the number of samples, while and ψ indicate the mean of the absolute (unsigned) percentage differences and the mean of the (signed) percentage differences, respectively.
Figure 6 shows trilinear (ternary) plots of the absorption coefficients ays(443), adt(443) and aph(443), expressed as a percentage of the total absorption (i.e., with respect to ) displayed with values increasing in the counterclockwise direction (Harris, 1999). These results exhibit very few cases characterized by dominance of absorption by particles with aph and adt values close to the upper- and lower-right apexes, respectively. Conversely, most of the cases indicate dominance of absorption by colored dissolved organic matter: see the ays values near the lower-left apex. This is particularly evident in the oligotrophic waters of EMED as well as the patterns characterizing the oligotrophic–mesotrophic waters of the western Mediterranean Sea (WMED), the optically complex water of BLKS and the highly absorbing waters of BLTS.
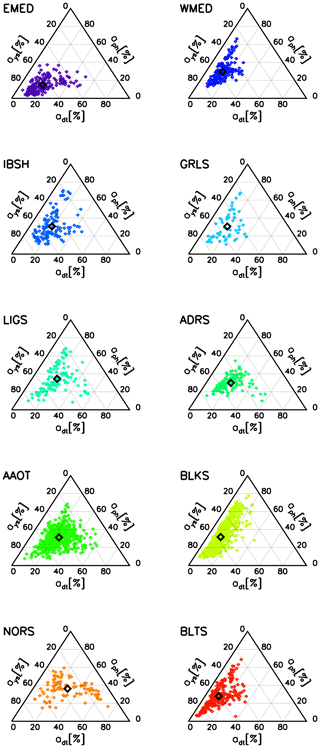
Figure 6Trilinear (ternary) plots of the absorption coefficients ays, adt and aph expressed in percentage of total non-water absorption (i.e., with respect to ) at the 443 nm center wavelength. The empty black square indicates the mean of the plotted values.
The specific results shown for the Mediterranean Sea (i.e., EMED and WMED), which may suggest inconsistency in the definition of Case-1 waters (IOCCG, 2000), are supported by an independent study (Pérez et al., 2016).
The parameters determined from the exponential fit versus the wavelength of adt(λ) and ays(λ) and the power law fit of bb(λ) versus the wavelength are provided in Tables 6–8. Specifically, the spectral values of adt(λ) and ays(λ) were fitted in the 412–665 nm spectral interval using
and
where Adt and Ays indicate the absorption coefficients fitted at 412 nm, Sdt and Sys indicate the slope of the exponential function, and Bdt and Bys account for the background.
Table 6Parameters Adt, Sdt and Bdt of the exponential fitting function (see Eq. 8) applied to the values of adt(λ). The quantity Rdt indicates the spectral average of the absolute differences (i.e., residuals) between the actual and fitted values.
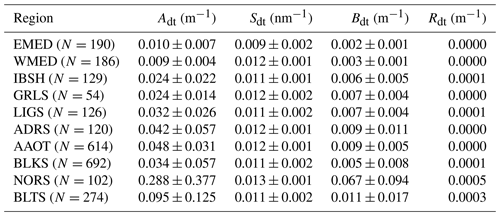
Table 7Parameters Ays, Sys and Bys of the exponential fitting function (see Eq. 9) applied to the values of ays(λ). The quantity Rys indicates the spectral average of absolute differences (i.e., residuals) between the actual and fitted values.
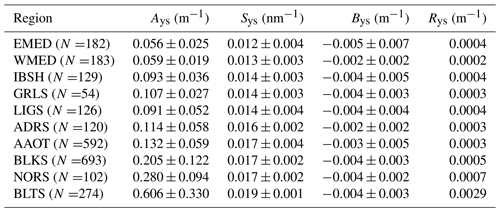
Table 8Parameters Ab and Sb of the power law fitting function (see Eq. 10) applied to the values of bb(λ) at λ=443, 488, 510, 555 and 620 nm for the CoASTS and BiOMaP marine regions. The quantity Rb indicates the spectral average of the absolute differences (i.e., residuals) between the actual and fitted data.
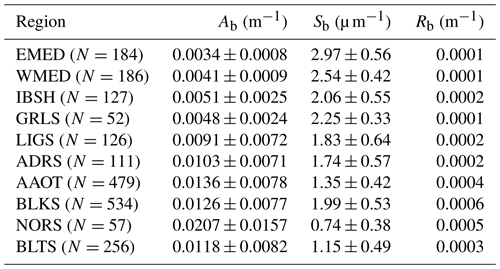
Conversely, the spectral values of bb(λ) at the center wavelengths λ=442, 488, 510, 550 and 620 nm (excluding 676 and 671 nm due to potential perturbations by a chlorophyll-a fluorescence) peak around 685 nm were fitted using
where Ab indicates the backscattering coefficient at 442 nm and Sb indicates the slope of the power law function.
Table 6 shows mean values of the slope Sdt varying from 0.009 nm−1 for EMED to 0.013 for NORS. Values of the bias Bdt naturally increase with Adt: the largest value of Bdt=0.067 m−1 is observed for NORS, which also exhibits the highest value of Adt=0.288 m−1. Residuals Rdt, which also increase with Adt, are quite minor, suggesting a generally good performance by the exponential fitting function.
Table 7 shows mean values Sys varying from 0.012 nm−1 for EMED to 0.019 nm−1 for BLTS. The systematic negative biases Bys across all the marine regions are likely explained by the choice of zeroing the original spectra of absorption coefficients using values averaged in the 670–680 nm spectral interval. High residuals Bys of 0.029 m−1 are observed for BLTS. This is explained by a decreased performance of Eq. (9) when fitting spectra of absorption coefficients exhibiting values approaching or exceeding 1 m−1 at 412 nm. Still, all residuals Bys expressed in percentage of Ays vary between 0.3 % and 0.5 %, except for EMED with a value of 0.9 % (not shown).
As expected, the values of Sb also largely vary across the CoASTS and BiOMaP marine regions: in particular, they exhibit values of 2.97 µm−1 for EMED, 2.06 µm−1 for the Iberian Shelf (IBSH) and 0.74 µm−1 for NORS. This is likely explained by an increase in the average particle size when going from the oligotrophic EMED to the eutrophic and more sediment-loaded North Sea.
Figures 7 and 8 show the distribution of Chl a and SPM across the CoASTS and BiOMaP marine regions. The very low concentrations characterizing the oligotrophic waters of EMED and exhibiting a mean Chl a value of 0.09 µg L−1 and a mean SPM value of 0.27 mg L−1 are remarkable. Conversely, Chl a exhibits mean values in the range 4–5 µg L−1 for both NORS and BLKS, while for the same marine regions SPM shows mean values of 9.96 and 1.53 mg L−1, respectively. A lognormal distribution of both Chl a and SPM is generally confirmed for the CoASTS and BiOMaP data.
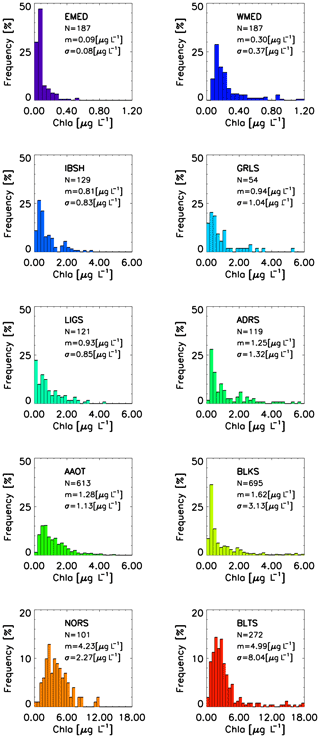
Figure 7Frequency distribution of Chl a across the CoASTS and BiOMaP marine regions. N indicates the number of stations, m indicates the mean values, and σ indicates the standard deviation.
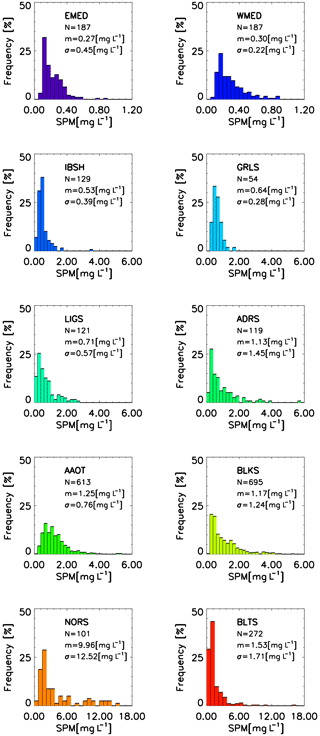
Figure 8Frequency distribution of SPM across the CoASTS and BiOMaP marine regions. N indicates the number of stations, m indicates the mean values, and σ indicates the standard deviation.
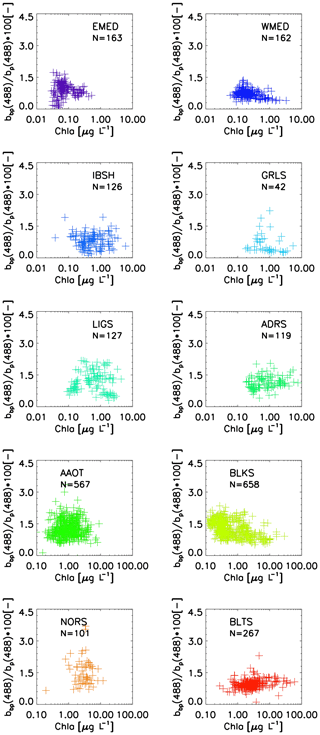
Figure 9Scatterplot and Chl a for the diverse CoASTS and BiOMaP marine regions. N indicates the number of samples.
Figure 9 displays the scatterplots of and Chl a, where bp(488) is determined by the difference between ct−w(488) and at−w(488), while bbp(488) is determined from bb(488) by subtracting the scattering coefficient of water bw(488) from Morel (1974). The results are consistent with those of Twardowski et al. (2001) for a variety of experimental data, with typically varying between 0.003 and 0.025. Exceptions are some very low values of for EMED data that are likely explained by large measurement uncertainties. Consistent with the published results are also the generally higher value and higher scatter of corresponding to low Chl a concentrations.
Table 9 provides the mean chlorophyll-a specific absorption coefficients determined by the ratio Chl a across the various CoASTS and BiOMaP marine regions. These mean values of vary from 0.047 m2 mg−1 in BLTS to 0.090 m2 mg−1 in EMED. The latter values could be challenged by increased relative uncertainties in the determination of both aph(443) and Chl a.
Interested researchers can download the CoASTS-BiOMaP dataset at https://doi.org/10.1594/PANGAEA.971945 (Zibordi and Berthon, 2024). The original field measurements leading to the creation of this dataset are currently not publicly available. However, they can be obtained from the authors on reasonable request.
The CoASTS and BiOMaP measurement programs led by the JRC Marine Optical Laboratory benefited from the collaboration of a number of European institutions and various funding programs supporting satellite ocean color applications. Between 1995 and 2022 the two programs produced time series at the AAOT site in the northern Adriatic Sea and geographically distributed bio-optical measurements across the major European seas. The measurements produced by the two programs after December 1998 include identical quantities and are characterized by standardization of measurement methods, instruments, data processing and quality assurance or control schemes.
This work introduced the CoASTS-BiOMaP dataset comprising the near-surface data products from the CoASTS and BiOMaP measurement programs that are of major relevance for satellite ocean color validation activities and bio-optical modeling.
| AAOT | Acqua Alta Oceanographic Tower |
| ADRS | Adriatic Sea |
| AERONET-OC | Ocean Color component of the Aerosol Robotic Network |
| BiOMaP | Bio-Optical mapping of Marine Properties |
| BLKS | Black Sea |
| BLTS | Baltic Sea |
| CDOM | Colored dissolved organic matter |
| CoASTS | Coastal Atmosphere and Sea Time Series |
| CTD | Conductivity–temperature–depth |
| EMED | Eastern Mediterranean Sea |
| GRLS | Greenland Sea |
| HPLC | High-performance liquid chromatography |
| IBSH | Iberian Shelf |
| LIGS | Ligurian Sea |
| JRC | Joint Research Center |
| NASA | National Aeronautics and Space Administration |
| NIST | National Institute of Standards and Technology |
| NORS | North Sea |
| NPL | National Physical Laboratory |
| SeaWiFS | Sea-viewing Wide Field-of-view Sensor |
| WMED | Western Mediterranean Sea |
| WiSPER | Wire-Stabilized Profiling Environmental Radiometer |
Both authors, GZ and JFB, who implemented and co-led the CoASTS and BiOMaP programs, contributed to the generation of the dataset and the writing of the manuscript. GZ was a JRC Scientific Officer from the conception to end of the CoASTS and BiOMaP programs.
The contact author has declared that none of the authors has any competing interests.
Publisher’s note: Copernicus Publications remains neutral with regard to jurisdictional claims made in the text, published maps, institutional affiliations, or any other geographical representation in this paper. While Copernicus Publications makes every effort to include appropriate place names, the final responsibility lies with the authors.
The technical contributions to the field measurements and laboratory analysis by many JRC and international colleagues are fully acknowledged: Cristina Targa, Stefania Grossi, Dirk Van der Linde, Lukasz Jankowski, Lyudmila Kamburska, Davide D'Alimonte, Marco Talone, Pietro Sciuto, Ilaria Cazzaniga, Jean Verdebout, Elisabetta Canuti, Alessandro Marchetti, Violeta Slabakova, Natalia Slabakova, Carolina Sa', Simone Colella, Gianluca Volpe, Seppo Kaitala, Jukka Seppala and Aleksandra Mazur.
Finally, Jaime Pitarch and Mike Twardowski are acknowledged for their comments on the submitted manuscript.
Direct or indirect (through ship time) support to CoASTS and BiOMaP activities was provided by the JRC through the EOSS and COLORS institutional projects; the European Commission through the MAST-III, EUROFLEETS and JERICO programs; the North Atlantic Treaty Organization (NATO) through the Science for Peace Program; the US National Aeronautics and Space Administration (NASA); the European Space Agency (ESA); the Romanian Space Agency (ROSA); the Institute of Oceanology of the Bulgarian Academy of Sciences; the Institute of Oceanology of the Polish Academy of Sciences; the Finnish Environment Institute; the Italian National Research Council; the Portuguese Hydrographic Institute; the Italian Hydrographic Institute; the Royal Belgian Institute of Natural Sciences, the Hellenic Centre for Marine Research; and the Université du Littoral Côte d'Opale.
The contribution of Giuseppe Zibordi to the finalization of this work was supported by the National Aeronautics and Space Administration through the GESTAR-II program, award no. 80NSSC22M0001, The contribution of Jean-François Berthon was supported by the DG DEFIS (the European Commission Directorate-General for Defence Industry and Space) and the Copernicus program.
This paper was edited by Salvatore Marullo and reviewed by Jaime Pitarch and Michael Twardowski.
Austin, R. W.: The remote sensing of spectral radiance from below the ocean surface, in: Optical aspects of oceanography, edited by: Jerlov, N. G. and Nielsen, E. S., 317–344, 1974.
Belward, A., Hartstra, J., Baruth, B., Beck, P., Carmona Moreno, C., Churchill, P., Craglia, M., Crandon, R., Ehrlich, D., Eva, H., Fortuny Guasch, J., Kemper, K. T., Kerdiles, H., Leo, O., Loudjani, P., Maenhout, G., Milenov, P., Pesaresi, M., Pinty, B., Zibordi, G., and Kreysa, J.: A history of remote sensing at the JRC, Publications Office of the European Union, Luxembourg, ISBN 978-92-76-49465-2, JRC127849, 2022.
Berthon, J.-F., Zibordi, G., Doyle, J. P., Grossi, S., van der Linde, D., and Targa, C.: Coastal Atmosphere and Sea Time Series (CoASTS), Part 2: Data Analysis, NASA Tech. Memo., 2002–206892, Vol. 20, edited by: Hooker, S. B. and Firestone, E. R., NASA Goddard Space Flight Center, Greenbelt, Maryland, 25 pp., https://oceancolor.sci.gsfc.nasa.gov/resources/docs/technical/seawifs_reports/postlaunch/post_vol20_abs/ (last access: 19 November 2024), 2002.
Berthon, J.-F., Mélin, F., and Zibordi, G.: Ocean colour remote sensing of the optically complex European seas, Remote Sensing of the European Seas, 35–52, Springer, Dordrecht, https://link.springer.com/chapter/10.1007/978-1-4020-6772-3_3 (last access: 19 November 2024), 2008.
Boss, E., Slade, W. H., Behrenfeld, M., and Dall'Olmo, G.: Acceptance angle effects on the beam attenuation in the ocean, Opt. Express, 17, 1535–1550, 2009.
D'Alimonte, D., Shybanov, E. B., Zibordi, G., and Kajiyama, T.: Regression of in-water radiometric profile data, Opt. Express, 21, 27707–27733, 2013.
Doxaran D., Leymarie, E., Nechad, B., Dogliotti, A., Ruddick, K., Gernez, P., and Knaeps, E.: Improved correction methods for field measurements of particulate light backscattering in turbid waters, Opt. Express, 24, 3615–3637, 2016.
Doyle, J. P. and Zibordi, G.: Optical propagation within a three-dimensional shadowed atmosphere–ocean field: application to large deployment structures, Appl. Opt., 41, 4283–4306, 2002.
Doyle, J. P., Hooker, S. B., Zibordi, G., and van der Linde, D.: Validation of an In-Water, Tower-Shading Correction Scheme, NASA Tech. Memo. 2003–206892, Vol. 25, edited by: Hooker, S. B. and Firestone, E. R., NASA Goddard Space Flight Center, Greenbelt, Maryland, 32 pp., https://oceancolor.sci.gsfc.nasa.gov/resources/docs/technical/seawifs_reports/postlaunch/post_vol25_abs/ (last access: 19 November 2024), 2003.
Ferrari, G. M. and Tassan, S.: A method using chemical oxidation to remove light absorption by phytoplankton pigments, J. Phycology, 35, 1090–1098, 1999.
Ferrari, G. M., Dowell, M. D., Grossi, S., and Targa, C.: Relationship between the optical properties of chromophoric dissolved organic matter and total concentration of dissolved organic carbon in the southern Baltic Sea region, Mar. Chem., 55, 299–316, 1996.
Gergely, M. and Zibordi, G.: Assessment of AERONET-OC Lwn uncertainties, Metrologia, 51, 40–47, 2013.
Harris, R. L.: Information graphics: A comprehensive illustrated reference, Oxford University Press, USA, 448 pp., ISBN 0-19-513532-6, 1999.
Hooker, S. B., Thomas, C. S., Van Heukelem, L., Russ, M. E., Ras, J., Claustre, H., Clementson, L., Canuti, E., Berthon, J.-F., Perl, J., Normandeau, C., Cullen, J., Kienast, M., and Pinckney, J. L.: The fourth SeaWiFS HPLC analysis round-Robin experiment (SeaHARRE–4), NASA, Technical Memorandum 2010–215857, NASA Goddard Space Flight Center, Greenbelt, Maryland, 75 pp., https://oceancolor.gsfc.nasa.gov/resources/docs/technical/hooker-215857-s.pdf (last access: 19 November 2024), 2010.
IOCCG: Remote Sensing of Ocean Colour in Coastal, and Other Optically-Complex, Waters, Reports of the International Ocean-Colour Coordinating Group, edited by: Sathyendranath, S., No. 3, IOCCG, Dartmouth, Canada, https://www.ioccg.org/reports/report3.pdf (last access: 19 November 2024), 2000.
IOCCG: IOCCG Ocean optics and biogeochemistry protocols for satellite ocean colour sensor validation: In situ optical radiometry, IOCCG Protocols Series, Volume 3, IOCCG, Dartmouth, Canada, https://ioccg.org/wp-content/uploads/2019/12/protocols-insitu-optical-radiometry-v3.0.pdf (last access: 4 November 2024), 2019a.
IOCCG: IOCCG Ocean optics and biogeochemistry protocols for satellite ocean colour sensor validation: Measurement protocol of absorption by chromophoric dissolved organic matter (CDOM) and other dissolved materials, Volume 5.0, IOCCG, Dartmouth, Canada, https://ioccg.org/wp-content/uploads/2019/10/cdom_abs_protocol_public_draft-19oct-2019-sm.pdf (last access: 4 November 2024), 2019b.
Jeffrey, S. W., Mantoura, R. F. C., and Wright S. W. (Eds.): Phytoplankton Pigments in Oceanography: Guidelines to Modern Methods, UNESCO Publishing, Paris, 661 pp., https://doi.org/10.1016/S0176-1617(00)80255-2, 1997.
Maffione, R. A. and Dana, D. R.: Instruments and methods for measuring the backward-scattering coefficient of ocean waters, Appl. Opt., 36, 6057–6067, 1997.
Morel, A.: Optical properties of pure water and pure seawater, in: Optical Aspects of Oceanography, edited by: by Jerlov, N. G. and Nielsen, E. S., 1974.
Morel, A. and Ahn, Y.-H.: Optical efficiency factors of free-living marine bacteria: Influence of bacterioplankton upon the optical properties and particulate organic carbon in oceanic waters, J. Mar. Res., 48, 145–175, 1990.
Morel, A., Antoine, D., and Gentili, B.: Bidirectional reflectance of oceanic waters: accounting for Raman emission and varying particle scattering phase function, Appl. Opt., 41, 6289–6306, 2002.
Mueller, J. L. and Austin, R. W.: Ocean Optics Protocols for Sea-WiFS Validation, Revision 1, NASA Tech. Memo. 104566, Vol. 25, edited by: Hooker, S. B. and Firestone, E. R., NASA Goddard Space Flight Center, Greenbelt, Maryland, 67 pp., https://ntrs.nasa.gov/api/citations/19950016254/downloads/19950016254.pdf (last access: 19 November 2024), 1995.
Pérez, G. L., Galí, M., Royer, S. J., Sarmento, H., Gasol, J. M., Marrasé, C., and Simó, R.: Bio-optical characterization of offshore NW Mediterranean waters: CDOM contribution to the absorption budget and diffuse attenuation of downwelling irradiance, Deep-Sea Res. Pt. I, 114, 111–127, 2016.
Roettgers, R., McKee, D., and Woźniak, S. B.: Evaluation of scatter corrections for ac-9 absorption measurements in coastal waters, Methods in Oceanography, 7, 21–39, 2013.
Smith, R. C. and Baker, K. S.: Optical properties of the clearest natural waters (200–800 nm), Appl. Opt., 20, 177–184, 1981.
Stockley, N. D., Röttgers, R., McKee, D., Lefering, I., Sullivan, J. M., and Twardowski, M. S.: Assessing uncertainties in scattering correction algorithms for reflective tube absorption measurements made with a WET Labs AC-9, Opt. Express, 25, A1139–A1153, 2017.
Stramski, D. and Kiefer, D. A.: Light scattering by microorganisms in the open ocean, Progr. Oceanogr., 28, 343–383, 1991.
Strickland, J. D. H. and Parsons, T. R.: A practical handbook of sea water analysis, Fish. Res. Board. Canada, 310 pp., https://publications.gc.ca/collections/collection_2015/mpo-dfo/Fs94-167-eng.pdf (last access: 19 November 2024), 1972.
Tassan, S. and Ferrari, G. M.: An alternative approach to absorption measurements of aquatic particles retained on filters, Limnol. Oceanogr., 40, 1358–1368, 1995.
Tassan, S., Ferrari, G. M., Bricaud, A., and Babin, M.: Variability of the amplification factor of light absorption by filter-retained aquatic particles in the coastal environment, J. Plankton Res., 22, 659–668, 2000.
Thuillier, G., Hersé, M. Foujols, T., Peetermans, W., Gillotay, D., Simon, P. C., and Mandel, H.: The solar spectral irradiance from 200 to 2400 nm as measured by the SOLSPEC spectrometer from the ATLAS and EURECA missions, Sol. Phys., 214, 1–22, https://doi.org/10.1023/A:1024048429145, 2003.
Twardowski, M. S., Boss, E., Macdonald, J. B., Pegau, W. S., Barnard, A. H., and Zaneveld, J. R. V.: A model for estimating bulk refractive index from the optical backscattering ratio and the implications for understanding particle composition in case I and case II waters, J. Geophys. Res.-Oceans, 106, 14129–14142, 2001.
Twardowski, M. S., Claustre, H., Freeman, S. A., Stramski, D., and Huot, Y.: Optical backscattering properties of the “clearest” natural waters, Biogeosciences, 4, 1041–1058, https://doi.org/10.5194/bg-4-1041-2007, 2007.
Valente, A., Sathyendranath, S., Brotas, V., Groom, S., Grant, M., Taberner, M., Antoine, D., Arnone, R., Balch, W. M., Barker, K., Barlow, R., Bélanger, S., Berthon, J.-F., Beşiktepe, Ş., Brando, V., Canuti, E., Chavez, F., Claustre, H., Crout, R., Frouin, R., García-Soto, C., Gibb, S. W., Gould, R., Hooker, S., Kahru, M., Klein, H., Kratzer, S., Loisel, H., McKee, D., Mitchell, B. G., Moisan, T., Muller-Karger, F., O'Dowd, L., Ondrusek, M., Poulton, A. J., Repecaud, M., Smyth, T., Sosik, H. M., Twardowski, M., Voss, K., Werdell, J., Wernand, M., and Zibordi, G.: A compilation of global bio-optical in situ data for ocean-colour satellite applications, Earth Syst. Sci. Data, 8, 235–252, https://doi.org/10.5194/essd-8-235-2016, 2016.
Van der Linde, D.: Protocol for total suspended matter estimate, JRC Technical Note I-98-182, Joint Research Centre of the European Commission, Ispra, Italy, 15 pp., 1998.
Van Heukelem, L. and Thomas, C. S.: Computer-assisted high-performance liquid chromatography method development with applications to the isolation and analysis of phytoplankton pigments, J. Chromatogr. A, 910, 31–49, 2001.
Voss, K. J. and Flora, S.: Spectral dependence of the seawater–air radiance transmission coefficient, J. Atmos. Ocean. Tech., 34, 1203–1205, 2017.
Werdell, P. J. and Bailey, S. W.: An improved in-situ bio-optical data set for ocean color algorithm development and satellite data product validation, Remote Sens. Environ., 98, 122–140, 2005.
Wet Labs: AC meter Protocol, WET Labs, Inc. Philomath, Oregon, 51 pp., https://misclab.umeoce.maine.edu/ftp/classes/OO2015/Instruments/ac9acs/acprotocol.pdf (last access: 4 November 2024), 2009.
Whitmire, A. L., Boss, E., Cowles, T. J., and Pegau, W. S.: Spectral variability of the particulate backscattering ratio, Opt. Express, 15, 7019–7031, 2007.
World Meteorological Organization: Guide to the Meteorological Instruments and Methods of Observation, WMO – N.8, 517 pp., https://community.wmo.int/en/activity-areas/imop/wmo-no_8 (last access: 19 November 2024), 1983.
Zaneveld, J. R. V., Kitchen, J. C., Bricaud, A., and Moore, C. C.: Analysis of in-situ spectral absorption meter data, in: Ocean Optics XI Proc. Soc. Photo-Optical Instrum. Eng. (SPIE), 1750, 187–200, https://doi.org/10.1117/12.140649, 1992.
Zibordi, G.: Immersion factor of in-water radiance sensors: assessment for a class of radiometers, J. Atmos. Ocean. Tech., 23, 302–313, 2006.
Zibordi, G. and Berthon, J.-F.: Coastal Atmosphere & Sea Time Series (CoASTS) and the Bio-Optical mapping of Marine optical Properties (BiOMaP): the near-surface marine bio-optical data set, https://doi.org/10.1594/PANGAEA.971945, 2024.
Zibordi, G. and Bulgarelli, B.: Effects of cosine error in irradiance measurements from field ocean color radiometers, Appl. Opt., 46, 5529–5538, 2007.
Zibordi, G. and Voss, K. J.: Field radiometry and ocean color remote sensing, in: Oceanography from Space, Springer, Dordrecht, 307–334, https://doi.org/10.1007/978-90-481-8681-5_18, 2010.
Zibordi, G., Doyle, J. P., and Hooker, S. B.: Offshore tower shading effects on in-water optical measurements, J. Atmos. Ocean. Tech., 16, 1767–1779, 1999.
Zibordi, G., Berthon, J.-F., Doyle, J. P., Grossi, S., van der Linde, D., Targa, C., and Alberotanza, L.: Coastal Atmosphere and Sea Time Series (CoASTS), Part 1: A Tower-Based Long-Term Measurement Program, NASA Tech. Memo. 2002–206892, Vol. 19, edited by: Hooker, S. B. and Firestone, E. R., NASA Goddard Space Flight Center, Greenbelt, Maryland, 29 pp., https://oceancolor.sci.gsfc.nasa.gov/resources/docs/technical/seawifs_reports/postlaunch/post_vol19_abs/ (last access: 19 November 2024), 2002.
Zibordi, G., Hooker, S. B., Mueller, J. M., and Lazin, G.: Characterization of the immersion factor for a series of in-water optical radiometers, J. Atmos. Ocean. Tech., 21, 501–514, 2004.
Zibordi, G., Berthon, J.-F., Mélin, F., and D'Alimonte, D.: Cross-site consistent in situ measurements for satellite ocean color applications: The BiOMaP radiometric dataset, Remote Sens. Environ., 115, 2104–2115, 2011.
Zibordi, G., Holben, B. N., Talone, M., D'Alimonte, D., Slutsker, I., Giles, D. M., and Sorokin, M. G.: Advances in the ocean color component of the aerosol robotic network (AERONET-OC), J. Atmos. Ocean. Tech., 38, 725–746, 2021.
- Abstract
- Introduction
- The CoASTS and BiOMaP programs
- Measurement overview
- Measurement and data reduction methods
- The near-surface CoASTS-BiOMaP dataset
- Data availability
- Summary and conclusions
- Appendix A: Abbreviations
- Author contributions
- Competing interests
- Disclaimer
- Acknowledgements
- Financial support
- Review statement
- References


