the Creative Commons Attribution 4.0 License.
the Creative Commons Attribution 4.0 License.
Enhancing high-resolution forest stand mean height mapping in China through an individual tree-based approach with close-range lidar data
Yuling Chen
Haitao Yang
Zekun Yang
Qiuli Yang
Weiyan Liu
Guoran Huang
Yu Ren
Kai Cheng
Tianyu Xiang
Mengxi Chen
Danyang Lin
Zhiyong Qi
Jiachen Xu
Yixuan Zhang
Guangcai Xu
Qinghua Guo
Forest stand mean height is a critical indicator in forestry, playing a pivotal role in various aspects such as forest inventory, sustainable forest management practices, climate change mitigation strategies, monitoring of forest structure changes, and wildlife habitat assessment. However, there is currently a lack of large-scale, spatially continuous forest stand mean height maps. This is primarily due to the requirement of accurate measurement of individual tree height in each forest plot, a task that cannot effectively be achieved by existing globally covered, discrete footprint-based satellite platforms. To address this gap, this study was conducted using over 1117 km2 of close-range light detection and ranging (lidar) data, which enables the measurement of individual tree heights in forest plots with high precision. Apart from lidar data, this study incorporated spatially continuous climatic, edaphic, topographic, vegetative, and synthetic aperture radar data as explanatory variables to map the tree-based arithmetic mean height (ha) and weighted mean height (hw) at 30 m resolution across China. Due to limitations in obtaining the basal area of individual tree within plots using uncrewed aerial vehicle (UAV) lidar data, this study calculated the weighted mean height through weighting an individual tree height by the square of its height. In addition, to overcome the potential influence of different vegetation divisions at a large spatial scale, we also developed a machine-learning-based mixed-effects (MLME) model to map forest stand mean height across China. The results showed that the average ha and hw across China were 11.3 and 13.3 m with standard deviations of 2.9 and 3.3 m, respectively. The accuracy of mapped products was validated utilizing lidar and field measurement data. The correlation coefficient (r) for ha and hw ranged from 0.603 to 0.906 and 0.634 to 0.889, while the root mean square error (RMSE) ranged from 2.6 to 4.1 and 2.9 to 4.3 m, respectively. Comparing with existing forest canopy height maps derived using the area-based approach, it was found that our products of ha and hw performed better and aligned more closely with the natural definition of tree height. The methods and maps presented in this study provide a solid foundation for estimating carbon storage, monitoring changes in forest structure, managing forest inventory, and assessing wildlife habitat availability. The dataset constructed for this study is publicly available at https://doi.org/10.5281/zenodo.12697784 (Chen et al., 2024).
- Article
(10288 KB) - Full-text XML
-
Supplement
(674 KB) - BibTeX
- EndNote
Tree height is a pivotal indicator in forestry (Wang et al., 2019a), with paramount importance for forest inventory, wildlife habitat assessment, and climate change mitigation strategies (Vaglio Laurin et al., 2019; Wang et al., 2019b; Zemp et al., 2023). Forest stand height denotes the mean height of trees within a stand/plot, including the arithmetic mean height and mean height weighted in proportion to their basal area (weighted mean height or Lorey's mean height) (Laar and Akça, 2007; Masaka et al., 2013). It serves as a key factor in assessing forest growth (Ma et al., 2023; McGregor et al., 2021), calculating forest volume (Xu et al., 2019) and carbon storage (Yao et al., 2018), and guiding sustainable forest management practices (Xu et al., 2023). Nevertheless, traditional tree height measurements derived from field surveys are typically time-consuming and resource-intensive (Jurjević et al., 2020; Liu et al., 2022), making it impractical to generate comprehensive wall-to-wall forest stand mean height data products across extensive spatial scales (Su et al., 2017). Although passive remote sensing techniques offer a potential solution for estimating forest stand height indirectly (Donoghue and Watt, 2006; Hall et al., 2006; Lu et al., 2004; Zhang et al., 2014). They are constrained by penetration ability and saturation effects, resulting in inherent uncertainty issues (Liu et al., 2022; Su et al., 2015). Mapping high-resolution forest stand mean height at a large scale through individual tree-based measurements remains a challenging but crucial objective in forest management and ecosystem monitoring.
Light detection and ranging (lidar), utilizing focused wavelength laser pulses, is an active remote sensing technique renowned for its robust penetration ability to directly characterize three-dimensional structures of forests (Guo et al., 2021; Liang et al., 2022; Liu et al., 2022; Ma et al., 2023; Su et al., 2017). The development of multi-platform lidar scanning has greatly enhanced the precision of tree height measurement from the individual trees to regional scales (Guo et al., 2021; Jurjević et al., 2020; Liu et al., 2022; Wang et al., 2019a). Additionally, to address challenges in accuracy and cost of lidar data, the innovations in close-range lidar, particularly through the use of uncrewed aerial vehicles (UAVs) and terrestrial laser scanning, have enhanced the flexibility, accessibility, and cost-effectiveness of lidar data in forestry applications (Guo et al., 2021; Hu et al., 2021; Yin et al., 2024). Consequently, the advancement of close-range lidar has laid a robust foundation of data and technology, facilitating the high-resolution wall-to-wall tree height mapping at large spatial scales.
Two main approaches are utilized for tree height measurement with lidar data: the area-based approach (Bouvier et al., 2015; Liu et al., 2022) and the tree-based approach (Su et al., 2017; Swayze et al., 2021; Yin et al., 2024). These approaches differ in their definition of height and the method used for calculation. The area-based approach, also known as the grid-based approach, simplifies the process of obtaining tree height. It involves generating a canopy height model (CHM) to calculate tree height based on the statistical relationships between plot-level lidar metrics. The height metric obtained from this approach is forest canopy height, which includes not only the actual tree height, but also the height of other branches (Bouvier et al., 2015). Additionally, changes in height within non-tree or non-vegetation pixels may also be included, leading to further deviation from the definition of tree height in forestry (Yin et al., 2024). Tree height calculated from the tree-based approach closely aligns with the natural definition of tree height, in which the height being evaluated is the height of the individual tree, ranging from the treetop to the ground. This approach requires first detecting individual trees in a sample plot, then measuring the height of each tree in this plot, and finally calculating the forest stand height (Laar and Akça, 2007; Masaka et al., 2013). Data from close-range lidar, with their advanced algorithms for individual tree segmentation, are widely used in the tree-based approach (Li et al., 2012; Qin et al., 2022; Tao et al., 2015; Yang et al., 2020; Yang et al., 2024; Yun et al., 2021). Despite its wide use in small-scale areas or specific forest types (Jurjević et al., 2020; Kwong and Fung, 2020; Næsset and Økland, 2002; Su et al., 2017; Yin et al., 2024), research gaps remain regarding large-scale application of the tree-based approach. Moreover, the absence of large-scale forest stand height metrics derived from the tree-based approach hinders the comparisons between tree-based and area-based methods for tree height estimation. Thus, to effectively implement sustainable management and development practices that balance conservation and human use needs, it is crucial to have comprehensive, timely, and accurate inventory and monitoring efforts for the height of forests at a national scale (Coops et al., 2021; Liu et al., 2022; Travers-Smith et al., 2024). However, there are challenges associated with using close-range lidar to collect continuous large-scale forest stand height observations considering the sparse coverage of lidar data and the associated costs.
To overcome the spatial discontinuity problem of close-range lidar samples on a large spatial scale, integration of multiple types of remote sensing data is a commonly used method for mapping wall-to-wall forest height (Huang et al., 2017; Lefsky, 2010; Lefsky et al., 2005; Liu et al., 2022; Su et al., 2017; Travers-Smith et al., 2024). Current approaches typically rely on spatial interpolation and regression techniques. Spatial interpolation involves predicting values at unobserved locations based on observed data points (Allard, 2013), taking advantage of spaceborne lidar data in wall-to-wall maps across extensive geographic areas with high resolution (Liu et al., 2022). For example, Liu et al. (2022) developed a spatial interpolation method to map China's forest canopy height by fusing GEDI, ICESat-2 ATLAS, and Sentinel-2 images. When it comes to forest stand mean height mapping, the spatial interpolation method may not be the most suitable method due to the rarity of forest stand mean heights in current spaceborne systems. In contrast, the regression strategy utilizes the continuous characteristics of optical remote sensing, radar, and existing data products as predictors to construct non-linear mathematical models linking environmental factors with observations. For example, Su et al. (2017) used the random forest algorithm to model forest stand height in Sierra Nevada based on GLAS tree heights, optical imagery, topographic data, and climate information. Travers-Smith et al. (2024) combined lidar and optical remote sensing products to map vegetation in high latitudes with a high overall accuracy. Currently, machine learning (ML) algorithms (Cheng et al., 2024a, b; Coops et al., 2021; Matasci et al., 2018) and deep learning algorithms (Fayad et al., 2024; Liu et al., 2022) are the primary non-linear mathematical regression approaches for achieving large-scale continuous spatial forest attributes mapping. Compared to deep learning algorithms, ML algorithms based on structured data are easier to implement and less computationally intensive. More importantly, in the context of mapping forest stand heights, feature engineering to compute relevant vegetation metrics is often preferred over utilizing raw radar and optical remote sensing data (Li et al., 2020; Potapov et al., 2021). Therefore, for estimation of the forest stand height through a tree-based approach at a large scale, the regression strategy using ML algorithms provides a robust solution for integrating multi-source remote data for wall-to-wall forest stand height mapping.
Variations in forest types within different vegetation divisions on large spatial scales may also influence the accuracy of forest stand height mapping. One feasible solution is to develop a specific model for each ecozone (Wu and Shi, 2023). However, this approach may lead to noticeable boundary effects when estimating results based on multiple specific models. Therefore, addressing how to adequately account for the spatial differences at a large spatial scale while using a single global model is a problem that requires a solution. The mixed-effects model, as demonstrated by Choi et al. (2024), offers a potential solution to simultaneously considering the heterogeneities of different regions. By integrating the mixed-effects model with ML, as proposed by Hu and Szymczak (2023), one can effectively leverage the strengths of both approaches to address complex data analysis challenges. This combination allows for the consideration of both random and fixed effects in the data while harnessing the flexibility and non-linear mathematical regression of ML to better explain the complexity of the data.
In this study, our main objective is to map the national-scale forest stand mean height across China through machine learning. We aim to address the challenges and potential of continuous mapping of tree height in heterogeneous forest ecosystem through a tree-based approach. To train machine learning models, we have collected over 1117 km2 of UAV lidar data across China. Subsequently, we mapped two forest stand mean height products at 30 m resolution: the arithmetic mean height (ha) and the weighted mean height (hw). Furthermore, we have validated the resulting forest stand mean height products by comparing them with field measurements and UAV lidar validation data. The national-scale maps of forest stand mean height produced in this study hold various applications, including estimating forest inventory, developing climate change mitigation strategies, monitoring changes in forest structure, and assessing wildlife habitats.
As illustrated in Fig. 1, the workflow for this study involved four main steps: (1) close-range lidar data processing, including individual tree segmentation and forest stand mean height calculation; (2) feature set construction, including multi-source remote sensing data and ancillary data processing; (3) ML-based mixed-effects (MLME) modeling; and (4) mapping of wall-to-wall forest stand mean height across China, including accuracy assessment and uncertainty analysis.
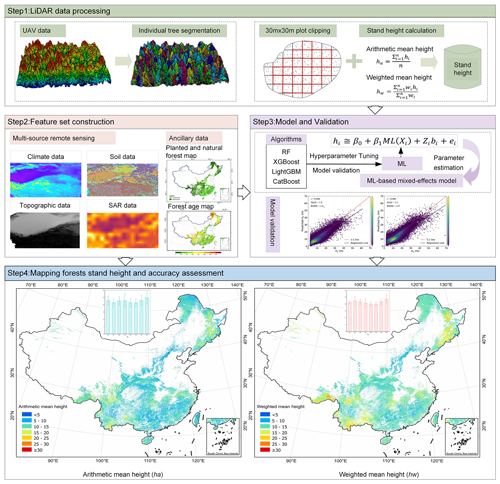
Figure 1Workflow adopted for the modeling and mapping forest stand mean heights (ha and hw) at 30 m resolution across the China's forest.
2.1 Close-range lidar data
The close-range lidar data used in this study were collected for the period from 2015, covering various types of vegetation divisions across China, excluding the Qinghai–Tibet Plateau alpine vegetation divisions (Tables 1, 2 and Fig. 2). The UAV lidar system was utilized in this study, resulting in a total data volume of 400 TB and covering an area of 1117.76 km2 (Table 2 and Fig. 2). These data serve as the foundation for creating the forest stand mean height sample set. The lidar data underwent initial processing using LiDAR360 software (v6.0; http://www.lidar360.com, last access: 26 July 2023), which included resampling, denoising, ground point classification, and normalization. The processed lidar data were then partitioned into 30 × 30 m grids, representing plots or stands of forest. In total, 610 342 plots were created. To identify individual trees with the height attribute within 30 × 30 m plots, the individual tree segmentation algorithm (Li et al., 2012) was introduced through the LiDAR360 software that was designed for crewed/UAV lidar data. Manual visual inspection was conducted for each plot to determine the optimal parameters for individual tree segmentation within the LiDAR360 software, ensuring more precise and reliable results. The dataset was used to train and validate the maps of forest stand mean heights in this study.
Table 1Lidar sensor parameter information during 2015 and 2023.
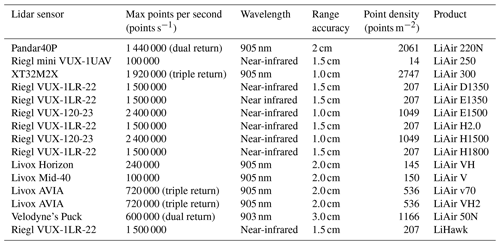
Note that we calculated point density (points m−2) based on terrain-following mode. The UAV lidar sensor maintained a height of 120 m above the ground, flew at a speed of 8 m s−1, and had a forward overlap ratio of 70 % and a lateral overlap ratio of 30 %.
Table 2Summary of the collected UAV lidar data grouped into eight vegetation divisions across China.

Note that the proportion of forest area covered by lidar data is the value of the ratio of the area where data were collected to the forest area in each vegetation division.
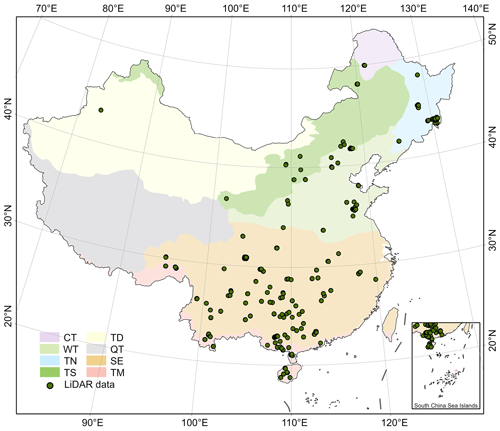
Figure 2Spatial distribution of the close-range lidar data used in this study. CT, TN, TS, TD, WT, QT, SE, and TM represent the vegetation divisions of cold temperate needleleaf forest, temperate needleleaf–broadleaf mixed forest, temperate steppe, temperate desert, warm temperate deciduous–broadleaf forest, Qinghai–Tibet Plateau alpine vegetation, subtropical evergreen broadleaf forest, and tropical monsoon forest–rainforest, respectively.
2.2 Field data
Field samples were collected for weighted mean height calculation (see Sect. 2.3) and product validation (see Sect. 2.5). From 2019 to 2023, a total of 294 plots were collected in six provinces of China. All of the plots achieved decimeter-level positioning accuracy, and each plot covered an area larger than 400 m2. The center position and information of individual trees in each plot, including the diameter at breast height (DBH > 5 cm) and tree height were recorded in each plot. However, it is worth noting that a time discrepancy may exist between the field surveys and lidar data acquisition. Additionally, variability may be introduced due to multiple field surveyors and region-specific adjustments to measurement tools.
2.3 Tree-based approach for calculating forest stand mean heights
Forest stand mean heights, including ha and hw, were calculated using a tree-based approach in this study (Laar and Akça, 2007; Nakai et al., 2010). While accurately segmenting individual trees based on lidar data might be challenging due to missing smaller trees and trees obscured by understory vegetation (Li et al., 2012; Tao et al., 2015; Yang et al., 2024), leading to some under-segmentation, this step remains crucial for modeling and mapping forest stand mean heights. Therefore, in this study, we only considered the parameter extraction of successfully segmented trees when using the tree-based approach for inverting and mapping forest stand mean heights. The segmented individual tree results obtained from close-range lidar data contained latitude, longitude, and tree height information for each tree.
2.3.1 Arithmetic mean height (ha)
The arithmetic mean height (ha) is calculated as the average of the tree heights of all trees obtained from the 30 × 30 m plots basing on our UAV lidar data. It is calculated as follows:
where hi is the height of ith tree (usually with a threshold of hi ≥ 2.0 m) and n is the number of trees within the grid.
2.3.2 Weighted mean height (hw)
Weighted mean height (hw) is calculated using the basal area as the weight for determining the forest stand mean height (Laar and Akça, 2007; Lorey, 1878; Masaka et al., 2013). It is calculated as follows:
where hw represents the weighted mean height (m), hi is the height of ith tree (usually with a threshold of hi≥2.0 m), wi is the weight (basal area) of ith tree, and n is the number of trees within the plot or stand.
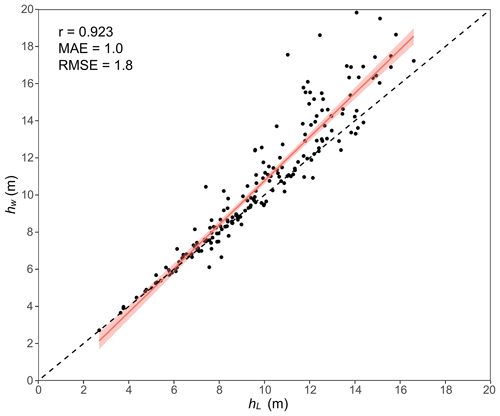
Considering the limitations in obtaining the basal area of individual trees within plots using UAV lidar data, the basal area cannot be used as a weight for calculating hw in this study. According to Næsset (1997), since the basal area of a tree is closely correlated to its height, the value of an individual tree height can be weighted by its tree height or even by the square of its height. Therefore, in this study, we adopted the method from Næsset (1997) to calculate hw, taking the tree height (w1) and square of the tree height (w2) as two alternative weights. The results were compared with the hw weighted based on basal area, and the better-performing one was selected as the final weight in this study. To determine the optimal weight, theoretical growth equations (Table S1 in the Supplement) for stand age and Lorey's mean height (hL, based on basal area) were constructed employing national forest inventory data (Cheng et al., 2024a). The optimal logistic model, hL model, was selected as the stand age (Tables S2 and S3). Then, close-range lidar data and forest age data from Cheng et al. (2024a) were combined with the selected model to calculate weighted by basal area. In addition, hw1 and hw2 were calculated based on weights of w1 and w2, respectively. The errors between and the two weighted mean heights (hw1 and hw2) were derived, and the ones with a smaller error were selected as the weighted mean height hw for this study (Table S4). Finally, to confirm the accuracy of the selected weighted hw from the second step, it was compared with the basal-area-weighted hL of 199 sample plots, calculated using integrated lidar and field data (including manually measured DBH and lidar-measured tree heights for each plot). hw weighted by w2 showed a strong correlation with hL, with correlation coefficient, r, of 0.92; root mean square error, RMSE, of 1.8 m; and mean absolute error, MAE, of 1.0 m (Fig. 3 and Table S4). Thus, in this study, w2 was used as the weight in the calculation of hw.
2.4 Ancillary data
In order to invert the forest stand mean height across China, 30 geospatial features were derived from multi-source remote sensing data. These features were grouped into five categories: climatic, edaphic, topographic, vegetative, and synthetic-aperture radar (SAR) data as shown in Table 3. Climate data were obtained from WorldClim 2.1 (https://www.worldclim.org, last access: 7 November 2023), which provides 19 bioclimatic variables, including temperature and precipitation at a 30 arcsec resolution. The Harmonized World Soil Database (HWSD) v1.2, with a resolution of 30 arcsec, was used to extract soil factors, including soil type and soil texture, to construct the tree height estimation model. The Shuttle Radar Topography Mission (SRTM) v3 product (SRTM Plus) provides global digital elevation data at 1 arcsec resolution and was used to extract topographic features. Three topographic features, i.e., elevation, slope, and aspect, were calculated using the Python ee package in this study (Table 3). The vegetative index used in this study is the Landsat-based annual maximum composite normalized digital vegetation index (NDVI) obtained from the Google Earth Engine (GEE). SAR data, including vertical–vertical (VV; the radar signal is transmitted and received with vertical polarization) and vertical–horizontal (VH; the radar signal is transmitted with vertical polarization and received with horizontal polarization), were derived from Sentinel-1. The planted and natural forest map was used to separate natural forests from planted ones (Cheng et al., 2024b). Additionally, the forest age map for China in 2020 (Cheng et al., 2024a) was utilized. For consistency, all geospatial features were resampled to 30 m resolution using the nearest resampling method.
2.5 ML-based mixed-effects model to map wall-to-wall forest stand mean height of China
The modeling data of the study have a hierarchical structure, including eight vegetation divisions, each hosting its specific plots. It is noteworthy that plots within the same vegetation division are not independent, and they exhibit notable heterogeneity when compared across various vegetation divisions. To address the problems, we proposed a novel machine-learning-based mixed-effects model framework. It integrates machine learning algorithms with mixed-effects model methodology, providing a powerful and flexible solution for modeling heterogeneous hierarchical data. This method not only enhances the accuracy of modeling, but also provides in-depth results for studies with complex data structures.
2.5.1 ML-based mixed-effects model (MLME)
We assumed there are n vegetation divisions, each containing forest stand mean height measurements taken at m spatial points. These spatial points correspond to 30 × 30 m plots in this study. We denote the tth () plot measurement in the ith () vegetation division as hit. The means, variances, and correlations of the forest stand mean height within the n vegetation divisions in each given plot can be expressed as follows:
The following non-linear mean function was chosen:
where β is the parameter vector and Xt is the predictor variable at plot t.
With the addition of certain random effects to the base model of Eq. (4), a non-linear mixed-effects model of general form is obtained.
where f denotes the forest stand mean height function, hi is the forest stand mean height at the ith vegetation division, β is the population parameter vector that is common to all vegetation divisions, bi is the random-effect vector specific to the ith vegetation division, and the εi is the error term.
To utilize linear prediction, we incorporate the random effects bi to linearize model (Eq. 5) with respect to the random effects as shown in Eq. (6). This model, linear in random effects, is termed the non-linear marginal model (Demidenko, 2013; Wang et al., 2023).
where Zi is the matrix of first-order derivatives with respect to the random effects.
The model described in Eq. (6) is decomposed into two distinct components: one related to fixed effects and the other related to random effects. For the fixed effect functions, we employed ML models, proposing the MLME model as described in Eq. (7).
where ML(Xi) represents the predicted value from the ML of each plot t (of ) within the mixed-effects model for vegetation division i (of ). β0 denotes the intercept coefficient, and β1 is the coefficient for the vector of predicted value for ML(Xi). Using the predicted values from the ML model, the influence of covariates is integrated into the mixed-effects model, thereby accounting for the specific forest stand mean height measurement within vegetation divisions.
2.5.2 Mapping wall-to-wall forest stand mean heights across China
According to the workflow outlined in Sect. 2.5.1, our work began with building the ML models to determine the fixed effects. We employed PyCaret, an open-source, low-code ML library in Python (https://pycaret.org, last access: 6 December 2023), which integrates various popular ML libraries and frameworks, to select ML algorithms for forest stand mean height estimation. Four ML algorithms, including random forest (RF), eXtreme Gradient Boosting (XGBoost), Light Gradient Boosting Machine (LightGBM), and Categorical Boosting (CatBoost), demonstrated superior performance (Table S5 in the Supplement). Then, the Bayesian optimization was employed for hyperparameter tuning (Mekruksavanich et al., 2022), using Optuna, an open-source framework for hyperparameter optimization, to automate the search for hyperparameters (Akiba et al., 2019) (Tables S6 and S7 in the Supplement). Next, the parameters of MLME were estimated using a two-step procedure. First, the forest stand mean height models were trained using the four ML algorithms to obtain ha and hw. It was found that LightGBM demonstrates the optimal performance and was selected to map ha and hw across China (Table S8 in the Supplement). Secondly, Eq. (7) in Sect. 2.5.1 was applied to derive vegetation-division-specific estimates of heights based on the forest stand mean height obtained from these best LightGBM models. Specifically, the lmer function from the lme4 package in the R language (version 4.3.0) was used for maximum likelihood estimation during model fitting.
2.5.3 Accuracy assessment
The original dataset was randomly split into two groups: two-thirds were added to the training set and the remainder to the validation set. Several statistical indicators, including the coefficient of determination (R2), root mean square error (RMSE), relative root mean square error (rRMSE), mean square error (MSE), and mean absolute error (MAE) were calculated to evaluate the performance of the ML model in this research. Additionally, the Akaike information criterion (AIC) and Bayesian information criterion (BIC) were employed to compare the accuracy and generalization of the parameter estimation results of the MLME model. The intraclass correlation coefficient (ICC) is a statistical measure used to quantify the reliability or agreement of measurements made by multiple plot observers measuring the same vegetation division. These statistical indicators are defined as follows:
where yi represents the observed value for the ith analytic tree, is the predicted value of ith observed value, n is the number of trees, is the mean value for the observed values, is the random intercept variance is the residual variance, L is the value of the log-likelihood function, and K is the number of parameters in the model.
2.6 Uncertainty analysis
The total uncertainty in forest stand mean heights at the pixel level is divided into three independent terms, with each term reported as a percentage of relative uncertainty, following Saatchi et al. (2011). The measurement error (εmeasurement) is associated with the accuracy of individual tree segmentation from close-range lidar data. This study employs the value of 1−F1 score as a measure of the percentage of relative uncertainty. The overall F1 score value averaged across all the testing plots was 0.90, with a corresponding measurement uncertainty of 10 % (Li et al., 2012).
The product error (εproduct) refers to errors in estimating the forest age (Cheng et al., 2024a) from forest structure attribute maps. It was estimated from the relations developed from calibration plots. The relative uncertainty in forest age for each pixel is calculated using Eq. (16), and then the maximum of mean relative error in forest age is calculated using Eq. (17) (Note S1 in the Supplement).
where RMSE is the root mean squared error in the validation set for the forest age product and represents the predicted value of the ith observed value.
The prediction error (εprediction) includes both the sampling error associated with the representativeness of the training data relative to the actual spatial distribution of stand height and the model predictions. The relative uncertainty for each pixel is calculated as follows:
where RMSEh is the root mean squared error in the validation set and represents the predicted stand height value of the ith observed stand height value.
Finally, we propagated the errors through the entire process by assuming all errors were independent and random. The uncertainty in estimating stand mean height (εh) was quantified using
To calculate the national-level uncertainty, we sum up the errors from all pixels using
where N is the number of pixels within the national boundary and and are the stand height and its relative uncertainty at pixel i, respectively.
3.1 UAV lidar-derived arithmetic mean height (ha) and weighted mean height (hw) across China
The UAV lidar-derived ha and hw varied across seven vegetation divisions (excluding Qinghai–Tibet Plateau alpine vegetation). However, as illustrated in Fig. 4, the rankings of ha and hw remained consistent across these vegetation divisions. The tallest lidar-derived ha and hw were recorded in the tropical monsoon forest–rainforest, measuring 68.49 and 69.67 m, respectively. In contrast, the highest average lidar-derived ha and hw were observed in the temperate desert, with values of 30.55 ± 6.94 and 37.28 ± 5.58 m, respectively (Fig. 4). The range of UAV lidar-derived ha and hw distribution was the widest in the tropical monsoon forest–rainforest, with standard deviations of 8.00 and 9.15 m, respectively (Fig. 4), while the lowest standard deviations of ha and hw were recorded in the cold temperate needleleaf forest, with values of 2.17 and 1.94 m, respectively (Fig. 4). These UAV lidar-derived ha and hw provided a concrete foundation for training and validating the tree-based approach for mapping wall-to-wall ha and hw of China's forests.
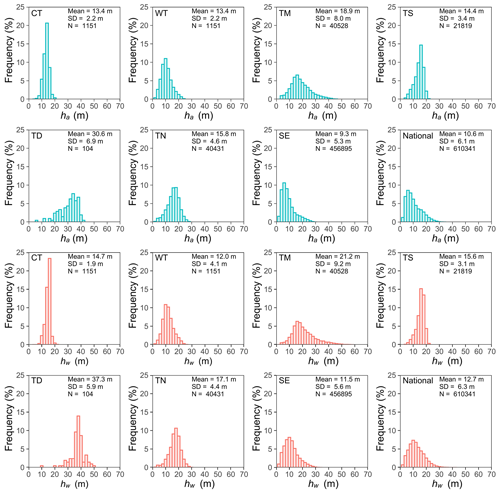
Figure 4Histograms of UAV lidar-derived ha and hw across the vegetation zone and the overall dataset. Mean and SD represent the mean and standard deviation of UAV lidar-derived ha and hw, with N representing the number of training sample plots (size = 30 × 30 m). CT, TN, TS, TD, WT, SE, and TM represent the vegetation divisions of cold temperate needleleaf forest, temperate needleleaf–broadleaf mixed forest, temperate steppe, temperate desert, warm temperate deciduous–broadleaf forest, subtropical evergreen broadleaf forest, and tropical monsoon forest–rainforest, respectively.
3.2 Prediction accuracy of the MLME model
Based on the construction and optimization process of the ML model (see Tables S6 and S7 in the Supplement), the MLME models simultaneously account for the interaction between covariates (the predicted ha and hw from the ML) and the grouping variable (eight vegetation divisions). These models, as shown in Tables 3 and 4, reveal different predictions of ha and hw across vegetation divisions. This study suggests that discrepancies in estimating ha and hw across China primarily stem from variations in vegetation divisions as evidenced by ICC values of 0.581 and 0.693 for ha and hw, respectively (Table 4). These values indicated that approximately 58.1 % and 69.3 % of the total variance are attributable to variations between different vegetation divisions for estimating ha and hw, respectively (Table 4).
Table 4Parameter estimates and fitting statistics of MLME models for vegetation divisions.
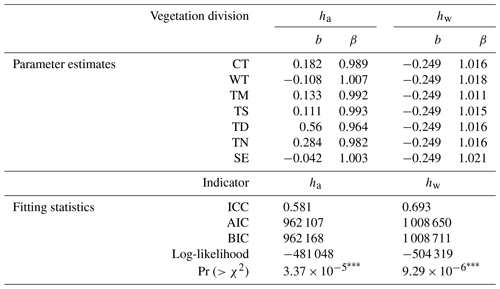
Note that ha is the arithmetic mean height, hw is weighted mean height, CT is cold temperate needleleaf forest, TN is temperate needleleaf–broadleaf mixed forest, TM is tropical monsoon forest–rainforest, TS is temperate steppe, TD is temperate desert, WT is warm temperate deciduous–broadleaf forest, and SE is subtropical evergreen broadleaf forest. The asterisks denote significance levels. : p value of less than 0.001, indicating a very high level of statistical significance.
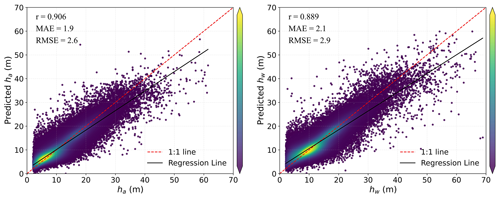
Our results demonstrated high accuracy in estimating ha and hw across China's forests, with R2 > 0.82, RMSE < 2.6 m, and MAE < 1.9 m for ha and R2 > 0.78, RMSE < 2.9 m, and MAE < 2.1 m for hw (Table 5 and Fig. 5). It can be seen that the accuracy of ha consistently surpasses that of hw regardless of whether ML or MLME methods were employed. As displayed in Table 5 and Fig. 5, MLME models, which integrated vegetation divisions as variables, showed slightly superior performance in estimating ha and hw compared to ML models, once again highlighting the impact of incorporating vegetation divisions into the estimation results. Additionally, incorporating vegetation divisions slightly improved the accuracy of hw estimation when compared to that of ha, This may be due to the stronger influence of vegetation divisions on hw (ICC = 0.693) (Tables 4 and 5). Figure 5 provides comparisons of estimated ha and hw against observed lidar validation data based on MLME. Excellent consistency can be found between estimated and validation results. High correlations are presented in the ha MLME model (r=0.906) and the hw MLME model (r=0.889). Specifically, ha tended to be slightly overestimated for lower measured mean height, while no biased estimation was observed for hw.
Table 5Comparative prediction accuracy of ha and hw models with ML and MLME.

Note that ha is the arithmetic mean height and hw is weighted mean height.
3.3 Wall-to-wall arithmetic mean height (ha) and weighted mean height (hw) of China
We applied MLME models to map ha and hw at a 30 m resolution across China's forests as shown in Figs. 6 and 7, respectively. Overall, the mean value of hw was 13.3 ± 3.3 m (mean value ± SD) for pixels, which is higher than that of ha (11.3 ± 2.9 m) per pixels. Geographically, our ha and hw maps exhibited similar patterns, with forests in the southwestern (ha=12.05 ± 3.27 m, hw=14.13 ± 3.85 m), northeastern (ha=12.05 ± 3.20 m, hw=14.74 ± 3.39 m), and southeastern (ha= 10.98 ± 2.67 m, hw= 12.67 ± 2.60 m) parts of China being relatively taller than those in the southern (ha=10.69 ± 2.39 m, hw=12.56 ± 2.39 m), northern (ha=10.28 ± 2.44 m, hw=11.80 ± 2.43 m), and northwestern (ha=10.63 ± 2.53 m, hw=12.59 ± 2.87 m) regions (Figs. 6 and 7). Despite considerable variations in ha and hw among forests in different provinces (Fig. 8), a consistent trend indicated that ha was generally lower than hw across all provinces, except for Tianjin (ha=8.78 ± 1.64 m vs. hw=8.34 ± 1.64 m) (Fig. 8). Notably, Jilin exhibited the highest ha value (13.41 ± 2.92 m), which was closely followed by Tibet (13.40 ± 3.60 m), Anhui (12.96 ± 2.65 m), Xinjiang (12.39 ± 4.01 m), and Sichuan (12.21 ± 3.02 m). Conversely, Shanghai recorded the highest hw value (17.17 ± 2.02 m), with Jilin (17.12 ± 2.87 m), Xinjiang (16.93 ± 2.54 m), Tibet (16.21 ± 4.73 m), and Yunnan (15.03 ± 4.02 m) trailing closely behind. Tibet, Xinjiang, and Yunnan showed greater variability in both ha and hw than in other provinces.
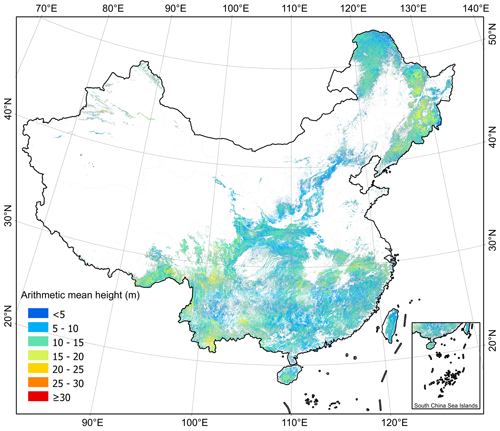
Figure 6The forest arithmetic mean height (ha) of China derived from the the tree-based approach at 30 m resolution for 2020.
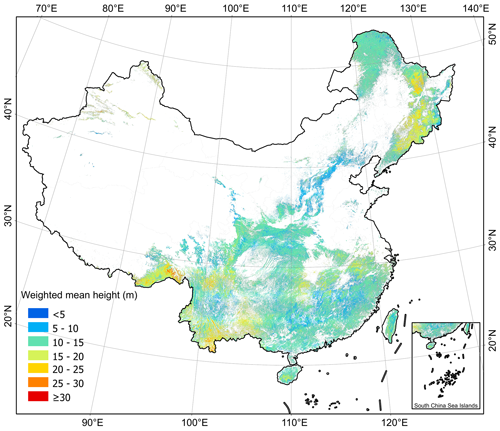
Figure 7The forest weighted mean height (hw) of China derived from the tree-based approach at 30 m resolution for 2020.
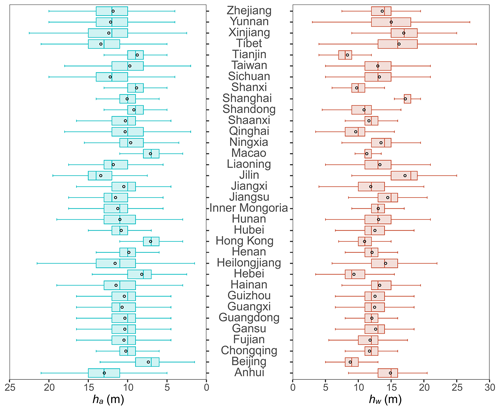
Figure 8Province-level analysis of ha and hw estimations derived from the tree-based approach. The black circle is the mean value, the solid line in box is median value for each province.
The estimations for ha and hw conformed to a normal distribution across eight vegetation divisions in China, with some notable differences between the two as shown in Fig. 9. The highest recorded values for ha and hw values were 94 and 96 m, respectively, observed in subtropical evergreen broadleaf forest. For ha, the temperate needleleaf–broadleaf mixed forest exhibited the tallest forest height (median = 13 m, mean = 13.03 m), followed by tropical monsoon forest–rainforest (median = 13 m, mean = 12.95 m), Qinghai–Tibet Plateau alpine vegetation (median = 12 m, mean = 12.38 m), temperate desert (median = 11 m, mean = 11.83 m), subtropical evergreen broadleaf forest (median = 11 m, mean = 11.14 m), temperate steppe (median = 11 m, mean = 10.78 m), cold temperate needleleaf forest (median = 11 m, mean = 10.75 m), and warm temperate deciduous–broadleaf forest (median = 9 m, mean = 9.34 m). For hw, tropical monsoon forest–rainforest had the tallest forest height (median = 16 m, mean = 16.41 m), followed by temperate needleleaf–broadleaf mixed forest (median = 16 m, mean = 15.96 m), temperate desert (median = 16 m, mean = 15.44 m), cold temperate needleleaf forest (median = 13 m, mean = 12.89 m), subtropical evergreen broadleaf forest (median = 12 m, mean = 12.84 m), temperate steppe (median = 13 m, mean = 12.80 m), Qinghai–Tibet Plateau alpine vegetation (median = 12 m, mean = 12.34 m), and warm temperate deciduous–broadleaf forest (median = 11 m, mean = 10.77 m). Compared to the ranges of ha distributions in different vegetation divisions, the ranges of hw distributions were wider as illustrated in Fig. 9. Specifically, the vegetation divisions with the greatest variations, the ranges of both ha and hw distributions were temperate desert (standard deviation = 4.09 and 4.55 m of ha and hw, respectively), tropical monsoon forest–rainforest (standard deviation = 3.71 and 4.39 m of ha and hw, respectively), and temperate needleleaf–broadleaf mixed forest (standard deviation = 3.10 and 3.27 m of ha and hw, respectively).
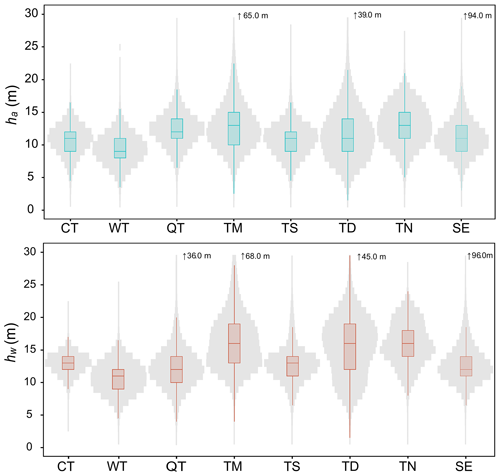
Figure 9Vegetation divisions-level analysis of the tree-based approach-derived ha and hw estimations. CT, TN, TS, TD, WT, QT, SE, and TM represent the vegetation divisions of cold temperate needleleaf forest, temperate needleleaf–broadleaf mixed forest, temperate steppe, temperate desert, warm temperate deciduous–broadleaf forest, Qinghai–Tibet Plateau alpine vegetation, subtropical evergreen broadleaf forest, and tropical monsoon forest–rainforest, respectively. The solid line in each box is median value.
3.4 Uncertainty analysis
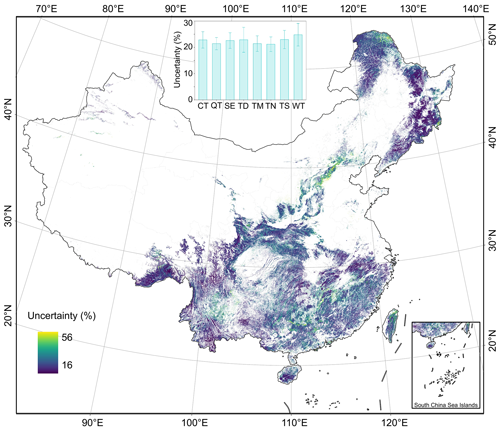
The uncertainties in ha (Fig. 10) and hw (Fig. 11) at the 30 m pixel level were quantified by integrating the measurement error, product error, and prediction error in ha and hw maps. The overall uncertainty in mapping ha and hw at the pixel scale, averaged over all vegetation divisions, was estimated to be 23 % and 21 %, respectively (Figs. 10 and 11). However, these uncertainties were not uniformly distributed across China. The uncertainty for ha ranged from 16 % to 56 %, while for hw, it ranged from 16 % to 59 %. These variations depended on the regional differences in forests, the quality of remote sensing imagery, and the sampling size and distribution of available field and lidar data. We further assessed the uncertainty around ha and hw estimates at national and regional scales by error propagation. As the sample area increased, the relative errors decreased. The national estimations were found to be constrained to within 1 % for ha (4.30 × 10⁻⁴ %) and hw (4.12 × 10⁻⁴ %).
The national scale, continuous maps of arithmetic mean height (ha) and weighted mean height (hw) across China address the challenges of accurately estimating forest stand mean height using a tree-based approach. These maps provide critical datasets for forest sustainable management in China, including climate change mitigation (e.g., terrestrial carbon estimation) (Duncanson et al., 2022; Migliavacca et al., 2021), forest ecosystem assessment (Davies et al., 2017; Jucker et al., 2018; Li et al., 2020), and forest inventory practices (Fang et al., 2006, 2001; Travers-Smith et al., 2024; Xu et al., 2019). By leveraging high-point-density, and high-precision close-range lidar data, spatially continuous maps that comply with the definitions of ha and hw in forestry were generated. Validation results indicate that our method has high accuracy (Figs. 5 and 12), demonstrating the potential for widespread application of tree-based forest stand mean height estimation at a large scale. Furthermore, our findings suggest that close-range lidar technology can enhance traditional forestry surveys by enabling rapid, accurate, large-scale, and cost-effective assessments.
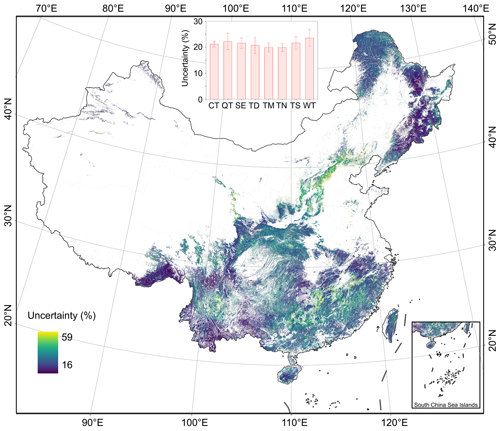
Figure 11Uncertainty analysis in the spatial distribution of forest weighted mean height (hw) in each pixel.
Regarding forest stand mean height estimations (ha and hw), distinctive methods and definitions of tree height from the commonly used CHM are employed in this study. Despite these differences, previous studies indicate that there was a strong correlation between forest stand mean height and the CHM-derived height metrics from lidar point clouds. Finer-scale analysis demonstrated that the 50 %, 75 %, 80 %, 90 %, and 95 % heights in the CHM model can serve as the optimal variables for linear regression prediction of Lorey's weighted height across different studies (Li et al., 2022; Liu et al., 2018; Pang et al., 2008). Conversely, for predicting arithmetic mean height, different optimal variables might be employed, including the 30 %, 60 %, and 70 % heights (Jensen and Mathews, 2016; Li et al., 2022). The abovementioned differences resulting from variations in geographic regions and tree species highlight the challenges in indirectly estimating ha and hw using the CHM (Yin et al., 2024). Spaceborne lidar and multi-source remote sensing data have been widely used for estimating forest canopy height on a national/global scale through area-based approaches (Coops et al., 2021; Liu et al., 2022; Travers-Smith et al., 2024), including the 98 % height (Lang et al., 2023; Liu et al., 2022), 95 % height (Potapov et al., 2021), 100 % height (Ni et al., 2015; Simard et al., 2011), and 90 % canopy height products. However, these results are more aligned with the maximum tree height, which may be numerically closer to the forest dominant/top height (Li et al., 2023) rather than the forestry definitions of forest stand mean height (Laar and Akça, 2007; Masaka et al., 2013). In forestry, the dominant tree height is widely recognized as a key factor in explaining forest site productivity (Vanclay, 1992; Vatandaslar et al., 2023; Woods et al., 2011), while stand mean heights are crucial for calculating forest volume and carbon storage capacity (Xu et al., 2019). As the demand for accurate tree height estimation grows, our study aligns with forestry definitions and needs. Taking advantages of extensive high-precision UAV lidar data, we mapped the national-scale forest ha and hw data products for China. Among them, ha can efficiently and accurately assess the stand mean height in even-aged stands (e.g., planted forest), while hw is a valuable parameter for representing the mean height in uneven-aged forest stands (e.g., natural forest). Our maps underscore the importance of using appropriate tree height definitions and methodologies tailored to meet the specific requirements of forestry management and ecological research.
A significant challenge of using a tree-based approach to calculate Lorey's weighted height from UAV lidar data lies in the difficulty of obtaining DBH information. Consequently, the traditional Lorey's weighted height calculation method is not feasible in this study. To address this problem, the regression height of the quadratic mean diameter method, which estimates stand mean height by corresponding to the tree height with an average DBH on the height–diameter curve, served as a simplified alternative (Laar and Akça, 2007; Lou et al., 2016). Therefore, following Næsset (1997), this study uses accurate tree height measurements obtained from UAV lidar, treating tree height itself as the weight to calculate the weighted mean height (hw) in this study. This method mitigates the limitations of applying Lorey's weighted height without DBH, yielding results that are highly consistent with those obtained using DBH-based ones (Fig. 3). However, as highlighted in Fig. 3, our weighting method shows a tendency to overestimate tree heights. We explored this issue through both theoretical derivation and empirical validation to offer a more comprehensive interpretation (detailed in Note S2 in the Supplement). Our analysis reveals that the overestimation of hw occurs mainly when the numerical value of DBH (measured in cm) consistently exceeds that of tree height (measured in meters), a rare and extreme scenario. Additionally, limitations in our validation data, such as its small sample size and uneven distribution, may have contributed to this discrepancy. Nonetheless, the hw calculation method used in this study is easy to apply to large-scale forest surveys, significantly reducing the input of labor, time, and costs.
Another challenge arises from the regional variations that affect tree height in China due to the extensive distribution of China's forests. In this study, a variety of variables related to forest growth were considered in a comprehensive way to address this issue (detailed in Sect. 2.3), thereby enhancing the model's explanatory force and improving the accuracy of ha and hw estimations. Additionally, forest stand mean height is significantly influenced by tree species (Laar and Akça, 2007). However, obtaining accurate tree species information through large-scale and remote sensing-based methods is challenging (Ørka et al., 2009). For example, Wu and Shi (2023) considered the distinct nature of forests in different ecological zones in China as a feasible method in the absence of known tree species to improve the accuracy of forest canopy height estimation through building ecological zone-based models. Similarly, to avoid the potential boundary effects introduced by multiple specific models, we employed the MLME model to capture and differentiate between forest types in vegetation divisions across China. It was revealed that 58.1 % and 69.3 % of the total variances of ha and hw were due to variations in vegetation divisions (Table 4). This indicates significant ecological differences between the vegetation divisions, leading to differences in ha and hw. Combining the results from Table 5, the MLME method showed a slight performance improvement over the ML method in both ha and hw. Additionally, the improvement in hw exceeds that in ha, possibly due to its higher ICC as shown in Table 4, which further highlights that hw is more sensitive to uneven-aged forest stands.
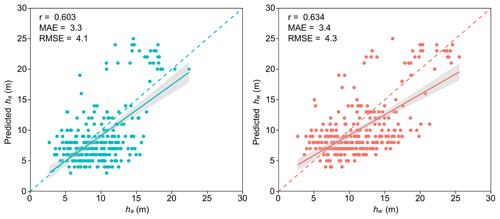
The validation results of both ha and hw estimations based on a tree-based approach compared to the field-measured forest stand mean height show an overestimation for plots with higher tree heights and a slight underestimation for plots with lower tree heights (Fig. 12). The values of r and RMSE for ha and hw indicate that ha and hw when validated through lidar data exhibit better performance (Figs. 5 and 12). Two reasons are likely to influence the accuracy assessment of ha and hw in this study. First, there may be certain errors in both field-based and lidar-based tree height measurements that may have contributed. Variations in researchers and measurement tools coupled with canopy occlusion can affect the accurate measurements of tree heights, particularly for the tall trees in field (Jurjević et al., 2020; Wang et al., 2019a). In this study, ha and hw estimations are influenced by accurate segmentation of individual trees based on lidar data. However, the accuracy of lidar-based individual tree segmentation is also affected by canopy occlusion (Huo et al., 2022; Li et al., 2012), especially the omission of low trees obscured by the canopy. This omission of trees with lower heights may increase the influence of the taller trees in hw weighted by tree height, leading to overestimated results (Laar and Akça, 2007; Lefsky, 2010) (Fig. 12). Second, the lack of temporal consistency between lidar data and field measurements may be another reason. In this study, the lidar data were collected from 2015 to 2023, while the field measurements were conducted from 2019 to 2023 (Yang et al., 2023). The relatively long-time span may witness significant tree growth, particularly in young forests (Tang et al., 2014). Therefore, this temporal inconsistency may have impacted the estimation and validation of ha and hw. Specifically, it could cause an underestimation of tree heights below 10 m as shown in Fig. 12.
Overall, despite the novelty of the data, maps of forest mean stand height, and topic of this study, there are still several limitations of the study in terms of close-range lidar data and algorithms of lidar process. First, as demonstrated in Fig. 2, close-range lidar data are spatially unevenly distributed across China. While over 1117 km2 of close-range lidar data were used, the gaps in data coverage over Qinghai–Tibet Plateau alpine vegetation divisions and uneven distribution in northwestern and southeastern China may influence the mapping accuracy. Enhancing data acquisition and establishing sharing mechanisms for lidar data might be key and feasible solutions for addressing this issue. Second, as shown in Table 1, training and validation data were sourced for a 9-year span and collected using various lidar sensors. As of 2015, the application of lidar has not been widely adopted in forest remote sensing research in China. Considering the cost and the difficulty of data collection, it was challenging to collect extensive, high-point density and accurate data across China within a short time frame. Consequently, multiple types of lidar sensors were employed over 9 years to meet the requirements of data quality. Pre-processing and calibration were conducted to minimize the errors result from variations in lidar sensors (Guo et al., 2017; Hu et al., 2021; Zhao et al., 2022). While realizing potential errors associated with tree growth, there is no better alternative data available to achieve this tree-based approach to forest stand mean height mapping. Third, the accuracy of the individual tree segmentation algorithm based on UAV lidar data may be another limitation in this study. Accurate segmentation of individual trees is crucial for forest stand mean height mapping through a tree-based approach. Challenges such as omission and inclusion errors throughout individualizing trees in complex stands affect the accurate attribute measurements regarding individual trees despite visual inspections. The accuracy of individual tree segmentation has also been included in the uncertainty analysis as shown in Figs. 10 and 11. The development of the individual tree segmentation algorithm and fusion of multi-lidar platforms are expected in future work to enhance individual tree segmentation accuracy.
Data described in this paper can be accessed on the Zenodo repository at https://doi.org/10.5281/zenodo.12697784 (Chen et al., 2024).
We have developed a tree-based approach to create spatially continuous forest stand mean height maps across China through integrating high-point-density, high-precision close-range lidar data and multi-source remote sensing data. The accuracy analysis of ha and hw demonstrates the feasibility of the proposed method. A practical framework for forestry investigation based on close-range lidar was proposed. The mean values of hw and ha are 13.3 ± 3.3 m and 11.3 ± 2.9 m at the pixel level, respectively. Validation based on lidar and field sample data shows that the RMSE values range from 2.6 to 4.1 m for ha and 2.9 to 4.3 m for hw, respectively, indicating that our approach outperforms existing forest canopy height maps derived from area-based approaches. Hopefully, our methods and maps will serve as a foundation for estimating carbon storage, monitoring changes in forest structure, managing forest inventory, and assessing wildlife habitat availability.
The supplement related to this article is available online at: https://doi.org/10.5194/essd-16-5267-2024-supplement.
YC, HY, and QG designed the study; YC and HY developed the MLME method; ZY, QY, WL, GH, YR, KC, TX, MC, DL, ZQ, JX, YZ, and GX collected lidar data and provided the filed measurements; and all authors of them processed the lidar data used in this study. YC generated the forest stand mean height products of China and performed the accuracy assessment, HY and YC wrote the original manuscript, and all authors participated in the process of manuscript revision.
The contact author has declared that none of the authors has any competing interests.
Publisher's note: Copernicus Publications remains neutral with regard to jurisdictional claims made in the text, published maps, institutional affiliations, or any other geographical representation in this paper. While Copernicus Publications makes every effort to include appropriate place names, the final responsibility lies with the authors. Regarding the maps used in this paper, please note that Figs. 1, 2, 6, 7, 10, and 11 contain disputed territories.
We would like to thank all the scientists, engineers, and students who participated in the field observations, instrument maintenance, and data processing. We highly appreciate the valuable and constructive comments on the paper provided by Yanjun Su of the Institute of Botany, Chinese Academy Of Sciences (CAS).
This work was supported by the National Key Research and Development Program (grant no. 2022YFF1300203) and the National Natural Science Foundation of China (grant nos. 42371329 and 32301285).
This paper was edited by Jia Yang and reviewed by two anonymous referees.
Akiba, T., Sano, S., Yanase, T., Ohta, T., and Koyama, M.: Optuna: A Next-generation Hyperparameter Optimization Framework, Proceedings of the 25th ACM SIGKDD International Conference on Knowledge Discovery & Data Mining, Anchorage, AK, USA, https://doi.org/10.1145/3292500.3330701, 2019.
Allard, D.: J.-P. Chilès, P. Delfiner: Geostatistics: Modeling Spatial Uncertainty, Math. Geosci., 45, 377–380, https://doi.org/10.1007/s11004-012-9429-y, 2013.
Bouvier, M., Durrieu, S., Fournier, R. A., and Renaud, J.-P.: Generalizing predictive models of forest inventory attributes using an area-based approach with airborne LiDAR data, Remote Sens. Environ., 156, 322–334, https://doi.org/10.1016/j.rse.2014.10.004, 2015.
Cheng, K., Chen, Y., Xiang, T., Yang, H., Liu, W., Ren, Y., Guan, H., Hu, T., Ma, Q., and Guo, Q.: A 2020 forest age map for China with 30 m resolution, Earth Syst. Sci. Data, 16, 803–819, https://doi.org/10.5194/essd-16-803-2024, 2024a.
Cheng, K., Yang, H., Guan, H., Ren, Y., Chen, Y., Chen, M., Yang, Z., Lin, D., Liu, W., Xu, J., Xu, G., Ma, K., and Guo, Q.: Unveiling China's natural and planted forest spatial–temporal dynamics from 1990 to 2020, ISPRS J. Photogramm., 209, 37–50, https://doi.org/10.1016/j.isprsjprs.2024.01.024, 2024b.
Chen, Y., Yang, H., Yang, Z., Yang, Q., Liu, W., Huang, G., Ren, Y., Cheng, K., Xiang, T., Chen, M., Lin, D., Qi, Z., Xu, J., Zhang, Y., Xu, G., and Guo, Q.: Enhancing High-Resolution Forest Stand Mean Height Mapping in China through an Individual Tree-Based Approach with Close-Range LiDAR Data (1.0), Zenodo [data set], https://doi.org/10.5281/zenodo.12697784, 2024.
Choi, S., McMaster, K. L., Kohli, N., Shanahan, E., Birinci, S., An, J., Duesenberg-Marshall, M., and Lembke, E. S.: Longitudinal effects of data-based instructional changes for students with intensive learning needs: A piecewise linear–linear mixed-effects modeling approach, J. Educ. Psychol., 116, 608–628, https://doi.org/10.1037/edu0000853, 2024.
Coops, N. C., Tompalski, P., Goodbody, T. R. H., Queinnec, M., Luther, J. E., Bolton, D. K., White, J. C., Wulder, M. A., van Lier, O. R., and Hermosilla, T.: Modelling lidar-derived estimates of forest attributes over space and time: A review of approaches and future trends, Remote Sens. Environ., 260, 112477, https://doi.org/10.1016/j.rse.2021.112477, 2021.
Davies, A. B., Ancrenaz, M., Oram, F., and Asner, G. P.: Canopy structure drives orangutan habitat selection in disturbed Bornean forests, P. Natl. Acad. Sci. USA, 114, 8307–8312, https://doi.org/10.1073/pnas.1706780114, 2017.
Demidenko, E.: Mixed models: theory and applications with R, 2nd Edn., John Wiley & Sons, ISBN 978-1-118-09157-9, 2013.
Donoghue, D. N. M. and Watt, P. J.: Using LiDAR to compare forest height estimates from IKONOS and Landsat ETM+ data in Sitka spruce plantation forests, Int. J. Remote Sens., 27, 2161–2175, https://doi.org/10.1080/01431160500396493, 2006.
Duncanson, L., Kellner, J. R., Armston, J., Dubayah, R., Minor, D. M., Hancock, S., Healey, S. P., Patterson, P. L., Saarela, S., Marselis, S., Silva, C. E., Bruening, J., Goetz, S. J., Tang, H., Hofton, M., Blair, B., Luthcke, S., Fatoyinbo, L., Abernethy, K., Alonso, A., Andersen, H.-E., Aplin, P., Baker, T. R., Barbier, N., Bastin, J. F., Biber, P., Boeckx, P., Bogaert, J., Boschetti, L., Boucher, P. B., Boyd, D. S., Burslem, D. F. R. P., Calvo-Rodriguez, S., Chave, J., Chazdon, R. L., Clark, D. B., Clark, D. A., Cohen, W. B., Coomes, D. A., Corona, P., Cushman, K. C., Cutler, M. E. J., Dalling, J. W., Dalponte, M., Dash, J., de-Miguel, S., Deng, S., Ellis, P. W., Erasmus, B., Fekety, P. A., Fernandez-Landa, A., Ferraz, A., Fischer, R., Fisher, A. G., García-Abril, A., Gobakken, T., Hacker, J. M., Heurich, M., Hill, R. A., Hopkinson, C., Huang, H., Hubbell, S. P., Hudak, A. T., Huth, A., Imbach, B., Jeffery, K. J., Katoh, M., Kearsley, E., Kenfack, D., Kljun, N., Knapp, N., Král, K., Krůček, M., Labrière, N., Lewis, S. L., Longo, M., Lucas, R. M., Main, R., Manzanera, J. A., Martínez, R. V., Mathieu, R., Memiaghe, H., Meyer, V., Mendoza, A. M., Monerris, A., Montesano, P., Morsdorf, F., Næsset, E., Naidoo, L., Nilus, R., O'Brien, M., Orwig, D. A., Papathanassiou, K., Parker, G., Philipson, C., Phillips, O. L., Pisek, J., Poulsen, J. R., Pretzsch, H., Rüdiger, C., Saatchi, S., Sanchez-Azofeifa, A., Sanchez-Lopez, N., Scholes, R., Silva, C. A., Simard, M., Skidmore, A., Stereńczak, K., Tanase, M., Torresan, C., Valbuena, R., Verbeeck, H., Vrska, T., Wessels, K., White, J. C., White, L. J. T., Zahabu, E., and Zgraggen, C.: Aboveground biomass density models for NASA's Global Ecosystem Dynamics Investigation (GEDI) lidar mission, Remote Sens. Environ., 270, 112845, https://doi.org/10.1016/j.rse.2021.112845, 2022.
Fang, J., Chen, A., Peng, C., Zhao, S., and Ci, L.: Changes in Forest Biomass Carbon Storage in China Between 1949 and 1998, Science, 292, 2320–2322, https://doi.org/10.1126/science.1058629, 2001.
Fang, J., Brown, S., Tang, Y., Nabuurs, G.-J., Wang, X., and Shen, H.: Overestimated Biomass Carbon Pools of the Northern mid- and High Latitude Forests, Climatic Change, 74, 355–368, https://doi.org/10.1007/s10584-005-9028-8, 2006.
Fayad, I., Ciais, P., Schwartz, M., Wigneron, J.-P., Baghdadi, N., de Truchis, A., d'Aspremont, A., Frappart, F., Saatchi, S., Sean, E., Pellissier-Tanon, A., and Bazzi, H.: Hy-TeC: a hybrid vision transformer model for high-resolution and large-scale mapping of canopy height, Remote Sens. Environ., 302, 113945, https://doi.org/10.1016/j.rse.2023.113945, 2024.
Guo, Q., Su, Y., Hu, T., Guan, H., Jin, S., Zhang, J., Zhao, X., Xu, K., Wei, D., Kelly, M., and Coops, N. C.: Lidar Boosts 3D Ecological Observations and Modelings: A Review and Perspective, IEEE Geosci. Remote, 9, 232–257, https://doi.org/10.1109/MGRS.2020.3032713, 2021.
Guo, Q., Su, Y., Hu, T., Zhao, X., Wu, F., Li, Y., Liu, J., Chen, L., Xu, G., Lin, G., Zheng, Y., Lin, Y., Mi, X., Fei, L., and Wang, X.: An integrated UAV-borne lidar system for 3D habitat mapping in three forest ecosystems across China, Int. J. Remote Sens., 38, 2954–2972, https://doi.org/10.1080/01431161.2017.1285083, 2017.
Hall, R. J., Skakun, R. S., Arsenault, E. J., and Case, B. S.: Modeling forest stand structure attributes using Landsat ETM+ data: Application to mapping of aboveground biomass and stand volume, Forest Ecol. Manag., 225, 378–390, https://doi.org/10.1016/j.foreco.2006.01.014, 2006.
Hu, J. and Szymczak, S.: A review on longitudinal data analysis with random forest, Brief Bioinform., 24, bbad002, https://doi.org/10.1093/bib/bbad002, 2023.
Hu, T., Sun, X., Su, Y., Guan, H., Sun, Q., Kelly, M., and Guo, Q.: Development and Performance Evaluation of a Very Low-Cost UAV-Lidar System for Forestry Applications, Remote Sens., 13, 77, https://doi.org/10.3390/rs13010077, 2021.
Huang, H., Liu, C., Wang, X., Biging, G. S., Chen, Y., Yang, J., and Gong, P.: Mapping vegetation heights in China using slope correction ICESat data, SRTM, MODIS-derived and climate data, ISPRS J Photogramm., 129, 189–199, https://doi.org/10.1016/j.isprsjprs.2017.04.020, 2017.
Huo, L., Lindberg, E., and Holmgren, J.: Towards low vegetation identification: A new method for tree crown segmentation from LiDAR data based on a symmetrical structure detection algorithm (SSD), Remote Sens. Environ., 270, 112857, https://doi.org/10.1016/j.rse.2021.112857, 2022.
Jensen, J. L. R. and Mathews, A. J.: Assessment of Image-Based Point Cloud Products to Generate a Bare Earth Surface and Estimate Canopy Heights in a Woodland Ecosystem, Remote Sens., 8, 50, https://doi.org/10.3390/rs8010050, 2016.
Jucker, T., Hardwick, S. R., Both, S., Elias, D. M. O., Ewers, R. M., Milodowski, D. T., Swinfield, T., and Coomes, D. A.: Canopy structure and topography jointly constrain the microclimate of human-modified tropical landscapes, Glob. Chang Biol., 24, 5243–5258, https://doi.org/10.1111/gcb.14415, 2018.
Jurjević, L., Liang, X., Gašparović, M., and Balenović, I.: Is field-measured tree height as reliable as believed – Part II, A comparison study of tree height estimates from conventional field measurement and low-cost close-range remote sensing in a deciduous forest, ISPRS J. Photogramm., 169, 227–241, https://doi.org/10.1016/j.isprsjprs.2020.09.014, 2020.
Kwong, I. H. Y. and Fung, T.: Tree height mapping and crown delineation using LiDAR, large format aerial photographs, and unmanned aerial vehicle photogrammetry in subtropical urban forest, Int. J. Remote Sens., 41, 5228–5256, https://doi.org/10.1080/01431161.2020.1731002, 2020.
Laar, A. v. and Akça, A. (Eds.): Measurement Of Stands, in: Forest Mensuration, Springer Netherlands, Dordrecht, 95–147, https://doi.org/10.1007/978-1-4020-5991-9_5, 2007.
Lang, N., Jetz, W., Schindler, K., and Wegner, J. D.: A high-resolution canopy height model of the Earth, Nat. Ecol. Evol., 7, 1778–1789, https://doi.org/10.1038/s41559-023-02206-6, 2023.
Lefsky, M. A.: A global forest canopy height map from the Moderate Resolution Imaging Spectroradiometer and the Geoscience Laser Altimeter System, Geophys. Res. Lett., 37, L15401, https://doi.org/10.1029/2010GL043622, 2010.
Lefsky, M. A., Harding, D. J., Keller, M., Cohen, W. B., Carabajal, C. C., Del Bom Espirito-Santo, F., Hunter, M. O., and de Oliveira Jr, R.: Estimates of forest canopy height and aboveground biomass using ICESat, Geophys. Res. Lett., 32, L22S02, https://doi.org/10.1029/2005GL023971, 2005.
Li, C., Chen, Z., Zhou, X., Zhou, M., and Li, Z.: Generalized models for subtropical forest inventory attribute estimations using a rule-based exhaustive combination approach with airborne LiDAR-derived metrics, GIsci. Remote Sens., 60, 2194601, https://doi.org/10.1080/15481603.2023.2194601, 2023.
Li, M., Liu, Q., Feng, Y., and Li, Z.: Analysis of estimation models of plantation stand heights using UAV LiDAR, National Remote Sensing Bulletin, 26, 2665–2678, https://doi.org/10.11834/jrs.20210246, 2022.
Li, W., Guo, Q., Jakubowski, M. K., and Kelly, M.: A new method for segmenting individual trees from the lidar point cloud, Photogramm Eng Remote Sens., 78, 75–84, https://doi.org/10.14358/PERS.78.1.75, 2012.
Li, W., Niu, Z., Shang, R., Qin, Y., Wang, L., and Chen, H.: High-resolution mapping of forest canopy height using machine learning by coupling ICESat-2 LiDAR with Sentinel-1, Sentinel-2 and Landsat-8 data, Int. J. Appl. Earth Obs. Geoinf., 92, 102163, https://doi.org/10.1016/j.jag.2020.102163, 2020.
Liang, X., Kukko, A., Balenović, I., Saarinen, N., Junttila, S., Kankare, V., Holopainen, M., Mokroš, M., Surový, P., Kaartinen, H., Jurjević, L., Honkavaara, E., Näsi, R., Liu, J., Hollaus, M., Tian, J., Yu, X., Pan, J., Cai, S., Virtanen, J. P., Wang, Y., and Hyyppä, J.: Close-Range Remote Sensing of Forests: The state of the art, challenges, and opportunities for systems and data acquisitions, IEEE Geosci. Remote Sens. Mag., 10, 32–71, https://doi.org/10.1109/MGRS.2022.3168135, 2022.
Liu, H., Zhang, Z., and Cao, L.: Estimating forest stand characteristics in a coastal plain forest plantation based on vertical structure profile parameters derived from ALS data, J. Remote Sens., 22, 872–888, 10.11834/jrs.20187465, 2018.
Liu, X., Su, Y., Hu, T., Yang, Q., Liu, B., Deng, Y., Tang, H., Tang, Z., Fang, J., and Guo, Q.: Neural network guided interpolation for mapping canopy height of China's forests by integrating GEDI and ICESat-2 data, Remote Sens. Environ., 269, 112844, https://doi.org/10.1016/j.rse.2021.112844, 2022.
Lorey, T.: Die mittlere bestandeshöhe, J. Allgemeine Forst- und Jagdzeitung, 54, 149–155, 1878.
Lou, M., Zhang, H., Lei, X., Li, C., and Zang, H.: Spatial Autoregressive Models for Stand Top and Stand Mean Height Relationship in Mixed Quercus mongolica Broadleaved Natural Stands of Northeast China, Forests, 7,43, https://doi.org/10.3390/f7020043, 2016.
Lu, D., Mausel, P., Brondıìzio, E., and Moran, E.: Relationships between forest stand parameters and Landsat TM spectral responses in the Brazilian Amazon Basin, Forest Ecol. Manag., 198, 149–167, https://doi.org/10.1016/j.foreco.2004.03.048, 2004.
Ma, Q., Su, Y., Niu, C., Ma, Q., Hu, T., Luo, X., Tai, X., Qiu, T., Zhang, Y., Bales, R. C., Liu, L., Kelly, M., and Guo, Q.: Tree mortality during long-term droughts is lower in structurally complex forest stands, Nat. Commun., 14, 7467, 10.1038/s41467-023-43083-8, 2023.
Masaka, K., Sato, H., Torita, H., Kon, H., and Fukuchi, M.: Thinning effect on height and radial growth of Pinus thunbergii Parlat. trees with special reference to trunk slenderness in a matured coastal forest in Hokkaido, Japan, J. Forest Res., 18, 475–481, https://doi.org/10.1007/s10310-012-0373-y, 2013.
Matasci, G., Hermosilla, T., Wulder, M. A., White, J. C., Coops, N. C., Hobart, G. W., and Zald, H. S. J.: Large-area mapping of Canadian boreal forest cover, height, biomass and other structural attributes using Landsat composites and lidar plots, Remote Sens. Environ., 209, 90–106, https://doi.org/10.1016/j.rse.2017.12.020, 2018.
McGregor, I. R., Helcoski, R., Kunert, N., Tepley, A. J., Gonzalez-Akre, E. B., Herrmann, V., Zailaa, J., Stovall, A. E. L., Bourg, N. A., McShea, W. J., Pederson, N., Sack, L., and Anderson-Teixeira, K. J.: Tree height and leaf drought tolerance traits shape growth responses across droughts in a temperate broadleaf forest, New Phytol., 231, 601–616, https://doi.org/10.1111/nph.16996, 2021.
Mekruksavanich, S., Jantawong, P., Hnoohom, N., and Jitpattanakul, A.: Hyperparameter Tuning in Convolutional Neural Network for Face Touching Activity Recognition using Accelerometer Data, 2022 Research, Invention, and Innovation Congress: Innovative Electricals and Electronics (RI2C), Bangkok, Thailand, 4–5 August 2022, 101–105, https://doi.org/10.1109/RI2C56397.2022.9910262, 2022.
Migliavacca, M., Musavi, T., Mahecha, M. D., Nelson, J. A., Knauer, J., Baldocchi, D. D., Perez-Priego, O., Christiansen, R., Peters, J., Anderson, K., Bahn, M., Black, T. A., Blanken, P. D., Bonal, D., Buchmann, N., Caldararu, S., Carrara, A., Carvalhais, N., Cescatti, A., Chen, J., Cleverly, J., Cremonese, E., Desai, A. R., El-Madany, T. S., Farella, M. M., Fernández-Martínez, M., Filippa, G., Forkel, M., Galvagno, M., Gomarasca, U., Gough, C. M., Göckede, M., Ibrom, A., Ikawa, H., Janssens, I. A., Jung, M., Kattge, J., Keenan, T. F., Knohl, A., Kobayashi, H., Kraemer, G., Law, B. E., Liddell, M. J., Ma, X., Mammarella, I., Martini, D., Macfarlane, C., Matteucci, G., Montagnani, L., Pabon-Moreno, D. E., Panigada, C., Papale, D., Pendall, E., Penuelas, J., Phillips, R. P., Reich, P. B., Rossini, M., Rotenberg, E., Scott, R. L., Stahl, C., Weber, U., Wohlfahrt, G., Wolf, S., Wright, I. J., Yakir, D., Zaehle, S., and Reichstein, M.: The three major axes of terrestrial ecosystem function, Nature, 598, 468–472, https://doi.org/10.1038/s41586-021-03939-9, 2021.
Nakai, T., Sumida, A., Kodama, Y., Hara, T., and Ohta, T.: A comparison between various definitions of forest stand height and aerodynamic canopy height, Agr. Forest Meteorol., 150 1225–1233, 2010.
Næsset, E.: Determination of mean tree height of forest stands using airborne laser scanner data, ISPRS J. Photogramm., 52, 49–56, https://doi.org/10.1016/S0924-2716(97)83000-6, 1997.
Næsset, E. and Økland, T.: Estimating tree height and tree crown properties using airborne scanning laser in a boreal nature reserve, Remote Sens. Environ., 79, 105–115, https://doi.org/10.1016/S0034-4257(01)00243-7, 2002.
Ni, X., Zhou, Y., Cao, C., Wang, X., Shi, Y., Park, T., Choi, S., and Myneni, R. B.: Mapping Forest Canopy Height over Continental China Using Multi-Source Remote Sensing Data, Remote Sens., 7, 8436–8452, https://doi.org/10.3390/rs70708436, 2015.
Ørka, H. O., Næsset, E., and Bollandsås, O. M.: Classifying species of individual trees by intensity and structure features derived from airborne laser scanner data, Remote Sens. Environ., 113, 1163–1174, https://doi.org/10.1016/j.rse.2009.02.002, 2009.
Pang, Y., Zhao, F., and Li, Z.: Forest height inversion using airborne Lidar technology, J. Remote Sens., 12, 158, https://doi.org/10.11834/jrs.20080120, 2008.
Potapov, P., Li, X., Hernandez-Serna, A., Tyukavina, A., Hansen, M. C., Kommareddy, A., Pickens, A., Turubanova, S., Tang, H., Silva, C. E., Armston, J., Dubayah, R., Blair, J. B., and Hofton, M.: Mapping global forest canopy height through integration of GEDI and Landsat data, Remote Sens. Environ., 253, 112165, https://doi.org/10.1016/j.rse.2020.112165, 2021.
Qin, H., Zhou, W., Yao, Y., and Wang, W.: Individual tree segmentation and tree species classification in subtropical broadleaf forests using UAV-based LiDAR, hyperspectral, and ultrahigh-resolution RGB data, Remote Sens. Environ., 280, 113143, https://doi.org/10.1016/j.rse.2022.113143, 2022.
Saatchi, S. S., Harris, N. L., Brown, S., Lefsky, M., Mitchard, E. T. A., Salas, W., Zutta, B. R., Buermann, W., Lewis, S. L., Hagen, S., Petrova, S., White, L., Silman, M., and Morel, A.: Benchmark map of forest carbon stocks in tropical regions across three continents, P. Natl. Acad. Sci. USA, 108, 9899–9904, https://doi.org/10.1073/pnas.1019576108, 2011.
Simard, M., Pinto, N., Fisher, J. B., and Baccini, A.: Mapping forest canopy height globally with spaceborne lidar, J. Geophys. Res.-Biogeo., 116, G04021, https://doi.org/10.1029/2011JG001708, 2011.
Su, Y., Ma, Q., and Guo, Q.: Fine-resolution forest tree height estimation across the Sierra Nevada through the integration of spaceborne LiDAR, airborne LiDAR, and optical imagery, Int. J. Digit Earth, 10, 307–323, https://doi.org/10.1080/17538947.2016.1227380, 2017.
Su, Y., Guo, Q., Ma, Q., and Li, W.: SRTM DEM Correction in Vegetated Mountain Areas through the Integration of Spaceborne LiDAR, Airborne LiDAR, and Optical Imagery, Remote Sens., 7, 11202–11225, https://doi.org/10.3390/rs70911202, 2015.
Swayze, N. C., Tinkham, W. T., Vogeler, J. C., and Hudak, A. T.: Influence of flight parameters on UAS-based monitoring of tree height, diameter, and density, Remote Sens. Environ., 263, 112540, https://doi.org/10.1016/j.rse.2021.112540, 2021.
Tang, J., Luyssaert, S., Richardson, A. D., Kutsch, W., and Janssens, I. A.: Steeper declines in forest photosynthesis than respiration explain age-driven decreases in forest growth, P. Natl. Acad. Sci. USA, 111, 8856–8860, https://doi.org/10.1073/pnas.1320761111, 2014.
Tao, S., Wu, F., Guo, Q., Wang, Y., Li, W., Xue, B., Hu, X., Li, P., Tian, D., Li, C., Yao, H., Li, Y., Xu, G., and Fang, J.: Segmenting tree crowns from terrestrial and mobile LiDAR data by exploring ecological theories, ISPRS J Photogramm., 110, 66–76, https://doi.org/10.1016/j.isprsjprs.2015.10.007, 2015.
Travers-Smith, H., Coops, N. C., Mulverhill, C., Wulder, M. A., Ignace, D., and Lantz, T. C.: Mapping vegetation height and identifying the northern forest limit across Canada using ICESat-2, Landsat time series and topographic data, Remote Sens. Environ., 305, 114097, https://doi.org/10.1016/j.rse.2024.114097, 2024.
Vaglio Laurin, G., Ding, J., Disney, M., Bartholomeus, H., Herold, M., Papale, D., and Valentini, R.: Tree height in tropical forest as measured by different ground, proximal, and remote sensing instruments, and impacts on above ground biomass estimates, Int. J. Appl. Earth Obs., 82, 101899, https://doi.org/10.1016/j.jag.2019.101899, 2019.
Vanclay, J. K.: Assessing site productivity in tropical moist forests: a review, Forest Ecol. Manag., 54, 257–287, https://doi.org/10.1016/0378-1127(92)90017-4, 1992.
Vatandaslar, C., Narin, O. G., and Abdikan, S.: Retrieval of forest height information using spaceborne LiDAR data: a comparison of GEDI and ICESat-2 missions for Crimean pine (Pinus nigra) stands, Trees, 37, 717–731, https://doi.org/10.1007/s00468-022-02378-x, 2023.
Wang, M., Kane, M. B., and Zhao, D.: Correlation-Regression Analysis for Understanding Dominant Height Projection Accuracy, Forest Sci., 69, e1–e10, https://doi.org/10.5849/fs-2016-092, 2023.
Wang, Y., Pyörälä, J., Liang, X., Lehtomäki, M., Kukko, A., Yu, X., Kaartinen, H., and Hyyppä, J.: In situ biomass estimation at tree and plot levels: What did data record and what did algorithms derive from terrestrial and aerial point clouds in boreal forest, Remote Sens. Environ., 232, 111309, https://doi.org/10.1016/j.rse.2019.111309, 2019a.
Wang, Y., Lehtomäki, M., Liang, X., Pyörälä, J., Kukko, A., Jaakkola, A., Liu, J., Feng, Z., Chen, R., and Hyyppä, J.: Is field-measured tree height as reliable as believed – A comparison study of tree height estimates from field measurement, airborne laser scanning and terrestrial laser scanning in a boreal forest, ISPRS J. Photogramm., 147, 132–145, https://doi.org/10.1016/j.isprsjprs.2018.11.008, 2019b.
Woods, M., Pitt, D., Penner, M., Lim, K., Nesbitt, D., Etheridge, D., and Treitz, P.: Operational implementation of a LiDAR inventory in Boreal Ontario, Forest. Chron., 87, 512–528, https://doi.org/10.5558/tfc2011-050, 2011.
Wu, Z. and Shi, F.: Mapping Forest Canopy Height at Large Scales Using ICESat-2 and Landsat: An Ecological Zoning Random Forest Approach, IEEE T. Geosci. Remote, 61, 1–16, https://doi.org/10.1109/TGRS.2022.3231926, 2023.
Xu, H., Yue, C., Zhang, Y., Liu, D., and Piao, S.: Forestation at the right time with the right species can generate persistent carbon benefits in China, P. Natl. Acad. Sci. USA, 120, e2304988120, https://doi.org/10.1073/pnas.2304988120, 2023.
Xu, Y., Li, C., Sun, Z., Jiang, L., and Fang, J.: Tree height explains stand volume of closed-canopy stands: Evidence from forest inventory data of China, Forest Ecol. Manag., 438, 51–56, https://doi.org/10.1016/j.foreco.2019.01.054, 2019.
Yang, J., Kang, Z., Cheng, S., Yang, Z., and Akwensi, P. H.: An Individual Tree Segmentation Method Based on Watershed Algorithm and Three-Dimensional Spatial Distribution Analysis From Airborne LiDAR Point Clouds, IEEE J. Sel. Top. Appl. Earth Obs., 13, 1055–1067, https://doi.org/10.1109/JSTARS.2020.2979369, 2020.
Yang, Q., Niu, C., Liu, X., Feng, Y., Ma, Q., Wang, X., Tang, H., and Guo, Q.: Mapping high-resolution forest aboveground biomass of China using multisource remote sensing data, GIsci. Remote Sens., 60, 2203303, https://doi.org/10.1080/15481603.2023.2203303, 2023.
Yang, Z., Su, Y., Li, W., Cheng, K., Guan, H., Ren, Y., Hu, T., Xu, G., and Guo, Q.: Segmenting Individual Trees From Terrestrial LiDAR Data Using Tree Branch Directivity, IEEE J. Sel. Top. Appl., 17, 956–969, https://doi.org/10.1109/JSTARS.2023.3334014, 2024.
Yao, Y., Piao, S., and Wang, T.: Future biomass carbon sequestration capacity of Chinese forests, Sci. Bull., 63, 1108–1117, https://doi.org/10.1016/j.scib.2018.07.015, 2018.
Yin, D., Wang, L., Lu, Y., and Shi, C.: Mangrove tree height growth monitoring from multi-temporal UAV-LiDAR, Remote Sens. Environ., 303, 114002, https://doi.org/10.1016/j.rse.2024.114002, 2024.
Yun, T., Jiang, K., Li, G., Eichhorn, M. P., Fan, J., Liu, F., Chen, B., An, F., and Cao, L.: Individual tree crown segmentation from airborne LiDAR data using a novel Gaussian filter and energy function minimization-based approach, Remote Sens. Environ., 256, 112307, https://doi.org/10.1016/j.rse.2021.112307, 2021.
Zemp, D. C., Guerrero-Ramirez, N., Brambach, F., Darras, K., Grass, I., Potapov, A., Röll, A., Arimond, I., Ballauff, J., Behling, H., Berkelmann, D., Biagioni, S., Buchori, D., Craven, D., Daniel, R., Gailing, O., Ellsäßer, F., Fardiansah, R., Hennings, N., Irawan, B., Khokthong, W., Krashevska, V., Krause, A., Kückes, J., Li, K., Lorenz, H., Maraun, M., Merk, M. S., Moura, C. C. M., Mulyani, Y. A., Paterno, G. B., Pebrianti, H. D., Polle, A., Prameswari, D. A., Sachsenmaier, L., Scheu, S., Schneider, D., Setiajiati, F., Setyaningsih, C. A., Sundawati, L., Tscharntke, T., Wollni, M., Hölscher, D., and Kreft, H.: Tree islands enhance biodiversity and functioning in oil palm landscapes, Nature, 618, 316–321, https://doi.org/10.1038/s41586-023-06086-5, 2023.
Zhang, G., Ganguly, S., Nemani, R. R., White, M. A., Milesi, C., Hashimoto, H., Wang, W., Saatchi, S., Yu, Y., and Myneni, R. B.: Estimation of forest aboveground biomass in California using canopy height and leaf area index estimated from satellite data, Remote Sens. Environ., 151, 44–56, https://doi.org/10.1016/j.rse.2014.01.025, 2014.
Zhao, X., Su, Y., Hu, T., Cao, M., Liu, X., Yang, Q., Guan, H., Liu, L., and Guo, Q.: Analysis of UAV lidar information loss and its influence on the estimation accuracy of structural and functional traits in a meadow steppe, Ecol. Indic., 135, 108515, https://doi.org/10.1016/j.ecolind.2021.108515, 2022.


