the Creative Commons Attribution 4.0 License.
the Creative Commons Attribution 4.0 License.
CREST: a Climate Data Record of Stratospheric Aerosols
Viktoria F. Sofieva
Alexei Rozanov
Monika Szelag
John P. Burrows
Christian Retscher
Robert Damadeo
Doug Degenstein
Landon A. Rieger
Adam Bourassa
Climate-related studies need information about the distribution of stratospheric aerosols, which influence the energy balance of the Earth's atmosphere. In this work, we present a merged dataset of vertically resolved stratospheric aerosol extinction coefficients, which is derived using data from six limb and occultation satellite instruments: SAGE (Stratospheric Aerosol and Gas Experiment) II on ERBS (Earth Radiation Budget Satellite), GOMOS (Global Ozone Monitoring by Occultation of Stars) and SCIAMACHY (Scanning Imaging Spectrometer for Atmospheric Chartography) on Envisat, OSIRIS (Optical Spectrograph and InfraRed Imaging System) on Odin, OMPS (Ozone Monitor Profiling Suite Limb Profiler) on Suomi NPP, and SAGE III on the ISS (International Space Station).
The merging of aerosol profiles is performed via the transformation of the aerosol datasets from individual satellite instruments to the same wavelength (750 nm) and their de-biasing and homogenization by adjusting the seasonal cycles. After such homogenization, the data from individual satellite instruments are in good agreement. The merged aerosol extinction coefficient is computed as the median of the adjusted data from the individual instruments.
The merged time series of vertically resolved monthly mean aerosol extinction coefficients at 750 nm is provided in 10° latitudinal bins from 90° S to 90° N, in the altitude range from 8.5 to 39.5 km. The time series of the stratospheric aerosol optical depth (SAOD) is created via the integration of aerosol extinction profiles from the tropopause to 39.5 km; it is also provided as monthly mean data in 10° latitudinal bins. The created aerosol climate record covers the period from October 1984 until December 2023, and it is intended to be extended in the future. The merged CREST aerosol dataset (v2) is available at https://doi.org/10.57707/fmib2share.dfe14351fd8548bcaca3c2956b17f665 (Sofieva et al., 2024a). It can be used in various climate-related studies.
- Article
(5118 KB) - Full-text XML
-
Supplement
(993 KB) - BibTeX
- EndNote
Stratospheric aerosols play an important role in the Earth system and affect the climate. Via the scattering of solar radiation back to space and by heating the stratosphere through the absorption of thermal infrared radiation upwelling from the troposphere, stratospheric aerosols impact the radiative forcing and, thus, the energy balance of Earth's atmosphere. By providing a surface for heterogeneous reactions, which release halogens, stratospheric aerosols contribute to the catalytic depletion of ozone. Because of a strong coupling between stratospheric aerosols, the stratospheric ozone amount, and the thermal balance and dynamics of the atmosphere, it is essential to consider realistic aerosol information in modeling studies and interpretation of measurements related to the stratosphere. The information about stratospheric aerosols and their influence on climate is also of value for investigations and analyses relevant for geoengineering (e.g., Crutzen, 2006).
One of the characteristics widely used to describe the amount of stratospheric aerosol is its extinction coefficient1. As discussed, for example, by von Savigny et al. (2015), at a first approximation, the aerosol extinction coefficient can be used to estimate the radiative forcing and, thus, quantify the impact of aerosols on climate change. There are several datasets of the stratospheric aerosol extinction coefficient retrieved from satellite measurements in limb-viewing geometry (e.g., Bourassa et al., 2012; Damadeo et al., 2013; von Savigny et al., 2015; Vanhellemont et al., 2010; Loughman et al., 2018). The first joint analysis of aerosol records from multiple instruments was done by Vernier et al. (2011), but their study did not aim to create a long-term merged dataset. A merged time series of the aerosol extinction coefficient using SAGE (Stratospheric Aerosol and Gas Experiment) II and OSIRIS (Optical Spectrograph and InfraRed Imaging System) aerosol data was presented by Rieger et al. (2015). The merging approach was based on a simple scaling of the extinctions at different wavelengths and assumed a prescribed wavelength dependence characterized by a fixed value of the Ångström exponent. This assumption represents a drawback of the method, as the Ångström exponent might vary significantly, even in the absence of very strong volcanic eruptions (e.g., Malinina et al., 2019). The GloSSAC (Global Space-based Stratospheric Aerosol Climatology) presented by Thomason et al. (2018) is an extension of the climatology described by Rieger et al. (2015): it includes the earlier observations from 1979 to 1984, extends the coverage of the dataset during the SAGE II measurement period, and adds CALIPSO (Cloud-Aerosol Lidar and Infrared Pathfinder Satellite Observation) observations after 2006. However, this climatology uses the same conversion of the OSIRIS data to SAGE II wavelengths as described by Rieger et al. (2015). The updated version of GloSSAC (Kovilakam et al., 2020) includes the latest versions of the individual aerosol datasets and added SAGE III aerosol extinction on the International Space Station (ISS), which allows for an improved conversion of aerosol extinction to other wavelengths to be made.
This paper describes a merged long-term dataset of aerosol extinction coefficient profiles at 750 nm derived from data by solar/stellar occultation and limb-scatter instruments: SAGE II on ERBS (Earth Radiation Budget Satellite), GOMOS (Global Ozone Monitoring by Occultation of Stars) and SCIAMACHY (Scanning Imaging Spectrometer for Atmospheric Chartography) on Envisat, OSIRIS on Odin, OMPS-LP (Ozone Monitor Profiling Suite Limb Profiler) on Suomi NPP, and SAGE III on the ISS. This dataset is referred to as “Climate Data Record of Stratospheric Aerosols” (CREST) hereafter. Our objective is to increase the reliability of the dataset by including the extinction measurements from multiple instruments measuring similar atmospheric quantities in the limb-viewing geometry in the post-SAGE II period.
The paper is organized as follows: Sect. 2 is dedicated to short descriptions of aerosol datasets from individual satellite instruments; Sect. 3 presents the merging algorithm; the correction and gap filling of SAGE II data during the high volcanic load after the Pinatubo eruption are discussed in Sect. 4; the creation of the stratospheric optical depth is discussed in Sect. 5; illustrations of the merged dataset and its comparison with GloSSAC v2.21 are presented in Sect. 6; and a summary and discussion conclude the paper in Sect. 8.
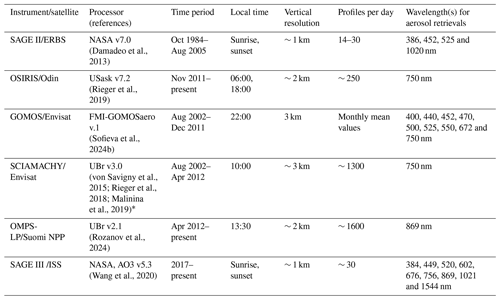
To create the CREST merged dataset, we used aerosol profiles from several limb and occultation instruments. The information about individual datasets is summarized in Table 1. Below we also present the descriptions of individual aerosol datasets.
2.1 OSIRIS
OSIRIS, aboard the Odin satellite (Llewellyn et al., 2004, p.200), has been performing limb-scatter measurements of the atmosphere from 2001 to present. In our work, we use the cloud-cleared aerosol extinction profiles from the new v7.2 retrievals (Rieger et al., 2019). The v7.2 processor uses the 470, 675, 750 and 805 nm wavelengths to retrieve aerosol extinction at 750 nm. The retrievals have reduced measurement geometry biases and improve extinction retrieval in the upper troposphere and lower stratosphere, compared with the previous v5.10 retrieval algorithm. The OSIRIS v7.2 aerosol extinction profiles are provided at 750 nm in the vertical range from ∼ 6.5 up to 35 km with a vertical resolution of ∼ 2 km. According to the recommendations of the OSIRIS team, post-2022 data are not used in the merged dataset.
2.2 SAGE II
SAGE II was a solar occultation instrument that operated aboard the ERBS satellite from 1984 to 2005 (https://sage.nasa.gov/missions/about-sage-ii/, last access: 25 October 2024, Russell and McCormick, 1989). SAGE II had seven channels at ultraviolet, visible and infrared wavelengths. The aerosol retrieval algorithm provides information about the size distribution, composition and concentration of aerosols (Thomason et al., 2008). In our analyses, we used v7 aerosol data. A detailed description of the aerosol retrievals can be found in Damadeo et al. (2013). SAGE II aerosol extinction profiles are provided at 386, 452, 525 and 1020 nm in the stratosphere and in the upper troposphere with a vertical resolution of ∼ 1.0 km.
We applied the following cloud filtering of individual SAGE II profiles. The cloud altitude is defined at the location where aerosol extinction at 1020 nm β1020 nm ≥ 2.5 × 10⁻³ km−1 and the ratio of extinctions ≤ 1.75. Each profile was examined for the presence of clouds; if clouds were found, all data at and below 1 km above that altitude were excluded. These criteria are slight modifications of various previous simplistic cloud-filtering techniques applied to SAGE data (e.g., Damadeo et al., 2024; Davis et al., 2021; Wang et al., 2002).
2.3 SAGE III/ISS
SAGE III is a solar occultation instrument currently operating on the ISS; it was installed in 2017 (https://sage.nasa.gov/missions/about-sage-iii-on-iss/, last access: 25 October 2024). The SAGE III detectors cover the ultraviolet to the near-infrared parts of the spectrum, and they allow for the characterization of different types of aerosols in the atmosphere. The retrieval methodology is similar to that of SAGE II, albeit with more spectral channels to better constrain the shape of the aerosol extinction spectrum (Wang et al., 2020). In our analyses, we used v5.3 aerosol data.
SAGE III/ISS aerosol extinction profiles are provided at nine wavelengths (384, 449, 520, 602, 676, 756, 869, 1021 and 1544 nm) in the altitude range from cloud top to ∼ 45 km with a vertical resolution of ∼ 0.75 km. The SAGE III/ISS data are filtered for the presence of clouds in the same way as SAGE II data.
2.4 SCIAMACHY
The SCIAMACHY instrument was part of the payload of the ESA Envisat satellite (Bovensmann et al., 1999; Burrows et al., 1995) and was launched into a Sun-synchronous orbit on the 28 February 2002, with an Equator crossing time of 10:00 LT (local time) in the descending node. It made measurements, including those during its commissioning phase, from March 2002 to April 2012; Envisat failed in early-April 2012, ending the mission. During each orbit, measurements in the following three observation modes were made: nadir, limb and solar/lunar occultation. Of relevance to this study are the measurements made in the limb-viewing geometry, which achieve global coverage in 6 d at the Equator. These are used to retrieve aerosol extinction profiles (Malinina et al., 2019; Rieger et al., 2018; von Savigny et al., 2015). We note that, in addition, solar occultation measurements were also made (see Noël et al., 2020) close to the terminator in the Northern Hemisphere, but they have limited latitude coverage.
In the limb measurement mode, the SCIAMACHY entrance optics, which include two scan mirrors and a telescope, collect the solar radiance upwelling from the atmosphere. The radiance comprises that scattered towards SCIAMACHY, i.e., (a) radiance that passes through the atmosphere en route to the surface and (b) radiance that is scattered back by the surface or clouds and then scattered by the atmosphere. In the standard limb scan mode, as opposed to an alternative optimized for measurements in the mesosphere and lower stratosphere, the SCIAMACHY optical scanner unit registers vertical profiles of the scattered radiance from a tangent point, close to or just below the surface, to a tangent height of ∼ 100 km.
The vertical scanning was done with a sampling of about 3.3 km. The instantaneous field of view of the instrument was about 2.6 km. At each tangent height, a horizontal scan, typically with four measurements and a total swath of 960 km, was performed. The spectral coverage of SCIAMACHY was 214–2386 nm, with a spectral resolution varying from 0.2 to 1.5 nm. In this study, Level 1 data (Version 8) provided by ESA are used, along with the utilization of calibration flags 1, 2, 4, 5 and 7. These flags address the amount of leakage current, the pixel-to-pixel gain, stray-light correction, wavelength calibration and radiometric calibration, respectively.
The aerosol extinction coefficients used in this study are from the University of Bremen processor V3.0, which is a further development of the V1.4 processor described by Rieger et al. (2018). Similar to the V1.4 aerosol extinction product, the retrieval is performed at 750 nm. The retrieval is done iteratively using the Levenberg–Marquardt approach. The regularization is applied to the relative differences with respect to the prior profile with a priori standard deviation set to 50. The main differences between V3.0 and V1.4 include the use of Sun-normalized radiance instead of normalization to a limb measurement at an upper tangent height and the utilization of an effective surface albedo retrieved from co-located nadir measurements. The latter approach is similar to that used by Pohl et al. (2024); however, the effective surface albedo is based solely on the co-located nadir observations and is no longer changed when retrieving the aerosol extinction profile. In addition, the vertical range of the retrieval is extended to 9–38 km, in comparison with 12–35 km in V1.4. The validation results for the V3.0 extinction retrieval show that the agreement with SAGE II data is similar to that found with V1.4 data products. However, most of the outliers identified in the comparison of V1.4 extinction data with independent measurements are no longer seen in the comparisons for the V3.0 product.
2.5 GOMOS
GOMOS is a stellar occultation instrument that was operated aboard the Envisat satellite in 2002–2012 (Bertaux et al., 2010; Kyrölä et al., 2004). GOMOS measured stellar light in the occultation geometry from above the atmosphere until the star was lost from the field of view, typically at altitudes of 10–15 km. In our analyses, we use the aerosol data retrieved with the FMI-GOMOSaero v1.0 processor (Sofieva et al., 2024b), which uses monthly and zonally averaged nighttime transmittance spectra as a basis for aerosol retrievals. The inversion algorithm uses the same strategy as GOMOS retrievals of trace gases: the spectral inversion followed by the vertical inversion (Kyrölä et al., 2010). The spectral inversion relies on the removal of the contribution from ozone, NO2, NO3 and Rayleigh scattering from the optical depth spectra, for each ray perigee altitude. The FMI-GOMOSaero dataset v.1.0 provides aerosol extinction profiles in the 10–40 km altitude range at wavelengths of 400, 440, 452, 470, 500, 525, 550, 672 and 750 nm with a vertical resolution of 3 km.
2.6 OMPS-LP
OMPS-LP is a part of the OMPS instrument suite that has been operating aboard the NOAA/NASA Suomi NPP satellite since the end of 2011 (Flynn et al., 2014). The field of view of the OMPS-LP instrument is pointed tangentially to the Earth's surface (limb-viewing geometry) and collects spectral radiance scattered by the Earth's atmosphere and reflected by the underlying surface using a two-dimensional charged-coupled device (CCD). The atmosphere is observed in the tangent height range from 0 to 100 km with a vertical sampling of 1 km and a vertical field of view for each pixel of about 1.5 km. The spectral coverage of the OMPS-LP instrument is 280–1000 nm, with a spectral resolution increasing from 1 nm in the UV region to about 30 nm in the near-IR. In this study, V2.6 Level 1 data provided by NASA are used. Only measurements from the central slit are considered.
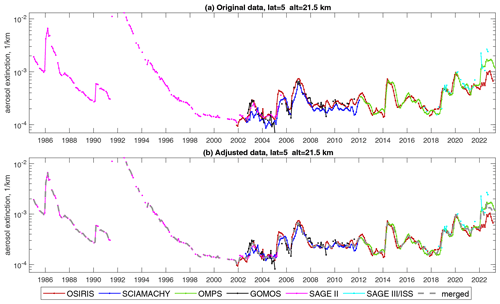
Figure 1Aerosol extinction coefficient (km−1) at 21.5 km in the 0–10° N latitude zone. Colored lines correspond to aerosol records from individual instruments for the (a) original data and (b) adjusted data. The merged aerosol extinction coefficient is shown by the gray line in panel (b).
The aerosol extinction coefficients used in this study are from the University of Bremen V2.1 product, which is described in detail in Rozanov et al. (2024). Briefly, the aerosol extinction coefficients are retrieved at a wavelength of 869 nm using the Sun-normalized radiance in the tangent height range from 8.5 to 48.5 km. The retrieval is iterative and uses the Levenberg–Marquardt approach with Tikhonov regularization (zeroth-order term and first-order derivative). At each iteration, the vertical profile of the aerosol extinction coefficient and the effective surface albedo are estimated simultaneously using all measurements in the selected tangent height range. The regularization is done with respect to the solution at the previous iteration.
The datasets from individual satellite instruments – GOMOS, OMPS-LP, OSIRIS, SAGE II, SAGE III/ISS and SCIAMACHY – were collected and gridded as monthly zonal means with a 10° step in the latitude. The OSIRIS dataset was selected as the reference because it has the longest data record. As the OSIRIS dataset is available only at 750 nm, this wavelength was chosen as the reference wavelength. The merging procedure consists of (i) the conversion of data to 750 nm, if they are retrieved at another wavelength; (ii) data adjustment; and (iii) merging of the adjusted aerosol profiles from different instruments. Below, we describe the details of each processing step.
3.1 Conversion to 750 nm
The extinction data, retrieved from the observations of the other instruments, were converted to 750 nm, if not already retrieved at this wavelength. For the conversion of SAGE II data, we used aerosol extinction at 525 and 1020 nm. The conversion is based on the Ångström formula:
Here, βλ and are aerosol extinction coefficients at wavelengths λ and λ0, respectively, and α is the Ångström exponent, with a correction derived from SAGE III/ISS data (for details, see Damadeo et al., 2024):
In Eq. (2), the Ångström exponent α is determined using the SAGE II aerosol extinction data at 525 and 1020 nm. This correction accounts for the bias introduced when using the Ångström exponent for interpolation, as the aerosol extinction spectrum does not quite follow the Ångström formula.
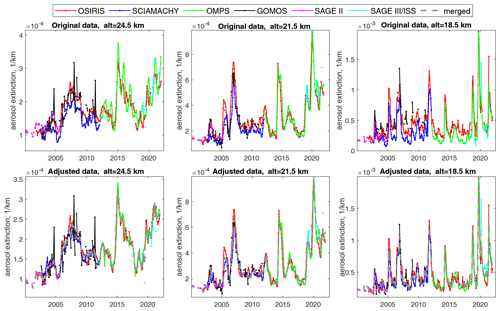
Figure 2The same as Fig. 1 but for several altitude levels and with a focus on the years 2000–2021.
GOMOS 675 nm aerosol data were converted to 750 nm using the Ångström exponent, which was determined from the GOMOS 500 and 675 nm aerosol extinction coefficients. As no measurement data providing the Ångström exponent for the entire operation period of OMPS-LP are available, the Ångström exponent used to convert OMPS-LP data was obtained by Mie calculations assuming a fixed particle size distribution, PSD (rmed = 0.08 µm, σ = 1.6). When scaling from a wavelength of 869 to 750 nm, this corresponds to a constant factor of 1.477. The fixed PSD assumed here is the same as that used in the OMPS-LP retrieval procedure and is based on an arbitrarily selected balloon-borne in situ measurements presented by Deshler (2008).
3.2 Data adjustment
Gridded time series from individual instruments were compared, and methods to remove biases between the time series were analyzed. The datasets have biases with respect to each other, and the seasonal cycles also differ at some locations and altitude levels (top panels of Figs. 1, 2 and S1–S4).
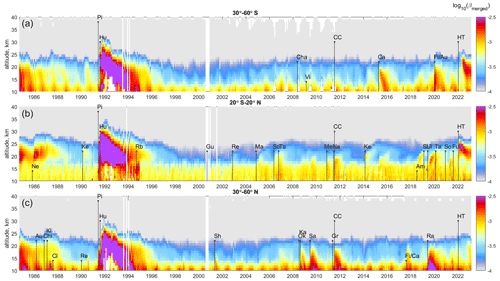
Figure 3The CREST merged aerosol extinction profiles log 10(βmerged[km−1]) at (a) 30–60° S, (b) 20° S–20° N and (c) 30–60° N. The volcanic eruptions are indicated by black bars, with the length of the bar being proportional to the volcanic explosivity index (VEI) value. Volcanos with VEI ≥ 5 are shown for all latitude zones, whereas those with VEI > 3 are shown for the corresponding latitude zones.
SCIAMACHY, OMPS-LP and GOMOS are adjusted to the OSIRIS time series as follows. For each instrument i, latitude zone and altitude level, the seasonal cycle Si(m) (where m is a month) is estimated using volcano-free periods (the years 2001–2005, 2007, 2010, 2013–2016 and 2020). Then, the seasonal cycles are fitted to the OSIRIS seasonal cycle using a robust linear regression:
In Eq. (3), a and b are the fitted coefficients and ϵ is noise. This procedure ensures that the scaling is performed properly, even in cases where the full year is not covered by OSIRIS data. The original seasonal cycles of SCIAMACHY, OMPS-LP and GOMOS are replaced with fitted seasonal cycles:
where Si is the value for the seasonal cycle in the corresponding month.
For SAGE II and SAGE III/ISS, due to limited data sampling and a relatively short overlapping period with OSIRIS, the seasonal cycle correction is not performed. For these datasets, the offset is computed as the median difference between OSIRIS and occultation aerosol data in their overlapping periods (the period is 2017–2021 for SAGE III and 2001–2005 for SAGE II) and added to data. The adjustment procedure works well, even in complicated cases.
3.3 The merging procedure and uncertainty estimates
The merged aerosol extinction coefficient time series is calculated as the median of the adjusted data from the individual instruments. Using the median has the advantage of minimizing the influence of outliers that might be present in the individual datasets.
Illustrations of original, adjusted and merged datasets in several latitude zones are presented in Figs. 1 and 2, as well as in Figs. S1–S4 in the Supplement. These figures show that the adjustment procedure makes individual datasets much closer to one another in the periods with overlapping measurements.
The uncertainties of the merged aerosol profiles are estimated in a similar manner to the approach used by Sofieva et al. (2017). For individual datasets, the uncertainty of the monthly mean values is estimated as the standard error of the mean, i.e., , where s2 is the sample variance and N is the number of measurements. The uncertainties of the data adjustments are approximately evaluated as the uncertainty of bias computation and are added quadratically to all individual monthly mean records except that of OSIRIS. The uncertainty of the merged aerosol extinction (which corresponds to the median value βmerged) is estimated as follows (Sofieva et al., 2017):
where is the uncertainty of the extinction corresponding to the median value.
Figure 3 shows the aerosol extinction profiles from the merged CREST dataset in three latitude zones: 30–60° S (Fig. 3a), 20° S–20° N (Fig. 3b) and 30–60° N (Fig. 3c). The main volcanic eruptions and strong wildfires are indicated in the figure by bars of length proportional to the volcanic explosivity index (VEI). As observed in Fig. 3, enhancements of aerosol extinction correspond to periods of enhanced volcanic activity or strong wildfires, which are listed in Table 2.
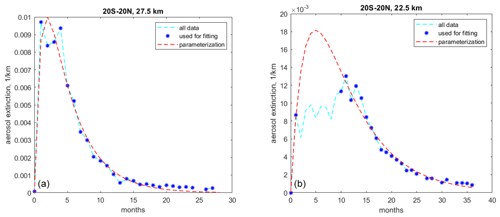
Figure 4Example of the SAGE II aerosol fitting with Eq. (6) during the Pinatubo period at 27.5 km (a) and 22.5 km (b). The data are for latitudes 20° S–20° N. For 27.5 km, all data were used for the fit. For 22.5 km, the data from 3 to 10 months after the Pinatubo eruption were excluded.
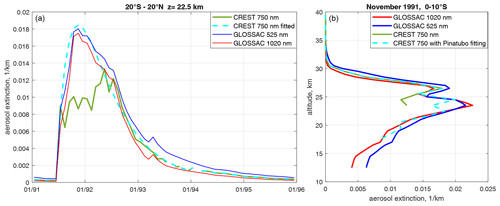
Figure 5(a) Time series of aerosol extinction at 22.5 km as reported by GloSSAC (at 525 and 1020 nm) and CREST (original data, solid green line; fitted by Eq. 5, dashed cyan line). (b) GloSSAC, CREST original and Pinatubo-corrected aerosol profiles for the 0–10° S latitude zone in November 1991.
Several publications have reported that the SAGE II aerosol load is underestimated or missing in the lower stratosphere during the Pinatubo volcanic eruption (Kovilakam et al., 2020; Sukhodolov et al., 2018). The reason for this is “saturation” in SAGE II data, i.e., there are no values larger than ∼ 0.012 km−1. The GloSSAC dataset (Kovilakam et al., 2020; Thomason et al., 2018) uses experimentally scaled CLAES (Cryogenic Limb Array Etalon Spectrometer) data at these times and locations. Instead, we applied the following approach in the merged CREST dataset. In the period affected by the Pinatubo volcanic eruption, i.e., beginning in June 1991 and lasting 3 years, the aerosol extinction β(t) as a function of time for each altitude level is fitted by the following function:
where a, b, τ1 and τ2 are parameters to fit. Equation (6) gives a simple parameterization of a fast increase and gradual decrease; it is not linked with a dynamical model. The coefficient a is estimated as the mean over the period from January to May 1991, while other parameters are obtained via nonlinear least-squares fitting by the Levenberg–Marquardt algorithm. As illustrated in Fig. 4a for 27.5 km, the aerosol peak associated with the Pinatubo eruption follows Eq. (6) well, for the cases in which SAGE II data are not saturated. For lower altitudes (from the tropopause to the level 8 km above the tropopause), the data from 3 to 12 months after the Pinatubo eruption are not used in the fit, as illustrated in Fig. 4b. The fitted aerosol peak during the strong Pinatubo load exceeds the maximal aerosol extinction value of ∼ 0.012 km−1 reported by SAGE II. The period for which data were omitted, from 3 to 12 months after the Pinatubo eruption, was selected after visual inspection, and it corresponds to a typical saturation period of nearly constant values. The fitting is performed in the stratosphere only, where there is a sufficient number of data points.
We performed such Pinatubo-filtering of the data from the tropics (20° S–20° N) and from other latitude zones (20–40°, 40–60° and 60–90°, both north and south) and found that saturation primarily affects the data in the tropics. Therefore, for latitude zones from 20° S to 20° N, the saturated aerosol data (i.e., for altitudes below 26 km, where the fitted aerosol value exceeds 0.011 km−1) are replaced with the fitted values. Missing data during Pinatubo eruption are also replaced with the fit.
The resulting Pinatubo-corrected aerosol profiles agree with GloSSAC within 5 %–10 %, as illustrated in Fig. 5. Considering the uncertainty of gap-filling approaches during Pinatubo in GloSSAC and CREST, such an agreement can be considered very good. Unfortunately, there are no available in situ measurements of aerosol extinction profiles during this period to validate CREST and GloSSAC profiles. However, the similarity between the GloSSAC and CREST aerosol profiles during the Pinatubo event increases confidence in both gap-filling approaches.
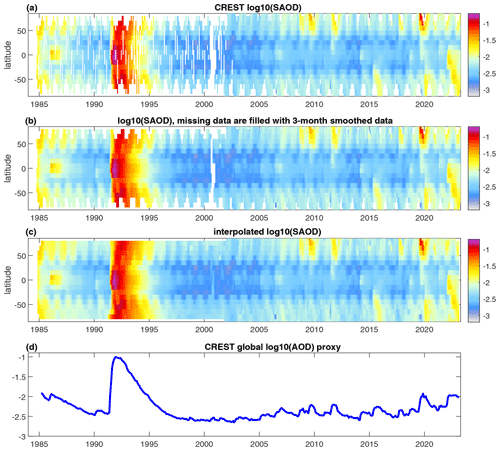
Figure 6Illustration of creating the CREST SAOD and aerosol proxy. Panel (a) shows SAOD as obtained from the integration of aerosol profiles. Panel (b) is the same as panel (a), but missing data are filled in with the 3-month mean for each latitude zone. Panel (c) presents the gap-free SAOD obtained from panel (b) by interpolation using Delaunay triangulation. Panel (d) shows the global mean SAOD (aerosol proxy). All SAOD values are plotted using logarithmic (log 10) scales.
The stratospheric aerosol optical depth (SAOD) has been computed via integration of aerosol extinction profiles from the tropopause to ∼ 40 km. The tropopause is computed using ERA5 data according to the World Meteorological Organization definition of the thermal tropopause. The resulting SAOD record is shown in Fig. 6a. The uncertainty of the stratospheric aerosol optical depth is evaluated using error propagation.
To use SAOD in climate simulations and in trend analyses, a gap-free dataset is needed. Therefore, we first fill small gaps by smoothing the data in each latitude zone via application of a 3-month running average (Fig. 6b). Then, the Delaunay triangulation method is applied to the time–latitude SAOD field, resulting in a gap-free stratospheric aerosol climate data record, as illustrated in Fig. 6c.
The global average (area-weighted) stratospheric aerosol optical depth in the latitude range from 80° S to 80° N is shown in Fig. 6d; it is used as aerosol proxy in, for example, trend analyses.
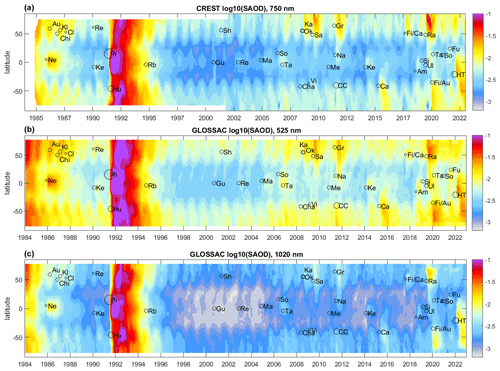
Figure 7CREST SAOD at 750 nm (a), GloSSAC SAOD at 525 nm (b) and GloSSAC SAOD at 1020 nm (c). SAOD is presented using a logarithmic color scale. Volcanic eruptions and wildfires are indicated by black circles; the size of the circles is proportional to their volcanic explosivity index (VEI; Table 1).
The interpolated CREST SAOD dataset is shown in Fig. 7a. In this figure, the main aerosol events (volcanic eruptions and wildfires) are indicated by the black circles. The circle size is proportional to the respective volcanic explosivity index VEI (Table 1). As observed in Fig. 7a, aerosol enhancements match very well with volcanic eruptions and strong wildfires.
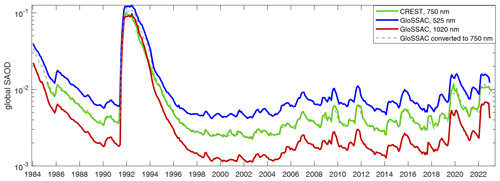
A comparison of the CREST and GloSSAC stratospheric optical depth datasets is shown in Fig. 7. GloSSAC provides SAOD at 525 and 1020 nm; therefore, SAOD is higher for 525 nm and lower for 1020 nm compared with CREST SAOD. The overall morphology of SAOD enhancements is very similar (considering the wavelength dependence) in CREST and GloSSAC. A comparison of global mean SAOD from CREST (750 nm) and GloSSAC (525 and 1020 nm) is shown in Fig. 8. The global mean was computed as the area-weighted SAOD in the latitude range from 80° S to 80° N. In this figure, we also show global GloSSAC SAOD converted to 750 nm using the same method as applied to SAGE II data (see Sect. 3).
As seen in Fig. 8, CREST and GloSSAC aerosol proxies are in very good agreement and show expected wavelength dependence of aerosol extinction. At the peak of the Pinatubo eruption, the CREST global SAOD is slightly different from that converted from the GloSSAC SAOD, which is probably related to different fitting and scaling of SAGE II data used in CREST and GloSSAC.
The merged CREST aerosol dataset is available at https://fmi.b2share.csc.fi/records/8bfa485de30840eba42d1d407f4ce19c, last access: 27 October 2024; the original version (v1, https://doi.org/10.23728/fmi-b2share.8bfa485de30840eba42d1d407f4ce19c, Sofieva et al., 2022) is until May 2022, whereas the extended version (v2, https://doi.org/10.57707/fmi-b2share.dfe14351fd8548bcaca3c2956b17f665, Sofieva et al., 2024a) is until December 2023. Interested readers can request the computational code from the corresponding author.
In this paper, we presented a new dataset: the Climate Data Record of Stratospheric Aerosols (CREST). The merged CREST dataset includes
-
monthly zonal mean aerosol extinction profiles at 750 nm from 8.5 to 39.5 km in 10° latitudinal bins from 90° S to 90° N;
-
monthly zonal mean stratospheric aerosol optical depth at 750 nm in 10° latitudinal bins from 90° S to 90° N;
-
global mean stratospheric optical depth, which can be used as an aerosol proxy in trend analyses.
The CREST dataset combines data from six limb and occultation instruments: OSIRIS, SAGE II, SAGE III/ISS, SCIAMACHY, OMPS-LP and GOMOS. The CREST dataset is complementary to NASA-GloSSAC: it provides aerosols at a different wavelength (750 nm), it uses a different collection of individual datasets included in the merged dataset and it employs a different merging approach. In addition, a different correction is applied to saturated SAGE II data during the Pinatubo period in the construction of the CREST dataset. The overall agreement between CREST and GloSSAC SAOD is very good.
The CREST dataset is openly available at https://fmi. b2share.csc.fi/records/8bfa485de30840eba42d1d407f4ce19c (last access: 27 October 2024). At the moment, it covers the period from October 1984 to December 2023, and it is intended to be extended in the future.
The created merged dataset of aerosol profiles can be used in various climate-related studies. For example, it can be used as a proxy in regression models for trend analyses or as forcing in simulations with chemistry transport models.
For the CREST dataset, we used aerosol extinction profiles from instruments measuring in the limb-viewing geometry and then compared CREST results with GloSSAC, which uses similar measurements. When new limb aerosol extinction profiles become available, they can easily be added to the merged dataset using the methods explained in the paper. However, there are also several active remote sensing instruments, such as CALIPSO, Aeolus (https://www.esa.int/Applications/Observing_the_Earth/FutureEO/Aeolus, last access: 27 October 2024, Flament et al., 2021) and EarthCARE (https://www.esa.int/Applications/Observing_the_Earth/FutureEO/EarthCARE, last access: 27 October 2024), that provide aerosol profiles from measurements in the nadir-viewing geometry. The quantities measured by active instruments (backscattering ratio) and sampling (about a 100 m wide footprint stripe vs. several hundred kilometers for limb instruments) are very different from those of the instruments used in this study. These differences in the measurement principles result in different sensitivity to aerosols and the vertical range of retrieved aerosol profiles. Nevertheless, the comparison of aerosol climate data records from limb and nadir measurement systems would provide added value, increasing the reliability of the stratospheric aerosol climate data record. Such an interesting and challenging task can be implemented in future works.
The supplement related to this article is available online at: https://doi.org/10.5194/essd-16-5227-2024-supplement.
VFS and AR designed the study and performed the analyses, VFS wrote the majority of the paper, and MS collected the database of volcanic eruptions. AR, MS, JPB, CR, RD, DD, LAR and AB provided the data and contributed to the analyses and writing of the paper.
The contact author has declared that none of the authors has any competing interests.
Publisher's note: Copernicus Publications remains neutral with regard to jurisdictional claims made in the text, published maps, institutional affiliations, or any other geographical representation in this paper. While Copernicus Publications makes every effort to include appropriate place names, the final responsibility lies with the authors.
The work has been performed within the framework of the ESA CREST project. The creation of the SCIAMACHY and OMPS-LP aerosol datasets at the University of Bremen was funded in part by the ESA, via the CREST project; by the German Research Foundation (DFG), via the Research Unit VolImpact (grant no. FOR2820); and by the University of Bremen and state of Bremen. The University of Bremen team gratefully acknowledges the computing time granted by the Resource Allocation Board and provided on the Lise and Emmy supercomputers at NHR@ZIB and NHR-NORD@Göttingen, respectively, as part of the NHR infrastructure. The calculations for this research were conducted with computing resources within the framework of the hbk00098 project. The Finnish Meteorological Institute team is grateful to the Academy of Finland (Centre of Excellence of Inverse Modelling and Imaging; decision no. 353082). OSIRIS operations and data processing are funded by the Canadian Space Agency.
This research has been supported by the European Space Agency (CREST, contract no. 4000130839/20/I-DT).
This paper was edited by Marc Daniel Mallet and reviewed by Stephen Wilson and one anonymous referee.
Bertaux, J. L., Kyrölä, E., Fussen, D., Hauchecorne, A., Dalaudier, F., Sofieva, V., Tamminen, J., Vanhellemont, F., Fanton d'Andon, O., Barrot, G., Mangin, A., Blanot, L., Lebrun, J. C., Pérot, K., Fehr, T., Saavedra, L., Leppelmeier, G. W., and Fraisse, R.: Global ozone monitoring by occultation of stars: an overview of GOMOS measurements on ENVISAT, Atmos. Chem. Phys., 10, 12091–12148, https://doi.org/10.5194/acp-10-12091-2010, 2010.
Bourassa, A. E., Rieger, L. A., Lloyd, N. D., and Degenstein, D. A.: Odin-OSIRIS stratospheric aerosol data product and SAGE III intercomparison, Atmos. Chem. Phys., 12, 605–614, https://doi.org/10.5194/acp-12-605-2012, 2012.
Bovensmann, H., Burrows, J. P., Buchwitz, M., Frerick, J., Noël, S., Rozanov, V. V., Chance, K. V., and Goede, A. P. H.: SCIAMACHY: Mission Objectives and Measurement Modes, J. Atmos. Sci., 56, 127–150, https://doi.org/10.1175/1520-0469(1999)056<0127:SMOAMM>2.0.CO;2, 1999.
Burrows, J. P., Hölzle, E., Goede, A. P. H., Visser, H., and Fricke, W.: SCIAMACHY—scanning imaging absorption spectrometer for atmospheric chartography, Acta Astronaut., 35, 445–451, https://doi.org/10.1016/0094-5765(94)00278-T, 1995.
Crutzen, P. J.: Albedo Enhancement by Stratospheric Sulfur Injections: A Contribution to Resolve a Policy Dilemma?, Clim. Change, 77, 211, https://doi.org/10.1007/s10584-006-9101-y, 2006.
Damadeo, R. P., Zawodny, J. M., Thomason, L. W., and Iyer, N.: SAGE version 7.0 algorithm: application to SAGE II, Atmos. Meas. Tech., 6, 3539–3561, https://doi.org/10.5194/amt-6-3539-2013, 2013.
Damadeo, R. P., Sofieva, V. F., Rozanov, A., and Thomason, L. W.: An empirical characterization of the aerosol Ångström exponent interpolation bias using SAGE III/ISS data, Atmos. Meas. Tech., 17, 3669–3678, https://doi.org/10.5194/amt-17-3669-2024, 2024.
Davis, S. M., Damadeo, R., Flittner, D., Rosenlof, K. H., Park, M., Randel, W. J., Hall, E. G., Huber, D., Hurst, D. F., Jordan, A. F., Kizer, S., Millan, L. F., Selkirk, H., Taha, G., Walker, K. A., and Vömel, H.: Validation of SAGE III/ISS Solar Water Vapor Data With Correlative Satellite and Balloon-Borne Measurements, J. Geophys. Res.-Atmos., 126, e2020JD033803, https://doi.org/10.1029/2020JD033803, 2021.
Deshler, T.: A review of global stratospheric aerosol: Measurements, importance, life cycle, and local stratospheric aerosol, Atmos. Res., 90, 223–232, https://doi.org/10.1016/j.atmosres.2008.03.016, 2008.
Flament, T., Trapon, D., Lacour, A., Dabas, A., Ehlers, F., and Huber, D.: Aeolus L2A aerosol optical properties product: standard correct algorithm and Mie correct algorithm, Atmos. Meas. Tech., 14, 7851–7871, https://doi.org/10.5194/amt-14-7851-2021, 2021.
Flynn, L., Long, C., Wu, X., Evans, R., Beck, C. T., Petropavlovskikh, I., McConville, G., Yu, W., Zhang, Z., Niu, J., Beach, E., Hao, Y., Pan, C., Sen, B., Novicki, M., Zhou, S., and Seftor, C.: Performance of the Ozone Mapping and Profiler Suite (OMPS) products: OMPS OZONE PRODUCTS, J. Geophys. Res.-Atmos., 119, 6181–6195, https://doi.org/10.1002/2013JD020467, 2014.
Kovilakam, M., Thomason, L. W., Ernest, N., Rieger, L., Bourassa, A., and Millán, L.: The Global Space-based Stratospheric Aerosol Climatology (version 2.0): 1979–2018, Earth Syst. Sci. Data, 12, 2607–2634, https://doi.org/10.5194/essd-12-2607-2020, 2020.
Kyrölä, E., Tamminen, J., Leppelmeier, G. W., Sofieva, V. F., Hassinen, S., Bertaux, J.-L., Hauchecorne, A., Dalaudier, F., Cot, C., Korablev, O., D'Andon, O. F., Barrot, G., Mangin, A., Theodore, B., Guirlet, M., Etanchaud, F., Snoij, P., Koopman, R., Saavedra, L., Fraisse, R., Fussen, D., and Vanhellemont, F.: GOMOS on Envisat: An overview, Adv. Space Res., 33, 1020–1028, 2004.
Kyrölä, E., Tamminen, J., Sofieva, V., Bertaux, J. L., Hauchecorne, A., Dalaudier, F., Fussen, D., Vanhellemont, F., Fanton d'Andon, O., Barrot, G., Guirlet, M., Mangin, A., Blanot, L., Fehr, T., Saavedra de Miguel, L., and Fraisse, R.: Retrieval of atmospheric parameters from GOMOS data, Atmos. Chem. Phys., 10, 11881–11903, https://doi.org/10.5194/acp-10-11881-2010, 2010.
Llewellyn, E., Lloyd, N. D., Degenstein, D. A., Gattinger, R. L., Petelina, S. V., Bourassa, A. E., Wiensz, J. T., Ivanov, E. V., McDade, I. C., Solheim, B. H., McConnell, J. C., Haley, C. S., Savigny, C. von, Sioris, C. E., McLinden, C. A., Griffioen, E., Kaminski, J., Evans, W. F. J., Puckrin, E., Strong, K., Wehrle, V., Hum, R. H., Kendall, D. J. W., Matsushita, J., Murtagh, D. P., Brohede, S., Stegman, J., Witt, G., Barnes, G., Payne, W. F., Piche, L., Smith, K., Warshaw, G., Deslauniers, D. L., Marchand, P., Richardson, E. H., King, R. A., Wevers, I., McCreath, W., Kyrola, E., Oikarinen, L., Leppelmeier, G. W., Auvinen, H., Megie, G., Hauchecorne, A., Lefevre, F., Noe, J. de L., Ricaud, P., Frisk, U., Sjoberg, F., Scheele, F. von, and Nordh, L.: The OSIRIS instrument on the Odin spacecraft, Can. J. Phys., 82, 411–422, https://doi.org/10.1139/p04-005, 2004.
Loughman, R., Bhartia, P. K., Chen, Z., Xu, P., Nyaku, E., and Taha, G.: The Ozone Mapping and Profiler Suite (OMPS) Limb Profiler (LP) Version 1 aerosol extinction retrieval algorithm: theoretical basis, Atmos. Meas. Tech., 11, 2633–2651, https://doi.org/10.5194/amt-11-2633-2018, 2018.
Malinina, E., Rozanov, A., Rieger, L., Bourassa, A., Bovensmann, H., Burrows, J. P., and Degenstein, D.: Stratospheric aerosol characteristics from space-borne observations: extinction coefficient and Ångström exponent, Atmos. Meas. Tech., 12, 3485–3502, https://doi.org/10.5194/amt-12-3485-2019, 2019.
Noël, S., Bramstedt, K., Rozanov, A., Malinina, E., Bovensmann, H., and Burrows, J. P.: Stratospheric aerosol extinction profiles from SCIAMACHY solar occultation, Atmos. Meas. Tech., 13, 5643–5666, https://doi.org/10.5194/amt-13-5643-2020, 2020.
Pohl, C., Wrana, F., Rozanov, A., Deshler, T., Malinina, E., von Savigny, C., Rieger, L. A., Bourassa, A. E., and Burrows, J. P.: Stratospheric aerosol characteristics from SCIAMACHY limb observations: two-parameter retrieval, Atmos. Meas. Tech., 17, 4153–4181, https://doi.org/10.5194/amt-17-4153-2024, 2024.
Rieger, L. A., Bourassa, A. E., and Degenstein, D. A.: Merging the OSIRIS and SAGE II stratospheric aerosol records, J. Geophys. Res.-Atmos., 120, 8890–8904, https://doi.org/10.1002/2015JD023133, 2015.
Rieger, L. A., Malinina, E. P., Rozanov, A. V., Burrows, J. P., Bourassa, A. E., and Degenstein, D. A.: A study of the approaches used to retrieve aerosol extinction, as applied to limb observations made by OSIRIS and SCIAMACHY, Atmos. Meas. Tech., 11, 3433–3445, https://doi.org/10.5194/amt-11-3433-2018, 2018.
Rieger, L. A., Zawada, D. J., Bourassa, A. E., and Degenstein, D. A.: A Multiwavelength Retrieval Approach for Improved OSIRIS Aerosol Extinction Retrievals, J. Geophys. Res.-Atmos., 124, 2018JD029897, https://doi.org/10.1029/2018JD029897, 2019.
Rozanov, A., Pohl, C., Arosio, C., Bourassa, A., Bramstedt, K., Malinina, E., Rieger, L., and Burrows, J. P.: Retrieval of stratospheric aerosol extinction coefficients from OMPS-LP measurements, EGUsphere [preprint], https://doi.org/10.5194/egusphere-2024-358, 2024.
Russell, P. B. and McCormick, M. P.: SAGE II aerosol data validation and initial data use: An introduction and overview, J. Geophys. Res., 94, 8335–8338, https://doi.org/10.1029/JD094iD06p08335, 1989.
Sofieva, V. F., Kyrölä, E., Laine, M., Tamminen, J., Degenstein, D., Bourassa, A., Roth, C., Zawada, D., Weber, M., Rozanov, A., Rahpoe, N., Stiller, G., Laeng, A., von Clarmann, T., Walker, K. A., Sheese, P., Hubert, D., van Roozendael, M., Zehner, C., Damadeo, R., Zawodny, J., Kramarova, N., and Bhartia, P. K.: Merged SAGE II, Ozone_cci and OMPS ozone profile dataset and evaluation of ozone trends in the stratosphere, Atmos. Chem. Phys., 17, 12533–12552, https://doi.org/10.5194/acp-17-12533-2017, 2017.
Sofieva, V. F., Rozanov, A., and Szelag, M.: Climate data Record of Stratospheric aerosols (CREST) (Version 1.0), Finnish Meteorological Institute [data set], https://doi.org/10.23728/FMI-B2SHARE.8BFA485DE30840EBA42D1D407F4CE19C, 2022.
Sofieva, V. F., Rozanov, A., and Szelag, M.: Climate data Record of Stratospheric aerosols (CREST) (Version 2.0), Finnish Meteorological Institute [data set], https://doi.org/10.57707/FMI-B2SHARE.DFE14351FD8548BCACA3C2956B17F665, 2024a.
Sofieva, V. F., Szelag, M., Tamminen, J., Fussen, D., Bingen, C., Vanhellemont, F., Mateshvili, N., Rozanov, A., and Pohl, C.: Multi-wavelength dataset of aerosol extinction profiles retrieved from GOMOS stellar occultation measurements, Atmos. Meas. Tech., 17, 3085–3101, https://doi.org/10.5194/amt-17-3085-2024, 2024b.
Sukhodolov, T., Sheng, J.-X., Feinberg, A., Luo, B.-P., Peter, T., Revell, L., Stenke, A., Weisenstein, D. K., and Rozanov, E.: Stratospheric aerosol evolution after Pinatubo simulated with a coupled size-resolved aerosol–chemistry–climate model, SOCOL-AERv1.0, Geosci. Model Dev., 11, 2633–2647, https://doi.org/10.5194/gmd-11-2633-2018, 2018.
Thomason, L. W., Burton, S. P., Luo, B.-P., and Peter, T.: SAGE II measurements of stratospheric aerosol properties at non-volcanic levels, Atmos. Chem. Phys., 8, 983–995, https://doi.org/10.5194/acp-8-983-2008, 2008.
Thomason, L. W., Ernest, N., Millán, L., Rieger, L., Bourassa, A., Vernier, J.-P., Manney, G., Luo, B., Arfeuille, F., and Peter, T.: A global space-based stratospheric aerosol climatology: 1979–2016, Earth Syst. Sci. Data, 10, 469–492, https://doi.org/10.5194/essd-10-469-2018, 2018.
Vanhellemont, F., Fussen, D., Mateshvili, N., Tétard, C., Bingen, C., Dekemper, E., Loodts, N., Kyrölä, E., Sofieva, V., Tamminen, J., Hauchecorne, A., Bertaux, J.-L., Dalaudier, F., Blanot, L., Fanton d'Andon, O., Barrot, G., Guirlet, M., Fehr, T., and Saavedra, L.: Optical extinction by upper tropospheric/stratospheric aerosols and clouds: GOMOS observations for the period 2002–2008, Atmos. Chem. Phys., 10, 7997–8009, https://doi.org/10.5194/acp-10-7997-2010, 2010.
Vernier, J.-P., Thomason, L. W., Pommereau, J.-P., Bourassa, A., Pelon, J., Garnier, A., Hauchecorne, A., Blanot, L., Trepte, C., Degenstein, D., and Vargas, F.: Major influence of tropical volcanic eruptions on the stratospheric aerosol layer during the last decade, Geophys. Res. Lett., 38, L12807, https://doi.org/10.1029/2011GL047563, 2011.
von Savigny, C., Ernst, F., Rozanov, A., Hommel, R., Eichmann, K.-U., Rozanov, V., Burrows, J. P., and Thomason, L. W.: Improved stratospheric aerosol extinction profiles from SCIAMACHY: validation and sample results, Atmos. Meas. Tech., 8, 5223–5235, https://doi.org/10.5194/amt-8-5223-2015, 2015.
Wang, H. J., Cunnold, D. M., Thomason, L. W., Zawodny, J. M., and Bodeker, G. E.: Assessment of SAGE version 6.1 ozone data quality, J. Geophys. Res.-Atmos., 107, ACH 8-1–ACH 8-18, https://doi.org/10.1029/2002JD002418, 2002.
Wang, H. J. R., Damadeo, R., Flittner, D., Kramarova, N., Taha, G., Davis, S., Thompson, A. M., Strahan, S., Wang, Y., Froidevaux, L., Degenstein, D., Bourassa, A., Steinbrecht, W., Walker, K. A., Querel, R., Leblanc, T., Godin-Beekmann, S., Hurst, D., and Hall, E.: Validation of SAGE III/ISS Solar Occultation Ozone Products With Correlative Satellite and Ground-Based Measurements, J. Geophys. Res.-Atmos., 125, e2020JD032430, https://doi.org/10.1029/2020JD032430, 2020.
The extinction coefficient is the sum of absorption and scattering in the atmosphere along the radiation path per unit distance. It is equal to , where Ni is the number density of atmospheric constituent i, σa,i(λ) is the absorption coefficient of species i at wavelength λ and σs,i(λ) is the scattering coefficient of species i at wavelength λ.
- Abstract
- Introduction
- Satellite aerosol data
- Merged dataset of aerosol profiles
- Filling gaps in SAGE II data during Pinatubo
- Creating stratospheric aerosol optical depth
- The merged CREST SAOD dataset: illustrations and comparison with GloSSAC
- Code and data availability
- Summary and discussion
- Author contributions
- Competing interests
- Disclaimer
- Acknowledgements
- Financial support
- Review statement
- References
- Supplement


