the Creative Commons Attribution 4.0 License.
the Creative Commons Attribution 4.0 License.
ISASO2: recent trends and regional patterns of ocean dissolved oxygen change
Nicolas Kolodziejczyk
Esther Portela
Virginie Thierry
Annaig Prigent
Recent estimates of the global inventory of dissolved oxygen (DO) have suggested a decrease of 2 % since the 1960s. However, due to the sparse historical oxygen data coverage, the DO inventory exhibits large regional uncertainties over the interannual timescale. Using the In Situ Analysis System for O2 (ISASO2), a new Argo DO-based optimally interpolated climatology at https://doi.org/10.17882/52367 (Kolodziejczyk et al., 2023), we have estimated an updated regional oxygen inventory. Over the long term (∼ 1980–2013), comparing the ISASO2 Argo fields with the first-guess World Ocean Atlas (WOA18) built from the DO bottle sample fields extracted from the World Ocean Database 2018 (WOD18), the broad tendency to global ocean deoxygenation remains robust in the upper 2000 m, with −451 ± 243 Tmol per decade. The oxygen decline is more pronounced in the key ventilation areas of the Southern Ocean and North Atlantic, except in the Nordic Seas, where oxygen has increased. Over the shorter timescale of the Argo period (2005–2019), the deoxygenation tendency seems globally amplified (−1211 ± 218 Tmol per decade). However, DO changes exhibit stronger amplitude and contrasting regional patterns. The recent changes in Apparent Oxygen Utilization mainly explain the interannual variability in the ventilation regions. However, Argo DO coverage is still incomplete as global and calibration method development is still in progress. Continuing the monitoring of the seasonal-to-interannual and regional-to-global DO variability from ISASO2 will improve our ability to reduce uncertainties in global and regional DO inventories.
- Article
(8978 KB) - Full-text XML
- BibTeX
- EndNote
The global inventory of dissolved oxygen (DO) has been reported as having declined by about 2 % over the last 60 years (Schmidtko et al., 2017; Helm et al., 2011; Ito et al., 2017). Moreover, future projections suggest sustained to increasing ocean deoxygenation until 2100, depending on the emission scenario (Bopp et al., 2013). This trend has been partly explained by the loss of solubility due to the warming of the upper-ocean layer under global warming of the Earth system (Keeling et al., 2010; Schmidtko et al., 2017). Furthermore, ocean warming and melting of continental ice have consequences for ocean circulation by enhancing surface stratification (Li et al., 2020; Yamaguchi and Suga, 2019; Sallée et al., 2021; Bronselaer et al., 2018; IPCC, 2021), which may reduce the ventilation of the DO in the Southern Ocean (Helm et al., 2011; Couespel et al., 2019; Bronselaer et al., 2020), in regions of deep-water formation in the northern North Atlantic (Stendardo and Gruber, 2012) and in the shallow thermocline ventilation cells in tropical regions (Oschlies et al., 2018). The latter has a particular impact on the weak DO supply to the Oxygen Minimum Zone (OMZ), which are naturally low-oxygen, or hypoxic, regions located in the eastern tropical oceans (Karstensen et al., 2008; Paulmier and Ruiz-Pino, 2009; Hahn et al., 2017). One of the critical ecological impacts of the combined effect of global deoxygenation and ocean warming is the decrease in the partial pressure of O2 (pO2; Hoffman et al., 2011; Brewer et al., 2014) and the increase in the biological oxygen consumption rate (Brewer and Peltzer, 2017). This is especially critical in the expending expansion of the OMZs (Stramma et al., 2008), with a strong impact on the habitat of pelagic species (Stramma et al., 2012) and macrofaunal diversity (Sperling et al., 2016).
Many efforts have been made recently to gather a comprehensive DO dataset and to diagnose the global DO inventory from historical datasets (e.g., Schmitdko et al., 2017; Helm et al., 2011; Ito et al., 2017). However, the interannual and regional DO variability and driving mechanisms, especially those associated with ocean ventilation (Helm et al., 2011; Portela et al., 2020b), suffer from large uncertainties due to a lack of dedicated and sustained observing systems (Levin, 2018; Oschlies et al., 2018). Consequently, at the regional scales, the modes of natural ocean variability need to be identified better, as they can obscure the long-term anthropogenic oxygen trends (e.g., Stramma et al., 2020; Stramma and Schmidtko, 2021; Feucher et al., 2022).
Since 2005, the development of the BGC-Argo mission collecting biogeochemical parameters such as DO (Claustre et al., 2020; Roemmich et al., 2019) from Argo floats has provided more than 150 000 quality-controlled profiles (Thierry and Bittig, 2021; Maurer et al., 2021). Although still sparse at the global scale, the coverage of the Argo DO time series allows the seasonal-to-interannual DO variability at the regional scale to be resolved. In some key regions, such as the North Atlantic subtropical and subpolar gyres, this new dataset has already improved our understanding of the physical drivers of regional DO variability (e.g., Billheimer et al., 2021; Feucher et al., 2022; Tjiputra et al., 2018). Thus, sustained and consistent further observations are needed to monitor the oxygen regional and interannual variability and to disentangle the long-term anthropogenic trends from natural variability (Levin, 2018). Also, beyond the warming-induced ocean deoxygenation, the crucial role of ventilation change in the amplification or attenuation of deoxygenation should be addressed at the regional and interannual timescales.
In this study, we constructed a climatological gridded product of the most updated Argo DO dataset using the In Situ Analysis System tool (ISAS; Gaillard et al., 2009, 2016). ISAS has routinely been used to optimally interpolate in situ temperature and salinity data, and it has now been adapted for analysis of the Argo DO. The new ISAS climatologies over the selected periods between 2005 and 2019 are compared with the historical World Ocean Atlas (WOA18, representative of the early 1980s). The global patterns of the recent DO change over the Argo period (2005–2019) and the long-term variability (1980–2013) are discussed (in regions covered by Argo DO). The climatological In Situ Analysis System for O2 (ISASO2) fields are freely available at https://doi.org/10.17882/52367 (Kolodziejczyk et al., 2023).
2.1 Argo DO data
The Argo DO data (March 2021 release) have been downloaded from the Coriolis Global Assembly Center (Argo, 2000). In this study, we used 117 359 delayed-mode (DM) Argo data from the surface to 2000 m depth covering the period 2005–2019 (Fig. 1a). Only quality control (QC) flags set to 1 (good) and 2 (probably good) have been retained by default in the analysis process.
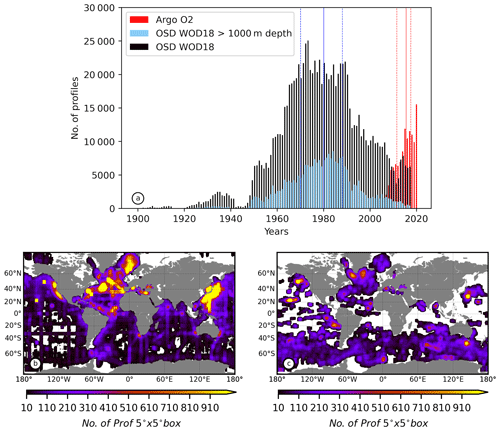
Figure 1(a) Yearly distribution of DO profiles from the WOD18 OSD used in WOA18 (black), the WOD18 OSD profiles deeper than 1000 m (blue) and the DMQC Argo dataset used in ISASO2 (red) over the period 1899–2019. Solid lines (dashed lines) are the medians (first and third quartiles) of the distribution. (b) Density of WOD18 OSD DO profiles. (c) Density of Argo DO profiles.
There are two main methods to measure DO in the ocean from an autonomous platform (Thierry et al., 2022). The first method is an electrochemical one that uses a Clark-type polarographic cell (Gnaiger and Forstner, 1983). The SBE43 sensor uses this measurement principle. The second method is an optical one based on the principle of dynamic fluorescence quenching (Lakowicz, 2006). Sensors based on this method are referred to as oxygen optodes (e.g., Aanderaa 4330, SBE63, SBE83 or AROD-FT Rinko). While the two types of sensors have been tested in the field since 2005, it has been shown that oxygen optodes are the only dissolved oxygen sensors currently suitable for Argo applications (Bittig et al., 2019). In addition, sensor models, designs, calibration processes and computing equations have evolved since 2005 (Thierry et al., 2022; Bittig et al., 2018, 2019), with the overall aim of improving DO data accuracy.
The best accuracy that can be reached with the present sensor type and knowledge is 1–2 µmol kg−1 (0.5 % O2 saturation). This requires the use of optodes with individual multipoint calibration and the adjustment of oxygen data to in situ and/or in-air reference data (Bittig and Körtzinger, 2017) to correct for the drift in O2 sensitivity that occurs between calibration and deployment (“storage drift” of order ∼ 5 % yr−1) as well as the “in situ drift” (order −0.5 % yr−1) that occurs during the multiyear deployment period (Bittig et al., 2018, 2019). In addition, oxygen optodes can show a pressure-dependent response of the sensor. This pressure has been characterized and is taken into account in the dissolved oxygen computation from the raw data (Bittig et al., 2014, 2018; Thierry et al., 2022). For some floats, an additional pressure correction might be necessary to reach 1–2 µmol kg−1. This needs to be estimated from ship-based calibrated reference data (Racapé et al., 2019). The last issue concerns a time-dependent lag in response to a change in DO, which affects data accuracy when sensors experience O2 gradients during vertical float displacement. While methods to characterize the response time and to correct for the sensor lag are known (Bittig et al., 2014; Bittig and Körtzinger, 2017; Gordon et al., 2020), they cannot be applied systematically, as this requires timing of each observation, which is not available in all float models. The lack of time response correction can lead to uncertainties of 6–7 µmol kg−1 for the SBE63 sensor and 13–15 µmol kg−1 for the Aanderaa 4330 sensor in the strongest oxycline region (Bittig and Kortzinger, 2017) and might contribute to the bias of −1.18 mmol kg−1 observed in the float data compared with GLODAP (Sharp et al., 2023).
The distribution of the measurement error provided by Argo DO delayed-mode quality control (DMQC) reflects the evolution of the sensors and the associated data uncertainties. The measurement errors, as estimated by DMQC operators, are mainly distributed around 2–3, 7–8 and 13–14 µmol kg−1 (Fig. 2). The former corresponds to the mean accuracy expected from the current sensor type and knowledge (Thierry and Bittig, 2021; Maurer et al., 2021). The latter two mainly reflect the data accuracy of older sensor models but might be due to specific configurations (deployment in the strong oxycline region or a lack of reference data). The ISASO2 climatology will be updated regularly, including the updated DMQC S-profiles with the most recent advances in sensor corrections.
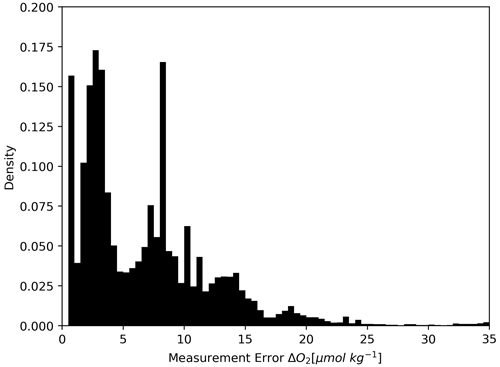
Figure 2Distribution of the measurement error (DOXY_ADJUSTED_ERROR) from Argo DO S-profiles interpolated on the ISAS standard z levels.
Another source of uncertainty is the inhomogeneous spatiotemporal distribution of the Argo DO data. Data coverage remains sparse in subtropical and tropical regions of the South Atlantic and Indian oceans, as well as in the eastern subtropical area of the Pacific Ocean (Fig. 1c). The coverage is particularly poor in the Pacific Ocean, while the best-sampled regions are the North Atlantic Ocean, Southern Ocean, eastern North Pacific Ocean and northern Indian Ocean (Fig. 1c).
2.2 WOA18 and WOD18 Ocean Station Data
The DO annual climatology from WOA18 (Garcia et al., 2019) was used as a first guess for ISASO2 interpolation. WOA18 was constructed by objective analysis (Barnes, 1964) of the available historical Ocean Station Data (OSD) provided in the World Ocean Database's 2018 release (WOD18; Boyer et al., 2018). The WOD18 OSD DO dataset gathers 962 219 low-vertical-resolution profiles over the period 1899–2017, with a strong sampling bias in the Northern Hemisphere (Fig. 1b). The OSD DO data are obtained using the Winkler titration method, excluding other DO sensor devices (Garcia et al., 2019). The accuracy of the Winker method was established as ±0.3 µmol kg−1 (Carpenter, 1965). The WOA18 climatology is provided on a 1° grid with an effective horizontal resolution between 892 and 446 km and over 102 standard depth levels between the surface and 5500 m depth. As there is no preferred time correlation scale introduced in the WOA18 mapping (Garcia et al., 2019), the time representativeness of WOA18 has been estimated using the OSD profile distribution of WOD18 (Fig. 1a).
The bulk of profiles deeper than 1000 m were mainly collected over the period 1970–1988 (first and third quartiles; Fig. 1a). The spatial distribution of the time representativeness of WOA18 and WOD18 for profiles deeper than at least 1000 m (Fig. 3d, e) reveals that the median year for the sampling carried out in the Northern Hemisphere ocean falls between 1970 and 1990, with a variance ranging from 6 to 20 years. In the Southern Hemisphere the sampling is more recent, between 1980 and 2000, with the largest spread (up to 25 years) in the South Atlantic Ocean (Fig. 3e). Using these relative time-representativeness values to compute the decadal trends at each grid point leads to increased uncertainties in the estimate of the median time (see Fig. 3). Over the vertical, the time representativeness of WOA18 and WOD18 gives a median time between 1970 and 1990 in the Northern Hemisphere, with a deeper profile reaching 2000 m, while in the Southern Hemisphere the median time is more representative of the 1980–2000 period, with larger spreads for samples deeper than 1000 m (Fig. 4).
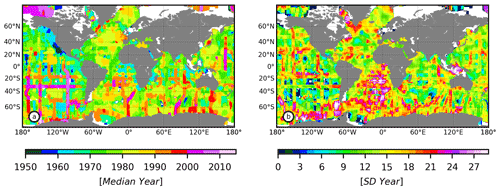
Figure 3(a) Median year of sampling for WOD18 OSD DO profiles and (b) the standard deviation (years) of the time distribution for WOD18 OSD DO profiles reaching at least 1000 m depth (5° × 5° box).
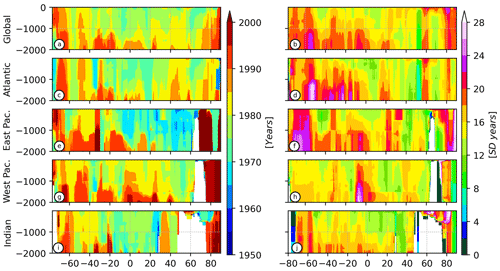
Figure 4Meridional section of median time (left column) and SD (right column) for WOD18 OSD O2 profiles for (a, b) the global ocean, (c, d) the Atlantic basin (90° W–20° E), (e, f) the eastern Pacific Ocean (180–90° W), (g, h) the western Pacific Ocean (120–180° E) and (i, j) the Indian Ocean (20–120° E). These time estimates are used to compute the equivalent trend for the difference between the WOA18 and ISAS_MEAN sections.
2.3 ISAS
Using ISAS (Gaillard et al., 2009, 2016), an optimal interpolation (OI; Bretherton et al., 1976) scheme has been used to map the DO data. The horizontal grid was 0.5° over 187 vertical levels from the surface to 5500 m depth. The a priori statistics used in the ISASO2 optimal interpolation are the DO annual climatology from WOA18 (Garcia et al., 2019) (Fig. 5a) used as a first guess and the updated standard deviation (SD) from Argo DO (binned in 5° × 5° boxes; Fig. 5d). The updated DO SD computed from Argo is representative of the seasonal-to-interannual variance. In comparison to the WOA variance climatology, new Argo DO data have significantly improved the a priori estimation of the DO variance in historically badly sampled regions, such as the Southern Hemisphere (see Fig. 5b, d). New regions of high DO variability have been identified, such as in the western boundary currents and the Antarctic Circumpolar Current. These regions are associated with frontal regions with sharp contrasts between water masses and strong dynamical features that likely produce high DO variability (e.g., Chapman et al., 2020).
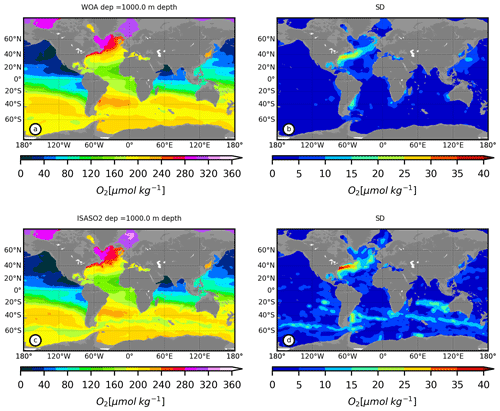
Figure 5(a) World Ocean Atlas (WOA) climatology of DO (µmol kg−1) at 1000 m depth. (b) WOAO2 climatology of the SD (µmol kg−1) between 2005 and 2019 at 1000 m depth. (c) ISASO2 climatology of DO (µmol kg−1) between 2005 and 2019 at 1000 m depth. (d) ISASO2 climatology of the SD (µmol kg−1) between 2005 and 2019 at 1000 m depth.
The Argo DO sampling coverage is not yet evenly distributed over the global ocean. Therefore, to deal with the partial coverage, the objective mapping was first performed for the mean state over three selected multiyear periods. In order to be consistent with the spatial scale of the ISAS20 (Gaillard et al., 2016) temperature and salinity fields also used in this study (Kolodziejczyk et al., 2023), the zonal and meridional decorrelation radius and variance weights are the same as in Gaillard et al. (2016; their Eq. 4), except for the correlation timescale (the time correlation Gaussian function), which is defined as
where Lt is the time decorrelation scale. There are three configurations: (i) ISASO2_MEAN maps the whole Argo dataset using a time correlation Gaussian window centered on January 2013 with a 5-year correlation scale (the half-Gaussian width is Lt=5 years). This mean encompasses 10 years of data and is designed to be representative of the decadal mean over the period 2009–2018. (ii) ISASO2_M11 and ISASO2_M16 are pentadal means using a time correlation Gaussian window centered on January 2011 and 2016, respectively, with a 2.5-year correlation scale (encompassing 5 years of data). These two configurations are designed to be representative of the ocean's pentadal mean over the periods between 2009–2013 and 2014–2018, respectively. This approach was chosen because it was a trade-off between having sufficient spatial coverage and allowing temporal discretization.
In addition, the DO concentration at saturation [O] has been computed using the ISASO2 T or S monthly fields averaged over the same three periods (Kolodziejczyk et al., 2023). The DO and Apparent Oxygen Utilization (defined as Apparent Oxygen Utilization AOU = [O] − [O2]) mean climatology has been provided by WOA2018 (Garcia et al., 2019).
It is worth addressing the innovation of the Argo DO profiles using a WOA18 first guess in the ISASO2 OI procedure. Clearly, the time representativeness of both datasets is different. The distribution of the difference between Argo DO observations and WOA18 first guesses of the locations of the Argo DO profiles shows an average shift of −4.31 µmol kg−1 (Fig. 6). This suggests a general deoxygenated bias between the WOA18 and Argo data that is likely due to either (i) a mean deoxygenation at the location of the Argo DO profile or (ii) a remaining low oxygen bias in the Argo DO profile. In contrast, after the OI procedure, the median of the residuals, i.e., the difference between Argo DO observations and ISASO2_MEAN at the location of the Argo DO profile, is −0.39 µmol kg−1 (Fig. 6). This suggests that ISASO2_MEAN estimates are slightly more oxygenated than Argo DO data at the location of the Argo DO profile. More generally, the ISASO2_MEAN DO slightly overestimates the DO in the period 2005–2019. This is likely due to the relaxation of the DO estimates toward the first guess (WOA18), which is typically less oxygenated, and the smoothing in the ISAS OI procedure.
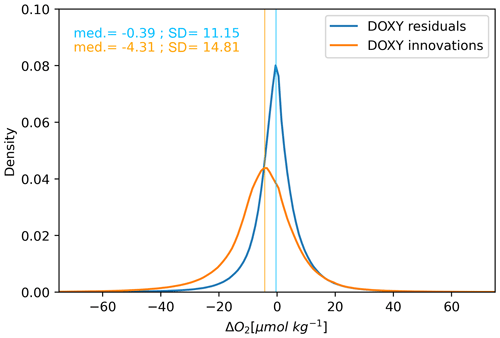
Figure 6Density of the residual distribution, i.e., the difference between the Argo data and ISAS_CLIM (blue), and innovation, i.e., the difference between the Argo data and the first-guess WOA18 data (orange). The median of innovation is −4.31 µmol kg−1, suggesting a general deoxygenated bias between the WOA18 and Argo data, likely due to (i) a mean deoxygenation at the location of the Argo DO profile or (ii) the remaining low oxygen bias in the Argo DO profile. The median for the residual is −0.39 µmol kg−1, suggesting that ISAS_CLIM estimates are slightly more oxygenated than Argo DO data at the location of the Argo DO profiles. This is likely due to the relaxation of the DO estimates toward the first guess (WOA18) and the smoothing in the OI procedure.
2.4 Error handling
The analyzed variance (error) is provided by the OI procedure. It is derived from the a priori variance updated from new Argo DO (Fig. 1c), covariance scales and measurement errors (Fig. 2) (Gaillard et al., 2009, 2016). Then, the error estimates of the regional DO inventory are computed by propagating the analyzed error computed from ISASO2 (Fig. 5d), using the linear expression
where αi is an element of space (layer thickness multiplied by the mean density for the vertical inventory or grid cell surface for the global inventory), ϵi is the error at the i grid point, and ρij is the correlation between the i and j grid points. This equation was applied for vertical and horizontal summations of error. Correlation ρij was computed from ISASO2 monthly temperature fields, assuming that large physical correlation scales can be applied to DO profiles. When computing the WOA18 DO inventory error, the a priori variance is inaccurate and an analyzed error is not provided. Therefore, the full a priori variance derived from Argo DO was used. This should be considered an upper bound of the WOA18 DO inventory. The error in a zonal average section is computed for each section cell using the Smith et al. (1994) expression for averaging spatial errors:
where is the quadratic average of the individual analyzed errors along a zonal band and DOF is the degree of freedom corresponding to the number of independent grid cells, i.e., the total number of grid cells divided by the number of grid cells corresponding to the largest correlation scale used in ISAS (Gaillard et al., 2016; von Schukmann et al., 2009).
2.5 Computation of trends
The computation of the decadal (pseudo)trend of the DO inventory or concentration is
where O and O are the DO inventory maps or concentration sections computed from two distinct means, and T1 and T2 are their respective median times. In the case of the three ISASO2 means, this is the central time of the analysis. In the case of the WOA, we have taken the representative time estimated using the median time distribution of the WOD18 OSD profiles (Fig. 3d, e). In both cases, we computed decadal trends, even if the difference between ISASO2 means is only representative of 5-year variability. This choice has been made to make comparable (normalize) the magnitude of the long-term and interannual variability. The associated uncertainty ranges for DO inventory and concentration trends have been estimated using propagation techniques of the analyzed error of ISASO2 (detailed in the Supplement). The calibration biases may affect the long-term trends. Introducing artificial bias correction (around 1 µmol kg−1) does not change the regional pattern of DO increase or decrease (not shown). However, a mean bias smaller than −1 µmol kg−1 could dramatically impact the total global inventory long-term trend, as our calculation method would overweight the Argo data in the comparison with the WOA climatology.
Two climatological configurations representative of three different periods are used to compute DO change, i.e., (i) ISASO2_MEAN minus WOA18, which corresponds on average to the Argo period (2009–2018) minus the pre-Argo period, and (ii) ISASO2_M16 minus ISASO2_M11, which corresponds to the period 2018–2014 minus the period 2013–2009 (5-year average). The differences are normalized using the time span between the WOA18 and WOD18 local median year (Figs. 3d and 4) and 2013 (central time of ISASO2_MEAN) and between 2016 and 2011 (5 years), respectively. The computed trend is normalized in terms of equivalent trend (µmol kg−1 or teramole per decade). For both periods, the error is computed by propagating the error as follows:
where denotes the analyzed fields with i and j in WOA, i.e., ISASO2_MEAN, ISASO2_M11 and ISASO2_M16; T is the median time span between the two compared analyses i and j or estimated by the WOD18 profile median time in the case of using WOA18 (see the map in Fig. 1c); ϵi,j is the error of analysis; ϵT is the variance of the median time span between analyses i and j (map in Fig. 3d); and cov is the covariance between different errors, which is assumed to be zero. For WOA18, as no analysis error is provided, we have taken the SD computed from Argo DO (Fig. 5d). This estimate is likely an upper bound of the errors of analysis (corresponding to a percentage of variance (PCTVAR) of 100 % in the OI).
In order to assess the robustness of our approach to estimating the change in DO, we have computed the DO trends in 5° × 5° boxes using a linear regression of individual profiles at 500 (not shown) and 1000 m (±50 m) with Argo + OSD data (Fig. 7c), WOD18 alone (Fig. 7d) and Argo alone (Fig. 7e). Three features can be highlighted from this analysis: (i) the comparison with computation of equivalent trends from OSD- and ISAS-interpolated fields provides the same orders of magnitude and comparable regional trend patterns (Fig. 7a, b, c, e). (ii) The most striking features are the larger magnitudes of the trends (in absolute values) during the Argo period, reaching more than twice those of the pre-Argo period. (iii) Using the OSD dataset alone over the pre-Argo period (Fig. 7d) provides inconsistent trends (compared with Argo + OSD in Fig. 7c) in badly sampled regions such as the Southern Ocean and generally non-significant trends due to a lack of data in many other regions (Fig. 7d).
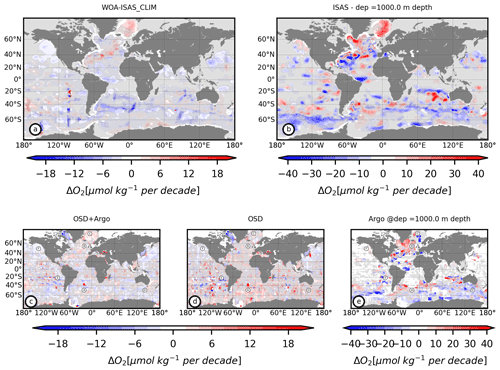
Figure 7DO trend (µmol kg−1 per decade) at 1000 m depth computed from (a) the difference between the ISASO2_MEAN climatology and the WOA18 climatology and (b) the difference of the pendatal climatology (ISAS_M16 minus ISAS_M11). The DO trend at 1000 m depth is computed from individual DO profiles in 5° × 5° boxes using (c) OSD WOD18 + Argo data, (d) the OSD WOD18 dataset alone and (e) the Argo DO dataset alone (2005–2020). Letters A–F on the panel (c), (d) and (e) maps indicate the locations of the time series shown in Fig. 8.
In order to gain further confidence in the mapped trends, we have also computed DO trends at selected locations over the global ocean (Fig. 8). In historically badly sampled regions, such as the Southern Ocean and subtropical and midlatitude regions, trends are generally barely significant and are inconsistent among datasets (Figs. 7 and 8a, d, e). In these cases, Argo floats provide data over the recent period that allowed us to better constrain the long-term trend. In contrast, well-sampled regions, such as the North Atlantic, the North Pacific and the Nordic Seas, exhibit robust long-term trends (Figs. 7 and 8b, c, f).
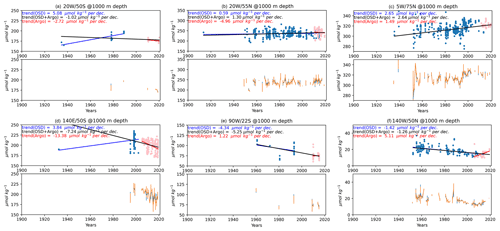
Figure 8Upper subpanel: DO trend computed in the 5° × 5° box at 1000 m depth for the OSD WOD18 + Argo (black) data, the OSD WOD18 dataset alone (blue) and the Argo DO dataset alone (2005–2020) (red). Lower subpanel: time series of the yearly mean (blue) and median (orange), together with the associated SD using the OSD WOD18 + Argo dataset. Each 5° × 5° box (see the corresponding labels in Fig. 7c, b, d) is centered on (a) 20° W–50° S, (b) 20° W–55° N, (c) 5° W–75° N, (d) 140° E–50° S, (e) 90° W–22° S and (f) 140° W–50° N.
The updated global DO inventory computed from ISASO2_MEAN gives about 235.2 ± 0.1 Pmol (236 ± 0.1 Pmol for WOA18O2), which is close to the 227.4 ± 1.1 Pmol computed by Schmidtko et al. (2017) with a different dataset and mapping method. The ∼ 1980–2013 global DO inventory change given by ISASO2_MEAN minus WOA18 is around −451 ± 243 Tmol per decade for the upper 2000 m.
The global map of DO inventory changes depicted in Fig. 9a reflects the regional mean equivalent trends between the Argo and pre-Argo periods. The global ocean has generally deoxygenated over several decades, except in the Nordic Seas (+4 mol m−2 per decade) and in a few regions of the subtropical southern Indo-Pacific (>10 mol m−2 per decade; Fig. 9a). The Northern Atlantic Ocean and Pacific Ocean are deoxygenating at a rate of around −6 mol m−2 per decade, and the tropical OMZs in the majority of the basins have expanded at 1000 m depth (black and red contours; Fig. 9a). The addition of new Argo DO data in this study has provided more robust patterns in the mid-latitude Southern Ocean in regions where Argo floats have been deployed (Fig. 9a). The Southern Ocean has historically been badly sampled in terms of DO, and thus its contribution to global deoxygenation since 1980 (about 42 %) might have been underestimated or impossible to calculate in previous studies (Ito et al., 2017). This DO loss is comparable to that of the tropical band over the same period (43 % between 30° S and N).
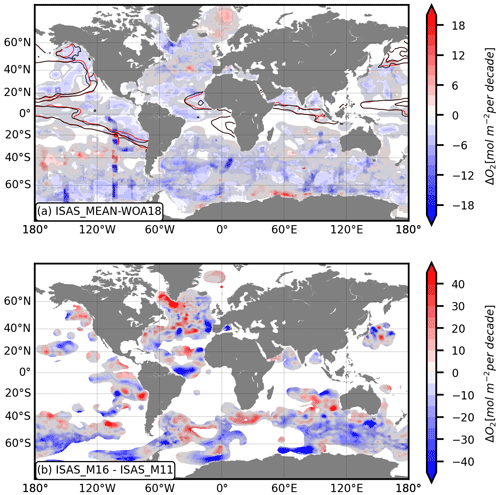
Figure 9(a) WOA18 and ISASO2_MEAN equivalent trends (mol m−2 per decade). Solid black (red) lines are the WOA18 (ISASO2_MEAN) 40 and 80 µmol kg−1 contours. (b) ISASO2_M16 and ISASO2_M11 equivalent trends (mol m−2 per decade). Equivalent trends smaller than the uncertainties are shaded in grey, and PCTVAR values higher than 95 % are blanked in Fig. 2a and b.
The Argo DO data provide further insight into the interannual changes in the DO inventory over the last 10 years (Fig. 9b). Globally, the ocean has lost the equivalent of about 1211 ± 218 Tmol of DO per decade over the Argo period (deduced from ISASO2_16 minus ISASO2_11). This suggests much more intense interannual variability in comparison with the longer-term change previously reported in the literature and in this study (e.g., Schmidtko et al., 2017). Furthermore, over the Argo period, the regional patterns are more than twice as intense as the regional patterns of the long-term trends but are in line with the regional change due to the natural mode of variability (e.g., Stramma and Schmidtko, 2021; Fig. 9a, b). The North Atlantic Subpolar Gyre, Nordic Seas and Gulf Stream regions show the largest spatially coherent increase in the DO inventory (>20 mol m−2 per decade; Fig. 9b). In contrast to the long-term trends, the Southern Ocean around 35–50° S (i.e., the subtropical front) exhibits a more intense increase in the DO inventory (>10 mol m−2 per decade), while south of 50° N more intense deoxygenation dominates (<15 mol m−2 per decade).
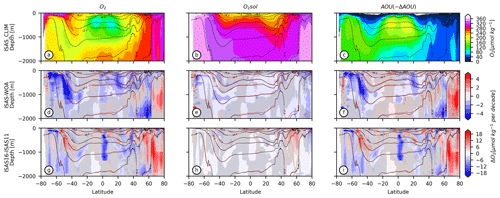
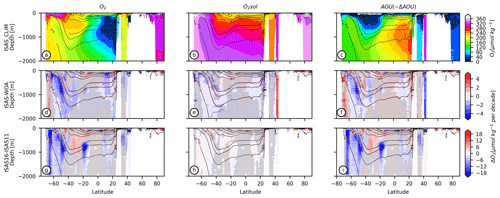
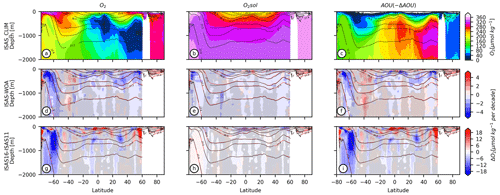
The processes generally invoked to explain the global deoxygenation are the decrease in seawater solubility ([O]) directly induced by the ocean warming and reduced ocean ventilation combined with increased biological utilization. These last two processes reflect an increase in the AOU (a proxy of the water-mass age). Zonally averaged sections of DO concentration [O] and AOU together with their temporal changes are used to better illustrate and understand interannual and long-term DO variabilities and their driving mechanisms (Figs. 10 and 11–14). Long-term regional deoxygenation (Fig. 10d) mainly occurs in the Southern Ocean and Northern Hemisphere in the upper 1500 m, except at subpolar northern latitudes (45–60° N), where it reaches down to 2000 m depth (not enough deeper Argo DO data are available; Fig. 10a, d) with an average trend of around 2 µmol kg−1 per decade. This is mainly explained by deoxygenation in North Atlantic Deep Water (NADW) in the Atlantic basin (Fig. 11a, d). In contrast, the water column in the Nordic Seas (>60° N) has oxygenated, mainly below 1000 m depth (Figs. 10d and 11d). The Southern Ocean has generally deoxygenated between the lower Antarctic Intermediate Water and the Upper Circumpolar Deep Water (σθ∼ 27.2–27.8 kg m−3, ∼ 2 µmol m−2 per decade; Fig. 10a, d). In contrast, deepening of the isopycnals of the well-ventilated Subantarctic Mode Water (SAMW) indicates a volume increase in the water masses, albeit with no significant DO increase (Fig. 10a, d). Between 20° S and 20° N, the tropical band exhibits slight deoxygenation in the upper 1000 m (1 µmol kg−1 per decade). The tropical and equatorial deoxygenation, mainly observed in the east of the Atlantic, Pacific and northern Indian basins, is consistent with the observed decadal increase in OMZ volume (Stramma et al., 2008; Figs. 10a, b and 11–13a, d).
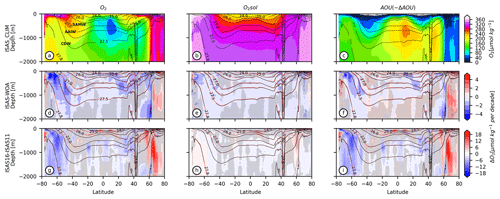
Figure 10Global zonal average section (ISASO2_MEAN) (a) DO, (b) oxygen saturation and (c) Apparent Oxygen Utilization (AOU) (µmol kg−1). ISASO2_CLIM-WOA18 (d) DO difference, (e) oxygen saturation difference and (f) AOU difference. ISAS_M16-ISAS_M11 (g) dissolved oxygen difference, (h) oxygen saturation difference and (g) AOU difference. Black (red) contours correspond to the recent (older) climatological isopycnals (potential density, kg m−3). The grey shading indicates when equivalent trends are smaller than uncertainties.
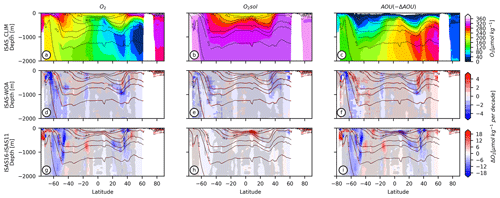
The change observed in the last decade reveals that the interannual-to-decadal variability can be twice as large as the long-term trend in some specific regions (Fig. 11). As an exception, over the Argo period, the Northern Hemisphere north of 40° N exhibits an oxygenation signal (>5 µmol m−2 per decade; Fig. 10g) that contrasts with the long-term mean, especially in the North Atlantic Subpolar Gyre down to 1500 m (>10 µmol kg−1 per decade; Fig. 11g). In the Southern Hemisphere there are differences between ocean basins. In the Indo-Pacific basins (Figs. 12g and 13g), in the Argo period, deoxygenation is more intense and deeper than in the pre-Argo period. In particular, the DO loss within the Upper Circumpolar Deep Water (around σθ=27.5 kg m−3) exceeds 8 µmol kg−1 per decade (Figs. 10g and 11–14g). In contrast, the Atlantic basin exhibits a smaller oxygen loss or even an oxygen gain over the upper 1000 m and slightly more intense deoxygenation between 1000 and 2000 m (Fig. 11d, g).
Over the recent (long-term) period, solubility contributed ∼ 30 % (50 %) of the global deoxygenation in the upper 2000 m of the water column (Fig. 10e, h). Over both periods, the regional (de)oxygenation appears to be mainly driven by AOU-related processes (Figs. 10f and i and 12–14f and i). AOU changes are also dominant over shorter timescales, as they explain the DO change patterns in most regions and depth ranges (Figs. 10i and 12–14i). Four main AOU patterns show up in Fig. 10f and i (and Figs. 11–14f and i): (i) AOU increase in the Southern Ocean below the intermediate waters (σθ≥27.5 kg m−3); (ii) AOU increase in the tropical band of the three oceanic basins (Figs. 10f, i and 11–14f, i); (iii) AOU increase (decrease) in the surface to subsurface waters over the long-term period (Argo period) in the North Atlantic Subpolar Gyre and North Pacific (Figs. 11, 12f, i); and (iv) AOU decrease north of 70° N in the Nordic Seas around 1000 m depth (Fig. 11f).
The data described in this paper can be accessed from SEANOE at https://doi.org/10.17882/52367 (Kolodziejczyk et al., 2023). The Argo data are freely available at https://doi.org/10.17882/42182 (Argo, 2000). The ISAS T, S and O2 fields are freely available from Kolodziejczyk et al. (2023). The WOA18 and WOD18 fields are freely available at https://www.ncei.noaa.gov/archive/accession/NCEI-WOA18 (Boyer et al., 2018) and https://www.ncei.noaa.gov/archive/accession/NCEI-WOD (Boyer et al., 2016), respectively.
The updated ISASO2 climatologies, with DMQC Argo DO profiles, provide new insight into the recent change in global and regional patterns of DO in the context of global ocean deoxygenation. First, comparing the ISASO2 Argo fields with the WOA18 built from the DO bottle sample fields extracted from WOD18, i.e., the most reliable historical dataset, the broad tendency toward global ocean deoxygenation remains robust in the upper 2000 m, with −451 ± 243 Tmol per decade between 1980 and 2013. In spite of a large range of values and no common time and space coverage over the estimated values, our results are in line with previous studies. Using WOCE data, Helm et al. (2011) found −550 ± 25 Tmol per decade within the 100–1000 m surface layer between 1970 and 1990. Schmidko et al. (2017) found a trend of −961 ± 429 Tmol per decade in the full water column between 1960 and 2015. Ito et al. (2017) reported DO trends of −243 ± 124 Tmol per decade in the upper 1000 m between 1958 and 2015. In spite of the different methods to estimate uncertainty in the literature, the relative magnitude of uncertainty estimates of global trends is also generally in line with that of previous studies.
In order to map the regional DO concentration, ISASO2 takes advantage of the new Argo DO data, which allow several sampling biases in the previous mapping such as in Schmidtko et al. (2017) to be resolved. First, Argo DO has provided a significant amount of data in the Southern Hemisphere that were unavailable in the historical conductivity–temperature–depth (CTD) dataset used in Schmidko et al. (2017). Second, historical CTD measurements have been carried out during summer, with Argo data for the seasonal cycle of DO in the sampled regions having been resolved for the first time and providing a better constraint on DO uncertainties (Fig. 5).
The GOBAI-O2 products (Sharp et al., 2023) were generated using T, S and O2 Argo data and an AI algorithm to interpolate and extrapolate O2 data over the full Argo period. The advantage of this approach is in providing longer time series and extrapolated profiles in poorly sampled regions. However, the uncertainties associated with machine learning interpolation remain high and need larger amounts of data to reduce them (Sharp et al., 2023). Here, with ISASO2, we choose a conventional OI approach that relies on a few a priori hypotheses. Future deployment of Argo DO floats will help to improve sampling and the robustness of our estimates.
Although Argo DO coverage is still partial in some regions, some contrasted regional patterns between the pre-Argo and Argo periods are emerging from the updated dataset. For instance, the historically badly sampled Southern Ocean shows clear deoxygenation over at least the last 2 decades. Moreover, consistent sampling over the Argo period has allowed us to provide pentadal-to-decadal means for these regions. Although the deoxygenation tendency seems globally amplified (−1211 ± 218 Tmol per decade), we cannot argue for an acceleration of deoxygenation over the Argo period. Rather, the global inventory may be sensitive to very large regional and interannual variability, as suggested by our map and sections of interannual change. It should be noted that the DO inventory over the full water column includes the euphotic zone, which may be highly variable in DO, and part of the variability at depth (below 2000 m) is overlooked during the Argo period. However, as reported in recent studies (Stramma et al., 2020; Stramma and Schmitdko, 2021; Feucher et al., 2022; Tjputra et al., 2018), natural modes of variability are known to strongly impact the ocean DO change at the regional scale. The Argo DO standard deviation and trend estimates shown here reveal for the first time the very inhomogeneous and intense DO variability over the ocean. This may help to quantify the range of uncertainty induced by natural or interannual variability over the longer-term deoxygenation trends.
Noticeable oxygenation patterns are observed in the deep Nordic Seas, especially north of 70° N in the Greenland Sea. Since the late 1990s, deeper convection has been reported in the Greenland Sea (1500 m depth), while the temperature of intermediate water has increased (Brakstad et al., 2019). The latter is compatible with the observed continuous decrease in oxygen solubility. However, deeper convection contributes to replenishing DO at depth, making the intermediate water younger (decreasing AOU) and then overcoming the solubility decrease (Lauvset et al., 2018). Interestingly, besides the strong interannual variability, long-term DO decreases in the North Atlantic, while DO increases in the deep Greenland Sea.
The Southern Ocean, which historically has been less consistently sampled, also reveals the high deoxygenation that has been reported near the Antarctic continent. The input of meltwater in Antarctica and the poleward wind shift in the Southern Ocean have been suspected of being responsible for increasing stratification. The latter would reduce ventilation and water-mass age (AOU) near the continent and within Circumpolar Deep Water, with a potentially strong impact on biological productivity (Bronselaer et al., 2018, 2020). Interestingly, SAMW, which is a hotspot of DO ventilation (Portela et al., 2020b), does not show any significant change over the long term in spite of its volume increase during recent decades (Kolodziejczyk et al., 2019; Portela et al., 2020a). In contrast, over the Argo period, strong variability of deoxygenation or oxygenation patterns is reported around the Southern Ocean, with oxygenation of the mode or intermediate waters during the last decade and deoxygenation of Circumpolar Deep Water.
Our study is mainly based on the historical bottle samples (OSD WOA18) and the recent Argo DO dataset (ISASO2). Excluding other oxygen profiles over the historical period may cause less-resolved historical time series and spatial coverage, especially in poorly sampled regions like the Southern Ocean. This may increase the uncertainties in trend computation: as is well known, the lack of data coverage may result in underestimation of the global trends computed from parameters analyzed with OI methods (Lymann and Johnson, 2014). However, continuous sampling of the Argo network helps to remove the seasonal bias usually associated with historical cruises that mainly occur during summer. This also allows better estimates of the natural DO seasonal-to-interannual SD, which is crucial for computing the range of uncertainties, even if the DO eddy variance contribution still has to be estimated (Atkins et al., 2022).
A major source of uncertainty in the Argo DO data in this study is the calibration of the DO profiles, which can exhibit a remaining low oxygen bias larger than 1 to 3 µmol kg−1 that could be due to an uncorrected sensor time response (Bittig et al., 2014; Maurer et al., 2021; Sharp et al., 2023). Continuous monitoring and progress in the Argo DO time response and drift correction are mandatory for ensuring quality and consistency among DO datasets of different origins. Regarding the historical OSD data, the accuracy of the Winkler titration method is generally ±0.3 µmol kg−1 (Carpenter, 1965). However, larger uncertainties are expected due to changes in the sampling and titration methods over the last century. Nevertheless, the still sparse DO data are probably the main source of uncertainty, especially when using the ISAS_M11 and ISAS_M16 configurations that present the most limited Argo coverage of the 5-year windows. Also, we hope that the ongoing deployment of global Argo DO observations will help to update the ISASO2 analysis in order to provide global DO fields with better spatial coverage and enhanced time discretization.
Therefore, long-term observations and consistent spatial coverage of the ocean DO, combined with other pressure–temperature–salinity (P–T–S) and BGC parameters in the framework of OneArgo, will provide further insight into the regional mechanisms of ocean deoxygenation, such as thermodynamic and chemical drivers of biological consumption (e.g., Hoffman et al., 2011; Brewer et al., 2014; Brewer and Peltzer, 2017). Moreover, this will finally shed some light on their still poorly known oxygen biological drivers (Levin et al., 2018; Oschlies et al., 2018).
NK developed the methodology and workflow. NK wrote the original draft. Review and editing of the final draft was conducted by EP, VT and AP. AP developed the software and data curation with NK.
The contact author has declared that none of the authors has any competing interests.
Publisher’s note: Copernicus Publications remains neutral with regard to jurisdictional claims made in the text, published maps, institutional affiliations, or any other geographical representation in this paper. While Copernicus Publications makes every effort to include appropriate place names, the final responsibility lies with the authors.
The ISAS tools are developed and made freely available by the CNRS/INSU Service National d'Observation Argo France (https://www.argo-france.fr/, last access: 29 October 2024) at the LOPS laboratory and at OSU IUEM (University of Brest). This work has received the support of the French government within the framework of the Investissements d'avenir program integrated into France 2030 and managed by the Agence Nationale de la Recherche (ANR) under the reference no. ANR-21-ESRE-0019. Esther Portela has been funded by the Natural Environment Research Council through grant no. NE/W00755X/1. The Argo data were collected and made freely available by the international Argo program and the national programs that contribute to it. The Argo program is part of the Global Ocean Observing System.
This research has been supported by the French Agence Nationale pour la Recherche (grant no : ANR-21-ESRE-0019).
This paper was edited by Sebastiaan van de Velde and reviewed by two anonymous referees.
Argo: Argo float data and metadata from Global Data Assembly Centre (Argo GDAC), SEANOE [data set], https://doi.org/10.17882/42182, 2000.
Atkins, J., Andrews, O., and Frenger, I.: Quantifying the Contribution of Ocean Mesoscale Eddies to Low Oxygen Extreme Events, Geophys. Res. Lett., 49, e2022GL098672, https://doi.org/10.1029/2022GL098672, 2022.
Barnes, S. L.: A Technique for Maximizing Details in Numerical Weather Map Analysis, J. Appl. Meteorol. Clim., 3, 396–409, https://doi.org/10.1175/1520-0450(1964)003<0396:ATFMDI>2.0.CO;2, 1964.
Billheimer, S. J., Talley, L. D., and Martz, T. R.: Oxygen Seasonality, Utilization Rate, and Impacts of Vertical Mixing in the Eighteen Degree Water Region of the Sargasso Sea as Observed by Profiling Biogeochemical Floats, Global Biogeochem. Cy., 35, e2020GB006824, https://doi.org/10.1029/2020GB006824, 2021.
Bittig, H. C., Fiedler, B., Scholz, R., Krahmann, G., and Körtzinger, A.: Time response of oxygen optodes on profiling platforms and its dependence on flow speed and temperature, Limnol. Oceanogr.-Meth., 12, 617–636, https://doi.org/10.4319/lom.2014.12.617, 2014.
Bittig, H. C. and Körtzinger, A.: Technical note: Update on response times, in-air measurements, and in situ drift for oxygen optodes on profiling platforms, Ocean Sci., 13, 1–11, https://doi.org/10.5194/os-13-1-2017, 2017.
Bittig, H. C., Körtzinger, A., Neill, C., van Ooijen, E., Plant, J. N., Hahn, J., Johnson, K. S., Yang, B., and Emerson, S. R.: Emerson6: Oxygen optode sensors: principle, characterization, calibration, and application in the ocean, Front. Mar. Sci., 4, 429, https://doi.org/10.3389/fmars.2017.00429, 2018.
Bittig, H., Maurer, T., Plant, J., Schmechtig, C., Wong, A., Claustre, H., Trull, T. W., Udaya, B. T. V. S., Boss, E., Dall’Olmo, G., Organelli, E., Poteau, A., Johnson, K. S., Hanstein, C., Leymarie, E., Le Reste, S., Riser, S. C., Rupan, A. R., Taillandier, V., Thierry, V., and Xing, X.: A BGC-argo guide: planning, deployment, data handling and usage, Front. Mar. Sci., 6, 502, https://doi.org/10.3389/fmars.2019.00502, 2019.
Bopp, L., Resplandy, L., Orr, J. C., Doney, S. C., Dunne, J. P., Gehlen, M., Halloran, P., Heinze, C., Ilyina, T., Séférian, R., Tjiputra, J., and Vichi, M.: Multiple stressors of ocean ecosystems in the 21st century: projections with CMIP5 models, Biogeosciences, 10, 6225–6245, https://doi.org/10.5194/bg-10-6225-2013, 2013.
Boyer, T. P., Antonov, J. I., Baranova, O. K., Coleman, C., García, H. E., Grodsky, A., Johnson, D. R., Locarnini, R. A., Mishonov, A. V., O'Brien, T. D., Paver, C. R., Reagan, J. R., Seidov, D., Smolyar, I. V., and Zweng, M. M.: NCEI Standard Product: World Ocean Database (WOD), NOAA National Centers for Environmental Information [data set], https://www.ncei.noaa.gov/archive/accession/NCEI-WOD (last access: 20 October 2024), 2016.
Boyer, T. P., Garcia, H. E., Locarnini, R. A., Zweng, M. M., Mishonov, A. V., Reagan, J. R., Weathers, K. A., Baranova, O. K., Seidov, D., and Smolyar, I. V.: World Ocean Atlas 2018, NOAA National Centers for Environmental Information [data set], https://www.ncei.noaa.gov/archive/accession/NCEI-WOA18 (last access: 20 October 2024), 2018.
Brakstad, A., Våge, K., Håvik, L., and MOORE, G. W. K.: Water mass transformation in the Greenland sea during the period 1986–2016, J. Phys. Oceanogr., 49, 121–140, https://doi.org/10.1175/JPO-D-17-0273.1, 2019.
Bretherton, F. P., Davis, R. E., and Fandry, C. B.: A technique for objective analysis and design of oceanographic experiments applied to MODE-73, Deep-Sea Res. Ocean. Abstr., 23, 559–582, https://doi.org/10.1016/0011-7471(76)90001-2, 1976.
Brewer, P. G. and Peltzer, E. T.: Depth perception: the need to report ocean biogeochemical rates as functions of temperature, not depth, Philos. T. Roy. Soc. A, 375, 2102, https://doi.org/10.1098/rsta.2016.0319, 2017.
Brewer, P. G., Hofmann, A. F., Peltzer, E. T., and Ussler III, W.: Evaluating microbial chemical choices: The ocean chemistry basis for the competition between use of O2 or NO as an electron acceptor, Deep-Sea Res. Pt. I, 87, 35–42, https://doi.org/10.1016/j.dsr.2014.02.002, 2014.
Bronselaer, B., Winton, M., Griffies, S. M., Hurlin, W. J., Rodgers, K. B., Sergienko, O. V., Stouffer, R. J., and Russell, J. L.: Change in future climate due to Antarctic meltwater, Nature, 564, 53–58, https://doi.org/10.1038/s41586-018-0712-z, 2018.
Bronselaer, B., Russell, J. L., Winton, M., Williams, N. L., Key, R. M., Dunne, J. P., Feely, R. A., Johnson, K. S., and Sarmiento, J. L.: Importance of wind and meltwater for observed chemical and physical changes in the Southern Ocean, Nat. Geosci., 13, 35–42, https://doi.org/10.1038/s41561-019-0502-8, 2020.
Carpenter, J. H.: The Chesapeake Bay Institute technique for the Winkler dissolved oxygen titration, Limnol. Oceanogr., 10, 141–143, 1965.
Chapman, C. C., Lea, M. A., Meyer, A., Sallée, J.-B., and Hindell, M.: Defining Southern Ocean fronts and their influence on biological and physical processes in a changing climate, Nat. Clim. Change, 10, 209–219, https://doi.org/10.1038/s41558-020-0705-4, 2020.
Claustre, H., Johnson, K. S., and Takeshita, Y.: Observing the Global Ocean with Biogeochemical-Argo, Annu. Rev. Mar. Sci., 3, 23–48, https://doi.org/10.1146/annurev-marine-010419-010956, 2020.
Couespel, D., Lévy, M., and Bopp, L.: Major Contribution of Reduced Upper Ocean Oxygen Mixing to Global Ocean Deoxygenation in an Earth System Model, Geophys. Res. Lett., 46, 12239–12249, https://doi.org/10.1029/2019GL084162, 2019.
Feucher, C., Portela, E., Kolodziejczyk, N., and Thierry, V.: Subpolar gyre decadal variability explains the recent oxygenation in the Irminger Sea, Communications Earth & Environment, 3, 279, https://doi.org/10.1038/s43247-022-00570-y, 2022.
Gnaigner, E. and Forstner, H. (Eds.): Polarographic Oxygen Sensors: Aquatic and Physiological Applications, Springer-Verlag, 370 pp., https://doi.org/10.1007/978-3-642-81863-9, 1983.
Gaillard, F., Autret, E., Thierry, V., Galaup, P., Coatanoan, C., and Loubrieu, T.: Quality Control of Large Argo Datasets, J. Atmos. Ocean. Tech., 26, 337–351, https://doi.org/10.1175/2008JTECHO552.1, 2009.
Gaillard, F., Reynaud, T., Thierry, V., Kolodziejczyk, N., and Von Schuckmann, K.: In situ-based reanalysis of the global ocean temperature and salinity with ISAS: Variability of the heat content and steric height, J. Climate, 29, 1305–1323, https://doi.org/10.1175/JCLI-D-15-0028.1, 2016.
Garcia, H. E., Weathers, K., Paver, C. R., Smolyar, I., Boyer, T. P., Locarnini, R. A., Zweng, M. M., Mishonov, A. V., Baranova, O. K., Seidov, D., and Reagan, J. R.: World Ocean Atlas 2018, Volume 3: Dissolved Oxygen, Apparent Oxygen Utilization, and Oxygen Saturation, Technical editor: Mishonov, A., NOAA Atlas NESDIS 83, 38 pp., https://www.ncei.noaa.gov/sites/default/files/2020-04/woa18_vol3.pdf (last access: 7 November 2024), 2019.
Gnaiger, E. and Forstner, H. (Eds.) Polarographic Oxygen Sensors, Aquatic and Physiological Applications, Springer, Berlin, Heidelberg, New York, 370 pp., https://doi.org/10.1007/978-3-642-81863-9, 1983.
Gordon, C., Fennel, K., Richards, C., Shay, L. K., and Brewster, J. K.: Can ocean community production and respiration be determined by measuring high-frequency oxygen profiles from autonomous floats?, Biogeosciences, 17, 4119–4134, https://doi.org/10.5194/bg-17-4119-2020, 2020.
Hahn, J., Brandt, P., Schmidtko, S., and Krahmann, G.: Decadal oxygen change in the eastern tropical North Atlantic, Ocean Sci., 13, 551–576, https://doi.org/10.5194/os-13-551-2017, 2017.
Helm, K. P., Bindoff, N. L., and Church, J. A.: Observed decreases in oxygen content of the global ocean, Geophys. Res. Lett., 38, L23602, https://doi.org/10.1029/2011GL049513, 2011.
Hofmann, A. F., Peltzer, E. T., Walz, P. M., and Brewer, P. G.: Hypoxia by degrees: Establishing definitions for a changing ocean, Deep-Sea Res. Pt. I, 58, 1212–1226, https://doi.org/10.1016/j.dsr.2011.09.004, 2011.
IPCC: Climate Change 2021: The Physical Science Basis. Contribution of Working Group I to the Sixth Assessment Report of the Intergovernmental Panel on Climate Change, edited by: Masson-Delmotte, V., Zhai, P., Pirani, A., Connors, S. L., Péan, C., Berger, S., Caud, N., Chen, Y., Goldfarb, L., Gomis, M. I., Huang, M., Leitzell, K., Lonnoy, E., Matthews, J. B. R., Maycock, T. K., Waterfield, T., Yelekçi, O., Yu, R., and Zhou, B., Cambridge University Press, Cambridge, United Kingdom and New York, NY, USA, https://doi.org/10.1017/9781009157896, 2021.
Ito, T., Minobe, S., Long, M. C., and Deutsch, C.: Upper Ocean O2 trends: 1955–2015, Geophys. Res. Lett., 4214–4223, https://doi.org/10.1002/2017GL073613, 2017.
Karstensen, J., Stramma, L., and Visbeck, M.: Oxygen minimum zones in the eastern tropical Atlantic and Pacific oceans, Prog. Oceanogr., 77, 331–350, https://doi.org/10.1016/j.pocean.2007.05.009, 2008.
Keeling, R. F., Körtzinger, A., and Gruber, N: Ocean deoxygenation in a warming world, Annu. Rev. Mar. Sci., 2, 199–229, https://doi.org/10.1146/annurev.marine.010908.163855, 2010.
Kolodziejczyk, N., Llovel, W., and Portela, E.: Interannual variability of upper ocean water masses as inferred from Argo Array, J. Geophys. Res.-Oceans, 124, 6067–6085, https://doi.org/10.1029/2018JC014866, 2019.
Kolodziejczyk N., Prigent-Mazella A., and Gaillard F.: ISAS temperature and salinity gridded fields, SEANOE [data set], https://doi.org/10.17882/52367, 2021.
Lakowicz, J. R. (Ed.): Quenching of Fluorescence, in: Principles of Fluorescence Spectroscopy, Springer, Boston, MA, https://doi.org/10.1007/978-0-387-46312-4_8, 2006.
Lauvset, S. K., Brakstad, A., Våge, K., Olsen, A., Jeansson, E., and Mork, K. A.: Continued warming, salinification and oxygenation of the Greenland Sea gyre, Tellus A, 70, 1476434, https://doi.org/10.1080/16000870.2018.1476434, 2018.
Levin, L. A.: Manifestation, drivers, and emergence of open ocean deoxygenation, Annu. Rev. Mar. Sci., 10, 229–260, https://doi.org/10.1146/annurev-marine-121916-063359, 2018.
Li, G., Cheng, L., Zhu, J., Trenberth, K. E., Mann, M. E., and Abraham, J. P.: Increasing ocean stratification over the past half-century, Nat. Clim. Change, 10, 1116–1123, https://doi.org/10.1038/s41558-020-00918-2, 2020.
Lyman, J. M. and Johnson, G. C.: Estimating global ocean heat content changes in the upper 1800 m since 1950 and the influence of climatology choice, J. Climate, 27, 1945–1957, 2014.
Maurer, T. L., Plant, J. N., and Johnson, K. S.: Delayed-Mode Quality Control of Oxygen, Nitrate, and pH Data on SOCCOM Biogeochemical Profiling Floats, Front. Mar. Sci., 8, 683207, https://doi.org/10.3389/fmars.2021.683207, 2021.
Oschlies, A., Brandt, P., Stramma, L., and Schmidtko, S.: Drivers and mechanisms of ocean deoxygenation, Nat. Geosci., 11, 467–473, https://doi.org/10.1038/s41561-018-0152-2, 2018.
Paulmier, A. and Ruiz-Pino, D.: Oxygen minimum zones (OMZs) in the modern ocean, Prog. Oceanogr., 80, 113–128, 2009.
Portela, E., Kolodziejczyk, N., Vic, C., and Thierry, V.: Physical Mechanisms Driving Oxygen Subduction in the Global Ocean, Geophys. Res. Lett., 47, e2020GL089040, https://doi.org/10.1029/2020GL089040, 2020.
Racapé, V., Thierry, V., Mercier, H., and Cabanes, C.: ISOW spreading and mixing as revealed by Deep-Argo floats launched in the Charlie Gibbs Fracture Zone, J. Geophys. Res.-Oceans, 124, 6787–6808, https://doi.org/10.1029/2019JC015040, 2019.
Roemmich, D., Alford, M. H., Claustre, H., Johnson, K., King, B., Moum, J., Oke, P., Owens, W. B., Pouliquen, S., Purkey, S., Scanderbeg, M., Suga, T., Wijffels, S., Zilberman, N., Bakker, D., Baringer, M., Belbeoch, M., Bittig, H. C., Boss, E., Calil, P., Carse, F., Carval, T., Chai, F., Conchubhair, D. Ó., d’Ortenzio, F., Dall’Olmo, G., Desbruyeres, D., Fennel, K., Fer, I., Ferrari, R., Forget, G., Freeland, H., Fujiki, T., Gehlen, M., Greenan, B., Hallberg, R., Hibiya, T., Hosoda, S., Jayne, S., Jochum, M., Johnson, G. C., Kang, K., Kolodziejczyk, N., Körtzinger, A., L. Traon, P.-Y., Lenn, Y.-D., Maze, G., Mork, K. A., Morris, T., Nagai, T., Nash, J., Garabato, A. N., Olsen, A., Pattabhi, R. R., Prakash, S., Riser, S., Schmechtig, C., Schmid, C., Shroyer, E., Sterl, A., Sutton, P., Talley, L., Tanhua, T., Thierry, V., Thomalla, S., Toole, J., Troisi, A., Trull, T. W., Turton, J., Velez-Belchi, P. J., Walczowski, W., Wang, H., Wanninkhof, R., Waterhouse, A. F., Waterman, S., Watson, A., Wilson, C., Wong, A. P. S., Xu, J., and Yasuda, I.: On the future of Argo: A global, full-depth, multi-disciplinary array, Front. Mar. Sci., 6, 1–28, https://doi.org/10.3389/fmars.2019.00439, 2019.
Sallée, J. B., Pellichero, V., Akhoudas, C., Pauthenet, E., Vignes, L., Schmidtko, S., Garabato, A. N., Sutherland, P., and Kuusela, M.: Summertime increases in upper-ocean stratification and mixed-layer depth, Nature, 591, 592–598, https://doi.org/10.1038/s41586-021-03303-x, 2021.
Schmidtko, S., Stramma, L., and Visbeck, M.: Decline in global oceanic oxygen content during the past five decades, Nature, 542, 335–339, https://doi.org/10.1038/nature21399, 2017.
Sharp, J. D., Fassbender, A. J., Carter, B. R., Johnson, G. C., Schultz, C., and Dunne, J. P.: GOBAI-O2: temporally and spatially resolved fields of ocean interior dissolved oxygen over nearly 2 decades, Earth Syst. Sci. Data, 15, 4481–4518, https://doi.org/10.5194/essd-15-4481-2023, 2023.
Smith, T. M., Reynolds, R. W., and Ropelewski, C. F.: Optimal Averaging of Seasonal Sea Surface Temperatures and Associated Confidence Intervals (1860–1989), J. Climate, 7, 949–964, https://doi.org/10.1175/1520-0442(1994)007<0949:OAOSSS>2.0.CO;2, 1994.
Sperling, E. A., Frieder, C. A., and Levin, L. A.: Biodiversity response to natural gradients of multiple stressors on continental margins, Proc. R. Soc. B, 283, 20160637, https://doi.org/10.1098/rspb.2016.0637, 2016.
Stendardo, I. and Gruber, N.: Oxygen trends over five decades in the North Atlantic, J. Geophys. Res.-Oceans, 117, C11004, https://doi.org/10.1029/2012JC007909, 2012.
Stramma, L. and Schmidtko, S.: Spatial and Temporal Variability of Oceanic Oxygen Changes and Underlying Trends, Atmos.-Ocean, 59, 122–132, https://doi.org/10.1080/07055900.2021.1905601, 2021.
Stramma, L., Brandt, P., Schafstall, J., Schott, F., Fischer, J., and Körtzinger, A.: Oxygen minimum zone in the North Atlantic south and east of the Cape Verde Islands, J. Geophys. Res.-Oceans, 113, C04014, https://doi.org/10.1029/2007JC004369, 2008.
Stramma, L., Prince, E. D., Schmidtko, S., Luo, J., Hoolihan, J. P., Visbeck, M., Wallace, D. W. R., Brandt, P., and Körtzinger, A.: Expansion of oxygen minimum zones may reduce available habitat for tropical pelagic fishes, Nat. Clim. Change, 2, 33–37, https://doi.org/10.1038/nclimate1304, 2012.
Stramma, L., Schmidtko, S., Bograd, S. J., Ono, T., Ross, T., Sasano, D., and Whitney, F. A.: Trends and decadal oscillations of oxygen and nutrients at 50 to 300 m depth in the equatorial and North Pacific, Biogeosciences, 17, 813–831, https://doi.org/10.5194/bg-17-813-2020, 2020.
Thierry, V. and Bittig, H.: The Argo-Bgc Team: Argo quality control manual for dissolved oxygen concentration, https://doi.org/10.13155/46542, 2021
Thierry, V., Bittig, H., Gilbert, D., Kobayashi, T., Kanako, S., and Schmid, C.: Processing Argo oxygen data at the DAC level, https://doi.org/10.13155/39795, 2022.
Tjiputra, J. F., Goris, N., Lauvset, S. K., Heinze, C., Olsen, A., Schwinger, J., and Steinfeldt, R.: Mechanisms and Early Detections of Multidecadal Oxygen Changes in the Interior Subpolar North Atlantic, Geophys. Res. Lett., 45, 4218–4229, https://doi.org/10.1029/2018GL077096, 2018.
von Schuckmann, K., Gaillard, F., and Le Traon, P.-Y.: Global hydrographic variability patterns during 2003–2008, J. Geophys. Res., 114, C09007, https://doi.org/10.1029/2008JC005237, 2009.
Yamaguchi, R. and Suga, T.: Trend and Variability in Global Upper-Ocean Stratification Since the 1960s, J. Geophys. Res.-Oceans, 124, 8933–8948, https://doi.org/10.1029/2019JC015439, 2019.


