the Creative Commons Attribution 4.0 License.
the Creative Commons Attribution 4.0 License.
Global mapping of oil palm planting year from 1990 to 2021
David L. A. Gaveau
Serge Wich
Zoltan Szantoi
Erik Meijaard
Oil palm is a controversial crop, primarily because it is associated with negative environmental impacts such as tropical deforestation. Mapping the crop and its characteristics, such as age, is crucial for informing public and policy discussions regarding these impacts. Oil palm has received substantial mapping efforts, but accurate and up-to-date oil palm maps of both extent and age are essential for monitoring impacts and informing concomitant debate. Here, we present a 10 m resolution global map of industrial and smallholder oil palm, developed using Sentinel-1 data for the years 2016–2021 and a deep learning model based on convolutional neural networks. In addition, we used Landsat-5, Landsat-7, and Landsat-8 to estimate the planting year from 1990 to 2021 at a 30 m spatial resolution. The planting year indicates the year of establishment of the current (as of 2021) oil palm plantation by means of either newly planted or replanted oil palm in an existing oil palm plantation. We validated the oil palm extent layer using 18 812 randomly distributed reference points. The accuracy of the planting-year layer was assessed using field data collected from 5831 industrial parcels and 1012 smallholder plantations distributed throughout the global oil palm growing area. We found oil palm plantations covering a total mapped area of 23.98 Mha, and our area estimates are 16.82 ± 0.19 Mha of industrial oil palm and 7.37 ± 0.25 Mha of smallholder oil palm worldwide. The producer's and user's accuracy are 91.0 ± 2.5 % and 91.8 ± 1.2 % for industrial plantations and 71.4 ± 0.7 % and 72.4 ± 1.8 % for smallholders; these values represent an improvement compared to a previous global oil palm dataset, particularly in terms of omission of oil palm. The overall mean error between the estimated planting year and the field data was −0.24 years, and the root-mean-square error was 2.65 years, but the agreement was lower for smallholders. Mapping the extent and planting year of smallholder plantations remains challenging, particularly for wild and sparsely planted oil palm, and future mapping efforts should focus on these specific types of plantations. The average oil palm plantation age was 14.1 years, and the area of oil palm over 20 years old was 6.28 Mha. Given that oil palm plantations are typically replanted after 25 years, our findings indicate that this area will require replanting within the coming decade, starting from 2021. Our dataset provides valuable input for optimal land use planning to meet the growing global demand for vegetable oils. The global oil palm extent layer for the year 2021 and the planting-year layer from 1990 to 2021 can be found at https://doi.org/10.5281/zenodo.13379129 (Descals, 2024a).
Vegetable oil crops cover around 543 ×106 ha (Mha), accounting for roughly 37 % of the total land area dedicated to agricultural crop production across the globe (Meijaard et al., 2024). In other words, oil crops are a major agricultural land use, and the expansion of land allocated to vegetable oil crops has outpaced that of other commodities. Among oil crops, oil palm produces the most oil in terms of total volume but on a relatively small area of land, equating to 29.62 Mha in 2021 (FAO, 2022) or about one-quarter of the land area allocated to soybean, the second-most productive oil crop in total volume (Meijaard et al., 2024). Oil palm, however, is a tropical crop, and its expansion over the past decades has resulted in the loss of tropical forest and associated high biological diversity (Meijaard et al., 2020). For example, oil palm replaced > 4 Mha of primary forest from 2001 to 2022 in Indonesia and Malaysia, the world's largest producers (Gaveau et al., 2022). There has been much debate, often emotive and polarized, about the extent to which oil palm has contributed to deforestation and the loss of threatened wildlife (Candellone et al., 2023; Teng et al., 2020). Up-to-date information about oil palm planting locations is necessary to inform this debate and to clarify the extent of global deforestation caused by oil palm, which remains unknown.
In addition to identifying where oil palm was planted, knowing the year of planting is also important. The planting year allows for the estimation of the oil palm age, which is a factor that determines the palm's productivity (Corley and Tinker, 2008). Oil palm plantations are often cleared after 25 years and the land is replanted with young palms because productivity declines after that age (Ismail and Mamat, 2002). Furthermore, plantation age allows for the estimation of dendrometric variables such as biomass and height using allometric equations. Biomass and height are important for calculating the carbon stock and management costs of the plantation (Corley and Tinker, 2008; Tan et al., 2014). The clearing of older oil palms and their replacement with new ones entail both positive and negative impacts; it is expensive, has social implications (Fosch et al., 2023), can increase yield through better planting material, reduces ecological connectivity in a landscape (Ashton-Butt et al., 2019), and also offers opportunities for restoration interventions (Wenzel et al., 2024). Thus, knowing the global extent and planting year of oil palm is valuable, and remote sensing serves as an important tool for obtaining this information.
Satellite remote sensing offers the capability of mapping both the extent and timing of oil palm development. Synthetic aperture radar (SAR) has been very useful for mapping the extent of oil palm because of the distinctive backscatter response of palm-like canopies (Miettinen and Liew, 2011). This characteristic backscatter response in SAR data has enabled the mapping of the global extent of closed-canopy oil palm stands using Sentinel-1 (Descals et al., 2021). To estimate the year of oil palm planting, previous studies have used satellite time series from MODIS (Xu et al., 2020) and Landsat (Danylo et al., 2021; Du et al., 2022; Gaveau et al., 2022). Their approach posits that the satellite time series can capture the various stages of oil palm development, particularly the moment when the land is cleared for oil palm planting. Similar studies have estimated the year of tree cover loss (Hansen et al., 2013) and the timing of disturbances in primary forests (Vancutsem et al., 2021) by detecting land cover changes in the Landsat time series. Although the dataset presented in Descals et al. (2021) is the first comprehensive global oil palm layer, its methodology consisted of a single-year classification that largely missed young oil palm and existing plantations that were replanted in previous years. A multi-annual oil palm classification using a longer Sentinel-1 time series can potentially reduce the omission of oil palm and provide a more accurate representation of the global oil palm extent. Furthermore, the layer in Descals et al. (2021) only depicted the extent of oil palm as of 2019 and does not provide information on planting year. Using the Landsat time series, we can estimate the year of oil palm planting, a valuable source of information that can complement the oil palm extent layer.
This study presents a global oil palm extent layer at 10 m resolution and a planting-year layer at 30 m resolution. For the oil palm extent, we extended the 2019 oil palm classification presented in Descals et al. (2021) to the period 2016–2021 using Sentinel-1 data. This classification was based on a convolutional neural network that identified industrial and smallholder plantations. For the year of oil palm planting, we developed a methodology specifically designed to detect the early stages of oil palm development in the Landsat time series from 1990 to 2021.
2.1 Overview
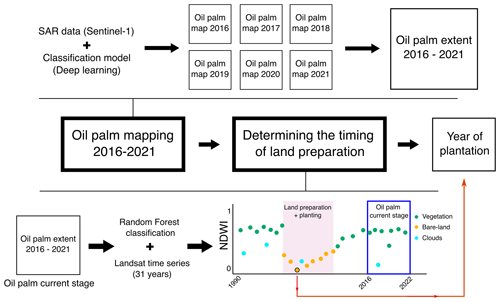
The algorithm used in this study consisted of three parts (Fig. 1). The first part involved mapping the extent of oil palm plantations using a deep learning model that classified Sentinel-1 annual composites. We performed the classification on annual composites from 2016 to 2021 and merged the annual classifications to create a single layer that depicted the oil palm extent. The second step involved estimating the timing of land preparation for oil palm by performing a retrospective analysis of the Landsat time series from 1990 to 2021. This step aimed to detect the images in the Landsat time series that depicted the land preparation for oil palm. In the third step, we determined the planting year of the current oil palm plantation as the date that showed the lowest normalized difference water index (NDWI) value during the land preparation phase.
2.2 Mapping the extent of oil palm
2.2.1 Sentinel-1 compositing
Sentinel-1 is a synthetic aperture radar satellite; it incorporates an active sensor in the C band and provides scenes at a spatial resolution of 10 m and at a revisit time of 6 d (Torres et al., 2012). The compositing approach employed in this study is the same as the one used for the 2019 oil palm layer (Descals et al., 2021). We used the single co-polarization vertical-transmit–vertical-receive band (VV) and the dual-band cross-polarization vertical-transmit–horizontal-receive band (VH) from the ground-range-detected (GRD) product. We corrected the data for the local incident angle. The correction of Sentinel-1 data for the local incident angle uses SRTM digital elevation data (version 4) to reduce terrain-induced variations in radar backscatter. The correction was applied to daily Sentinel-1 scenes. The code for the correction of the local incident angle and the generation of the Sentinel-1 composites can be found in the “Code availability” section (Descals, 2021). The daily Sentinel-1 images were aggregated annually from 2016 to 2021 using the median for ascending and descending orbits separately. Temporal information, such as seasonal variations in spectral backscatter, was not extracted from the Sentinel-1 time series. The final annual composites represent the average of these two orbit composites. Aggregating the orbits separately addresses imbalances in the number of scenes between orbits, which could otherwise introduce potential terrain-induced artefacts if one orbit prevails. Although Sentinel-1 data are available from 2014, systematic full coverage of the oil palm growing area started from 2016. For this reason, we generated the first annual oil palm map for 2016.
2.2.2 Deep learning classification
We used the deep learning model DeepLabv3+ to classify the Sentinel-1 composites into annual oil palm maps for the period 2016–2021. DeepLabv3+ is a supervised classification model for semantic segmentation based on convolutional neural networks (Chen et al., 2017). The convolutional neural network architecture in this study mirrors that of the global oil palm layer for 2019 (Descals et al., 2021); the model underwent training using the same training dataset, comprising 296 training images of 10×10 km. The model predicted three classes: class 0, consisting of other land cover types that are not closed-canopy oil palm; class 1, consisting of closed-canopy industrial oil palm; and class 2, consisting of closed-canopy smallholder oil palm.
In this study, we adopted the definitions of industrial and smallholder oil palm plantations from Descals et al. (2021). Industrial plantations typically span several thousand hectares, with uniform palm age and well-defined, often rectangular boundaries (Fig. A1 in the Appendix). These plantations feature dense networks of roads or canals, designed during the initial development of the plantation to optimize harvesting. On flat terrain, the roads are arranged in a rectilinear grid, while, in hilly areas, they tend to curve. In contrast, smallholder plantations are usually less than 25 ha, though this threshold varies by country. Compared to industrial plantations, smallholder plantations are less organized and have more diverse palm ages, forming a mosaic landscape mixed with other land uses. Large clusters of smallholder plantations have sparser trail networks than industrial ones.
One significant distinction between the 2019 oil palm layer, presented in Descals et al. (2021), and that of this work is the input data used in the deep learning model. For the global oil palm layer of 2019, the classification model used the VV and VH bands from Sentinel-1 GRD as input, as well as the red band (B4) from Sentinel-2 level 2A. Since Sentinel-2 level-2A data were not available for the oil palm growing area before 2019, we excluded Sentinel-2 and used a classification model that only classified Sentinel-1 data. Since the original model required an input image with three channels, we stacked the VV and VH spectral images along with a third image filled with zeros. In this way, we could re-train the existing deep learning model without modifications in its architecture. One potential limitation of using only Sentinel-1 is that the classification model can increase the commission error in other land cover types and, especially, in other palm species, such as coconut and sago palms. The false positives were already apparent in the 2019 global oil palm layer, with previous studies raising concerns about coconut plantations incorrectly classified as oil palm in Indonesia (Danylo et al., 2021; Descals et al., 2023). To address this issue, we applied two amendments to reduce the occurrence of false positives. First, we masked oil palm pixels that overlapped with the classes “cropland”, “built-up”, “waterbodies”, “herbaceous wetland”, and “mangrove” in the 10 m ESA WorldCover map v200 (Zanaga et al., 2022) given that oil palm is unlikely to be present in these land cover types. Second, we inspected the annual oil palm classification using high-resolution satellite imagery from Google Maps to remove any remaining false positives. We visually identified these false positives and reclassified them as the class “other”.
2.2.3 Merging annual classifications 2016–2021
We combined the annual oil palm classification layers for the period 2016–2021 into a single layer that shows the extent of oil palm. The merged oil palm layer depicts the oil palm detected at least once during the period 2016–2021. Since Sentinel-1 SAR scenes are inherently noisy, closed-canopy plantations are more likely to be missed in single-year classifications. For this reason, we did not provide the six annual classifications as a time series but rather as a single layer depicting the situation as of 2021. We used three rules to merge the annual classification layers (Table 1). In the merged layer, a pixel equal to zero indicates the absence of oil palm throughout the 2016–2021 period. A pixel value of 1 indicates the detection of an industrial plantation at least once in the 2016–2021 period, while a pixel value of 2 indicates the absence of industrial plantations and the detection of a smallholder plantation at least once in the same period.
Table 1Rules for merging the annual oil palm classification maps (2016–2021) with the oil palm extent. The rules assign a class (other, industrial oil palm, and smallholder oil palm) based on the same classes in the annual maps.

The reclassification rules prioritize the presence of oil palm, especially industrial plantations, and classify a pixel as such if it detects oil palm in any year between 2016 and 2021. The following three arguments justify these rules:
-
Classification models using satellite data tend to underestimate the true oil palm area (Descals et al., 2021). For instance, the global oil palm layer of 2019 showed an omission error that was substantially higher than the commission error. Considering these rates of omission and commission, oil palm is likely to be present in a pixel if the classification model has identified it at least once between 2016 and 2021.
-
These rules ensure that the merged layer reflects the replanting of oil palm plantations. For instance, a mature plantation that was clear-cut in 2017 would be detected as oil palm in 2016 but omitted in subsequent years (Fig. A2). By using these rules, such rotated plantations are included as oil palm despite being detected as other in the years following the rotation.
-
The rules ensure that young plantations that reached full canopy closure during 2016–2021 are included as oil palm in the merged layer. This rule would affect young oil palm detected as other in the first years of the period 2016–2021 but detected as oil palm once the plantation reaches full canopy closure within that timeframe.
2.2.4 Validation of the oil the palm extent
We conducted the validation of the global oil palm extent using the validation dataset developed for the 2019 global oil palm layer (Descals et al., 2021). This validation dataset included 10 816 points generated by simple random sampling and 2679 points generated by stratified random sampling. In this study, we rejected the validation points generated by stratified random sampling because these points were sampled based on the mapped area of the 2019 oil palm layer and, thus, cannot be used for validating the layer presented in this study. For the points generated by simple random sampling, we updated their true label considering the land cover for the period 2016–2021; in the original validation dataset, the true label only reflected the land cover scenario in 2019. Three cases arose in which the true label of a validation point required updating:
-
The first was young oil palm in 2019 that reached full canopy closure in 2020 and 2021. The true label was re-coded from the class of other to the class of industrial oil palm or smallholder oil palm.
-
The second was closed-canopy oil palm that was clear-cut between 2016 and 2018. These plantations were interpreted as bare land (class of other) in the 2019 validation dataset. The true label of these points was re-coded to industrial oil palm or smallholder oil palm.
-
The final case was coconut plantations that were incorrectly interpreted as oil palm. The true label was re-coded to the class of other. These points were mainly found in the Philippines and Indonesia. The recognition of coconut plantations was aided by an earlier study that mapped coconut palms at the global scale (Descals et al., 2023).
Additionally, we generated 7148 new validation points across all grid cells where the merged oil palm layer included oil palm. After removing the stratified random sampling points from the original dataset, a high class imbalance became prominent, with few points being labelled as industrial or smallholder oil palm. To address this, we added 1000 new points generated through stratified random sampling: 700 for industrial oil palm and 300 for smallholder oil palm. The updated validation dataset includes a total of 18 812 points: 16 839 points were labelled as the class of other, 1374 points were labelled as the class of industrial oil palm, and 531 points were labelled as the class of smallholder oil palm.
2.3 Determining the planting year with Landsat data
2.3.1 Landsat time series for determining the stages of oil palm development
The planting year was estimated using the Landsat time series (Landsat-5, Landsat-7, and Landsat-8). These optical satellites have provided 30 m resolution images since 1984, depending on the region, each at a revisit time of 16 d. We used the Landsat-5, Landsat-7, and Landsat-8 level-2 collection-2 tier-1 products, which contain atmospherically corrected surface reflectance. Landsat can depict the different stages of oil palm, from the moment of land preparation to the young and mature stages. To illustrate this, in Fig. 2, we present a time series of the normalized difference water index (NDWI) (Gao, 1996), calculated as the normalized difference between the near-infrared band (NIR, band 5 in Landsat-8) and shortwave infrared band (SWIR, band 7 in Landsat-8), for an industrial oil palm plantation in South Papua, Indonesia. This time series reveals low NDWI values during land preparation for oil palm, followed by a steady increase during the growth of young oil palm. NDWI plateaus when the plantation reaches full canopy closure about 3 years after the planting. We selected NDWI because it is less noisy than indices relying on visible-spectrum bands. NDWI uses SWIR and NIR bands, which can penetrate thin clouds and are less affected by atmospheric conditions like water vapour, which is typically high in the tropics.
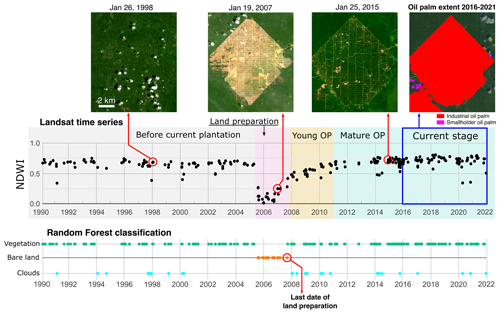
Figure 2Normalized difference water index (NDWI) and classification time series obtained from Landsat-5, Landsat-7, and Landsat-8 for an industrial oil palm plantation in South Papua, Indonesia. The time series was extracted for a pixel located at the centre of the plantation. The upper images illustrate Landsat images for specific dates of the period 1990–2021. The current extent of oil palm was detected using Sentinel-1 data for the period 2016–2021. The random forest model classified Landsat images into three classes: vegetation, bare land, and clouds.
2.3.2 Estimation of the planting year
We estimated the timing of land development for oil palm using a random forest model that classified the Landsat time series into three classes (Fig. 2): vegetation, bare land, and clouds. The purpose of the random forest classification was to detect the last Landsat observations depicting bare land, which reflect the preparation of land for the current oil palm plantation, as of 2021. We included the class “clouds” in the random forest model to flag cloud observations that remained present in the Landsat images after applying the cloud masking. The random forest model was applied only to the pixels in which oil palm was detected for the period 2016–2021. Then, we extracted the date of the Landsat observation corresponding to the final stage of land preparation. We named this date the last date of land preparation (LDLP), and it corresponds to the last Landsat observation that was classified as bare land. We assumed that the date of such a Landsat observation indicates the time when the current plantation begins to grow and cover the ground, thereby altering the spectral signature of the pixel from bare land to vegetation.
We calculated the LDLP pixel-wise and applied a mode filter to reduce the noise and salt-and-pepper effect in the layer. The LDLP, however, is a proxy for the planting year, and a mismatch may exist. To determine the planting year, we estimated it as the year with the lowest NDWI value observed in the 5 years preceding the LDLP. As an example, if the LDLP was detected in May 2016, we determined the planting year as the year with the lowest NDWI observed between June 2011 and May 2016. The agreement between the minimum NDWI year and the actual planting year was evaluated using field data (Sect. 2.4.2).
Our estimation reflects the planting year of the oil palm plantation detected between 2016 and 2021. Our definition of the planting year may not coincide with the year when oil palm was established for the first time, which could be substantially earlier than our estimate. This scenario arises in plantations that undergo a rotation, wherein oil palm is clear-cut and subsequently replanted with new oil palm seedlings.
2.4 Validation of the planting year
2.4.1 Visual inspection of the Landsat time series
We visually inspected the Landsat time series to verify that our methodology correctly detected the date when land was prepared for oil palm development. To do that, we plotted the NDWI time series, and an interpreter visualized the Landsat image that corresponded to the end of the land preparation for oil palm. The Landsat image that depicts the land preparation for oil palm is characterized by homogeneous bare land within the plantation area (Fig. A3a). The interpreter visualized the Landsat time series for all validation points that the deep learning model correctly classified as oil palm. Finally, we used a contingency table to compare the year determined by the interpreter with the LDLP image estimated using Landsat.
2.4.2 Comparison with field data
The accuracy of the planting-year layer was assessed with 6843 ground-truth observations of planting year obtained from plantation owners. These field data include the planting year of 5831 industrial parcels and 1012 smallholder plantations, ranging from 1990 to 2021. A parcel is a subunit of an industrial plantation that encompasses any continuous oil palm area, usually delineated by the harvesting road network of the plantation. The industrial plantations are located in three countries, namely Brazil, Gabon, and Indonesia, and the ground-truth data were provided to us by the respective owning companies. The year of planting within smallholder plantations was acquired through interviews with the plantation owners. A total of 93.5 % of the interviews were carried out by the company that delivered the data for industrial plantations in Indonesia, and the remaining interviews were conducted specifically for the purpose of this study. The ground-truth data for the smallholder plantations were collected in Cameroon and Indonesia.
3.1 Global oil palm extent
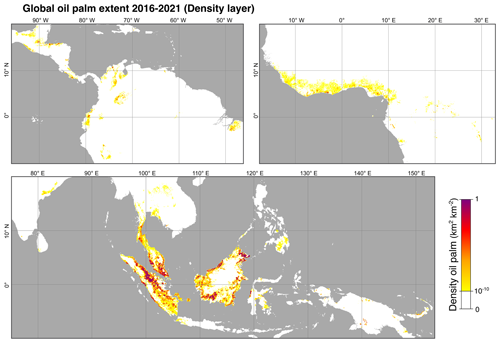
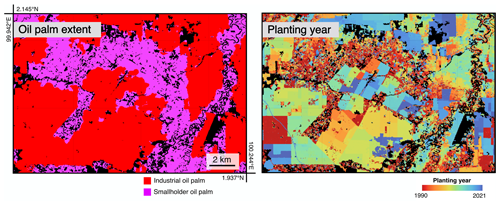
The oil palm extent layer is provided in 609 raster files covering an area of 100×100 km each. These 100×100 km grid cells represent the regions where oil palm was identified in the 2019 version, presented in Descals et al. (2021), as well as grid cells where oil palm was omitted in the previous version (Fig. A4). The new regions mainly include an oil palm hotspots in the state of Andhra Pradesh in India, industrial plantations in the Congo basin, and scattered plantations in Thailand and Central and South America. The classification model incorrectly identified some coconut plantations and paddy fields as oil palm, especially in Southeast Asia (Fig. A5). These false positives were also present in the previous 2019 oil palm layer but have been manually removed in this current study. We discarded a total of 82 grid cells that were processed in the 2019 oil palm layer as these grid cells did not include any oil palm. These grid cells were predominantly located in coconut-growing regions in Mexico, India, the Philippines, and Indonesia. We mapped a global oil palm area of 23.98 Mha, with 16.69 Mha (69.6 %) corresponding to industrial plantations and 7.29 Mha (30.4 %) corresponding to smallholders. A total of 83.6 % of the mapped area falls in Malaysia and Indonesia; Fig. 3 shows the global hotspot regions of oil palm cultivation. The mapped area is larger than the 2019 global oil palm layer because the updated version includes young oil palm, either from emerging plantations that reached the full canopy closure during the period 2016–2021 or from existing plantations that were replanted before 2019 (Fig. A6). The total oil palm area estimate is 16.82 ± 0.19 Mha for industrial plantations and 7.37 ± 0.25 Mha for smallholder plantations, with Indonesia being the top-producing country with 9.73 ± 0.15 Mha of industrial and 3.91 ± 0.17 Mha of smallholder plantations; a detail of the resulting layers for a hotspot area in Indonesia is shown in Fig. 4.
Our area estimates for Indonesia align with those of a previous study (Gaveau et al., 2022), which used a manually digitized reference dataset and reported 10.32 Mha of industrial oil palm and 5.92 Mha of smallholder oil palm in Indonesia in 2019. The higher oil palm area reported by Gaveau et al. (2022) includes land cleared for oil palm in 2019 that may not have matured into detectable oil palm in our classification map. This different definition of oil palm may explain the slightly higher oil palm area reported in Gaveau et al. (2022). Our area estimates also align with national statistics for oil palm harvested areas reported by FAO and USDA (Fig. A7). The largest discrepancy occurred in Nigeria, where we estimated 0.38 ± 0.13 Mha compared to the 4.86 and 3.00 Mha reported by FAO and FAS-USDA, respectively. This difference may result from the inclusion of semi-wild oil palms in the FAO and USDA statistics. Semi-wild oil palm, common in West Africa, is mostly omitted in our oil palm layer as these palms typically grow scattered across the landscape, making them difficult to map accurately with Sentinel-1.
3.2 Validation of the oil palm extent
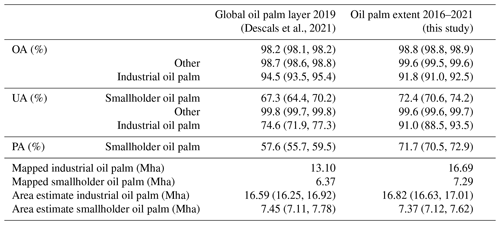
The global oil palm extent of 2016–2021 represents an improvement compared to the same layer developed for 2019. The overall accuracy was significantly higher in the updated oil palm layer (98.8 ± 0.1 %; 95 % confidence interval) compared to the accuracy of the 2019 layer (98.2 ± 0.1 %) (Table 2). The producer's accuracy improved for all three classes. The producer's accuracy for industrial and smallholder oil palm increased from 74.6 ± 2.7 % and 57.6 ± 1.9 % to 91.0 ± 2.5 % and 71.7 ± 1.2 %, respectively, indicating that the updated layer misses far fewer oil palm plantations than the 2019 layer. The user's accuracy for smallholder oil palm also improved, from 67.3 ± 2.9 % to 72.4 ± 1.8 %, but it decreased for industrial oil palm, from 94.5 ± 1.0 % to 91.8 ± 0.7 %, indicating that the updated version commits more industrial oil palm. This may be due to the rules used for merging the annual classification maps, which favoured the presence of industrial oil palm. Despite the decrease in the producer's accuracy, the accuracies for industrial oil palm remain higher than those for smallholder plantations, indicating that mapping smallholder oil palm using satellite data remains challenging. In the oil palm extent of 2016–2021, the producer's and user's accuracies are of the same order for industrial and smallholder oil palm, meaning that the model omits and commits roughly the same area for both classes. This explains the small difference between the area estimate and the area mapped in this study.
Table 2Accuracy assessment of the global oil palm layer (Descals et al., 2021) and the oil palm extent of 2016–2021 presented in this study. The accuracy metrics are the overall accuracy (OA), the user's accuracy (UA), and the producer's accuracy (PA). Upper- and lower-bound estimates for a 95 % confidence level are shown in parentheses.
3.3 Validation of the planting year
The LDLP agreed with the true date obtained by visual inspection of the Landsat time series by 59.6 %: 501 points out of the 841 points (Fig. 5). This agreement was 64.8 % (405/625) for industrial and 44.0 % (95/216) for smallholder plantations. A total of 76.3 % of the points showed an error of ±3 years: 78.4 % of points for industrial and 61.6 % of points for smallholders. Many of these validation points were located near roads or near the border of a plantation, where the reliability of the LDLP may be lower due to the border effect. The border effect refers to the high heterogeneity in land cover types observed within a 30 m Landsat pixel at the edge of the plantation. This variation in land cover can obscure the changes in the plantation reflected in the NDWI time series. In smallholder plantations, there are more pixels that are affected by the border effect, and validation points are more likely to be at the edges than in industrial plantations. This may explain the lower agreement in smallholder plantations. Additionally, smallholder plantations are often established over several years, and a question from our field teams about the initial year of establishment may have been confusing to the plantation owner (see Discussion).
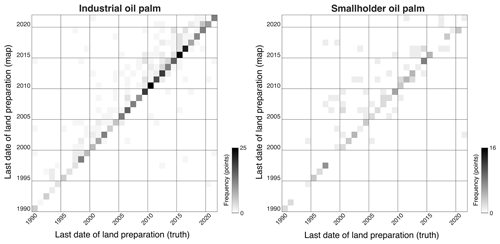
Figure 5Contingency table covering the “last date of land preparation” estimated from Landsat using a random forest classification (map) and the same date obtained by visual inspection of the Landsat time series (truth). The contingency table was created using 625 validation points of industrial oil palm plantations and 216 points of smallholder plantations.
The agreement between LDLP and the true date obtained by visual inspection varied by region. We found a low agreement in regions where the Landsat NDWI time series presents seasonal fluctuations. In these regions, NDWI decreases during annually recurring dry periods, and the random forest incorrectly identified these low NDWI values as bare land. We identified this issue in India and various parts of Southeast Asia, including Thailand and Sulawesi (Fig. A3b). The agreement was also low in Africa, mostly explained by the high frequency of clouds and gaps in the Landsat time series, which affected the period 1990–2014 (Fig. A3c).
The comparison with ground-truth data showed a good agreement (Fig. 6), with an overall mean error (ME; field data − satellite estimate) of −0.24 years, a root-mean-squared error (RMSE) of 2.65 years, and a coefficient of correlation (R2) of 0.86. The agreement in terms of RMSE was higher for industrial plantations (2.02 years) than for smallholder plantations (4.89 years). The high agreement in industrial plantations was found across all regions (Table 3), indicating that the planting year can be determined accurately for industrial oil palm. The difference between the field data and the satellite estimation was consistent across the range of planting years, although it was slightly higher for older plantations. Smallholders in Cameroon showed the lowest agreement (RMSE = 7.01 years).
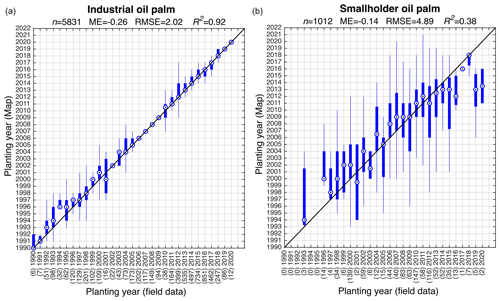
Figure 6Comparison between the planting year obtained from Landsat and the true planting year obtained from field data in (a) industrial and (b) smallholder oil palm plantations. The title shows the number of observations (n), mean error (ME; field data − satellite estimate), root-mean-squared error (RMSE), and coefficient of correlation (R2). The number of observations from field data for each year appears in parentheses on the x axis.
The dynamic of planting years follows a similar pattern for industrial and smallholder plantations in Indonesia, Malaysia, and around the world (Fig. 7). From 1990, the area of oil palm planted each year increased steadily, peaking around 2015. However, after 2015, this trend reversed, and the area of oil palm planted each year declined. This indicates that most oil palms are of medium age; the average age of industrial oil palm is 14.0 years, while smallholders have an average age of 14.2 years. The area of oil palm over 20 years is 4.34 Mha for industrial oil palm and 1.94 Mha for smallholders.
Table 3Comparison between the planting year estimated from Landsat and the true planting year obtained from field data for different regions. The columns show the mean error (ME), root-mean-squared error (RMSE), coefficient of correlation (R2), and the number of observations (n).
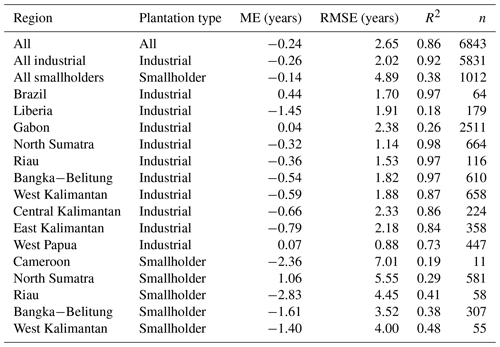
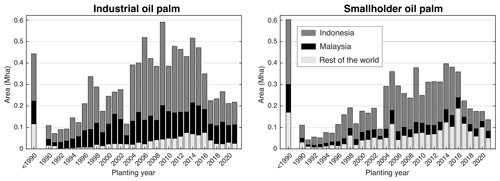
Figure 7Oil palm planting year for industrial and smallholder oil palm for the period 1990–2021 in Indonesia, Malaysia, and the rest of the world. The planting year denotes the time when oil palm was established, either as a new plantation or through the process of replanting, where old oil palm trees are cleared and replaced by young ones to maintain productivity.
This study presents a dataset that includes a global oil palm extent layer for 2021 and an oil palm planting-year layer from 1990 to 2021. The oil palm extent layer improves the omission error in the previously published map for 2019 (Descals et al., 2021). Two factors explain this improvement in the omission error. First, the current methodology can identify young oil palm plantations that have been replanted during the period 2016–2021. Second, by combining multiple annual classifications, we minimized the omission of oil palm. Oil palm can be excluded in a single year, potentially due to inherent noise and the impact of surface roughness in radar Sentinel-1 data. The merging of annual classifications favoured the classification of oil palm, thus reducing the omission of oil palm. The updated oil palm layer also improves in terms of the commission error; false positives in coconut, paddy fields, and other palm species were removed manually. Despite the improved accuracies, the oil palm extent layer presents three major caveats. First, the oil palm extent layer mostly omits emerging young oil palms that were planted for the first time in 2016–2021. Our layer particularly omits plantations established in the later years of the period 2016–2021 as these new plantations had not yet become detectable by Sentinel-1 by 2021. This is because young oil palm exhibits a spectral backscatter in Sentinel-1 that is similar to other non-oil-palm land covers. Second, we assumed that oil palm plantations that were clear-cut between 2016 and 2021 are replanted as oil palm. Oil palm plantations that undergo replanting with a different tree plantation or crop would be regarded as false positives. Third, most open-canopy oil palm remains undetected in this updated version, although this issue was more apparent in the 2019 oil palm layer presented in Descals et al. (2021). This affects failed plantations through burning, floods, and pests (Fosch et al., 2023), as well as semi-wild plantations and oil palms in heterogeneous settings, especially in Africa. Subsistence-level oil palm in Africa could add millions of hectares; the area of these unaccounted traditional oil palm plantations was estimated to be 6.66 Mha in Africa in 2013 (Carrere, 2010). The presence of unaccounted semi-wild oil palm is likely to explain the ∼ 4.5 Mha discrepancy between our area estimates and FAO's oil palm area in Nigeria, as well as the difference between our global oil palm mapped area (23.98 Mha) and FAO's reported global harvested area (29.62 Mha) for 2021. Despite this discrepancy, the comparison with official statistics supports the validity of our oil palm extent layer as our area estimates closely align with the FAO- and USDA-reported oil palm areas in other top-producing countries.
The validation dataset provided in this study is also an improvement over the previous version published in Descals et al. (2021). First, we corrected the true label in the validation points that fell within coconut plantations and were incorrectly interpreted as oil palm. Young oil palm plantations in 2019, which were labelled as the class of other, were also corrected and re-labelled as oil palm. The changes in the validation dataset explain the lower producer's and user's accuracies obtained in this study for the 2019 oil palm layer compared to the same accuracies presented in Descals et al. (2021). Second, we provide information about whether the validation points were generated by simple random sampling or stratified random sampling. Simple random sampling is ideal for assessing and comparing the accuracy of different oil palm datasets as it eliminates the need to recalculate the number of points in each stratum, unlike stratified random sampling (Gaveau et al., 2021). Future research can directly use our validation dataset to assess the accuracy of oil palm datasets, creating statistically rigorous accuracy metrics and area estimates along with confidence intervals (Sheil et al., 2024).
The accuracy of the planting-year layer was assessed using a large ground-truth dataset. The comparison with ground-truth data allowed us to determine which Landsat observation matched most closely with the true year of planting. In this study, we found that the minimum NDWI date showed high agreement with the planting year obtained from field data, particularly for industrial oil palm. These are important findings that should be considered when estimating oil palm development in future studies. While the agreement in terms of RMSE was suboptimal for smallholders, the bias was negligible. The low agreement for smallholders might be partially explained by a memory or reporting errors; the longer ago a plantation was developed, the less likely it is that the year of planting was reported accurately. Furthermore, smallholder plantations often develop sequentially, beginning with a few hectares and expanding in subsequent years, making it challenging to answer interview questions about the planting year. Additional limitations could explain the inaccurate estimations of the planting year for smallholders. First, the border effect might obscure the land cover changes reflected in the NDWI time series, especially in small plantations where the 30 m Landsat pixels do not cover the entire plantation. Second, our methodology cannot detect replanting years in cases where owners use the under-planting technique, which involves planting seedlings between older trees and then removing the older trees once the seedlings have matured into young trees (Chia et al., 2002). This replanting approach would primarily concern smallholders as industrial plantations typically clear-cut existing oil palm trees and replant entire areas with new palms afterwards. Lastly, we observed inaccurate estimations of the planting year in areas where the Landsat NDWI time series exhibited significant gaps due to data scarcity or extensive cloud cover. These data gaps are especially pronounced in the oil palm-growing regions of Africa (Kovalskyy and Roy, 2013), particularly before 2013, when only Landsat-5 and Landsat-7 data were available. Inaccuracies were also found in regions where vegetation displayed seasonal fluctuations in NDWI. These issues were most prevalent across much of Africa, India, and specific regions of Southeast Asia. Users should exercise caution when using our year of planting layer, particularly in these areas and for smallholders in general.
The trends in the planting year show patterns that are comparable to a previous study (Gaveau et al., 2022), which presented a recent decline in oil palm expansion in Indonesia from around 2010. Despite the similarities, our trends are not entirely comparable to those obtained by Gaveau et al. (2022). Their analysis measures the number of new plantation areas (expansion) added each year, whereas our annual oil palm area encompasses both annual expansion and the clearing and replanting of old plantations. In addition, our methodology presents a caveat; our classification model only detects closed-canopy plantations, thereby excluding very young plantations with open canopies. An oil palm plantation typically takes about 3 years or longer to achieve full canopy closure, at which point radar satellites can detect it. As a result, using imagery up to 2021, we could not detect new plantation areas established during the last 3 years of the time series (2019–2021). This limitation implies that the oil palm area for planting years after 2019 mostly includes replanting of existing old plantations and overlooks the expansion of new areas of land.
Our planting-year layer provides insight into where replanting is required and how much of the area requires it. Replanting costs are estimated to be between EUR 3200 and 3800 ha−1 (Nurfatriani et al., 2019). These costs are important, especially in Indonesia, where replanting will soon be necessary in many oil palm plantations that have surpassed their ideal production age (Grass et al., 2020). According to our results, Indonesia has 3.54 Mha of oil palm older than 20 years, indicating a substantial capital expenditure of some USD 10 to 15 billion over the decade after 2021. A total of 30.5 % of this area that requires replanting is on smallholder plantations, where the availability of funds to finance replanting may be a significant constraint (Petri et al., 2023). Replanting is important because it allows higher-yielding varieties to replace older lower-yield ones (Ismail and Mamat, 2002), and, given the growing demand for vegetable oils (Meijaard et al., 2024), effective replanting can reduce the expansion of the oil palm area or other oil crops and, thus, can minimize negative environmental and social impacts. Replanting also represents an opportunity to develop more wildlife-friendly plantations by establishing forest corridors (Gregory et al., 2014). Finally, the methodology we develop for mapping oil palm age can be relevant for regulations such as the European Commission's European Union Deforestation Free-Product Regulation (EUDR). The EUDR has already entered into force, banning certain commodities coming from areas deforested and planted with those selected commodities after 31 December 2020 from entering the EU market. Our methodology can be adjusted to annually estimate the timing of establishment for emerging oil palm plantations that result from recent deforestation, enabling the monitoring and reporting of deforestation driven by oil palm expansion.
The dataset presented in this study is freely available for download at https://doi.org/10.5281/zenodo.13379129 (Descals, 2024a). The repository in Zenodo contains the following data:
-
Grid_OilPalm2016-2021.shp is a shapefile that delineates the 609 grid cells of 100×100 km where oil palm was found.
-
GlobalOilPalm_OP-extent.zip consists of 609 raster tiles of 100×100 km in GeoTIFF format. The raster files show the results of a deep learning classification of Sentinel-1 data at a spatial resolution of 10 m. The classes are
- [0]
-
other land covers that are not oil palm
- [1]
-
industrial oil palm plantations
- [2]
-
smallholder oil palm plantations.
-
GlobalOilPalm_YoP.zip consists of 609 raster tiles of 100×100 km in GeoTIFF format. The raster files depict the year of oil palm plantation. The raster files have a spatial resolution of 30 m.
-
Validation_points_GlobalOP2016-2021.shp is a shapefile that contains the 18 812 points used to validate the global oil palm extent of 2016–2021 and the oil palm age layer. Each point includes the attribute “class”, which is the class assigned by visual interpretation of sub-metre-resolution images, and the attributes “OP2016-2021” and “OP2019”, which show the mapped classes in the oil palm extent of 2016–2021 (this dataset) and the global oil palm layer of 2019 (Descals et al., 2021), respectively. These attributes contain the class values
- [0]
-
other land covers that are not oil palm
- [1]
-
industrial oil palm plantations
- [2]
-
smallholder oil palm plantations.
The Sentinel-1 SAR GRD is available at the Copernicus Open Access Hub: https://scihub.copernicus.eu/ (European Space Agency, 2024). The Landsat-5, Landsat-7, and Landsat-8 surface reflectances are available at the USGS Earth Explorer portal: https://earthexplorer.usgs.gov/ (United States Geological Survey, 2024). Very-high-resolution images (spatial resolution < 1 m) can be visualized in the Google Earth Engine code editor or Google Maps. We obtained the 2021 official oil palm area statistics from FAOSTAT (FAO, 2022) and FAS-USDA (FAS-USDA, 2024).
The oil palm extent and the planting year can be visualized at https://ee-globaloilpalm.projects.earthengine.app/view/global-oil-palm-planting-year-1990-2021 (Descals, 2024b). This web map allows for the inspection of Landsat time series and the visualization of historical satellite images for a given oil palm plantation.
The code that generates the Sentinel-1 and Sentinel-2 composites can be found at https://doi.org/10.5281/zenodo.4617748 (Descals, 2021).
The original code of the semantic segmentation model DeepLabv3+ can be found at https://github.com/tensorflow/models/tree/master/research/deeplab (GitHub, 2021).
This study offers significant advances by providing global layers on oil palm extent and planting year, which are critical for understanding the environmental impacts associated with oil palm. Our methodology improves the omission error by detecting oil palm rotations and reducing false positives through manual removal of misclassified areas, resulting in a mapped global oil palm area of 23.98 Mha. However, caveats exist, including the omission of young plantations, assumptions about replanting, and challenges in detecting open-canopy oil palm. The validation dataset can help future studies in evaluating upcoming global oil palm datasets. Finally, our estimation of oil palm age provides insights into replanting needs, which is crucial for sustainable management and addressing environmental concerns.
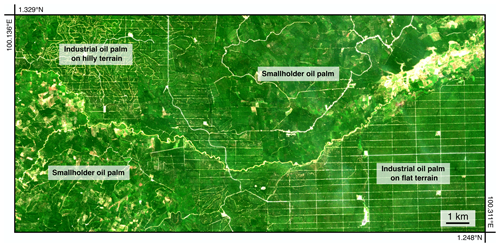
Figure A1Sentinel-2 true colour composite depicting industrial and smallholder plantations in a region in Riau Province, Indonesia.
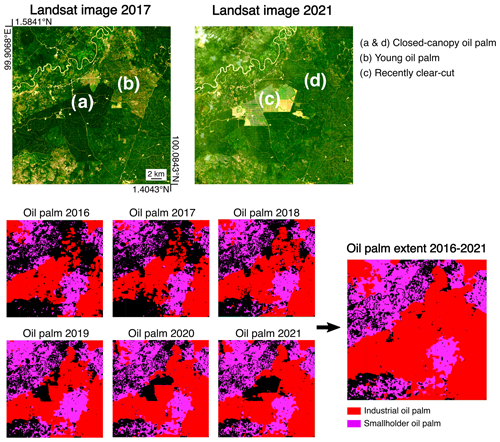
Figure A2Example of the merging of the multi-annual oil palm classification maps. The upper images show two Landsat images taken in 2016 and 2021 in a region in North Sumatra. The two images depict a clear-cutting of an industrial plantation – (a) to (c) – and the transition of a young oil palm to a closed-canopy plantation – (b) to (d). The lower images show the annual oil palm classification maps from 2016 to 2021 and the merged oil palm layer in a region in North Sumatra. Young oil palm and oil palm from replanting were not detected in certain years of the annual classification maps, but these plantations were included in the merged layer of 2016–2021.
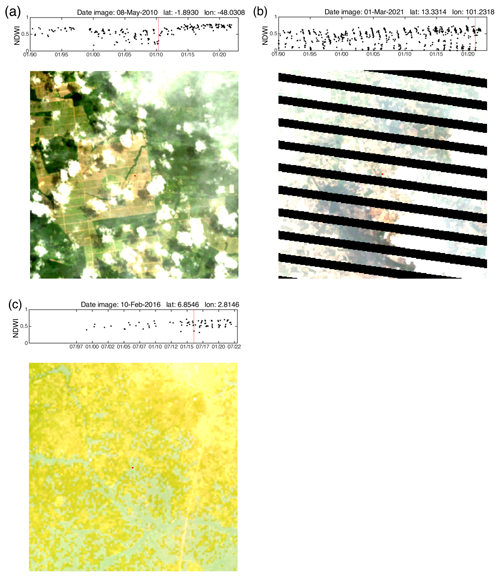
Figure A3Example of the Landsat NDWI time series and the Landsat image that corresponds to the last date of land preparation for three validation points. The NDWI time series corresponds to the pixel located at the centre of the image. The images correspond to the last Landsat images classified as bare land using a random forest classification. (a) The NDWI time series shows the typical patterns of oil palm development, and the Landsat image corresponds to the land preparation for oil palm. (b) The NDWI time series presents a pronounced seasonality, and the random forest classified the low NDWI values as bare land. (c) The NDWI time series presents persistent gaps, and the last observation classified as bare land corresponds to an image largely impacted by cloud cover.
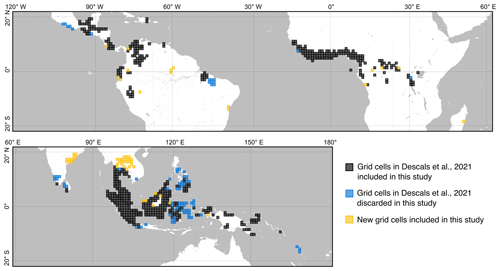
Figure A4Grid cells of 100×100 km used for the classification of Sentinel-1 composites. Grid cells in black and blue show the regions where oil palm was detected for 2019 in a previous study (Descals et al., 2021). Blue grid cells were not included in this study as they only included oil palm false positives. Grid cells in orange represent regions where oil palm was detected for the first time in this study.
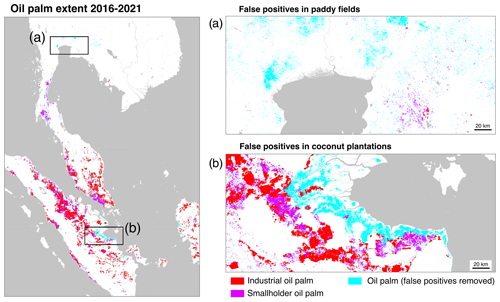
Figure A5Oil palm false positives in the oil palm extent of 2016–2021. False positives (in cyan) were found in paddy fields (inset (a)) and coconut plantations (inset (b)) and were removed in the final version of the layer.
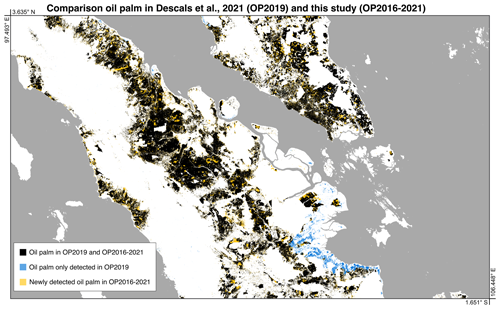
Figure A6Comparison between the oil palm dataset developed by Descals et al. (2021) for 2019 and the oil palm extent layer developed in this study for 2016–2021. Black pixels indicate oil palm detected in both datasets, orange pixels represent newly detected oil palm in this study, and blue pixels correspond to areas detected in 2019 but not included in this study. The orange pixels primarily correspond to young oil palm omitted in the previous version, while the blue pixels mostly consist of false positives in coconut-growing regions.
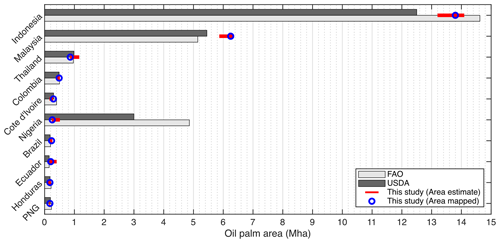
Figure A7Oil palm area for the 10 highest-producing countries according to the dataset presented in this study. The bars depict the oil palm area for 2021 according to official statistics (FAO and USDA), the blue circles represent the mapped oil palm area using the deep learning model, and the red line shows our oil palm area estimate with a 95 % confidence interval.
The conceptualization of this work originated from AD and EM. AD designed the study. AD collected the reference points, implemented the data processing workflow, and generated the figures and tables. AD and EM wrote the draft, and AD, DG, SW, ZS, and EM were involved in the revision of the paper.
Adrià Descals performed remote sensing consulting work for the ICT & GIS department at PT Austindo Nusantara Jaya Tbk. David Gaveau is a member of the IUCN Oil Crops Task Force, a group tasked by the IUCN to investigate the sustainability of palm oil, and he has done oil-palm-related work for this task force, as well as for Greenpeace. Serge Wich received research funding from PT Austindo Nusantara Jaya Tbk and is a member of the IUCN Oil Crops Task Force, and he has done oil-palm-related work for this task force. Erik Meijaard chairs and has received funding from the IUCN Oil Crops Task Force, and he has done work paid for by palm oil companies and the Roundtable on Sustainable Palm Oil. The peer-review process was guided by an independent editor, and the authors also have no other competing interests to declare.
Publisher’s note: Copernicus Publications remains neutral with regard to jurisdictional claims made in the text, published maps, institutional affiliations, or any other geographical representation in this paper. While Copernicus Publications makes every effort to include appropriate place names, the final responsibility lies with the authors.
We thank Austindo Nusantara Jaya, OLAM Gabon, and Agropalma for providing age verification data and Andi Erman and Ayompe Lacour for coordinating the field data collection.
We acknowledge funding from the Roundtable on Sustainable Palm Oil (RSPO) (funding agreement no. PUR-02750).
This paper was edited by Dalei Hao and reviewed by two anonymous referees.
Ashton‐Butt, A., Willcock, S., Purnomo, D., Suhardi, A. A. K., Aryawan, R., Wahyuningsih, R., Naim, M., Poppy, G. M., Caliman, J.-P., Peh, K. S.-H., and Snaddon, J. L.: Replanting of first-cycle oil palm results in a second wave of biodiversity loss, Ecol. Evol., 9, 6433–6443, 2019.
Candellone, E., Aleta, A., de Arruda, H. F., Meijaard, E., and Moreno, Y.: Understanding the Vegetable Oil Debate and Its Implications for Sustainability through Social Media, arXiv [preprint], https://doi.org/10.48550/arXiv.2308.07108, 2023.
Carrere, R.: Oil palm in Africa: Past, present and future scenarios, WRM series on tree plantations, 15, 1–78, 2010.
Chen, L.-C., Papandreou, G., Kokkinos, I., Murphy, K., and Yuille, A. L.: Deeplab: Semantic image segmentation with deep convolutional nets, atrous convolution, and fully connected crfs, IEEE T. Pattern Anal., 40, 834–848, 2017.
Chia, C., Lim, C., Teo, K., and Rao, V.: Oil palm replanting-experiences of underplanting, Planter, 78, 237–248, 2002.
Corley, R. H. V. and Tinker, P. B.: The oil palm, John Wiley & Sons, https://doi.org/10.1002/9781118953297, 2008.
Danylo, O., Pirker, J., Lemoine, G., Ceccherini, G., See, L., McCallum, I., Kraxner, F., Achard, F., and Fritz, S.: A map of the extent and year of detection of oil palm plantations in Indonesia, Malaysia and Thailand, Sci. Data, 8, 1–8, 2021.
Descals, A.: oil_palm_global v1.0 (Version 1.0), Zenodo [code], https://doi.org/10.5281/zenodo.4617748, 2021.
Descals, A.: Global oil palm extent and planting year from 1990 to 2021 (Version 1.2), Zenodo [data set], https://doi.org/10.5281/zenodo.13379129, 2024a.
Descals, A.: Global oil palm extent and planting year from 1990 to 2021 Earth Engine App, https://ee-globaloilpalm.projects.earthengine.app/view/global-oil-palm-planting-year-1990-2021, last access: 5 April 2024b.
Descals, A., Wich, S., Meijaard, E., Gaveau, D. L. A., Peedell, S., and Szantoi, Z.: High-resolution global map of smallholder and industrial closed-canopy oil palm plantations, Earth Syst. Sci. Data, 13, 1211–1231, https://doi.org/10.5194/essd-13-1211-2021, 2021.
Descals, A., Wich, S., Szantoi, Z., Struebig, M. J., Dennis, R., Hatton, Z., Ariffin, T., Unus, N., Gaveau, D. L. A., and Meijaard, E.: High-resolution global map of closed-canopy coconut palm, Earth Syst. Sci. Data, 15, 3991–4010, https://doi.org/10.5194/essd-15-3991-2023, 2023.
Du, Z., Yu, L., Yang, J., Xu, Y., Chen, B., Peng, S., Zhang, T., Fu, H., Harris, N., and Gong, P.: A global map of planting years of plantations, Sci. Data, 9, 141, https://doi.org/10.1038/s41597-022-01260-2, 2022.
European Space Agency: Copernicus Open Access Hub, https://scihub.copernicus.eu/, last access: 25 April 2024.
FAO: FAOSTAT statistical database, https://www.fao.org/faostat (last access: 25 April 2024), 2022.
FAS-USDA: Crop Explorer, https://ipad.fas.usda.gov/cropexplorer/, last access: 25 April 2024.
Fosch, A., Ferraz de Arruda, G., Aleta, A., Descals, A., Gaveau, D., Morgans, C., Santika, T., Struebig, M. J., Meijaard, E., and Moreno, Y.: Replanting unproductive palm oil with smallholder plantations can help achieve Sustainable Development Goals in Sumatra, Indonesia, Commun. Earth Environ., 4, 378, https://doi.org/10.1038/s43247-023-01037-4, 2023.
Gao, B.-C.: NDWI – A normalized difference water index for remote sensing of vegetation liquid water from space, Remote Sens. Environ., 58, 257–266, 1996.
Gaveau, D. L. A., Descals, A., Salim, M. A., Sheil, D., and Sloan, S.: Refined burned-area mapping protocol using Sentinel-2 data increases estimate of 2019 Indonesian burning, Earth Syst. Sci. Data, 13, 5353–5368, https://doi.org/10.5194/essd-13-5353-2021, 2021.
Gaveau, D. L., Locatelli, B., Salim, M. A., Manurung, T., Descals, A., Angelsen, A., Meijaard, E., and Sheil, D.: Slowing deforestation in Indonesia follows declining oil palm expansion and lower oil prices, PloS one, 17, e0266178, https://doi.org/10.1371/journal.pone.0266178, 2022.
GitHub: DeepLab: Deep Labelling for Semantic Image Segmentation, https://github.com/tensorflow/models/tree/master/research/deeplab (last access: 25 April 2024), 2021.
Grass, I., Kubitza, C., Krishna, V. V., Corre, M. D., Mußhoff, O., Pütz, P., Drescher, J., Rembold, K., Ariyanti, E. S., Barnes, A. D., Brinkmann, N., Brose, U., Brümmer, B., Buchori, D., Daniel, R., Darras, K. F. A., Faust, H., Fehrmann, L., Hein, J., Hennings, N., Hidayat, P., Hölscher, D., Jochum, M., Knohl, A., Kotowska, M. M., Krashevska, V., Kreft, H., Leuschner, C., Lobite, N. J. S., Panjaitan, R., Polle, A., Potapov, A. M., Purnama, E., Qaim, M., Röll, A., Scheu, S., Schneider, D., Tjoa, A., Tscharntke, T., Veldkamp, E., and Wollni, M.: Trade-offs between multifunctionality and profit in tropical smallholder landscapes, Natu. Commun., 11, 1186, https://doi.org/10.1038/s41467-020-15013-5, 2020.
Gregory, S. D., Ancrenaz, M., Brook, B. W., Goossens, B., Alfred, R., Ambu, L. N., and Fordham, D. A.: Forecasts of habitat suitability improve habitat corridor efficacy in rapidly changing environments, Divers. Distrib., 20, 1044–1057, 2014.
Hansen, M. C., Potapov, P. V., Moore, R., Hancher, M., Turubanova, S. A., Tyukavina, A., Thau, D., Stehman, S. V., Goetz, S. J., Loveland, T. R., Kommareddy, A., Egorov, A., Chini, L., Justice, C. O., and Townshend, J. R. G.: High-Resolution Global Maps of 21st-Century Forest Cover Change, Science, 342, 850–853, https://doi.org/10.1126/science.1244693, 2013.
Ismail, A. and Mamat, M. N.: The optimal age of oil palm replanting, Oil palm industry economic journal, 2, 11–18, 2002.
Kovalskyy, V. and Roy, D. P.: The global availability of Landsat 5 TM and Landsat 7 ETM+ land surface observations and implications for global 30 m Landsat data product generation, Remote Sens. Environ., 130, 280–293, 2013.
Meijaard, E., Brooks, T. M., Carlson, K. M., Slade, E. M., Garcia-Ulloa, J., Gaveau, D. L. A., Lee, J. S. H., Santika, T., Juffe-Bignoli, D., Struebig, M. J., Wich, S. A., Ancrenaz, M., Koh, L. P., Zamira, N., Abrams, J. F., Prins, H. T. H., Sendashonga, C. N., Murdiyarso, D., Furumo, P. R., Macfarlane, N., Hoffmann, R., Persio, M., Descals, A., Szantoi, Z., and Sheil, D.: The environmental impacts of palm oil in context, Nat. Plants, 6, 1418–1426, 2020.
Meijaard, E., Virah-Sawmy, M., Newing, H., Ingram, V., Holle, M. J. M., Pasmans, T., Omar, S., Hombergh, H. van den, Unus, N., Fosch, A., Arruda, H. F. de, Allen, J., Tsagarakis, K., Ogwu, M. C., Diaz-Ismael, A., Hance, J., Moreno, Y., O'Keeffe, S., Slavin, J., Slingerland, M., Meijaard, E. M., Macfarlane, N., Jimenez, R., Wich, S. A., and Sheil, D.: Exploring the future of vegetable oils, Oil crop implications – Fats, forests, forecasts, and futures, IUCN, https://doi.org/10.2305/KFJA1910, 2024.
Miettinen, J. and Liew, S. C.: Separability of insular Southeast Asian woody plantation species in the 50 m resolution ALOS PALSAR mosaic product, Remote Sens. Lett., 2, 299–307, 2011.
Nurfatriani, F., Sari, G., and Komarudin, H.: Optimization of crude palm oil fund to support smallholder oil palm replanting in reducing deforestation in Indonesia, Sustainability-Basel, 11, 18, https://doi.org/10.3390/su11184914, 2019.
Petri, H., Hendrawan, D., Bähr, T., Musshoff, O., Wollni, M., Asnawi, R., and Faust, H.: Replanting challenges among Indonesian oil palm smallholders: a narrative review, Environ. Dev. Sustain., 26, 8, https://doi.org/10.1007/s10668-023-03527-z, 2023.
Sheil, D., Descals, A., Meijaard, E., and Gaveau, D.: Rubber Planting and Deforestation, Preprints [preprint], https://doi.org/10.20944/preprints202402.0743.v2, 2024.
Tan, K. P., Kanniah, K. D., and Cracknell, A. P.: On the upstream inputs into the MODIS primary productivity products using biometric data from oil palm plantations, Int. J. Remote Sens. 35, 2215–2246, 2014.
Teng, S., Khong, K. W., and Ha, N. C.: Palm oil and its environmental impacts: A big data analytics study, J. Clean. Product., 274, 122901, https://doi.org/10.1016/j.jclepro.2020.122901, 2020.
Torres, R., Snoeij, P., Geudtner, D., Bibby, D., Davidson, M., Attema, E., Potin, P., Rommen, B., Floury, N., Brown, M., Navas Traver, I., Deghaye, P., Duesmann, B., Rosich, B., Miranda, N., Bruno, C., L'Abbate, M., Croci, R., Pietropaolo, A., Huchler, M., and Rostan, F.: GMES Sentinel-1 mission, Remote Sens. Environ., 120, 9–24, 2012.
United States Geological Survey: Earth Explorer data portal, https://earthexplorer.usgs.gov/, last access: 25 April 2024.
Vancutsem, C., Achard, F., Pekel, J.-F., Vieilledent, G., Carboni, S., Simonetti, D., Gallego, J., Aragao, L. E., and Nasi, R.: Long-term (1990–2019) monitoring of forest cover changes in the humid tropics, Sci. Adv., 7, eabe1603, https://doi.org/10.1126/sciadv.abe1603, 2021.
Wenzel, A., Westphal, C., Ballauff, J., Berkelmann, D., Brambach, F., Buchori, D., Camarretta, N., Corre, M. D., Daniel, R., Darras, K., Erasmi, S., Formaglio, G., Hölscher, D., Iddris, N. A., Irawan, B., Knohl, A., Kotowska, M. M., Krashevska, V., Kreft, H., Mulyani, Y., Mußhoff, O., Paterno, G. B., Polle, A., Potapov, A., Röll, A., Scheu, S., Schlund, M., Schneider, D., Sibhatu, K. T., Stiegler, C., Sundawati, L., Tjoa, A., Tscharntke, T., Veldkamp, E., Waite, P.-A., Wollni, M., Zemp, D. C., and Grass, I.: Balancing economic and ecological functions in smallholder and industrial oil palm plantations, P. Natl. Acad. Sci., 121, e2307220121, https://doi.org/10.1073/pnas.2307220121, 2024.
Xu, Y., Yu, L., Li, W., Ciais, P., Cheng, Y., and Gong, P.: Annual oil palm plantation maps in Malaysia and Indonesia from 2001 to 2016, Earth Syst. Sci. Data, 12, 847–867, https://doi.org/10.5194/essd-12-847-2020, 2020.
Zanaga, D., Van De Kerchove, R., Daems, D., De Keersmaecker, W., Brockmann, C., Kirches, G., Wevers, J., Cartus, O., Santoro, M., Fritz, S., Lesiv, M., Herold, M., Tsendbazar, N., Xu, P., Ramoino, F., and Arino, O.: ESA WorldCover 10 m 2021 v200, Zenodo [data set], https://doi.org/10.5281/zenodo.7254221, 2022.


