the Creative Commons Attribution 4.0 License.
the Creative Commons Attribution 4.0 License.
Integration by design: driving mineral system knowledge using multi-modal, collocated, scale-consistent characterisation
Michael Gazley
Renee Birchall
Ben Patterson
Jessica Stromberg
Morgan Willams
Andreas Björk
Monica Le Gras
Tina D. Shelton
Courteney Dhnaram
Vladimir Lisitsin
Tobias Schlegel
Helen McFarlane
John Walshe
Recent decades have seen an exponential rise in the application of machine learning in geoscience. However, fundamental differences distinguish geoscience data from most other data types. Geoscience datasets are typically multi-dimensional, and contain 1D (drill holes), 2D (maps or cross-sections), and 3D volumetric and point data (models/voxels). Geoscience data quality is a product of the data's resolution and the precision of the methods used to acquire them. The dimensionality, resolution, and precision of each layer within a geoscience dataset translate into limitations to the spatiality, scale, and uncertainty of resulting interpretations. Historically, geoscience datasets were overlaid cartographically to incorporate subjective, experience-driven knowledge and variances in scale and resolution. These nuances and limitations that underpin the reliability of automated interpretation are well understood by geoscientists but are rarely appropriately transferred to data science. For true integration of geoscience data, such issues cannot be overlooked without consequence. To apply data analytics to complex geoscience data (e.g. hydrothermal mineral systems) effectively, methodologies that characterise the system quantitatively at a common scale, using collocated analyses, should be sought. This paper provides research and exploration insights from an innovative district-wide, scale-integrated geoscience data project, which analysed 1590 samples from 23 mineral deposits and prospects across the Cloncurry district, Queensland, Australia. Nine different analytical techniques were used, including density, magnetic susceptibility, remanent magnetisation, anisotropy of magnetic susceptibility, radiometrics, conductivity, automated mineralogy based on scanning electron microscopy (SEM), geochemistry, and short-wave infrared (SWIR) hyperspectral data with 561 columns of scale-integrated data (+2151 columns of SWIR data). All data were collected on 2.2 cm × 2.5 cm sample cylinders, a scale at which the confidence in the coupling of data from techniques can be high. These data are integrated by design to eliminate the need to downscale coarser measurements via assumptions, inferences, inversions, and interpolations. This scale-consistent approach is critical to the quantitative characterisation of mineral systems and has numerous applications in mineral exploration, such as linking alteration paragenesis with structural controls and petrophysical zonation. The Cloncurry METAL dataset is made freely available via the AuScope Data Repository: https://doi.org/10.60623/82trleue (Austin et al., 2024).
- Article
(19846 KB) - Full-text XML
- BibTeX
- EndNote
© The author's copyright for this publication is transferred to Commonwealth Scientific and Industrial Research Organisation 2024. To the extent permitted by law, all rights are reserved and no part of this publication covered by copyright may be reproduced or copied in any form or by any means except with the written permission of CSIRO.
With the increase in computer power and the algorithmic advances of the last few decade(s), there has been a new wave of statistical application to data analytics (Biamonte et al., 2017), with machine learning steadily gaining popularity since the turn of the millennium (Fig. 1) and proving effective for many applications (e.g. retail, finance). Not surprisingly, this new enthusiasm has spread to data-heavy fields of science, which has led to an exponential increase in the adaptation of machine learning to the analysis of geoscience data since ca. 2010 (Fig. 1). However, there are fundamental differences that distinguish geoscience data from most other data types to which machine-learning methods are commonly applied.
Geoscience datasets have highly variable precision and resolution, which drastically affects the resolution at which datasets can be confidently scaled and correlated. Geoscience data are also intrinsically multi-scale and are used at a range of scales. Geoscience data are multi-dimensional, comprising a range of one-, two-, and three-dimensional products that are typically transformed and collocated to a common 2D (i.e. map-based) or 3D (i.e. model-based) framework to facilitate interrogation, integration, and application (Figs. 2, 3). Remote sensing and geophysics provide information about a wide range of crustal depths from surface imagery to near-surface (e.g. electromagnetics (EM), magnetics) and deep crustal (e.g. magnetotellurics (MT), gravity) imaging.
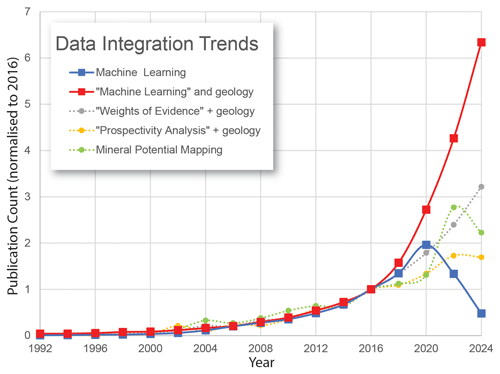
Figure 1Google Scholar™ search results for a range of common data integration phrases used in geology and mineral exploration. Data for each point on the graph comprise all results for the 2 years prior to that year. Each dataset is normalised to 2016 to provide a meaningful comparison of recent trends in the use of different techniques. Based on Austin et al. (2021a).
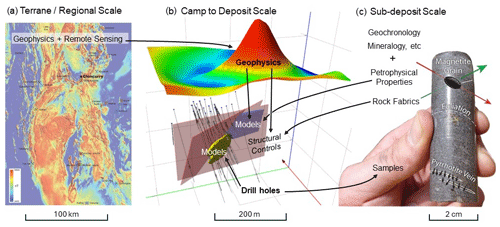
Figure 2Illustration of some of the different scales of data in mineral exploration and some common linkages between scales. (a) The terrane/regional scale is dominated by geophysics and remote sensing; (b) the camp to deposit scale is dominated by drilling and geophysics, is multi-dimensional, has mixed resolution, and may involve several feedback loops with the sub-deposit scale; (c) the sub-deposit scale acquires material from the deposit scale and feeds back constraining information (e.g. petrophysics, mineralogy, rock fabrics).
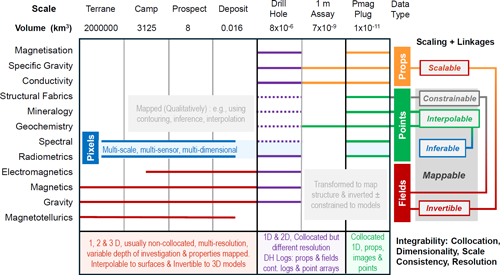
Figure 3Schematic illustrating different types of data used across regional exploration (left); resource definition (centre); and deposit characterisation, linkages between datasets at different scales, and some methods of scaling datasets. The left panel lists techniques by relative depth effectiveness. The lower panels provide a summary of data integrability. Dashed lines indicate data may be collected as a series of points (cf. continuous measurements).
A major application of geoscience data is mineral exploration, which utilises multiple techniques across a range of resolutions, spatial distributions, depth sensitivities, and precision levels to vector towards mineralisation, narrowing the search space from the terrane to deposit scales. Exploration is guided by geological knowledge, ranging from assumptions (e.g. generic deposit characteristics) to qualitative interpretations and hard data. During the early stages of exploration, the integration of those data is largely qualitative and map-based (2D) and incorporates multiple scales of data. The approach is tried and tested, is often effective, and is appropriate given the nature of the data utilised. However, it is primarily qualitative and can overlook some of the intrinsic properties of the data, including sparsity and their multi-scale, multi-resolution, and multi-dimensional nature. True integration of geoscience data (e.g. using modern data analytics such as machine learning) cannot overlook these issues without consequence.
Accurate scaling of multi-resolution and multi-dimensional data can be achieved using geophysics, provided scale-consistent, collocated ore body knowledge is available. Such quantitative knowledge of mineral systems allows conversion of mineral system processes into scalable properties, which constrain geophysical models, facilitate true quantitative integration, and underpin predictive mineral discovery.
Here we present (to our knowledge) the world's first publicly available, district-wide, scale-integrated, collocated geoscience dataset. It incorporates 2712 columns of data (NB >2000 of these are hyperspectral data) from nine different techniques and includes detailed petrophysical data, such as density, magnetic susceptibility, remanent magnetisation, magnetic fabrics (anisotropy of magnetic susceptibility, AMS), radiometrics, and conductivity. It contains comprehensive mineralogy, mineral texture, and alteration information based on TESCAN Integrated Mineral Analyzer (TIMA)–scanning electron microscopy (SEM) scans. It also contains comprehensive geochemistry (from both portable X-ray fluorescence analyses and analyses of powders) and hyperspectral data. It contains information for 1590 samples (many with three specimens each), extracted from 23 deposits and prospects: Altia, Artemis, Brumby, Barbara, Cameron River, Cannington, Canteen, Cormorant, E1 North, Eloise, Ernest Henry, Great Australia, Kalman, Kulthor, Little Eva, Maronan, Merlin, Monakoff, Mt Colin, Osborne, Starra-276, SWAN/Domain 81, and Trekelano.
This dataset allows all the major techniques used in mineral exploration and deposit characterisation to be correlated and contrasted at the same scale by providing quantitative, integrated insights into the processes that control geophysical signatures and better inform our understanding of the relationships between alteration and structure. This dataset is integrated by design: it comprises “complex” data (many columns) and not “big” data (many rows). But, if used to its full potential, it can enable more effective translation of geochemical, structural, and geological processes into physical parameters and potentially help make big data tangible in the mineral resource sector. It can help shift the current paradigm in mineral exploration (i.e. using a mixture of qualitative and quantitative data at different scales) towards the fully quantitative, scale-consistent datasets that can enable future mineral system science. We hope that this dataset will lead to new discoveries that are vital to the economy of the Mount Isa region, Australia, and furthermore hope it provides the impetus and inspiration for re-thinking the role of data in the outcomes of data analytics.
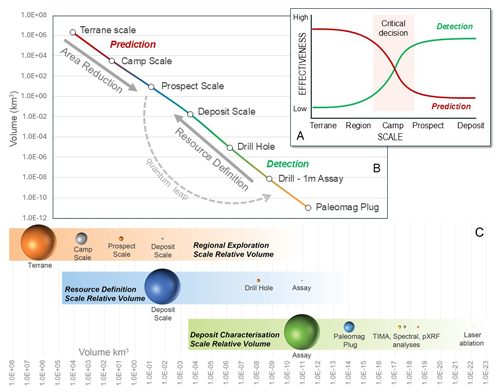
Figure 4Schematic illustrating different scales of investigation used in mineral exploration: (a) illustrates the relationships between scale and cost-effectiveness and the switch from prediction to detection at the camp scale (after McCuaig et al., 2010), (b) extends the insights of McCuaig et al. (2010) to the deposit characterisation scale and illustrates the quantum leap in data scale required to define a mineral resource, and (c) illustrates the relative volumes utilised across the three main scales and across a range of measurement techniques used in mineral exploration and deposit characterisation.
2.1 Geoscience data
Geoscience datasets have highly variable precision across different data types and scales, which drastically affect the resolution at which datasets can be confidently correlated. They are intrinsically multi-scale and are commonly collected and analysed at a range of different scales. In mineral exploration (for example), several different scales are used, including the terrane, regional, camp, deposit, and sub-deposit scales (e.g. drill holes, individual samples; Fig. 2). Scale in this sense may mean the resolution (pixel size) of a 2D image/raster or the voxel size of interpreted or interpolated 3D volume (Figs. 3, 4) but can also refer to the volume from which an analysis is conducted or the area on which a measurement is made. Scale varies greatly across techniques from the > km3 to < mm3 scale. Geochemical data, spatially, are simple point data relative to the scale and depth complexities associated with geophysics. However, the volume/area of those points varies across several orders of magnitude from metres to micrometres (µm) depending on the method of analysis (Fig. 4). For example, the measured volumes of various techniques utilised at sub-deposit scales (e.g. 1 m composite assay, palaeomagnetic plug, single-point portable X-ray fluorescence (pXRF) measurement, and laser-induced breakdown spectroscopy (LIBS)) span 11 orders of magnitude (i.e. 1×10¹¹ variation; Fig. 4). Complexities associated with the scale of different datasets may render data un-integrable even if they are collocated.
In addition to these scale and resolution issues, geoscience data are also multi-dimensional, comprising 1D information (e.g. drill holes), 2D information both on maps and in cross-sections, and 3D data (e.g. grids and voxels; Fig. 3). This multi-dimensional aspect is atypical in most other spatial data. For example, in a demographic dataset used to define the optimal location of new services, every piece of information is related to a single point (e.g. where a person lives) which has a unique spatial (x, y) location. Although the demographic data may have a z location, the third dimension is relatively inconsequential in the context of the demographic dataset. Many geoscience datasets (e.g. ground geochemistry) are comparable, with each point corresponding to a specific x, y point on a surface and numerous variables attributed to each point (e.g. Cu, Pb concentrations). Neither dataset type has any depth penetration, and the areal coverage of the data is infinitesimal in relation to the area of investigation (i.e. each analysis corresponds to a singular point rather than describing a substantial 3D volume). Interpreting simple x,y datasets is, not surprisingly, relatively uncomplicated in regard to dealing with scale and dimensionality, even though one could use any manner of complex analysis. The addition of a third dimension, as is common in many geoscience datasets (e.g. especially mineral and petroleum exploration data), and uncertainties related to depth sensitivities of different techniques add another level of complexity and, with it, additional data sparsity. This complexity of dimensionality interacts variably with scale and/or resolution complexities across a range of data types and acquisition methodologies (Fig. 3).
Data sparsity is a major factor for all types of geoscience data but specifically their application, for example, in mineral exploration. Sparsity can be defined as a function of scale, resolution, and dimensionality, but in practice, it is more typically a function of logistical factors such as project budget/workforce and site accessibility (e.g. Sect. 4). Scale, resolution, and by association data sparsity are inherently linked to mineral exploration strategy (Fig. 4a, b). Exploration typically starts at a terrane scale, using regional-scale datasets (e.g. geophysics and remote sensing) to define major crustal pathways, geodynamic triggers, and indicators of fertility (Smillie et al., 2017). Successively higher-resolution datasets and/or more scale- and depth-appropriate technologies are utilised to reduce the search space by approximately 3–5 orders of magnitude (Fig. 4a, b) to a relatively small area of perceived favourability (i.e. camp to prospect scales). The focussing of exploration on the sub-camp scale typically triggers a shift from low-cost, typically qualitative, predictive methodologies to high-cost, quantitative, direct detection (Fig. 4a; McCuaig et al., 2010), such as via drilling, assaying, and surface geochemistry, which hopefully define a prospect. The switch to detection methodologies at the camp to prospect scale coincides with a shift to higher-resolution, multi-scale, multi-modal, and multi-dimensional data (Fig. 2–4).
To define a statistically valid (e.g. JORC-compliant) resource requires high-resolution, quantitative, spatially representative data that can be extrapolated/interpolated upwards to the deposit scale (Fig. 4b). Hence, to get from the prospect to the deposit scale effectively requires a switch from mainly qualitative to quantitative methods and a quantum leap (of approx. 12 orders of magnitude) in scale to the drill hole/sample scale. Resources are defined by working backwards from the drill scale to the deposit scale (Fig. 4b). A resource can only be proven by improving the data volume (sampling more) to the point where statistical confidence in the upscaling technique (e.g. kriging) is achieved. This resource definition stage (i.e. the end goal of mineral exploration) requires the volume sampled (both resource and waste) to be within 2 orders of magnitude of the volume of the resource. But at all other scales of exploration, the ratio of sampled rock to area of interest is effectively infinitesimal. For example, at the terrane (or mineral system) scale, that ratio may range from (based on 2500 drill holes) to (based on 1500 palaeomagnetic plugs, as sampled here). Therefore, attempting to sample a mineral system holistically by sampling more will not be effective. Sampling smarter and better addressing the inherent resolution and dimensionality issues and depth limitations when transforming, scaling, and integrating data should be more effective.
2.2 Data scaling and translation
A range of approaches have been developed to address scaling issues in geographical, geological, and geophysical data. For example, Google Earth™ imagery (e.g. Gröger et al., 2005) uses various functions to represent maps and 3D buildings differently depending on the scale to which the user has zoomed in. This requires the database to have different-resolution imagery and differently scaled models available that can be loaded on the fly, and therefore the approach is multi-scale rather than scalable. Unfortunately, similar approaches have not yet been widely adopted across the geosciences, due in part to many of the complexities outlined above. There are, however, numerous commonly used statistical approaches used for the up- and downscaling of geoscience data, including fractal, geostatistical, general statistical, and machine-learning methodologies; Bayesian-, process-, and probability-based approaches; and resampling/interpolation (Ge et al., 2019).
Interpolation is commonly used to simultaneously re-scale raw data (e.g. geophysical surveys) and translate the spatial dimensionality of those data (e.g. from a grid of points or series of lines to a surface/raster). In many cases, the resolution of the input data varies substantially in the x and y dimensions; e.g. for aeromagnetic data, an along-line resolution of ∼8 m and an across-line resolution of 200 m are common survey specifications. In most cases, interpolation of survey data therefore involves downsampling along lines (i.e. 8 × 5 m) and upscaling across lines (i.e. 200 m 5) to produce a raster of intermediate resolution. A maximum resolution of 40 m can be achieved in this example, but the grid resolution and methodology for interpolation (e.g. inverse distance, minimum curvature, kriging) are user choices. Such methods not only are limited to a degree by the scale of the data (they are scale-dependent), but also involve human choices and are therefore inherently non-unique. Although scaled data products are commonly utilised and integrated as data, they are data products sensu stricto. Scaled data products, interpolations, and/or interpretations are nevertheless crucial intermediary products that allow disparate sources to be translated to a common spatial framework (e.g. maps, models), analysed, integrated, and in some cases (e.g. drilling, geophysics) interpolated and/or inverted to 3D data products.
The scaling and translation of multi-scale, multi-dimensional datasets into 3D can be achieved using a range of different techniques in two major categories: geostatistical and geophysical methodologies. A range of geostatistical techniques are utilised in geosciences to predict variables based on spatial datasets (Dumakor-Dupey and Arya, 2021). Inverse distance weighting (IDW) and kriging are commonly applied to mineral resource estimation to upscale point data to 3D volumes with calculated ore-grade prediction. A common methodology used to translate potential field geophysics into 3D is to adopt a voxel framework and attribute petrophysical properties to voxels based on inversion of the geophysical field data. Whilst convenient, such approaches can easily overlook issues of scale and the depth of investigation. For example, gravity and magnetics data can be jointly inverted using grid data despite a 100-fold difference in their resolution. If the resolution and depth sensitivities of the data used to derive 3D volumes of the sub-surface vary substantially with the scale of investigation, so too should those of models. Use of voxel inversions in integration also requires the user to address the inherent issue of non-uniqueness, which is particularly problematic for the inversion of vector properties (e.g. remanent magnetisation). This can be undertaken probabilistically (e.g. Giraud et al., 2023) based on any given number of possible models or geophysically based on petrophysical constraints (Austin et al., 2019a). Neither approach is optimal (i.e. probability does not need to honour physics, whereas petrophysical constraints are limited by sampling), but ultimately geophysical models need to honour physics and not probability. We therefore need probabilistic models that can honour petrophysical constraints, but more importantly we must have those petrophysical constraints in a form that can be integrated with other geoscience data.
2.3 Data integration
Historically, geoscience datasets have been gathered incrementally, often over extended timescales, by different people, in different institutions, and for different purposes. Geological surveys and companies may have set methodologies for data collection, but these evolve sporadically, and there are no universally accepted ways of collecting, analysing, or even reporting geoscience data.
Traditionally, geoscience data have been overlain in a manner more similar to cartography than true data integration. Such map-based integration is more art than science but nevertheless provides a qualitative means of assimilating multiple datasets, with different scales, levels of precision, and depths of analysis, into a common framework. Geoscientists undertaking this form of integration may account for some of the differences in scale and resolution on the fly, but beyond that, they can overlook the fact that each layer provides information at different scales/resolutions, often with variable depths of investigation and large variations in sparsity. In this cartographic approach to data integration, overlooking the scale–resolution–dimensionality issue may not substantially affect the outcome.
This traditional cartographic approach is utilised by a range of modern, data-based methodologies for exploration including various methods of mineral prospectivity mapping (MPM), which utilise GIS-based applications to analyse and integrate multi-source and multi-scale exploration data (Yousefi et al., 2021). Whilst effective at the regional to camp scale, MPM has struggled to deal effectively with the complex, multi-scale data used to characterise ore-forming processes (Porwal and Kreuzer, 2010; Yousefi et al., 2019). Therefore, the improved characterisation of ore-forming processes at multiple scales is essential to improving the effectiveness of MPM (Kreuzer et al., 2020; Yousefi et al., 2021) and furthermore novel 3D approaches to data integration (e.g. Li et al., 2024; Deng et al., 2022; Xiang et al., 2020).
Volumetrically, once geoscience data are scaled and translated to make predictions about 3D geology, it must be accepted that there are far fewer knowns than unknowns. Much of our understanding is interpretation, not fact, and consequently, the uncertainty associated with each dataset, in the context of a large 3D volume of rocks (e.g. the Cloncurry district), is very high. As we integrate additional data types, the uncertainty propagates and is often poorly captured in our models.
The many nuances, limitations, and pitfalls associated with most types of geoscience data significantly affect the outcomes of modern data-driven approaches. In many cases, these issues are well understood by domain experts, but such knowledge is often not appropriately transferred to data scientists. Some of the main issues include
-
understanding the effects of sample size, resolution, and dimensionality of different types of data, as well as the limitations thereof;
-
recognition of the differences between various geophysical techniques, imaging techniques, and point sample analyses (i.e. differences in the intrinsic scale and resolution and implications for the depth of investigation);
-
realising that differences in the way data are scaled (e.g. simple subjective interpretation, hand contouring, interpolation, and inversion) impact the precision of the resultant datasets;
-
knowing that some datasets are partially compatible in some instances (e.g. magnetics and gravity often overlap) but most datasets are not because they often describe unrelated properties at different scales and/or different crustal levels (e.g. geophysics).
2.4 Integration by design
We must work at a range of scales in geosciences, but the issues highlighted above make holistic approaches to mineral system knowledge problematic, particularly at larger scales. Therefore, rather than starting at the large scale, i.e. starting with a large area and attempting to force disparate datasets to describe concise voxels (3D pixels) in a model, it may be advantageous to characterise mineral systems at a scale where we can be confident of the coupling of the datasets (i.e. at the small scale). The integrated characterisation approach builds on traditional approaches used in hard-rock petrophysics (e.g. Mutton and Shaw, 1979; Brescianini et al., 1992; Webb and Rowston, 1995; Bishop and Emerson, 1999; Austin and Blenkinsop, 2008; Austin et al., 2013) by linking properties to quantitative geological information. Similar approaches that collect scale-constrained, collocated datasets are increasingly being adopted globally (e.g. Enkin et al., 2016, 2020; Dentith et al., 2020; Leväniemi and Hokka, 2022). Although working at the sample scale may not allow for extrapolation across large areas or volumes mathematically, it does provide quantitative, collocated characterisation of a suite of measurable parameters at a consistent scale. Those measurements are made on a range of different volumes (ranging between palaeomagnetic plugs and pXRF spots; Fig. 4c). However, using a systematic approach (e.g. Sect. 4.1), we can ensure samples are both homogenous and representative of the mineral system. That consistency of approach circumvents the potential volume issues between various data streams to a large degree. Cloncurry METAL (Austin et al., 2024) is therefore a truly integrated dataset which does not require assumptions, inferences, inversions, and interpolations prior to integration.
Scale-integrated, collocated datasets can be utilised, with confidence, for a variety of statistical and machine-learning approaches to understand the mineral system holistically. The outcomes from scale-constrained analyses can be utilised to make better use of a suite of compatible but spatially distinct techniques at expanded scales, where their own specific nuances of scale, resolution, and dimensionality can be accommodated more effectively. For example, if a particular pattern that suggests mineralisation is related to a specific radiometric and magnetic signature, we can target such patterns in those specific regional datasets. As a by-product, this approach provides ammunition to make better-informed decisions about which datasets are crucial and where individual datasets should be improved in terms of coverage, resolution, depth penetration, and/or precision.
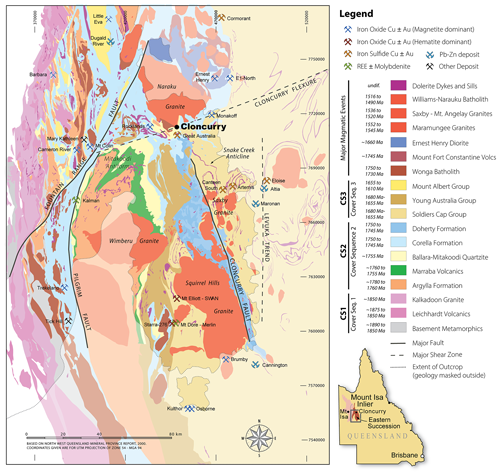
The Cloncurry district (Fig. 5) is a richly endowed region in northwest Queensland, Australia, that contains a range of mineral systems which have produced deposits of various commodities, including base metals, precious metals, and rare earth elements (REE). It has undergone a protracted structural and metasomatic history (e.g. Foster and Austin, 2008; Rubenach, 2013). Whilst there is much conjecture as to the genesis of deposits and timing of different styles of mineralisation (e.g. Groves et al., 2010; Hitzman et al., 1992; Hitzman, 2000; Williams et al., 2005), there is general agreement on the broad timing of major structural, metamorphic, magmatic, metasomatic, and mineralisation events (Fig. 6).
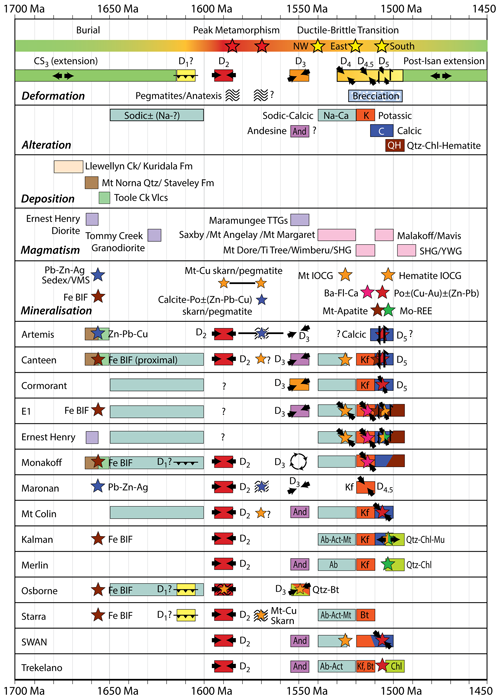
Figure 6Condensed and simplified tectonic, metasomatic, depositional, magmatic, and metallogenic history of the Cloncurry district mineral system (five upper panels) and the processes observed at each of the deposits and prospects discussed in the study (modified from Austin et al., 2016f).
The Cloncurry district is very diverse in terms of the types and styles of mineralisation present. It is notable as an iron oxide copper–gold (IOCG) district, but in many ways, there are few sensu stricto IOCG deposits present (e.g. Ernest Henry, SWAN, E1 North) based on the earliest classifications (e.g. Hitzman et al., 1992). Many deposits could be referred to as IOCG-related (e.g. Monakoff, Starra, Osborne), but Broken Hill-type (BHT), skarn, and volcanogenic massive sulfide (VMS) deposits are also present. Various studies have recognised a continuum between different mineralisation styles in different deposits (e.g. Williams, 1998; Austin and Blenkinsop, 2009), and the Cloncurry deposits comprise components of iron–apatite (Kiruna-style), magnetite-dominant IOCG, pyrrhotite-dominant iron sulfide copper–gold (ISCG), and hematite-dominant IOCG assemblages. There is also an array of skarn-like assemblages (Williams and Heinemann, 1993; Williams and Baker, 1995; Roache et al., 2005). These include dolomite–magnetite–chalcopyrite (e.g. Starra-276; Patterson et al., 2016c) to calcite–pyrrhotite–sphalerite–chalcopyrite assemblages (e.g. Artemis; Austin et al., 2016c; Knorsch et al., 2020), calcite–pyrrhotite–chalcopyrite assemblages (e.g. Canteen; Austin et al., 2016i), calcite–pyrrhotite–galena (Maronan; Austin et al., 2016a), and calcite–baryte–fluorite–magnetite–chalcopyrite (e.g. Monakoff; Austin et al., 2016e). High-temperature garnet-, pyroxene-, and amphibole-rich (i.e. non-carbonate) “skarn-like” varieties are present, predominantly in association with Pb–Zn mineralisation types, e.g. Cannington (Chapman and Williams, 1998; Roach et al., 2005), Pegmont (Williams et al., 1998), Maramungee (Williams and Heinemann, 1993), and Maronan (De Jong, 1995; Austin et al., 2016a). Austin and Blenkinsop (2009) suggested some of these deposits had characteristics which were transitional with those generally considered part of VMS (e.g. Maronan; Austin et al., 2016a) and/or IOCG-style systems (e.g. Monakoff; Austin et al., 2016e).
Overall, the Cloncurry district is geochemically, structurally, geophysically, and metallogenically complex. It has long been a challenging terrane for explorers, and many, often conflicting, interpretations have been generated for the district over the last century. Geophysical techniques (primarily aeromagnetic surveys) were instrumental in the last major round of discoveries including Ernest Henry (Webb and Rowston, 1995), Osborne (Anderson and Logan, 1992), Cannington (Walters et al., 2002), and Eloise (Brescianini et al., 1992), but they are becoming less fruitful as bullseye targets are increasingly exhausted and the search space deepens. GIS-based statistical approaches to mineral prospectivity mapping (e.g. Mustard et al., 2004; Ford and Blenkinsop, 2008; Austin and Blenkinsop, 2009; Cole et al., 2020) have provided some new targets but are often poorly constrained by quantitative mineral system characterisation. Both geophysical and mineral prospectivity mapping approaches to exploration may increasingly be failing due to the adoption of generic deposit models that misrepresent the complexity of and variability in the mineral system.
Within the global context, the district is unparalleled in its diversity of mineralisation styles, related alteration assemblages, and associated geophysical signatures. It is lithologically diverse, preserves a distinct metamorphic gradient (i.e. upper amphibolite in the SSE to lower greenschist in the north; Foster and Austin, 2008), exhibits complex and heterogenous deformation, and consequently exhibits variable rheological conditions across several mineralising stages (Fig. 6). The diversity of mineralisation styles produced is primarily a consequence of rheological, metamorphic, and structural inhomogeneity. It is challenging to pigeonhole different styles of mineralisation within the district, but perhaps these seemingly disparate mineral deposits are part of a larger interrelated mineral system. The dataset that is presented here provides a unique opportunity to examine this complex mineral system through quantitative and scale-consistent means. We believe that this style of dataset is a prerequisite to the next paradigm shift in exploration of the Cloncurry district and will challenge how we use data to explore in this highly complex piece of the Earth's crust.
4.1 Sampling strategy
The aim of this project was to develop a comprehensive sample suite which is representative of the deposits and prospects in the Cloncurry district (Fig. 5), with particular focus on the following significant resources: the Ernest Henry, Starra, Osborne, SWAN, Eloise, and Cannington deposits. Systematic sampling was critical for maximising exploration insights into the mineral system. Our ability to sample representatively was mainly limited by our access to material and hence was dependent on maintaining relationships with key stakeholders including the Geological Survey of Queensland and collaborating mining and exploration companies.
Ideally, the sampling strategy was driven by or at least informed by company geologists with a priori understanding of individual deposits. However, holistic sampling is always limited by where holes are drilled and what core is available for sampling. In some instances, ideal holes were drilled early, and sometimes these were degraded via oxidation, were unlocatable, lacked appropriate orientation data, or were assayed to the extent that little material remained. Drilling is commonly focussed on the core of a deposit, and in some instances, there was a lack of drill core material available to sample through the distal footprint and into the background and/or along the strike. In such cases, surface and open-pit sampling was conducted.
Field surface sampling in ancient highly weathered terranes introduces an additional bias because the availability of fresh material is a direct function of the competence of the material. For example, at Starra, differential weathering has resulted in the competent silicic ironstone forming a prominent ridge of outcrop but minimal (and highly weathered) exposures of host rocks in the footwall and hanging wall. Open mine pits provide opportunities to sample the local footprint but also introduce sampling biases. For example, in situ rocks can only be sampled from pit walls, where they are accessed by a haul road, and only when they are considered competent enough to stand under. The core of the system generally coincides with the base of the pit, which is often filled with water and/or loose material, making it inaccessible, and in some cases exposed underground workings and mine wall instability may render parts of the pit off-limits.
In sampling for petrophysical properties, we must be opportunistic, utilising whichever sampling approaches will provide the best coverage of a specific deposit whilst also maintaining strict sampling protocols, e.g. not oversampling mineralised sections.
Several basic criteria should always be adopted, as outlined below.
4.1.1 Zonation
The aim of drill hole selection and sampling was to provide a representative, scale–consistent sample suite across the mineral system. Sampling covering the ore zone and proximal, medial, and distal alteration through to the background in both the hanging wall and the footwall was conducted for each deposit or prospect. This is relatively straightforward for upright linear systems with clearly defined footwalls and hanging walls such as Starra-276 (Sect. 4.2.4). However, different deposit styles present different challenges. Breccia pipes (e.g. Ernest Henry, SWAN, Brumby, E1 North) may be concentrically zoned, and Broken Hill-type systems may include complexly folded, zoned stratiform mineralisation in addition to fault-controlled replacement.
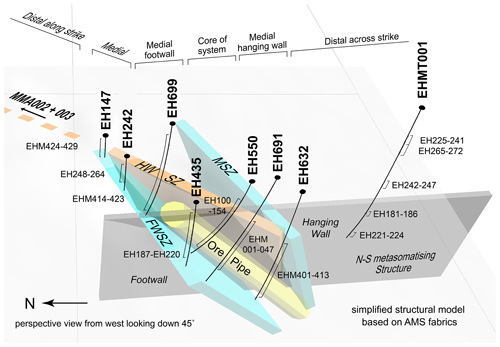
Figure 7Simplified 3D structural model of Ernest Henry based on measured AMS fabrics. All drill holes sampled are presented along with the respective sample numbers. The zonation of the system as it relates to the samples is approximated by titles along the top of the figure. The model is viewed from the west and looking down at ∼45°. The scale varies in this perspective view.
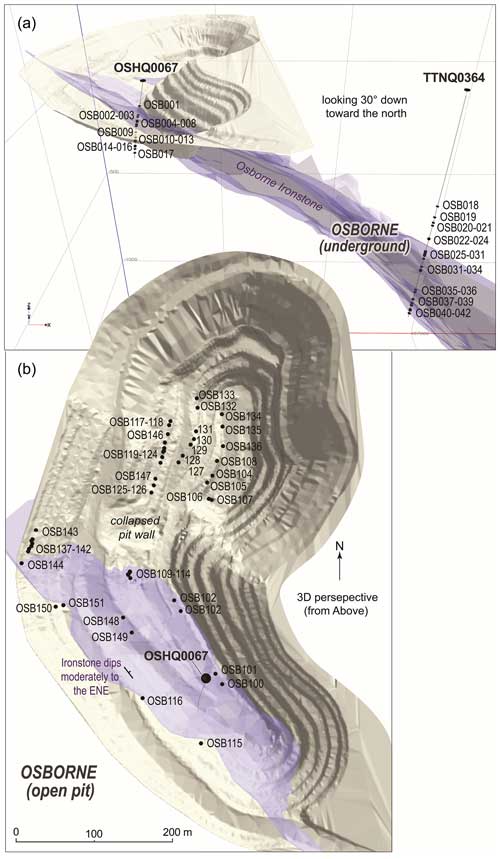
Figure 8Sampling of Osborne incorporated (a) diamond drill core samples combined from two holes, one in the open pit and another to the east, as well as (b) substantial sampling within the open pit. Collectively the samples cover a series of ENE-dipping mineralised ironstones (shown in purple) which extend from the southwestern pit wall towards the centre of the pit and continue east into the underground mine, with host rocks on either side (i.e. the footwall and hanging wall).
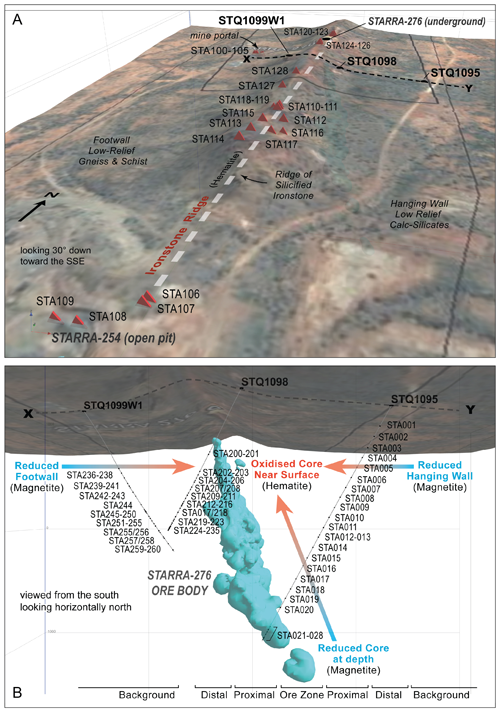
Figure 9(a) A 3D view of © Google Earth imagery draped on a DEM over an ironstone ridge cropping out between Starra-257 and Starra-276. The majority of surface samples were silicified hematite-dominant ironstones used to examine the relationships between redox and mineral zonation along the strike. (b) An underground 3D view of Starra-276, and the location of samples. The turquoise body is a 0.75 % equivalent copper-grade shell. Underground sampling provides excellent east-to-west and surface-to-depth coverage across the Starra system and can be used to understand the relationships between redox and mineralisation across the strike and to depth.
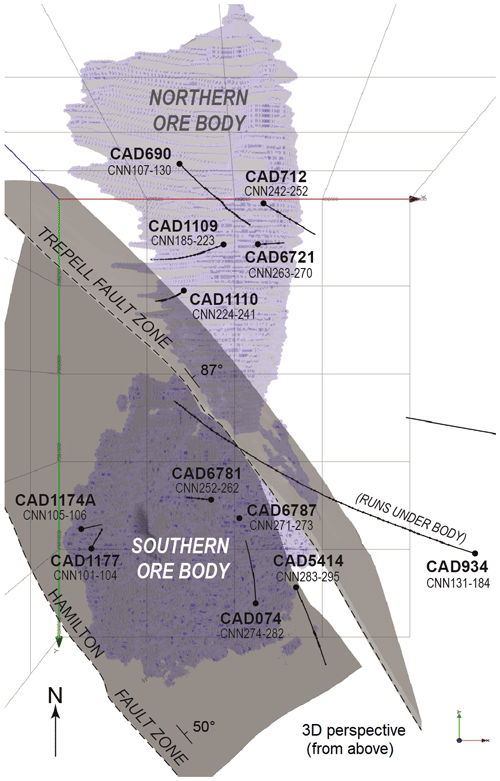
Figure 10A 3D model of the Cannington ore body, with samples covering the northern and southern mineralised zones, all seven ore types, the alteration zone adjacent to the ore body, and all host lithologies (including psammite, schist, gneiss, and amphibolite).
Adequately capturing the mineral system requires appropriate coverage both across and along the strike, and several strategies have been adopted based on the complexity of the deposit and the material available to sample.
-
For deposits under cover with a wealth of near-mine drilling (e.g. Ernest Henry; Fig. 7), it was possible to sample variability in core to distal zonation across and along the strike using diamond drill core.
-
In open-pit mines with limited drill hole availability (e.g. Osborne; Fig. 8), we undertook hybrid sampling of diamond core and open-pit blocks/palaeomagnetic cores to improve areal coverage.
-
In underground mines where drill holes through the distal footprint were limited (e.g. Starra-276; Fig. 9), we undertook hybrid sampling of diamond core and surface blocks/palaeomagnetic cores.
-
Deposits modified by near-surface alteration (e.g. Starra-276, E1 North) also required surface-to-depth sampling to capture possible overprinting effects.
-
For complex, structurally, metamorphically, and metasomatically modified deposits with no obvious alteration footprint (e.g. Cannington; Fig. 10), we utilised local geologists to ensure coverage of all lithologies and ore types.
4.1.2 Sample spacing
Representative sample spacing downhole throughout a mineral system is critical to ensure that a representative view of the 3D volume of the system is captured in the dataset, but it is rarely possible due to a range of factors. Inhibiting factors for drill core sampling include variability in the quality of core (e.g. due to weathering, shearing, cracking); unsuitable sample volumes, mainly as a result of assaying (e.g. different core sizes and with a full, half, or quarter core); and whether individual lengths of core are oriented. Sample frequency for surface sampling is mainly limited by where fresh rocks crop out, and mine sampling is mainly limited by the location of mine walls and other safety factors. Furthermore, the extent of zonation in mineral deposits and their alteration halos vary widely, ranging from <1 m to kilometres in scale, so the sampling frequency was varied depending on the size and complexity of the system locally to capture a representative suite of samples. In complex and heterogenous lithologies, the sampling frequency was higher (e.g. <1 m in mineralised zones), whereas in more homogenous and distal lithologies, the sampling frequency was typically reduced (e.g. >10 m).
4.1.3 Representativity
Samples were selected to be representative of the lithology of that part of the drill core (i.e. similar to the majority of the core across several trays) in order to capture the bulk physical properties of that lithology. Adopting this strategy allows for upscaling of the physical properties with confidence in geophysical modelling. Whilst some of the sampling conducted adheres to this methodology quite stringently, there are cases of oversampling through the mineralised zones, cases of undersampling through the mineralised zones where no core remained in the tray, and cases where samples could not be obtained due to a lack of appropriately sized or appropriately oriented core.
4.1.4 Orientation
Oriented samples are critical for geographic corrections to both anisotropy of magnetic susceptibility (AMS) and remanent magnetisation measurements. In some cases, where holes are drilled at near-vertical orientations, caution should be taken when interpreting AMS and palaeomagnetic results because where the dip approaches 90°, the strike of the orientation becomes increasingly unreliable. However, in general, holes will tend to lift with depth, and as the plunge decreases, the orientation becomes increasingly reliable (even at dips of ∼85°).
4.2 Sample distribution
The data presented here were gathered from 1590 samples, taken from 23 mineral deposits and prospects across the Cloncurry district, Queensland. The sampling undertaken spanned almost a decade, starting with pilot projects from 2011–2014 and then under two major Queensland Government-funded projects: Uncover Cloncurry (2015–2016) and Cloncurry METAL (2018–2021).
4.2.1 Uncover Cloncurry samples
The Uncover Cloncurry project collected relatively few samples per deposit but provided a broad overview of the true range of mineralisation styles present in the Cloncurry mineral system. The deposits and prospect types sampled included Broken Hill-type (BHT) deposits, such as Altia Pb–Zn–Ag; Artemis Zn–Cu; Maronan Pb–Zn–Ag; iron oxide copper–gold (IOCG) type, including Brumby Cu–Au, E1 Cu–Au, Kalman Cu–Au–Mo, Monakoff Cu–Au, Trekelano Cu–Au, and related breccia sulfide ores (e.g. Merlin Mo–REE); iron sulfide copper–gold (ISCG) type, including Canteen Cu–Au and Cormorant Cu–Au; and skarns (e.g. Mount Colin). Sampling was undertaken on only one or two diamond drill holes for many of these deposits and prospects, and in some cases, the sampling may not be sufficiently representative. However, in many cases a significant number of diamond drill holes were sampled (e.g. Maronan, Brumby), and in some cases blocks and hand-drilled samples were extracted from mine pit walls (e.g. Monakoff, E1). Information on the location and geological context of those samples can be found in the Uncover Cloncurry reports, e.g. Austin et al. (2016a, c, d, e, f, g, h, i), Gazley et al. (2016a, b, 2017), and Patterson et al. (2016a, b), and/or is discussed further below.
4.2.2 Ernest Henry Cu–Au deposit
Ernest Henry is the most comprehensively sampled deposit in this dataset, with samples from 10 diamond drill holes (Fig. 7). The bulk of the holes intersect the core of the deposit (e.g. EH691, EH550, and EH435), with representative holes intersecting the proximal (e.g. EH631), medial (e.g. EH632), and distal (e.g. EHMT001) parts of the alteration footprint across the strike to the southeast. Other holes are intended to sample the proximal (e.g. EH147), medial (e.g. EH242), and distal zones (e.g. MMA002 and MMA003) along the strike to the northeast of the deposit. Sampling of Ernest Henry was completed in four phases. Initial sampling of EH691 was completed on-site at the Ernest Henry Mine in 2015. Phases 2–4 were completed as drill holes were made available at the GSQ core facility in Zillmere, Queensland, Australia. A summary of the drill holes sampled is provided in Fig. 7, and detailed descriptions of the samples and their context within the deposit and its environs are provided in Schlegel et al. (2021, 2022) and Austin et al. (2021b).
4.2.3 Osborne Cu–Au deposit
Osborne was sampled both from diamond drill cores and from within the open pit (Fig. 8). The two sampled drill holes (OSHQ0067 and TTNQ0364, total of 42 samples) cut across the mineralised zone in the near-surface region and towards the base of the underground mineral resource, respectively. Hand-drilled cores and oriented block samples (52 in total) were collected from several traverses across key sections of the open pit, providing excellent coverage of the deposit (particularly the lower and upper ironstone horizons). Numerous samples were also taken outside the mineralised horizons. However, it was not possible to apply a representative sampling grid due to several factors including ground instability (i.e. the large debris slope in the middle of the mine), which contributed to the lack of samples between the two main ironstone horizons. Other complicating factors included risks associated with working under high/steep pit walls and restricted access to areas in which underground workings were exposed. All the samples were accurately surveyed courtesy of the Chinova mine surveyor, and further information on samples and their context within the deposit and its environs is provided in McFarlane et al. (2021b).
4.2.4 Starra-276 Au–Cu deposit
Starra-276 was sampled from the surface and also from three drill cores. The surface sampling was intended as a pilot study to assess the feasibility of weathered samples for mapping regional alteration zoning. However, the local outcrop is so dominated by highly competent (silicified) hematite ironstones that very few samples could be obtained from the incompetent, weathered, and eroded units on either side. This resulted in 27 hand-drilled and block samples from the surface at Starra-276 (Fig. 9a). Most of the surface samples were obtained from the ironstones, cropping out above and to the north and south of Starra-276. These were collected to assess along-strike geochemical variability in the ironstone and for comparison with samples from depth to test the vertical zonation within the system (e.g. super- or hypogene enrichment). The remaining samples are from three diamond drill holes which form an E–W cross-section through the system, with 38 samples from STQ1095 (Patterson et al., 2016c) complemented by a further 61 drill core samples from two scissor holes (STQ1098, STQ1099W1) covering the footwall and hanging wall of the deposit (Fig. 9b). Whilst on-site, detailed magnetic susceptibility logs for the scissored drill holes were acquired, which can be used for comparison with geochemical data. Further information on sampling and their context within the deposit and its environs is provided in McFarlane et al. (2021a).
4.2.5 Cannington Ag–Zn–Pb deposit
Ten drill holes were sampled at the Cannington Mine site, aiming to cover the deposit from north to south and shallow to deep (Fig. 10). The 190 samples collected provide a representative suite of the seven different styles of mineralisation found at Cannington, i.e. the Kheri, Cuckadoo, Broadlands, Glenholme, Burnham, Inveravon, and Nithsdale types, and a representative selection of the host rocks of the deposit in both the northern and the southern zones. Samples were taken from outside the system into the core mineralisation types to assess the proximal-to-distal footprint of the system. Although there are uncertainties regarding the extent of the footprint of the Cannington deposit (many suggest a small alteration footprint), we aimed to obtain a representative selection of what the local geologists interpret as the alteration footprint, referred to as SHMU (sillimanite–muscovite schist). Drill hole CAD934, which skims the periphery of the system from shallow levels to beneath the body, provides an opportunity to test the extent of the deposit footprint. Further information on samples and their context within the deposit and its environs is provided in Pearce et al. (2021).
4.2.6 SWAN Cu–Au deposit
The SWAN-Mount Elliott camp was sampled from four drill cores: three from the SWAN system and one from Mount Elliott ∼900 m to the east. MEQ1215 (56 samples) was drilled into the hanging wall of the SWAN system, dipping to the southwest through the main ore/breccia body. Additional holes were selected to generate a representative E–W cross-section through the SWAN deposit, intersecting the distal and proximal alteration zones through the main ore/breccia body. Drill holes MEHQ07105 (8 samples) and MEHQ011130 (52 samples) are to the east of MEQ1215 and are scissored holes which cut through the main breccia body from the east and west, respectively. MEQ-95-208 is sampled from ∼195 m depth in the Mount Elliott hanging wall, through a “skarnoid” mineralised zone and into the footwall. Further information on samples and their context within the deposit and its environs is provided in Stromberg et al. (2021) and Patterson et al. (2016a).
4.2.7 Eloise Au–Cu deposit
Eloise was sampled at a 30 m average sample interval from numerous drill cores for a total of 58 samples. Sampling focussed on Eloise Deeps and three satellite deposits. Several short intervals from Eloise Deeps (drill holes ED62 and ED60) and Macy (MA03E), Chloe (EN003), and Middle West (EAM130) were sampled. A long drill hole through the main ore body at Eloise Deeps (ED126) was systematically sampled. The samples selected at each of the four mineralised bodies are representative of the main lithologies that host the deposits, capture their proximal-to-distal footprints, and intersect the various lodes. Further information on samples and their context within the deposit and its environs is provided in Birchall et al. (2021).
5.1 Sample preparation
The samples were extracted from surface and mine sampling (Starra-276, Osborne, Monakoff, E1) and diamond drill holes as outlined in Sect. 4, producing a range of different physical samples that required different initial preparation prior to analyses.
-
The 25 mm diameter cores, drilled in situ with a petrol-powered rock drill, were oriented in situ using a sun compass which was unaffected by extreme local magnetic fields present at many sites. In some cases these samples needed to be re-assembled and glued before being marked with orientation lines.
-
The 10–50 cm blocks extracted by cold chisel and hammer from the surface outcrops and open pits were also oriented using a sun compass in the field. The sun compass orientation marks were used to draw azimuth lines on the block surface. The block was then drilled perpendicularly to the orientation surface using a 25 mm diamond coring drill. The orientation mark was thus transferred from the block surface to the top of the 25 mm core.
-
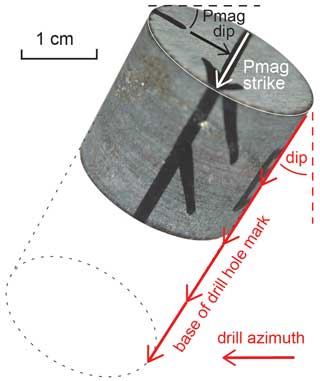
The 10–30 cm pieces of either NQ (48 mm diameter) or HQ (63 mm diameter) core sampled from diamond drill holes were oriented using a method that differed from the standard palaeomagnetic method, with marks pointing downwards along the base of the hole (Fig. 11). Therefore, orientations were re-marked to the standard palaeomagnetic system prior to re-drilling and cutting (Fig. 11). In this system, the palaeomagnetic azimuth = the diamond drill dip azimuth − 90° and the palaeomagnetic dip = 90° − the diamond drill plunge. Once re-marked, a coring drill was used to drill down the axis of each sample to produce 25 mm cores.
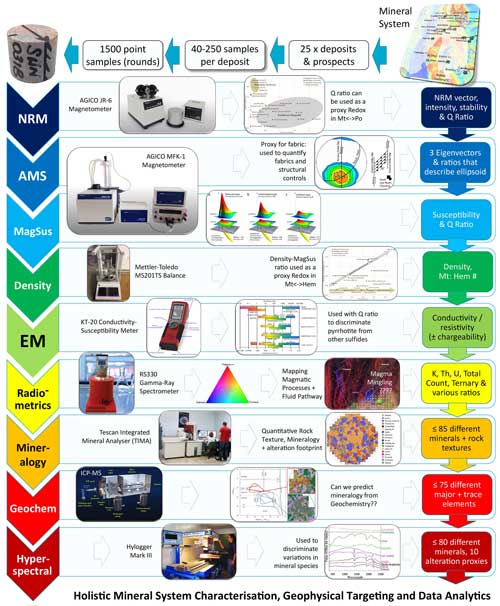
All samples were sawn into 22 mm long segments referred to as palaeomagnetic plugs or “rounds” (Figs. 11, 12). Cylinders of this dimension provide a good approximation of a dipole magnetic source (Riisager and Abrahamsen, 2003). At least three rounds were made from each sample where possible to provide statistically reasonable mean values for the petrophysical measurements. Preparing three samples also allowed for one sample to be used for geochemistry and mineralogy and one for alternating field demagnetisation (AFD), with one reserved for future analyses (e.g. geochronology; Portela et al., 2024). Samples were labelled with unique specimen codes and re-marked with orientation lines (Fig. 11) to enable measurements of vector information, e.g. palaeomagnetic vectors and magnetic fabrics (i.e. anisotropy of magnetic susceptibility; AMS). A range of analytical techniques, illustrated in Fig. 12 and outlined in Sect. 5.2, were applied to up to three specimens per sample.
5.2 Techniques (methods, instrumentation, data processing, and pitfalls)
5.2.1 Density measurements
The density of an object is defined as mass per unit volume, but it is commonly assumed to be the weight in air of a unit volume of an object at a specific temperature (Johnson and Olhoeft, 2017). Petrophysical studies routinely consider sample weight to be equivalent to mass due to the minimal discrepancy. “Density” may refer to either dry bulk density, in which the solid material and pore space are considered, or saturated bulk density (grain density), in which only the volume of solid material is considered, or both. Bulk density, especially of sedimentary rocks, varies significantly with fluid content (water) within pore spaces (Johnson and Olhoeft, 2017), but in most cases crystalline igneous, metamorphic, and metasomatic rocks (i.e. almost all rocks observed in this study) preserve sufficiently low porosity for the dry and saturated bulk densities to be effectively equivalent (i.e. within 0.001 g cm−3). Densities should be stated in SI base units (kg m−3) but are more commonly reported in g cm−3 (3 orders of magnitude smaller), mainly for ease of use.
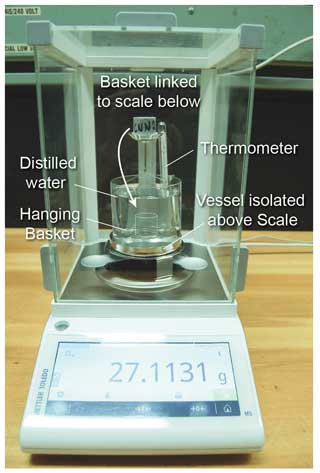
Figure 13Mettler Toledo MS204TS analytical balance with hanging basket suspended in distilled water.
Specific gravity, as measured in study, is the density relative to a standard substance (commonly water). Based on the Archimedes principle, specific gravity (SG) is calculated as the ratio of the weight/mass of a rock sample in air at a stated temperature to the weight/mass in air of a unit in a volume of gas-free distilled water at a stated temperature (Johnson and Olhoeft, 2017). In this study, SG values were calculated based on weight measurements made using a Mettler Toledo MS204TS analytical balance, which is designed specifically for making SG measurements of this kind (Fig. 13). An earlier version of the same instrument, the Mettler Toledo AG204, was utilised for some legacy samples (see column U in the database).
Samples were initially weighed in air and then subsequently weighed in distilled water.
The SG and volume of each sample were calculated using the following equations:
where ρ is density, A is the sample weight in air, B is the sample weight in liquid, ρL is the density of the liquid, and V is the sample volume.
SG values for up to three specimens per sample (columns P–R in the database) were used to derive mean SG values (column S) and an associated standard deviation (column T). Although SG is dimensionless, being a ratio of two densities, we report it here in density units (g cm−3) because the denominator (the density of water) is effectively a constant (approximately 1 g cm−3), and therefore the SG is effectively equivalent to bulk density.
Volume results determined using the Archimedes principle are utilised to make volume corrections to other petrophysical parameters, specifically magnetic susceptibility and natural remanent magnetisation (NRM) measurements.
5.2.2 Magnetic susceptibility measurements
Magnetic susceptibility measurements are the most common type of petrophysical quantity collected in mineral exploration, and along with measurements of remanent magnetisation, they allow for determination of the in situ magnetisation of different lithologies and alteration styles that can be used to constrain forward modelling and inversion. Magnetic susceptibility measurements were made using an AGICO MFK-1A Kappabridge magnetometer. However, for legacy samples, other instruments may have been utilised (see column AA in the database).
The MFK-1A Kappabridge apparatus consists of the pick-up unit, control unit, and computer and represents a high-precision fully automatic inductance bridge. It automatically zeroes between readings, automatically compensates for the thermal drift of the bridge, and automatically switches to an appropriate range. The measuring coils are designed as sixth-order compensated solenoids with high field homogeneity. The instrument is based on micro-electronic components, with two microprocessors controlling all functions of the Kappabridge, and is fully controlled by an external laptop computer. The output signal from pick-up coils is amplified, filtered, and digitalised, and raw data are transferred directly to the computer in the form of .ran files and/or .ams files, which are native formats for AGICO's Anisoft™ 4.2 and 5.0 software packages.
Bulk susceptibility measurements were taken with the field strength set at 200 A m−1 to maximise the dynamic range of the sensor. The MFK-1A apparatus calculates magnetic susceptibility values based on a nominal sample volume of 10 cm3, and therefore the results were later corrected using volumes calculated during density measurements.
Users should be aware that in magnetite-rich rocks with susceptibilities greater than 0.1 SI (especially above 1 SI), the self-demagnetisation effect considerably suppresses the intrinsic magnetic susceptibility of a rock (e.g. Austin et al., 2014). The measured magnetic susceptibilities reported in Austin et al. (2024) incorporate both the intrinsic susceptibility and suppression due to the self-demagnetising field. However, our measurements are also limited by the measurement range of the MFK-1A instrument, which can realistically only measure 10 cm3 samples up to susceptibilities of approx. 2.25 SI. Measurements of magnetite-rich and/or mushketovite-rich ironstones (which may have intrinsic susceptibilities of 10–20 SI; Clark, 1988) are likely beyond the detection limits of the instrument and may therefore be suppressed to some degree.
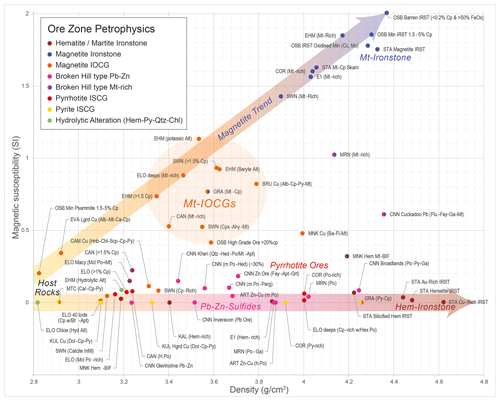
Figure 14Plot of density vs. magnetic susceptibility data, a common method for differentiating the abundances of major ore-forming minerals, e.g. hematite, magnetite, and pyrrhotite, providing knowledge that can be used to constrain geophysical inversions and also insights into the chemical factors controlling mineralisation, such as redox (Austin 2021b; Austin et al., 2021d). The first three letters of the labels correspond to deposit codes, and the remainder is a lithological description. Modified from Austin (2021a).
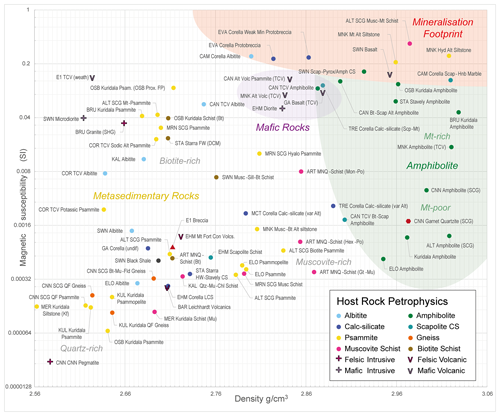
Figure 15Plot of magnetic susceptibility vs. density for a selection of host rocks and distal alteration assemblages from the Cloncurry district; shading indicates appropriate ranges for some common lithological classes. The first three letters of the labels correspond to deposit codes, and the remainder is a lithological description. Modified from Austin (2021a).
Magnetic susceptibility measurements were made on up to three specimens for each sample (columns V–X in the database) to derive a mean magnetic susceptibility value (column Y) for the sample and an associated standard deviation (column Z). Magnetic susceptibility is commonly plotted relative to density to compare the properties of different deposit types and their alteration halos. A linear plot is used here for ore deposits mainly because it provides a clear indication of the relative magnetic mineral contents relative to a linear magnetite trend (Fig. 14). A Henkel plot (logarithm of magnetic susceptibility against density; Enkin et al., 2020) is used to better differentiate more weakly magnetic samples from the alteration footprint (Fig. 15). The data correlate well with similar studies, e.g. the Great Bear IOCG deposits (Enkin et al., 2016), with IOCG deposits (e.g. Ernest Henry and SWAN) plotting just above the quartz–feldspar–calcite + magnetite line of Enkin et al. (2020).
5.2.3 Remanent magnetisation measurements
The direction of remanent magnetism is important in understanding the overall magnetisation strength and direction in highly magnetised mineralised bodies (e.g. Peculiar Knob; Schmidt et al., 2007). Understanding remanent magnetism is crucial to determining confidence in resultant 3D magnetic forward models and inversions because it facilitates a reliable estimation of the impact of remanent magnetisation on the overall (i.e. induced + remanent) magnetisation of the body. Where magnetised rocks have a high Koenigsberger ratio (a high ratio of remanent to induced magnetisation) and where the remanent magnetisation direction is significantly oblique to the inducing field, anomalies will be incorrectly modelled if they do not account for the remanent magnetisation.
At least two rounds from each sample underwent natural remanent magnetisation (NRM) measurements. The process requires the input of the sample orientation data to correct the measured magnetisation direction to geographic coordinates. For the Cloncurry METAL project, all samples were measured using an AGICO JR-6 spinner magnetometer. However, many of the legacy samples which are included in the Cloncurry METAL database (Austin et al., 2024) were measured on a 2G Enterprises 755R three-axis cryogenic magnetometer and/or a custom-made CSIRO three-axis spinner fluxgate magnetometer.
The JR-6 spinner magnetometer is the world's most sensitive and accurate instrument for measurement of the remanent magnetisation of rocks based on classical (non-cryogenic) principles and is the standard for palaeomagnetism worldwide (AGICO, 2021). It functions by rotating the rock specimen at a constant angular speed inside the pick-up unit inside a pair of coils. An alternating current (AC) voltage is induced in the coils, whose amplitude and phase depend on the magnitude and direction of the remanent magnetisation (RM) vector of the specimen. The resultant voltage is amplified, filtered, and digitised. Using harmonic analysis, the computer calculates two rectangular components of the projection of RM vector into the plane perpendicularly to the axis of rotation. The JR-6A version used has an automatic specimen holder which changes the position of the specimen during measurement to obtain the complete vector automatically. The measurement process is fully controlled by a PC, and the data are interpreted using AGICO's Rema6 software.
The 2G cryogenic magnetometer uses three superconducting-quantum-interference devices (SQUIDs) to measure the three components of the magnetic field with magnetic dipole moment noise of less than A m−1. Unfortunately, this system does not have the dynamic range necessary to measure strongly magnetised specimens. Strongly magnetised specimens therefore had to be measured on the three-axis spinner magnetometer. The three-axis spinner utilises a fluxgate magnetometer positioned adjacent to the sample spinning mechanism. The results of the NRM measurements yielded a magnitude, declination, and inclination of the magnetisation direction. The data extracted from the 2G and custom spinner magnetometers are recorded in a simple ASCII file which required substantial re-formatting before interpretation using Pmag software developed by Phil Schmidt (CSIRO). Remanent magnetisation and the Koenigsberger ratio are commonly plotted relative to density (Fig. 16) and/or magnetic susceptibility to characterise the dominant magnetic minerals within deposits and their footprints (e.g. hematite, magnetite, and pyrrhotite) which generally form under different redox conditions.
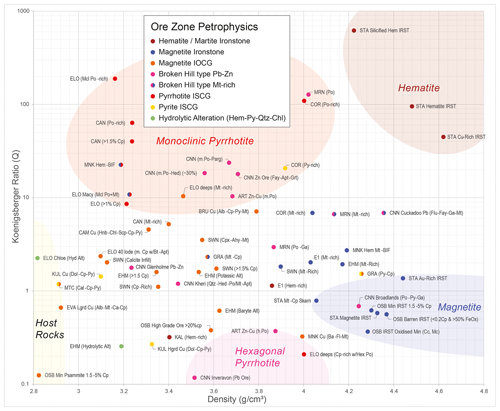
Figure 16The Koenigsberger ratio plotted relative to density; this is one tool petrophysicists use to characterise the dominant magnetic minerals within deposits and their footprints. Fe-oxides and sulfides such as hematite, magnetite, and monoclinic pyrrhotite all have characteristic petrophysical properties which provide information about the chemical conditions leading to mineralisation (e.g. redox and/or pH). The first three letters of the labels correspond to deposit codes, and the remainder is a lithological description. Modified from Austin (2021a).
5.2.4 Conductivity
Minerals act as semiconductors or insulators (silicates and oxides) in crustal rocks. In metal exploration, unlike for fluid-saturated rocks in petroleum petrophysics, conductivity is not primarily related to ions in pore fluids. Instead, conductivity is heavily dependent on the presence and interconnectivity (fabric) of metal-bearing minerals, e.g. chalcopyrite and galena.
Conductivity measurements were carried out for up to three rounds per sample using a KT-20 handheld susceptibility and conductivity meter which was set to 100 kHz, providing sensitivity as low as 0.1 S m−1. The equipment is widely used in the industry for susceptibility measurements but is prone to providing ambiguous results due to the placement of the sensor. A custom-made holder was utilised to counter ambiguity by ensuring the measurements always had the flat end of the round centred on the sensor. The results were quality-checked directly on the instrument display during collection and imported into the accompanying GeoView program. Subsequently, they were exported as discrete records in .csv format, which were collated for the database using a .bat script and then cross-checked against a measurement log. Users of these data should be aware that electrical resistivity and conductivity measurements are highly scale-dependent (Fitzpatrick, 2006). Fitzpatrick (2006) suggests conductivity should be measured on 1 m diamond cores to achieve reliable results. Whilst conductivity is measured at a consistent scale across all samples, the sample size is sub-optimal, and our conductivity measurements should be considered useful estimations of where sulfide occurs. Chargeability is not scale-dependent and would be a more suitable type of data to collect on small cores such as those used in this study.
5.2.5 Radiometrics
Radioactive isotopes have played an important role as a heat source during the Earth's history, and heat generation from intrusions is often included in mineral system models. Measurable parameters for heat production in rocks are the radioactive isotopes of uranium (238U), thorium (232Th), and potassium (40K). The heat generated per second by these elements (µW kg−1) would be presented as concentrations cU, cTh, and cK, respectively; the total Qr is the heat produced by radioactivity in the rock (Rybach, 1976, 1988):
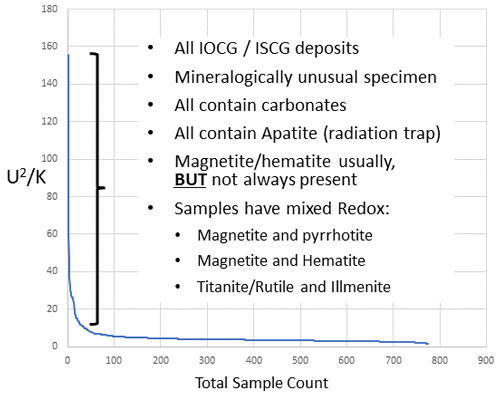
Radiometric measurements were conducted with a Radiation Solutions RS-332 gamma-ray spectrometer and a custom-made tray holding up to three rounds per measurement. For most samples, all three slots were used for assay mode measurements collected over 300 s (5 min) of run-time. The accompanying RS Analyst program was used to catalogue and export the data. Results were tabulated with K (40K), U (uranium and radium), Th (232Th), the dose, and the dose rate, using respective data units (%, ppm, nSv, nSv h−1). The data were imported into the database together with the measurement ID and the number of rounds in each of the measurements (N). Standard radiometric ratios, , , , , , and , were calculated and are also listed in the database. These ratios are a means of normalising the relative proportions of K, Th, and U in different rock types, independent of their total count, to differentiate K, Th, and U anomalism. It has long been recognised that uranium anomalism in airborne radiometric data correlates with mineralisation and fluid pathways at numerous sites within the study area (Lambourn and Shelley, 1972). However, gamma-ray spectrometry at the sample scale provides a petrophysical means of integrating mineralogical and geochemical understanding of ore formation, providing knowledge that can be used to better interrogate airborne radiometric datasets (e.g. Austin 2021b; Austin et al., 2021d). Uranium-anomalous specimens (i.e. those with in Fig. 17) have distinct mineralogical properties. They all occur in IOCG or ISCG deposits and prospects and contain carbonates (calcite and/or dolomite) and apatite. They are mineralogically complex and preserve mixed feldspar, titanium, iron oxide, and iron sulfide assemblages (e.g. they contain magnetite and pyrrhotite, magnetite and hematite, and/or titanite ± rutile and ilmenite). Walshe et al. (2016) have argued that the distribution of andesine–ilmenite assemblages versus K-feldspar–titanite assemblages can be used to define pH and/or redox gradients in IOCG systems.
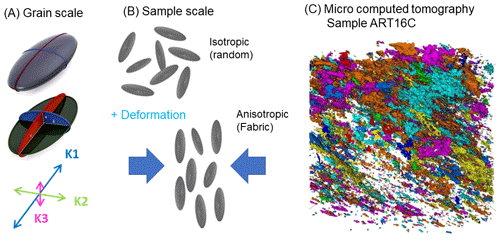
Figure 18(a) Anisotropy of magnetic susceptibility at the grain scale corresponds to the preferred crystallographic axes of a magnetic grain referred to as K1 (which represents the long axis of the grain and the vector of maximum susceptibility), K2 (the intermediate axis), and K3 (the short axis). (b) Visualisation of the alignment of grains within a rock, which illustrates whether that rock is isotropic or anisotropic. Isotropic rocks generally have randomly oriented grain, which collectively have no preferred alignment, whereas in anisotropic rocks the grains are preferentially aligned. (c) Grain alignment, which corresponds to the measured AMS fabric, validated using micro-computed tomography (from Austin et al., 2016c).
5.2.6 Structural fabrics
Methods
Anisotropy of magnetic susceptibility (AMS) is a second-order symmetric tensor that maps alignment of iron in the crystal lattice (Biedermann et al., 2015) and therefore maps mineral alignment in rocks (Fig. 18). AMS is often used as a proxy for mineral texture in geologic applications (Biedermann et al., 2015). AMS fabrics have been related to numerous events through a range of temperature–pressure conditions, from viscous flow in magmas (e.g. Knight and Walker, 1988; Ferré et al., 2002) through to folding and ductile–brittle shearing during relatively late stages of orogenesis (e.g. Torsvik et al., 1992; Greiling and Verma, 2001; Austin et al., 2019b).
Anisotropy of magnetic susceptibility (AMS) measurements were made on most samples using an AGICO MFK-1A Kappabridge magnetometer. The MFK-1A apparatus effectively measures the axes of maximum, intermediate, and minimum susceptibility that relate to the fabric of the magnetic grains within the rock.
For legacy samples (Uncover Cloncurry), 64 measurements are taken while spinning the specimen about the x, y, and z axes individually, using a conventional single-axis rotator attachment. The field sensor is zeroed after the sample is inserted into the pick-up coil, thereby eliminating any field bias from the measurements made as the sample is rotated. Then one bulk susceptibility value is measured along one axis, and the complete susceptibility tensor is combined from these measurements. For Cloncurry METAL measurements, a 3D-rotator attachment was used. The 3D rotator spins the specimen simultaneously about two axes with different velocities, enabling the determination of 320 directional susceptibilities during a single measurement phase (constituting an excellent 3D distribution within a sphere). Once the specimen is inserted into the rotator, measurement is fully automated, requiring no additional manipulation to measure the full AMS tensor and halving the time for measurement. The output signal from pick-up coils is amplified, filtered, and digitalised, and raw data are transferred directly to the computer in the form of .ran files and/or .ams files, which are native formats for AGICO's Anisoft software packages (Chadima and Jelinek, 2009), used to view and analyse the data.
Data
The AMS data are displayed for each specimen separately in the database: Specimen A, columns CG–DC; Specimen B, columns DD–DZ; and Specimen C, columns DD–DZ. The resulting data are comprised of a bulk susceptibility (column CH in the case of Specimen A) and three orthogonal tensors that together define the AMS ellipsoid. The three tensors are a long axis (K1), an intermediate axis (K2), and a short axis (K3). Each of these tensors is comprised of a relative intensity (i.e. a multiplier of the bulk susceptibility) for that tensor (e.g. column CJ), a declination (or dip azimuth, e.g. column CM), vector inclination (or plunge, e.g. CP), and α 95 % errors for each (in degrees; e.g. CS and CV). The AMS ellipsoid is geographically corrected relative to drill hole or surface sample orientation and can be visualised using stereonets.
Anisoft 4.2 was used to assess the quality and clustering, whether the magnetic fabrics within specific lithologies or structures have a preferred orientation overall, and whether the distribution of orientations reflect a specific type of fabric within that rock (e.g. axial, axial planar, or planar distributions; Závada et al., 2017). Three main parameters, introduced by Jelinek (1981), are commonly calculated from the results to differentiate the style of fabrics present. P (e.g. column DA) is equal to K1 K3 and corresponds to the anisotropy factor. Rocks with high P values are highly anisotropic, whereas rocks with P≈1 are isotropic. L (e.g. column CY) is equal to K1 K3 and defines the extent to which a rock has lineation (i.e. if K1 > K2 ≈ K3, the ellipsoid is prolate and the rock has lineation). F (e.g. column CZ) is equal to K2 K3 and defines the extent to which a rock is foliated (i.e. if K1 ≈ K2 > K3, the ellipsoid is oblate, and the rock has foliation). Other Jelinek (1981) parameters included are Pj (e.g. column DB), the corrected degree of anisotropy which takes the shape parameter into consideration, and T (e.g. column DC), the shape parameter (where 0 = isotropic, oblate (planar) ellipsoid, and prolate (linear) ellipsoid). An example data output from Anisoft 4.2 software and an interpretation of those data are presented in Fig. 19.
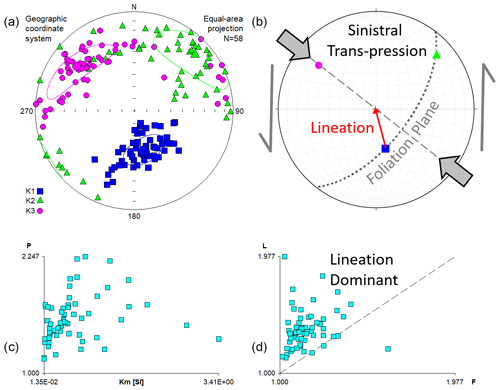
Figure 19Example of AMS data for samples from the hanging-wall shear zone, Ernest Henry deposit. (a) Stereonet in which the three AMS tensors are plotted for each specimen. (b) Summary of the structural information derived from the AMS data. (c) Plot of P (anisotropy factor (K1 K3) vs. magnetic susceptibility. (d) Plot of L (lineation) vs. F (foliation). From Austin et al. (2021i).
Processing
The data collection process involved individual analyses of up to three specimens (i.e. sub-samples) for most petrophysical properties (e.g. magnetic susceptibility), simultaneous analysis of up to three specimens for radiometrics, and scanning of one specimen for mineralogy (TIMA). It is not practical to present these data in a database, due mainly to the extent of additional calculations and metadata required by each of the individual techniques. The Cloncurry METAL “database” (Austin et al., 2024) is therefore provided as a single spreadsheet.
Vector properties and tensors such as AMS ellipsoids required trigonometric vector addition to calculate weighted mean lineations (i.e. K1 vectors, columns FK–FL) with corresponding intensity (column FM) and weighted mean foliations (i.e. inverse weighted planes perpendicular to K3, columns FO–FP) with corresponding intensity (column FQ) for each sample. These calculations, which incorporate both vectors and the relative intensity of the fabrics of up to three specimens, provide weighted mean foliation and lineation data for each sample, which are compatible with traditional measurements used in structural geology.
The mean length is also calculated for the mean lineation (column FN) and mean foliation (column FR) as a measure of certainty of the results. The mean length is the vector sum of two or more vectors divided by the sum of the vector lengths (i.e. a measure of the parallelism of the vectors), which provides an effective measure of the relative textural homogeneity of the sample. Samples with a mean length >90 % are considered texturally consistent. Whilst samples with a mean length <90 % have fabrics that are inconsistent to at least some degree, the user should note that the result is highly dependent on the number of vectors used in the calculation. Regardless of the number of vectors included in the calculation, a mean length of 100 % indicates all vectors are parallel. Where two vectors are used in the calculation, a mean length of 95 % approximates two vectors of equal intensity that are 30° offset from each other, a mean length of 85 % approximates two vectors of equal length offset 45° from each other, and a mean length of 50 % approximates two vectors of equal length offset 90° from each other. Where three vectors are used in the calculation, a mean length of 92 % approximates three vectors of equal intensity that are 30° offset from each other, a mean length of 80 % approximates three vectors of equal intensity offset 45° from each other, and a mean length of 33 % approximates three vectors of equal intensity 90° offset from each other. Where three vectors are used in the calculation, a mean length of zero is possible (but highly unlikely) if three vectors of equal intensity are offset 120° from each other.
5.2.7 Automated mineral mapping
Sample preparation
After the petrophysical analyses were completed, samples were polished for automated mineral mapping. Where possible, the rounds were polished on the side opposite to the palaeoazimuth markings (see Sect. 3.1) and without resin impregnation on the surface; however resin was required for more porous samples.
Automated mineral mapping was conducted using a TESCAN™ MIRA field emission gun (FEG) scanning electron microscope, coupled with three EDAX energy-dispersive X-ray spectroscopy (EDS) detectors, a backscatter electron (BSE) detector, and the TESCAN Integrated Mineral Analyzer (TIMA) software package. The automated modal mineralogy setting on the scanning electron microscope utilises a 25 keV, 6 nA, 26 nm electron beam, and a 10 µm pixel size was chosen for analyses with a required minimum of 1000 X-ray counts per pixel. Standard electron beam alignment, focussing, and instrument calibration, including BSE and EDS detector calibration, were carried out before each analysis run of up to 22 samples.
An area of ∼23 mm in diameter of the polished surface was scanned, with an average analysis time of 1 h and 50 min at 10 µm pixel resolution, producing mineral phase and BSE data for each sample. If the scanning electron microscope scans an unrecognised mineral phase, a grain boundary, or poorly polished section due to the presence of clay minerals or sample fractures, unclassified (black) pixels will occur in the dataset and in the phase panoramas. Any unrecognised genuine phases can be added later to the mineral library in the TIMA software. While the TIMA SEM system is operating in modal mineralogy mode, it produces volume percent mineral abundances down to 0.01 vol. % detection limits, which can be exported in .csv format along with the mineral-phase .png images (e.g. Fig. 20) that are integral to interpreting alteration mineral assemblages and the textural relationships of each sample.
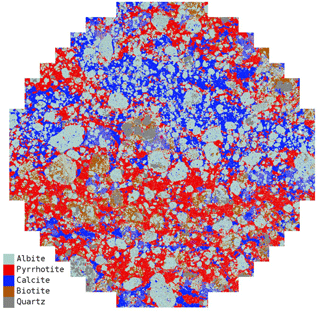
Figure 20One of the more interesting TIMA images: sample CAN003 is a micro-breccia from the Canteen prospect, with sodic-altered clasts in a matrix of monoclinic (magnetic) pyrrhotite and calcite. The matrix displays classic Durchbewegung textures, which result from ductile flow in pyrrhotite, which mills and rotates the breccia clasts.
Mineral classification methods
For each of the deposits studied in this project, a CSIRO-developed X-ray spectral-matching mineral classification library was generated. The “legacy” Uncover Cloncurry samples were considered in the development of each library and were reprocessed accordingly. The new mineral classification libraries have improved previously misclassified or unclassified phases (e.g. scapolite and plagioclase at Ernest Henry and sillimanite/andalusite and pyroxenes at SWAN) found in the Uncover Cloncurry datasets. On average, each of the deposit-specific mineral classification libraries includes more than 150 minerals, which have been generated from international standards from Web Mineral's Mineralogy Database; semi-quantitative electron backscatter diffraction (EBSD) analyses, which were acquired with an Oxford detector on TIMA SEM; or microprobe standards. Any minerals that were imported directly from the international Web Mineral database were imported in consultation with the available literature for each of the deposits and in-built spectral-matching and spectral-quantification calculators in the TIMA software.
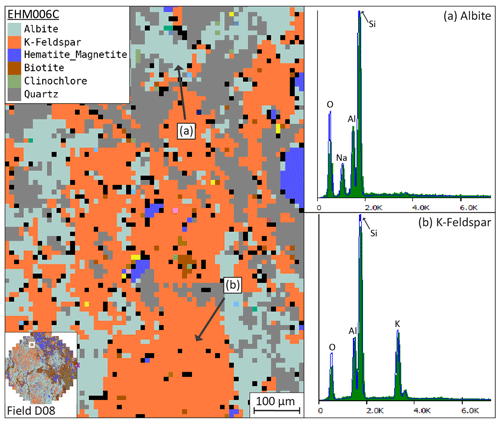
Figure 21Mineral-phase panorama from sample EHM006, Field D08, highlighting the mineral classification library at the pixel scale and (a) X-ray spectra from albite in the sample and (b) X-ray spectra from K-feldspar in the sample. These minerals are constrained by not only their key elemental expression but also elements that set them apart from similar phases – i.e. albite will be constrained not only by O, Na, Al, and Si, but also by Ca and K – to differentiate them from more calcic feldspars and from K-feldspar along with other elements where overlaps may occur.
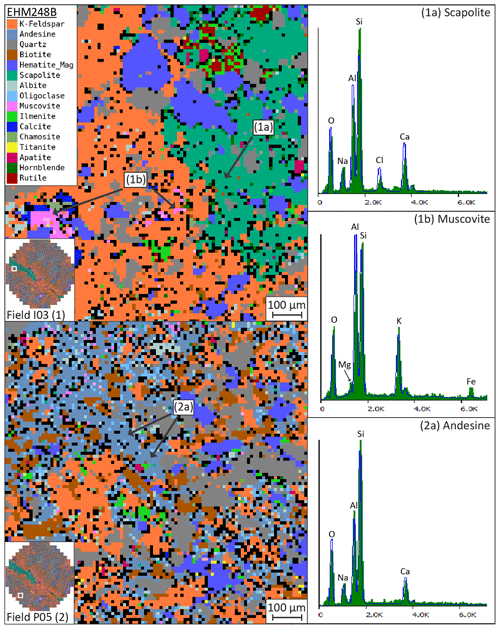
Figure 22Mineral-phase panorama from sample EHM248, Field I03 (1) and P05 (2), highlighting spectra from potentially competing mineral phases such as scapolite, andesine, and alteration mineral muscovite. While the X-ray spectra from scapolite in (1a) are similar to the andesine spectra in (2a) they are able to be distinguished by adding a strict Cl constraint into both mineral classifications. (1b) The endmember composition of muscovite does not contain any Fe or Mg; however, it is a common impurity in white micas, and therefore the muscovite classification has been edited to allow a small amount of Fe and Mg. After a specified limit, increases in Mg or Fe (and a decrease in Al and increase in Si) would see the phase classified as phengitic muscovite.
In the mineral classification library, each mineral is constrained by its mineral chemistry (Fig. 21) and, furthermore, the expected X-ray count range per element within the mineral. The X-ray count ranges are guided by the reference spectra but generally need to be refined for each mineral as the computed ranges can be misleading. Additional elemental constraints with low-to-background X-ray count values are often added when minerals of similar composition need to be differentiated (Fig. 22). Due to many minerals existing as variations of their solid solutions, in some cases, small impurities such as Fe and Mg in muscovite (Fig. 22) are allowed into the mineral definition. The primary and secondary constraints are particularly important for minerals that have undergone multiple stages of alteration and include common and unusual impurities, for example the grossular- and spessartine-rich almandine garnet species found at the Cannington deposit (Pearce et al., 2021).
5.2.8 Geochemistry
Portable X-ray fluorescence data were collected using an Olympus Vanta pXRF instrument, which has a 50 kV, 4 W rhodium (Rh) X-ray tube and a large-area silicon drift detector. Analytical beam times were 20 s and utilised a 10 and 40 kV beam in Geochem mode. Measurements were checked against five known (matrix-matched) diamond core standards and a silica blank to check efficacy and instrument drift during data acquisition. However the data presented in the database (Austin et al., 2024) are uncalibrated against the standards as the instrument measurements closely matched the standard values. The instrument drift was also monitored by repeating one unique standard and a blank every 20 analyses. Measurements were taken on the polished surface of the TIMA rounds, apart from samples which were set using resin prior to polishing due to poor rock quality/friability (e.g. some SWAN samples). The resin has a significant impact on the pXRF results due to signal attenuation and interference, and so measurements were undertaken on the unresined back of the samples. The front resined sides were also measured for a small test set of 23 samples from SWAN, confirming that the data are unusable as all elemental concentrations are attenuated by as much as 2 orders of magnitude. All pXRF data in the database (columns NY to QQ) include the proportion of the element present and associated reading error (1 standard error), both of which are displayed in parts per million (ppm). Light elements, defined as those with atomic number <11 (i.e. Na and lighter), cannot be quantified by pXRF, and so the total proportion of all light elements (LE_concentration) is presented in column QP, with the respective error in column QQ (both in ppm).
5.2.9 Hyperspectral data
Data collection
Hyperspectral data in the visible and near-infrared and short-wave infrared (VNIR–SWIR; 350–2500 nm) spectral regions were collected using an ASD (Analytical Spectral Devices) FieldSpec 4 spectrometer. Data were collected on the polished TIMA round surfaces for 100 averages, and the instrument was calibrated using a standard white reference material. Spectra were viewed and analysed in The Spectral Geologist (TSG) software. Collecting spectral data on a polished surface is not the ideal measurement condition and imparts some noise onto the spectra due to scattering effects, which are largely related to the mineral assemblage present (e.g. sulfide-richer or iron-oxide-richer samples are generally noisier). However, hyperspectral measurements were not a component of the original Uncover datasets and were added as a database component for the METAL datasets midway through sampling, and so a significant number of METAL samples as well as the ∼500 Uncover Cloncurry samples were already polished prior to the onset of data collection.
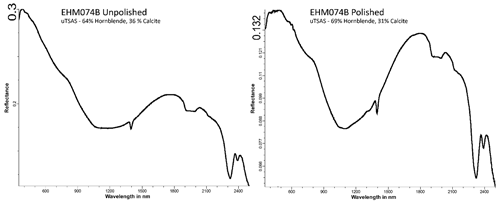
Figure 23ASD spectra of sample EHM047B before and after polishing; note the decrease in overall reflectance (vs. albedo) in the polished sample from a maximum reflectance of 0.3 to 0.132 as well as the negligible change in the qualitative TSA (The Spectral Assistant) mineralogy output.
A key component of creating a fully scalable and integrable geoscience database is that all the data are measured in a consistent manner with measurements from different methods on the same sample surface. Therefore, a suite of 23 test samples from Ernest Henry were measured pre- and post-polishing to evaluate the impact of polished vs. unpolished samples on the spectral results. The primary difference between the spectra from the rough and polished surface is in the overall shape of the spectral background, which is observed as systematically lower vs. albedo (reflectance albedo over 450–2450 nm) and higher SWIR spectral-contrast pfit (range of reflectance over [1300, 2500] nm, de-trended by a third-order polynomial fit) in the polished samples (Fig. 23). A minor but systematic difference is also observed in the spectral outputs from polished and unpolished samples for commonly used scalars (e.g. 2250D and 2200D). However, the outcome is the same trend across the sample suite for both the polished and the unpolished sample, and negligible changes to the qualitative TSA (The Spectral Assistant; uTSA) outputs were observed (Fig. 23). Given the test sample results and that the bulk of the samples (including all of the Uncover samples) were already polished, the remaining samples were also measured on the polished surface for consistency across the database so that all measurements (TIMA, pXRF, ASD) were representative of the same surface. The exception is for samples which were set using resin prior to polishing due to poor rock quality/friability (e.g. some SWAN samples). As with the pXRF data, the backside of the resined samples was measured to avoid interferences from the resin.
Processing and data outputs
Spectral mineralogy outputs were generated in the TSG (The Spectral Geologist) software using a series of CSIRO-developed batch scalars (system, user-published, and file) as well as the inbuilt TSA (The Spectral Assistant) function of TSG. These standard outputs were included for each deposit dataset regardless of their efficacy for a given deposit or mineral system. This is so that every deposit has consistent outputs for use in advanced data analytics and relies on the user for evaluation of which outputs to use in making interpretations. All the spectral outputs have been created using TSG Version 8.0.7.4 and TSA Version 7 (released May 2020).
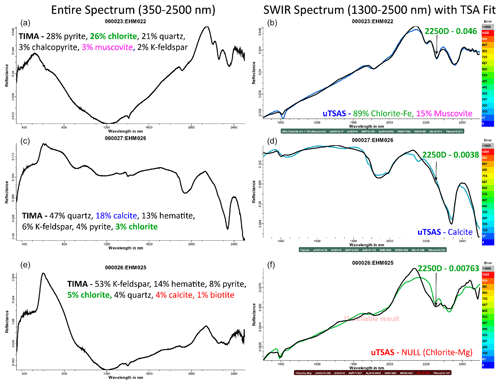
Figure 24ASD spectra (a, c, e) and corresponding user TSA outputs and TSA-modelled spectra (coloured) overlain on the sample spectrum (black) for the SWIR spectral region (b, d, f) for three samples (EHM022, EHM026, EHM025). The TSA-modelled spectra are coloured by error with the top sample (EHM022) having the lowest error. TIMA mineralogy results are provided for comparison as well as the output of the 2250D base scalars, which approximates the abundance of chlorite (and biotite) and provides an improved proxy for chlorite abundance compared to the TSA results.
TSA is an algorithm for automated spectral unmixing which uses its training library to match the spectrum against a single mineral or model a simulated mixture of two to four minerals that most closely resembles that of the input spectrum (Berman et al., 2011) (Fig. 24). TSA mineralogy outputs are one of the most common outputs derived from hyperspectral data using TSG and should be used with caution as they are only a best approximation of the top three contributing minerals to a given SWIR, VNIR, or thermal infrared (TIR) spectrum and represent relative abundances. The quantification of any spectral parameters requires the concurrent collection of validation data for calibration of the spectral data, e.g. quantitative X-ray diffraction (XRD; Haest et al., 2012; Laukamp et al., 2017) or EPMA (electron probe microanalysis; Lypaczewski and Rivard, 2018). Regardless, TSA unmixing results are commonly used by geologists as the data are exported as relative weights of a given mineral (Fig. 24); however, these results and their reliability are highly dependent on the reference library used, as well as the mineral assemblage present (Laukamp et al., 2017). It should also be noted that the mineral assemblages present in the Cloncurry METAL and Uncover samples are dominated by SWIR-inactive minerals, including oxides and sulfides, whereas the SWIR-active mineral assemblages relevant for vectoring towards mineralisation are typically dominated by chlorite, biotite, and calcite mineral species (e.g. Ernest Henry), which are challenging to distinguish between in the SWIR due to their overlapping spectral absorption features, namely the ∼2250 nm “Mg–OH” and the ∼2340 nm carbonate feature (Laukamp et al., 2017; Lypaczewski and Rivard, 2018) (Fig. 24).
TSA results have been exported into the Cloncurry METAL database (Austin et al., 2024) at both the mineral group scale (QW to RJ) and the mineral scale (RK to TE) to allow for application at different levels of detail. However, the mineral group results are more robust, and the mineral scale of TSA outputs should be approached with caution (e.g. Laukamp et al., 2017). Parameters related to the quality of the fit have also been included to assist the user in evaluating the quality of the results (QS to QV) (Fig. 24). The minerals included in the TSA library for a given deposit are informed by the TIMA automated mineralogy results with domain expert input to evaluate the rate of false positives and misclassifications. Given the limited number of SWIR-active minerals in the samples, the libraries used for the TSA unmixing do not change significantly between deposits. For all samples, the albedo threshold in the TSA setting was changed from its standard setting of 0.04 to 0.01 to accommodate the darkness of the rocks and the lower albedo of the polished samples with respect to unpolished or powdered samples. This also reduced the number of null TSA results.
As discussed above, for the purpose of the database outputs and their application in advanced data analytics, the TSA libraries have been minimally changed between deposits, and the TSA settings have been kept consistent. However, the TSA outputs for a given deposit may be improved (null results reduced) for certain mineral phases with the addition of deposit-specific custom external reference libraries and further tweaking of the TSA settings. The changing of TSA settings is something which is generally not recommended and was tested for Ernest Henry with well-constrained TIMA mineralogy and domain knowledge input. While the number of null results was reduced, the results were often unreliable, as would be expected when removing constraints from the unmixing model, and in general resulted in an overrepresentation of chlorite across the dataset (e.g. EHM025 in Fig. 24), and so the results are not included in the database. Another approach to improving unmixing results is to expand the mineral library using external reference libraries which include spectra of minerals known to be in the dataset. This approach was tested with the Ernest Henry dataset using a custom external library which included a larger number of biotite spectra, as biotite and chlorite are difficult to unmix, as well as scapolite, which is known to occur in the samples (from the TIMA data). The application of this library did not result in a significant improvement in the unmixing results (e.g. no scapolite identification) and in many cases resulted in more misclassifications, and so the results are not included in the database. The presence of known phases (from previous GSQ work and CSIRO TIMA datasets) such as scapolite and piemontite was also probed using a spectral-matching method (aux-match in TSG). This method outputs the results of curve matching between spectra in the project dataset and spectra in an AUX (custom library) dataset and yielded no significant matches despite the presence of scapolite in abundances of up to ∼50 wt % in some samples.
This highlights the inherent difficulties in mineral identification in mixed samples from SWIR spectra using endmember library spectra. Another limitation of conventional unmixing methods (like TSA) is that it uses only the SWIR region of the spectra (1400–2500 nm) and does not consider the entire spectral range of the instrument (350–2500 nm) (Fig. 24). This is important when considering that the assemblages present in the Cloncurry samples are dominated by “SWIR-inactive” minerals and that the mineralised assemblages are iron-oxide-rich (Fig. 24). While SWIR-inactive mineral such as feldspars do not have distinctive spectral features in the SWIR, they contribute to the spectral background, and the VNIR region of the spectrum is sensitive to the presence of iron oxides and transition metals. It is for this reason that the entire raw spectrum is included in the database.
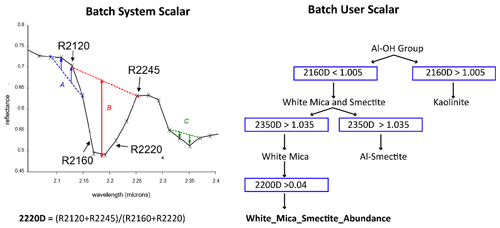
Figure 25Schematics for derivation of the batch system 2200D scalar and the batch user White_Mica_Smectite_Abundance scalar, both of which probe the 2200 nm Al–OH spectral absorption feature.
Given the inherent complications with spectral unmixing results, many spectral geologists (e.g. Laukamp et al., 2021) prefer to probe individual spectral features in a dataset by looking at, for example, the depth, wavelength, or shape of a well-understood spectral absorption feature such as the 2200 nm “Al–OH” feature (e.g. Haest et al., 2012) or the 2250 nm “Mg–OH” feature (e.g, Sonntag et al., 2012) (Fig. 24). Figure 24 provides a good example of how the 2250D (batch system) scalar, which provides a measure of the depth of the 2250 nm feature, relates to the abundance of chlorite in three samples and is an improvement on the TSA outputs. Scalar is the term used by TSG to refer to any set of calculated values related to loaded spectral data. The outputs included in the database are what are referred to as batch scalars. These are pre-written, well-established, and in most cases published scripts for spectral parameters which probe the position or depth of a given spectral absorption feature (see Laukamp et al., 2021, for an overview). The outputs in the database are split into three categories, TSG batch system scalars (scalar name_SS), TSG batch user scalars (scalar name_US), and batch file scalars (scalar name_FS). Batch system scalars commonly use a three-band polynomial fit, while the user scalars employ a multiple-feature extraction method for their outputs, so they are much more restrictive (Fig. 25). Details of the scalars' names, applications, and references are included the database explanatory notes and are also described in Laukamp et al. (2021). Not all of the scalars in the database will be relevant or even trustworthy for every deposit but have been included so that each dataset in the final database (Austin et al., 2024) has the same outputs for use in advanced data analytics. It is also important to note that the system scalars (_SS) do not have any masking applied to them and that the user should consider this in their application (Fig. 25).
5.3 Dataset collation and integration
For ease of use, our dataset is provided as a single Excel spreadsheet or as separate spreadsheets for individual deposits. It comprises numerous outputs from a variety of different sensors, which are processed on numerous software platforms, and required additional pre-processing, integration, and assimilation steps for some of the methods.
The format was modified from the previous version (Uncover Cloncurry; Gazley et al., 2016c), which had three to four lines per sample, each corresponding to a different sub-sample (specimen). This format was difficult to use because most data were missing from most lines. In the updated version, all data from each sample (up to three specimens) are included in one row, and extra calculations have been added to better summarise the data. In general, these are simple averages. However, in the case of vector quantities (e.g. AMS and remanent magnetisation), the average direction of three vectors coupled with the average intensity of the vector can provide a poor summary of the data and the associated errors. Calculating vector means (i.e. adding the three vectors together trigonometrically) is a far more accurate summary of the data, and the associated mean length metric provides an excellent measure of the consistency of the three vectors used in the calculation.
To make the Cloncurry METAL data (Austin et al., 2024) easy to use, a range of metadata (descriptions of which are outlined on Sheet 2 of the database) are provided.
-
Information on the structural context and system zonation has been included. Structural context is ascertained by examination of the position of the samples relative to mineralisation (determined from Leapfrog interpolation) and relative to the established structural framework of deposits (if they exist). Where possible, previous work, including 3D geophysical and geochemical models and cross-sections in a 3D GIS (e.g. Discover 3D™, Geoscience ANALYST™, or Leapfrog™), was assembled. System zonation was determined by examination of the alteration assemblages present in TIMA imagery and was also determined relative to previous work. An example of how these contextual metadata are used is provided in relation to structure, geophysics, and geochemistry in some of the major outputs of this study (e.g. Schlegel et al., 2021; Austin et al., 2021b, d; McFarlane et al., 2021a, b; Stromberg et al., 2021).
-
Accurate three-dimensional location data (x, y in metres relative to the GDA zone 54 map grid; GDA is the Geocentric Datum of Australia; z is relative to sea level) for each sample are also provided. xyz data were calculated from collar location and survey information from confidential company drilling data and downhole depth information collected during sampling and computed using the “Drillholes” function of MapInfo Discover™.
-
General geological descriptions based on company logs (where available), from sampling notes (where available), and/or from TIMA imagery are also included. It should be noted that these data are highly qualitative, especially from the former two sources. Whilst the TIMA images are quantitative, consistent representations of the lithology of the rock and the interpretations of the rock type, alteration, and texture are still qualitative. Until complex variables such as protolith, textural fabrics, and relative proportions of alteration products can be determined autonomously from TIMA imagery using data analytics, these descriptions will have to suffice. However, they should be used with caution, and users of the database are encouraged to review the TIMA imagery themselves and revise the structural and alteration framework to suit their specific needs or, better still, devise an automated method.
5.4 QA/QC
Each of the input datasets for this project was produced using proprietary instrumentation and software, and as such much of the quality assurance and checking were undertaken using these software packages prior to export. Some of the main problems identified at this stage of the process included the following:
-
false parallelism of NRM directions due to the sample rotator not working correctly on the JR-6 magnetometer,
-
subdued magnetic susceptibility readings in magnetite-rich samples due to self-demagnetisation effects,
-
large percentages of “unknown” minerals in TIMA results due to TIMA mineral library limitations.
These issues and others of a similar nature were easily addressed by minor changes to the set-up of various instruments, modifying instrument settings, and/or improving reference spectra, as required.
The processing and assimilation of these individual data streams, however, present far more opportunities to introduce errors via mistranslation of proprietary data formats into text, misplacement of data, or misapplication of functions (e.g. using the wrong columns to calculate averages and ratios). By and large, these kinds of errors presented as obvious bipolar contrasts in resultant outputs, typically with variances of orders of magnitude. These were (hopefully) all fixed prior to publication.
In some cases, the data passed QA/QC but still had a major flaw that made them difficult to integrate effectively. These flaws were encountered in a subsequent data analytics project (Williams et al., 2022), in which the entire dataset produced a suspicious bi-modal clustering on one axis of several non-linear data reduction projections. After individually assessing each of the various components which correlated with a key axis of the dimension reduction projection, two major problems were identified. Both were related to underlying collection and processing issues.
-
There was an approximately 10 % difference in the radiometric dose, mainly correlated with a consistent difference of ∼25 % between the potassium percentage of two groups of samples. Those with a lower dose rate were all measured at our North Ryde laboratory in around November 2018, whereas the samples with the higher dose rate were all measured at our relocated Lindfield laboratory in around April 2020. Williams et al. (2022) found that all samples measured at each site shared the same flaw and inferred that the contrast in the mean radiation level was due to the background radiation of the different laboratory environments. This calibration error was amended by normalising each channel of radiometric data relative to the mean measurements from each site.
-
Williams et al. (2022) also found instances in which similar rocks with similar mineralogy plotted at opposite ends of a dimensionally reduced projection. In this case it was found that the main difference between the two clusters was related to the methodology used to generate the TIMA mineralogy maps. One of these clusters was comprised of earlier Uncover Cloncurry samples (Gazley et al., 2016c), which were measured using a previous version of the TIMA software and processed with a slightly different TIMA library. The previous TIMA library did not include phases such as fayalite, almandine, epidote, fluorite, and scapolite. Thus, during processing of the data, one mineral could easily be incorrectly classified as another; e.g. andesine in the earlier data was instead classified as scapolite in the later data. In some instances, the same mineral was also mapped using different names; e.g. potassic feldspar was mapped as microcline in the Uncover Cloncurry mineral library but as K-feldspar in the Cloncurry METAL library (Williams et al., 2022). This major oversight has been amended in the updated version of the data. In general, however, the use of a different TIMA library may dramatically affect several mineral phases, and in this case variances in the volume of actinolite, scapolite, and K-feldspar all affected the projection dramatically. Because of the updated software, it was not feasible to individually reprocess all results, and so legacy samples were only reprocessed for deposits studied in the Cloncurry METAL project (i.e. Cannington, Ernest Henry, SWAN, Starra-276, Osborne, and Eloise).
The use of different mineral libraries meant some of the more uncommon assemblages from the earlier study could not be easily integrated with data from the latter, highlighting that the processes by which data are collected, reduced, and represented have profound impacts on any big-data approaches to geoscience. This is a particular issue for categorical data (e.g. mineralogy), which may not be precisely identified or may correspond to mixtures of multiple endmembers, but it is a common problem across all spectral/elemental imaging and scanning analyses where data need to be “unmixed”. To best address such issues across different rock suites using quantitative mineralogy approaches (e.g. TIMA SEM), it is critical to (1) have access to raw data, (2) customise data reduction approaches, and (3) use smarter and/or more flexible approaches to classification and estimation of mineral-phase proportions.
Data collection issues almost certainly have a greater impact on outputs than data analytics methodologies. The issues identified here are detectable, are resolvable, and have relatively small impacts due to the scale-integrated nature of the data, the high quality of the data, and consistency of the sampling and analytical tools used. However, the use of datasets assimilated from different scales, resolutions, precision levels, and tools more generally would almost certainly lead to far more serious issues, which could be substantially less detectable and which no amount of buffering, filtering, recalibration, or conversion could adequately suppress. The consistency and quality of inputs are paramount.
The data collected by this study span a range of geoscience applications, including understanding deposit paragenesis (Schlegel, 2021; Schlegel et al., 2021, 2022); integrated insights into the geochemical, mineralogical, and petrophysical footprints of mineral deposits (e.g. Austin et al., 2021d); quantifying the structural controls (Austin et al., 2021b; McFarlane and Austin, 2021); and geophysical expression (Austin, 2021a, b; Austin et al., 2021b) of mineral systems. The resulting knowledge can be applied to three broad functions: mineral exploration techniques, mineral system science and characterisation, and novel approaches to each using data analytics.
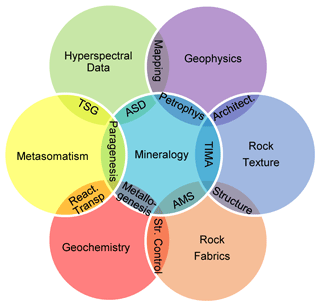
Figure 26Venn diagram illustrating how different techniques are integrated to produce scale-consistent mineral system exploration and targeting tools. Mineralogy, at the centre, is the key link to all other techniques and tools and aligns with the major geoscience fields. The inner areas of overlap are tools and observations we use to link mineralogy to other areas of geoscience. The outer areas of overlap are primarily where different areas of geoscience can be integrated to provide insights into the key mineral system characteristics, e.g. the five questions of mineral system science (Walshe et al., 2005).
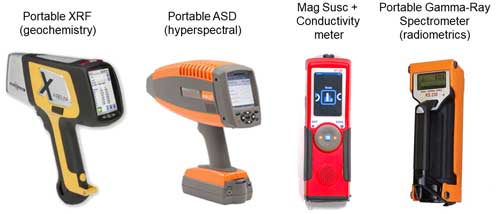
Figure 27Examples of core-shed tools that can be used for mineral system characterisation and targeting: a portable X-ray fluorescence analyser (pXRF), portable reflectance spectrometer (ASD), magnetic susceptibility and conductivity meter, and gamma-ray spectrometer.
6.1 Mineral exploration and mineral system characterisation
The data produced have applications across a range of greenfield and brownfield exploration toolkits as visualised by the Venn diagram in Fig. 26. At the core of this capability is the TIMA SEM quantitative mineralogy technology. TIMA SEM provides quantitative information about mineralogy, lithology, rock texture, and metamorphic-grade and alteration paragenesis, much of which is only collected qualitatively and very subjectively in mineral exploration. Furthermore, TIMA SEM provides contextual information that can be used to constrain our understanding of the other techniques (i.e. surrounding TIMA in the Venn diagram, Fig. 26) producing camp-scale exploration targeting criteria which can be exploited using conventional core-shed tools (e.g. Fig. 27). The resultant data also provide quantitative constraints across a range of geoscience disciplines, which address the five questions of mineral systems science (Walshe et al., 2005), outlined as follows: (1) what is the role of geodynamics? (2) What is the role of the architecture of the system? (3) What are the roles of fluids, their sources, and reservoirs? (4) What are the fluid flow drivers and pathways? (5) What are the metal transport and deposition processes? The applications of these data are discussed below, citing examples within this framework.
6.1.1 Geodynamics
Insights into the geodynamics of the mineral system can be gained via interrogation of the mineralogical and textural information derived from the TIMA SEM imagery. The mineralogy data provide information about the relative abundance of metamorphic indicator minerals (e.g. sillimanite, andalusite, kyanite pseudomorphs) as well as information about the temporal juxtaposition of metamorphic and metasomatic reaction assemblages. Textural information from TIMA SEM also provides insights into tectono-metamorphic evolution by differentiating primary sedimentary and igneous textures from metamorphic, metasomatic, and tectonic textures. This mineralogical and textural quantification of rocks provides valuable information for the reconstruction of sedimentary, magmatic, metamorphic, tectonic, and metasomatic history, i.e. the geodynamic evolution, of a terrane. In general, for the Cloncurry terrane, mineralisation typically post-dates the major metamorphic and tectonic episodes, coinciding instead with late magmatic hydrothermal activity and strike-slip tectonics. However, there are examples in which our data provide critical insights into the earlier metamorphic history of the Cloncurry district. For example, the work by Pearce et al. (2021) integrating metamorphic petrology and REE geochemistry data from the Cannington deposit identifies a complex history of pervasive Fe and Ca–Fe alteration that was subsequently exposed to high-grade (> upper amphibolite facies) metamorphism and later hydrated to form the complex assemblages observed. The TIMA imagery on its own provides future studies with an ideal launching platform, allowing researchers to readily locate minerals of interest for interpreting broad crustal processes (e.g. REE profiles), thermobarometry (e.g. garnet, pyroxenes, amphiboles, sillimanite), and geochronology (e.g. monazite, zircon, and allanite; e.g. Portela et al., 2024).
6.1.2 Architecture
The mineralogical and textural quantification of rocks provided by TIMA SEM can be integrated with quantitative information on rock fabrics provided by anisotropy of magnetic susceptibility (AMS) data to provide valuable information about the architecture of the system. The AMS technique allows differentiation of isotropic and anisotropic rocks, thereby assisting in the differentiation of rock types and providing insights into their role in the development of regional- to deposit-scale architecture. For example, Austin et al. (2021b) found that dioritic intrusions in the distal footwall and hanging wall of Ernest Henry had isotropic (i.e. undeformed) fabrics, consistent with them acting as rigid buttresses that focussed strain during deformation. AMS provided information on the nature of fabrics within different rock types, in particular on whether fabrics are lineation or foliation dominant and the strength of those fabrics. Such information allows us to differentiate primary sedimentary and magmatic fabrics from tectonic fabrics and furthermore quantify the bulk rotations in those fabrics related to folding (e.g. McFarlane et al., 2021a, b) and/or rotation of rigid blocks within an incompetent substrate (e.g. Austin and Patterson, 2020). The technique furthermore allows us to contrast lineation and foliation fabrics within a cluster of samples to produce information on the kinematics of a deposit. Such insights can be integrated with conventional structural geology, lineament interpretation based on geophysical filter products, and 3D geophysical models to characterise regional architecture and palaeo-kinematics.
6.1.3 Fluids (metasomatism)
Fluid composition (including contained elements such as gold, copper, iron, sulfur, and carbonate carbon) and fluid properties (including oxygen fugacity/redox and acidity (pH)) are important factors that control mineralisation. Whilst technically not directly characterised by the data obtained in this study, valuable insights into fluid composition, redox, and the acidity of the fluids involved in mineralisation can still be obtained via understanding of alteration paragenesis and deposit zonation. The main tools for understanding these properties include TIMA SEM mineralogy and SWIR hyperspectral data.
The Cloncurry METAL datasets identified several mineral zoning patterns and compositional trends related to Cloncurry district IOCG systems, many of which are non-unique and have applications to district-scale exploration. These include
-
feldspar mineral zonation at Ernest Henry (e.g. Schlegel et al., 2021) and Eloise (e.g. Birchall et al., 2021);
-
zonation in white mica and carbonate abundance and chemistry at Starra-276 (McFarlane et al., 2021b);
-
chlorite and biotite distribution and/or chemistry at Eloise (Birchall et al., 2021) and Osborne (McFarlane et al., 2021a);
-
chlorite–biotite–white mica zonation at Ernest Henry (Schlegel et al., 2021) and Mount Elliott (Stromberg et al., 2021);
-
apatite halos around the mineralised zones at SWAN (Stromberg et al., 2021), Ernest Henry (Schlegel et al., 2021), and Eloise (Birchall et al., 2021).
Hyperspectral data are sensitive to most mineral species (apart from sulfides), and different spectral ranges are sensitive to different mineral species (Laukamp et al., 2021). While hyperspectral mineralogy is a surface technique, it can be used to map alteration from the sub-sample to regional scale and thus can be easily integrated with other geoscience datasets such as those of radiometrics and magnetics to inform our understanding of alteration footprints and fluid pathways (e.g. Sect. 6.1.4). Stromberg et al. (2021) provide an excellent example, combining high-resolution SEM-based mineral mapping from four drill holes at SWAN-Mount Elliott with continuous downhole hyperspectral HyLogger3™ datasets to present an updated alteration paragenesis of the system. Their work describes the role of successive fluids in localising mineralisation and developing the associated alteration footprint.
The role of fluids in localising mineralisation can also be examined at much finer scales using TIMA SEM coupled with geochemistry data. Schlegel et al. (2021) and McFarlane et al. (2021a) highlighted the role of acid–base reactions in controlling mineralisation at Ernest Henry and Starra-276. Schlegel (2021), Schlegel et al. (2022) furthermore highlighted how the TIMA SEM mineral mapping approach can be used to understand the role of fluids in generating porosity in hydrothermal systems. They suggested that mineral zonation resulted from sodic alteration, potassic and iron metasomatism, shearing, and brecciation, followed by regressive hydrolytic alteration and carbonisation. Hydrolytic alteration resulted in the variable replacement of magnetite by hematite and also resulted in volume reduction/porosity creation (evident now as late carbonate infill and veining), which made way for the late high-grade copper mineralisation.
6.1.4 Pathways
Insights from conventional structural geology, geophysics-based lineament interpretation, and 3D geophysical modelling provide rigid constraints on the architecture of the system and its palaeo-kinematics. Structures are commonly assumed to be fluid pathways. In reality, however, all structures have unique histories, have different kinematics, and are active at different times. Whilst the interaction of structure and alteration can be constrained at the sample-to-deposit scale using METAL data, it is more difficult to differentiate the role of regional structures in localising mineralising fluids based purely on conventional structural geology and lineament interpretation. To differentiate fluid pathways from other structures, new methods are required that can highlight fluid–rock interactions within those structures, not only at the sample scale to core scale, but also at the district scale.
Research on IOCG deposits (Austin et al., 2016a, d, f, i; Austin, 2021b; Austin et al., 2021d) has identified associations between mineral deposition and redox reactions, reflected in transitions between magnetite and pyrrhotite or hematite-bearing lithologies. That work illustrated that transitions between these key deposit-forming minerals coincide with elevated uranium on the more oxidised side of the gradient (i.e. magnetite in a reduced system or hematite in an oxidised system). This association is mappable at the sample scale using the METAL approach and at the drill core/deposit scale using a handheld susceptibility meter and gamma-ray spectrometer. At a regional scale the association of Fe-oxide and uranium (i.e. the redox gradient) can be mapped using a combination of airborne magnetic and radiometric data (e.g. Austin, 2021b). This technique allows the differentiation of fluid pathways from un-involved structures at several IOCG deposits across the Cloncurry district including SWAN, Starra-276, Monakoff, Cormorant, and Canteen (Austin, 2021b; Austin et al., 2024). The recognition of such processes provides an ideal proxy for oxidised fluid pathways within IOCG mineral systems because they allow us to convert chemical reactions into physical properties that can be recognised in geophysical data. In contrast to mineralogical or chemical properties, these physical properties can be readily scaled from sample and drill-core scale to deposit and district scale, allowing us to trace fluid pathways from the deposit into the district.
6.1.5 Mineral deposition
Mineral deposition in hydrothermal systems is typically a function of several processes, usually the chemical reactivity potential of the host and fluid, coupled with the available porosity (e.g. Sect. 6.1.3) and structural controls. The Cloncurry METAL database (Austin et al., 2024) provides insights into each process. Information on structural fabrics within a mineralised system is derived primarily from AMS data (discussed in Sect. 6.1.2), which are upscaled using geophysical modelling and lineament interpretation and integrated with insights from radiometrics to constrain fluid pathways (discussed in Sect. 6.1.4). This knowledge of the structural controls is coupled with insights into different fluid–rock reactions and alteration paragenesis from TIMA SEM (discussed in Sect. 6.1.3) to characterise mineral deposition. In essence, the processes involved in mineral deposition are interdependent; that is, fluid pressure impacts structural rheology, which impacts porosity generation, which impacts chemical reactivity. These processes are all linked, and the great advantage of the METAL methodology for data integration is that our data are integrated by design, and therefore the methodology describes these processes holistically.
Austin and McFarlane (2021) provided an example of how insights into structural controls can be integrated with an understanding of the metallogenic history to understand mineral deposition. Their work demonstrated that the juxtaposition of tectonic lineations and foliations at Ernest Henry suggested anticlockwise rotation of the strain direction, causing a transition from pure reverse movement to sinistral strike slip from ca. 1550–1500 Ma. They interpreted that as the system evolved into strike-slip-dominant tectonics, N–S-oriented near-surface structures linked with reactivated sub-parallel basement structures, facilitating fluid flow between the lower and upper crust. The AMS technique has furthermore identified that the majority of structurally controlled hydrothermal deposits plunge parallel to the measured K1 (lineation) vector (e.g. Austin et al., 2016b, e, h, 2021b, d; McFarlane and Austin, 2021; Birchall et al., 2021). This allows us to predict the plunge of most mineral deposits in the Cloncurry district, demonstrating its value as an exploration tool if utilised early in a greenfield drilling campaign to accurately plan follow-up drilling (McFarlane and Austin, 2021).
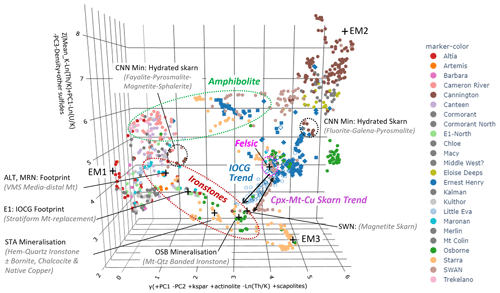
Figure 28UMAP projection of all samples from all deposits (using only the petrophysical, mineralogical, and hyperspectral properties), highlighting three main endmembers and major intermediate host lithologies. Note that as the projection is developed from a network representation of similarities between samples, samples plotting intermediately between other identifiable groups do not necessarily exhibit a precisely intermediate character (as could be concluded if plotting the original features), and rather they have similarities to both groups. However, in some cases the projection has indeed highlighted some key geological features which can be related to the projection axes (x, y, z). Figure from Williams et al. (2022). Note that the term PC refers to five principal components defined by Williams et al. (2022, Table 1) based on combinations of TSG scalars and TIMA mineralogy data.
6.2 Machine learning
Williams et al. (2022) developed targeted workflows to make use of the range of geoscience data within the reference database and investigated options for pre-processing, transformation, and the construction of unsupervised and supervised predictive models. These workflows were implemented in Python and were presented as a package of configurable scripts, which can be readily integrated and extended with widely used open-source machine-learning packages. A range of software tools and algorithms have been used, adapted, and created to make use of specific types of geoscience data in machine-learning workflows and for configuration of model generation and interrogation.
The multi-property nature and dimensionality of the dataset presented a challenge for use in machine-learning workflows. However, targeted dimensionally reduced projections were found to be more useful for unravelling complex geology than bivariate, ternary, or three-dimensional diagrams. Williams et al. (2022) identified the prominent features and signatures which define the larger-scale structure of these projections, providing a geological framework for the clustering models developed. Dissection of dimensionally reduced projections also assisted in identifying a series of QA/QC issues related to the reference dataset itself, which otherwise may have been more difficult to identify or diagnose.
The models developed can efficiently represent complex geology as described by geologists and suggest that some degree of predictive analytics for exploration is feasible. The project provided a reference framework (Fig. 28), allowing explorers to contextualise future exploration results relative to known mineral system signatures in the region and in so doing further build the reference framework.
Data described in this paper can be accessed via the AuScope Data Repository: https://doi.org/10.60623/82trleue (Austin et al., 2024).
Cloncurry METAL set out to push the boundaries of big data by critically examining the role of the data, in particular the pitfalls of incompleteness, inhomogeneities of scale, and specific scale dependencies of different data types (e.g. contrasting depth of resolution of magnetic vs. gravity inversions). We recognised that one way to bridge the gap between large-scale, low-resolution datasets and the fractal (i.e. multi-scale) nature of geological systems was to develop a scale-consistent (sample-based) methodology for data collection and translate knowledge into physical parameters which are readily scalable. The outcome of this has led to the world's first fully integrated petrophysical–mineralogical–geochemical–structural–metasomatic characterisation dataset, across over 20 deposits from one of the most geologically complex mineral systems on Earth.
This paper presents data from this innovative district-wide, scale-integrated geoscience data project, which analysed 1590 samples from 23 mineral deposits and prospects across the Cloncurry district, Queensland. Nine different analytical techniques, including density, magnetic susceptibility, remanent magnetisation, anisotropy of magnetic susceptibility, radiometrics, conductivity, modal mineralogy from TIMA SEM, geochemistry, and short-wave infrared (SWIR) hyperspectral data, resulted in 561 columns of scale-integrated data (+2151 columns of SWIR data). All data were collected on 2.2 cm × 2.5 cm sized sample cylinders, a scale at which the spatial coupling of the techniques was assured. These data are integrated by design, eliminating the need to downscale coarser measurements using assumptions, inferences, inversions, and interpolations. This scale-consistent approach is critical to quantitative characterisation of mineral systems and has numerous applications to mineral exploration, such as linking alteration paragenesis with structural controls and petrophysical zonation.
Whilst the database is not 100 % complete (i.e. it is missing data for some samples), it is, to our knowledge, the most complete dataset of its kind. It is a unique dataset which paves the way for a completely different approach to mineral exploration, to understanding mineral systems, and to advancing the use of data analytics in the geosciences. Our team has extracted significant value out of these new integrated data as demonstrated by the examples contained herein. But we have only scratched the surface of the potential applications of this approach, and there is much to be revealed by the wider geoscience community. These data and associated imagery, modelling, and insights provide an optimal platform for further studies by providing comprehensive characterisation of the deposits, their footprints, and host rocks. They describe a mineral system at the sample scale.
Figure 29The integration of domain expertise is critical to understanding how different vectors to mineralisation are integrated in practice. This geological understanding is critical to underpinning sensible utilisation of advanced data analytics.
This project highlights the need to think carefully about how geoscience data are collected and how collection and processing impact upon automated interpretation. The consistency of the scale, resolution, and depth of investigation of input data is paramount and should be carefully considered in order to best capture geoscience data that are meaningful to data analytics. It is crucial to recognise that very few of the datasets utilised in geoscience (especially mineral exploration) are truly spatially coincident, truly quantitative (at all scales), or compatible (in terms of describing identical volumes). To make big data work in geosciences, changing how we approach the data will lead to improved outputs from data analytics rather than the analytics themselves. Data must first be integrable to be integrated.
Ultimately, the most important aspects of data integration will always be tied to people. The integration of ideas and the linking of domain expertise are critical to aligning the mineral vectors provided by different techniques (Fig. 29). Getting domain experts together in the field, core shed, laboratory, and conference room is critical to developing improved methodologies for unlocking mineral potential and maximising the utility of data analytics. We hope this publication provides a platform for innovative research into a unique and complex mineral system and is a catalyst for adoption of this approach across mineral districts globally.
This project and its predecessor were conceptualised by JRA, MG, and JW. Project funding, leadership, and administration were undertaken by JRA and VL, with mentorship from JW. Sampling was undertaken by JRA, MG, BP, RB, CD, JW, TS, and HM. Data collection was undertaken by BP, AB, and JRA (petrophysics and AMS); RB, TDS, MLG, and MG (TIMA SEM); and JS, RB, and TDS (pXRF and ASD). Data curation and validation were undertaken by JRA, RB, BP, AB, and JS. Data visualisation and graphics were primarily by JRA with contributions from RB and JS. Investigation and analysis were undertaken by JRA, TS, HM, JW, JS, RB, MG, BP, and AB. Draft preparation, editing, and review (pre-submission) were by BP, RB, MG, JS, and JRA. Post-review editing and revision were by JRA.
The contact author has declared that none of the authors has any competing interests.
Publisher's note: Copernicus Publications remains neutral with regard to jurisdictional claims made in the text, published maps, institutional affiliations, or any other geographical representation in this paper. While Copernicus Publications makes every effort to include appropriate place names, the final responsibility lies with the authors.
The authors acknowledge the thoughtful and constructive reviews of Randy Enkin (Geological Survey of Canada) and Hanna Leväniemi (Geological Survey of Finland), which have added substantially to the quality of this paper. We also acknowledge the in-kind support from mineral explorers in the Cloncurry district, who provided accommodation, site access, samples, and data for this project.
This research has been supported by the Geological Survey of Queensland (GSQ) and the Commonwealth Scientific and Industrial Research Organisation (CSIRO).
This paper was edited by Kirsten Elger and reviewed by Randolph Enkin and Hanna Leväniemi.
AGICO: AGICO Company Webpage, https://www.agico.cz/text/products/jr6/jr6.php (last access: 11 October 2024), 2021.
Anderson, C. G. and Logan, K. J.: The history and current status of geophysical exploration at the Osborne Cu & Au deposit, Mt. Isa. Exploration Geophysics, 23, 1–8, https://doi.org/10.1071/EG992001, 1992.
Austin, J. R.: Petrophysically constrained targeting of Iron Oxide Copper-Gold, Iron Sulphide Copper-Gold, Skarn and Broken Hill Type systems, CSIRO, Australia, http://hdl.handle.net/102.100.100/429914?index=1 (last access: 11 October 2024), 2021a.
Austin, J. R.: Mapping IOCG Fluid Pathways with Radiometrics: Case Studies, Tools and Exploration Strategy, CSIRO, Australia http://hdl.handle.net/102.100.100/435119?index=1 (last access: 11 October 2024), 2021b.
Austin, J. R. and Blenkinsop, T. G.: The Cloncurry Lineament: geophysical and geological evidence for a deep crustal structure in the Eastern Succession of the Mount Isa Inlier, Precambr. Res., 163, 50–68, https://doi.org/10.1016/j.precamres.2007.08.012 2008.
Austin, J. R. and Blenkinsop, T. G.: Local to regional scale structural controls on mineralization and the importance of a major lineament in the eastern Mount Isa Inlier, Australia: Review and analysis with autocorrelation and weights of evidence, Ore Geol. Rev., 35, 298–316, https://doi.org/10.1016/j.oregeorev.2009.03.004, 2009.
Austin, J. R., Schmidt, P. W., and Foss, C. A.: Magnetic modeling of iron oxide copper-gold mineralization constrained by 3D multiscale integration of petrophysical and geochemical data: Cloncurry District, Australia, Interpretation, 1 T63–T84, https://doi.org/10.1190/INT-2013-0005.1, 2013.
Austin, J. R., Geuna, S., Clark, D. A., and Hillan, D.: Remanence, self-demagnetization and their ramifications for magnetic modelling of iron oxide copper-gold deposits: An example from Candelaria, Chile, J. Appl. Geophys., 109, 242–255, https://doi.org/10.1016/j.jappgeo.2014.08.002, 2014.
Austin, J. R., Gazley, M. F., Godel, B., Hawkins, S., and le Gras, M.: The Maronan Pb- Ag deposit: Integrated Petrophysical and Geochemical analyses, in: Uncover Cloncurry, edited by: Gazley, M., CSIRO, Australia, pp. 50. https://doi.org/10.4225/08/585820ef41b35, 2016a.
Austin, J. R., Gazley, M. F., Ibrahimi, T., Walshe, J. L., Patterson, B. O., and le Gras, M.: Uncover Cloncurry – The E1 North Cu-Au deposit: Integrated Petrophysical and geochemical analyses, in: Uncover Cloncurry, edited by: Gazley, M., CSIRO, Australia, pp. 50, https://doi.org/10.4225/08/585820bbc7223, 2016b.
Austin, J. R., Gazley, M. F., Patterson, B., leGras, M., and Walshe, J. L.: The Artemis Zn-Cu deposit: Integrated Petrophysical and Geochemical analyses, in: Uncover Cloncurry, edited by: Gazley, M., CSIRO, Australia, pp. 45, https://doi.org/10.4225/08/5858211087845, 2016c.
Austin, J. R., Gazley, M. F., Patterson, B. O., le Gras, M., and Walshe, J.: Uncover Cloncurry – The Cormorant Cu-Au Prospect: Integrated petrophysical and geochemical analyses, in: Uncover Cloncurry, edited by: Gazley, M., CSIRO, Australia, https://doi.org/10.4225/08/585820f9410a7, 2016d.
Austin, J. R., Gazley, M. F., Walshe, J. L., Godel, B., leGras, M., and Patterson, B. O.: The Monakoff Cu-Au-U deposit: Integrated Petrophysical and Geochemical analyses, in: Uncover Cloncurry, edited by: Gazley, M., CSIRO, Australia, pp. 50, https://doi.org/10.4225/08/585821240c01c, 2016e.
Austin, J. R., Gazley, M. F., Walshe, J. L., and Patterson, B. O.: Uncover Cloncurry – Summary: Integrated structural, metasomatic and metallogenic history of the Cloncurry District, CSIRO, Australia, pp. 45. https://doi.org/10.4225/08/5858208ac5528, 2016f.
Austin, J. R., Hawkins, S., Gazley, M. F., Patterson, B. O., leGras, M., and Walshe, J.: The Mount Colin Au-Cu deposit: Integrated petrophysical and geochemical analyses, CSIRO, Australia, https://doi.org/10.4225/08/585820d2990d3, 2016g.
Austin, J. R., Walshe, J. L., Gazley, M. F., Ibrahimi, T., Patterson, B. O., and leGras, M.: The Ernest Henry Cu-Au deposit: Integrated Petrophysical and Geochemical analyses, in: Uncover Cloncurry, edited by: Gazley, M., CSIRO, Australia, pp. 56, https://doi.org/10.4225/08/585820dc26de0, 2016h.
Austin, J. R., Walshe, J. L., Gazley, M. F., Sisson, M., leGras, M., and Godel, B.: The Canteen Cu-Au prospect: Integrated Petrophysical and geochemical analyses, in: Uncover Cloncurry, edited by: Gazley, M., CSIRO, Australia, pp. 51, https://doi.org/10.4225/08/5858212d5c7de, 2016i.
Austin, J. R., Björk, A., and Patterson, B. O.: Structural controls of the Ernest Henry IOCG deposit: Insights from integrated structural, geophysical and mineralogical analyses, ASEG Extended Abstracts, pp. 1–5, https://doi.org/10.1080/22020586.2019.12073161, 2019a.
Austin, J. R., Hillan, D., and Foss, C. A.: Remanent magnetization mapping: A tool for greenfields magmatic Ni-Cu-PGE exploration undercover: Part 2, Ore Geology Reviews, 109, 290–302, https://doi.org/10.1016/j.oregeorev.2019.04.017, 2019b.
Austin, J. R. and Patterson, B. O.: Deciphering deformation in ultramafic intrusions via magnetic fabric (AMS) and palaeomagnetic studies, Savannah Ni-PGE camp, NW Australia, Tectonophysics, 793, 228608, https://doi.org/10.1016/j.tecto.2020.228608, 2020.
Austin, J. R., Birchall, R., Stromberg, J., Patterson, B., Bjork, A, Dhnaram, C., Lisitsin, V., Walshe, J. Gazley, M., leGras, M., Shelton, T., Spinks, S., Pearce, M., Schlegel, T., and McFarlane, H.: The Cloncurry METAL Geodatabase mk1: A scale-integrated relational geodatabase for Cloncurry District, Northwest Queensland, Brisbane, Qld: Geological Survey of Queensland, csiro: EP2021-0324, http://hdl.handle.net/102.100.100/429916?index=1 (last access: 11 October 2024), 2021a.
Austin, J. R., McFarlane, H. B., Schlegel, T. U., Patterson, B., Birchall, R., Walshe, J., Bjork, A., and Shelton, T. D.: Tectono-metasomatic history and structural controls of the Ernest Henry deposit: Insights from integrated mineralogy and magnetic fabric studies: Part IV: Cloncurry METAL final report 2018/2021, edited by: Austin, J., CSIRO, Australia pp. 66, http://hdl.handle.net/102.100.100/429915?index=1 (last access: 11 October 2024), 2021b.
Austin, J. R., Patterson, B., Birchall, R., Björk, A., Walshe, J., Schlegel, T., Stromberg, J., McFarlane, H., Shelton, T. D., and Pearce, M.: Metasomatic controls on petrophysical zonation in IOCG mineral systems: An example from Ernest Henry, Cloncurry District: Part III: Cloncurry METAL Final Report 2018/21, edited by: Austin, J., CSIRO Australia, http://hdl.handle.net/102.100.100/421957?index=1 (last access: 11 October 2024), 2021c.
Austin, J. R., Schlegel, T. U., Walshe, J., Bjork, A., and Foss, C.: Geophysical proxies for redox gradients in IOCG systems: Cloncurry District, Qld, Australia. Australian Society of Exploration Geophysicists Extended Abstracts, Volume 2021, 3rd Australasian Exploration Geoscience Conference, Brisbane, 2021, Zenodo [data set], https://doi.org/10.5281/zenodo.7687590, 2021d.
Austin, J. R., Birchall, R., Stromberg, J., Patterson, B., Bjork, A, Dhnaram, C., Lisitsin, V., Walshe, J. Gazley, M., leGras, M., Shelton, T., Spinks, S., Pearce, M., Schlegel, T., and McFarlane, H.: Cloncurry METAL: multimodal integrated mineral system characterisation data, AuScope [data set], https://doi.org/10.60623/82trleue, 2024.
Berman, M., Bischof, L., Lagerstrom, R., Guo, T., Huntington, J., Mason, P.: An unmixing algorithm based on a large library of shortwave infrared spectra, CSIRO, Australia, https://doi.org/10.4225/08/584c433f7ab79, 2011.
Biamonte, J., Wittek, P., Pancotti, N., Wiebe, N., and Loyd, S.: Quantum machine learning, Nature, 549, 195–202, https://doi.org/10.1038/nature23474, 2017.
Biedermann, A. R., Kunze, K., Zappone A. S., and Hirt, A. M.: Origin of magnetic fabrics in ultramafic rocks. IOP Conference Series: Materials Science and Engineering, vol. 82, 17th International Conference on Textures of Materials (ICOTOM 17), Dresden, Germany, https://doi.org/10.1088/1757-899X/82/1/012098, 2015.
Birchall, R., Austin, J. R., Stromberg, J. M., Schlegel, T. U., Shelton, T. D., Björk, A., Woodall, C. E., and McFarlane, H. B.: A revised alteration paragenesis for the Eloise Au-Cu deposit: Results of integrated TIMA mineralogy and hyperspectral studies. Part IX: Cloncurry METAL Final Report 2018/21, edited by: Austin, J., CSIRO, Australia, pp. 59, http://hdl.handle.net/102.100.100/433371?index=1 (last access: 11 October 2024), 2021.
Bishop, J. R. and Emerson, D. W.: Geophysical properties of zinc-bearing deposits, Australian J. Earth Sci., 46, 311–328, https://doi.org/10.1046/j.1440-0952.1999.00706.x, 1999.
Brescianini, R. F., Asten, M. W., and McLean, N.: Geophysical characteristics of the Eloise Cu/Au deposit north-west Queensland, Exploration Geophysics, 23, 33–42, https://doi.org/10.1071/EG992033, 1992.
Chadima, M. and Jelinek, V.: Anisoft 4.2: Anisotropy Data Browser for Windows, Agico, Inc., http://hdl.handle.net/11104/0163273 (last access: 11 October 2024), 2009.
Chapman, L. H. and Williams, P. J.: Evolution of pyroxene–pyroxenoid–garnet alteration at the Cannington Ag–Pb–Zn Deposit, Cloncurry District, Queensland, Australia, Econ. Geol., 93, 1390–1405, https://doi.org/10.2113/gsecongeo.93.8.1390, 1998.
Clark, D. A.: Magnetic properties and magnetic signatures of the Trough Tank and Starra copper-gold deposits, Eastern Mount Isa Block, AMIRA Project 78/P96B: Applications of Rock magnetism, https://confluence.csiro.au/display/cmfr/Historic+Publications (last access: 11 October 2024), 1988.
Cole, D., McCalman, L., Metelka, V., Otto, A., Robertson, J., Rodger, A., and Steinberg, D.: NWMP Data-Driven Mineral Exploration and Geological Mapping, https://geoscience.data.qld.gov.au/data/dataset/cr113697/resource/geo-doc1055039-cr113697 (last access: 11 October 2024), 2020.
De Jong, G.: Post metamorphic alteration and mineralisation in a highly deformed Proterozoic terrain: the eastern Selwyn Range, Cloncurry District NW Queensland, Unpublished Ph.D. Thesis, James Cook University, Townsville, Qld., Australia, 1995.
Deng, D., Zheng, Y., Chen, J., Yu, S., Xiao, K., and Mao, X.: Learning 3D mineral prospectivity from 3D geological models using convolutional neural networks: Application to a structure-controlled hydrothermal gold deposit, Comput. Geosci., 161, 105074, https://doi.org/10.1016/j.cageo.2022.105074, 2022.
Dentith, M., Enkin, R. J., Morris, W., Adams, C., and Bourne, B.: Petrophysics and mineral exploration: a workflow for data analysis and a new interpretation framework, Geophys. Prospect., 68, 178–199, https://doi.org/10.1111/1365-2478.12882. 2020.
Dumakor-Dupey, N. K. and Arya, S.: Machine Learning – A Review of Applications in Mineral Resource Estimation, Energies, 14, 4079, https://doi.org/10.3390/en14144079, 2021.
Enkin, R. J., Corriveau, L., and Hayward, N.: Metasomatic Alteration Control of Petrophysical Properties in the Great Bear Magmatic Zone (Northwest Territories, Canada), Econ. Geol., 111, 2073–2085, https://doi.org/10.2113/econgeo.111.8.2073, 2016.
Enkin, R. J., Hamilton, T. S., and Morris, W. A.: The Henkel petrophysical plot: Mineralogy and lithology from physical properties, Geochem. Geophys. Geosyst., 20, e2019GC008818, https://doi.org/10.1029/2019GC008818, 2020.
Ferré, E. C., Bordarier, C., and Marsh, J. S.: Magma flow inferred from AMS fabrics in a layered mafic sill, Insizwa, South Africa, Tectonophysics, 354, 1–23, https://doi.org/10.1016/S0040-1951(02)00273-1, 2002.
Fitzpatrick, A. D.: Scale dependent electrical properties of sulphide deposits, PhD thesis, University of Tasmania, https://figshare.utas.edu.au/articles/thesis/Scale_dependent_electrical_properties_of_sulphide_deposits/23210849?file=40908593 (last access: 11 October 2024), 2006.
Ford, A. and Blenkinsop, T. G.: Combining fractal analysis of mineral deposit clustering with weights-of-evidence to evaluate patterns of mineralisation: Application to Cu deposits of the Mount Isa Inlier, NW Queensland, Australia, Ore Geol. Rev., 33, 435–450, https://doi.org/10.1016/j.oregeorev.2007.01.004, 2008.
Foster, D. R. W. and Austin, J. R.: The 1800 to 1610 Ma stratigraphic and magmatic history of the Eastern Succession, Mount Isa Inlier, and correlations with adjacent Paleoproterozoic terranes, Precambrian Res., 163, 7–30, https://doi.org/10.1016/j.precamres.2007.08.010, 2008.
Gazley, M., Patterson, B., Austin, J., and Walshe, J.: Uncover Cloncurry – Osborne Cu-Au deposit: Integrated petrophysical and geochemical analyses, CSIRO, Australia, pp. 25, https://doi.org/10.4225/08/585820e576d1f, 2016a.
Gazley, M., Sisson, M., Austin, J. R., Patterson, B., le Gras, M., and Walshe, J.: The Trekelano Cu-Au deposit: Integrated petrophysical and geochemical analyses, in: Uncover Cloncurry, edited by: Gazley, M., CSIRO, Australia, 21 pp., https://doi.org/10.4225/08/5858211a8e914, 2016b.
Gazley, M., Patterson, B., Austin, J., and Godel, B.: Background on techniques and methods, CSIRO, Australia, Kensington, WA, https://doi.org/10.4225/08/58582106f07d6, 2016c.
Gazley, M., Sisson, M., Patterson, B., Austin, J. R., and Walshe, J.: The Cameron River prospect: Integrated petrophysical and geochemical analyses, in: Uncover Cloncurry, edited by: Gazley, M., CSIRO, Australia, https://doi.org/10.4225/08/5aa17a27b1147, 2017.
Ge, Y., Jin, Y., Stein, A., Chen, Y., Wang, J., Wang, J., Cheng, Q., Bai, H., Liu, M., and Atkinson, P. W.: Principles and methods of scaling geospatial Earth science data, Earth-Sci. Rev., 197, 102897, https://doi.org/10.1016/j.earscirev.2019.102897, 2019.
Giraud, J., Seillé, H., Lindsay, M. D., Visser, G., Ogarko, V., and Jessell, M. W.: Utilisation of probabilistic magnetotelluric modelling to constrain magnetic data inversion: proof-of-concept and field application, Solid Earth, 14, 43–68, https://doi.org/10.5194/se-14-43-2023, 2023.
Greiling, R. and Verma, P.: Strike-slip and tectonics granitoid emplacement: an AMS fabric study from the Odenwald Crystalline Complex, SW Germany, Mineral. Petrol., 72, 165, https://doi.org/10.1007/s007100170032, 2001.
Gröger, G., Kolbe, T. H., Schmittwilken, J., Stroh, V., and Plümer, L.: Integrating versions, history and levels-of-detail within a 3D geodatabase, in: Proceedings of the 1st international ISPRS/EuroSDR/DGPF-Workshop on Next Generation 3D City Models, edited by: Gröger, G., Kolbe, T. H., 21–22 June 2005, Bonn, EuroSDR, pp. 35–40, https://mediatum.ub.tum.de/1453849 (last access: 11 October 2024), 2005.
Groves, D. I., Bierlein, F. P., Meinert, L. D., and Hitzman, M. W.: Iron Oxide Copper-Gold (IOCG) Deposits through Earth History: Implications for Origin, Lithospheric Setting, and Distinction from Other Epigenetic Iron Oxide Deposits, Econ. Geol., 105, 641–654, https://doi.org/10.2113/gsecongeo.105.3.641, 2010.
Haest, M., Cudahy, T., Laukamp, C., and Gregory, S.: Quantitative Mineralogy from Infrared Spectroscopic Data. I. Validation of Mineral Abundance and Composition Scripts at the Rocklea Channel Iron Deposits in Western Australia, Econ. Geol., 107, 200–228, https://doi.org/10.2113/econgeo.107.2.209, 2012.
Hitzman, M. W.: Iron oxide-Cu-Au deposits: what, where, when and why?, in: Hydrothermal Iron Oxide Copper-gold and Related Deposits: A Global Perspective, vol. 1, edited by: Porter, T. M., Australian Mineral Foundation, 9–25, https://portergeo.com.au/full_text/Hitzman_IOCG_Overview-PGC_Publishing.pdf (last access: 11 October 2024), 2000.
Hitzman, M. W., Oreskes, N., and Einaudi, M. T.: Geological characteristics and tectonic setting of Proterozoic iron oxide (Cu-U-Au-REE) deposits, Precamb. Res., 58, 241–287, https://doi.org/10.1016/0301-9268(92)90121-4, 1992.
Jelinek, V.: Characterization of the magnetic fabric of rocks, Tectonophysics, 79, 63–67, https://doi.org/10.1016/0040-1951(81)90110-4, 1981.
Johnson, G. R. and Olhoeft, G. R.: Density of rocks and minerals, in: Handbook of Physical Properties of Rocks, CRC Press, 1–38, https://doi.org/10.1201/9780203712030, 2017.
Knight, M. D. and Walker, G. P.: Magma flow directions in dikes of the Koolau Complex, Oahu, determined from magnetic fabric studies, J. Geophys. Res.-Sol. Ea., 93, 4301–4319, https://doi.org/10.1029/JB093iB05p04301, 1988.
Knorsch, M., Deditius, A. P., Xia, F., Pearce, M. A., and Uvarova, Y.: The impact of hydrothermal mineral replacement reactions on the formation and alteration of carbonate-hosted polymetallic sulfide deposits: A case study of the Artemis prospect, Queensland, Australia, Ore Geol. Rev., 116, 103232, https://doi.org/10.1016/j.oregeorev.2019.103232, 2020.
Kreuzer, O. P., Yousefi, M., and Nykänen, V.: Introduction to the special issue on spatial modelling and analysis of ore forming processes in mineral exploration targeting, Ore Geol. Rev., 119, 103391, https://doi.org/10.1016/j.oregeorev.2020.103391, 2020.
Lambourn, S. S. and Shelley, E. P.: Cloncurry detailed airborne magnetic and radiometric survey, Queensland 1970, Record 1972/110, Geoscience Australia, Canberra, http://pid.geoscience.gov.au/dataset/ga/12791 (last access: 11 October 2024), 1972.
Laukamp, C., Mason, P., Lau, I., Warren, P., and Rodger, A.: A mineral dataset for testing methods of SWIR interpretation, CSIRO EP175248, 10 pp., https://doi.org/10.25919/5f1f243e51b33, 2017.
Laukamp, C., Rodger, A., LeGras, M., Lampinen., H., Lau, I., Pejcic, B., Stromberg, J., Francis, N., and Ramanaidou, E.: Mineral Physicochemistry Underlying Feature-Based Extraction of Mineral Abundance and Composition from Shortwave, Mid and Thermal Infrared Reflectance Spectra, Minerals, 11, 347, https://doi.org/10.3390/min11040347, 2021.
Leväniemi, H. and Hokka, J.: Petrophysical target characterization with lithogeochemical clustering: the Metsämonttu Zn–Pb–Cu deposit, southern Finland, Near Surf. Geophys., 20, 637–660, https://doi.org/10.1002/nsg.12182. 2022.
Li, X., Chen, Y., Yuan, F., Jowitt, S. M., Zhang, M., Ge, C., Wang, Z., and Deng, Y.: 3D mineral prospectivity modeling using multi-scale 3D convolution neural network and spatial attention approaches, Geochemistry, 126125, https://doi.org/10.1016/j.chemer.2024.126125. 2024.
Lypaczewski, P. and Rivard, B.: Estimating the Mg# and AlVI content of biotite and chlorite from short wave infrared reflectance spectroscopy: Predictive equations and recommendations for their use, Int. J. Appl. Earth Obs., 68, 116–126, https://doi.org/10.1016/j.jag.2018.02.003, 2018.
McCuaig, T. C., Beresford, S., and Hronsky, J. M. A.: Translating the mineral systems approach into an effective exploration targeting system, Ore Geol. Rev., 38, 128–138, https://doi.org/10.1016/j.oregeorev.2010.05.008, 2010.
McFarlane, H. B. and Austin, J. R.: Anisotropy of Magnetic Susceptibility (AMS): A powerful tool for quantifying IOCG structural controls and predicting ore body geometries, CSIRO, Australia, 2021.
McFarlane, H. B., Austin, J. R., Schlegel, T. U., Birchall, R, Bjork, A., Stromberg, J., Walshe, J., Shelton, T., and Pearce, M.: Starra 276 and 251: Redox Gradients and Structural Controls – Integrated petrophysical, structural and mineralogical analysis: Part V: Cloncurry METAL Final Report 2018/2021, edited by: Austin, J., CSIRO, Australia, http://hdl.handle.net/102.100.100/429198?index=1 (last access: 11 October 2024), 2021a.
McFarlane, H. B., Bjork, A., Stromberg, J., Austin, J. R., Birchall, R., Schlegel, T. U., Shelton, T. D., and Patterson, B.: Mineralogical, petrophysical and structural characterisation of Osborne Cu-Au deposit: Part IIX: Cloncurry METAL Final Report 2018/2021, edited by: Austin, J., CSIRO, Australia, pp. 53, http://hdl.handle.net/102.100.100/433817?index=1 (last access: 11 October 2024), 2021b.
Mustard, R., Blenkinsop, T., McKeagney, C., Huddleston-Holmes, C., and Partington, G.: New perspectives on IOCG deposits. Mt Isa Eastern Succession, northwest Queensland, Extended abstracts, SEG 2004 Conference, pp. 281–284, https://researchonline.jcu.edu.au/3539/ (last access: 11 October 2024), 2004.
Mutton, A. J. and Shaw, R. D.: Physical property measurements as an aid to magnetic interpretation in basement terrains, Explor. Geophys., 10, 79–91. https://doi.org/10.1071/EG979079, 1979.
Patterson, B., Austin, J. R., Gazley, M., and Walshe, J.: The SWAN Cu-Au deposit: Integrated petrophysical and geochemical analyses, in: Uncover Cloncurry, edited by: Gazley, M., CSIRO, Australia, https://doi.org/10.4225/08/5858209427c32, 2016a.
Patterson, B., Gazley, M., Austin, J. R., and Walshe, J.: The Merlin Mo-Re deposit: Integrated petrophysical and geochemical analyses, in: Uncover Cloncurry, edited by: Gazley, M., CSIRO, Australia, 30 pp., https://doi.org/10.4225/08/585821367807e, 2016b.
Patterson, B., Austin, J. R., Walshe, J. Gazley, M., leGras, M., and Godel, B.: The Starra Cu-Au deposits: Integrated petrophysical and geochemical analyses. in: Uncover Cloncurry, edited by: Gazley, M., CSIRO, Australia, https://doi.org/10.4225/08/586fdb2db600b, 2016c.
Pearce, M., Austin, J., McFarlane, H., Birchall, R., and Spinks, S.: Cloncurry METAL Final Report Part VII: Cloncurry METAL Final Report 2018/2021, edited by: Austin, J., CSIRO, Australia, pp. 46, http://hdl.handle.net/102.100.100/429788?index=1 (last access: 11 October 2024), 2021.
Portela, L., Siégel, C., Allen, C., and Austin, J.: Allanite U-Th-Pb geochronology of IOCG and Zn-Ag-Pb deposits in the Mount Isa Inlier, Australia. Society of Economic Geologists 2024 conference proceedings, Windhoek, Namibia, http://hdl.handle.net/102.100.100/636762?index=1 (last access: 25 October 2024), 2024.
Porwal, A. K. and Kreuzer, O. P.: Introduction to the special issue: mineral prospectivity analysis and quantitative resource estimation, Ore Geol. Rev., 38, 121–127, https://doi.org/10.1016/j.oregeorev.2010.06.002, 2010.
Riisager, P. and Abrahamsen, N.: Palaeomagnetic errors related to sample shape and inhomogeneity, Earth Planets Space, 55, 83–91, 2003.
Roache, T. J., Williams, P. J., Richmond, J. M., and Chapman, L. H.: Vein and Skarn Formation at the Cannington Ag–Pb–Zn Deposit, northeastern Australia, The Canadian Mineralogist, 43, 241–262, 2005.
Rubenach, M.: Structural Controls of Metasomatism on a Regional Scale, in: Metasomatism and the Chemical Transformation of Rock, Lecture Notes in Earth System Sciences, Springer, Berlin, Heidelberg, 2013.
Rybach, L.: Radioactive heat production in rocks and its relation to other petrophysical parameters, Pure Appl. Geophys., 114, 309–318, 1976.
Rybach, L.: Determination of heat production rate, in: Handbook of Terrestrial Heat Flow Density Determination, edited by: Haenel, R., Rybach, L., and Stegena, L., Kluwer Academic Publishers, Dordrecht, pp. 486, 1988.
Schlegel, T. U.: Mapping Mineral Zonation using Integrated TIMA Mineralogy and Geochemistry: Vectoring to Grade, CSIRO, Australia, pp. 8, http://hdl.handle.net/102.100.100/433707?index=1 (last access: 11 October 2024), 2021.
Schlegel, T. U., Birchall, R., Stromberg, J. M., McFarlane, H., Shelton, T., Godel, B., Bjork, A., Pearce, M. A., Walshe, J. L., and Austin, J.: Mineral System Knowledge via Integration of Mineralogy, Geochemistry and Petrophysics – A case study on the Ernest Henry IOCG deposit. Part II: Cloncurry METAL final report 2018/2021, edited by: Austin, J., CSIRO, Australia, pp. 46, CSIRO, Australia, 2021.
Schlegel, T. U., Birchall, R., Shelton, T. D., and Austin, J. R.: Mapping the mineral zonation at the Ernest Henry iron oxide copper-gold deposit: Vectoring to Cu-Au mineralization using modal mineralogy, Econ. Geol., 117, 485–494, https://doi.org/10.5382/ECONGEO.4915, 2022.
Schmidt, P. W., McEnroe, S. A., Clark, D. A., and Robinson, P.: Magnetic properties and potential field modeling of the Peculiar Knob metamorphosed iron formation, South Australia: An analog for the source of the intense Martian magnetic anomalies?, J. Geophys. Res.-Sol. Ea., 112, B03102, https://doi.org/10.1029/2006JB004495, 2007.
Smillie, R., Hill, M., Martin, A.P., Rattenbury, M., and Turnbull, R.: A Mineral Systems Approach for New Zealand: New Opportunities for Exploration, in: Proceedings Australasian Institute of Mining and Metallurgy 50th New Zealand Branch Annual Conference, edited by: Fergusson, D., Australasian Institute of Mining and Metallurgy, 306–313, 2017.
Sonntag, I., Laukamp, C., and Hagemann, S. G.: Low potassium hydrothermal alteration in low sulfidation epithermal systems as detected by IRS and XRD: An example from the Co-O mine, Eastern Mindaneo, Phillipines, Ore Geol. Rev., 45, 47–60, 2012.
Stromberg, J. M., McFarlane, H. B., Birchall, R., Schlegel, T. U., Austin, J. R., Pearce, M. A., and Shelton, T. D.: SWAN and Mount Elliot Cu-Au Systems – Multi-scale Investigation of Calc-Silicate Alteration Mineralogy. Part VI: Cloncurry METAL Final Report 2018/2021, CSIRO, Australia, http://hdl.handle.net/102.100.100/428686?index=1 (last access: 11 October 2024), 2021.
Torsvik, T. H., Sturt, B. A., Swensson, E., Andersen, T. B., and Dewey, J. F.: Palaeomagnetic dating of fault rocks: evidence for Permian and Mesozoic movements and brittle deformation along the extensional Dalsfjord Fault, western Norway, Geophys. J. Int., 109, 565–580, https://doi.org/10.1111/j.1365-246X.1992.tb00118.x, 1992.
Walshe, J. L., Cooke, D. R., and Neumayr, P.: Five questions for fun and profit: A mineral system perspective on metallogenic epochs, provinces and magmatic hydrothermal Cu and Au deposits, in: Mineral Deposit Research: Meeting the Global Challenge, edited by: Mao, J. and Bierlein, F. P., Springer, Berlin, Heidelberg, https://doi.org/10.1007/3-540-27946-6_124, 2005.
Walshe, J. L., Gazley, M. F., Austin, J. R., and Patterson, B. O.: Chemical gradients in the Cloncurry Mineral System: Vectors to grade?, in: Uncover Cloncurry, edited by: Gazley, M., CSIRO, Australia, https://doi.org/10.4225/08/585820a819235, 2016.
Walters, S. G., Skrzeczynski, B., Whiting, T., Bunting, F., and Arnold, G.: Discovery and Geology of the Cannington Ag-Pb-Zn Deposit, Mount Isa Eastern Succession, Australia: Development and Application of an Exploration Model for Broken Hill-Type Deposits, in: Integrated Methods for Discovery: Global Exploration in the Twenty-First Century, edited by: Goldfarb, R. J. and Nielsen R. L., https://doi.org/10.5382/SP.09.05, 2002.
Webb, M. and Rowston, P.: The Geophysics of the Ernest Henry Cu-Au Deposit (N.W.) Qld, Exploration Geophysics, 26, 51–59, https://doi.org/10.1071/EG995051, 1995.
Williams, M. J., Schlegel, T. U., Austin, J., Lisitsin, V., Francis, N., Armstrong, D., Wathen-Dunn, K., and Dhnaram, C.: Signatures of Key Mineral Systems in the Eastern Mount Isa Province, Queensland: New Perspectives from Data Analytics, CSIRO, Australia, 109 pp., https://doi.org/10.25919/gv7t-xr02, 2022.
Williams, P. J.: Metalliferous economic geology of the Mt Isa Eastern Succession, Queensland, Australian J. Earth Sci., 45, 329–341, https://doi.org/10.1080/08120099808728395, 1998.
Williams, P. J. and Baker, T.: Regional-scale association of Skarn alteration and base metal deposits in the Cloncurry District, Mount Isa Inlier, Queensland, Australia. Transactions of the Institute of Mining and Metallurgy Section B (Applied Earth Science), 104, 189–192, https://minabs.americangeosciences.org/vufind/Record/2001069649 (last access: 11 October 2024), 1995.
Williams, P. J. and Heinemann, M.: Maramungee; a Proterozoic Zn skarn in the Cloncurry District, Mount Isa Inlier, Queensland, Australia, Econ. Geol., 88, 1114–1134, https://doi.org/10.2113/gsecongeo.88.5.1114, 1993.
Williams, P. J., Pendergast, W. J., and Dong, G.: Late orogenic alteration in the wall rocks of the Pegmont Pb–Zn deposits, Cloncurry District, Queensland, Australia, Econ. Geol., 93, 1180–1189, https://doi.org/10.2113/gsecongeo.93.8.1180, 1998.
Williams, P. J., Barton, M. D., Johnson, D. A., Fontboté, L., de Haller, A., Mark, G., Oliver, N. H. S., and Marschik, R.: Iron oxide copper-gold deposits: Geology, Space-time distribution, and possible modes of origin: Econ. Geol., 100th Anniversary Volume, 371–405, https://doi.org/10.5382/AV100.13, 2005.
Xiang, J., Xiao, K., Carranza, E. J. M., Chen, J., and Li, S.: 3D Mineral Prospectivity Mapping with Random Forests: A Case Study of Tongling, Anhui, China, Nat. Resour. Res., 29, 395–414, https://doi.org/10.1007/s11053-019-09578-2, 2020.
Yousefi, M., Kreuzer, O. P., Nykänen, V., and Hronsky, J. M. A.: Exploration information systems – a proposal for the future use of GIS in mineral exploration targeting, Geol. Rev., 111, 103005, https://doi.org/10.1016/j.oregeorev.2019.103005, 2019.
Yousefi, M., Carranza, E. J. M., Kreuzer, O. P., Nykänen, V., Hronsky, J. M. A., and Mihalasky, M. J.: Data analysis methods for prospectivity modelling as applied to mineral exploration targeting: State-of-the-art and outlook, J. Geochem. Explor., 229, 106839, https://doi.org/10.1016/j.gexplo.2021.106839, 2021.
Závada, P., Calassou, T., Schulmann, K., Hrouda, F., Štípská, P., Hasalová, P., Míková, J., Magna, T., and Mixa, P.: Magnetic fabric transposition in folded granite sills in Variscan orogenic wedge, J. Struct. Geol., 94, 166–183, https://doi.org/10.1016/j.jsg.2016.11.007, 2017.


