the Creative Commons Attribution 4.0 License.
the Creative Commons Attribution 4.0 License.
 | 19 Jan 2024
Oceanographic dataset collected during the 2021 scientific expedition of the Canadian Coast Guard Ship Amundsen
Tahiana Ratsimbazafy
Thibaud Dezutter
Amélie Desmarais
Daniel Amirault
Pascal Guillot
Simon Morisset
Since 2003, the state-of-the-art Canadian Coast Guard Ship (CCGS) research icebreaker Amundsen has furrowed the Canadian Arctic waters to support novel research endeavors and collect oceanographic data. This paper presents the data acquisition, the processing methods and an overview of the data collected during the 2021 expedition as the ship traveled over 30 000 km during 122 d across the Canadian Arctic Ocean, collecting sea surface, atmospheric and seabed underway measurements. A total of 266 casts of a conductivity, temperature and depth profiler mounted on a Conductivity Temperature Depth rosette (CTD Rosette) were also conducted to monitor the main physical, chemical and biological parameters of the water column. More specifically, the data presented here were collected with the CTD Rosette across historical sampling transects in Davis Strait, the North Water Polynya (NOW) and Cape Bathurst. A 182 km dedicated survey using the Moving Vessel Profiler® (MVP), equipped with CTD, transmissometer, dissolved oxygen, fluorescence and sound velocity sensors, was conducted across Hudson Strait. We also present an overview of the data collected by the underway systems (seabed, thermosalinograph and atmospheric). Such data are essential in understanding the impacts of climate warming on the unique environments of the Canadian Arctic Ocean. Amundsen Science supports and promotes easy access and sharing of such valuable data to the scientific community.
- Article
(16303 KB) - Full-text XML
- BibTeX
- EndNote


The Canadian Arctic Ocean covers 4 million km2, and over 70 % of Canada’s coastline is within the Arctic region (Niemi et al., 2020). Such a vast area embraces numerous unique ecosystems for which it has been challenging to establish a global, robust and reliable baseline to fully understand the impact of global warming. Over the years, ice camp (Untersteiner et al., 2009; Massicotte et al., 2020), research vessels (such as the Canadian Coast Guard Ship (CCGS) Amundsen and the CCGS Louis Saint-Laurent), Inuit Knowledge (Weatherhead et al., 2010; Gearheard et al., 2010) and moorings (Armitage et al., 2020; Dezutter et al., 2021; Nadaï et al., 2021) have all been tools used to acquire data and to fill gaps in the Canadian Arctic Ocean knowledge. Meanwhile, satellites and meteorological stations have been providing reliable and rigorous datasets of sea ice and air temperature since the industrialization period. Previous work showed that the Arctic is warming twice as fast as the rest of the world and will continue to do so (Serreze et al., 2009; Gulev et al., 2021). In the Canadian Arctic, the summer sea ice extent has been reduced by 9.1 % per decade over 1968–2022 (Environment and Climate Change Canada, 2023) in addition to global thinning (Lindsay and Schweiger, 2015; Meier et al., 2014), while the air temperature has been increasing between 1.5 and 3.7 ∘C from 1948 to 2018 over the Arctic land (Environment and Natural Resources Canada, 2021). The unique ecosystems of the Arctic Ocean, driven by extreme seasonality in light regime and sea ice cover, which dictate the energy transfer through the food web, from micro-algae to large marine mammals (Falk-Petersen et al., 2007), have been directly and indirectly impacted by the drastic loss of sea ice. Changes in timing of biological events (Niemi et al., 2020; Hauser et al., 2017), northern shift of species (Dunmall et al., 2018; Higdon and Ferguson, 2009) along with increase marine traffic (Halliday et al., 2022; Johnston et al., 2017; Dawson et al., 2018) and pollution (Adams et al., 2021) are all known consequences of the climate change and ice retreat in the Canadian Arctic.
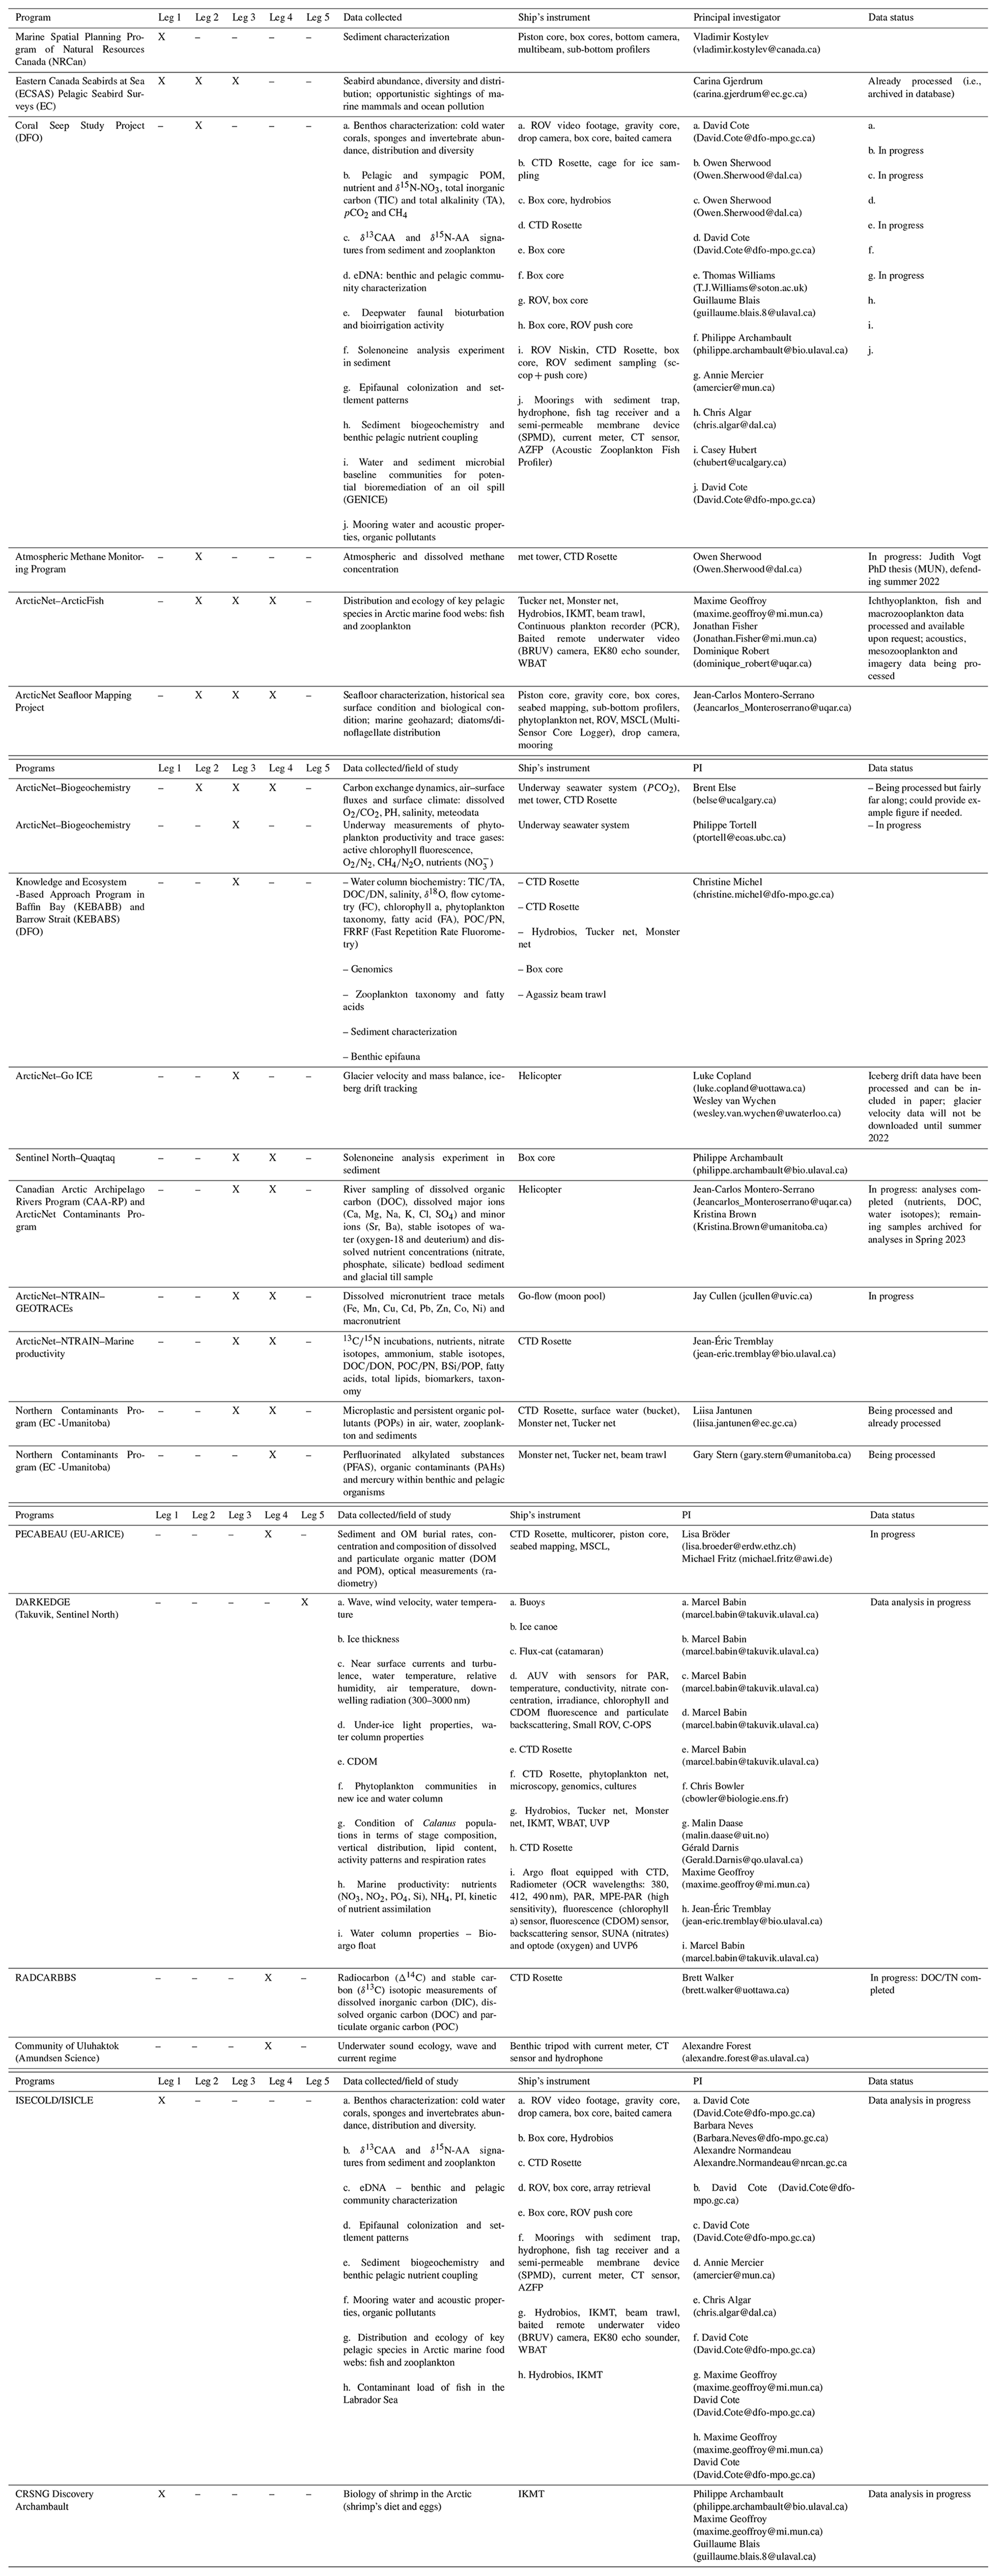
Since 2003, the CCGS icebreaker Amundsen and its leading-edge scientific instrumentation has been monitoring the Canadian Arctic by supporting dozens of large-scale national and international research initiatives from academia, local communities, and the public and private sectors. The CCGS Amundsen is the only coast guard ship seasonally dedicated to science. Over 1400 refereed scientific publications and 400 datasets have resulted from the CCGS Amundsen expeditions. The publications range from physical oceanography to geology, biogeochemistry, ecology and safety hazard assessments (Dmitrenko et al., 2023; Rodríguez-Cuicas et al., 2023; Stern et al., 2023; Vogt et al., 2023; Yunda-Guarin et al., 2023). Hosted at Université Laval, Amundsen Science is the organization responsible for the management of the scientific mandate of the research icebreaker CCGS Amundsen. Specifically, Amundsen Science manages the vessel’s pool of scientific equipment, coordinates the deployment of the icebreaker for science and provides logistical, financial and technical support to user programs. In order to promote and share Canadian Arctic oceanographic data, the objective of this paper is to present an overview of datasets collected by the core instruments managed by Amundsen Science over the 2021 Amundsen scientific expedition. The expedition took place from 4 July to 3 November and was divided into five legs1 taking place in the Labrador Sea, the Baffin Bay, the Canadian Arctic Archipelago and the Beaufort Sea (Fig. 1). Eight multidisciplinary national and international research programs and other ancillary projects took part in this annual expedition (Table B1). Research programs' objectives are central to the Amundsen expeditions and are supported by Amundsen Science through oceanographic data acquisitions. Detailed CTD Rosette, Moving Vessel Profiler®, underway measurement of sea surface properties with thermosalinograph (TSG) and atmospheric data, multibeam echo sounder, single beam echo sounder and sub-bottom profiler datasets were collected during this expedition and are presented in this paper. Information on additional samples collected by the research teams onboard during the 2021 expedition can be obtained by contacting the respective principal investigators (PI, as detailed in Table B1) or by consulting the expedition report (Desmarais et al., 2023). The Amundsen Science website (https://amundsenscience.com/data/data-access/, last access: 15 December 2023) includes an overview of all the available data from previous years published in the Polar Data Catalogue (https://www.polardata.ca/, last access: 15 December 2023).
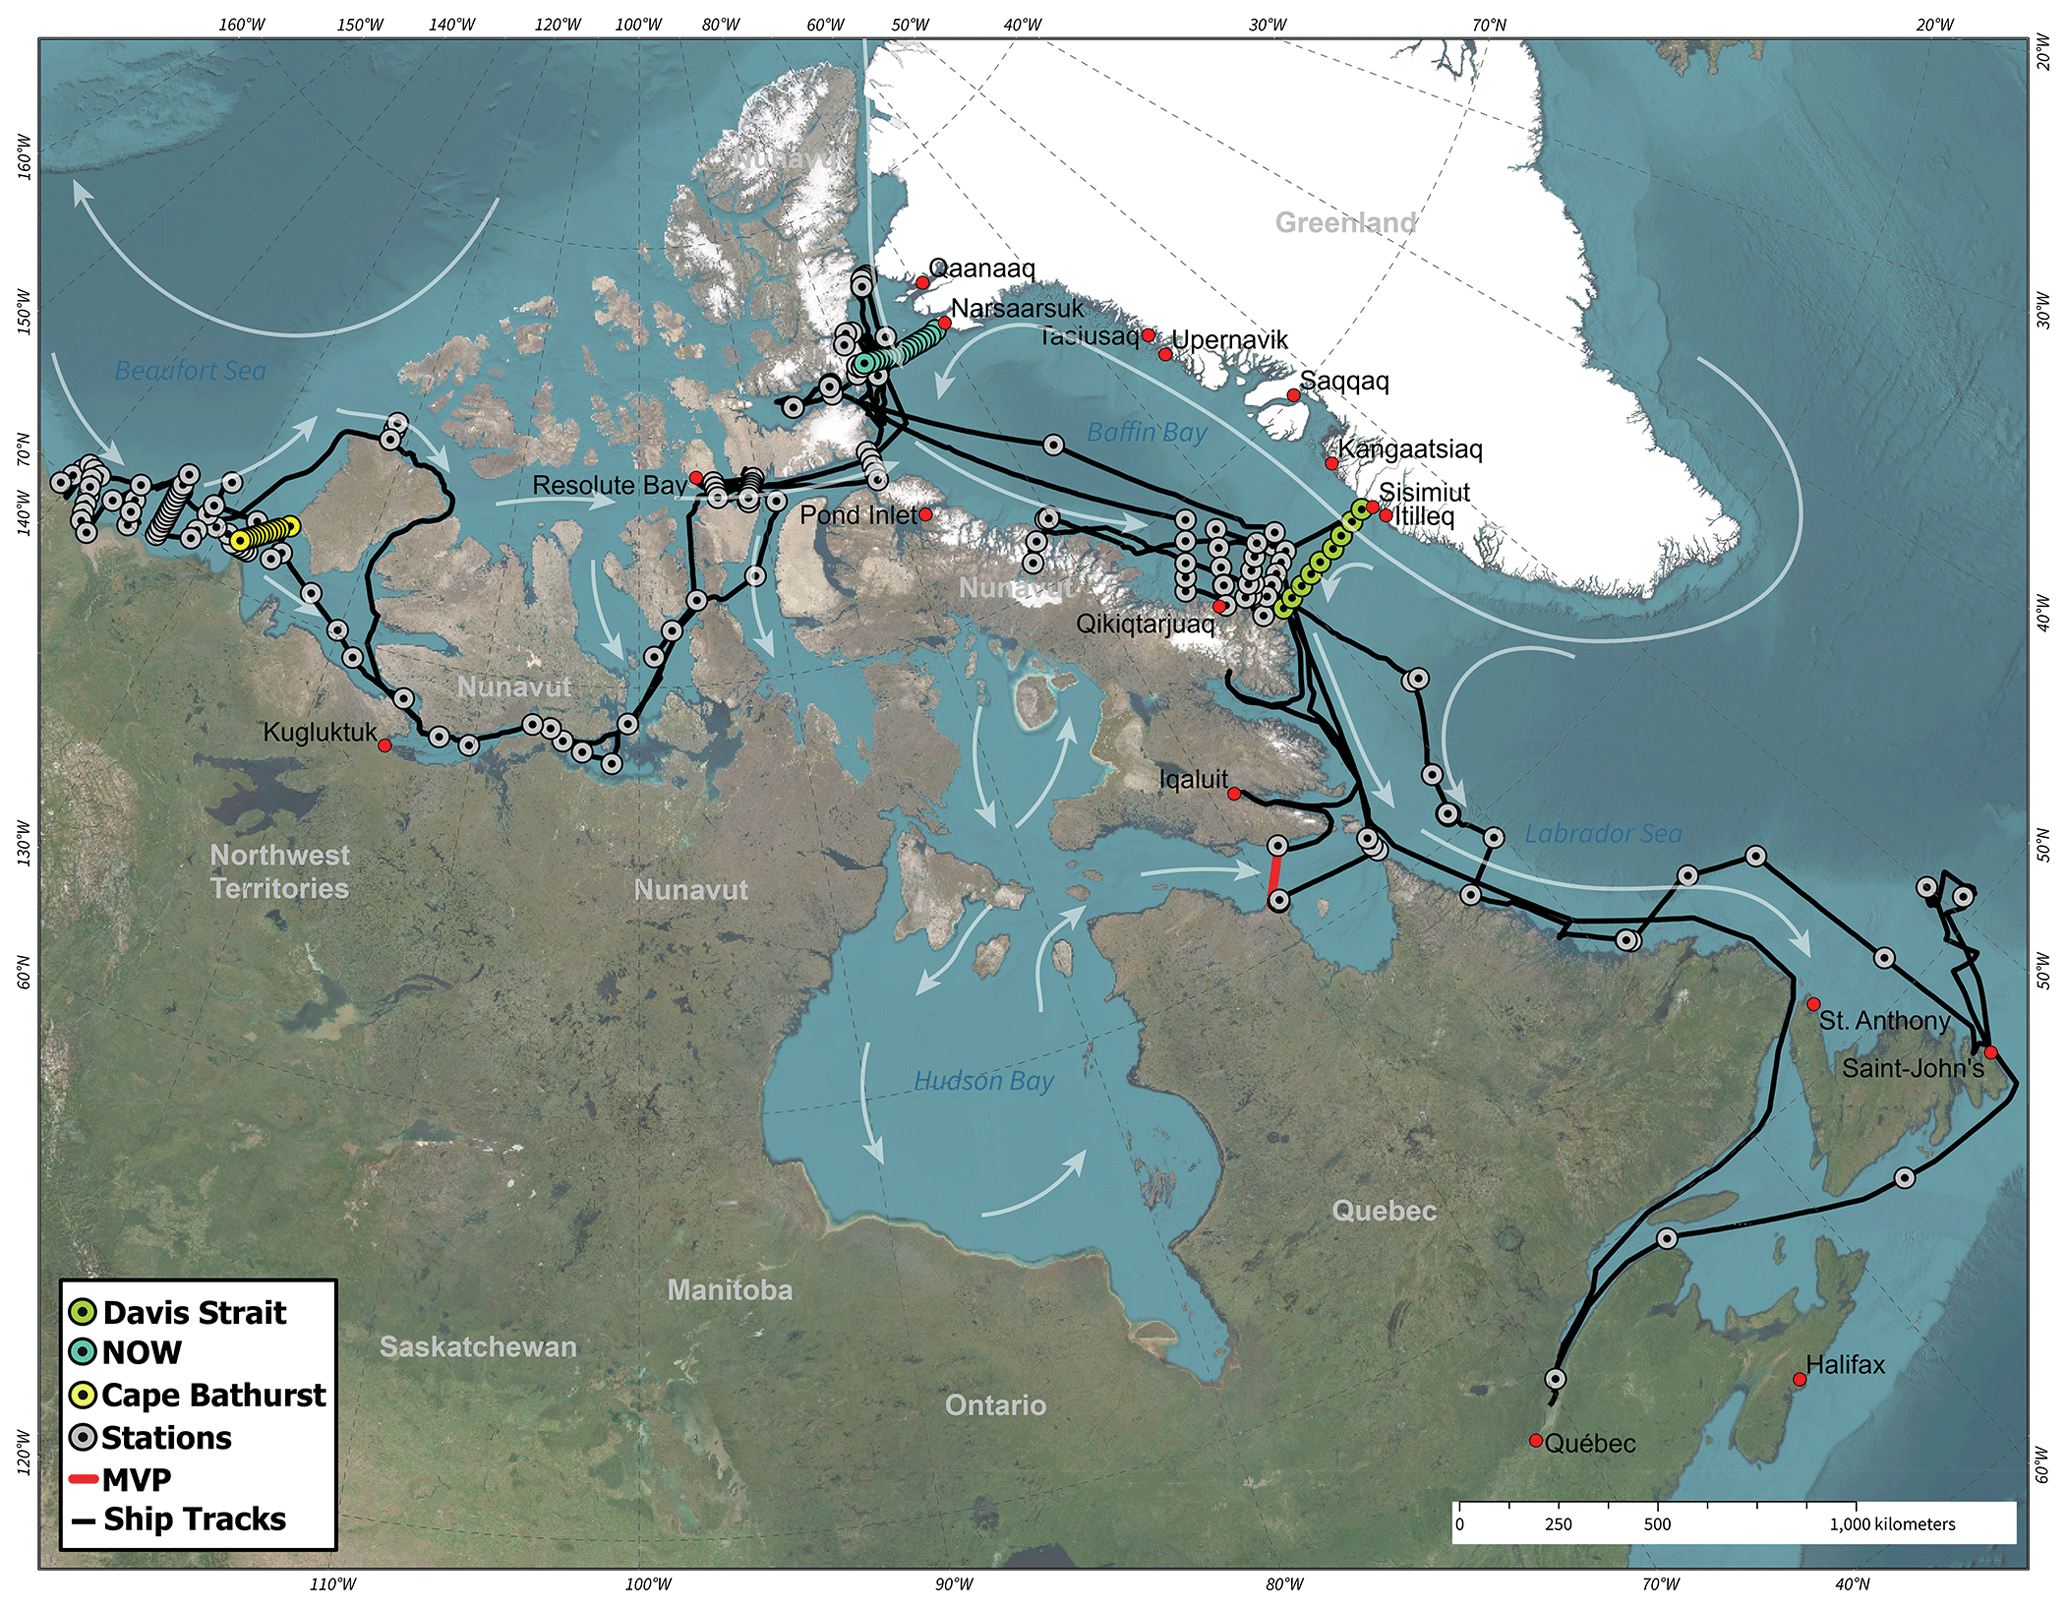
Figure 1Map of the CCGS Amundsen 2021 expedition, including ship track and the locations of CTD Rosette stations and MVP casts. Current circulation represented by white arrows is derived from Arctic Monitoring and Assessment Programme (AMAP) (1998). (ESRI 2023).
1.1 Regional settings
1.1.1 Labrador Sea and Hudson Strait
The Labrador Sea, located between Labrador and Greenland, receives several water currents from different parts of the Arctic regions. The Baffin Current from the Baffin Bay brings cold water as well as drifting icebergs and ice islands into the Labrador Sea, acting as a corridor for ice transport (Yang et al., 2016; New et al., 2021). Such moving ice blocks were reported by Marko et al. (2014) as presenting risks for activities and operations conducted offshore Newfoundland. Cold waters from Hudson Bay's current circulates through Hudson Strait to the Labrador Sea where it joins warm sub-arctic water from the North Atlantic Current (McGeehan and Maslowski, 2012; Yang et al., 2016) and feeds the source of water mass formation in the Labrador and Irminger seas (Kieke and Yashayaev, 2015).
Exchanges of carbon dioxide, oxygen and heat between the deep ocean and the atmosphere have been reported by Clarke and Coote (1988), Azetsu-Scott et al. (2003), DeGrandpre et al. (2006), Körtzinger et al. (2008), and Yashayaev and Seidov (2015) to occur in the Labrador Sea area. They arise from deep ocean convection processes during winter when heat losses occur and cold waters sink to greater depth, produces the Labrador Sea water (McCartney, 1992; Kieke et al., 2009) and allows the possibility of exchange between the intermediate and deep waters with the surface water and the atmosphere (Kieke et al., 2009).
Such complexity of system processes occurring in the Labrador Sea demonstrate how important the gathering of scientific knowledge is as guidance for various decision makers to monitor risks associated with various activities, such as exploration and exploitation of oil and gas, in order to maintain the safety of marine ecosystems in the region.
1.1.2 Baffin Bay
Located between the Baffin Island and Greenland, Baffin Bay is connected to the Lincoln Sea through Nares Strait, one of the pathways of sea ice transport from the Arctic Ocean into Baffin Bay (Kwok, 2005). Lancaster and Jones Sound are considered as a sea ice corridor as well, connecting Baffin Bay to the Arctic Ocean and allowing ice and fresher water being transported downstream to Davis Strait and the Labrador Sea (Tang et al., 2004). Despite its location in high latitude, Baffin Bay is under the influence of the northward West Greenland Current (WGC), bringing warm and salty waters, and exchanges heat, salt and ice with the southward Baffin Island Current in an anti-clockwise circulation (Arctic Monitoring and Assessment Programme (AMAP), 2018).
In Nares Strait, between Ellesmere Island and Greenland, ice arches typically form each winter at both its northern and southern ends (Moore et al., 2021). The formation of an ice arch in Nares Strait and the resulting cessation of ice transport, the input of warm and salty Atlantic water from the West Greenland current and upwelling of warmer waters, all contribute to the formation of the North Water Polynya (NOW), a year-round expanse of open waters in Smith Sound and northern Baffin Bay which is the largest and most productive of its kind (Melling et al., 2001; Moore et al., 2019). The thinning of the Arctic sea ice is negatively affecting the stability of these ice arches, which results in an acceleration in the loss of multi-year ice from the Arctic and could impact the NOW polynya ecosystem (Moore et al., 2021; Kwok et al., 2010; Moore et al., 2019).
Glaciers, ice caps and ice fields of the Canadian Arctic and Greenland also contribute to the freshwater input in Baffin Bay via their runoff through fjords, rivers and calving (Bamber et al., 2018). Some ice fields, such as the Manson ice field (southeast Ellesmere Island, Canada), directly connect with northern Baffin Bay. In the Canadian Arctic, the Manson ice field has the highest concentration of surging glaciers, characterized by surging periods and variable glacial and freshwater flow (Copland et al., 2003).
During the 2021 Arctic expedition, the CCGS Amundsen visited Baffin Bay and northern Baffin Bay for scientific sampling activities to monitor seawater physics, chemistry nutrients, contaminants and the biodiversity present along precise historical transects, glacier fronts and Baffin Island fjords.
1.1.3 Canadian Arctic Archipelago
The Canadian Arctic Archipelago (CAA) covers several islands and channels between Banks Island in the west and Baffin and Ellesmere islands in the east. This area is characterized by the mixing of Pacific, Atlantic and Arctic-originating waters, a strong year-to-year variability in oceanographic and biological processes and changing sea ice conditions (Michel et al., 2006; Pizzolato et al., 2014). Over the past decades, marine transport in the region has increased due to the easing in navigability driven by reductions in the extent, thickness and age of sea ice (Kwok et al., 2009). As the CAA could become the largest ice export outlet for the Arctic Ocean (Howell and Brady, 2019), risk of collision resulting in potential Arctic oil spills are high (Helle et al., 2020). Arctic Council’s Working Group on the Protection of the Arctic Marine Environment (PAME) (2020) indicated the importance of collecting bathymetric and sub-bottom data for seafloor mapping, identifying potential geohazards and obstacles to a safe navigation in the newly open Arctic.
Collecting bathymetric data for seafloor mapping is a challenging task for a large area with limited access such as the Arctic. An earlier version of digital bathymetric data, International Bathymetric Chart of the Arctic Ocean (IBCAO), was first introduced by Jakobsson et al. (2000) at the American Geophysical Union (AGU) conference in 1999. The data were part of the declassified historic sounding collections from the United States and the British submarines between 1957 and 1988. Several updates have been made since using models and new data from different sources (Jakobsson et al., 2008, 2012).
During the 2021 expedition, the CCGS Amundsen collected dedicated echo-sounding data at Smith Bay and Ellesmere Island. Description of instruments for seabed data acquisition and samples from the seabed mapping are presented in Sect. 2.3.3 and Sect. 3.5 respectively.
1.1.4 Beaufort Sea
Recently, important changes in sea ice have been reported in both Beaufort Sea and the Mackenzie shelf region of the Arctic Ocean (Comiso, 2002; Galley et al., 2016; Mudryk et al., 2018). First-year ice is becoming more common in the area due to increased transport of old ice away from the regional peripheral Arctic seas (Nghiem et al., 2007; Ogi et al., 2008; Hutchings and Rigor, 2012). The Beaufort Sea shelves are mostly influenced by the Mackenzie River sediment-rich input (Carson et al., 1998), carrying a large and seasonally amount of freshwater with 130×106 t yr−1 (Carmack and Macdonald, 2002).
Along the Mackenzie shelf stretches the highly productive Cape Bathurst polynya, the third biggest expanse of open water that has existed year-round (Arrigo and van Dijken, 2004). This ecosystem is also exceptional since it provides habitat for some of the highest densities of birds and marine mammals in the Arctic (Harwood and Stirling, 1992; Dickson and Gilchrist, 2002), although climate-change-induced stress and anthropogenic activities are putting – and increasing – pressure on the ecosystem (Hoover et al., 2021).
Since 2002, extensive multidisciplinary research programs have been conducted in the Beaufort Sea area from the CCGS Amundsen through international overwintering research programs including the Canadian Arctic Shelf Exchange Study (CASES) in 2003–2004 and the Circumpolar Flaw Lead (CFL) Study in 2007–2008. Environmental and oceanographic research activities were also conducted in the offshore region of the Mackenzie shelf, shelf slope and Beaufort Sea within the framework of the Beaufort Regional Environmental Assessment program (BREA).
Data collected and the subsequent methods applied to ensure quality assurance and quality control (QAQC) are presented in the following section. Computer programs used to produce the transects figures in this manuscript are available in Ratsimbazafy et al. (2023).
2.1 CTD Rosette profiler
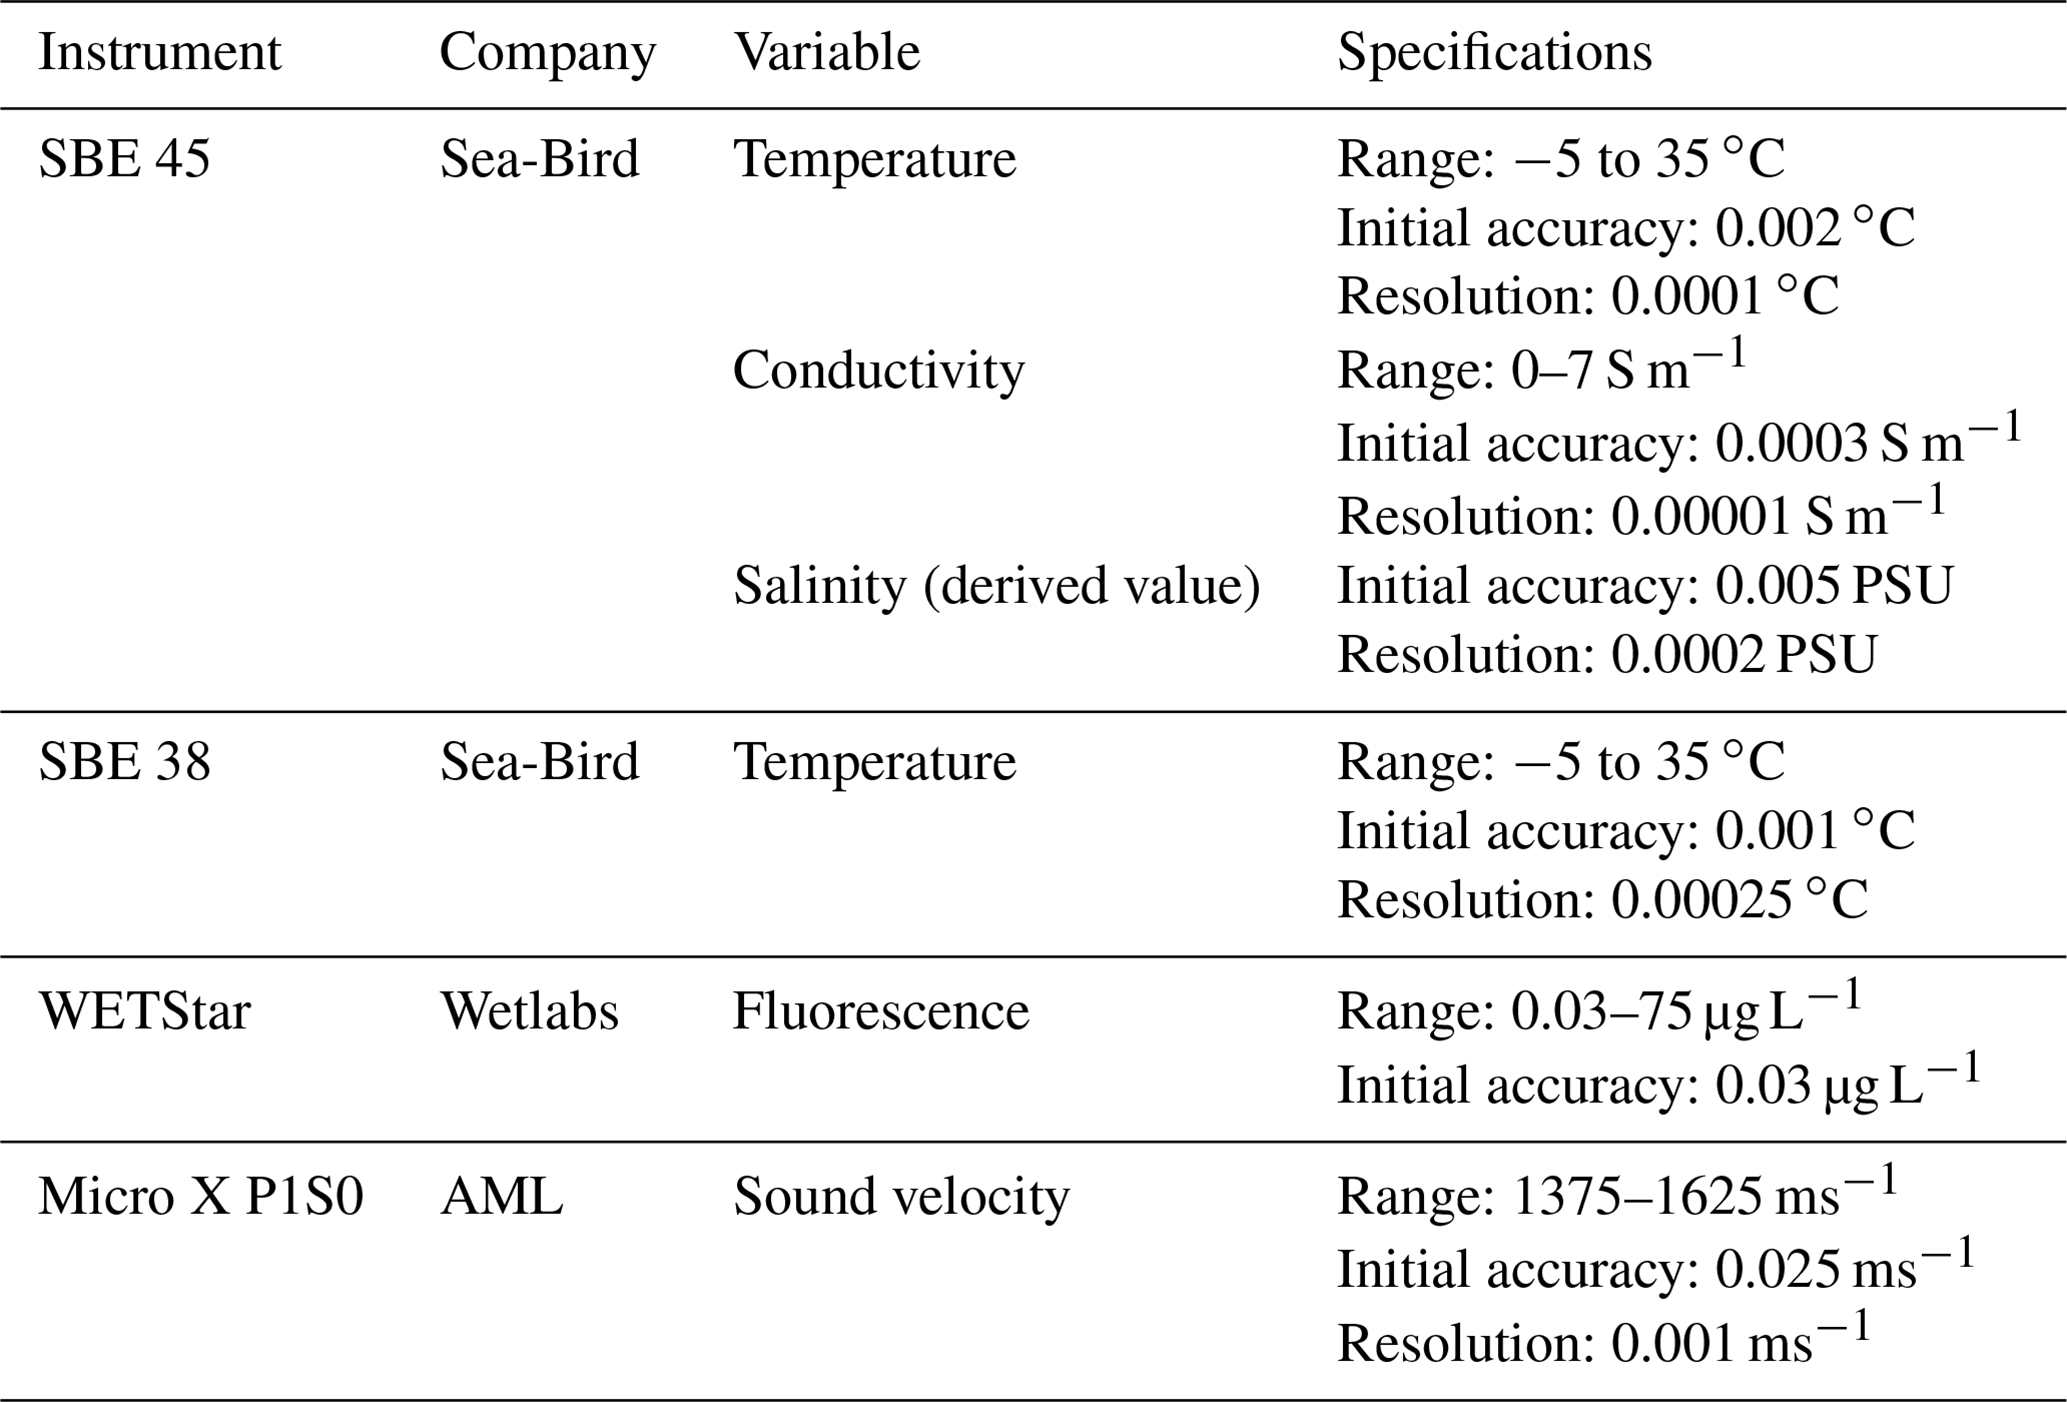
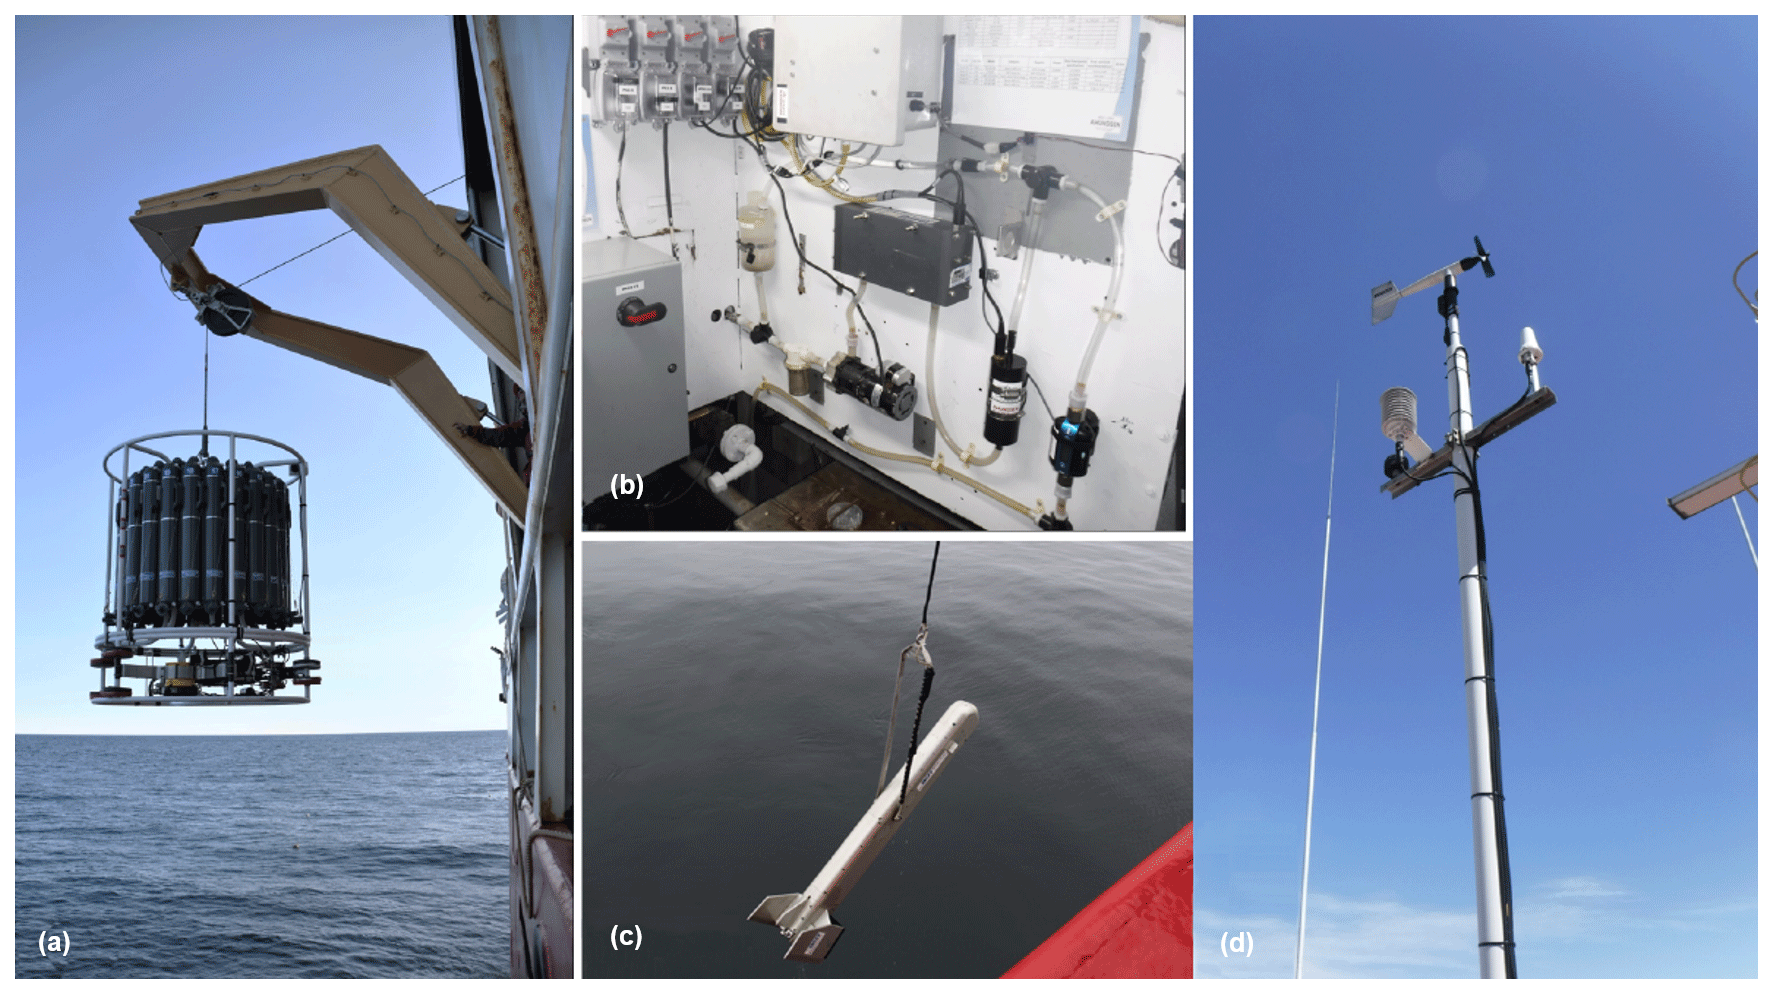
The CCGS Amundsen is equipped with a Sea-Bird Scientific© SBE 911plus CTD (SBE 9plus CTD unit combined with SBE 11plus V2 deck unit) mounted on a SBE 32 carousel water sampler with 24 Niskin bottles (12 L each), model 110BES by Ocean Test Equipment (see Appendix C2). Along with the basic SBE CTD sensors (temperature, conductivity, pressure and dissolved oxygen), the SBE 9plus supports several auxiliary sensors (nitrate, transmissometer, colored dissolved organic matter, fluorescence and photosynthetically active radiation (PAR)). Conductivity, temperature and fluorescence sensors are doubled to ensure data redundancy and reliability. A surface PAR (SPAR) sensor is also installed at the top of the bridge between 10 and 15 m from the sea surface and provides reference values. The main sensors are factory calibrated every year before the cruise period and are post-calibrated after the cruises which allows detection of any problems such as drift. An independent LADCP (lowered acoustic Doppler current profiler) is also mounted to the frame in order to measure the horizontal current velocities throughout the water column. The LADCP is a Teledyne 300 kHz instrument that looks downward. It is set up to record data with 8 m bin size, one ping per second and zero blanking. Technical specifications related to each sensor mounted on the rosette are summarized in Table 1.
Table 1Instruments and specifications of the CTD Rosette deployed during the 2021 expedition of the CCGS Amundsen.
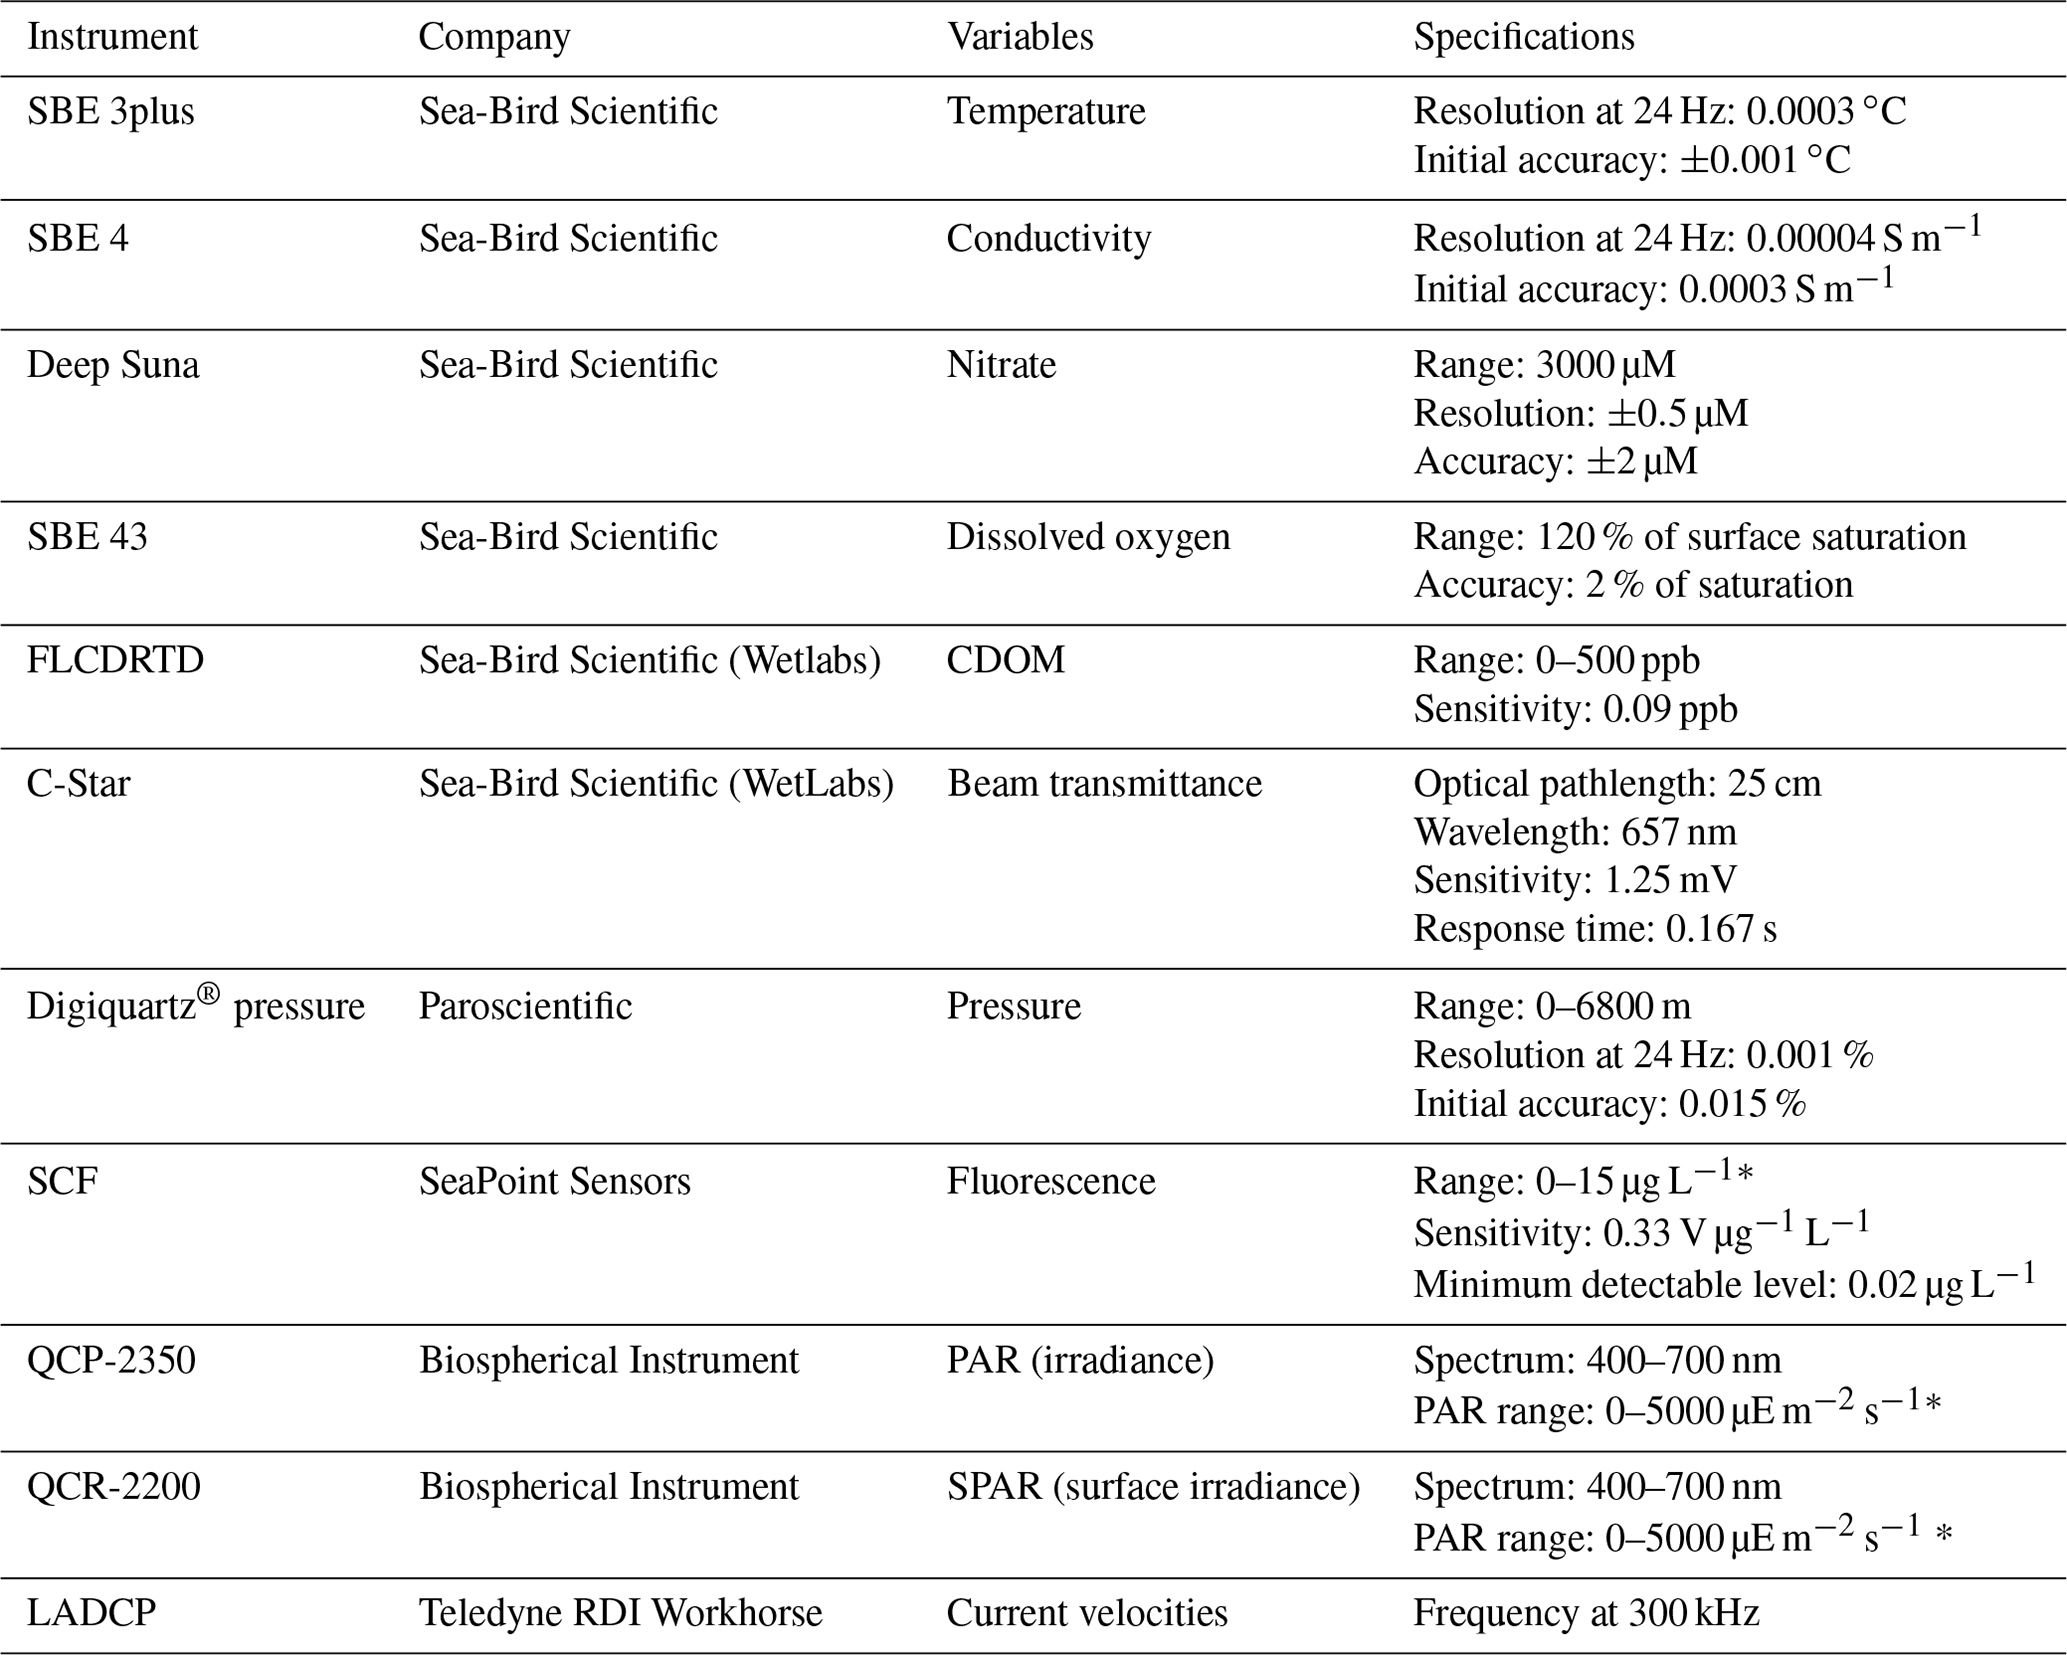
* The SCF can be used in four sensibility and range configurations. The 15 µg L−1 range configuration was used for all casts of the 2021 expedition. For QCP-2350 specifications, see Biospherical Instruments Inc. (2014). Most QCR specifications are known to be identical to those of QCP sensors.
The water samples collected with the CTD Rosette are used by multiple scientific programs (see Table B1) and by Amundsen Science for data validation. The conductivity sensors are compared with salinity water samples analyzed with a 8400B Guildline salinometer. The dissolved oxygen sensor is validated with water samples analyzed via the Winkler method (Aminot and Chaussepied, 1983). Other sensors, such as the Suna nitrate sensor or the SeaPoint fluorescence sensors, are validated with water samples if they are analyzed and available from other scientific teams.
Figure 2 depicts the temperature and salinity anomalies recorded by the dual sensor system. Good agreement is obvious between the two temperature sensors. However, the salinity sensor presents a slight and continuous drift by the end of leg five. The comparison with the water samples allowed determination of the faulty sensor.
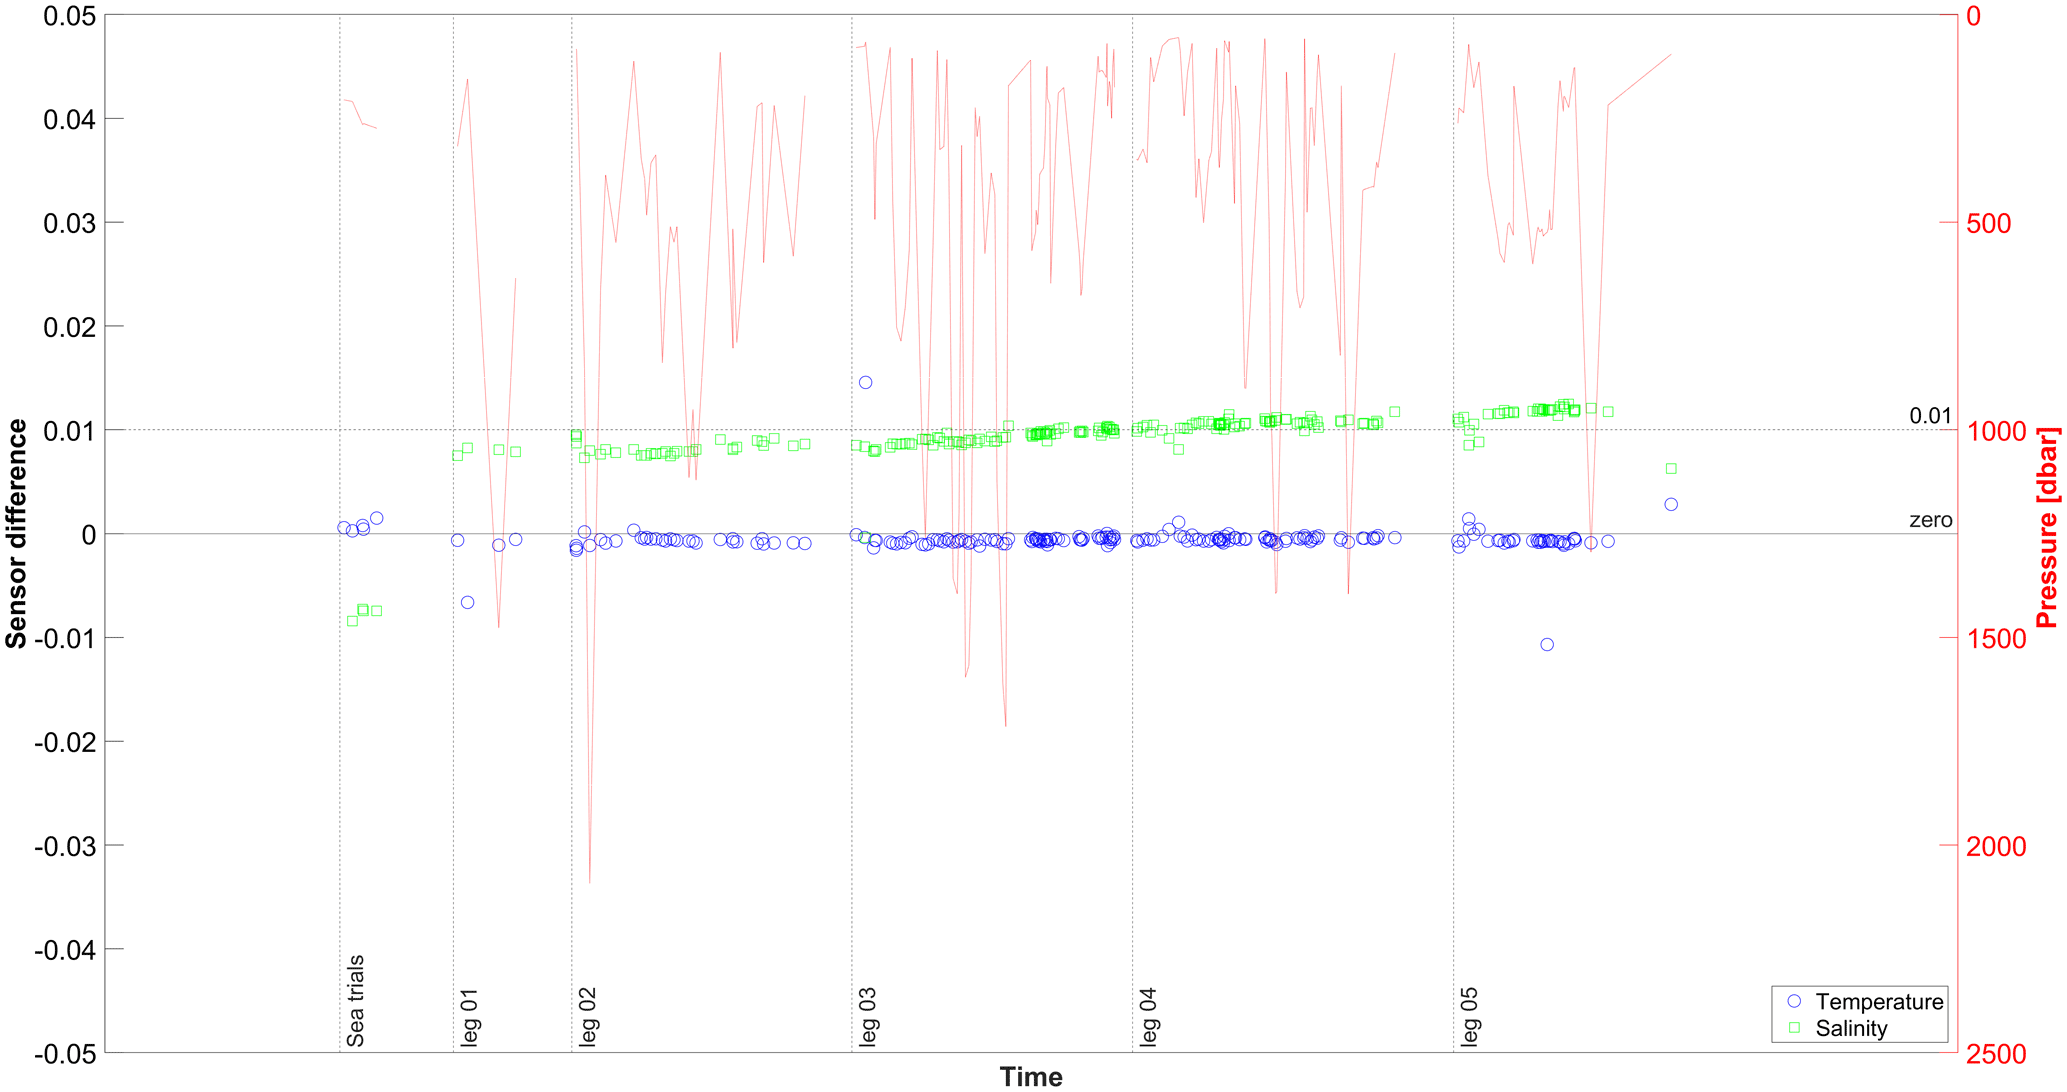
Figure 2CTD anomaly evolution between the dual Sea-Bird conductivity (green) and temperature (blue) sensors along the sea and the five legs. Both salinity and temperature were used to calculate the anomaly. They are extracted from the highest pressure values (red) from each profile (last quarter of the pressure range).
The CTD data are processed using the Seabird data processing software (Sea-Bird Electronics, 2017) and using the recommended processing module sequences. The QAQC procedure is mainly based on the Global Temperature and Salinity Profile Program (GTSPP) quality control tests (Intergovernmental Oceanographic Commission, 2010). Additional tests, including pump status checking, downcast versus upcast comparison and dual sensor comparison (temperature and salinity), are applied as well. Moreover, the main sensors, such as temperature, conductivity and dissolved oxygen, are factory post-calibrated to detect potential issues.
The conservative temperature and absolute salinity presented in this paper are calculated using the Gibbs SeaWater (GSW) Oceanographic Toolbox (McDougall and Barker, 2011), based on the thermodynamic equation of seawater 2010 (TEOS-10) (IOC et al., 2010).
2.2 Moving Vessel Profiler ®
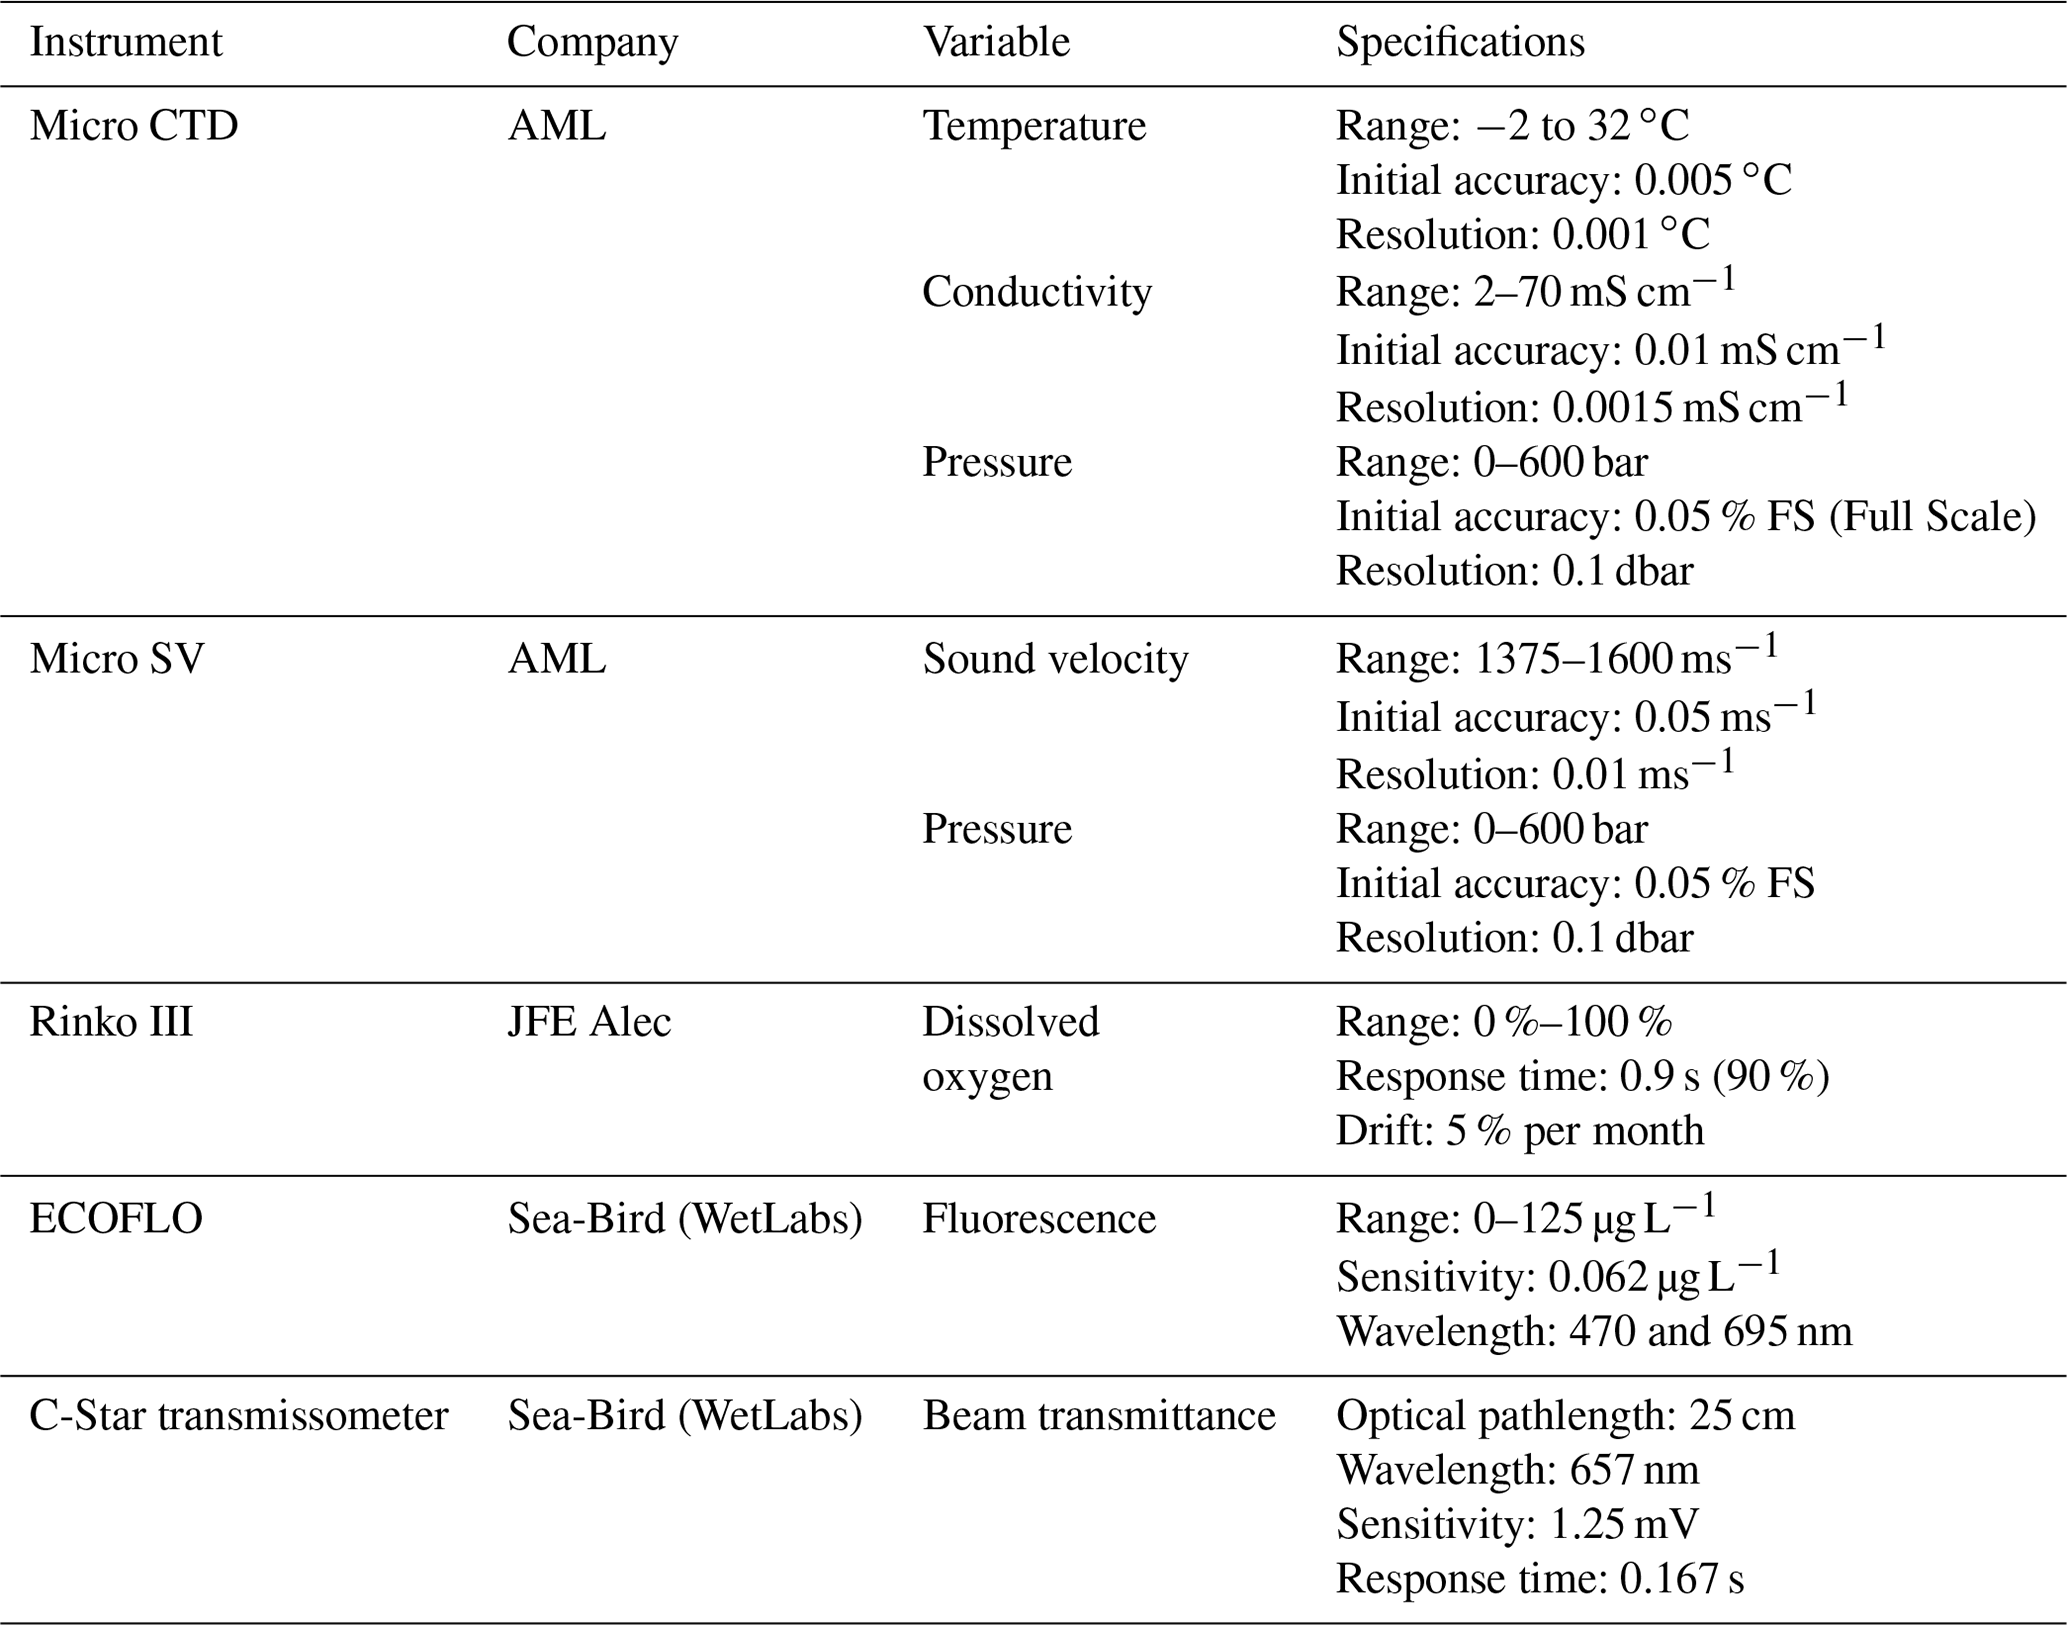
The AML Oceanographic Moving Vessel Profiler® (MVP300) is part of the central pool of instruments operated by Amundsen Science on the CCGS Amundsen. With its capability of supporting both shallow and deep-water datasets collection, the MVP's primary function is to allow accurate data collection of all the water column without the need to stop the vessel. The system includes a computer-controlled smart winch and deployment system that allows continuous up and down casts of the free fall fish. The fish is equipped with seven sensors to record oceanographic data along a transect of vertical dives of the fish. The installed probes include temperature, conductivity, pressure, sound velocity, dissolved oxygen, fluorescence and transmittance sensors. Technical specifications related to the sensors mounted on the MVP are presented in Table 2.
Table 2Instrumentation and specifications of the MVP during the 2021 expedition.
MVP data processing is conducted using a MATLAB® in-house processing script developed by Amundsen Science. Processing steps are sequentially applied on each cast of a given MVP transect and include the conversion of analog inputs into digital inputs, the flagging of out of range and spiking values and the average over 1 m depth.
Derived parameters are also calculated (salinity, sound velocity, etc.) and a manual data check is conducted to ensure the quality of the data. The final processed data are saved in text-based format. More details are available in the MVP processing report (Amundsen Science, 2021b).
2.3 Underway systems
2.3.1 Thermosalinograph
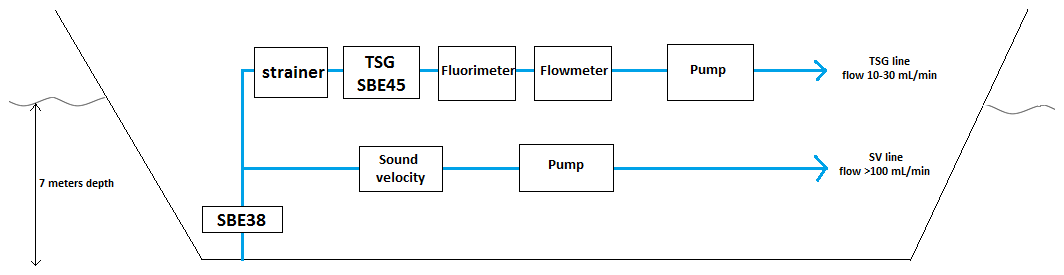
The CCGS Amundsen is equipped with a continuous underway seawater sampling system including a Thermosalinograph (TSG) for temperature and conductivity measurements coupled with a fluorometer, a sound velocity sensor and an additional temperature sensor. A 20 mesh size strainer is placed at the beginning of the line to filter the surface seawater, which circulates under the ship to reach the TSG installation under the vessel's deck before entering the water line. Technical specifications related to the sensors included on the TSG are presented in Table 3. Geolocations (latitude and longitude), dates and times of the recording are presented alongside the practical salinity. Other variables related to the ship (vessel speed (in knots) and water flow rate (in liters per minute)) are presented in the dataset as well.
The configuration of the TSG is shown in Appendix C. Data processing is conducted using the MATLAB® in house processing script (available in Sect. 5) and requires the use of navigation data, atmospheric data and seawater surface salinity samples from the TSG (analyzed with a Guildline salinometer) and CTD Rosette data for intercomparison and correction. Processing steps including out-of-range values flagging, averaging data over 1 min, intercomparison and correction with collocated data were carried out. The final processed data are saved in text-based format. More details are available in the TSG processing report published with the dataset (Amundsen Science, 2021d).
Table 3Instrumentation and specifications of the thermosalinograph during the 2021 expedition (Amundsen Science, 2021d).
Data quality assessment for the practical salinity is shown in Fig. 3. The uncertainty value is roughly equal to 0.01 PSU (Practical Salinity Unit) while the bias stays constant when compared with the result from the CTD Rosette. To be consistent with the datasets in the present paper, the absolute salinity is presented instead of the practical salinity. The absolute salinity was calculated using the new thermodynamic equation of seawater (TEOS-10) (IOC et al., 2010) within the Gibbs Seawater (GSW) toolbox by McDougall and Barker (2011).
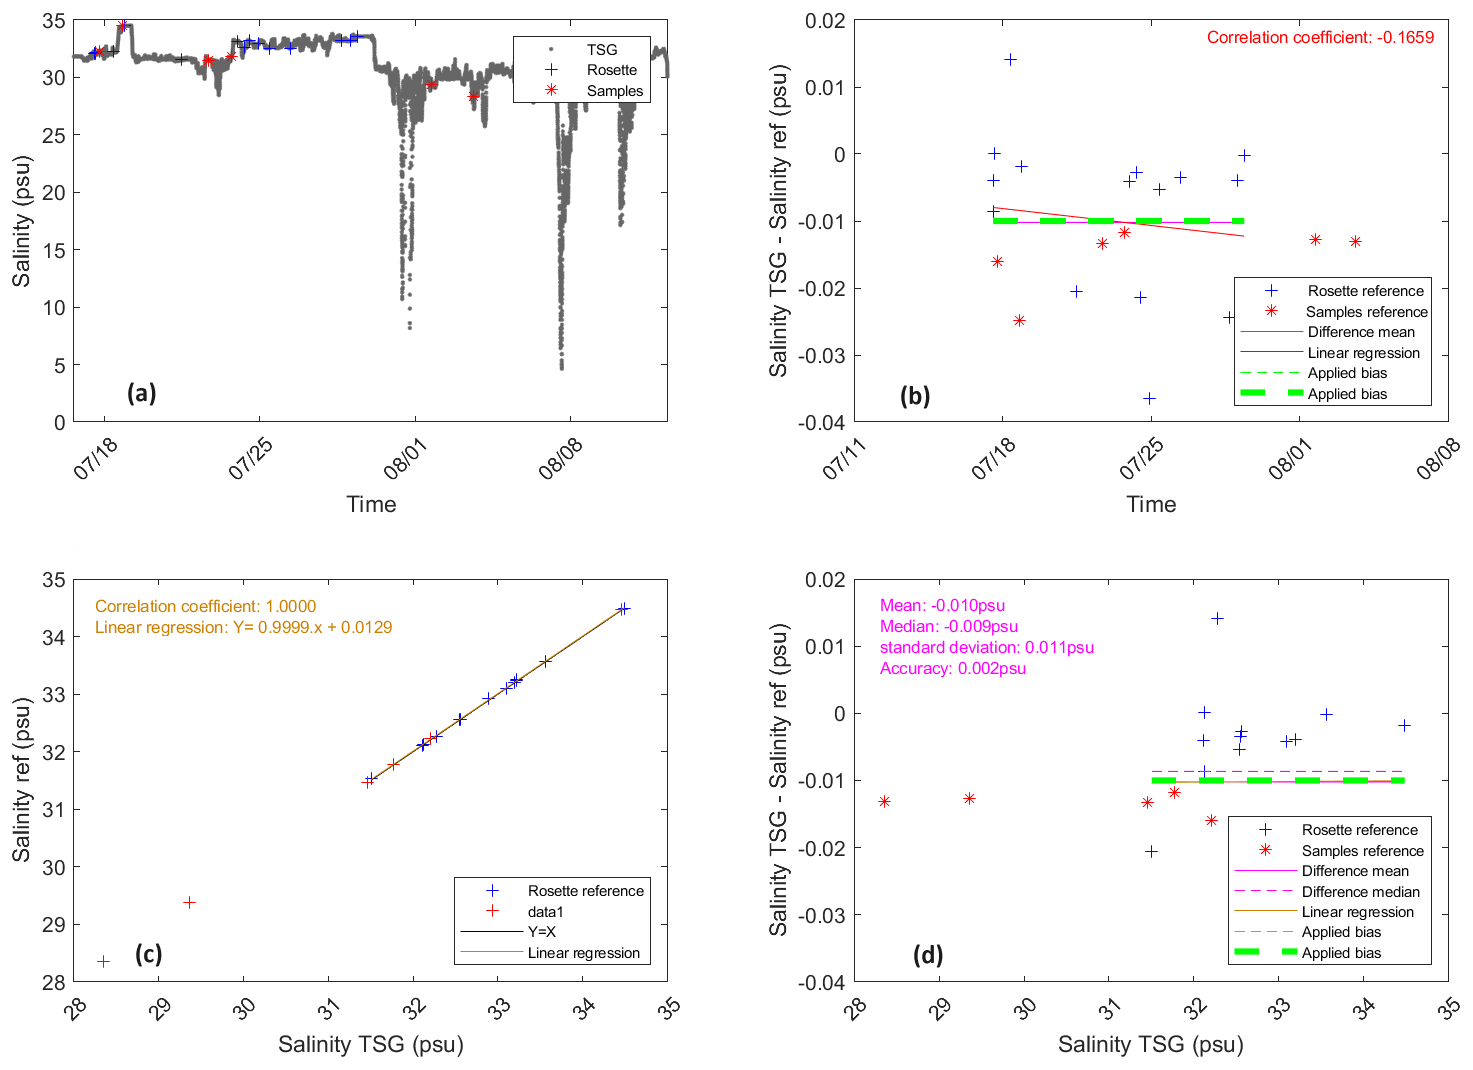
Figure 3Practical salinity quality assessment (Amundsen Science, 2021d).
2.3.2 Atmospheric data
The CCGS Amundsen is part of the worldwide Voluntary Observing Ship (VOS) scheme, led by the World Meteorological Organization (WMO). As part of this program, an Automated Voluntary Observing Ship (AVOS) system is installed by Environment and Climate Change Canada (ECCC) on the ship to record continuous data on atmospheric pressure, wind speed, wind direction, air temperature and humidity. Amundsen Science retrieves and processes the available AVOS data and adds them to the available pool of data. Data processing is conducted using a MATLAB® in-house processing script (available in Sect. 5) and includes flagging out-of-range values, environmental corrections (wind speed, vessel pitch and roll, shadow, etc.), averaging data over 2 min and manual checks.
Processed data are saved in text-based format (one file for each leg). More details are provided in the AVOS processing report (Amundsen Science, 2021a).
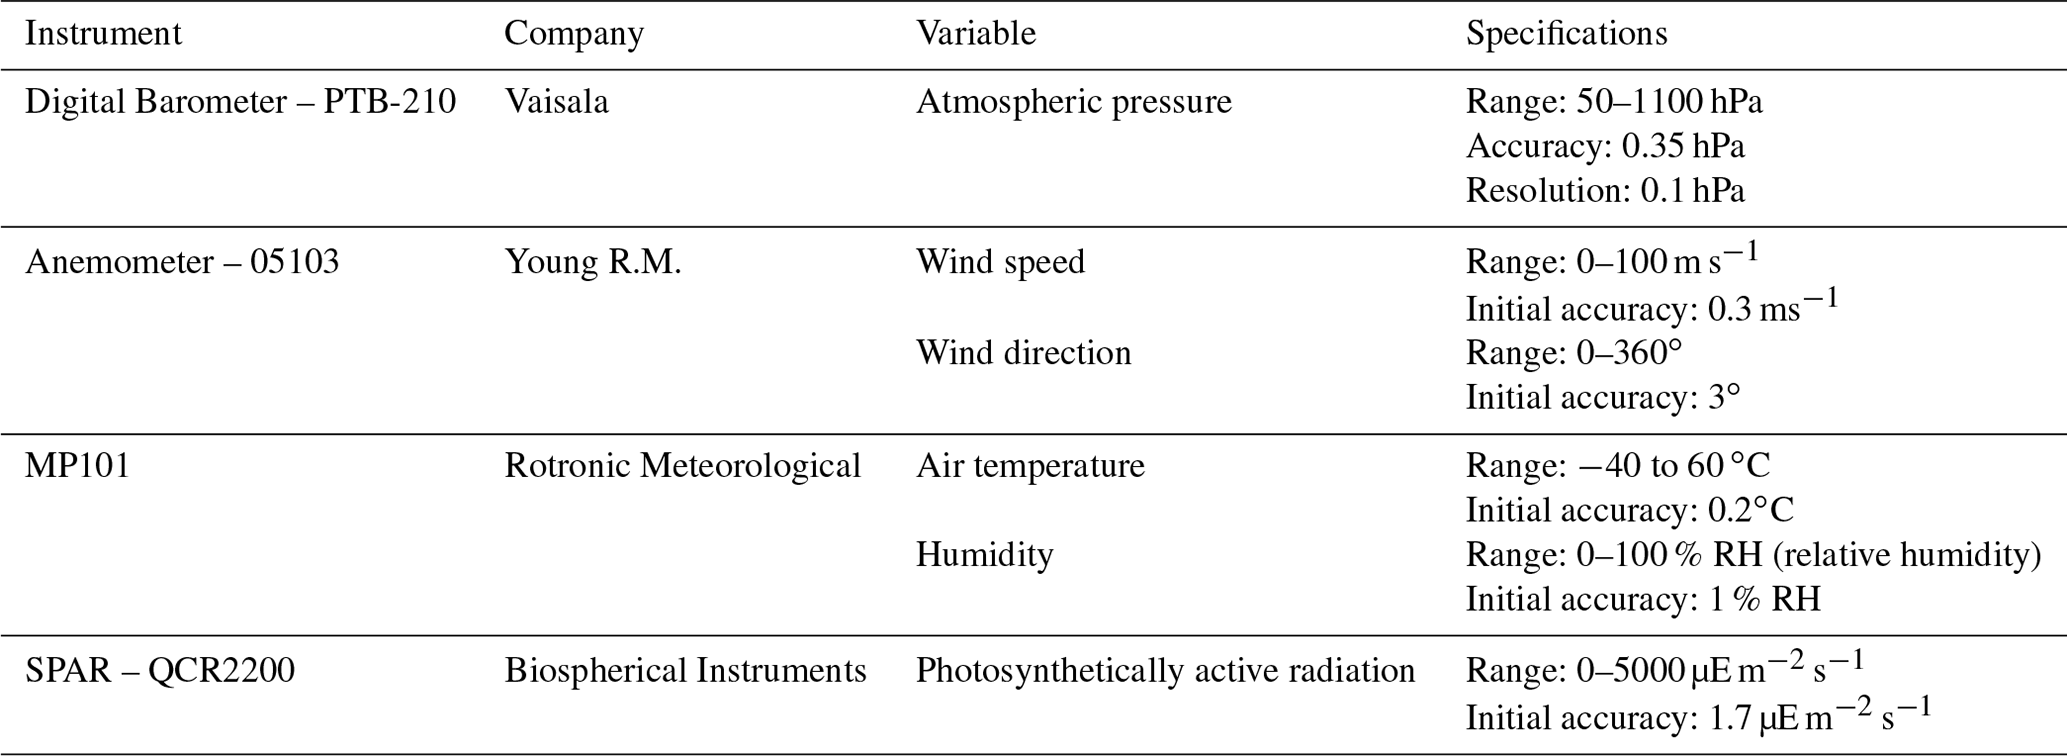
Table 4Instruments and specifications of the AVOS underway system.
2.3.3 Seabed data acquisition instruments
During the 2021 mission, the CCGS Amundsen was equipped with a Kongsberg® multibeam echo sounder (EM 302) and a Knudsen 3260 sub-bottom profiler to acquire dedicated and underway seabed data. The seabed data acquisition systems opportunistically operate throughout the entirety of each scientific expedition. Seabed mapping relies on analyzing acoustic pulses propagated and received by echo sounders to generate georeferenced models of the seabed. The bathymetry consists of three-dimensional topographic point clouds of the seafloor, whereas sub-bottom consists of vertical profiles of strata layers below the seafloor. Arctic seabed mapping supports a wide range of research (habitat mapping, geology, paleoclimatology, glacial history, archeology, geohazards, geopolitics and more) and provides ships with needed information to navigate safely.
The CCGS Amundsen's EM 302, upgraded to the Kongsberg® EM 304 MKI in summer 2022, is a 30 kHz system capable of acquiring data in 10–8000 m water depth. The multibeam echo sounder integrates the global navigation satellite system and inertial measurement unit data from the Applanix POSMV V4 to georeference generated soundings. The Kongsberg Seafloor Information System (SIS) acquisition software retrieves acquired EM 302 data from the system's processing unit and optimizes data quality using various parameters and tools applied by onboard technicians. The processing of the multibeam raw data includes integration of sound velocity profiles derived from each CTD Rosette profile to the multibeam during acquisition. Onboard operators integrate real-time sound velocity measurements at the transducer face and conduct quality assurance of each cast. If CTD Rosette casts are sparse and require long transits between deployments, synthetic sound velocity profiles are applied using the 2009 and 2013 World Ocean Atlas models (WOA09 and WOA13). Then, raw EM 302 data are imported to CARIS HIPS and SIPS®, where data are georeferenced to absolute positions, depths are converted to reference the mean sea level (MSL) datum using the WebTide Tidal Solution Model® and total propagated uncertainty is calculated. Operators revise data in the HIPS and SIPS® 2D and 3D Subeditor tool and manually reject erroneous data points from the dataset. Finally, cleaned bathymetry data are exported to raster surfaces, cataloged and distributed.
Processed data are saved in raster format and publicly available through a multitude of sources indicated on Amundsen Science's website (Amundsen Science, 2023).
3.1 CTD Rosette
During the 2021 expedition, Amundsen Science deployed the CTD Rosette on 266 occasions, producing 4, 35, 83, 103 and 41 casts, respectively, during legs 1–5 spanning the Canadian and Greenlandic Arctic, from the coast of Labrador to Beaufort Sea (Fig. 1). Historical CTD transects were visited during the 2021 expedition and three were selected to present an overview of the CTD data collected during this expedition in Davis Strait, northern Baffin Bay (NOW) and Cape Bathurst. These transects are called historical, as they were visited multiple times since 2003 by the CCGS Amundsen. (Note that the Davis Strait transect has only been visited since 2018 but is intended to be visited yearly from now on.) For each transect, spatially and vertically interpolated values of conservative temperature (CT), dissolved oxygen (DO) and absolute salinity (AS) are presented. The seafloor data represented in the following figures are retrieved from echo sounder depth data along the ship track. Temperature-Salinity (T-S) diagrams compiling all the profiles from the transect are also presented for each transect in order to describe water mass of the area.
3.1.1 Davis Strait
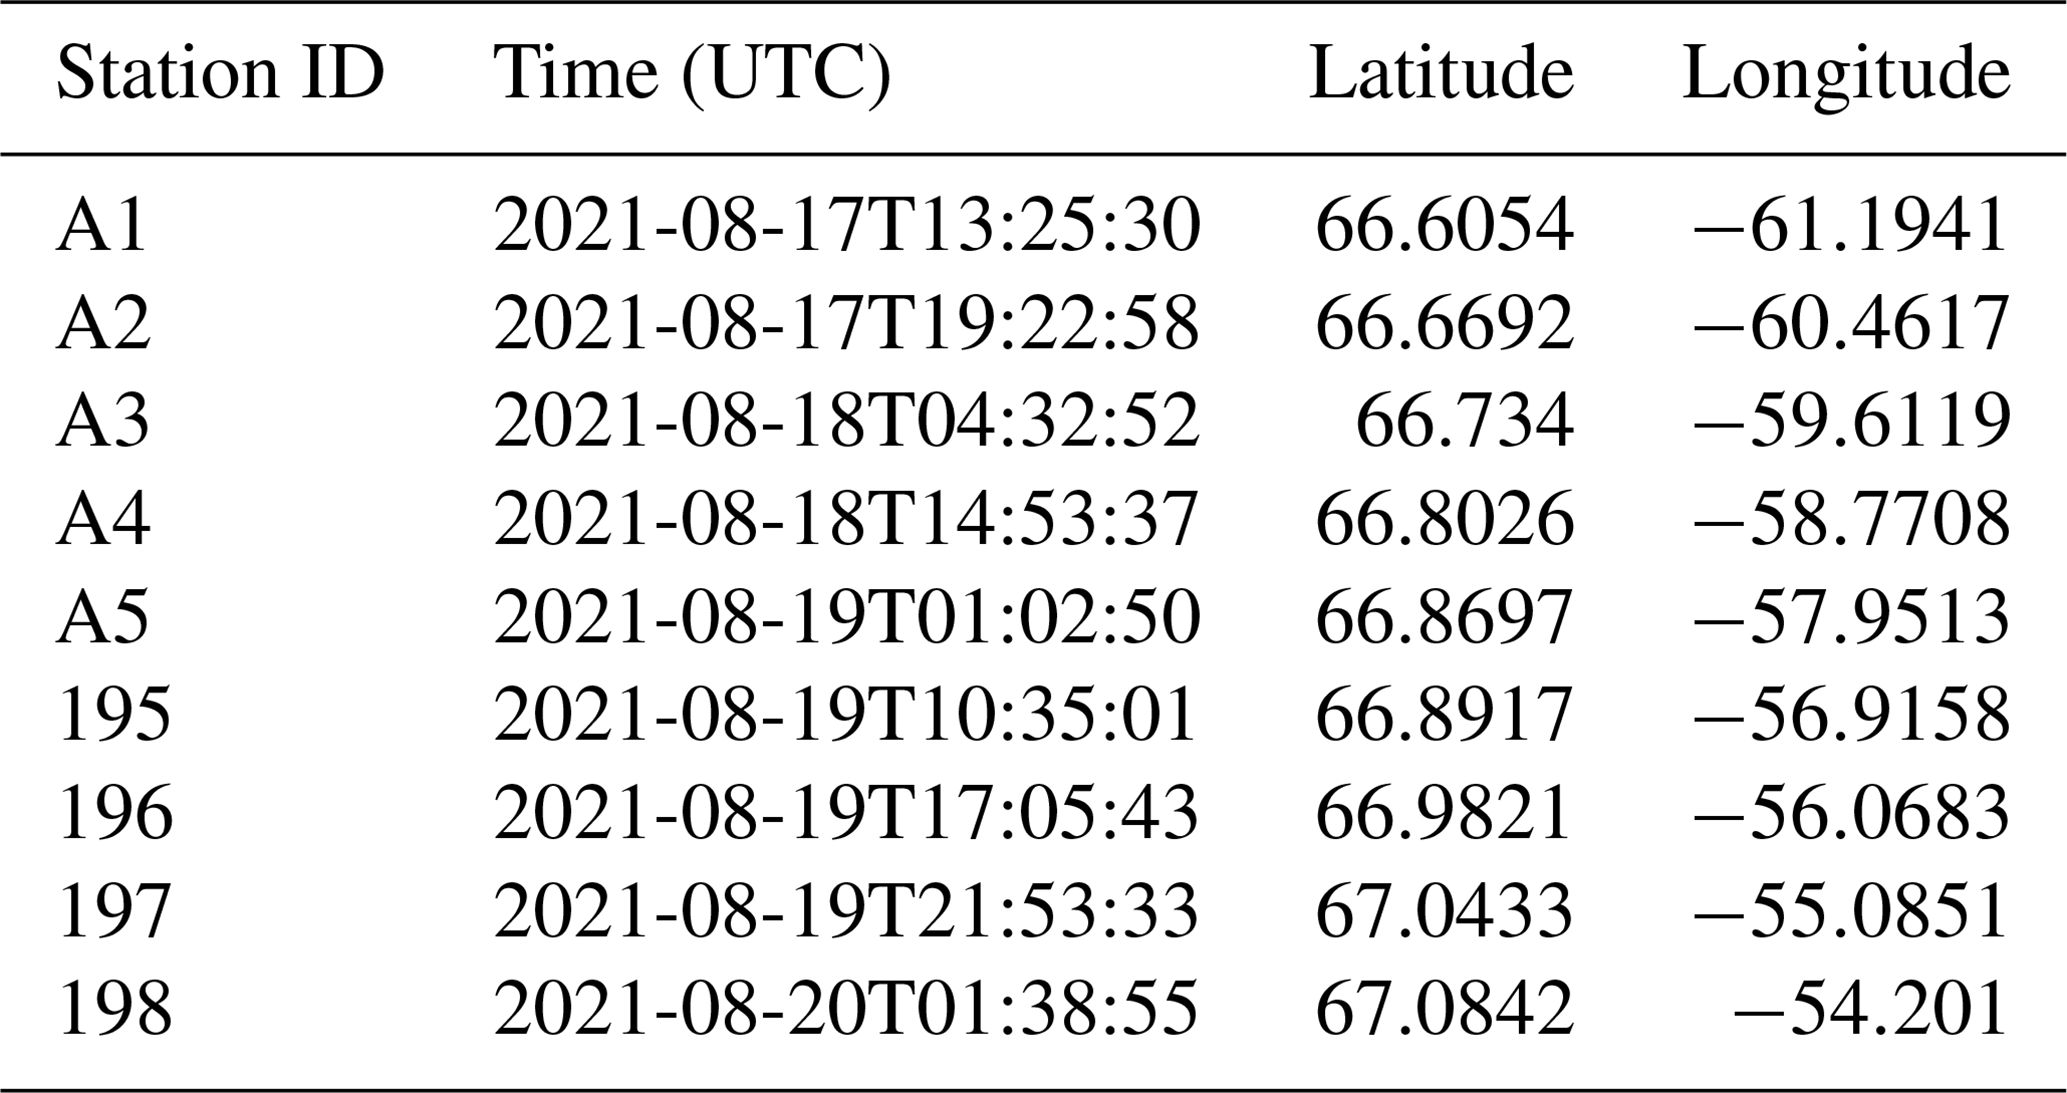
Nine stations were sampled along the Davis Strait between 17 and 20 August 2021 (see Table A1). A clear distinction between water properties of the eastern and western part of Davis Strait was observed (Fig. 4). The Davis Strait water masses have been extensively described (Tang et al., 2004; Curry et al., 2011; Lehmann et al., 2019; Punshon et al., 2014) and the four main water masses of the region were observed (Fig. 5) during the sampling from the CCGS Amundsen. The West Greenland Slope Current (WGSC) water mass is characterized by discontinued layers of the highest salinity (up to 34.5 g kg−1), warm temperature (2.4 ∘C) and relatively poor DO concentration (250–300 µM). This water mass is present along the Greenland slope between 100 and 700 dbar. The water mass present over the Greenland shelf is characterized by the highest temperatures recorded along the transect (up to 6.5 ∘C), relative richness in oxygen (300–340 µM) and fresher waters (up to 34.1 g kg−1). Over the western side of the strait, Baffin Island Current (BIC) water mass can be observed in the top 200 dbar. This water mass is characterized by the lowest salinity recorded (30–33.7 g kg−1) in this transect and the highest DO concentration (420 µM) in the surface layers, which extend over the Greenland slope. The coldest temperature is also observed in the BIC (−1.5 ∘C), between 50–200 dbar. Finally, the Atlantic-derived waters of the western part of Davis Strait are characterized by relatively warm (0–2 ∘C), oxygen depleted (<280 µM) and relatively salty (>33.7 g kg−1) waters below 300 dbar (Fig. 4b, c and d). The distinction between the different water masses observed in Fig. 5 has been made according to Tang et al. (2004) and Curry et al. (2011).
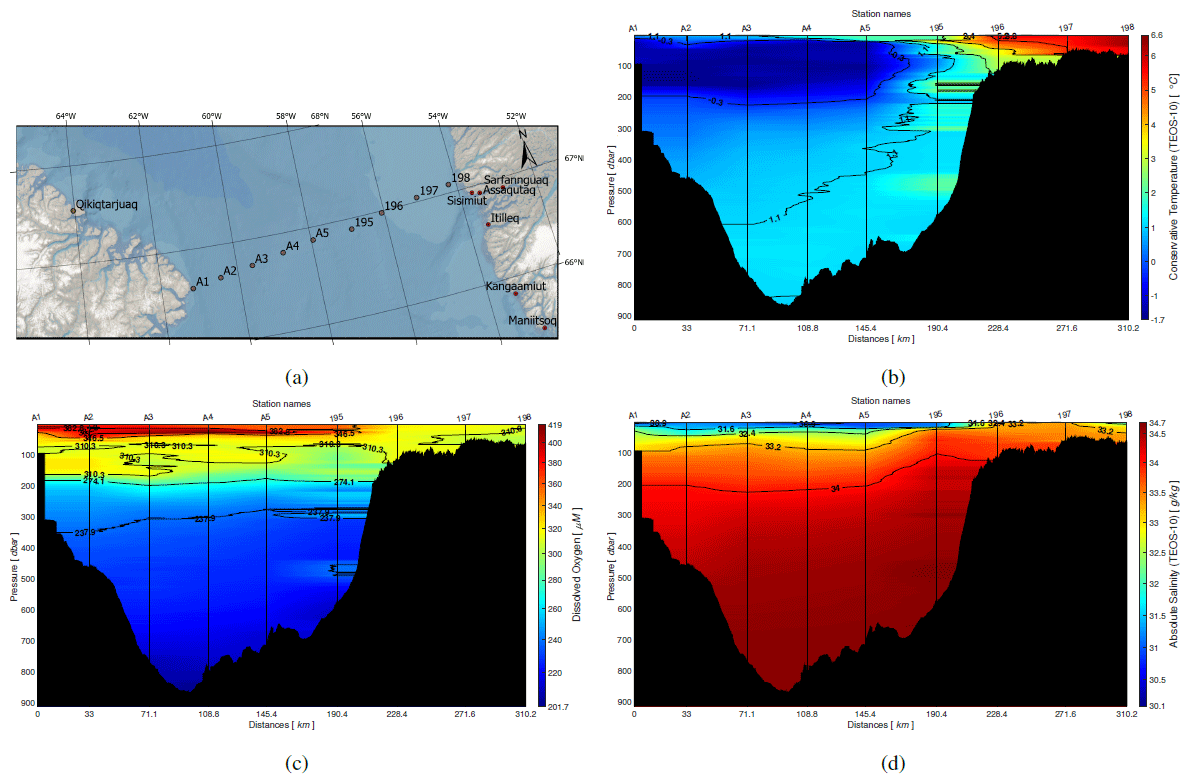
Figure 4Davis Strait transect profiles during leg 3 of the 2021 expedition. Isolines represent the variable presented in each panel. Panel (a) shows the position of stations along the Davis Strait transect, (b) conservative temperature (∘C), (c) dissolved oxygen (µM) and (d) absolute salinity (g kg−1)
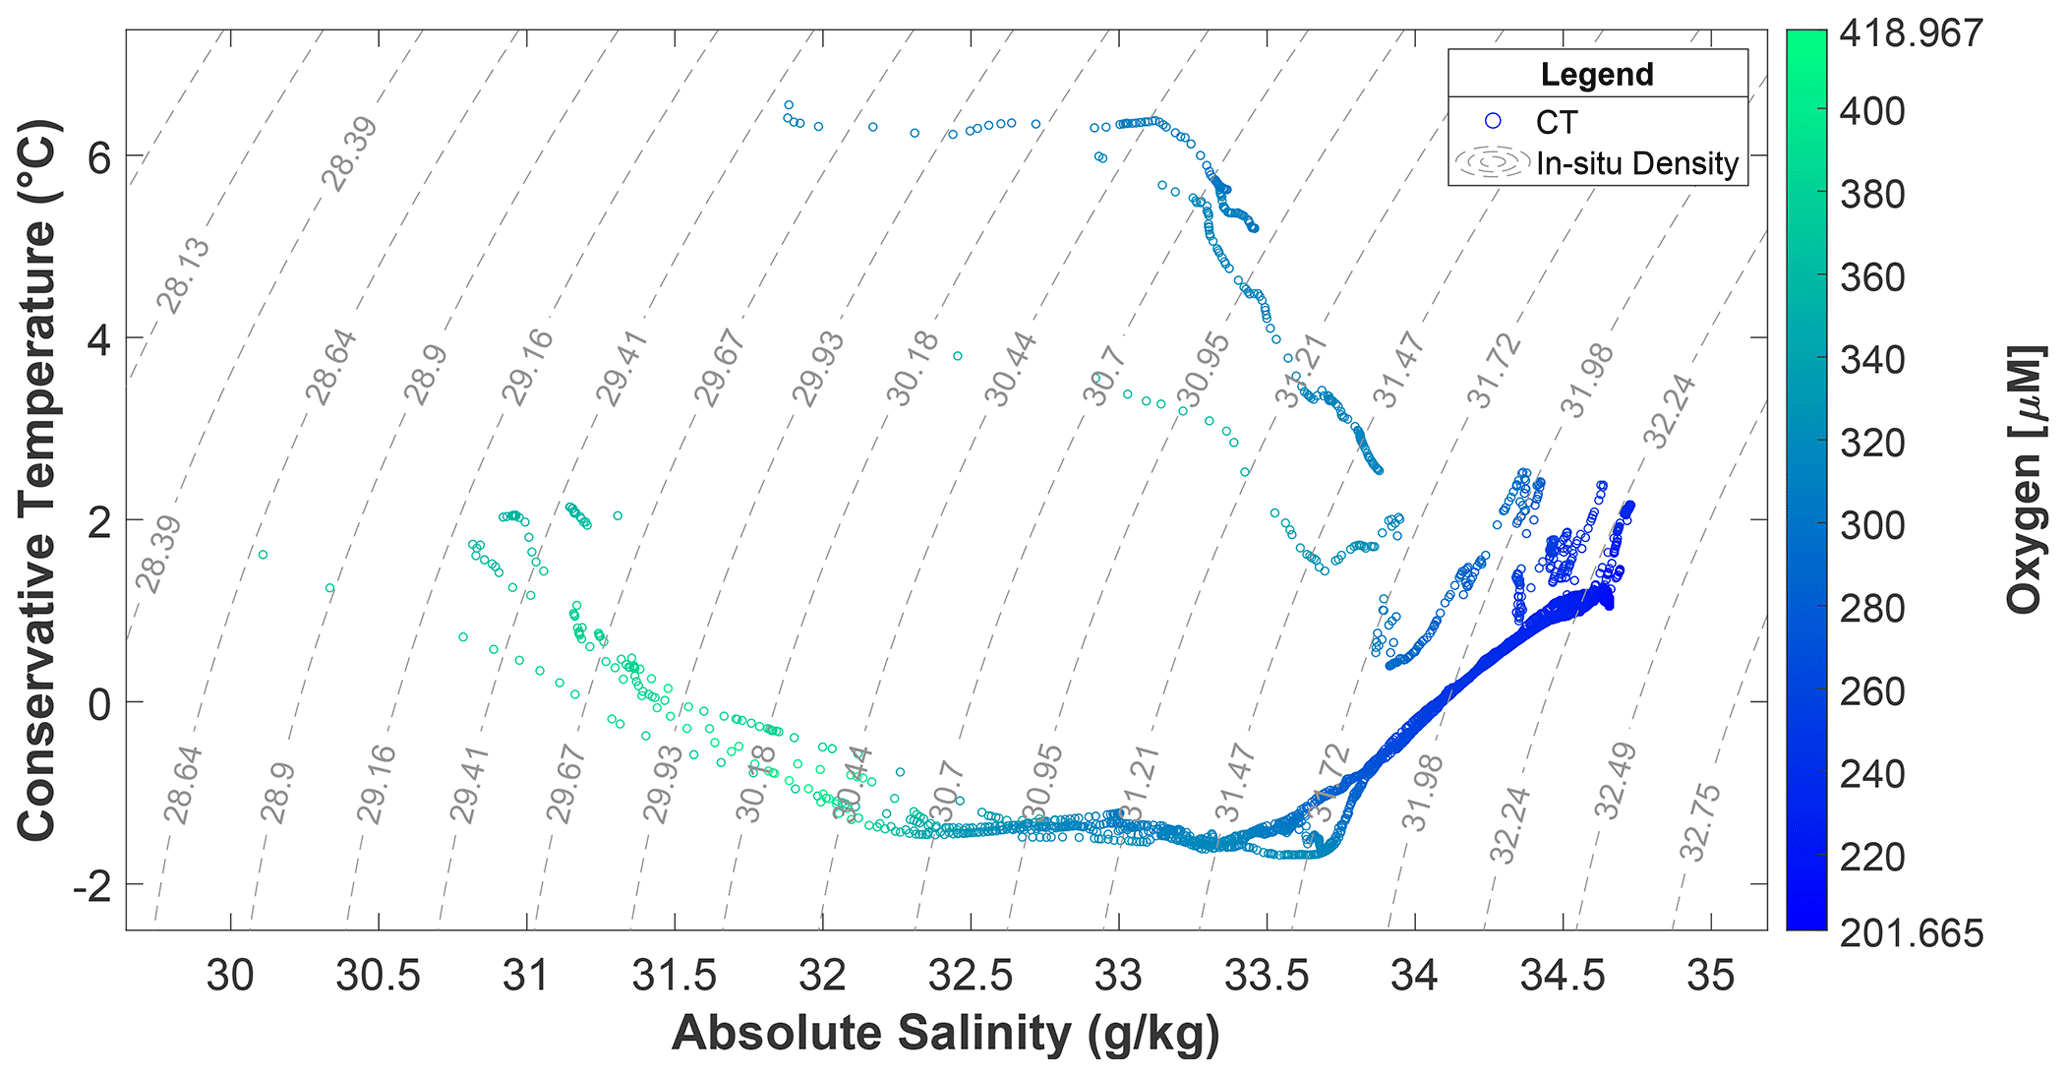
Figure 5TS diagram represented by absolute salinity (AS) and conservative temperature (CT). The isolines are the in situ density calculated with AS and CT.
3.1.2 North Water Polynya
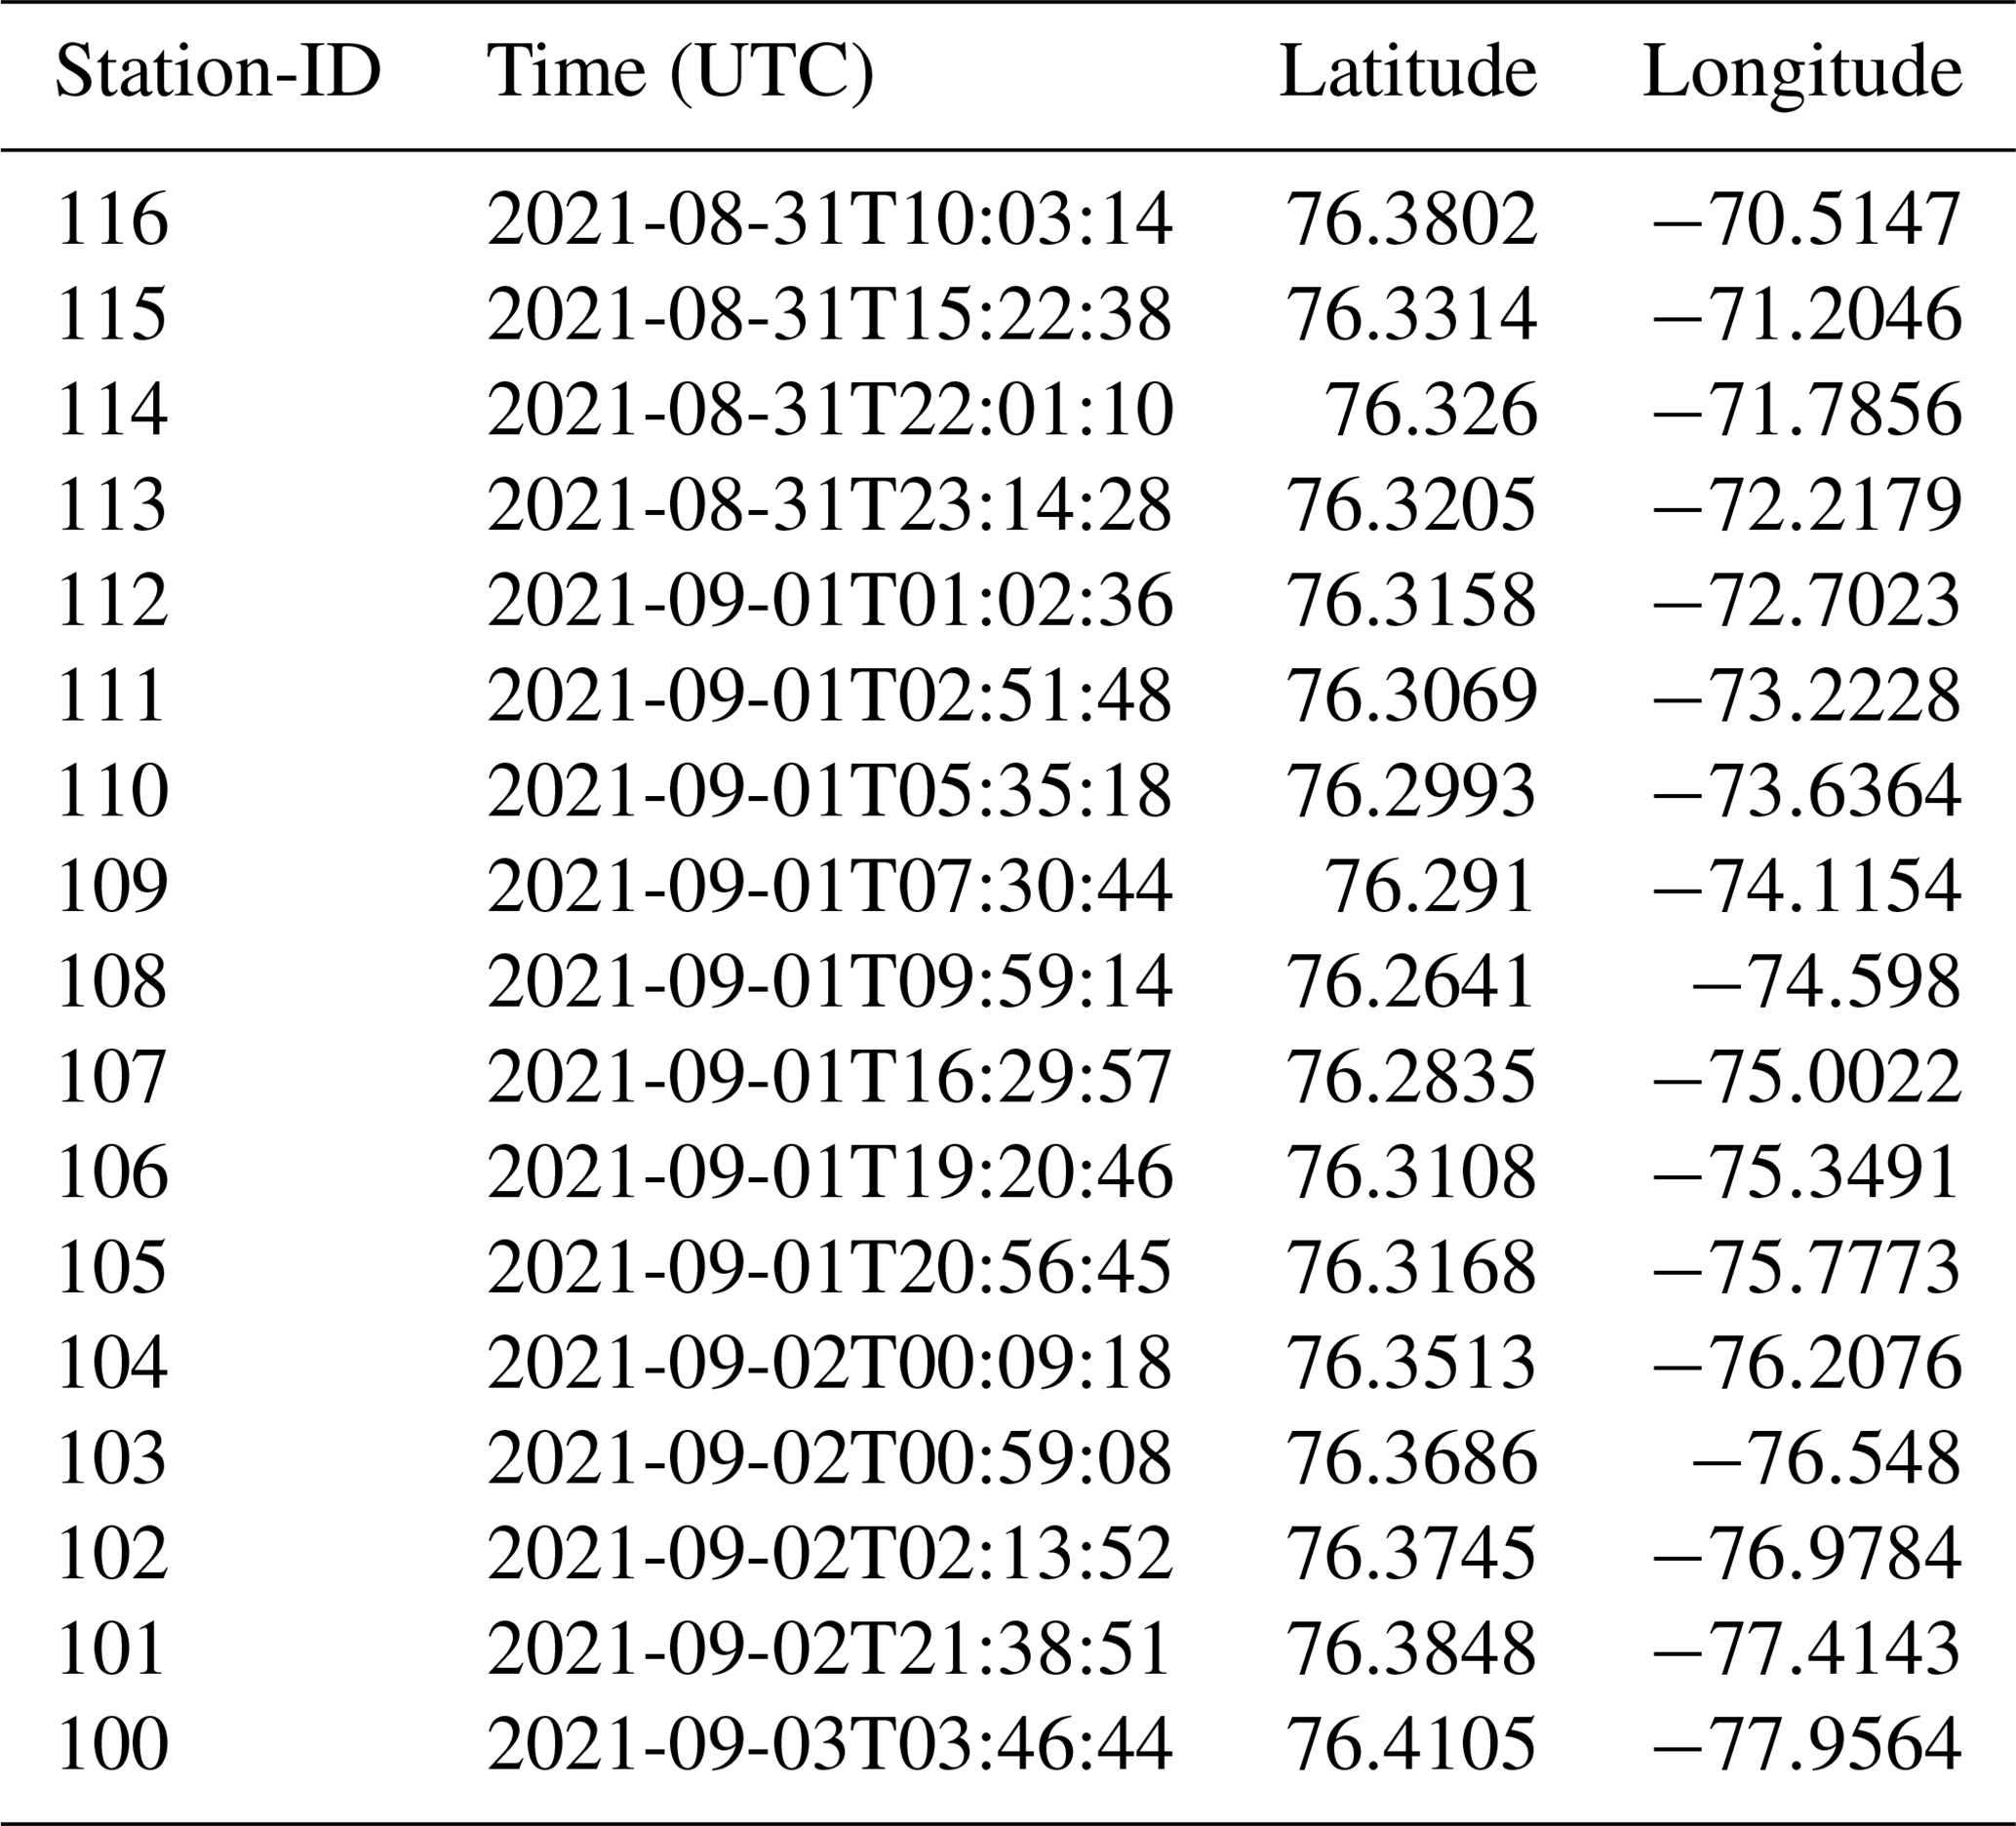
Seventeen stations were sampled along the North Water Polynya (NOW) transect between 31 August and 3 September (see Table A2). Figure 6a–d show the positions of the different CTD Rosette casts, interpolated values of conservative temperature (CT), dissolved oxygen (DO) and absolute salinity (AS), respectively, through the water column at each station along the NOW transect. As stated by Bâcle et al. (2002); Lobb et al. (2003), the West Greenland Current (WGS) brings the warm and salty Atlantic waters in the region between 200 and 400 dbar. This water mass can be observed in Fig. 6 by two distinctive cells between stations 107 and 111 and between stations 111 and 116, where the maximum value of AS (34.5 g kg−1) and lowest value of DO concentration (<250 µM) of the transect are located. A relatively warm temperature of 1 ∘C also defines the water mass. This water mass is trapped under a cold halocline observed between 50 and 150 dbar (Bâcle et al., 2002; Lobb et al., 2003). Based on Fig. 6d, this layer is characterized by absolute salinity values ranging from 33 to 33.8 g kg−1, temperature colder than 0.7 ∘C and waters relatively rich in DO, ranging from 295 to 340 µM. A warm, fresh and DO-rich (max 400 µM) polar mixed layer (PML) is observed from surface at roughly 75 dbar along the transect. Between stations 101 and 107 a colder and fresher surface layer is observed over the ridge (Fig. 6d). A thin DO-rich layer can be observed within the PML around 30 dbar and is extended up to 100 dbar over the ridge (stations 101–105). This water mostly comes from the north by Smith Sound and from the west by Jones Sound and has been warmed during summer (Bâcle et al., 2002; Lobb et al., 2003).
All CTD casts of the NOW transect are plotted in the TS diagram (Fig. 7). Along the transect, two water masses are defined by two sets of conservative temperature (on the left side of the figure). They correspond to density values less than 29.47 kg m−3. Mixture of waters is observable in the layer with density values between 29.47 and 31.4 kg m−3.
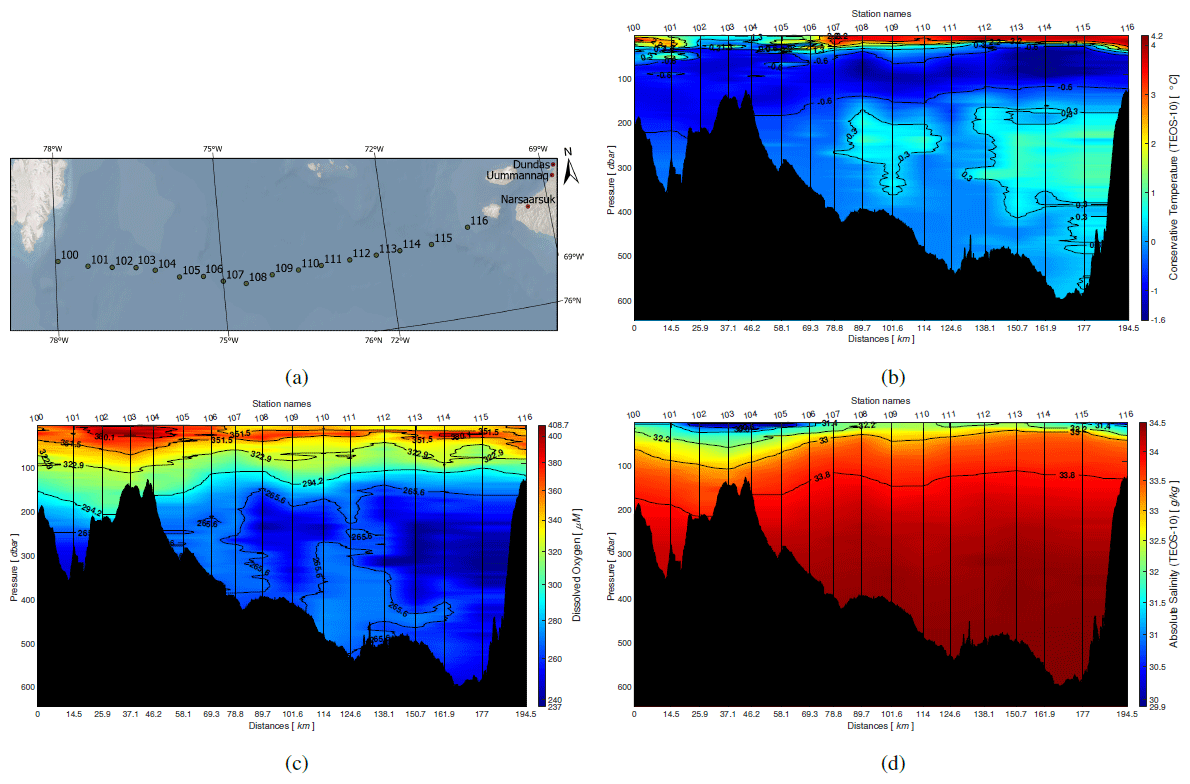
Figure 6NOW transect profiles during leg 3 of the 2021 expedition. Isolines represent the variable presented in each panel. Panel (a) shows the position of stations along the NOW transect, (b) conservative temperature (∘C), (c) dissolved oxygen (µM) and (d) absolute salinity (g kg−1)
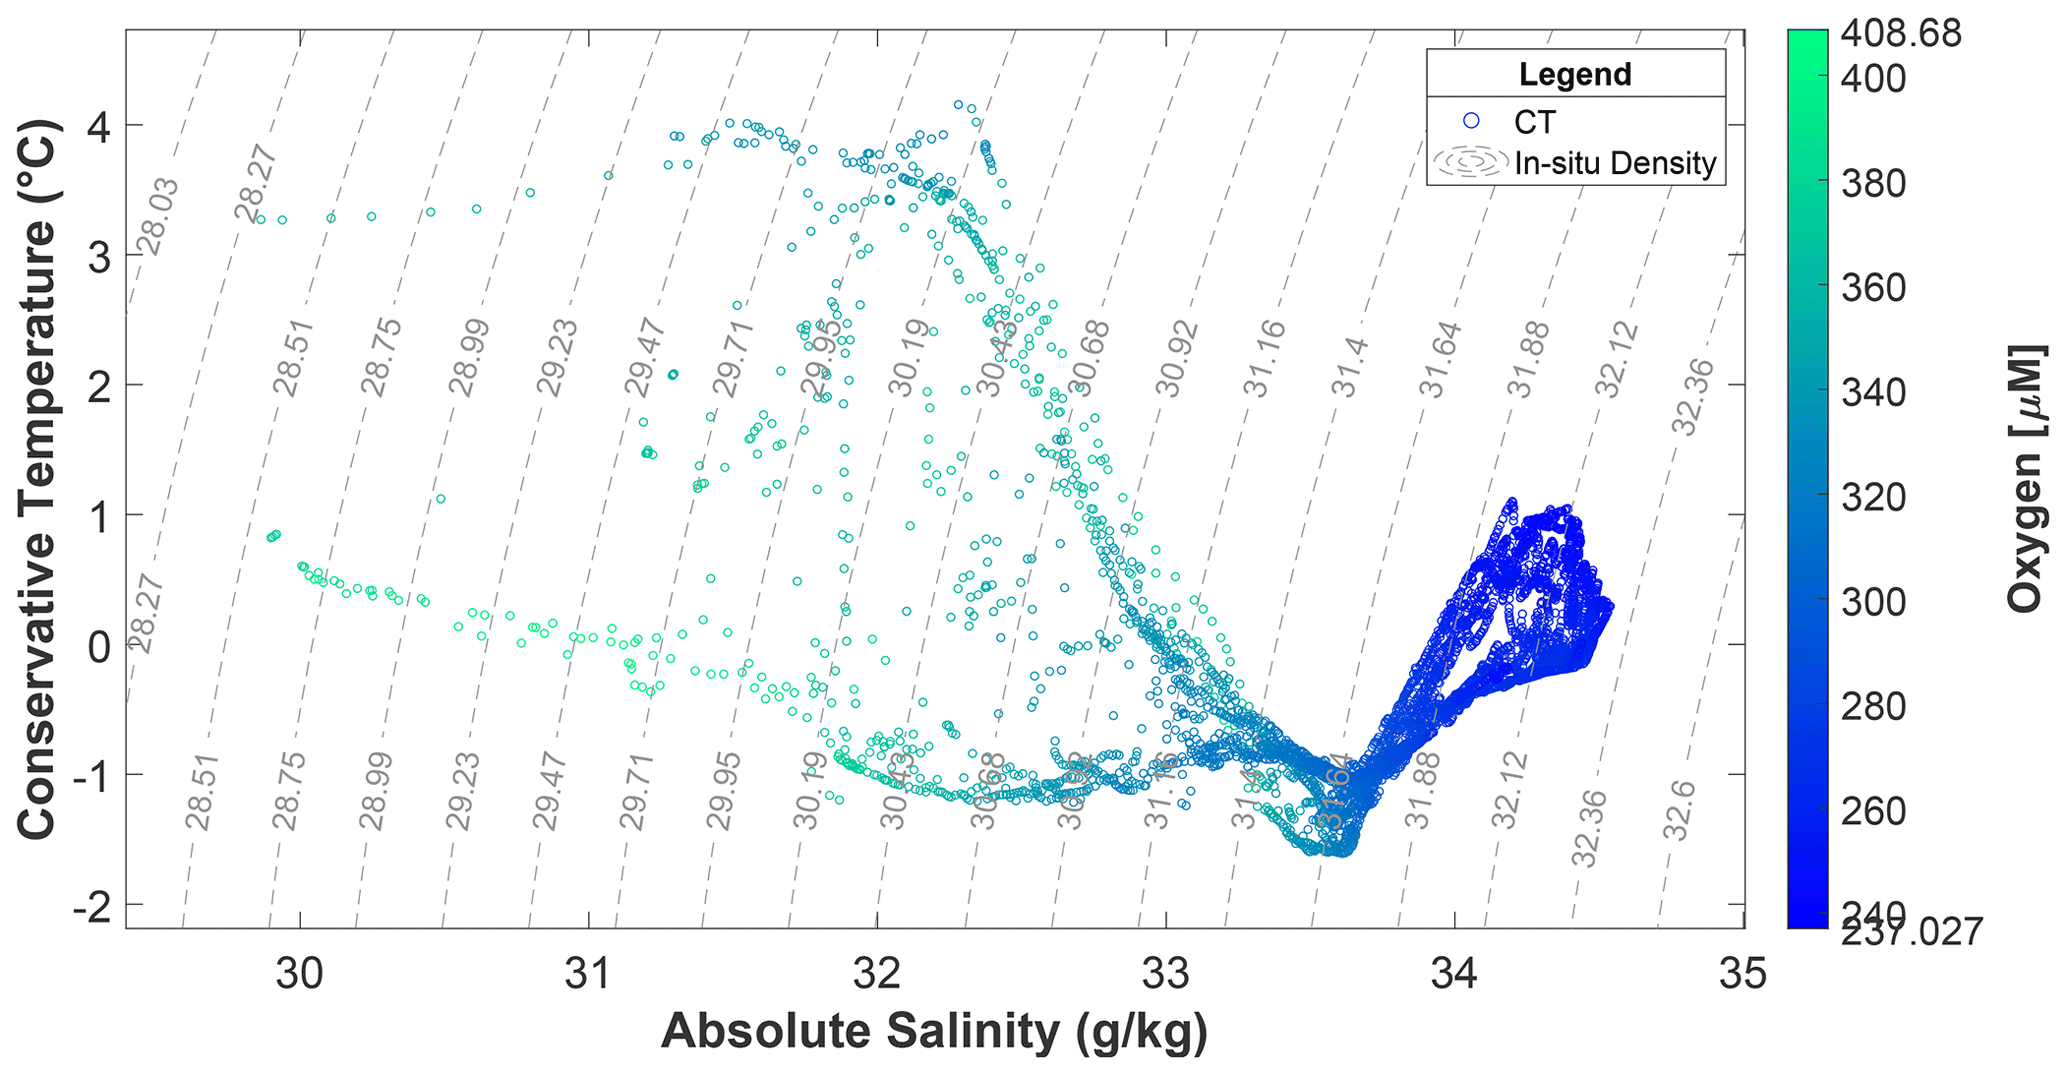
Figure 7NOW TS diagram. The isolines are the in situ density calculated with absolute salinity and conservative temperature.
3.1.3 Cape Bathurst
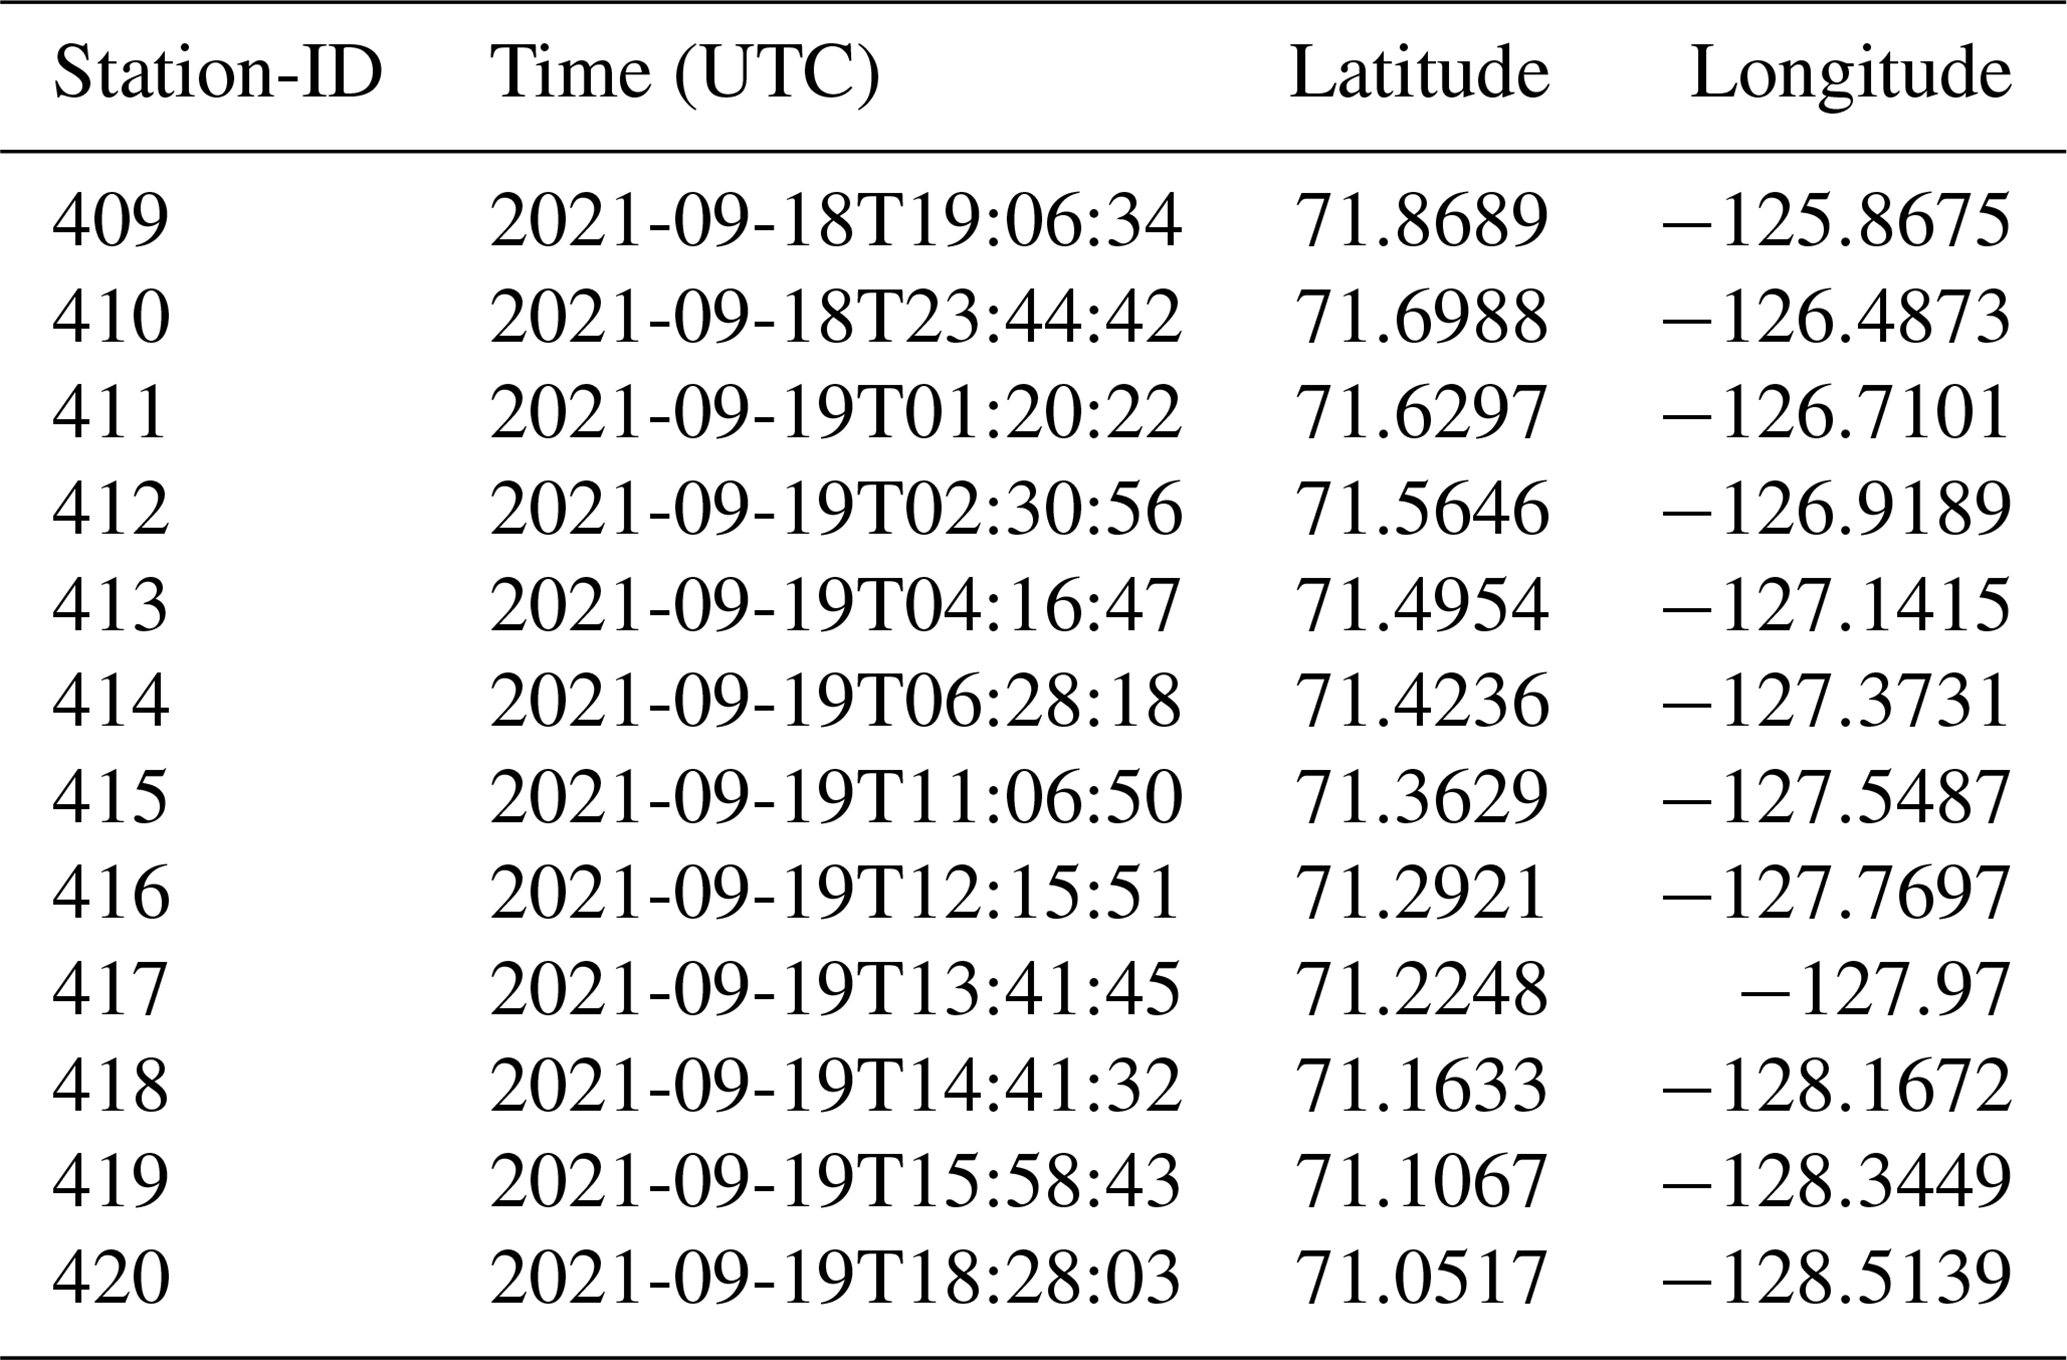
Twelve stations were sampled from Sachs Harbour toward Cape Bathurst on 18 and 19 September (see Table A3). The transect crosses over a major gateway of Arctic water mass exchange. In September 2021, three major water masses can be observed. The polar mixed layer (PML) is observed from surface to 25–50 dbar with a stable low salinity (27–30 g kg−1), while temperature is much more contrasted (ranging from −1 to 3.5 ∘C). The surface layer becomes thinner as we go toward Cap Bathurst from station 409 to station 420. Under the PML lies the halocline waters between 50 and 200 dbar, originating from the Pacific. This water mass shows increasing salinity from 31 to 34 g kg−1 toward the base of the layer. The coldest temperatures are recorded in the halocline layer (−1.5 ∘C) and DO of 270 µM. Finally, the Atlantic water lays below 250 dbar with a salinity around 34 g kg−1, temperature of 0.5 ∘C and a minimum DO concentration of 225 µM. A possible upwelling can be observed at station 411 where there is intrusion of deep high salinity water in the halocline layer. Upwelling already had been observed in the region by Williams and Carmack (2008). Conservative temperature shows a pattern of inversion, as values are higher at the surface at station 409 and at stations 415–420, and at pressures deeper than 150 dbar (Fig. 8). A TS diagram regrouping all casts along the Cape Bathurst transect displays similar profiles than previously discussed by Lansard et al. (2012) and Simpson et al. (2008) in the southeastern Beaufort Sea region (Fig. 9). The Amundsen has sampled in the Cape Bathurst area 12 times since 2003, which produces an extensive dataset that could be used by readers to assess interannual variability and trend in the region. Massicotte et al. (2021) have compiled and standardized the collected datasets from the 2009 MALINA expedition in the Beaufort Sea in order to facilitate their reuses. Such a dataset can be compared to the ones collected by the Amundsen during the 2021 expedition.
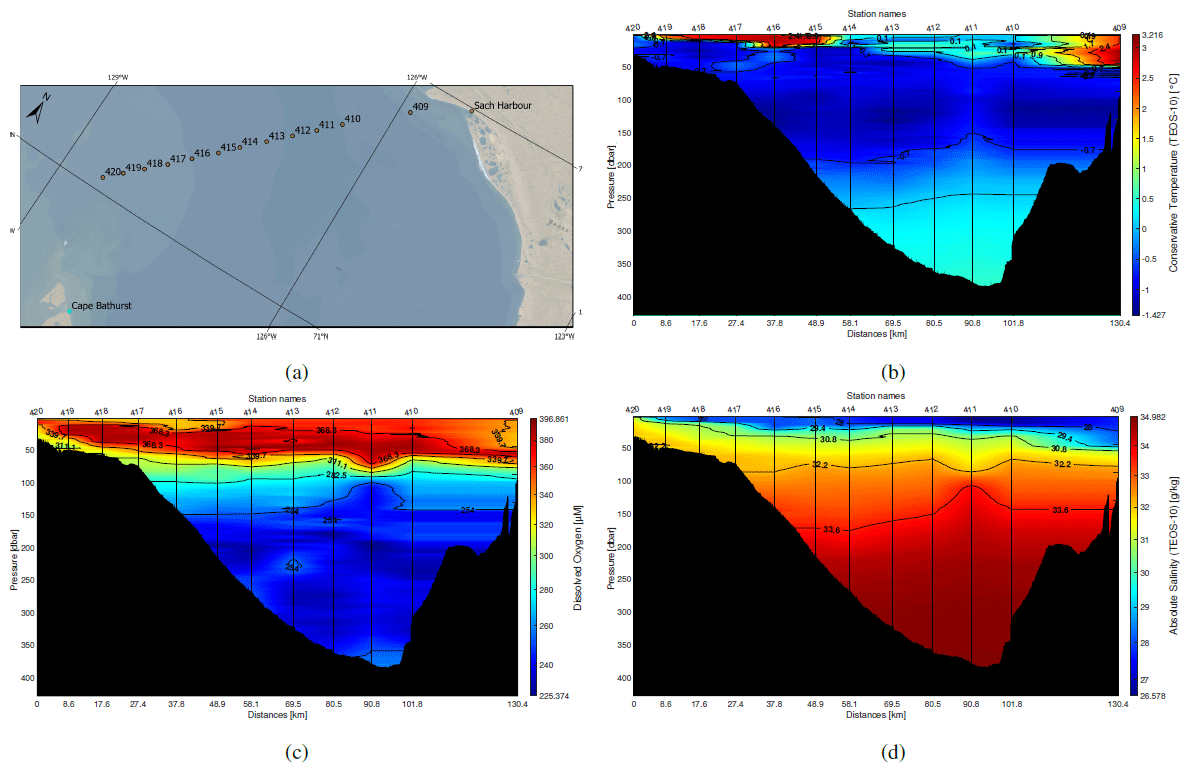
Figure 8Cape Bathurst transect profiles during leg 4 of the 2021 expedition. Isolines represent the variable presented in each panel. The northeastern side of the transect is located on the left. Panel (a) shows the position of stations along the Cape Bathurst transect, (b) conservative temperature (∘C), (c) dissolved oxygen (µM) and (d) absolute salinity (g kg−1).
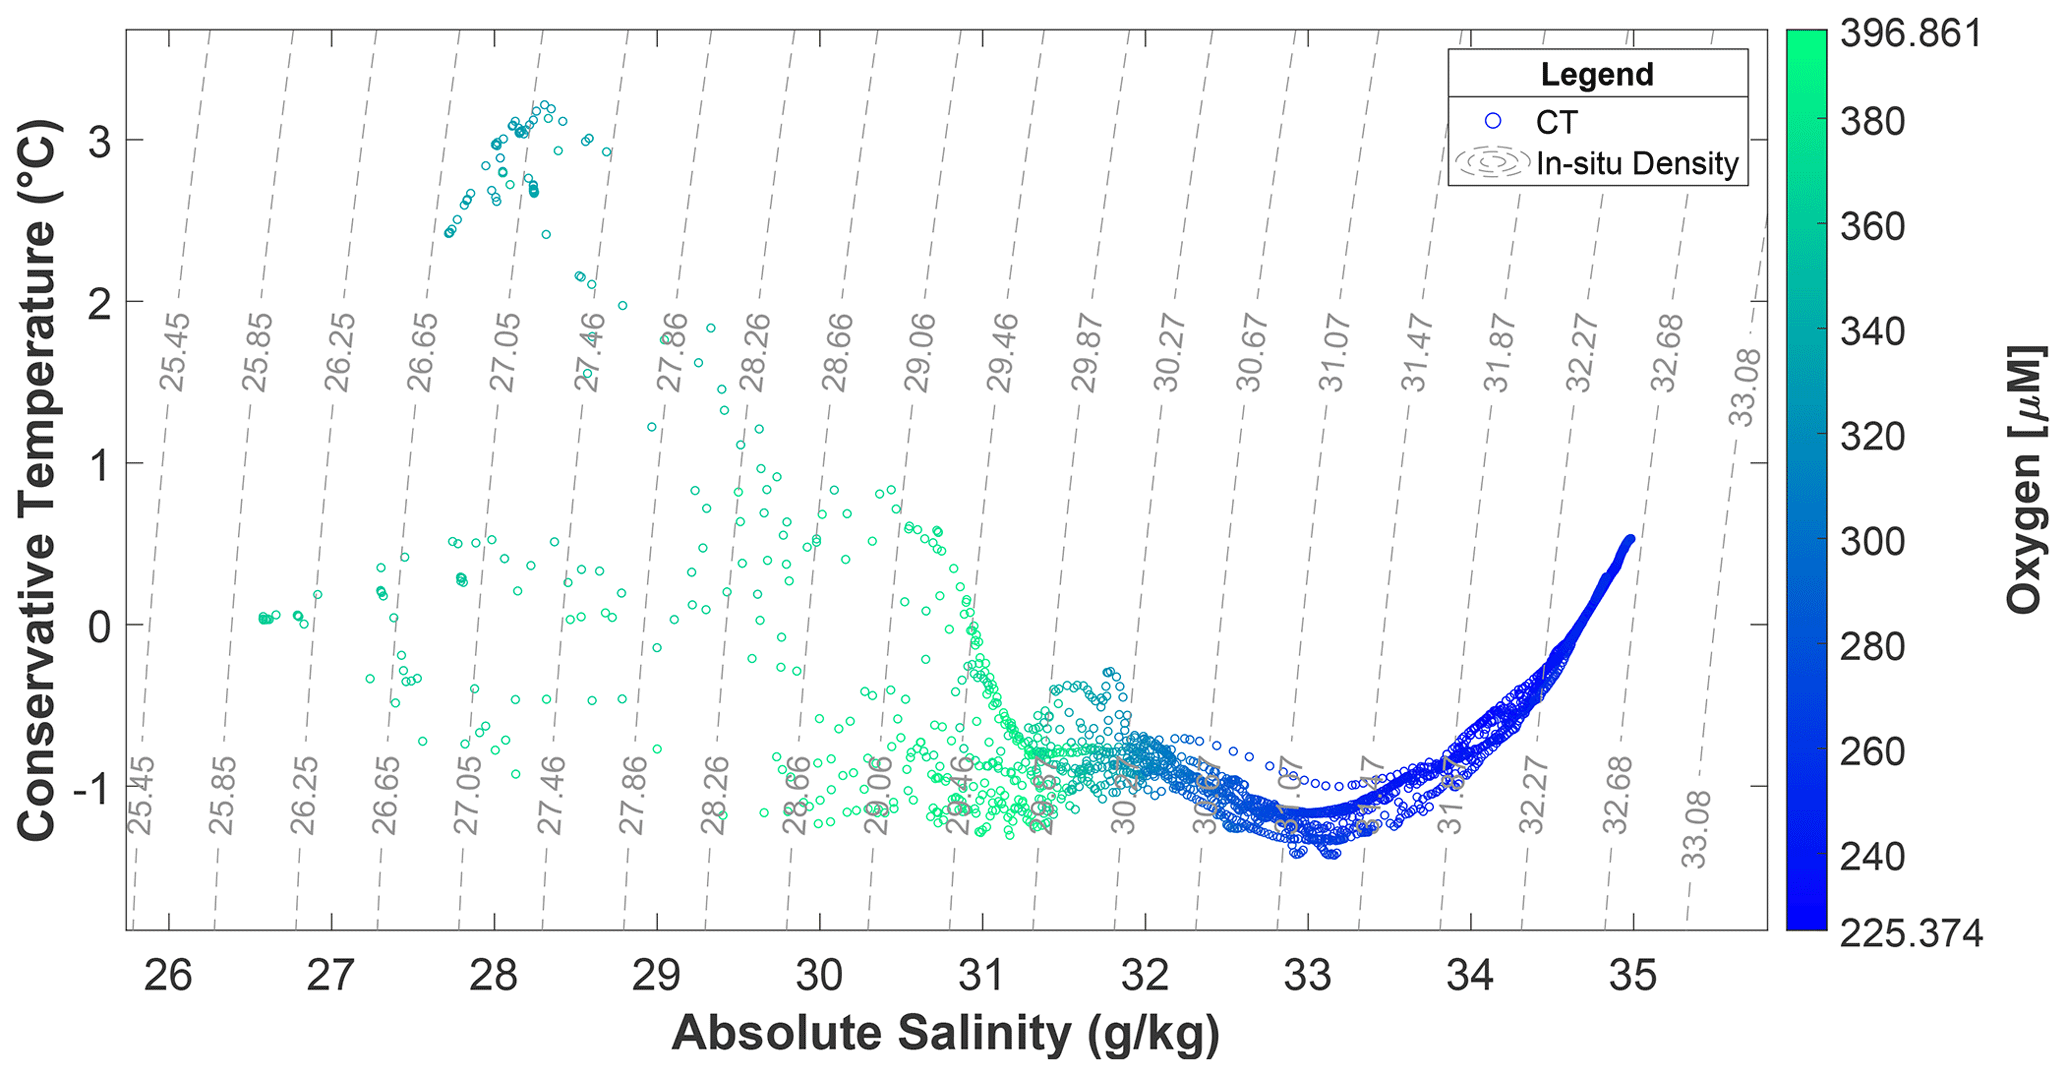
Figure 9Cape Bathurst transect TS diagram. The isolines are the in situ density values calculated with AS and CT.
3.2 MVP
One MVP transect was conducted in Hudson Strait during leg 3 on 14 August 2021. A total of 197 casts (vertical dives) were carried out. The transects shown in Fig. 10 represent 148 casts (casts 1–148) arranged linearly from Baffin Island to the coast of Nunavik (left to right). The remaining set of casts (casts 149–197) were conducted across Diana Bay to reach Quaqtaq. Only the first 148 casts are presented in this paper. Quality control assessment is applied at the final step of the data processing. Uncertainties of 0.01 PSU are observed when there is relatively low vertical variability, but a high vertical gradient can increase these uncertainties. For the dissolved oxygen sensor on the MVP, the uncertainty is in the order of 1 %. However, it may exceed the value of 1 % when high vertical temperature and salinity gradients occur.
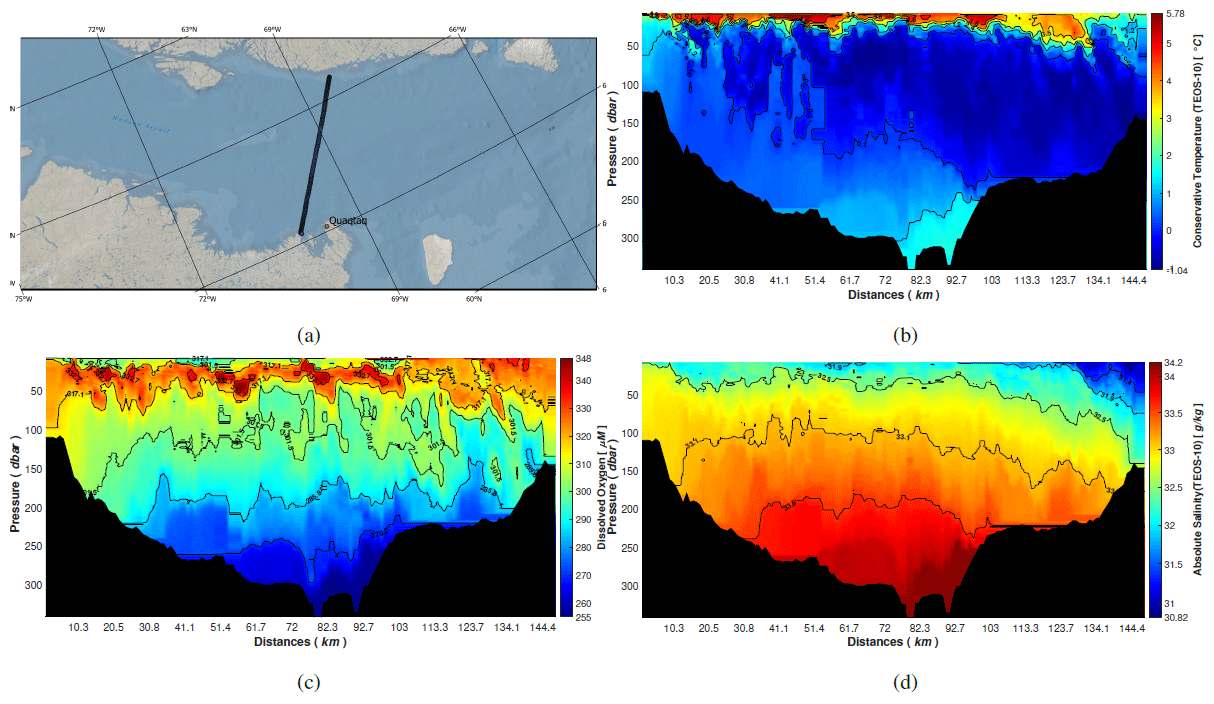
Figure 10MVP section profile across Hudson Strait from leg 3 of the 2021 expedition. Panel (a) shows MVP dive locations across Hudson Strait, (b) conservative temperature (∘C), (c) dissolved oxygen (µM) and (d) absolute salinity (g kg−1).
Over the transect in Hudson Strait, the MVP dived approximately at each kilometer, allowing high precision data recording. Mixing and turbulence are visible in Fig. 10c, where the layer of maximum dissolved oxygen is overall well defined, but varies in depth over nearly 50 dbar. The lowest dissolved oxygen values are located in the center of the transect, below 200 dbar. Lower salinity values (below 32 g kg−1) are located close to the coast of Nunavik, on the right side of Fig. 10d. This relatively freshwater mass is characteristic of the Hudson Bay outflow, the principal current linking the Hudson Bay system to the Labrador Sea, as described in previous studies (Ridenour et al., 2021; Straneo and Saucier, 2008). A layer of high salinity (>34 g kg−1), surrounded by the 1.5∘ conservative temperature isoline, is observed at the bottom. Above this bottom layer lies a superposition of two layers of AS limited by CT values of 0.7 and −0.2 ∘C, respectively. From the bottom to the surface, the variation in AS appears to be smoother compared with the variation in the DO. In general, the layer of high DO does not reflect the AS values anywhere near the surface (Fig. 10d).
3.3 TSG
The underway thermosalinograph was operational during the five legs of the CCGS Amundsen scientific expedition in 2021, but only sea surface absolute salinity derived from the practical salinity recorded during leg 2 from 16 July to 12 August 2021 is presented in Figs. 11 and 12. This subset was selected because of its high spatial variations. The minimum and maximum values of the absolute salinity ranges between 4.66 and 34.69 g kg−1 (average and median salinity of 31.04 and 31.59 g kg−1, respectively) in accordance with previous observed values for Baffin Bay and Labrador Sea (Lavoie et al., 2013; Zweng and Münchow, 2006). Lower values (fresher waters) are located in Scott Inlet and in the Clark and Gibbs fjords (Nunavut), close to Qikiqtaaluk (Sillem) Island. Higher salinity is observed over the deeper regions of Labrador Sea and southern Baffin Bay. The close-up map in Fig. 12 shows the variation of the sea surface salinity at a location where fresh water masses meet the sea.
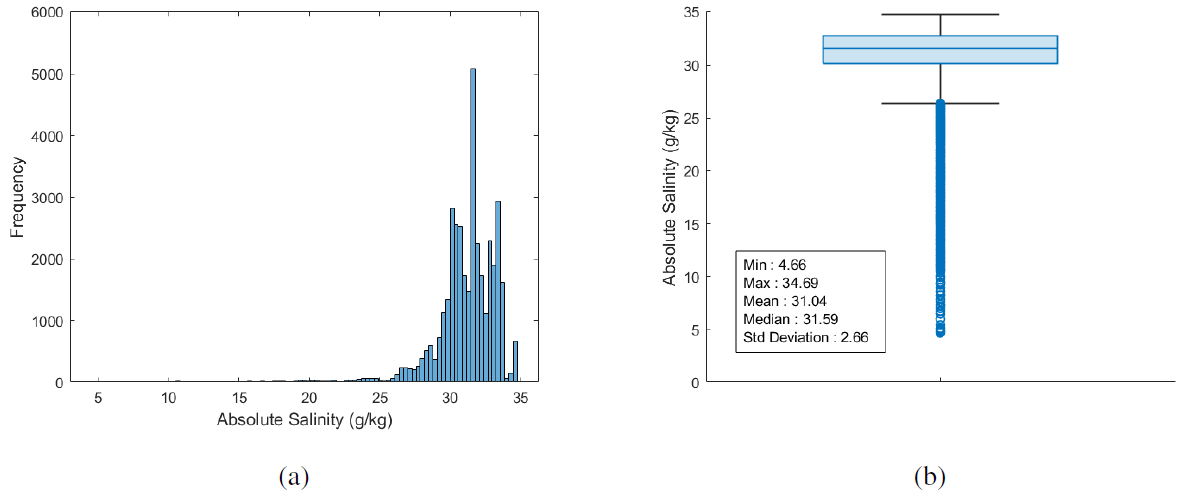
Figure 11Panel (a) shows a histogram and (b) a boxplot of the absolute salinity values from the TSG system collected during leg 2 of the 2021 expedition.
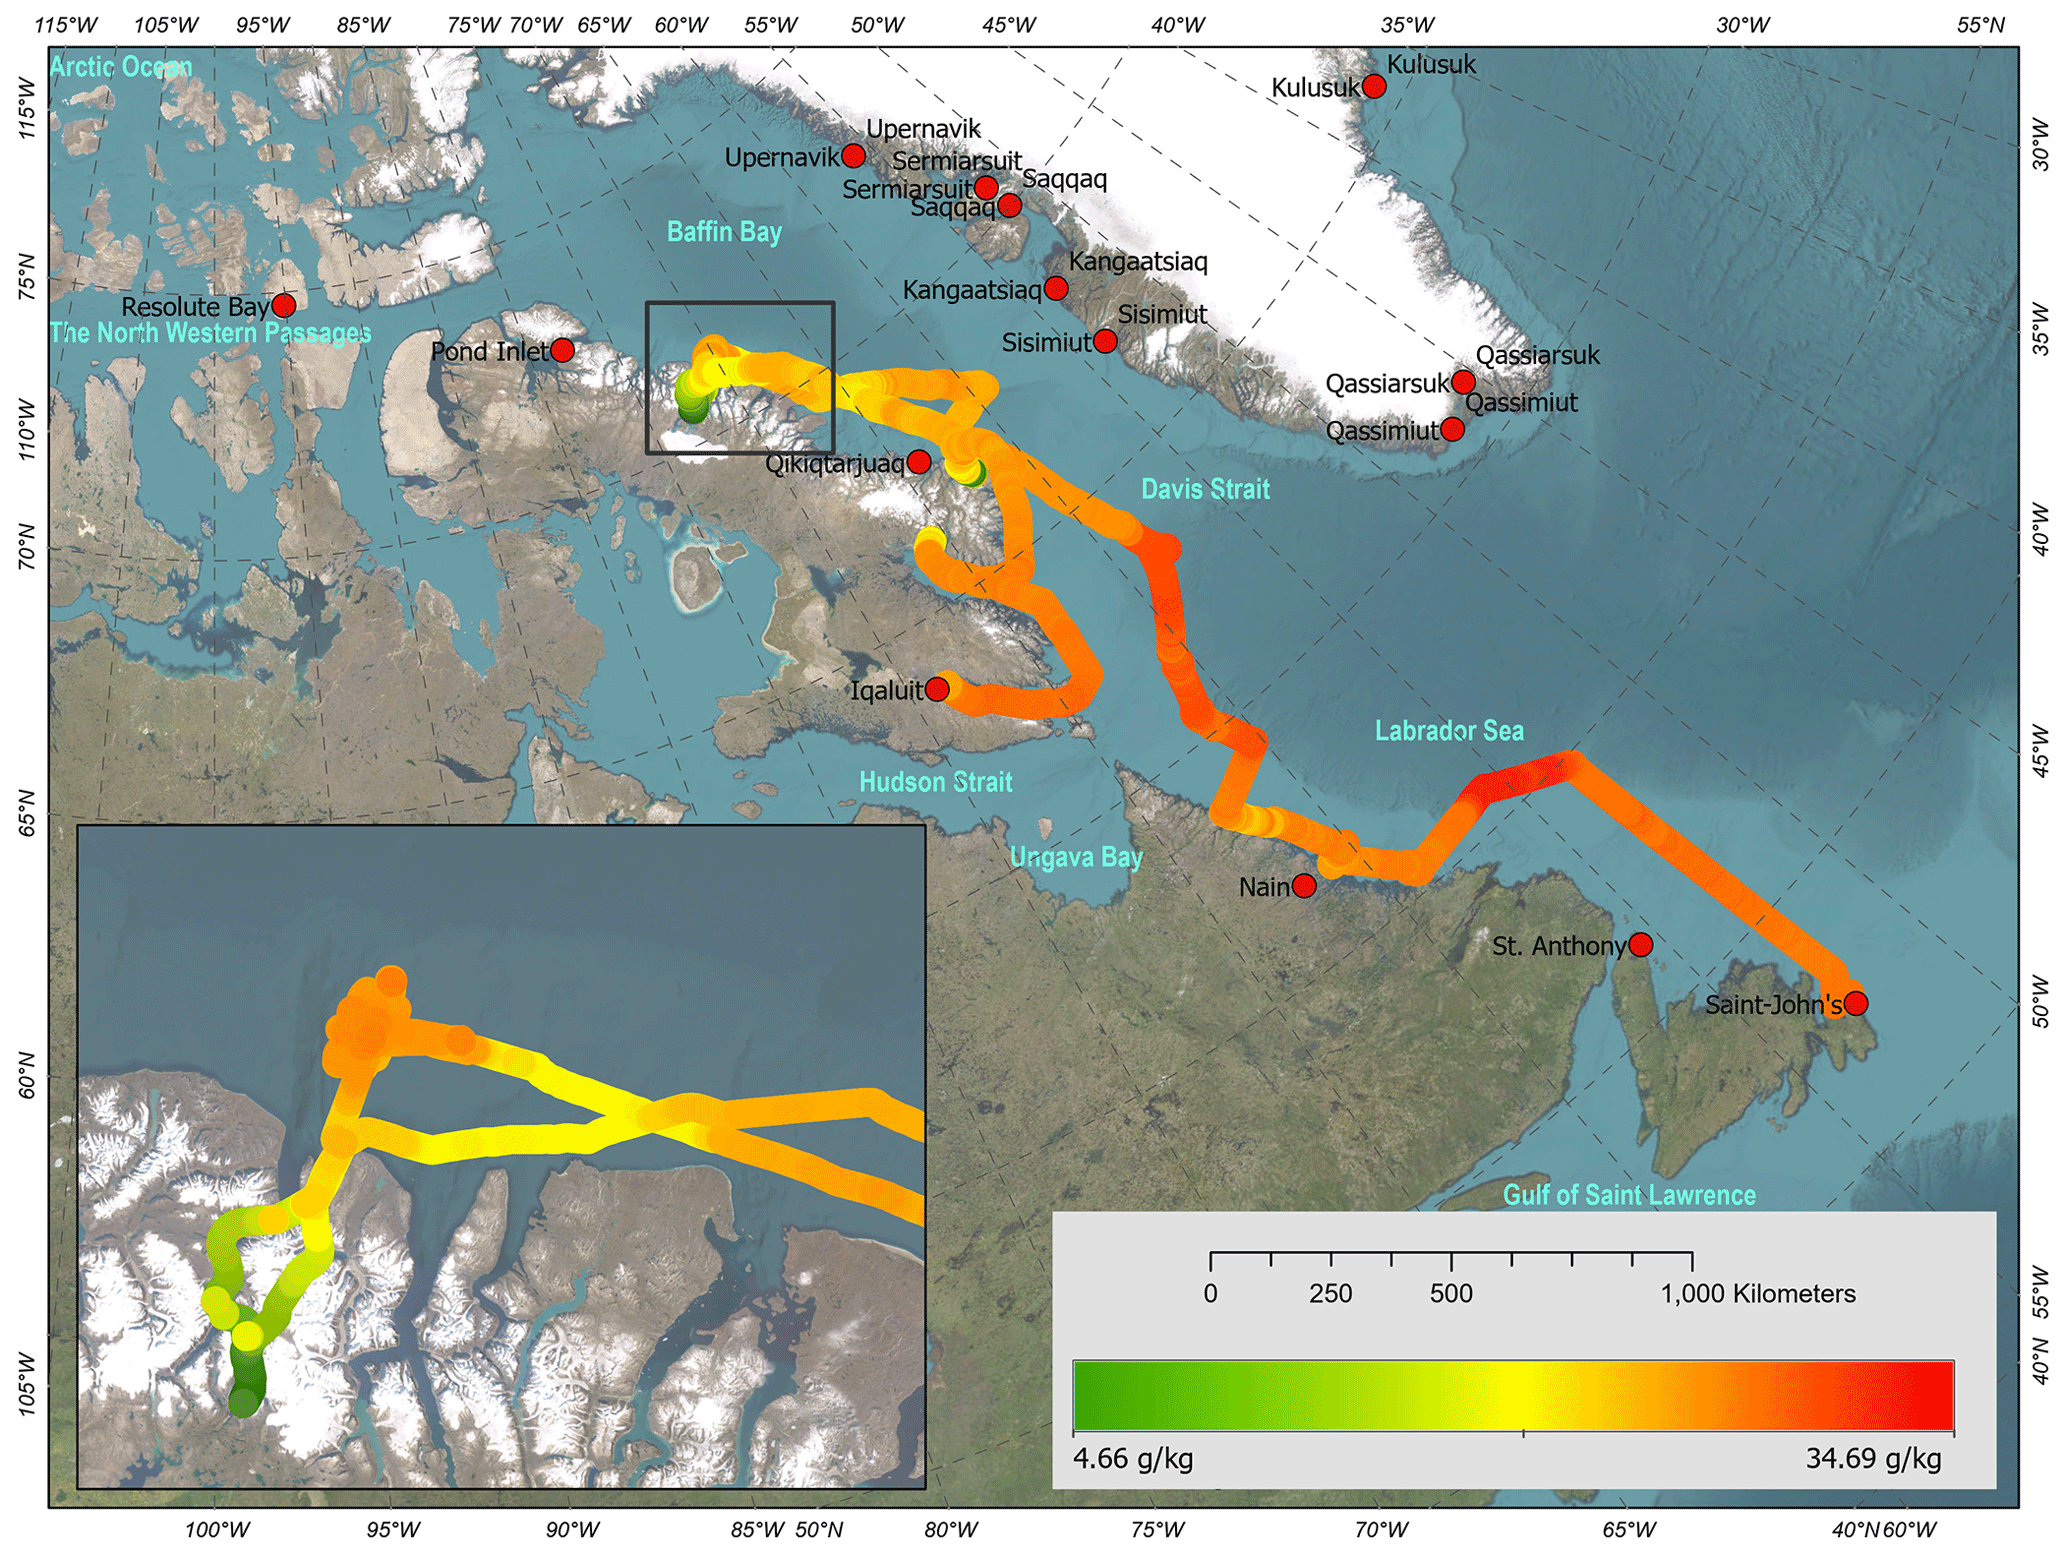
Figure 12Absolute salinity (g kg−1) obtained from the underway TSG system during leg 2 of the 2021 expedition (ESRI 2023).
3.4 Atmospheric data
The Automated Voluntary Observing System (AVOS) recorded atmospheric and weather data continuously during the 2021 scientific expedition. Due to instrument malfunctions and errors identified during data processing, the percentage of data reaching the quality standards described in Sect. 2.3.2 varies between 44 % of acceptable values (relative humidity) and 97 % (atmospheric pressure), with an average of 67 % of acceptable values for all measured variables. Diurnal cycles and air mass changes can be observed during an 8 d segment of leg 2, where the ship sailed in the Labrador Sea from offshore Makkovik to Davis Strait (Fig. 13). A subset of four major variables (atmospheric pressure, surface photosynthetic active radiation (SPAR), air temperature, and humidity) is presented and may be used to assess meteorological conditions during other sampling operations and during transit. Such variables can be necessary to interpret other findings, as sea surface physical conditions and weather are closely related during sampling activities (Rohli and Li, 2021; Lin et al., 1996).
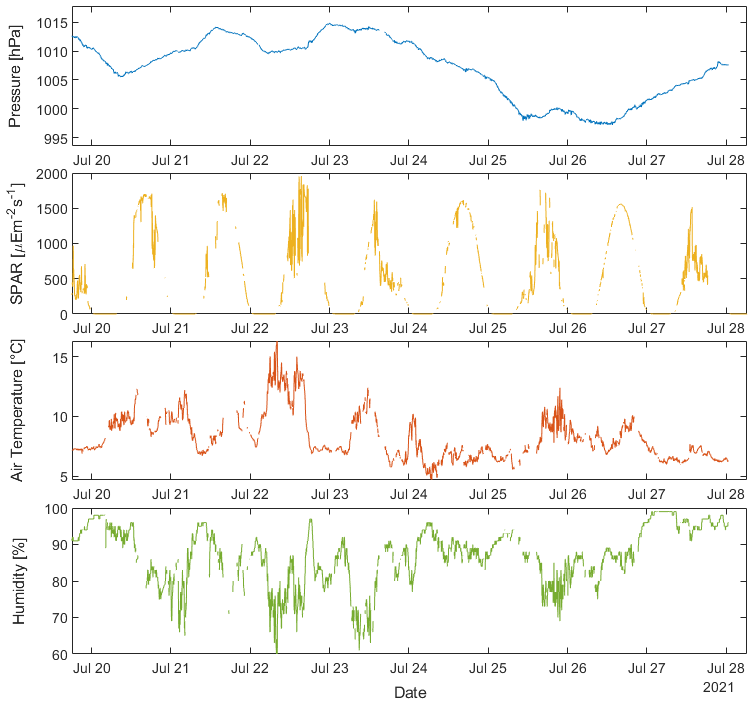
Figure 13Atmospheric data from leg 2 of the 2021 expedition. Atmospheric pressure, surface photosynthetic active radiation (SPAR), air temperature and relative humidity were measured over 20–28 July 2021.
3.5 Seabed data
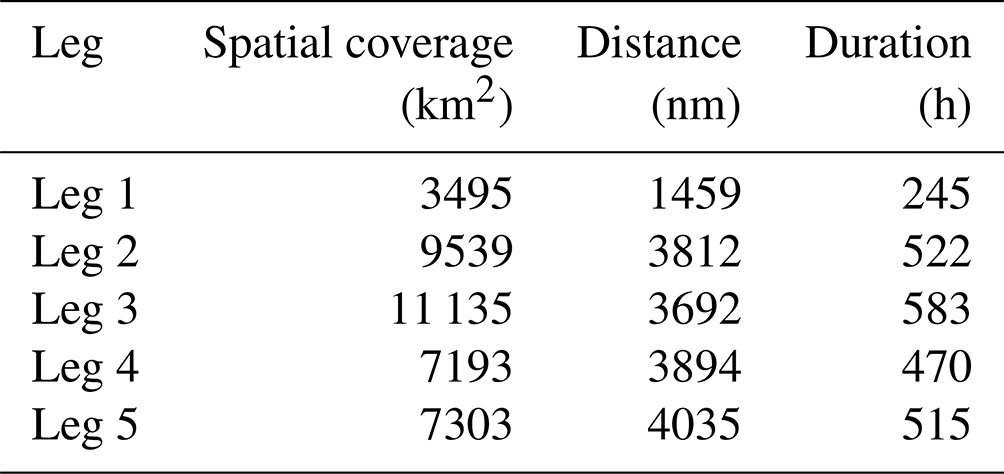
Over the five legs of the 2021 expedition the scientific echo sounders onboard the CCGS Amundsen continuously collected data, accumulating approximately 38 700 km2 of spatial coverage over a distance of nearly 17 000 nautical miles (Table 5).
In addition to opportunistic data collection, dedicated seabed surveys provided primary and ancillary datasets to research projects. The following section presents two dedicated multibeam operations conducted during the 2021 expedition. (Data can be accessed on demand at amundsen.data@as.ulaval.ca.)
Table 5Scientific echo sounder spatial coverage, operational distance and operational time during the 2021 expedition.
3.5.1 Makkovik
The hydrographic survey seen in Fig. 14 was conducted offshore Makkovik (Nunatsiavut) during leg 2. The survey zone is located 12 nautical miles from the coast of Makkovik where the seafloor ranges from 100 to 900 m depth in transition between coastal and deep areas, at the junction between the Aillik and Kaipokok domains of the Paleoproterozoic Makkovik province (Peace et al., 2018). Several overlapping geological processes take place in this province and create a complex geological structure (Culshaw et al., 2000). The area was selected for this survey due to its topographic features and steep slopes, which may host conditions supporting coral habitats (Edinger et al., 2011; Wareham and Edinger, 2007).
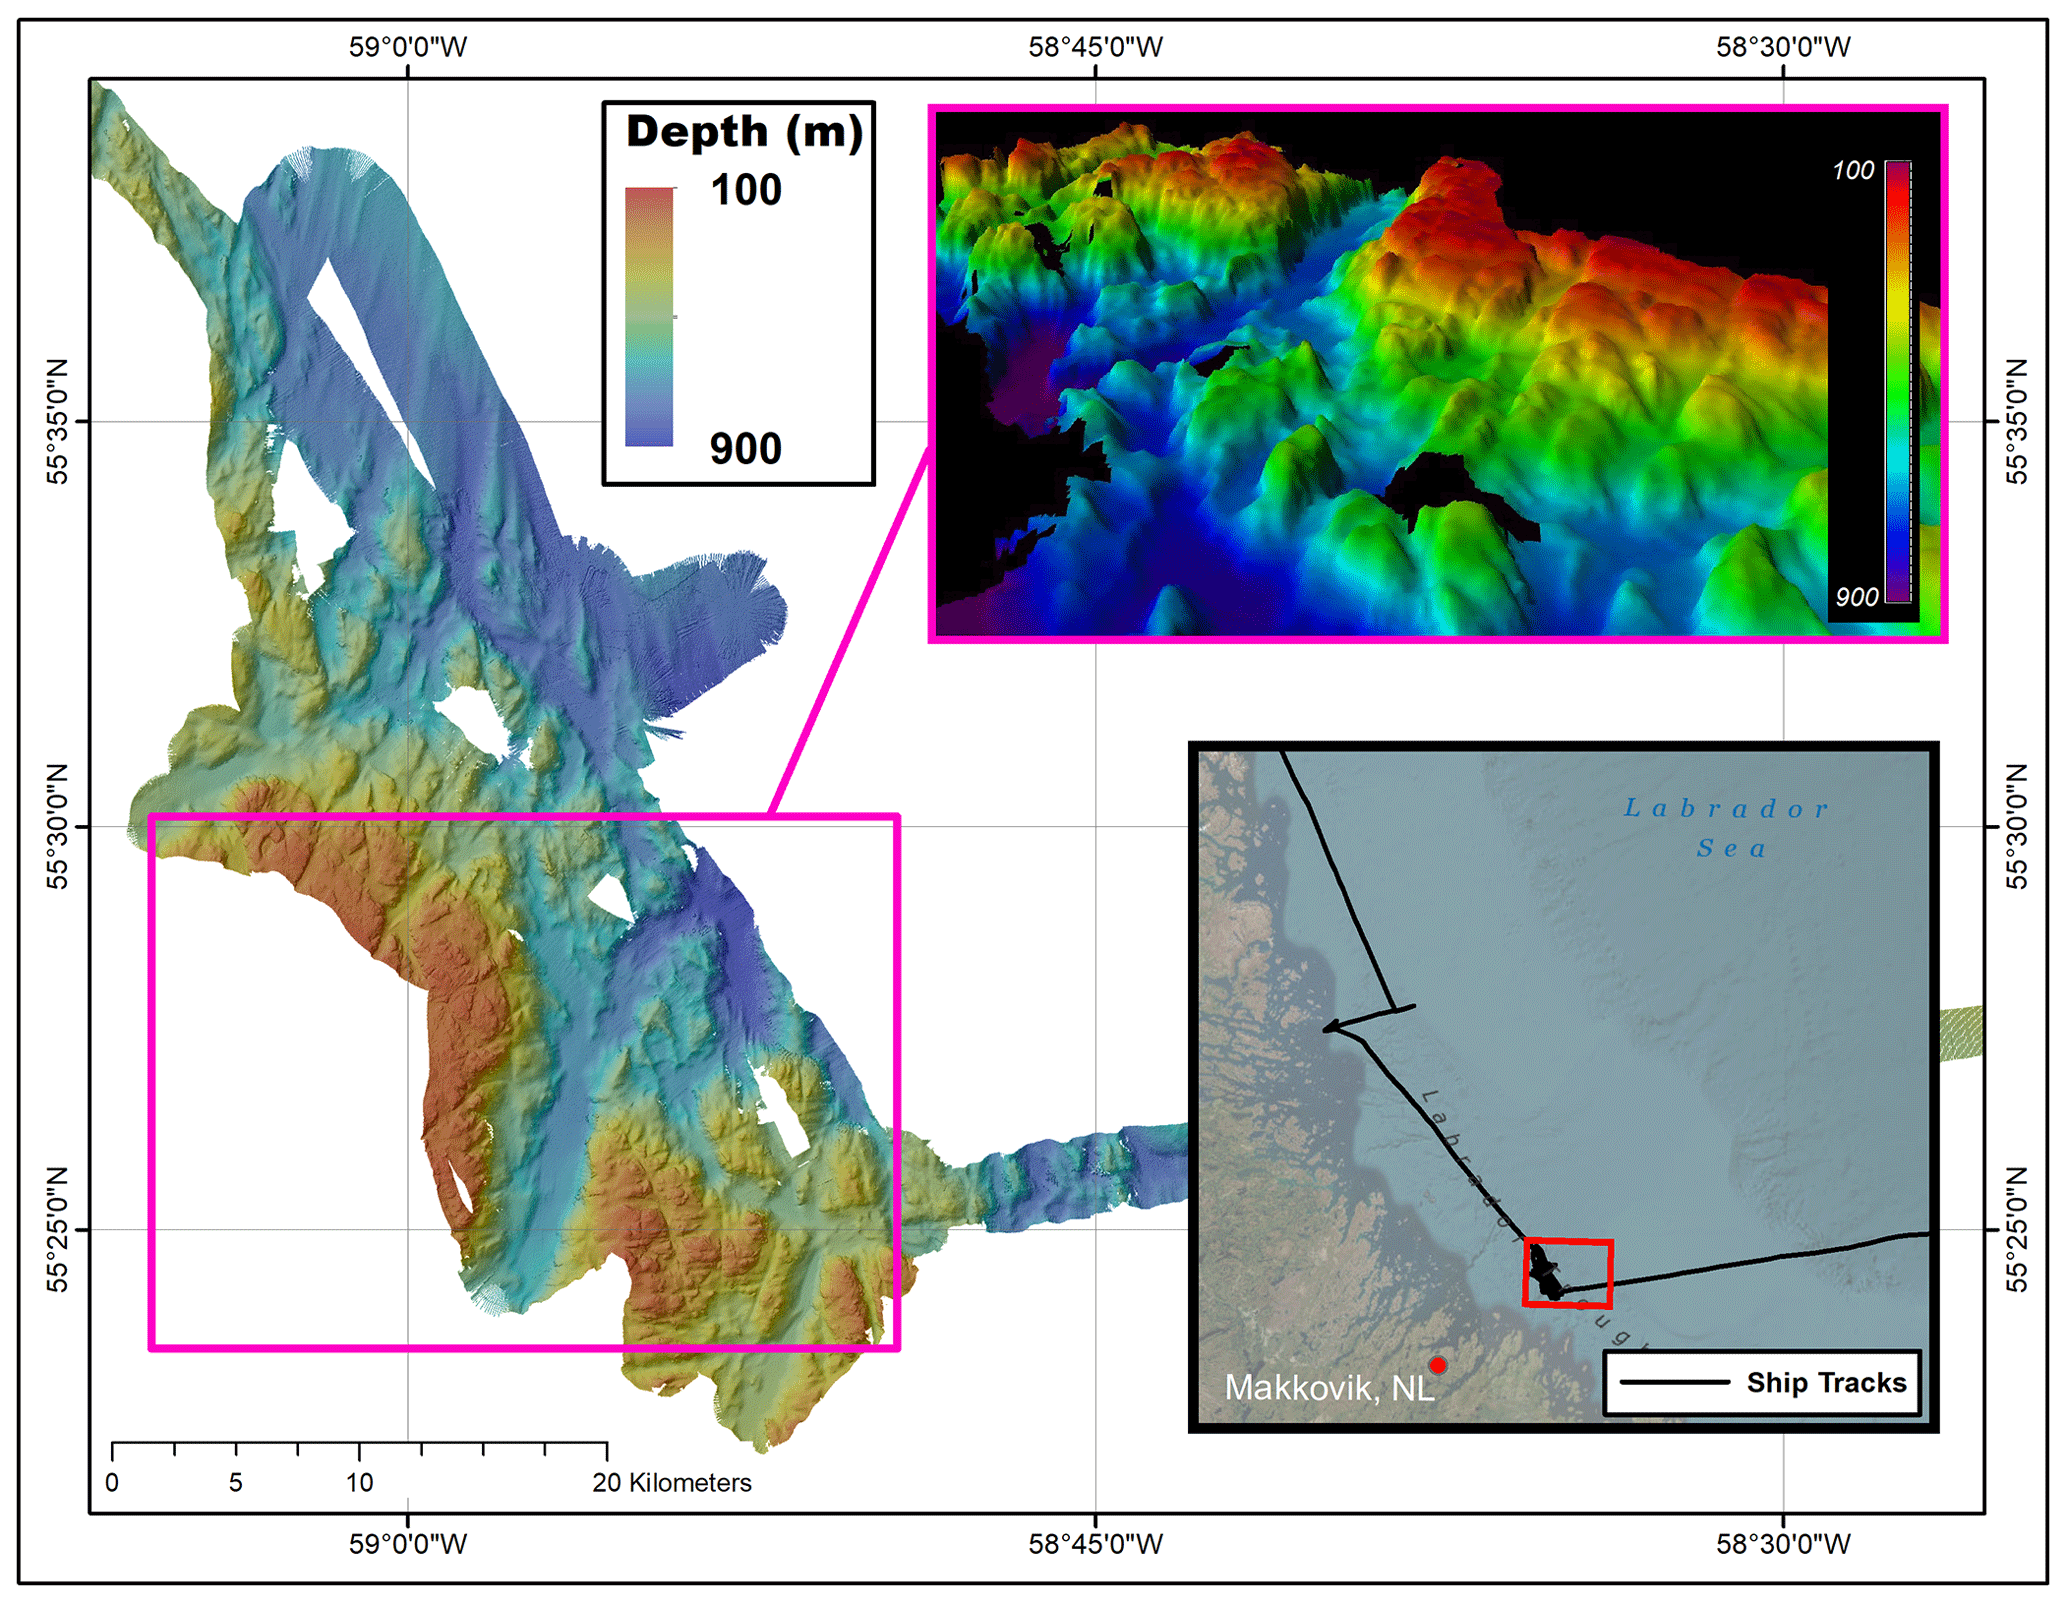
Figure 14Hydrographic survey completed during leg 2 of the 2021 expedition (ESRI 2023).
3.5.2 Smith Bay
Little is known about the precise mechanisms linking the ocean–climate system and frontal positions of glaciers in the CAA (Cook et al., 2019). In order to characterize post-glacial history of Mittie glacier and study the dynamics of glaciers in the CAA (Desmarais et al., 2023), bathymetric data (Fig. 15) and in situ samples were collected in Smith Bay, Nunavut, during leg 3. In addition to the operation of CCGS Amundsen echo sounders, a multibeam echo sounder was installed and tested on the ship's barge along the terminus of Mittie glacier.
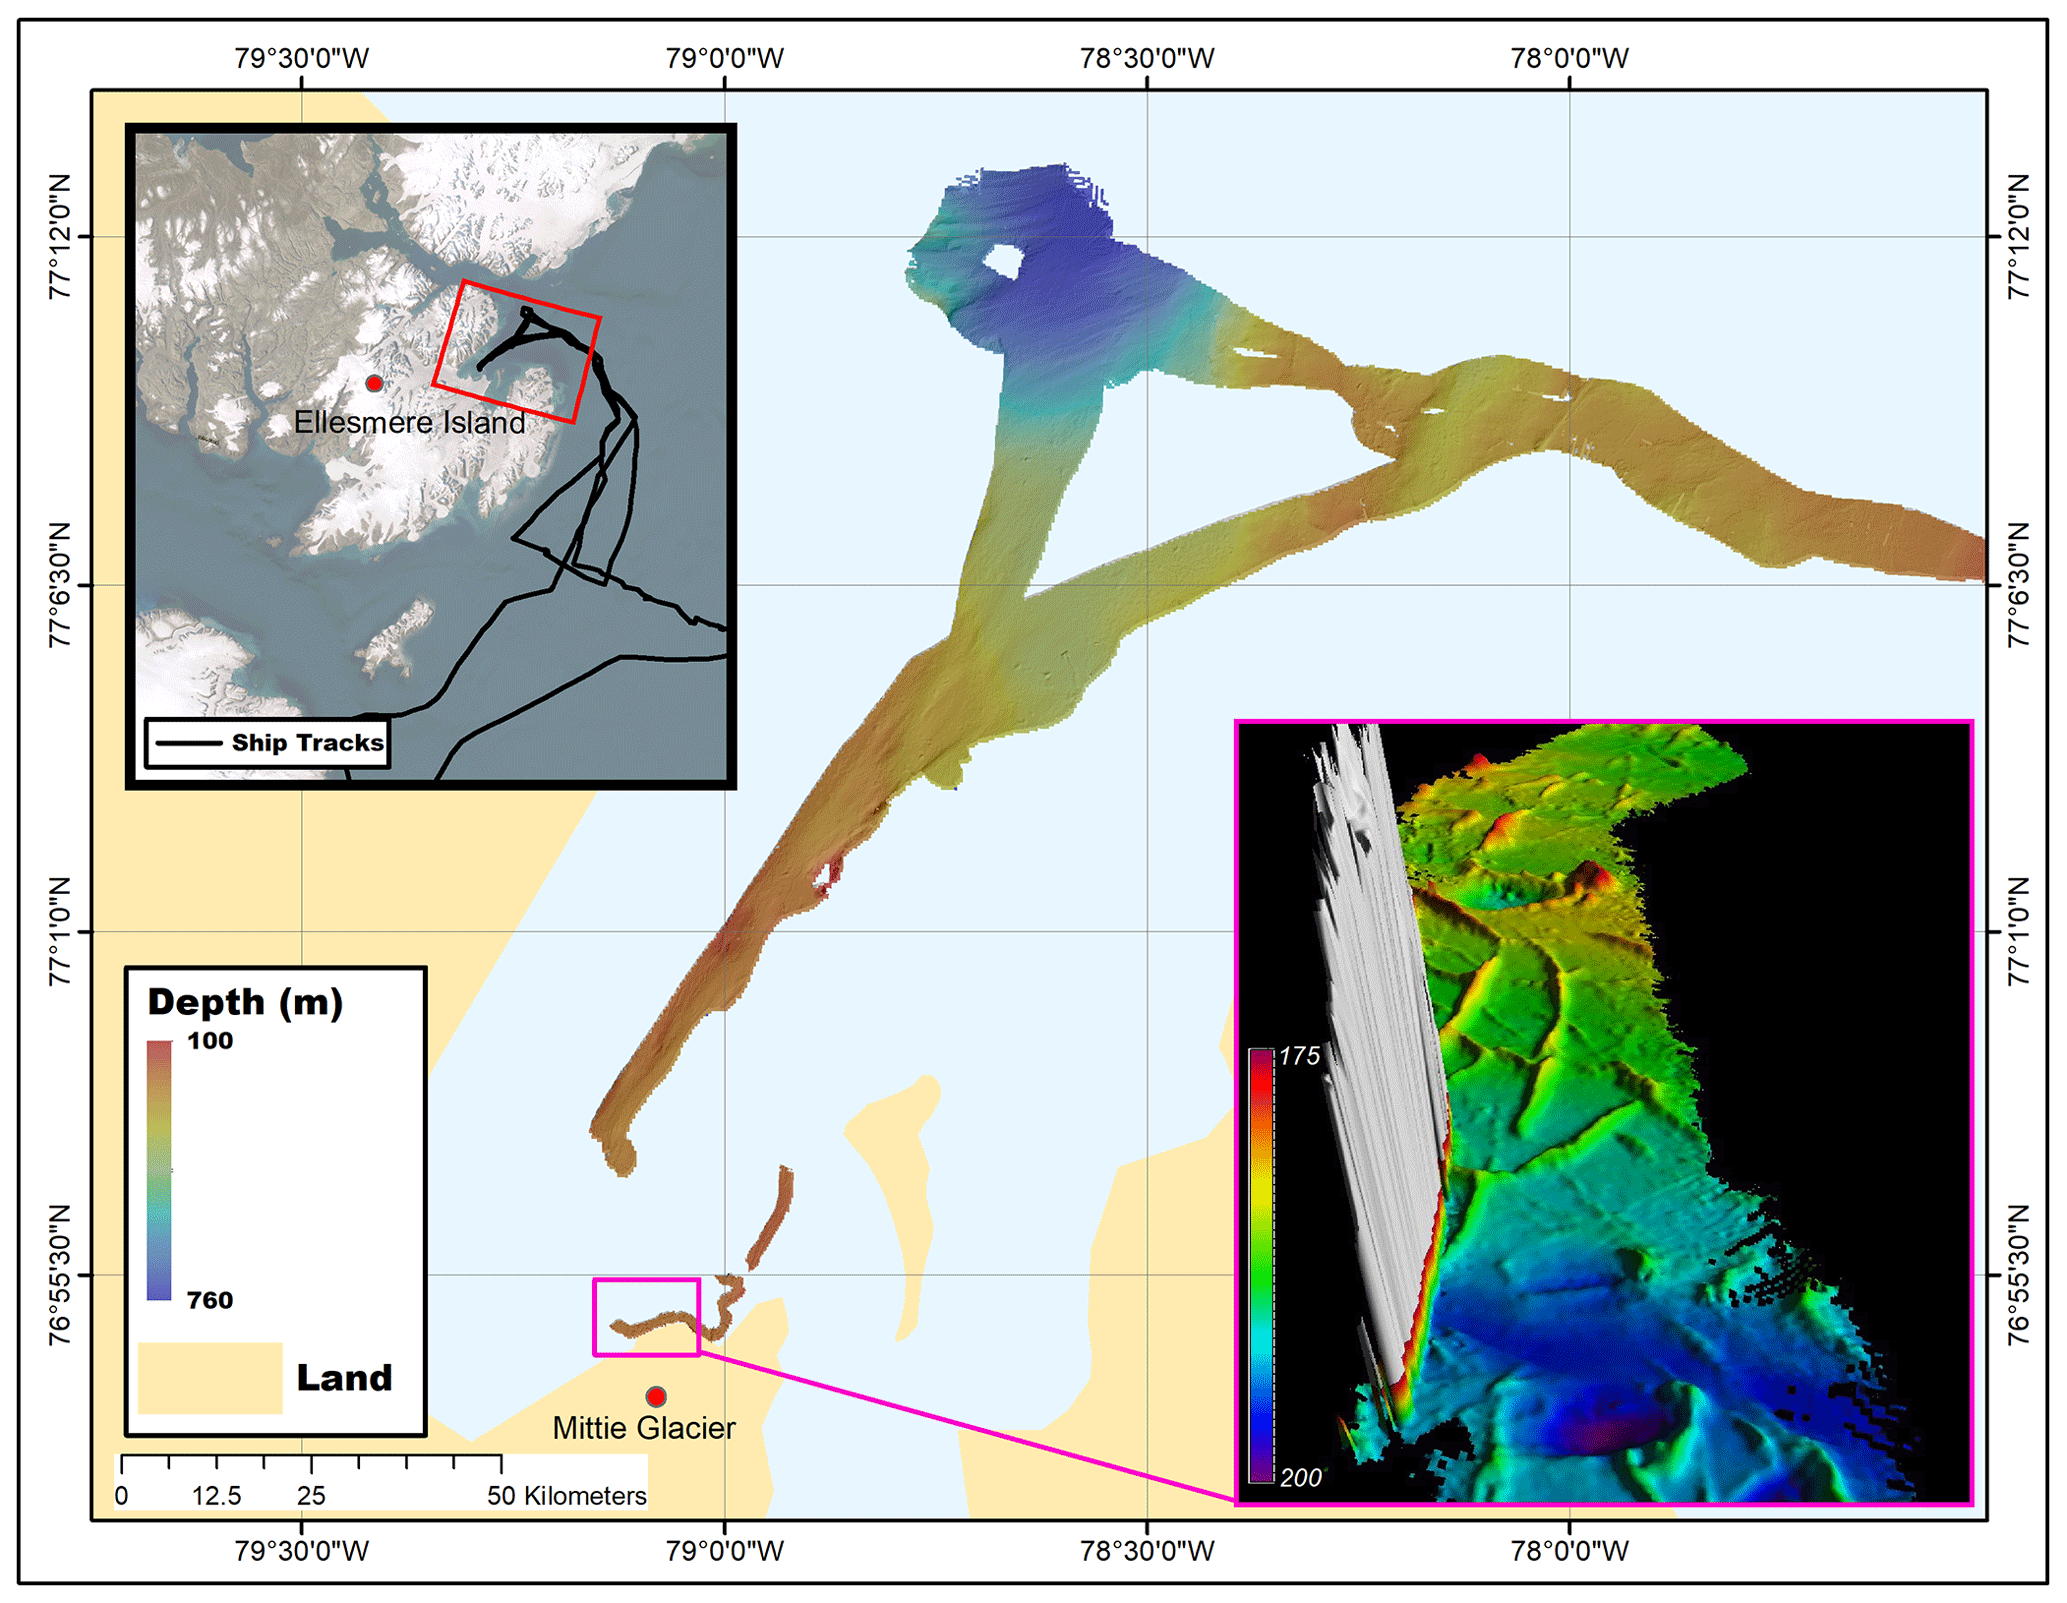
Figure 15Hydrographic survey completed during leg 3 of the 2021 expedition (ESRI 2023)
Little to no seafloor data existed in Smith Bay prior to leg 3 operations; the CCGS Amundsen collected the first publicly available high resolution seafloor topography dataset in the area. Data depicted in Fig. 15 will increase the efficiency and safety of navigation for future operations in the area.
All data are available on the Polar Data Catalogue as follows:
-
AVOS: https://doi.org/10.5884/12518 (Amundsen Science, 2021a)
-
MVP: https://doi.org/10.5884/12519 (Amundsen Science, 2021b)
-
CTD Rosette: https://doi.org/10.5884/12713 (Amundsen Science, 2021c)
-
TSG: https://doi.org/10.5884/12715 (Amundsen Science, 2021d)
All the codes and data used to produce the figures representing the transects in the present paper are available on GitLab at Université Laval (https://git.valeria.science/amundsen/2021-data-paper-codes-repository, Ratsimbazafy et al., 2023).
The vast amount of data collected by the central pool of equipment of the CCGS Amundsen during the 2021 scientific expedition in the Arctic can be used to study a vast array of research fields, from atmospheric environment to benthic ecosystems. Concurrent measurements above and under the sea surface provide invaluable tools to study the unique processes taking place in the Canadian and Greenlandic Arctic. The long-term monitoring of some of the regions of interest can allow studies of regional trends and variability. Similar research activities were also undertaken onboard other vessels in 2021, such as the USCGC Healy (McRaven, 2022) in Baffin Bay, and can be used to validate or further refine findings. Only a few variables collected by the core datasets of the scientific pool of equipment are presented in this paper, and readers are encouraged to consult Table B1 for a comprehensive list of all data produced by the participants of the CCGS Amundsen scientific expedition of 2021. Along with instruments presented in this paper, Amundsen Science is also responsible for managing a mono-beam fish and zooplankton sonar (EK-80), 360∘ camera for ice concentration images, remotely operated vehicle (ROV) video footage, moorings and navigation data.
Datasets collected during the scientific expedition of 2021 are archived and published in the Polar Data Catalogue for long-term use. The metadata and data structures follow international standards to ensure findability and reusability of the data. Links to retrieve core datasets collected with the scientific pool of instruments onboard the CCGS Amundsen are available on the Amundsen Science website, in the section “Data Access”, at https://amundsenscience.com/data/data-access/ (last access: 15 December 2023). A complete list of instruments included onboard the CCGS Amundsen are available at https://amundsenscience.com/canadian-research-icebreaker/scientific-equipment/ (last access: 15 December 2023).
All authors contributed to the conceptualization of the research, the investigation and the visualization of the data. TR, PG, DA and SM contributed to the curation of the data presented hereby. TR, TD, AD, DA an PG took part in writing – original draft preparation, review & editing.
TR made Figs. 1, 4b, c and d, 5, 6b, c, and d, 7, 8b, c, and d, 9, 10b, c, and d, 11, 12. AD made Fig. 13. SM made Fig. 3. PG made Fig. 2. TD contributed to Fig. 1 and made Figs. 4a, 6a, 8a, 10a. SM made Figs. C1, C2.
The contact author has declared that none of the authors has any competing interests.
Publisher’s note: Copernicus Publications remains neutral with regard to jurisdictional claims made in the text, published maps, institutional affiliations, or any other geographical representation in this paper. While Copernicus Publications makes every effort to include appropriate place names, the final responsibility lies with the authors.
We thank the commanding officers and crews of the CCGS Amundsen for providing support during the entire 2021 expedition. This sampling could not have been undertaken without the interest and contributions of the scientific community and user programs. We thank Philippe Massicotte (Université Laval) for providing suggestions.
This research has been supported by the Canada Foundation for Innovation (Major Science Initiatives, grant no. 35560).
This paper was edited by Alberto Ribotti and reviewed by Paola Picco and one anonymous referee.
Adams, J. K., Dean, B. Y., Athey, S. N., Jantunen, L. M., Bernstein, S., Stern, G., Diamond, M. L., and Finkelstein, S. A.: Anthropogenic particles (including microfibers and microplastics) in marine sediments of the Canadian Arctic, Sci. Total Environ., 784, 147155, https://doi.org/10.1016/j.scitotenv.2021.147155, 2021. a
Aminot, A. and Chaussepied, M.: Manuel des analyses chimiques en milieu marin, 551.464 AMI, Centre national pour l'exploitation des océans Brest, http://pascal-francis.inist.fr/vibad/index.php?action=getRecordDetail&idt=6411644 (last access: 8 January 2024), 1983. a
Amundsen Science: Data Access – Amundsen Science, https://amundsenscience.com/data/data-access/, last access: 15 December 2023. a
Amundsen Science: AVOS Meteorological Data collected by the CCGS Amundsen in the Canadian Arctic, Arcticnet Inc. [data set], https://doi.org/10.5884/12518, 2021a. a, b
Amundsen Science: Moving Vessel Profiling (MVP) data collected by the CCGS Amundsen in the Canadian Arctic, Arcticnet Inc. [data set], https://doi.org/10.5884/12519, 2021b. a, b
Amundsen Science: CTD-Rosette data collected by the CCGS Amundsen in the Canadian Arctic, Arcticnet Inc. [data set], https://doi.org/10.5884/12713, 2021c. a
Amundsen Science: TSG data collected by the CCGS Amundsen in the Canadian Arctic, Arcticnet Inc. [data set], https://doi.org/10.5884/12715, 2021d. a, b, c, d
Arctic Council’s Working Group on the Protection of the Arctic Marine Environment (PAME): Arctic Shipping Status Report 1, Tech. Rep., https://pame.is/document-library/pame-reports-new/pame-ministerial-deliverables/2021-12th-arctic-council-ministerial-meeting-reykjavik-iceland/793-assr-1-the-increase-in-arctic-shipping-2013-2019/file (last access: 15 December 2023), 2020. a
Arctic Monitoring and Assessment Programme (AMAP): AMAP Assessment Report: Arctic Pollution Issues. Arctic Monitoring and Assessment Programme (AMAP), Tech. rep., Arctic Monitoring and Assessment Programme, https://www.amap.no/documents/doc/amap-assessment-report-arctic-pollution-issues/68 (last access: 15 December 2023), 1998. a
Arctic Monitoring and Assessment Programme (AMAP): 2018 AMAP Assessment – Arctic ocean acidification, Tech. Rep., Arctic Monitoring and Assessment Programme, https://www.amap.no/documents/doc/amap-assessment-2018-arctic-ocean-acidification/1659 (last access: 15 December 2023), 2018. a
Armitage, T. W. K., Manucharyan, G. E., Petty, A. A., Kwok, R., and Thompson, A. F.: Enhanced eddy activity in the Beaufort Gyre in response to sea ice loss, Nat. Commun., 11, 761, https://doi.org/10.1038/s41467-020-14449-z, 2020. a
Arrigo, K. R. and van Dijken, G. L.: Annual cycles of sea ice and phytoplankton in Cape Bathurst polynya, southeastern Beaufort Sea, Canadian Arctic, Geophys. Res. Lett., 31, 2003GL018978, https://doi.org/10.1029/2003GL018978, 2004. a
Azetsu-Scott, K., Jones, E. P., Yashayaev, I., and Gershey, R. M.: Time series study of CFC concentrations in the Labrador Sea during deep and shallow convection regimes (1991–2000), J. Geophys. Res.-Oceans, 108, 2002JC001317, https://doi.org/10.1029/2002JC001317, 2003. a
Bâcle, J., Carmack, E. C., and Ingram, R.: Water column structure and circulation under the North Water during spring transition: April–July 1998, Deep-Sea Res. Pt. II, 49, 4907–4925, https://doi.org/10.1016/S0967-0645(02)00170-4, 2002. a, b, c
Bamber, J. L., Tedstone, A. J., King, M. D., Howat, I. M., Enderlin, E. M., van den Broeke, M. R., and Noel, B.: Land Ice Freshwater Budget of the Arctic and North Atlantic Oceans: 1. Data, Methods, and Results, J. Geophys. Res.-Oceans, 123, 1827–1837, https://doi.org/10.1002/2017JC013605, 2018. a
Biospherical Instruments Inc.: QCP‐2300™, QCP‐2350™ Series with Logarithmically Compressed Analog Voltage Output, http://www.biospherical.com/images/pdf/qcp2300_apr2014.pdf (last access: 15 December 2023), 2014. a
Carmack, E. C. and Macdonald, R. W. (Eds.): Oceanography of the Canadian Shelf of the Beaufort Sea: A Setting for Marine Life, Arctic, 55, 29–45, https://doi.org/10.14430/arctic733, 2002. a
Carson, M. A., Jasper, J. N., and Conly, F. M.: Magnitude and Sources of Sediment Input to the Mackenzie Delta, Northwest Territories, 1974–94, Arctic, 51, 116–124, http://www.jstor.org/stable/40488391 (last access: 15 December 2023), 1998. a
Clarke, R. A. and Coote, A. R.: The Formation of Labrador Sea Water. Part III: The Evolution of Oxygen and Nutrient Concentration, J. Phys. Oceanogr., 18, 469–480, https://doi.org/10.1175/1520-0485(1988)018<0469:TFOLSW>2.0.CO;2, 1988. a
Comiso, J. C.: A rapidly declining perennial sea ice cover in the Arctic, Geophys. Res. Lett., 29, 17-1–17-4, https://doi.org/10.1029/2002GL015650, 2002. a
Cook, A. J., Copland, L., Noël, B. P. Y., Stokes, C. R., Bentley, M. J., Sharp, M. J., Bingham, R. G., and Van Den Broeke, M. R.: Atmospheric forcing of rapid marine-terminating glacier retreat in the Canadian Arctic Archipelago, Science Advances, 5, eaau8507, https://doi.org/10.1126/sciadv.aau8507, 2019. a
Copland, L., Sharp, M. J., and Dowdeswell, J. A.: The distribution and flow characteristics of surge-type glaciers in the Canadian High Arctic, Ann. Glaciol., 36, 73–81, https://doi.org/10.3189/172756403781816301, 2003. a
Culshaw, N., Ketchum, J., and Barr, S.: Structural evolution of the Makkovik Province, Labrador, Canada: Tectonic processes during 200 Myr at a Paleoproterozoic active margin, Tectonics, 19, 961–977, https://doi.org/10.1029/1999TC001156, 2000. a
Curry, B., Lee, C. M., and Petrie, B.: Volume, Freshwater, and Heat Fluxes through Davis Strait, 2004–05, J. Phys. Oceanogr., 41, 429–436, https://doi.org/10.1175/2010JPO4536.1, 2011. a, b
Dawson, J., Pizzolato, L., Howell, S. E. L., Copland, L., and Johnston, M. E.: Temporal and Spatial Patterns of Ship Traffic in the Canadian Arctic from 1990 to 2015, Vol. 71, https://doi.org/10.14430/arctic4698, 2018. a
DeGrandpre, M. D., Körtzinger, A., Send, U., Wallace, D. W. R., and Bellerby, R. G. J.: Uptake and sequestration of atmospheric CO2 in the Labrador Sea deep convection region, Geophys. Res. Lett., 33, 2006GL026881, https://doi.org/10.1029/2006GL026881, 2006. a
Desmarais, A., Forest, A., and Merzouk, A.: Arctic Expedition aboard the CCGS Amundsen (2021), SIOOC [data set], https://doi.org/10.26071/ogsl-b4a48b59-5fb8, 2023. a, b
Dezutter, T., Lalande, C., Darnis, G., and Fortier, L.: Seasonal and interannual variability of the Queen Maud Gulf ecosystem derived from sediment trap measurements, Limnol. Oceanogr., 66, S411–S426, https://doi.org/10.1002/lno.11628, 2021. a
Dickson, D. L. and Gilchrist, H. G. (Eds.): Status of Marine Birds of the Southeastern Beaufort Sea, vol. Vol. 55 No. 5 (2002): Supplement: 1–93 of The Beaufort Sea Conference 2000, Arctic Institute of North America, https://doi.org/10.14430/arctic734, 2002. a
Dmitrenko, I. A., Kirillov, S. A., Rudels, B., Geilfus, N.-X., Ehn, J., Babb, D. G., Lilien, D. A., and Dahl-Jensen, D.: Modification of Pacific water in the northern Canadian Arctic, In Frontiers in Marine Science, Frontiers Media SA, 10, https://doi.org/10.3389/fmars.2023.1181800, 2023. a
Dunmall, K., McNicholl, D., and Reist, J.: Community-based Monitoring Demonstrates Increasing Occurrences and Abundances of Pacific Salmon in the Canadian Arctic from 2000 to 2017, N. Pac. Anadr. Fish Comm. Tech. Rep. 11, 87–90, https://doi.org/10.23849/npafctr11/87.90, 2018. a
Edinger, E. N., Sherwood, O. A., Piper, D. J., Wareham, V. E., Baker, K. D., Gilkinson, K. D., and Scott, D. B.: Geological features supporting deep-sea coral habitat in Atlantic Canada, Cont. Shelf Res., 31, S69–S84, https://doi.org/10.1016/j.csr.2010.07.004, 2011. a
Environment and Natural Resources Canada: Environment and Natural Resources Canada (2021) Climate data viewer, Government of Canada, https://climate-viewer.canada.ca/climate-maps.html (last access: 15 December 2023), 2021. a
Environment and Climate Change Canada: Canadian Environmental Sustainability Indicators: Sea ice in Canada, https://www.canada.ca/en/environment-climate-change/services/environmental-indicators/seaice.html (last access: 11 January 2024), 2023. a
Falk-Petersen, S., Pavlov, V., Timofeev, S., and Sargent, J. R.: Climate variability and possible effects on arctic food chains: The role of Calanus, Springer Berlin Heidelberg, Berlin, Heidelberg, 147–166, ISBN 978-3-540-48514-8, https://doi.org/10.1007/978-3-540-48514-8_9, 2007. a
Galley, R. J., Babb, D., Ogi, M., Else, B. G. T., Geilfus, N.-X., Crabeck, O., Barber, D. G., and Rysgaard, S.: Replacement of multiyear sea ice and changes in the open water season duration in the Beaufort Sea since 2004, J. Geophys. Res.-Oceans, 121, 1806–1823, https://doi.org/10.1002/2015JC011583, 2016. a
Gearheard, S., Pocernich, M., Stewart, R., Sanguya, J., and Huntington, H. P.: Linking Inuit knowledge and meteorological station observations to understand changing wind patterns at Clyde River, Nunavut, Climatic Change, 100, 294, https://doi.org/10.1007/s10584-009-9587-1, 2010. a
Gulev, S., Thorne, P., Ahn, J., Dentener, F., Domingues, C., Gerland, S., Gong, D., Kaufman, D., Nnamchi, H., Quaas, J., Rivera, J., Sathyendranath, S., Smith, S., Trewin, B., von Schuckmann, K., and Vose, R.: Changing State of the Climate System, Cambridge University Press, Cambridge, United Kingdom and New York, NY, USA, 287–422, https://doi.org/10.1017/9781009157896.004, 2021. a
Halliday, W. D., Dawson, J., Yurkowski, D. J., Doniol-Valcroze, T., Ferguson, S. H., Gjerdrum, C., Hussey, N. E., Kochanowicz, Z., Mallory, M. L., Marcoux, M., Watt, C. A., and Wong, S. N.: Vessel risks to marine wildlife in the Tallurutiup Imanga National Marine Conservation Area and the eastern entrance to the Northwest Passage, Environ. Sci. Policy, 127, 181–195, https://doi.org/10.1016/j.envsci.2021.10.026, 2022. a
Harwood, L. A. and Stirling, I.: Distribution of ringed seals in the southeastern Beaufort Sea during late summer, Can. J. Zool., 70, 891–900, https://doi.org/10.1139/z92-127, 1992. a
Hauser, D. D. W., Laidre, K. L., Stafford, K. M., Stern, H. L., Suydam, R. S., and Richard, P. R.: Decadal shifts in autumn migration timing by Pacific Arctic beluga whales are related to delayed annual sea ice formation, Glob. Change Biol., 23, 2206–2217, https://doi.org/10.1111/gcb.13564, 2017. a
Helle, I., Mäkinen, J., Nevalainen, M., Afenyo, M., and Vanhatalo, J.: Impacts of oil spills on Arctic marine ecosystems: A quantitative and probabilistic risk assessment perspective, Environ. Sci. Technol., 54, 2112–2121, 2020. a
Higdon, J. W. and Ferguson, S. H.: Loss of Arctic sea ice causing punctuated change in sightings of killer whales (Orcinus orca) over the past century, Ecol. Appl., 19, 1365–1375, https://doi.org/10.1890/07-1941.1, 2009. a
Hoover, C., Walkusz, W., MacPhee, S., Niemi, A., Majewski, A., and Loseto, L.: Canadian Beaufort Sea Shelf Food Web Structure and Changes from 1970–2012, Tech. Rep. Canadian Data Report of Fisheries and Aquatic Sciences 1313, Central and Arctic Region, Fisheries and Oceans Canada, 501 University Crescent, Winnipeg, MB R3T 2N6, https://publications.gc.ca/collections/collection_2021/mpo-dfo/Fs97-13-1313-eng.pdf (last access: 8 January 2024), 2021. a
Howell, S. E. L. and Brady, M.: The Dynamic Response of Sea Ice to Warming in the Canadian Arctic Archipelago, Geophys. Res. Lett., 46, 13119–13125, https://doi.org/10.1029/2019GL085116, 2019. a
Hutchings, J. K. and Rigor, I. G.: Role of ice dynamics in anomalous ice conditions in the Beaufort Sea during 2006 and 2007, J. Geophys. Res.-Oceans, 117, 2011JC007182, https://doi.org/10.1029/2011JC007182, 2012. a
Intergovernmental Oceanographic Commission: GTSPP Real-Time Quality Control Manual, revised edition 2010, https://unesdoc.unesco.org/notice?id=p::usmarcdef_0000190563 (last access: 15 December 2023), 2010. a
IOC, SCOR and IAPSO: The international thermodynamic equation of seawater – 2010: Calculation and use of thermodynamic properties, Intergovernmental Oceanographic Commission, Manuals and Guides No. 56, UNESCO, 196 pp., https://www.teos-10.org/pubs/TEOS-10_Manual.pdf (last access: 11 January 2024), 2010. a, b
Jakobsson, M., Cherkis, N., Woodward, J., Macnab, R., and Coakley, B.: New grid of Arctic bathymetry aids scientists and mapmakers, Eos, 81, 89–96, https://doi.org/10.1029/00EO00059, 2000. a
Jakobsson, M., Macnab, R., Mayer, L., Anderson, R., Edwards, M., Hatzky, J., Schenke, H. W., and Johnson, P.: An improved bathymetric portrayal of the Arctic Ocean: Implications for ocean modeling and geological, Geophysical and Oceanographic Analyses, Geophys. Res. Lett., 35, 2008GL033520, https://doi.org/10.1029/2008GL033520, 2008. a
Jakobsson, M., Mayer, L., Coakley, B., Dowdeswell, J. A., Forbes, S., Fridman, B., Hodnesdal, H., Noormets, R., Pedersen, R., Rebesco, M., Schenke, H. W., Zarayskaya, Y., Accettella, D., Armstrong, A., Anderson, R. M., Bienhoff, P., Camerlenghi, A., Church, I., Edwards, M., Gardner, J. V., Hall, J. K., Hell, B., Hestvik, O., Kristoffersen, Y., Marcussen, C., Mohammad, R., Mosher, D., Nghiem, S. V., Pedrosa, M. T., Travaglini, P. G., and Weatherall, P.: The International Bathymetric Chart of the Arctic Ocean (IBCAO) Version 3.0, Geophys. Res. Lett., 39, 2012GL052219, https://doi.org/10.1029/2012GL052219, 2012. a
Johnston, M., Dawson, J., De Souza, E., and Stewart, E. J.: Management challenges for the fastest growing marine shipping sector in Arctic Canada: pleasure crafts, Polar Rec., 53, 67–78, https://doi.org/10.1017/S0032247416000565, 2017. a
Kieke, D. and Yashayaev, I.: Studies of Labrador Sea Water formation and variability in the subpolar North Atlantic in the light of international partnership and collaboration, Prog. Oceanogr., 132, 220–232, https://doi.org/10.1016/j.pocean.2014.12.010, 2015. a
Kieke, D., Klein, B., Stramma, L., Rhein, M., and Koltermann, K. P.: Variability and propagation of Labrador Sea Water in the southern subpolar North Atlantic, Deep-Sea Res. Pt. I, 56, 1656–1674, https://doi.org/10.1016/j.dsr.2009.05.010, 2009. a, b
Körtzinger, A., Send, U., Wallace, D. W. R., Karstensen, J., and DeGrandpre, M.: Seasonal cycle of O2 and pCO2 in the central Labrador Sea: Atmospheric, biological, and physical implications, Global Biogeochem. Cy., 22, 2007GB003029, https://doi.org/10.1029/2007GB003029, 2008. a
Kwok, R.: Variability of Nares Strait ice flux, Geophys. Res. Lett., 32, 2005GL024768, https://doi.org/10.1029/2005GL024768, 2005. a
Kwok, R., Cunningham, G. F., Wensnahan, M., Rigor, I., Zwally, H. J., and Yi, D.: Thinning and volume loss of the Arctic Ocean sea ice cover: 2003–2008, J. Geophys. Res.-Oceans, 114, 2009JC005312, https://doi.org/10.1029/2009JC005312, 2009. a
Kwok, R., Toudal Pedersen, L., Gudmandsen, P., and Pang, S. S.: Large sea ice outflow into the Nares Strait in 2007, Geophys. Res. Lett., 37, 2009GL041872, https://doi.org/10.1029/2009GL041872, 2010. a
Lansard, B., Mucci, A., Miller, L. A., Macdonald, R. W., and Gratton, Y.: Seasonal variability of water mass distribution in the southeastern Beaufort Sea determined by total alkalinity and δ18O, J. Geophys. Res.-Oceans, 117, 2011JC007299, https://doi.org/10.1029/2011JC007299, 2012. a
Lavoie, D., Lambert, N., and van der Baaren, A.: Projections of future physical and biogeochemical conditions in Hudson and Baffin bays from CMIP5 Global Climate Models, Can. Tech. Rep. Hydrogr. Ocean Sci., xiii + 129 pp., https://publications.gc.ca/collections/collection_2013/mpo-dfo/Fs97-18-289-eng.pdf (last access: 8 January 2024), 2013. a
Lehmann, N., Kienast, M., Granger, J., Bourbonnais, A., Altabet, M. A., and Tremblay, J.-E.: Remote Western Arctic Nutrients Fuel Remineralization in Deep Baffin Bay, Global Biogeochem. Cy., 33, 649–667, https://doi.org/10.1029/2018GB006134, 2019. a
Lin, C. A., Greatbatch, R. J., and Zhang, S.: Large Scale Atmosphere-Ocean Interaction and Climate, in: Climate Sensitivity to Radiative Perturbations, edited by: Treut, H. L., Springer Berlin Heidelberg, Berlin, Heidelberg, 291–303, ISBN 978-3-642-61053-0, 1996. a
Lindsay, R. and Schweiger, A.: Arctic sea ice thickness loss determined using subsurface, aircraft, and satellite observations, The Cryosphere, 9, 269–283, https://doi.org/10.5194/tc-9-269-2015, 2015. a
Lobb, J., Carmack, E. C., Ingram, R. G., and Weaver, A. J.: Structure and mixing across an Arctic/Atlantic front in northern Baffin Bay, Geophys. Res. Lett., 30, 2003GL017755, https://doi.org/10.1029/2003GL017755, 2003. a, b, c
Marko, J. R., Fissel, D. B., de Saavedra Álvarez, M. M., Ross, E., and Kerr, R.: Iceberg severity off the east coast of North America in relation to upstream sea ice variability: An update, in: 2014 Oceans, St. John's, NL, Canada, 14–19 September 2014, 1–6, https://doi.org/10.1109/OCEANS.2014.7003128, 2014. a
Massicotte, P., Amiraux, R., Amyot, M.-P., Archambault, P., Ardyna, M., Arnaud, L., Artigue, L., Aubry, C., Ayotte, P., Bécu, G., Bélanger, S., Benner, R., Bittig, H. C., Bricaud, A., Brossier, E., Bruyant, F., Chauvaud, L., Christiansen-Stowe, D., Claustre, H., Cornet-Barthaux, V., Coupel, P., Cox, C., Delaforge, A., Dezutter, T., Dimier, C., Domine, F., Dufour, F., Dufresne, C., Dumont, D., Ehn, J., Else, B., Ferland, J., Forget, M.-H., Fortier, L., Galí, M., Galindo, V., Gallinari, M., Garcia, N., Gérikas Ribeiro, C., Gourdal, M., Gourvil, P., Goyens, C., Grondin, P.-L., Guillot, P., Guilmette, C., Houssais, M.-N., Joux, F., Lacour, L., Lacour, T., Lafond, A., Lagunas, J., Lalande, C., Laliberté, J., Lambert-Girard, S., Larivière, J., Lavaud, J., LeBaron, A., Leblanc, K., Le Gall, F., Legras, J., Lemire, M., Levasseur, M., Leymarie, E., Leynaert, A., Lopes dos Santos, A., Lourenço, A., Mah, D., Marec, C., Marie, D., Martin, N., Marty, C., Marty, S., Massé, G., Matsuoka, A., Matthes, L., Moriceau, B., Muller, P.-E., Mundy, C.-J., Neukermans, G., Oziel, L., Panagiotopoulos, C., Pangrazi, J.-J., Picard, G., Picheral, M., Pinczon du Sel, F., Pogorzelec, N., Probert, I., Quéguiner, B., Raimbault, P., Ras, J., Rehm, E., Reimer, E., Rontani, J.-F., Rysgaard, S., Saint-Béat, B., Sampei, M., Sansoulet, J., Schmechtig, C., Schmidt, S., Sempéré, R., Sévigny, C., Shen, Y., Tragin, M., Tremblay, J.-E., Vaulot, D., Verin, G., Vivier, F., Vladoiu, A., Whitehead, J., and Babin, M.: Green Edge ice camp campaigns: understanding the processes controlling the under-ice Arctic phytoplankton spring bloom, Earth System Science Data, 12, https://doi.org/10.5194/essd-12-151-2020, 2020. a
Massicotte, P., Amon, R. M. W., Antoine, D., Archambault, P., Balzano, S., Bélanger, S., Benner, R., Boeuf, D., Bricaud, A., Bruyant, F., Chaillou, G., Chami, M., Charrière, B., Chen, J., Claustre, H., Coupel, P., Delsaut, N., Doxaran, D., Ehn, J., Fichot, C., Forget, M.-H., Fu, P., Gagnon, J., Garcia, N., Gasser, B., Ghiglione, J.-F., Gorsky, G., Gosselin, M., Gourvil, P., Gratton, Y., Guillot, P., Heipieper, H. J., Heussner, S., Hooker, S. B., Huot, Y., Jeanthon, C., Jeffrey, W., Joux, F., Kawamura, K., Lansard, B., Leymarie, E., Link, H., Lovejoy, C., Marec, C., Marie, D., Martin, J., Martín, J., Massé, G., Matsuoka, A., McKague, V., Mignot, A., Miller, W. L., Miquel, J.-C., Mucci, A., Ono, K., Ortega-Retuerta, E., Panagiotopoulos, C., Papakyriakou, T., Picheral, M., Prieur, L., Raimbault, P., Ras, J., Reynolds, R. A., Rochon, A., Rontani, J.-F., Schmechtig, C., Schmidt, S., Sempéré, R., Shen, Y., Song, G., Stramski, D., Tachibana, E., Thirouard, A., Tolosa, I., Tremblay, J.-É., Vaïtilingom, M., Vaulot, D., Vaultier, F., Volkman, J. K., Xie, H., Zheng, G., and Babin, M.: The MALINA oceanographic expedition: how do changes in ice cover, permafrost and UV radiation impact biodiversity and biogeochemical fluxes in the Arctic Ocean?, Earth Syst. Sci. Data, 13, 1561–1592, https://doi.org/10.5194/essd-13-1561-2021, 2021. a
McCartney, M.: Recirculating components to the deep boundary current of the northern North Atlantic, Prog. Oceanogr., 29, 283–383, https://doi.org/10.1016/0079-6611(92)90006-L, 1992. a
McDougall, T. J. and Barker, P. M.: Getting started with TEOS-10 and the Gibbs Seawater (GSW) oceanographic toolbox, Scor/Iapso WG, 127, 1–28, ISBN 978-0-646-55621-5, https://www.teos-10.org/pubs/Getting_Started.pdf (last access: 8 January 2024), 2011. a, b
McGeehan, T. and Maslowski, W.: Evaluation and control mechanisms of volume and freshwater export through the Canadian Arctic Archipelago in a high-resolution pan-Arctic ice-ocean model, J. Geophys. Res.-Oceans, 117, 2011JC007261, https://doi.org/10.1029/2011JC007261, 2012. a
McRaven, L.: Shipboard hydrographic measurements from the Fate of freshwater and heat from the West Greenland Current project (2021), Arctic Data Center [data set], https://doi.org/10.18739/A2DB7VR5M, 2022. a
Meier, W. N., Hovelsrud, G. K., van Oort, B. E., Key, J. R., Kovacs, K. M., Michel, C., Haas, C., Granskog, M. A., Gerland, S., Perovich, D. K., Makshtas, A., and Reist, J. D.: Arctic sea ice in transformation: A review of recent observed changes and impacts on biology and human activity, Rev. Geophys., 52, 185–217, https://doi.org/10.1002/2013RG000431, 2014. a
Melling, H., Gratton, Y., and Ingram, G.: Ocean circulation within the North Water polynya of Baffin Bay, Atmos. Ocean, 39, 301–325, https://doi.org/10.1080/07055900.2001.9649683, 2001. a
Michel, C., Ingram, R., and Harris, L.: Variability in oceanographic and ecological processes in the Canadian Arctic Archipelago, Prog. Oceanogr., 71, 379–401, https://doi.org/10.1016/j.pocean.2006.09.006, 2006. a
Moore, G. W. K., Schweiger, A., Zhang, J., and Steele, M.: Spatiotemporal Variability of Sea Ice in the Arctic's Last Ice Area, Geophys. Res. Lett., 46, 11237–11243, https://doi.org/10.1029/2019GL083722, 2019. a, b
Moore, G. W. K., Howell, S. E. L., Brady, M., Xu, X., and McNeil, K.: Anomalous collapses of Nares Strait ice arches leads to enhanced export of Arctic sea ice, Nat. Commun., 12, 1, https://doi.org/10.1038/s41467-020-20314-w, 2021. a, b
Mudryk, L. R., Derksen, C., Howell, S., Laliberté, F., Thackeray, C., Sospedra-Alfonso, R., Vionnet, V., Kushner, P. J., and Brown, R.: Canadian snow and sea ice: historical trends and projections, The Cryosphere, 12, 1157–1176, https://doi.org/10.5194/tc-12-1157-2018, 2018. a
Nadaï, G., Nöthig, E.-M., Fortier, L., and Lalande, C.: Early snowmelt and sea ice breakup enhance algal export in the Beaufort Sea, Prog. Oceanogr., 190, 102–479, https://doi.org/10.1016/j.pocean.2020.102479, 2021. a
New, A. L., Smeed, D. A., Czaja, A., Blaker, A. T., Mecking, J. V., Mathews, J. P., and Sanchez-Franks, A.: Labrador Slope Water connects the subarctic with the Gulf Stream, Environ. Res. Lett., 16, 084019, https://doi.org/10.1088/1748-9326/ac1293, 2021. a
Nghiem, S. V., Rigor, I. G., Perovich, D. K., Clemente-Colón, P., Weatherly, J. W., and Neumann, G.: Rapid reduction of Arctic perennial sea ice, Geophys. Res. Lett., 34, 2007GL031138, https://doi.org/10.1029/2007GL031138, 2007. a
Niemi, A., Ferguson, S., Hedges, K., Melling, H., Michel, C., Ayles, B., Azetsu-Scott, K., Coupel, P., Deslauriers, D., Devred, E., Doniol-Valcroze, T., Dunmall, K., Eert, J., Galbraith, P., Geoffroy, M., Gilchrist, G., Hennin, H., Howland, K., Kendall, M., and Zimmerman, S.: State of Canada's Arctic Seas, Tech. Rep., https://doi.org/10.13140/RG.2.2.26859.16162, 2020. a, b
Ogi, M., Rigor, I. G., McPhee, M. G., and Wallace, J. M.: Summer retreat of Arctic sea ice: Role of summer winds, Geophys. Res. Lett., 35, 2008GL035672, https://doi.org/10.1029/2008GL035672, 2008. a
Peace, A. L., Dempsey, E. D., Schiffer, C., Welford, J. K., McCaffrey, K. J. W., Imber, J., and Phethean, J. J. J.: Evidence for Basement Reactivation during the Opening of the Labrador Sea from the Makkovik Province, Labrador, Canada: Insights from Field Data and Numerical Models, Geosciences, 8, 308, https://doi.org/10.3390/geosciences8080308, 2018. a
Pizzolato, L., Howell, S. E. L., Derksen, C., Dawson, J., and Copland, L.: Changing sea ice conditions and marine transportation activity in Canadian Arctic waters between 1990 and 2012, Clim. Change, 123, 161–173, 2014. a
Punshon, S., Azetsu-Scott, K., and Lee, C. M.: On the distribution of dissolved methane in Davis Strait, North Atlantic Ocean, Mar. Chem., 161, 20–25, https://doi.org/10.1016/j.marchem.2014.02.004, 2014. a
Ratsimbazafy, T., Guillot, P., Dezutter, T., and Desmarais, A.: 2021 Data Paper Codes Repository, Valeria [code and data set], https://git.valeria.science/amundsen/2021-data-paper-codes-repository, last access: 15 December 2023. a, b
Ridenour, N., Straneo, F., Holte, J., Gratton, Y., Myers, P., and Barber, D.: Hudson Strait Inflow: Structure and Variability, J. Geophys. Res.-Oceans, 126, 2020JC017089, https://doi.org/10.1029/2020JC017089, 2021. a
Rodríguez-Cuicas, M.-E., Montero-Serrano, J.-C., St-Onge, G., and Normandeau, A.: A 600-year marine record associated with the dynamics of the eastern Penny Ice Cap (Baffin Island, Nunavut, Canada), J. Quaternary Sci., 38, 1062–1081, https://doi.org/10.1002/jqs.3531, 2023. a
Rohli, R. V. and Li, C.: Weather Effects on the Coastal Ocean, Springer International Publishing, Cham, 399–413, ISBN 978-3-030-73093-2, https://doi.org/10.1007/978-3-030-73093-2_40, 2021. a
Sea-Bird Electronics, I.: SBE Data Processing, Sea Bird Scientific [software], http://seabird.com/software/sbe-data-processing (last access: 15 December 2023), 2017. a
Serreze, M. C., Barrett, A. P., Stroeve, J. C., Kindig, D. N., and Holland, M. M.: The emergence of surface-based Arctic amplification, The Cryosphere, 3, 11–19, https://doi.org/10.5194/tc-3-11-2009, 2009. a
Simpson, K. G., Tremblay, J.-E., Gratton, Y., and Price, N. M.: An annual study of inorganic and organic nitrogen and phosphorus and silicic acid in the southeastern Beaufort Sea, J. Geophys. Res.-Oceans, 113, 2007JC004462, https://doi.org/10.1029/2007JC004462, 2008. a
Stern, G. A., Macdonald, C. R., Carvalho, P. C., Wolfe, T., and Ferraz, F.: Baseline levels and characterization of hydrocarbons in surface marine sediments along the transportation corridor in Hudson Bay: A multivariate analysis of n-alkanes, PAHs and biomarkers, Sci. Total Environ., 855, 158718, https://doi.org/10.1016/j.scitotenv.2022.158718, 2023. a
Straneo, F. and Saucier, F.: The outflow from Hudson Strait and its contribution to the Labrador Current, Deep-Sea Res. Pt. I, 55, 926–946, https://doi.org/10.1016/j.dsr.2008.03.012, 2008. a
Tang, C. C., Ross, C. K., Yao, T., Petrie, B., DeTracey, B. M., and Dunlap, E.: The circulation, water masses and sea-ice of Baffin Bay, Prog. Oceanogr., 63, 183–228, https://doi.org/10.1016/j.pocean.2004.09.005, 2004. a, b, c
Untersteiner, N., Thorndike, A., Rothrock, D., and Hunkins, K.: AIDJEX revisited: A look back at the U.S.-Canadian Arctic Ice Dynamics Joint Experiment 1970–78, Arctic, 60, 327–336, https://doi.org/10.14430/arctic233, 2009. a
Vogt, J., Risk, D., Bourlon, E., Azetsu-Scott, K., Edinger, E. N., and Sherwood, O. A.: Sea–air methane flux estimates derived from marine surface observations and instantaneous atmospheric measurements in the northern Labrador Sea and Baffin Bay, Biogeosciences, 20, 1773–1787, https://doi.org/10.5194/bg-20-1773-2023, 2023. a
Wareham, V. E. and Edinger, E. N.: Distribution of deep-sea corals in the Newfoundland and Labrador region, Northwest Atlantic Ocean, B. Mar. Sci., 81, 289–313, 2007. a
Weatherhead, E., Gearheard, S., and Barry, R.: Changes in weather persistence: Insight from Inuit knowledge, Global Environ. Chang., 20, 523–528, https://doi.org/10.1016/j.gloenvcha.2010.02.002, 2010. a
Williams, W. J. and Carmack, E. C.: Combined effect of wind-forcing and isobath divergence on upwelling at Cape Bathurst, Beaufort Sea, J. Mar. Res., 66, https://elischolar.library.yale.edu/journal_of_marine_research/209 (last access: 8 January 2024), 2008. a
Yang, Q., Dixon, T. H., Myers, P. G., Bonin, J., Chambers, D., van den Broeke, M. R., Ribergaard, M. H., and Mortensen, J.: Recent increases in Arctic freshwater flux affects Labrador Sea convection and Atlantic overturning circulation, Nat. Commun., 7, 10525, https://doi.org/10.1038/ncomms10525, 2016. a, b
Yashayaev, I. and Seidov, D.: The role of the Atlantic Water in multidecadal ocean variability in the Nordic and Barents Seas, Prog. Oceanogr., 132, 68–127, https://doi.org/10.1016/j.pocean.2014.11.009, 2015. a
Yunda-Guarin, G., Michel, L. N., Roy, V., Friscourt, N., Gosselin, M., Nozais, C., and Archambault, P.: Trophic ecology of epibenthic communities exposed to different sea-ice concentrations across the Canadian Arctic Ocean, Prog. Oceanogr., 217, 103105, https://doi.org/10.1016/j.pocean.2023.103105, 2023. a
Zweng, M. M. and Münchow, A.: Warming and freshening of Baffin Bay, 1916–2003, J. Geophys. Res.-Oceans, 111, 2005JC003093, https://doi.org/10.1029/2005JC003093, 2006. a
A leg is a determined period during which the sampling operations of the ship are scheduled.
- Abstract
- Introduction
- Data acquisition, processing and quality control
- Data overview
- Data availability
- Code availability
- Conclusion
- Appendix A: Station IDs: geographical coordinates
- Appendix B: Programs and data collected during the 2021 CCGS Amundsen expedition
- Appendix C: Additional figures
- Author contributions
- Competing interests
- Disclaimer
- Acknowledgements
- Financial support
- Review statement
- References