the Creative Commons Attribution 4.0 License.
the Creative Commons Attribution 4.0 License.
 | 21 Oct 2024
A Copernicus-based evapotranspiration dataset at 100 m spatial resolution over four Mediterranean basins
Paulina Bartkowiak
Bartolomeo Ventura
Alexander Jacob
Mariapina Castelli
Evapotranspiration (ET) is responsible for regulating the hydrological cycle, with a relevant impact on air humidity and precipitation that is particularly important in the context of acute drought events in recent years. With the intensification of rainfall deficits and extreme heat events, the Mediterranean region requires regular monitoring to enhance water resource management. Even though remote sensing provides spatially continuous information for estimating ET on large scales, existing global products with spatial resolutions ≥ 0.5 km are insufficient for capturing spatial detail at a local level. In the framework of ESA's 4DMED-Hydrology project, we generate an ET dataset at both high spatial and high temporal resolutions using the Priestley–Taylor Two-Source Energy Balance (TSEB-PT) model driven by Copernicus satellite data. We build an automatic workflow to generate a 100 m ET product by combining data from Sentinel-2 (S2) MultiSpectral Instrument (MSI) and Sentinel-3 (S3) land surface temperature (LST) with ERA5 climate reanalysis derived within the period 2017–2021 over four Mediterranean basins in Italy, Spain, France, and Tunisia (Po, Ebro, Hérault, and Medjerda). First, original S2 data are pre-processed before deriving 100 m inputs for the ET estimation. Next, biophysical variables, like leaf area index and fractional vegetation cover, are generated, and then they are temporally composited within a 10 d window according to S3 acquisitions. Consequently, decadal S2 mosaics are used to derive the remaining TSEB-PT inputs. In parallel, we sharpen 1 km S3 by exploiting the dependency between coarse-resolution LST and 100 m S2 reflectances using a decision tree algorithm. Afterwards, climate forcings are utilized to model energy fluxes and then for daily ET retrieval. The daily ET composites demonstrate reasonable TSEB-PT estimates. Based on the validation results against eight eddy covariance (EC) towers between 2017 and 2021, the model predicts 100 m ET with an average RMSE of 1.38 mm d−1 and a Pearson coefficient equal to 0.60. Regardless of some constraints mostly related to the high complexity of EC sites, TSEB-PT can effectively estimate 100 m ET, which opens up new opportunities for monitoring the hydrological cycle on a regional scale. The full dataset is freely available at https://doi.org/10.48784/b90a02d6-5d13-4acd-b11c-99a0d381ca9a, https://doi.org/10.48784/fb631817-189f-4b57-af6a-38cef217bad3, https://doi.org/10.48784/70cd192c-0d46-4811-ad1d-51a09734a2e9, and https://doi.org/10.48784/7abdbd94-ddfe-48df-ab09-341ad2f52e47 for the Ebro, Hérault, Medjerda, and Po catchments, respectively (Bartkowiak et al., 2023a–d).
- Article
(8682 KB) - Full-text XML
- BibTeX
- EndNote


Terrestrial evapotranspiration (ET) is a keystone component for estimating water loss from Earth's surface, being the main indicator of biophysical conditions for vegetation and bare soil (Coenders-Gerrits et al., 2020; Gouveia et al., 2017). Designated an essential climate variable, ET substantially contributes to hydrological, energy, and carbon cycles through its high sensitivity to atmosphere–land interactions, which are particularly crucial in the context of a warming climate (Fisher et al., 2017; Konapala et al., 2020). Given its significance, ET finds widespread use in various environmental applications, including climate studies (Chattopadhyay and Hulme, 1997; Dezsi et al., 2018; Gao et al., 2017), drought detection (Maes and Steppe, 2012; Otkin et al., 2016), sustainable agriculture and food production (Allen et al., 1998; Cammalleri et al., 2014; Dari et al., 2022), and natural ecosystem monitoring (Anderson et al., 2012; Granata et al., 2020). However, most of these activities require spatially continuous ET data with regular revisit times and long-term observation records (Jiang et al., 2021). While conventional in situ measurements such as lysimeters, eddy covariance, and Bowen ratio techniques (Allen et al., 1991; Buttar et al., 2008; Pastorello et al., 2020) provide frequent time series, their limited spatial coverage and sparse network restrict their practical utility compared to gridded ET products.
Over the past few decades, many methods have been developed for retrieving spatially distributed ET over large areas, which can be categorized into two groups: process-based and data-driven approaches. The first category comprises physical modelling methods that derive energy fluxes based on theoretical assumptions. These approaches rely on various forcing parameters to explain ET and have been proposed by many researchers (Allen et al., 1998; Monteith, 1965; Norman et al., 1995; Penman, 1948; Priestley and Taylor, 1972; Su, 2002; Mallick et al., 2014). In addition to the “single-pixel methods” (Chirouze et al., 2014), land surface temperature (LST)-based contextual methods of ET that calibrate energy balance under dry–hot and wet–cold conditions within an image have been successfully applied in numerous studies (Bastiaanssen et al., 2005; Sobrino et al., 2021; Trezza et al., 2013). In contrast, the second group is based on empirical relationships between ET and its controlling predictors. These relationships are derived from in situ and remotely sensed observations and are mainly established using statistical regressions (Maselli et al., 2014), machine learning (ML), and deep-learning (DL) algorithms, like random forest (Douna et al., 2021), artificial neural networks (Ferreira et al., 2019; Jain et al., 2008), and long short-term memory (Babaeian et al., 2022). In these data-driven approaches, the focus is primarily on the statistical patterns and correlations between the observed variables and ET, with minimal incorporation of physical mechanisms into a model. In recent years, to achieve a balance between physical principles and model-learned relationships over large and diverse datasets, the scientific community has proposed process-constrained ML and DL methods that combine data-driven algorithms with process-based modelling (Cui et al., 2021; Hu et al., 2021; Reichstein et al., 2019).
Regardless of the ET method employed, open-source global climate datasets, like the European Reanalysis V5 (ERA5) and NASA Global Land Data Assimilation System (GLDAS), in conjunction with a surge in spaceborne Earth observation (EO) technologies, have greatly accelerated the development of many gridded ET products (Bhattarai and Wagle, 2021; García-Santos et al., 2022). Although ET cannot be measured directly from space, since the 1980s EO satellites have been providing valuable observations of land surface parameters, enabling estimation of actual ET at large scales (Zhang et al., 2016). One notable advantage of freely accessible global ET products is their spatiotemporal continuity and related long-term availability. In recent years, several long-term datasets have been developed, including the GLDAS Catchment Land Surface Model (CLSM) encompassing the years 1948 to 2014 and the Priestley–Taylor-based Global Land Evaporation Amsterdam Model (GLEAM) covering the period from 1980 to the present (Li et al., 2018; Miralles et al., 2011; Martens et al., 2017). Although these global-scale models provide extensive time series at the continental level, serving as a valuable parameter for many hydrological models (Alfieri et al., 2022; López López et al., 2017) and offering important insights into water availability at a large scale (Bai and Liu, 2018), they provide ET data at spatial resolutions of tens of kilometres. Since 2015, daily 3 km ET maps, driven by the Spinning Enhanced Visible and InfraRed Imager (SEVIRI) on board the geostationary Meteosat Second Generation (MSG) satellite, have been generated and made available through the Land Surface Analysis – Satellite Application Facility (LSA-SAF) system (https://landsaf.ipma.pt/, last access: 4 September 2023). Additionally, other global ET products include the Penman–Monteith MOD16 maps driven by Moderate Resolution Imaging Spectroradiometer (MODIS) inputs (Mu et al., 2007) and Operational Simplified Surface Energy Balance (SSEBop) ET, typically utilizing the 1 km MODIS LST and leaf area index (LAI) products and climate reanalysis datasets (Senay et al., 2013), among others that have been successfully applied in many regions (Weerasinghe et al., 2020). Despite their reliable validation results in relatively homogenous landscapes, like the contiguous United States (CONUS) with an average R2 of 0.7 for both SSEBop and MOD16 (Velpuri et al., 2013), their large pixel size and related insensitivity to complex terrain might not be representative over heterogenous locations (Castelli, 2021; McShane et al., 2017).
Surface energy balance (SEB) modelling is a valuable tool for estimating ET using high-resolution (HR) thermal remote sensing, like subfield-scale Landsat LST imagery with a pixel size ranging from 60 to 120 m and the 70 m ECOsystem Spaceborne Thermal Radiometer Experiment (ECOSTRESS) mission launched in 2018 (Anderson et al., 2021; Xue et al., 2022). Currently, the global HR ECOSTRESS ET data are generated from the Priestley–Taylor Jet Propulsion Laboratory (PT-JPL) algorithm (Fisher et al., 2008; Fisher, 2018). To expand the high capabilities of the HR LST, Cawse-Nicholson and Anderson (2021) introduced the disaggregated Atmosphere-Land Exchange Inverse Jet Propulsion Laboratory (DisALEXI-JPL) model, which provides ECOSTRESS-driven energy fluxes over the CONUS area. Additionally, ESA's European ECOSTRESS Hub data repository has been released, which offers an open-source 70 m daily evaporation product for Europe and Africa based on the non-parametric Surface Temperature Initiated Closure (STIC) model (Hu et al., 2022; Mallick et al., 2014). Even though the HR ET datasets obtain satisfactory results, the irregular revisit time of ECOSTRESS over Europe and the 8–16 d repeat cycle for Landsat hamper their use in monitoring ET dynamics and temporal trends. In this context, the next generations of HR thermal missions are designed, including ESA's Copernicus Land Surface Temperature Monitoring (LSTM) mission, the Thermal infraRed Imaging Satellite for High-resolution Natural resource Assessment (TRISHNA) of CNES–ISRO (France and India), and NASA's thermal infrared (TIR) Surface Biology and Geology (SGB) mission. Even though these instruments are planned for launch between 2024 and 2028, their operational use will be delayed further. Thus, there is an urgent need to bridge this gap by advancing current satellite-based ET estimates.
Given the limited availability of HR LST data, such as those with both a daily revisit time and a sub-kilometre pixel size, SEB-based retrievals have been commonly enhanced by spatially downscaling daily TIR images obtained from 1 km satellite sensors like Terra/Aqua MODIS, the Visible Infrared Imaging Radiometer Suite (VIIRS) on board the Suomi National Polar-orbiting Partnership (S-NPP), and the Sentinel-3 Sea and Land Surface Temperature Radiometer (SLSTR) (Bisquert et al., 2016; Guzinski and Nieto, 2019; Xue et al., 2021). Due to the increasing volume and variability of geospatial data, many data-driven approaches have been proposed, relying on empirical relationships between 1 km surface temperatures and high-resolution explanatory variables derived from synthetic aperture radar (SAR) and visible shortwave infrared (VSWIR) sensors (Amazirh et al., 2019; Li et al., 2019; Mao et al., 2021; Pu and Bonafoni, 2023). For instance, Liu et al. (2020) employed a random forest algorithm to derive 250 m MODIS LSTs over northern China, reporting an improvement in RMSE of 32 %–36 % compared to the original 1 km images. Furthermore, since 2019 the FAO initiative Water Productivity through Open access of Remotely sensed derived data (WaPOR) has provided 10 d ET composites over Africa and the Middle East derived from the ETLook model and driven by MODIS, PROBA-V, and Landsat data at continental, country, and subnational scales, corresponding to resolutions of 250, 100, and 30 m, respectively (Bastiaanssen et al., 2012; Blatchford et al., 2020). In parallel, the Priestley–Taylor Two-Source Energy Balance model, forced by ESA Copernicus data, has demonstrated the potential to produce HR ET with global coverage (Bellvert et al., 2020; Guzinski et al., 2020; Chintala et al., 2022). The frequent acquisitions of the HR Sentinel-2 MultiSpectral Instrument (MSI) and 1 km Sentinel-3 SLSTR with the two-satellite configurations, along with global ERA5 climate data, serve as reliable inputs for the Two-Source Energy Balance (TSEB-PT) model due to their long-term continuity and evolution plans. As reported by Guzinski et al. (2021), Copernicus datasets, including Sentinel-3 LST downscaled to resolutions ranging from 20 to 300 m, exhibit better spatial-scale consistency than WaPOR inputs, resulting in a correlation coefficient equal to 0.9 and a mean bias of less than 0.3 mm d−1 over Mediterranean agricultural areas in Tunisia and Spain during the growing season in 2018–2019.
In this study, we aim to produce Copernicus-based ET maps for the Mediterranean region (MR) utilizing the Two-Source Energy Balance model with a dual-source scheme, which allows estimation of energy fluxes for both vegetation and soil components. The ET product covers the years 2017–2021 and is generated at a high spatiotemporal resolution of 100 m on a daily basis as a reasonable scale over a fragmented Mediterranean landscape. The maps are derived using freely available algorithms developed within ESA's Sentinels for Evapotranspiration (Sen-ET) initiative (DHI-GRAS, 2020). In general, we synergistically combine high-resolution Sentinel-2 shortwave data, moderate-resolution Sentinel-3 LST images, and ERA5 climate observations to generate ET grids. Due to big data volume and the multi-step processing involved, the objective of this study is also to automatize the entire workflow for large-scale applications and to provide recommendations for facilitating Sen-ET inputs and algorithms through cloud computing infrastructure. To achieve this, we implement the entire workflow using cloud computing units offered by VMware, the Earth Observation Data Centre (EODC), and CloudFerro. The processing pipelines are designed to update the resulting ET time series and make it more suitable for operational use. To the best of our knowledge, this is the first application of TSEB-PT at sub-kilometre spatial resolution over the Mediterranean basin. Notably, such areas are often underrepresented in globally oriented studies, making this work particularly useful in advancing our understanding of ET in regions of high ecohydrological and socio-economic importance.
2.1 Study sites
Our study focuses on four Mediterranean river basins: the Ebro in Spain, the Po in Italy, the Medjerda in Tunisia, and the Hérault in Languedoc-Roussillon in France. The regions cover a total area of approximately 190 000 km2. Figure 1 depicts the geographical locations of all the areas of interest.
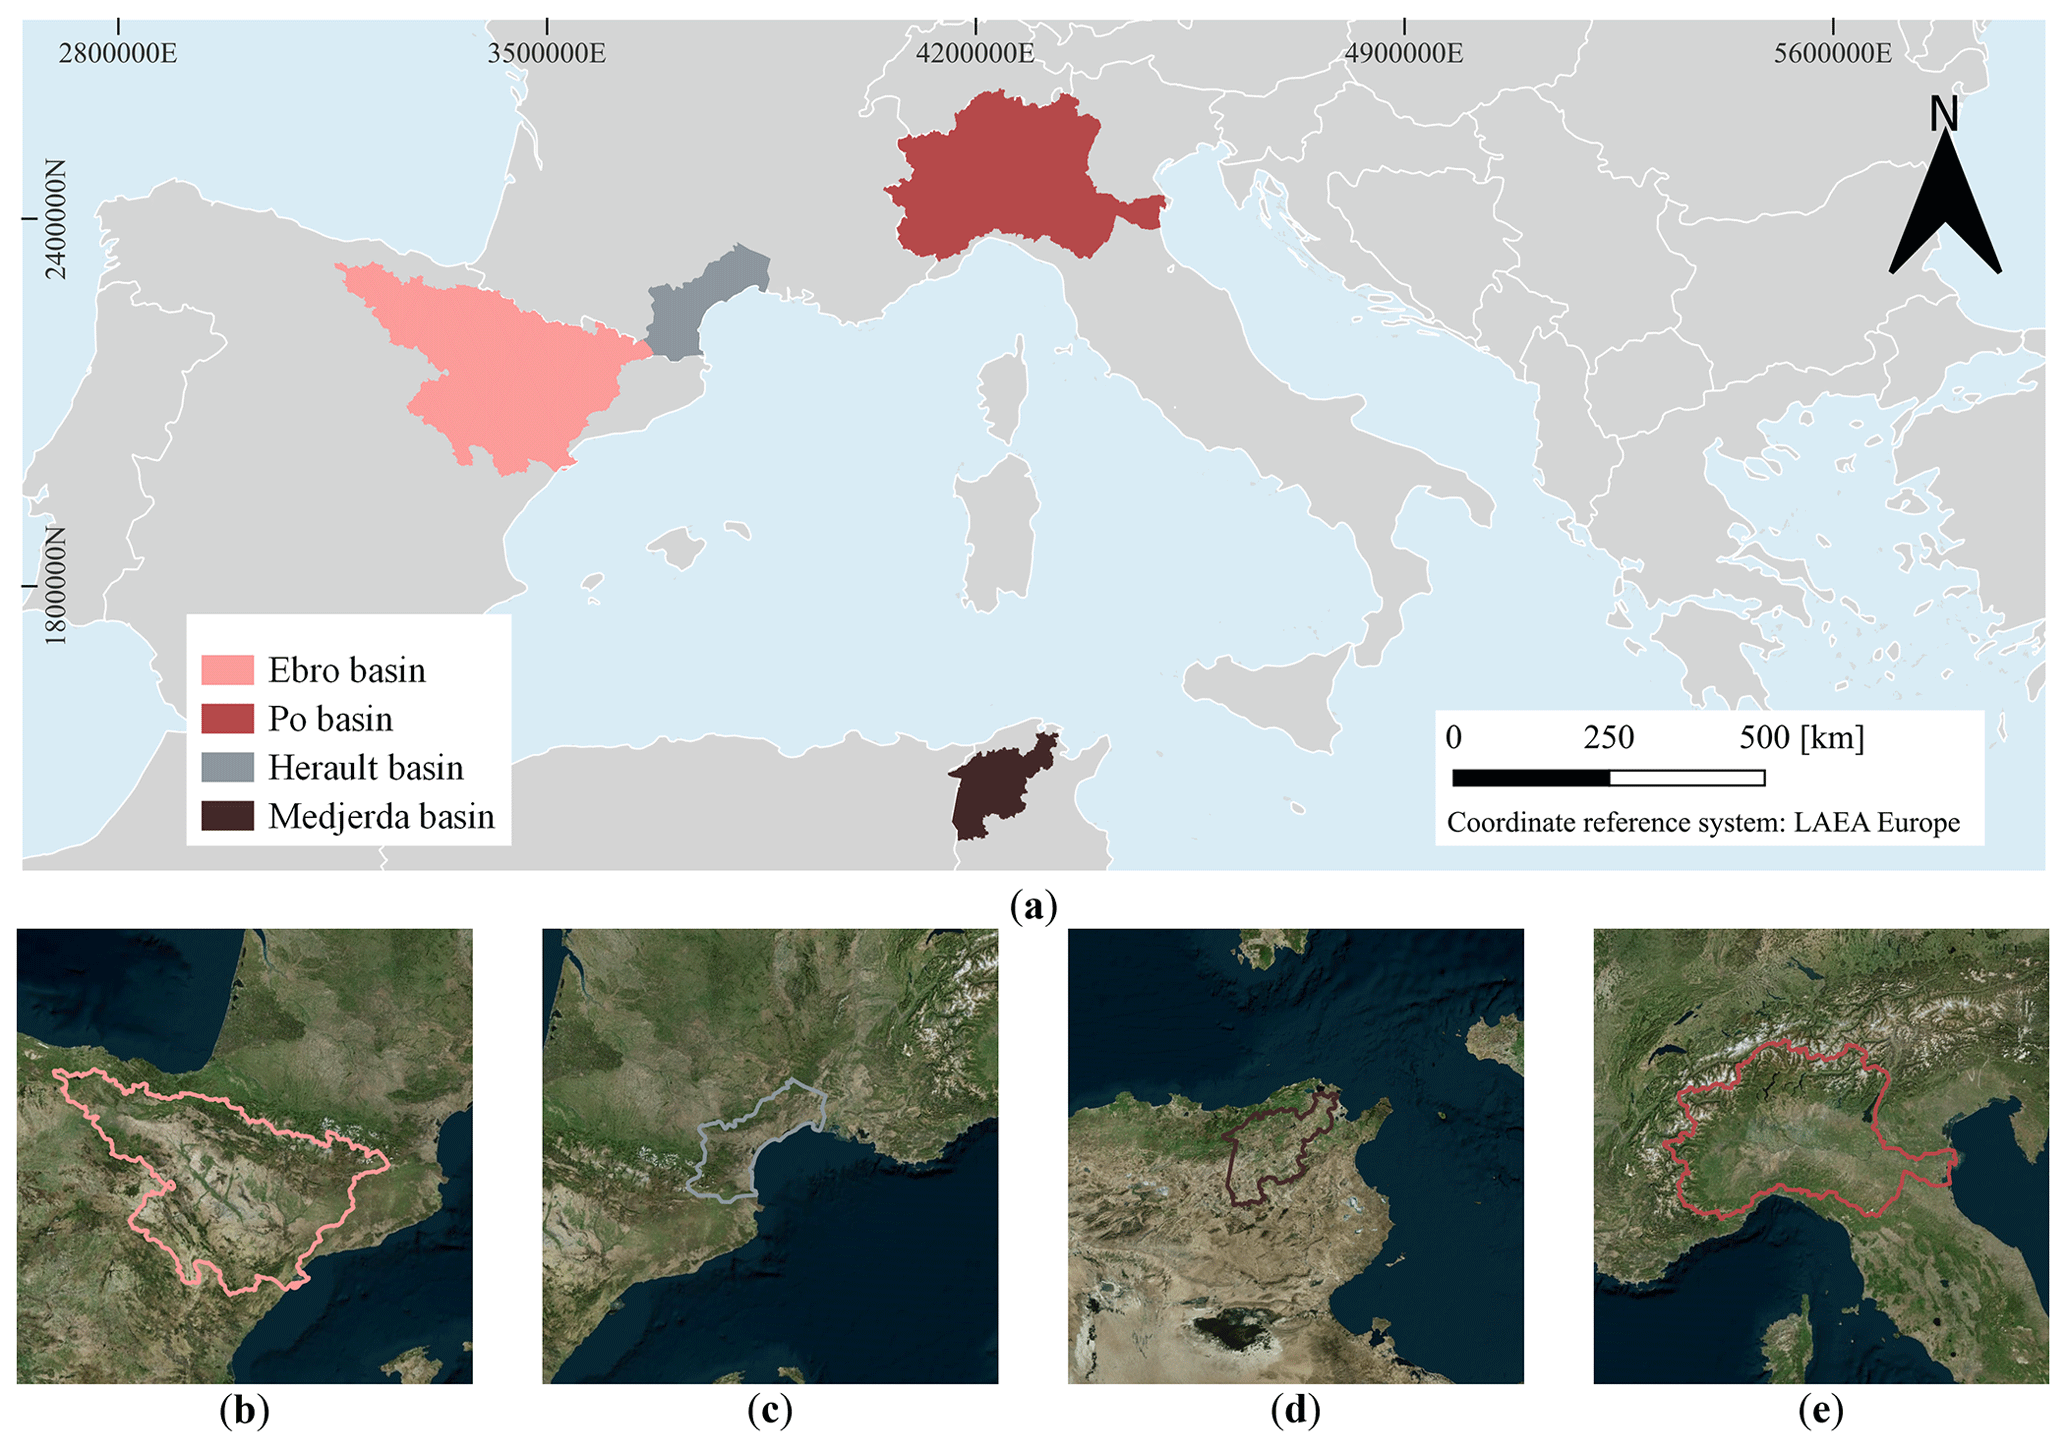
Figure 1Overview of the areas of interest. (a) General locations of the basins in the Mediterranean region. (b–e) Ebro, Hérault, Medjerda, and Po basins. All the figures were generated in QGIS using internal resources (a) and open-source layers provided by https://www.bing.com/maps (last access: 18 August 2023) (b–e) © Microsoft.
As demonstrated in Fig. 1, the Ebro basin (EB), with a total catchment size of about 85 500 km2, exhibits a diverse landscape, leading to varied climatic conditions. The EB experiences an oceanic and Mediterranean mountain climate in the north with an average annual air temperature (TAmean) ranging from 9 to 12 °C. Moving south-east, the climate transitions to warm oceanic, where TAmean ranges from 11 to 14 °C (Lorenzo-González et al., 2023). Precipitation patterns also vary across the region. The south-eastern part experiences low precipitation (350–700 mm yr−1), while the mountainous regions receive more rainfall, yielding 800–2000 mm yr−1 (Gaona et al., 2022). To meet the water demands of the entire EB, extensive canal systems have been developed, and around 92 % of the total water consumption is allocated to irrigation and farming (Barella-Ortiz et al., 2023). Similarly, in the Po basin (PB), which spans an approximate surface area of 71 000 km2, the climate and water resources are strongly influenced by the region's topography. The northern PB is known for its Alpine climate, and it is characterized by numerous water reservoirs commonly used for energy generation. The southern areas, despite having a lower water supply, play a vital role in agriculture due to their large water storage capacities and favourable terrain (Dari et al., 2023). TAmean in the Po basin varies across the region. In the mountains, TAmean ranges from 5 to 10 °C, while in the remaining zones it falls within the range of 10 to 15 °C (Musolino et al., 2017). Additionally, the average precipitation ranges from 700 to 1500 mm yr−1 (Filippucci et al., 2022). The coastal Languedoc-Roussillon (LR) region with the Hérault basin (HB) in southern France is another agriculture-oriented basin, with nearly 30 % of the arable land represented by vineyards (Cambrea et al., 2020). LR is primarily influenced by a Mediterranean climate characterized by hot, dry summers and mild winters. The southern sections of the Pyrenees exhibit nival climatic conditions. Similarly to the EB and PB, the HB follows a climatic gradient that is dependent on its geolocation. In the northern part, the yearly TAmean ranges around 8 °C, while precipitation reaches 1600 mm yr−1. In contrast, the southern part experiences higher temperatures, with TAmean surpassing 15 °C, and lower rainfall levels of around 600 mm yr−1 (Fabre et al., 2015). The Medjerda basin (MB) in Tunisia represents a catchment with drier and hotter climatic conditions compared to the other study sites. In fact, it is characterized by low annual precipitation varying between 350 and 600 mm, coupled with high annual temperatures averaging between 16 and 22 °C (Rajosoa et al., 2022). With an area of approximately 15 500 km2, the MB is the largest watershed in Tunisia, and thus it holds significant importance in terms of water supply for both domestic use and farming (Boulmaiz et al., 2022). Indeed, agriculture plays a dominant role, consuming the largest number of water resources and accounting for nearly 76 % of the total water volume available (FAO, 2020).
Given the hydro-demanding activities across the study sites, which include crop irrigation, energy production, mass tourism, and domestic water use, together with the challenges posed by extreme heatwaves and recurring droughts in recent years, daily ET maps at the river basin scale would be highly beneficial for supporting vegetation monitoring and sustainable water management practices (Gouveia et al., 2017).
2.2 In situ measurements
In this study, eddy covariance measurements collected in the framework of the European Fluxes Database Cluster (EFDC) are used to validate gridded ET products (Heiskanen et al., 2022). The EFDC is the European initiative that gathers and standardizes in situ fluxes from a wide range of eddy covariance (EC) networks (e.g. ICOS, InGOS, CarboItaly, and GHG-Europe) to facilitate their application among the scientific community worldwide. The database stores long-term measurements (since 1996) that are pre-processed and quality-controlled by providers before data submission to the system.
In this work, after deriving all measurements from the EFDC, all available EC records have been harmonized and made available as a multi-year file stack with a daily time step through the project-dedicated PostgreSQL database (https://edp-portal.eurac.edu/, last access: 10 February 2024). Consequently, ground-based EC data are analysed for eight stations located in the study's subdomains (see Sect. 2.1 for more details). The sites are represented by different vegetated land covers which include Alpine grasslands, forest, and vineyard ecosystems. As depicted in Table 1, five towers are located in mountainous regions above 1400 m a.s.l. and are covered by grasslands and forest, while the three remaining towers lie in forest and vineyard biomes in France and Italy at altitudes ranging from 1 to 270 m a.s.l. Considering the time span of the generated ET product, in situ measurements temporally overlap with Copernicus Sentinel-3 LST data acquired between 2017 and 2021.
Table 1Eddy covariance stations for validating gridded ET maps.
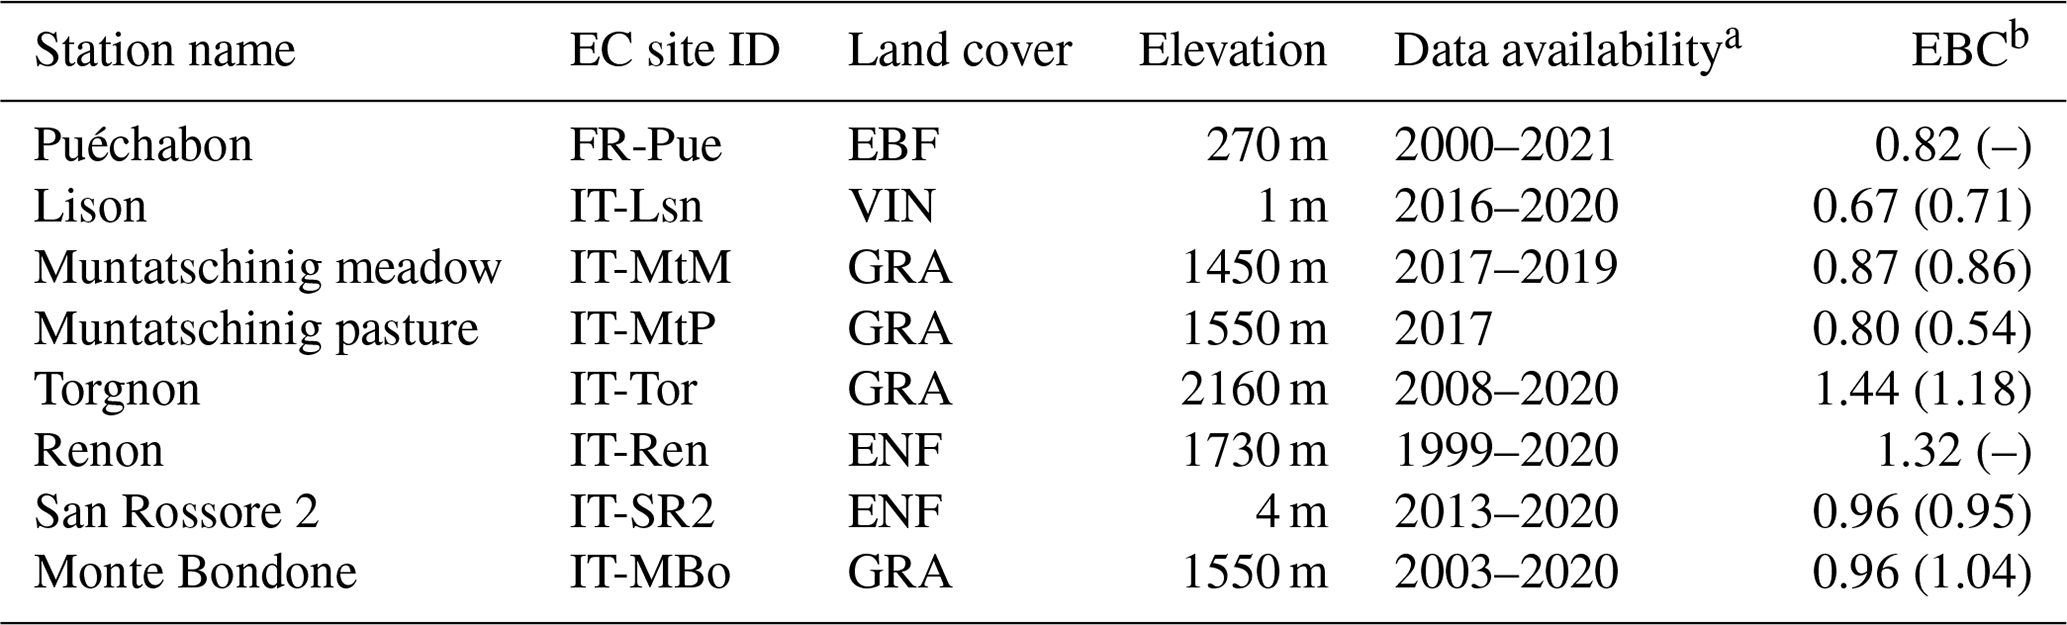
a Time span for raw local measurements before excluding years of non-interest. b EBC outside the parentheses corresponds to all available records at the sites, while the values in the parentheses are derived for the years 2017–2021. EBF: evergreen broadleaf forest; VIN: vineyard; GRA: grassland; ENF: evergreen needleleaf forest.
To derive daily ET observations with good quality, all in situ latent heat flux (LE) measurements collected at 30 min temporal resolution are first pre-processed to eliminate outliers (i.e. records smaller or greater than the 1st and 99th percentiles, respectively), duplicates, rainy events (>0 mm d−1), and eventually days with a subdaily coverage smaller than 25 % (Hulsman et al., 2023). Additionally, 30 min station records with low quality assurance (QA) are removed. In the case of missing QA flags, we exclude the corresponding instantaneous data records from further analysis. As a result, the number of ground measurements is reduced. Apart from that, the observations are checked for the energy balance closure (EBC) ratio (i.e. [] with Rn the net radiation, G the soil heat flux, and H the sensible heat flux), as shown in Table 1. Considering all available records at the flux sites, EBCs vary between 0.67 at IT-Lsn and 1.44 at IT-Tor, while for our years of interest (2017–2021) the average ratio ranges from 0.54 at IT-MtP to a maximum value of 1.18 at IT-Tor. Even though some stations either exceed unity (IT-SR2 and IT-Tor) or have smaller values than the acceptable threshold of 0.75 (IT-Lsn and IT-MtP), we include all locations in the validation process due to the small number of flux sites available over the basins (Pastorello et al., 2020). After the quality checks, the local ET observations are estimated using the approach proposed by Allen et al. (1998). Specifically, latent heat flux (W m−2) is converted to daily ET (mm d−1) using the following formula:
where ρw is the water density (1000 kg m−3) and L is the latent heat of vaporization (2.25×10⁶ J kg−1). After the equation transformation, the tower-derived ET is estimated and then compared against the 100 m ET product as described in the next sections of this paper.
2.3 Gridded data
Multi-source ESA Copernicus data to estimate the actual ET are used in this study: satellite, meteorological, and ancillary remotely sensed variables. This section outlines the source datasets and accompanying pre-processing steps involved before the main processing chain for deriving ET. Table 2 provides a comprehensive overview of all gridded variables utilized for the ET modelling. It should be mentioned that in Sect. 3 we present more details on all Copernicus-based outputs at the intermediate and final processing stages with cloud computing resources.
Table 2Gridded data used in this study.
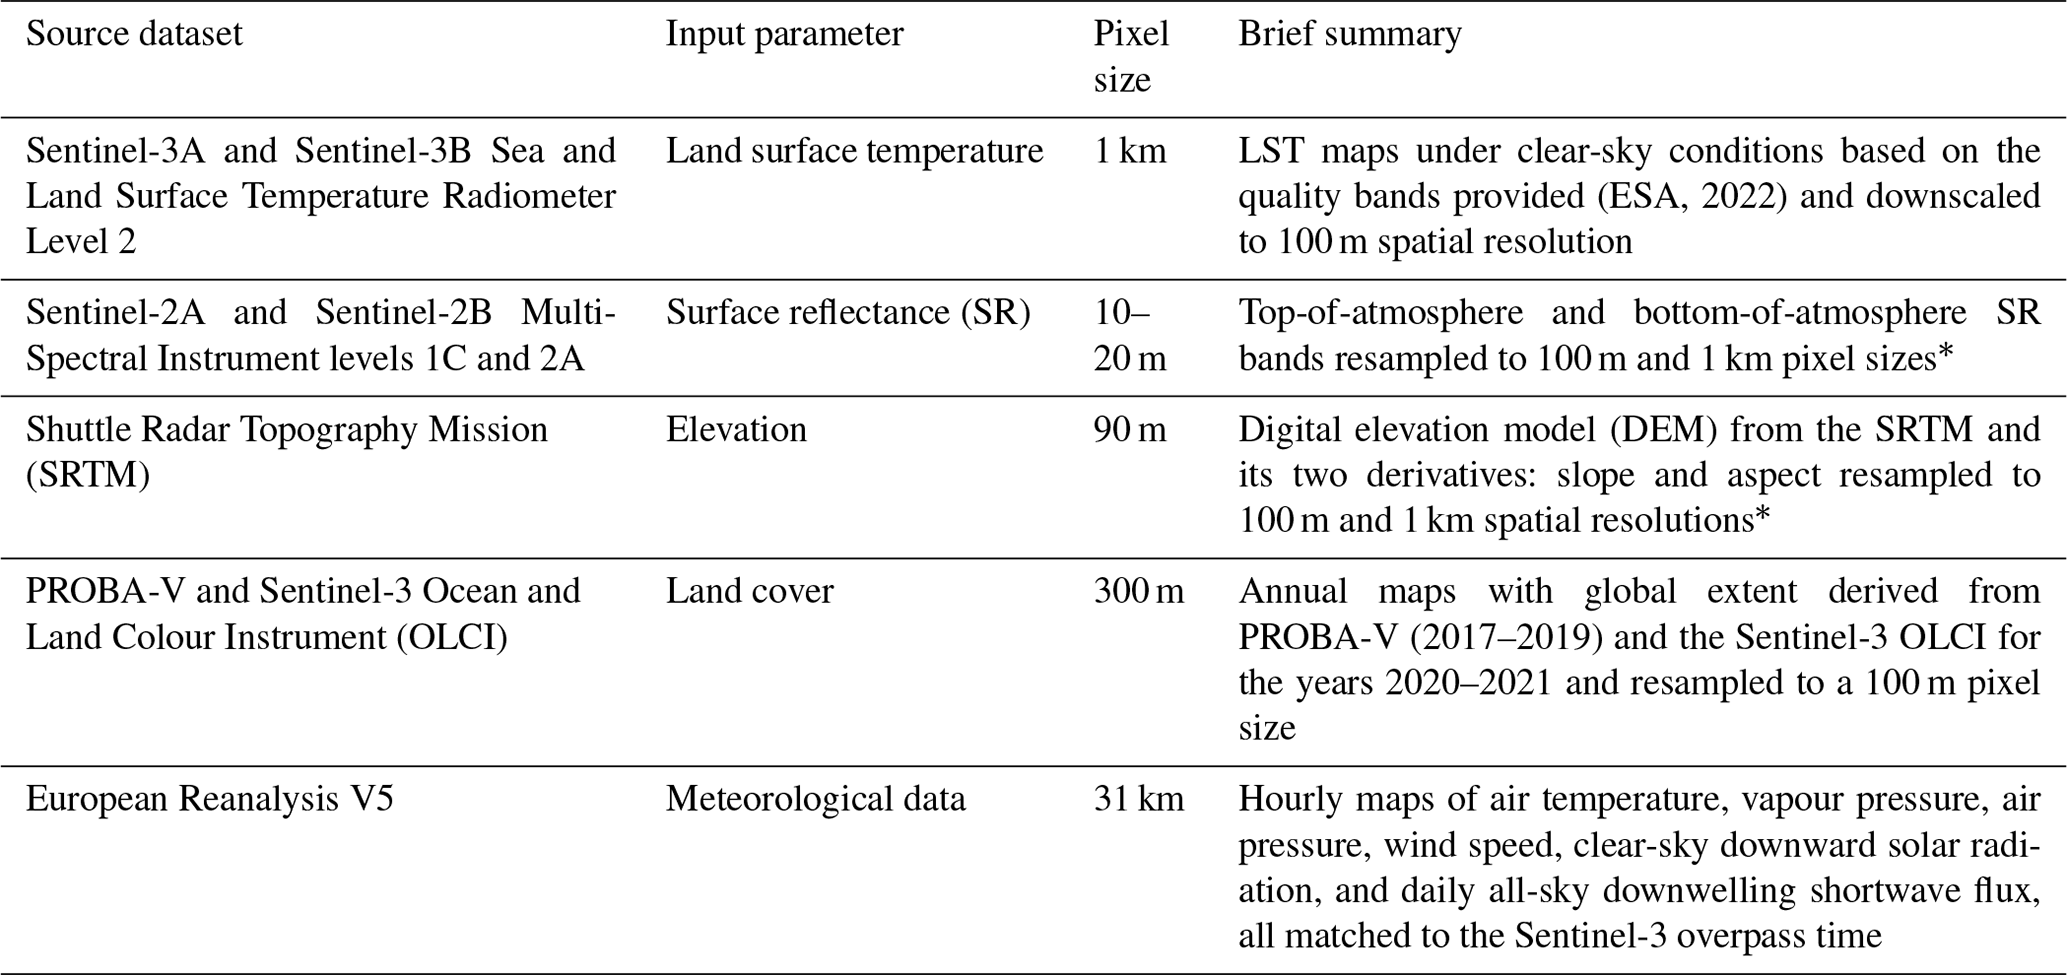
∗ Both the 1 km and 100 m datasets are utilized for data-driven thermal downscaling, while the 100 m intermediate outputs are incorporated directly into the ET model.
In this work, the ET model is forced by Copernicus satellite data, including daily 1 km Sentinel-3 LST maps and fine-spatiotemporal-resolution Sentinel-2 MSI imagery (10–20 m, 2–5 d revisit time), all derived for the years 2017–2021. Land surface temperature, as a crucial forcing parameter for the ET model, corresponds to daytime S3 acquisitions under clear-sky conditions. Simultaneously, biophysical variables and shortwave bands at 100 m resolution are derived from the original S2 on the bottom-of-atmosphere (S2L2A) reflectance maps with a total spatial coverage of 52 Sentinel-2 tiles (Table 2). In the case of missing S2L2A, we first pre-process Sentinel-2 Level 1C (S2L1C) to derive atmospherically corrected S2 scenes, as explained in the next sections of this paper. In this work, daytime land surface temperature images, as a crucial forcing parameter for estimating turbulent fluxes, are derived from Sentinel-3A and Sentinel-3B SLSTR data. In this regard, we extract specific bands from 1 km S3 products, including LST and cloud masks, along with Sun and S3 sensor geometries. Due to the two-satellite constellation since June 2018, Sentinel-3 acquisitions with minimum viewing zenith angles (VZAs) are selected when multiple scenes on the same day are captured. The reason for that choice is motivated by the fact that a larger VZA has a more negative impact on surface temperature accuracy due to angular anisotropy in the thermal infrared spectrum. To derive surface biophysical variables for ET modelling, the constellation of the Sentinel-2 MSI (both A and B) is exploited and, in particular, nine 10–20 m reflectance bands from the VSWIR region are extracted. In addition, the resulting S2L2A shortwave channels are used as 100 m predictor variables to downscale 1 km Sentinel-3 SLSTR LST data. More details on satellite data preparation are given in the next sections of this paper.
To run the ET processing chain, two other satellite-driven products are also used: 300 m Copernicus Climate Change Initiative (CCI) land cover (LC) maps (https://www.esa-landcover-cci.org/, last access: 22 July 2023; ESA, 2017) and elevation data obtained from the 90 m Shuttle Radar Topography Mission (SRTM). The first one is derived through the Climate Data Store (CDS) API client in Python as explained at https://cds.climate.copernicus.eu/ (last access: 16 May 2023), while the digital elevation model (DEM) is automatically downloaded from the dedicated SRTM database that is available online (https://srtm.csi.cgiar.org, last access: 16 February 2023; NASA JPL, 2013). After data download, both inputs are resampled to 100 m resolution to be ready for ET model runs. Despite the pixel size discrepancy between inputs and the ET product, this choice is determined by temporal coverage of the CCI LS data (2017–2021), with specially designed lookup tables for estimating ancillary parameters to force the TSEB-PT model, such as canopy height, fractional vegetation cover, average leaf size, and canopy shape. In the case of elevation, we select a 90 m SRTM DEM product due to its ET-like spatial resolution. Apart from that, DEM information is used as an input predictor to downscale 1 km Sentinel-3 LST and to topographically correct ERA5 parameters following the strategy proposed by Guzinski et al. (2021).
Meteorological parameters, which are essential input variables for ET estimation, are derived from high-frequency European Reanalysis V5 climate data provided by the European Centre for Medium-Range Weather Forecasts (ECMWF) and are downloaded from the CDS for the period 2017–2021 (Hersbach et al., 2020). As forcing inputs for the TSEB-PT model, we use meteorological observations that include air temperature (TA), vapour pressure (VP), wind speed (both u and v components), surface pressure (SP), and two ERA5 solar radiation components: all-sky shortwave downwelling fluxes and clear-sky downward shortwave radiation (SW) temporally matched to the Sentinel-3 SLSTR overpass time. Hourly SW datasets are selected rather than all-sky downwelling solar irradiance due to an assumption of clear-sky conditions during S3 acquisitions being incapable of penetrating clouds. The ERA5 dataset is used to estimate input parameters, like net shortwave radiation and longwave irradiance, and then to derive instantaneous energy fluxes and extrapolate latent heat flux to daily time steps.
3.1 General framework
This study aims to develop an automatic workflow for generating Copernicus-based daily ET datasets at 100 m resolution from 2017 to 2021. Sub-kilometre ET mapping is considered a reasonable scale in the Mediterranean basins characterized by complex topography and highly patched land cover, where 1 km ET maps might not fully represent spatial heterogeneities of the land surface (Massari et al., 2021). In general, the entire workflow to produce a daily 100 m ET product consists of two steps: (1) input parameter preparation and (2) TSEB-PT modelling of ET (Fig. 2). In the following sections we describe each processing chain in more detail.
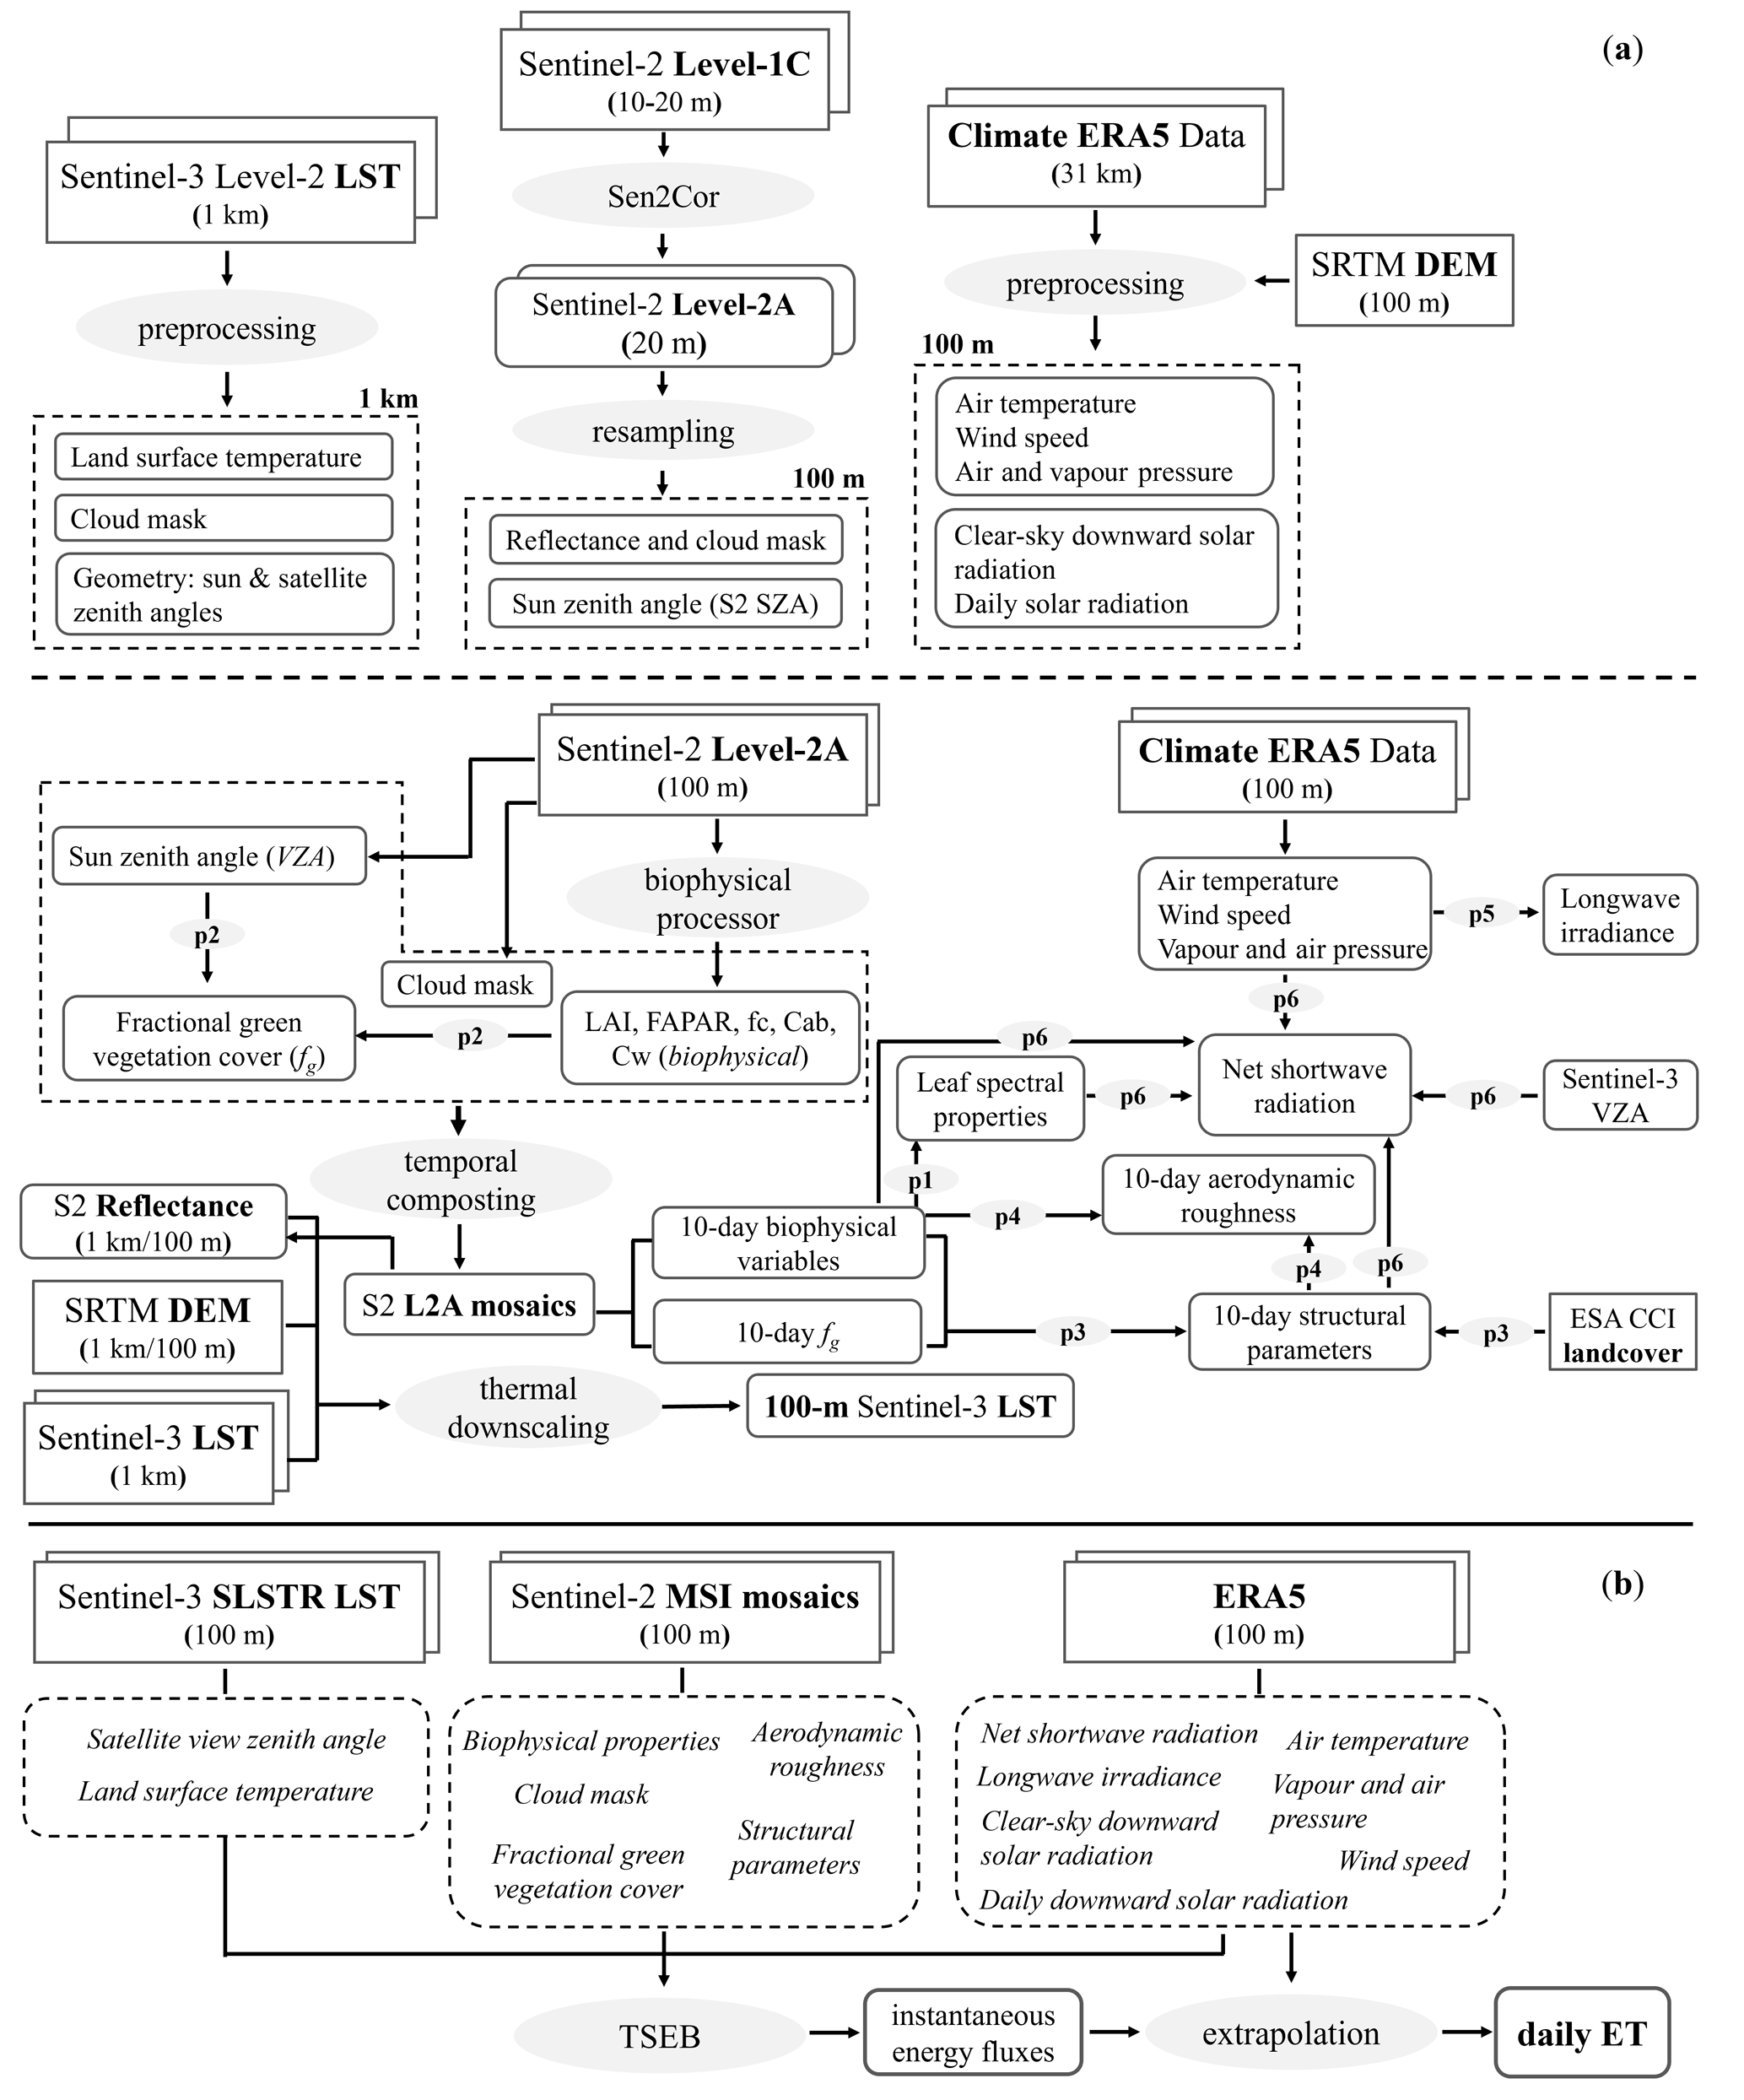
Figure 2Schematic flowchart of the whole ET process, including (a) source data pre-processing (the top row) and input retrievals for the Priestley–Taylor Two-Source Energy Balance modelling (the lower line) and (b) daily ET estimation at 100 m resolution. While the processes are represented by the ovals (e.g. pre-processing, thermal downscaling, TSEB-PT modelling, and intermediate p1–p6), the rectangles stand for the source parameters, and the round rectangles indicate intermediate and final results.
Owing to the large-scale ET modelling and its related high computational and memory requirements, we distribute our work on multiple virtual machines. We implement the processing flow with the setup on Ubuntu v20.04 LTS using two geospatial cloud computing platforms offered by the EODC (https://eodc.eu/, last access: 15 June 2023) and the ESA high-performance computing (HPC) cluster of CloudFerro (https://cloudferro.com/, last access: 11 July 2023). The main advantage of this solution is the direct access to satellite data and the capability to facilitate big data processing more robustly. Apart from these resources, two internal units of Eurac Research with Ubuntu v18.04 LTS are deployed on VMware machines (https://www.vmware.com/). In this case, EO data are directly downloaded from the ESA Copernicus Open Access Hub (https://scihub.copernicus.eu/, last access: 9 January 2023). The multiple selection of cloud providers has two reasons. First, the entire procedure for deriving ET maps at 100 m resolution is complex (see Fig. 2), which translates into big requirements in terms of disk space, computing memory, and processing time. For example, a 5-year dataset (2017–2021), including intermediate and final outputs over one Sentinel-2 tile, requires around 600 GB. Secondly, we diversify our processing workflows into many computing units due to their accessibility offered by the ESA Network of Resources (NoR) sponsorship programme. Furthermore, in the framework of the 4DMed-Hydrology project, Eurac Research was asked to test the new ESA HPC infrastructure considering the high-volume processing of the entire workflow presented in this study.
To keep the data pipeline consistent over the multiple platforms, we harmonize the entire workflow by creating a unique Conda environment on all our machines. ET outputs are obtained by automatizing entire routines, including baseline ESA SNAP Graph Processing Tool (GPT) algorithms and Python baseline codes developed in the framework of the Sen-ET project (https://www.esa-sen4et.org, last access: 16 October 2023). For more specific details on the data (pre-)processing for both satellite and meteorological parameters, we recommend visiting the open-source GitHub repository available at https://github.com/DHI-GRAS/ (last access: 16 October 2023). The repository includes codes that calculate necessary inputs for the TSEB-PT model.
3.2 Input parameter preparation
Considering multi-source datasets in conjunction with their different processing levels and spatial scales, the primary step of our workflow includes source data pre-processing and input preparation to force the Priestley–Taylor Two-Source Energy Balance model (Table 2, Fig. 2a).
First, we spatially aggregate 20 m Sentinel-2 Level-2A reflectances and their geometries to a 100 m pixel size with an arithmetic mean function. In this study, we select a resolution of 100 m for the ET product rather than the original 20 m S2 cell size. Prior to the final modelling, we tested the impact of the spatial resolution of input variables on the final ET estimates considering the above-mentioned pixel dimensions. ET simulations forced by the 20 and 100 m parameters gave similar results, and thus the latter solution was chosen as a trade-off between high spatial resolution and storage use along with computing speed. In addition, to the best of our knowledge, long-term high-resolution ancillary variables, e.g. elevation and land cover at spatial resolution <100 m, are not freely available for incorporation into the entire workflow.
Nevertheless, S2L2A preparation is challenging, mainly due to incomplete time series on the EODC service. This requires copying of missing datasets, either from CloudFerro or from the Copernicus Open Access Hub. Apart from that, Sentinel-2 data over the Medjerda basin in Africa between 2017 and mid-2018 are not available on all the platforms (last accessed on 9 January 2022). As shown in Fig. 2a, in that case S2L1C scenes are first pre-processed with a Sen2Cor processor to obtain atmospherically corrected 20 m S2L2A granules together with a scene classification layer for cloud removal afterwards (Main-Knorn et al., 2017). Since the time frame of this work covers the years 2017–2021, it is necessary to use two different versions of Sen2Cor. Indeed, Sen2Cor 2.5.5 is able to ingest only those data belonging to 2017–2021, while S2 scenes from 2022 need to be processed using Sen2Cor 2.10.01. To solve this problem, we set up two different docker containers for the two Sen2Cor versions. After checking the acquisition date of the input data, the bash script is run considering the time overlapping Sen2Cor releases. Due to straightforward Sen2Cor cloud mask retrieval and its well-established workflow, we decided to apply this approach to the entire Sentinel-2 time series.
Next, S2-driven biophysical parameters, including LAI, canopy height (hC), and fractional vegetation cover (fC), are produced using the S2 Toolbox Biophysical Processor (Weiss et al., 2016; Xie et al., 2019). The entire procedure requires eight Sentinel-2 L2A bands acquired in the VSWIR electromagnetic spectrum together with geometry information, like Sun and sensor zenith angles. LAI retrieval is a hybrid approach based on an inversion of the PROSAIL radiative transfer model simulations of S2 canopy reflectance using neural network modelling. More details on estimating biophysical variables are provided by Weiss et al. (2016). At the same time, the fraction of green vegetation (fg) is generated by incorporating the S2 VZA and biophysical variables as input parameters (Fig. 2b). To minimize the cloud cover effect in the Sentinel-2 product, all the above-mentioned outputs are mosaicked using a 10 d window with respect to Sentinel-3 overpass dates. This means that time-coincident Sentinel-2 granules are temporally ranked, and good-quality pixels with possibly the closest date to S3 acquisition are selected. The entire procedure is developed in SNAP GPT to be run in an automated manner over the entire image collection. Next, 10 d composites are utilized in conjunction with other ET model parameters, like 100 m CCI land cover, to derive the remaining inputs, including aerodynamic roughness, along with vegetation structural and spectral properties as shown in Fig. 2b. In addition, atmospherically corrected surface reflectance bands are resampled to 1 km spatial resolution to sharpen daily Sentinel-3 LST data.
As outlined in Sect. 2.3, we use the satellite-based LST from 1 km Sentinel-3 SLSTR Level-2 data to estimate the actual ET. Given the sensitivity of TIR instruments to overcast conditions, all cloudy pixels are eliminated with respect to the cloud-in mask provided with the SL_2_LST product. Next, the S3 datasets are cropped according to Sentinel-2 tiles (https://sentinels.copernicus.eu/web/sentinel/missions/sentinel-2/data-products, last access: 7 January 2022) and re-projected onto the World Geodetic System 1984 (WGS84) coordinate system for synergistic use with Sentinel-2 data afterwards.
Notably, it should be mentioned that CloudFerro provides different versions of Sentinel-3 LST in terms of cropping schemes, baseline collections, and related software versions for data processing. This hinders the immediate use of the data and requires an investment of time to analyse the quality of the data and choose the proper version, and thus S3 LST processing needs to be preceded by data checks and proper filtering. In general, it is recommended that the newest baseline collection v4 be chosen rather than a product with baseline collection v3, as v4 is re-processed using upgraded software after major evolutions.
While taking advantage of complementary Sentinel-2 and Sentinel-3 instruments, we sharpen the 1 km S3 SL_2_LST product to derive enhanced surface temperatures at a spatial resolution corresponding to our ET product (Fig. 2a). Thermal downscaling is based on the data mining sharpener (DMS) approach proposed by Gao et al. (2012). It has been successfully applied in many studies to enhance the spatial consistency of LST grids (Anderson et al., 2021; Guzinski et al., 2020; Sánchez et al., 2023; Yang et al., 2021). As presented in Guzinski and Nieto (2019), TSEB-PT driven by downscaled DMS-based surface temperatures is more robust compared to ET estimates driven by the original 1 km LST data, with an increase in the Pearson correlation coefficient (R) of around 13 % between in situ ET and their corresponding modelled observations. The DMS method incorporated into the Priestley–Taylor Two-Source Energy Balance modelling pipeline has also been demonstrated to be more performant than evapotranspiration estimates derived from the METRIC (Mapping Evapotranspiration with Internalized Calibration) and End-member-based Soil and Vegetation Energy Partitioning (ESVEP) models at 11 flux tower sites across different vegetation types and climate zones (https://www.esa-sen4et.org/downloads/prototype_evaluation_v1.3.pdf, last access: 16 June 2022). On average, TSEB-PT achieved a consistently lower RMSE and higher correlation for latent fluxes, yielding an RMSE of 90 W m−2 and an R exceeding 0.7, which largely outperform METRIC and ESVEP by more than 11 % and 30 % for RMSE and R, respectively. Moreover, Sánchez et al. (2023) conducted an extensive study on the performance of LST downscaling in Spain and, based on their validation results with in situ measurements, the DMS approach gave an RMSE nearly 2 times smaller than the 1 km S3 LST. In addition to the above-mentioned literature review, in our co-authored paper we compared Sen-ET outcomes with other evapotranspiration products, including 3 km MSG SEVIRI and 70 m ECOSTRESS ET, which on average yielded less robust accuracy metrics than our 100 m retrievals (De Santis et al., 2022). In this regard, the kernel-driven regressions are obtained from the bagging ensemble of the decision tree (DT) algorithm that reduces the risk of model overfitting. In this study, the DMS approach predicts land surface temperature at 100 m spatial resolution by exploiting empirical relationships between coarse LST grids and high-resolution explanatory variables for each Sentinel-3 acquisition date. The functional relationship between clear-sky Sentinel-3 LST data and explanatory variables is based on 10 d S2 reflectance composites in conjunction with DEM and shortwave irradiance incident angles at S3 overpass times derived from the SRTM-based slope and aspect grids (Fig. 2b). The DMS method simultaneously establishes global (within the 100 km S2 tile) and local (30-by-30 Sentinel-3 pixels within a moving window) regression models and then fuses these two estimates as their weighted linear combination to increase the number of samples for model training, also capturing thermal heterogeneity at the local scale. Consequently, downscaled LST maps are derived by applying daily models to the HR predictors while forcing energy conservation between the original Sentinel-3 images and sharpened granules. The entire procedure is performed in the blending phase by applying a weight to global and local estimates based on residual correction between the original LST and the 100 m S3 image sharpened with two regression schemes. This means that LST pixels with a lower bias result in greater weight, while grid cells with larger residuals have a smaller impact on the final LST estimation.
Given a wide range of fine-resolution predictors (<100 m) and their high revisit times (2–5 d), the enhancement method in the spatial domain is selected rather than the image fusion approach that increases the temporal availability of high-spatial-resolution LST images by exploiting (sub)daily observations from coarse-resolution TIR scanners (Sun et al., 2017; Yang et al., 2017). As mentioned before, the DMS method belongs to well-established downscaling approaches, and its recent open-source implementation increases its visibility among users (Guzinski and Nieto, 2019). Furthermore, TSEB-PT has been constantly updated to enhance the modelling strategy for thermal sharpening and, as reported by Guzinski et al. (2023), the enhanced DMS achieved better results, translating into improvements of up to 1.5 K in accuracy of downscaled LST and an average RMSE of 0.8 mm d−1 for daily ET. The successful applications of the DMS procedure for deriving high-spatial-resolution ET, as shown in many research studies before, moved us towards generation of a 100 m ET dataset, assuming its better performance in different land covers and climates compared to the original S3-driven TSEB-PT estimates at 1 km resolution. Nevertheless, considering the terrain complexity and patched land cover of our study areas compared to the above-mentioned studies, where the majority of the flux towers are located in relatively homogenous environments (Table 1), we additionally evaluated the performance of the ET model forced by the original 1 km Sentinel-3 SLSTR versus ET forced by 100 m DMS-derived inputs.
ECMWF ERA5 climate datasets also require pre-processing prior to inclusion in the Two-Source Energy Balance model. All extracted variables from the reanalysis dataset (see Sect. 2.3 for more details), except for wind speed, are corrected for terrain effects using the SRTM DEM product (Fig. 2a). Similar to instantaneous variables, all-sky shortwave downwelling fluxes are first enhanced by accounting for topography orientation (i.e. illumination conditions) and an hourly cloud cover factor derived from SW and are then interpolated to daily observations. Considering the better representativeness of low-resolution meteorological parameters at the blending height of 100 m rather than 2 m above the ground, TA, VP, and SP are recalculated at that height (Guzinski et al., 2021). Daily average solar radiation is obtained by interpolating hourly ERA5 shortwave downward irradiance over a 24 h period starting at midnight local time. Next, the product is used to extrapolate instantaneous latent flux to daily ET. After calibrating the ERA5 components, we prepare specific radiative fluxes for deriving instantaneous energy fluxes corresponding to Sentinel-3 overpasses. In this regard, meteorological input is utilized to compute longwave irradiance, and then instantaneous net shortwave radiation is derived from Sentinel-3 VZA imagery and 10 d Sentinel-2 composites of structural and biophysical parameters (Fig. 2a).
3.3 TSEB-PT modelling of ET
In this work, we utilize the Priestley–Taylor Two-Source Energy Balance model driven by ESA Copernicus data (Fig. 2) to produce daily evaporation maps over the Mediterranean region (Norman et al., 1995; Kustas and Norman, 1999). The main advantage of the model over heterogenous areas is the fact that TSEB-PT considers the soil (S) and canopy (C) to be two distinct components and employs a two-layer approach to estimate latent (LE) and sensible heat (H) fluxes for each element separately:
where Rn denotes the net radiation (W m−2), LE represents the latent heat flux (W m−2), H represents the sensible heat flux (W m−2), and G stands for the soil heat flux (W m−2). Unlike other satellite-based methods, the model minimizes the number of input parameters, and its relative simplicity makes it an ideal candidate for high-volume processing (Kustas and Anderson, 2009). The net radiation subcomponents (RnS and RnC) are calculated following the methodology presented by Campbell and Norman (1998). HS (HC) is determined by evaluating the temperature gradient between the soil (canopy) and TA at a reference height, as described by Guzinski et al. (2020). The primary remotely sensed variables required by the model are land surface temperature, which represents the combined effect of both soil and canopy, and fractional vegetation cover (fC), which is used to partition the energy between vegetation cover and soil. As the surface temperatures of soil (LSTS) and vegetation (LSTC) are unknown, TSEB-PT divides LST into soil and canopy temperatures based on the fractional vegetation content, which is parameterized by the leaf area index (Guzinski et al., 2014):
TSEB-PT employs an iterative procedure to calculate LSTS and LSTC, along with their respective soil (canopy) sensible heat fluxes HS (HC). The entire process of determining LSTS, HS, LSTC, and HC commences with an initial estimation of canopy transpiration () based on the Priestley–Taylor coefficient αPT (Priestley and Taylor, 1972):
where Δ is the slope of the vapour pressure versus the air temperature and γ is the psychometric constant (kPa K−1). Using an initial , the sensible heat flux from vegetation is calculated as the residual term of the energy balance (Eq. 3). Consequently, LSTC is obtained from the estimated HC and air temperature as explained in Nieto et al. (2019). Next, LSTS is obtained using Eq. (4) and, subsequently, the soil sensible heat flux is derived. Finally, LES is determined as the residual flux from Eq. (2), which ensures energy balance closure. The resistance term is formulated following the approach proposed by Kustas and Norman (1999). The entire iterative process to derive turbulent fluxes terminates when the soil latent heat flux reaches a non-negative value. If the obtained does not yield a physically realistic solution, the αPT (with an initial value of 1.26) is successively modified by decreasing it until a physically realistic solution is obtained (Norman et al., 1995; Kustas and Norman, 1999). More details on TSEB-PT may be found in many research studies (Chintala et al., 2022; Guzinski et al., 2020; Hoffmann et al., 2016; Nieto et al., 2019) and in an open-source GitHub repository written in Python at https://github.com/hectornieto/pyTSEB (last access: 16 October 2023).
In this study, the TSEB-PT model is forced with gridded inputs, including Sentinel products in conjunction with ERA5 climate parameters for deriving 100 m instantaneous energy fluxes corresponding to Sentinel-3 overpasses. As shown in Fig. 2b, radiometric temperature and its viewing zenith angle are sourced from the S3 LST product, while biophysical input parameters, like chlorophyll- and water-based leaf reflectance and transmittance fC and its green component fg, are derived from 10 d Sentinel-2 mosaics (see Sect. 3.2 for more details). While vegetation structural parameters, including leaf angle distribution and canopy width-to-height ratio variables, are used to compute the clumping index for quantifying the foliage distribution, aerodynamic roughness length and zero-plane displacement height serve as inputs for parameterizing the resistances required by TSEB-PT. As summarized in Fig. 2b, apart from S3 LST- and S2 SR-driven variables, hourly ERA5 derivatives are utilized. In this regard, meteorological observations, which include air temperature, wind speed, vapour, and air pressure, are interpolated on a 30 min timescale fitted to Sentinel-3 acquisitions and are then applied to the model. Furthermore, longwave irradiance and net shortwave radiation are incorporated into TSEB-PT to estimate the energy exchange between the surface and the atmosphere. After energy fluxes are obtained (e.g. LE, H, Rn, and G), the total latent heat flux is extrapolated to daily ET estimates over each S2 tile using the all-sky ERA5 daily solar irradiance. The last step of the processing flow involves the generation of daily ET maps for our subdomains, i.e. the Po, Ebro, Hérault, and Medjerda basins. This is achieved by averaging mosaic spatiotemporal tiles using a specially developed compositing algorithm as described in Sect. 4 of this paper.
3.4 ET validation
To access the quality of the daily 100 m ET product, we validate our results using local measurements collected by eddy covariance systems (Pastorello et al., 2020) and compare the model performance with ET retrievals forced by 1 km Sentinel-3 LST. In this regard, we perform ground-based validation by exploiting relationships between in situ daily latent heat fluxes and ET estimates derived from TSEB-PT. As mentioned in Sect. 2.2, before the validation, LE values are converted to ET estimates expressed in millimetres per day (Allen et al., 1998), and then the resulting datasets are spatiotemporally matched to the 5-year ET dataset (2017–2021). Validation of gridded TSEB-PT outputs requires information on the spatial range of EC towers. Due to methods requiring parameters to estimate two-dimensional flux footprints, such as the Flux Footprint Prediction climatology proposed by Kljun et al. (2015), two simplified validation strategies are chosen: pixel-wise and buffer strategies within a 100 m grid cell and with a 50 m radius, respectively. While the first approach is based on the direct extraction of pixel values to points, for the latter method satellite-based TSEB-PT simulations are derived within a 50 m extent around each EC site considering the percentage contribution of each overlapping 100 m pixel in that zone. TSEB-PT validation is performed when ET data cover at least 50 % of the total buffer area. In this work, the discrepancies between modelled and observed ET values are evaluated by means of statistical accuracy metrics that include the RMSE, Pearson correlation coefficient, and mean bias. They are calculated as follows:
where xi stands for the ground-based value on day i, yi denotes the predicted value from the TSEB-PT model for a daily observation i, and n is the number of matching observations incorporated into the validation process.
4.1 Evaluation of the daily ET at the EC sites
The performance of the ET maps is evaluated against in situ ET data derived from the EFDC database over grassland (IT-MBo, IT-MtM, IT-MtP, and IT-Tor), forest (FR-Pue, IT-Ren, and IT-SR2), and vineyard at the Lison site (IT-Lsn). First, we examine the overall relationships between local ET- and TSEB-PT-based estimates under clear-sky conditions together for all the sites (Fig. 3a). As illustrated in the global scatterplot, the linear regression analysis over all the sites with the pixel-wise (buffer) approach generates on average an RMSE and R of 1.38 mm d−1 (1.39 mm d−1) and 0.60 (0.59), respectively. Due to insignificant differences between the two validation strategies applied, in the rest of this study we focus on the point-based approach.
Note that, even though half of the EC towers cover the 4 years between 2017 and 2020 as shown in Table 2, data filtering and its related quality checks together with the necessity to match in situ points with gridded ET values result in a lower number of paired observations for the validation (Table 2, Fig. 3).
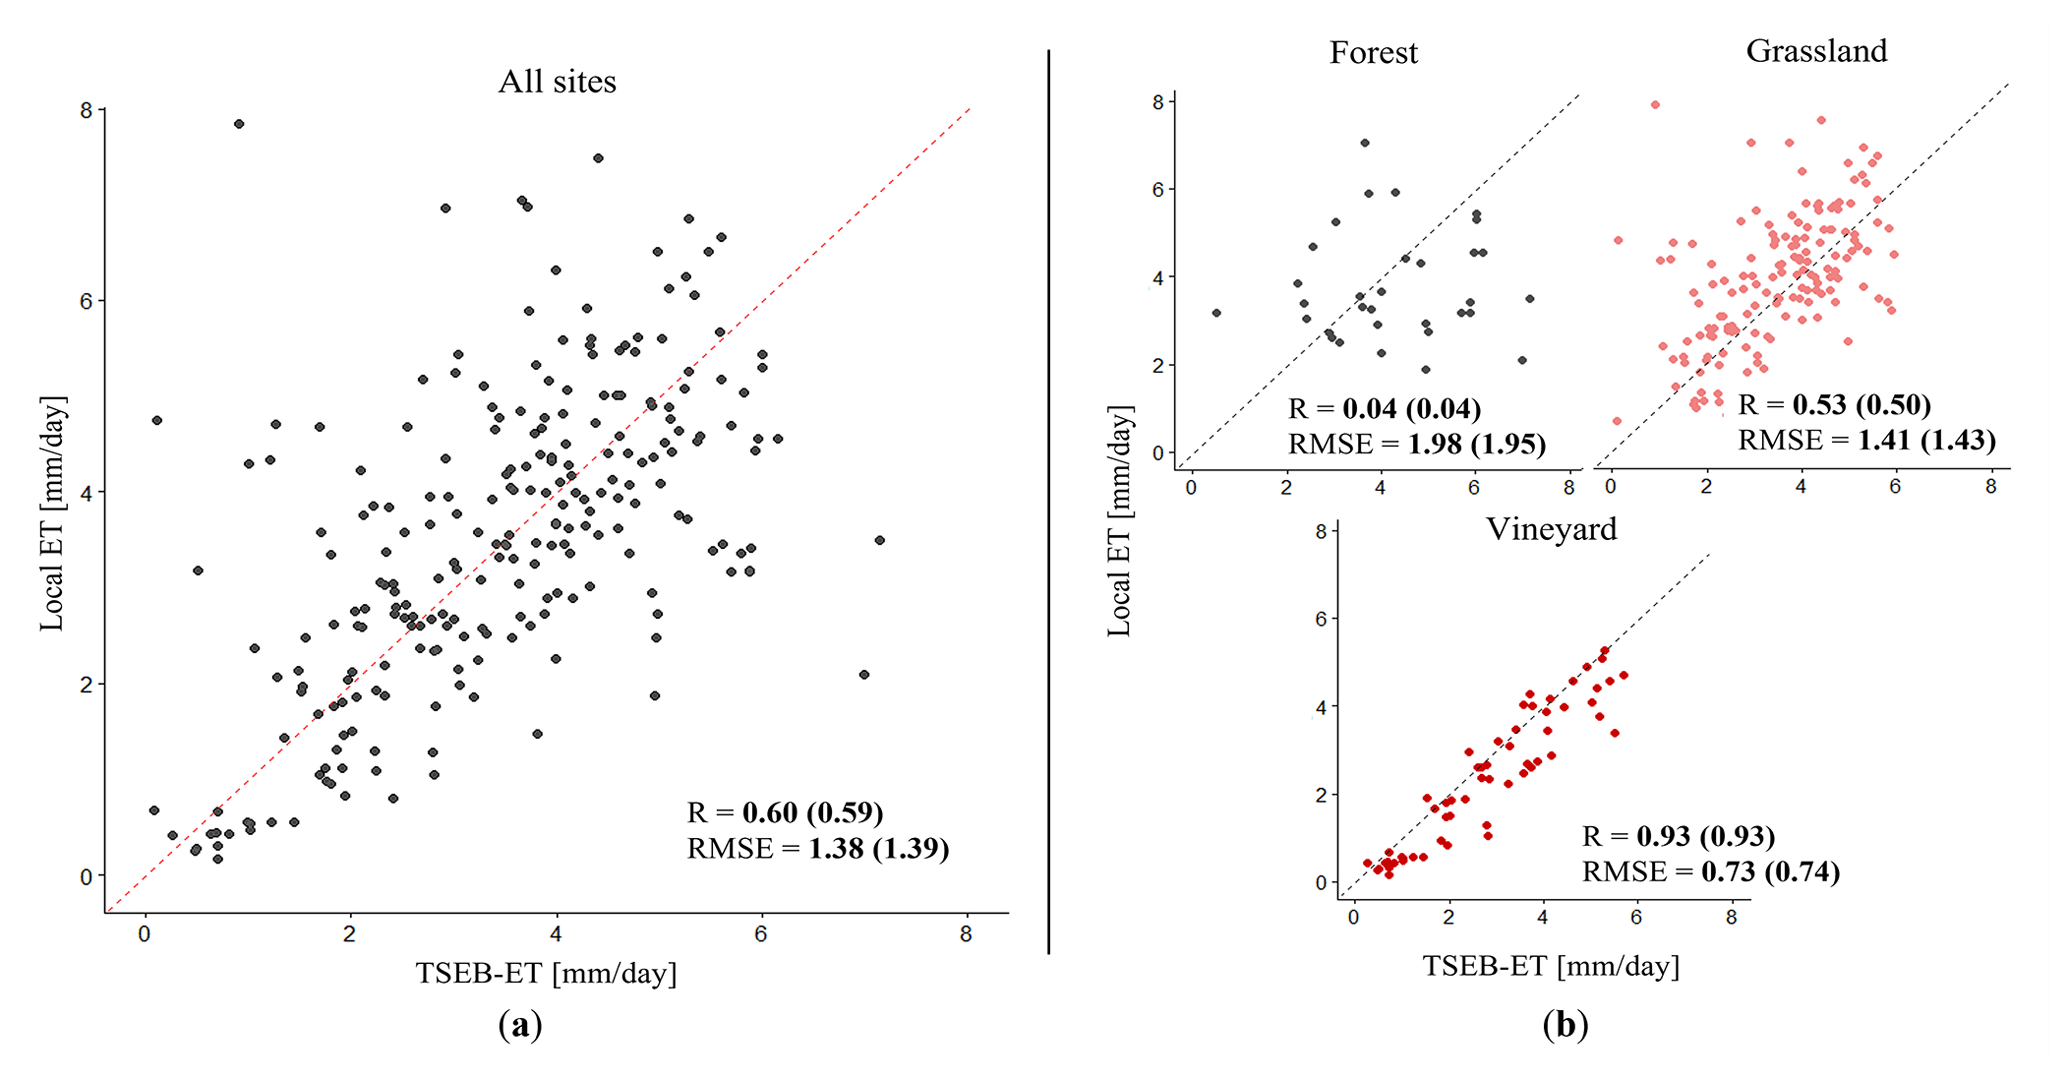
Figure 3Scatterplots of ground-derived ET observations and TSEB-PT simulations for (a) all the eddy covariance sites and (b) the separated land covers: forest, grassland, and vineyard. Note that the values in parentheses indicate accuracy statistics obtained within the 50 m buffer, while the records outside the parentheses represent a pixel-wise validation strategy.
Second, we investigate the TSEB-PT performance considering separately three vegetation biomes, i.e. forest, grassland, and vineyard. As shown in Fig. 3b, the accuracies differ between the land covers, with the best results for lowland vineyards in IT-Lsn yielding an RMSE of 0.73 mm d−1 and a high score for the Pearson coefficient exceeding 0.90. Meanwhile, for grassland, we observe a moderate correlation between in situ and modelled ET, with R=0.53 and a larger mean error of around 1.41 mm d−1 (Fig. 3b). Notably, it should be mentioned that all grass-covered EC locations are situated over the Alpine region at altitudes ranging from 1450 to 2160 m a.s.l. characterized by relatively steep slopes and high land cover variability (see Appendix A). These factors together with low-resolution inputs like downward and net solar radiation might affect the TSEB-PT performance at the Muntatschinig (IT-MtM and IT-MtP) and IT-Tor sites (Table 3). On the other hand, despite the Alpine location of IT-MBo, TSEB-PT exhibits a higher potential to estimate daily ET, as presented in Table 3. The evaluation metrics for this station indicate a slight underestimation of the model (MB = −0.16 mm d−1), yielding an RMSE and R of around 1 mm d−1 and 0.7, respectively. The better accuracy statistics over IT-MBo compared to other grass-covered sites are attributable to the relatively homogenous land cover and flat terrain at IT-MBo. The distributions of the solar radiation, wind speed, and air temperature gradients are less influenced by landscape complexity over a mountainous plateau than over steep slopes, and thus the coarse-resolution ERA5 might be more representative of IT-MBo compared to the IT-Tor and Muntatschinig locations.
Table 3Local accuracy scores between in situ data and modelled ET using TSEB-PT for the eight eddy covariance towers incorporated into this study.
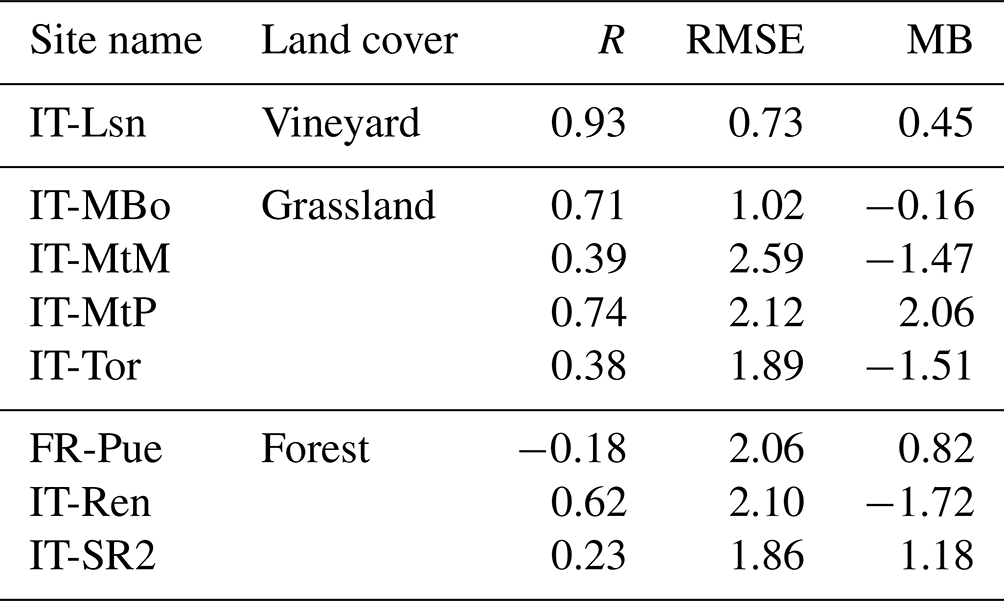
The average accuracy scores over forested areas are least satisfactory when predicting daily gridded ET. The Pearson correlation coefficient is negligible (R=0.04), and the RMSE is around 2 mm d−1 (Fig. 3b). Moreover, as seen in Table 3, regardless of the site or forest type (evergreen broadleaf or needleleaf forest), TSEB-PT-based ET maps have high RMSE scores ranging from 1.86 to 2.10 mm d−1, with a large overestimation (underestimation) of 1.18 mm d−1 (−1.72 mm d−1) for IT-SR2 and IT-Ren, respectively. The poor accuracy at forested sites might be related to the possible EC measurement uncertainties associated with surface energy imbalance (see Table 1) and coordinate rotation of turbulent fluxes. These aspects will be investigated further by removing unsatisfactory in situ observations by applying stricter criteria for energy imbalance and exploiting different methods for calculating the coordinate system for flux retrieval at challenging EC towers (Castelli et al., 2018; Mauder et al., 2013; Rannik et al., 2020; Ross and Grant, 2015). Furthermore, the robustness of TSEB-PT is also affected by land surface features, such as complex tree structures and their multi-layer composition, which is not considered in Sen-ET. This means that controlling parameters for the model obtained from remote sensing (Copernicus Sentinels) and climate reanalysis data (ERA5) may not capture the spatial variability of vegetation elements, which is often accompanied by shadows (Penot and Merlin, 2023). Similarly to our results, in Jaafar et al. (2022), the TSEB-PT forced by LST derived from Landsat and MODIS was found to be less robust over mixed forest (MF) and EBF (i.e. an RMSE of 1.5–3 mm d−1) compared to its superior performance over croplands with a mean error below 1.4 mm d−1. Even though accuracy scores indicate close agreement with our findings over forested landscapes, the authors obtained a higher correlation with a minimum R of 0.6 in woody savanna. Therefore, further work will concentrate on increasing TSEB robustness over complex landscapes by enhancing the model with better-quality input variables (e.g. land cover, canopy height, solar radiation, and wind speed), together with adjusting the default value of the αPT coefficient that depends on climate and vegetation biophysical properties (Andreu et al., 2018; Cristóbal et al., 2020; Guzinski et al., 2013). Furthermore, Yang et al. (2017, 2020) applied ALEXI/DisALEXI using the multi-sensor TIR data fusion approach (e.g. GOES, MODIS, and Landsat) to derive 30 m daily ET retrievals at pine forest sites and showed a good correspondence to flux towers, with an average RMSE ranging from 1.0 to 1.3 mm d−1. Nevertheless, the authors suggest Landsat-based modelling for deriving high-spatial-resolution ET rather than medium-scale MODIS LST, especially over heterogenous forested landscapes, to account for the complex structures of these biomes.
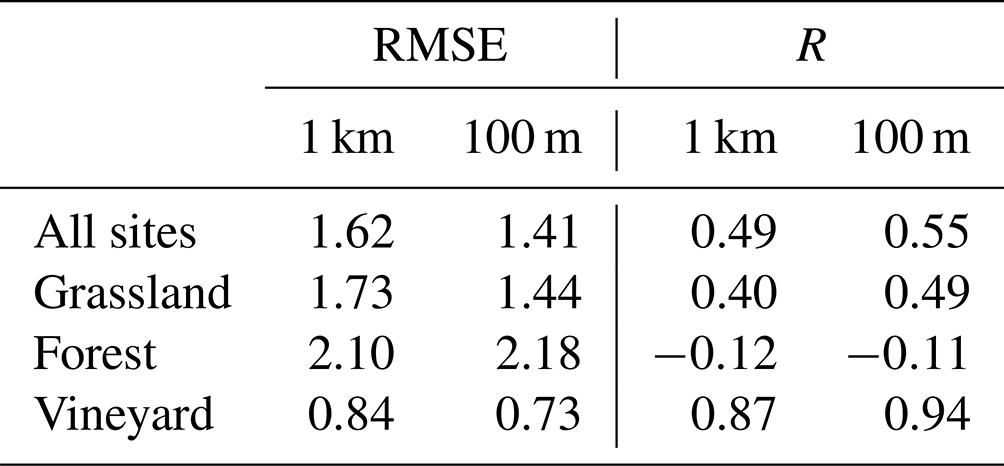
In parallel, we investigate the impact of 1 km Sentinel-3 LST on the final accuracy of the ET product. In this regard, TSEB-PT is re-run with low-resolution surface temperatures, and the obtained outputs are compared against the in situ daily ET that temporally overlaps with 100 m gridded retrievals. As shown in Table 4, on average, the comparison results between the two gridded products demonstrate better TSEB-PT prediction skill with downscaled temperature rather than with the original Sentinel-3 LST product. In general, we observe a 13 % decrease in the RMSE and an improvement in the Pearson correlation coefficient of around 12 %, which shows closer agreement between ground measurements and 100 m ET retrievals when all flux sites are incorporated into the analysis. At the level of a single land cover class, the ET model driven by downscaled LSTs outperforms TSEB-PT estimates derived from 1 km Sentinel-3 data, with the most satisfactory accuracy results for grassland and vineyard. For these biomes, RMSE (R) values range between 0.73 mm d−1 (0.94) and 1.44 mm d−1 (0.49), which corresponds to a 15 % improvement in accuracy metrics compared to 1 km ET retrievals (Table 4). In the case of forested sites, the validation scores are very similar for both ET products, with no enhancement observed for high-resolution outputs. More detailed information on accuracy scores at the flux site level is provided in Appendix B.
Table 4Station-based comparison of accuracy results between 1 km and 100 m ET retrievals considering RMSEs and R scores.
In summary, the evaluation metrics depict a high land cover dependency, with the best accuracy for the vineyard site in IT-Lsn and the grass-covered plateau of IT-MBo yielding an average RMSE ranging from 0.7 to 1 mm d−1 and a mean R of 0.7–0.9. Despite 100 m Sentinel-based inputs, it is still challenging to accurately estimate ET over mountains and forest areas, like Alpine grasslands (IT-MtM, IT-MtP, and IT-Tor) and Mediterranean forests (FR-Pue and It-SR2). For these ecosystems the mean statistical scores are less satisfactory, with RMSEs ranging from 1.86 mm d−1 at the IT-SR2 site to 2.59 mm d−1 at the IT-MtM site (Table 3). This might appear for several reasons. First, these sites are characterized by patched land covers, including grazed grass, sparsely distributed bushes, and trees, along with their complex multi-layer structure exposed to shadows, which contributes to spatial heterogeneities within 100 m ET pixels. Furthermore, high-elevation grasslands are strongly affected by complex interactions between surface energy balance components having an impact on the final ET estimates (Mildrexler, 2011). These findings are in line with the outcomes of Bartkowiak et al. (2022), where the MODIS LST-based TSEB-PT achieved a moderate agreement with local LE records at the Muntatschinig sites (R2 close to 0.61), even though the model was forced with ground-derived meteorological inputs at very high spatiotemporal resolution.
Owing to the temporal lag of the vegetation response between VSWIR and the TIR spectrum, reflectance bands from the Sentinel-2 MSI might be insufficient to estimate the LST, particularly over non-homogenous areas with patched land cover and complex topography. As reported in other studies, ancillary parameters like soil moisture, emissivity, and other surface energy balance components are expected to be more robust explanatory variables for predicting surface temperatures at higher spatial resolution (Hu et al., 2023; Merlin et al., 2010). Furthermore, the 10 d reflectance composites obtained from Sentinel-2 L2A may not be temporally representative of vegetation conditions corresponding to Sentinel-3 acquisition dates, introducing additional uncertainties into the DMS procedure, especially for areas with fast canopy changes due to harvesting, livestock grazing, and mowing events. Consequently, this also affects downscaled LST images that are predicted from the S2 SR mosaics, neglecting the time-varying characteristics of the land surface.
Apart from the lagged S2 response, the data-driven DMS algorithm depends on the thermal variability of 1 km S3 pixels, which constrains its predictions within those cell values used for model training (see Sect. 3.2 for more details). This could contribute to bigger differences between in situ and modelled ET.
As mentioned before, we use the existing TSEB-PT configuration with the global ERA5 data to scale up the ET retrieval over the Mediterranean region. The ET models are controlled by climate inputs derived from 31 km fields, which might negatively influence energy fluxes and daily ET. As reported by Fisher et al. (2017), these data might not capture local climate conditions and their rapid changeability over complex areas. By applying 31 km meteorological inputs together with net and downward shortwave radiation, ERA5 parameters do not reflect the spatial variability of the land, resulting in a mismatch between EC tower-derived ET values and their corresponding gridded estimates.
4.2 Daily ET mosaics
The last step of the processing workflow includes the generation of daily ET composites from S2 tile-cropped ET grids for each basin separately. In this regard, we create daily mosaics with respect to acquisition days of the SL_2_LST product considering two different product dissemination units (PDUs) that include Sentinel-3 images distributed in half-orbit stripes and a 3 min frame mode. Given many ET maps with the same date within an identical Sentinel-2 tile, which can happen to frame scenes with smaller spatial extents, ET granules are first combined by applying an average function over overlapping areas for each product derived from individual S3 SLSTR instruments. Next, day-coincident ET grids obtained from Sentinel-3A and Sentinel-3B satellites are composited together. In the case of single-frame acquisitions and large-stripe images, that processing step is skipped. Finally, all ET granules are fused for the S2 tile-wise basin coverage (see Appendix C), where overlying areas of different S2 tiles are also averaged. Low-quality pixels, mostly affected by clouds and a lack of input parameters for TSEB-PT, are flagged as NaN values. To make the datasets harmonized and consistent with other hydrological products, all the mosaics are re-projected onto the WGS84 coordinate system using a uniform MR domain grid (Massari et al., 2022).
The development of the ET mosaic-compositing scheme has been performed using the SNAP Graph Processing Tool.
Figure 4 presents the final ET maps in the summer of 2018 for the MR catchments, i.e. the Ebro, Hérault, Medjerda, and Po basins.

Figure 4Examples of 100 m ET mosaics from the third week of August 2018 for (a) Languedoc-Roussillon with Hérault (15 August), (b) Ebro (13 August), (c) Medjerda (16 August), and (d) Po (15 August). The entire grids are cropped following the Sentinel-2 tiling scheme. Missing data (in white) are related to Sentinel-3 cloud masks and anthropogenic surfaces. Since we focus on terrestrial ET, water bodies are also removed.
From a visual assessment of the daily mosaics, regardless of the study areas, no notable irregularities in evaporation are observed (Fig. 4). Daily ET composites follow both landscape- and season-induced ET patterns across the study areas. As shown in Fig. 4, between 13 and 15 August, the Ebro and Po basins contain lower ET values over the mountainous regions of the northern Apennines and the southern Alps between Italy and Switzerland, along with the Pyrenees and the Iberian Range in Spain (Fig. 4b, d). At the same time, the central parts of the Ebro catchment, despite semi-arid climatic conditions, have higher ET values, which indicates a strong impact on agricultural activities where many parcels are irrigated during the growing season. Similarly, more intense ET can be observed in the western Alps and across the Po River depression, covered by extensive canal systems allocated to farming and food production. In parallel, Hérault exhibited two different ET zones on 15 August 2018 (Fig. 4a). While the south-western part of the Pyrenees is characterized by greater daily ET rates, the remaining area represented by arable land indicates generally lower evaporation, proving possible water stress in the LR region characterized by hot and dry summers. The daily composite of the Medjerda basin from 16 August, despite many invalid pixels in the image, depicts geographically reasonable TSEB-PT model estimates (Fig. 4c). That is, the seaside area in the north represents irrigated fields where ET is expected to be larger compared to the southern zone with limited water resources due to the arid climate.
Nevertheless, the ET product contains areas where TSEB-PT is incapable of estimating ET. Apart from masked surfaces like water bodies and other non-vegetated classes, we can observe an impact of cloud cover (CC) in the final ET product. Even though we reduce this effect by combining decadal Sentinel-2 composites, which minimize cloud probability, and daily Sentinel-3 LST, which by its high revisit time enables relatively continuous ET monitoring without big temporal gaps between observations, cloud occurrence is still present in the daily ET mosaics. This is especially visible over the Medjerda catchment, where nearly 86 % of the total vegetated surface area contains non-valid pixels (Fig. 5a). Seaside areas and the central part of the MB might be affected by overcast conditions, while the southern part is covered by desert and sparse vegetation. In addition, a smaller number of S2 acquisitions outside Europe might have an impact on the higher CC percentage in Tunisia. On the other hand, the three remaining basins (i.e. EB, HB, and PB) are generally influenced by relatively similar frequencies of overcast conditions that range between 62 % for Hérault and 69 % for Po and Ebro as shown in Fig. 5a. Similarly to the Medjerda region, they are located in close proximity to the Mediterranean Sea, and in the case of Ebro and Po they include extensive mountain ranges, like the Alps and Pyrenees, that are frequently exposed to cloud contamination.
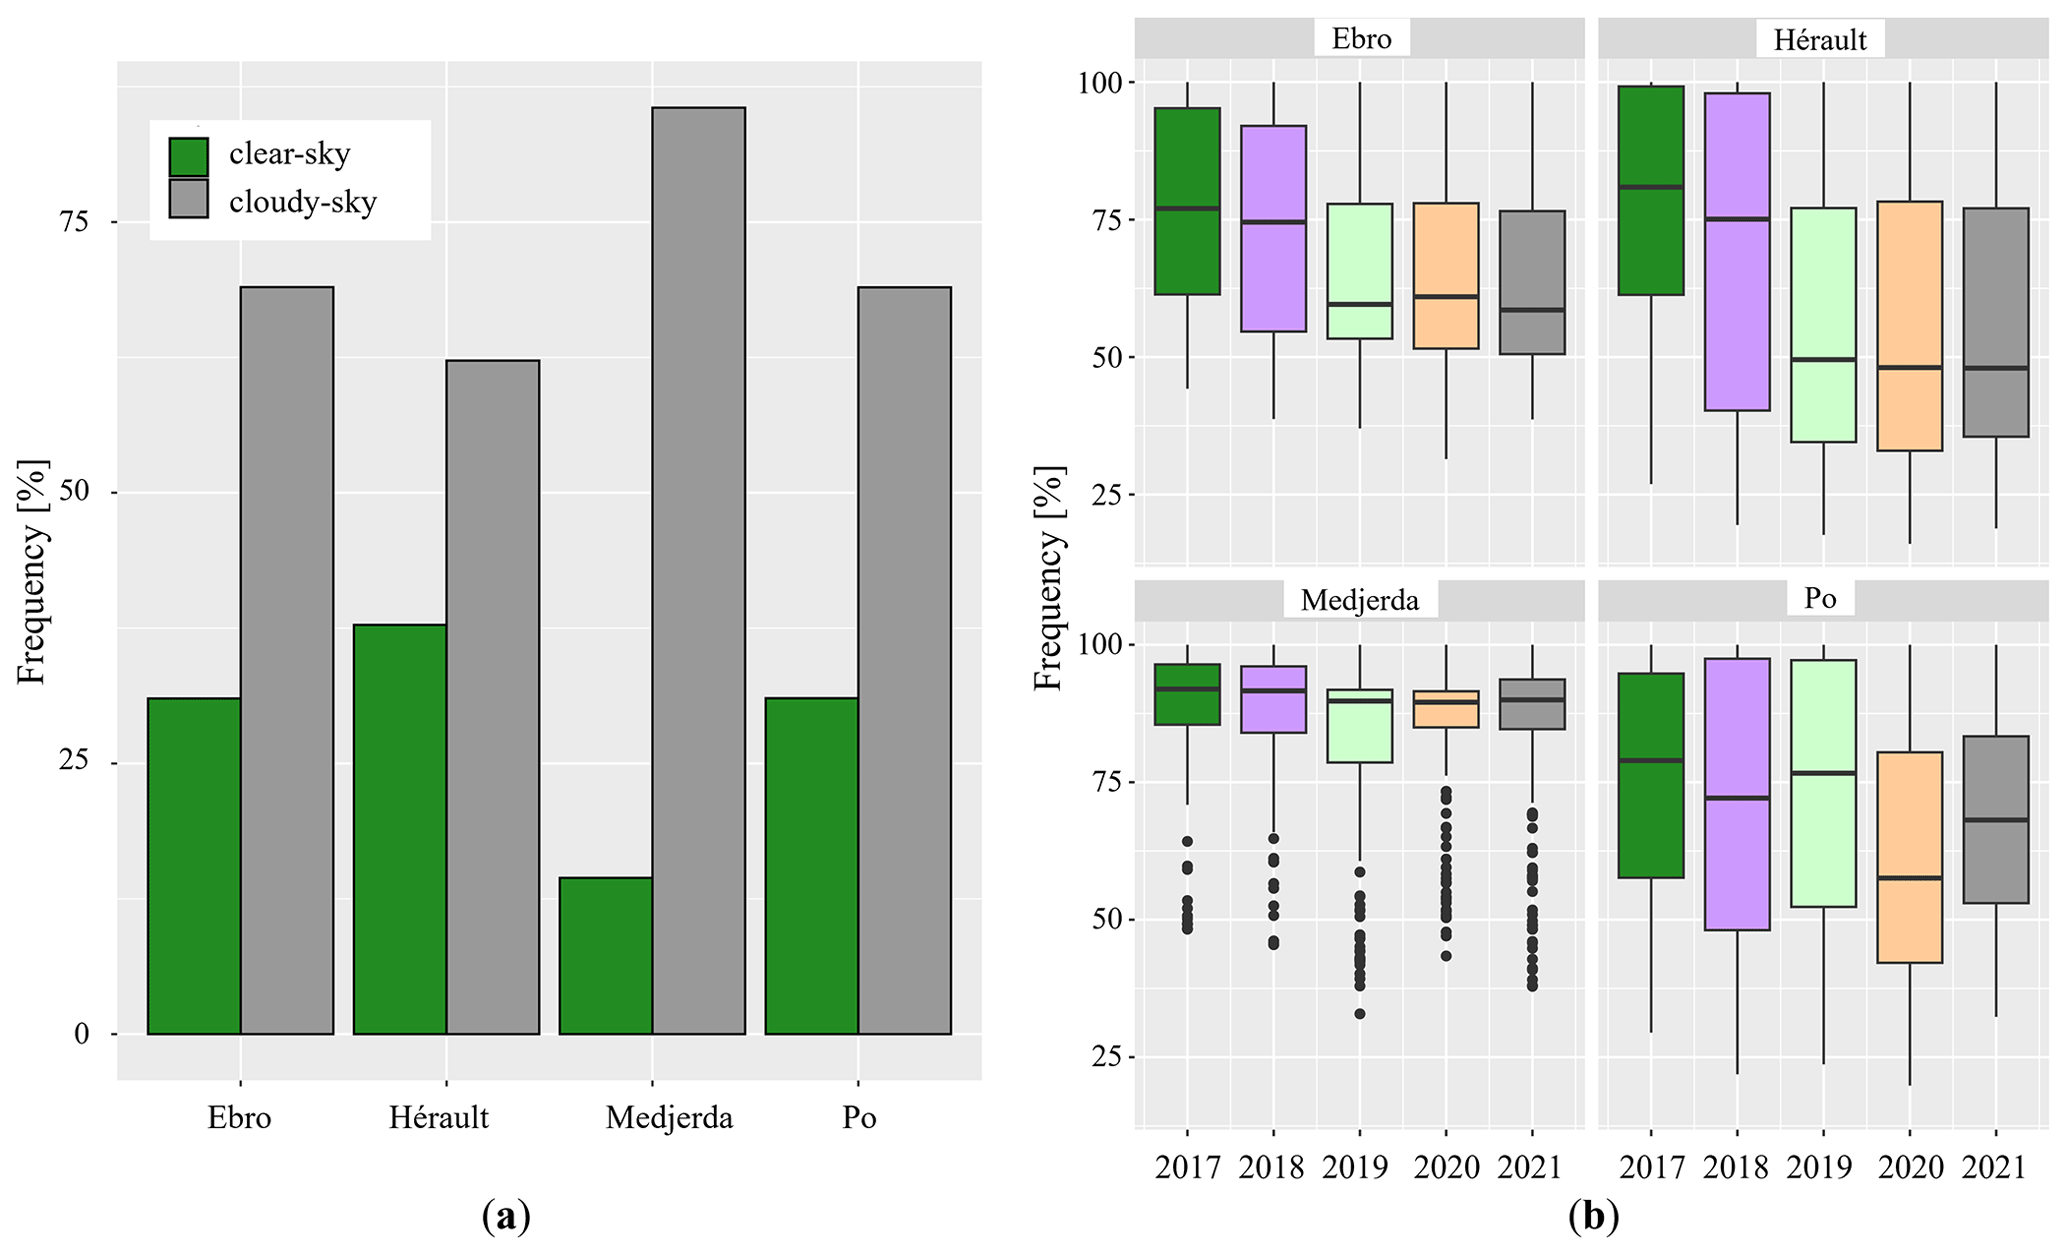
Figure 5General overview of the sky conditions for the final ET mosaics over each basin (EB, HB, MB, and PB) considering (a) clear and overcast conditions at Sentinel-3 and Sentinel-2 overpass times for the period 2017–2021 and (b) the distribution of cloudy-sky conditions for each separate year. Note that non-vegetated surfaces are excluded from this analysis. In order to minimize other disturbing factors such as seasonal snow cover, our time of interest covers the period of the growing season.
Nonetheless, if we scrutinize the cloud occurrence over the entire ET collection on an annual basis (2017–2021), the frequency of cloudy events fluctuates from day to day (Fig. 5b). For example, considering the geographical proximity of the Ebro and Hérault basins, we can observe higher values of cloud coverage in the period 2017–2018 with an average CC (CCmean) equal to 74 %, while for 2019–2021 the clear-sky pixels correspond to 40 % of all available grid cells. At the same time, the interquartile ranges (IQRs) are relatively consistent over time for each of the two catchments. On average, cloud cover frequency over the Po basin differs between the years with the highest IQR values in 2017–2019 (CCmean=72 %) and a smaller cloud effect yielding 64 % for the 2-year period between 2020 and 2021 (Fig. 5b). In contrast, the Medjerda region is the one most affected by clouds, with the highest cloud coverage and lowest CC variability among all the basins over the entire time period. As depicted in Fig. 5b, an average percentage of invalid pixels over the catchment ranges from 83 % in 2019 to 88 % in 2017. In general, sky conditions comprising more than 50 % clear-sky pixels are observed beyond the IQRs.
The 100 m ET maps form the contribution of Eurac Research to the 4DMED-Hydrology project funded by the European Space Agency (https://www.4dmed-hydrology.org/, last access: 11 September 2023). This dataset is available for the period 2017–2021 for each separate Mediterranean basin, i.e. the Ebro, Hérault, Medjerda, and Po catchments. ET maps are produced for each month (January–December) of the year in the form of daily observations. The spatial extent corresponds to Sentinel-2 tiling grids overlapping the study domains (Fig. 4). Each layer contains a single band with daily ET values (mm d−1) corresponding to the Sentinel-3 acquisition day. Invalid pixels, mainly due to vegetation masks, cloud contamination, and a lack of input data for the TSEB-PT model, are filled with NaN values. ET outputs are generated in Cloud Optimized GeoTIFF (COG) format with metadata included in the file attributes. A COG is a regular GeoTIFF file optimized for use in a cloud environment and ready to be hosted on an HTTP(S) file server, with an internal organization that enables more efficient workflows on the cloud. It facilitates data download through HTTP(S) data requests and allows a user to crop data according to areas of interest. The importance of metadata availability in the COG file is twofold: on the one hand, it offers the chance to evaluate the data without opening them, and on the other hand this information has been used to fill a catalogue following the SpatioTemporal Asset Catalog (STAC) specifications, which provide a common structure for describing and cataloguing spatiotemporal assets (https://stacspec.org/en/, SpatioTemporal Asset Catalog Project, 2023). To query the ET data in STAC, relevant STAC documentation is available together with a Python snippet code for massive data download via the Environmental Data Platform (https://edp-portal.eurac.edu/discovery/, EURAC Research, 2024). Alternatively, we provide an additional data link to manually download the entire basin-based ET collection.
As mentioned before, daily ET datasets are accessible through the Environmental Data Platform of Eurac Research under the Creative Commons Attribution 4.0 License (CC BY 4.0). Note that, if you use these datasets, you are kindly asked to include the following references concerning the four study domains:
-
Ebro, https://doi.org/10.48784/b90a02d6-5d13-4acd-b11c-99a0d381ca9a (Bartkowiak et al., 2023a);
-
Hérault, https://doi.org/10.48784/fb631817-189f-4b57-af6a-38cef217bad3 (Bartkowiak et al., 2023b);
-
Medjerda, https://doi.org/10.48784/70cd192c-0d46-4811-ad1d-51a09734a2e9 (Bartkowiak et al., 2023c); and
-
Po, https://doi.org/10.48784/7abdbd94-ddfe-48df-ab09-341ad2f52e47 (Bartkowiak et al., 2023d).
All code routines developed for the entire processing workflow are available upon request to the authors.
Although ET plays a key role in the hydrological cycle and represents a nexus between energy, water, and carbon exchange, its availability is constrained to either short-range in situ measurements or freely available satellite-derived ET data at coarse spatial resolutions (≥ 0.5 km). Thus, the generation of HR ET datasets is of high importance among scientists and governmental institutions and agricultural communities for advancing hydrological cycle monitoring and sustainable water management.
Motivated by the lack of ET data at a high spatiotemporal resolution over the Mediterranean region, we build an automatic workflow to provide 5-year time series of the 100 m daily ET product (2017–2021) as a helpful tool in the context of recurring drought events across four MR basins: Ebro (Spain), Hérault (France), Medjerda (Tunisia), and Po (Italy). Specifically, we utilize a globally applicable TSEB-PT approach with a reduced number of inputs that minimize its complexity, which is an advantage for high-volume processing at large scales. The model is physically based and has a long history of successful research studies that confirm its maturity and stability. Results demonstrate that the developed TSEB-PT ET workflow is capable of predicting ET in a robust manner.
The daily composites generally follow the seasonal patterns of the canopy over the study areas (see Sect. 2.1), with higher ET values over irrigated areas and lower estimates over rain-fed vegetation like natural grasslands and forests. The validated 100 m time series with local records from eddy covariance stations have more reasonable scores compared to time-coincident ET estimates forced by 1 km LST data, resulting in lower RMSE and higher R scores. Nevertheless, the prediction skill of the Copernicus-driven ET from TSEB-PT exhibits land cover dependency with the best accuracy results for agricultural areas and less satisfactory outcomes in forests. The validation scores confirm a strong agreement between gridded data and in situ measurements, especially over relatively uniform and flat areas represented by vineyard and grassland that yield an average R and mean error equal to 0.80 and 0.85 mm d−1, respectively. In contrast, at the level of single land cover classes, RMSEs (R values) range from 1.86 mm d−1 (−0.18) in forested areas to 2.59 mm d−1 (0.74) in grasslands considering all the remaining sites in this study.
Even though the Priestley–Taylor TSEB-PT gives very promising outcomes for plain and homogenous areas, which makes it a perfect candidate for lowland agriculture activities, site locations across biomes, like steep mountainous grasslands and forested sites, create some confusion in the model, mainly due to the inability of gridded inputs to represent a complex canopy structure and its heterogeneity together with highly changeable meteorological conditions (Elfarkh et al., 2020). Notably, TSEB-PT estimates are affected by spatial heterogeneities of the study areas and consequently the pixel size of gridded input parameters. Given the temporal and spatial frameworks of this project, the validation is conducted against EC towers, 62.5 % of which are located in the Alps. Thus, future work should be extended to more validation sites with relatively simple terrain and homogenous vegetation to minimize environmental impacts on the TSEB-PT performance, and in the case of complex sites EC processing procedures will include stricter quality checks and enhancement procedures by exploiting the capabilities of different energy balance closure methods and correcting the EC coordinate system for in situ flux retrieval. In parallel, additional work will focus on the implementation of better-quality inputs, such as climate forcings from 3 km solar radiation acquired by the MSG SEVIRI and 5.5 km Copernicus European Regional ReAnalysis (CERRA) reanalysis datasets. Moreover, considering the ET dependency on LST accuracy, the DMS together with Sentinel-2 and Sentinel-3 cloud masks will be enriched. Even though a more rigorous cloud layer for the TIR sensor is being actively debated among scientists (https://thermal2023.esa.int/, last access: 20 October 2023), the most recent S3 SLSTR Validation Report from 2017 provides unimproved data. Considering irregular ET observations affected by cloudy-sky conditions, future research should also concentrate on a data-driven approach to recover overcast cell grids. Furthermore, to capture time-induced characteristics of the land surface, LST-downscaling and TSEB-PT models might additionally be driven by more frequent variables rather than 10 d Sentinel-2 reflectances. The temporal mismatch between S2 and S3 can be solved by applying Harmonized Landsat–Sentinel imagery, which in parallel minimizes the probability of cloudiness. Consequently, due to some inaccuracies in the Sen2Cor cloud mask, other products like Sen2cloudless and Fmask will be integrated into the workflow. The enhanced products would be a valuable tool for accurately estimating the components of the terrestrial water cycle on a regional scale and over heterogenous ecosystems.
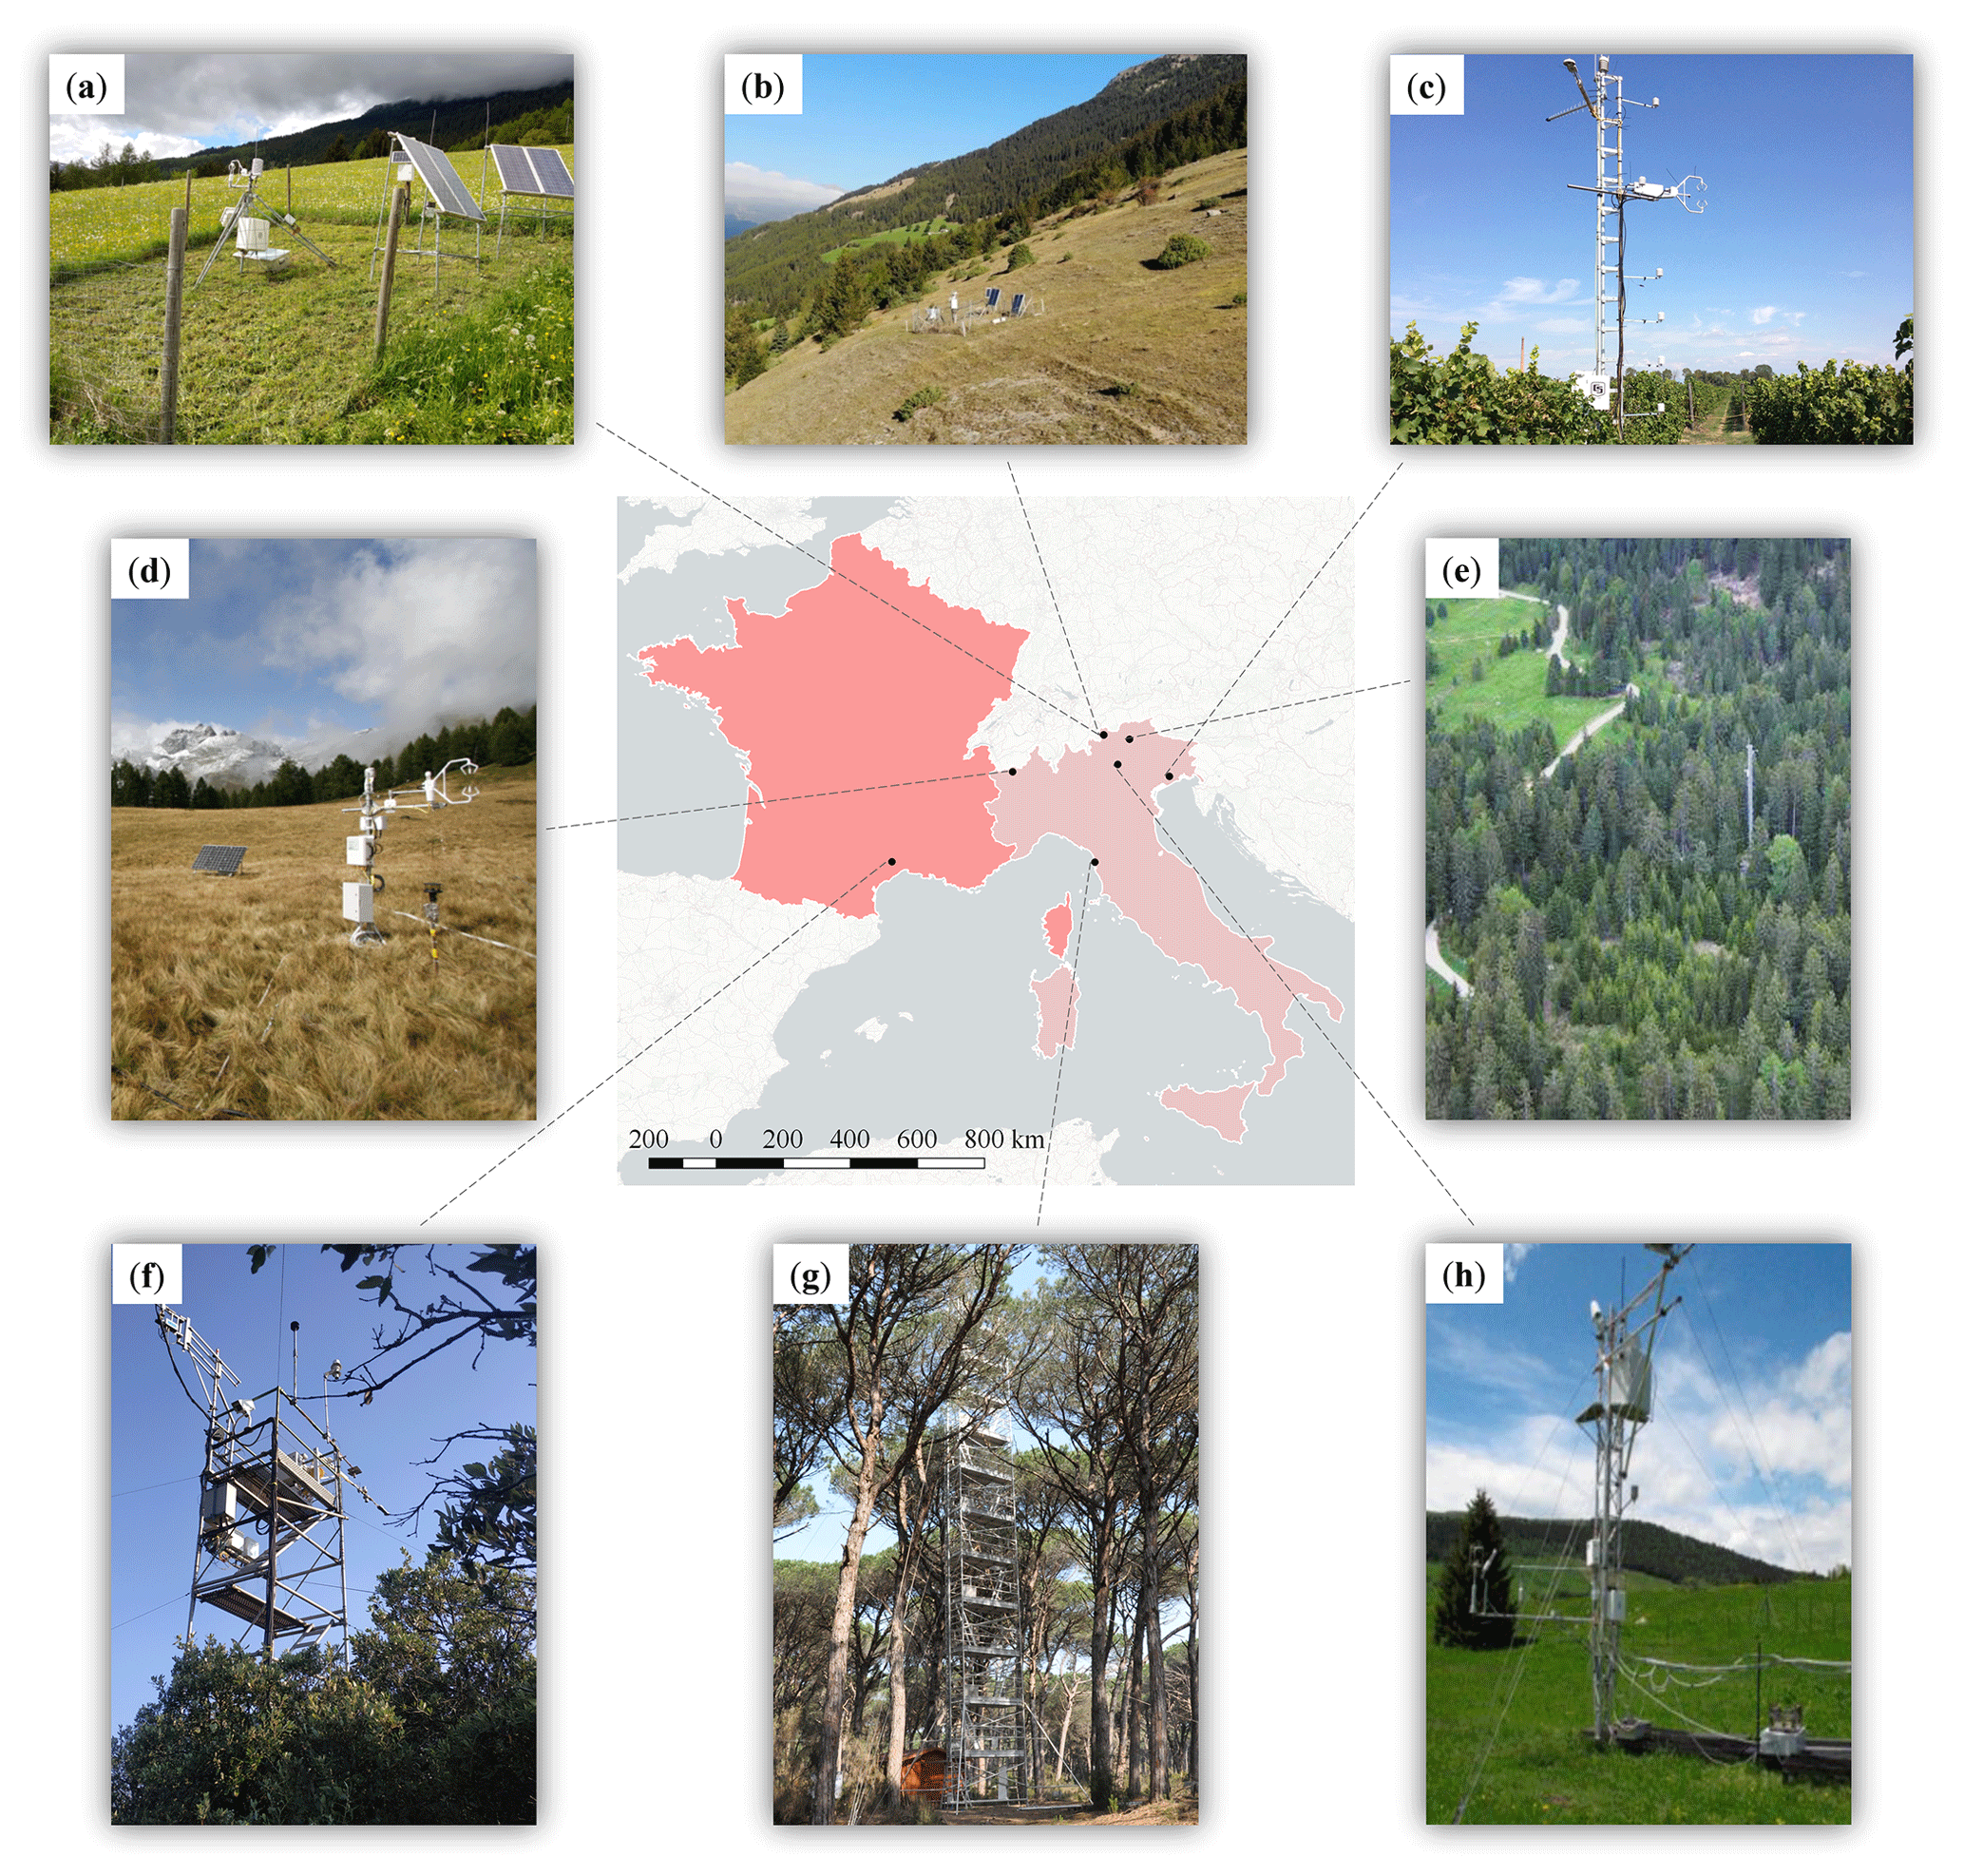
Figure A1Locations of the eddy covariance towers used for validating the ET product at the (a) IT-MtM (source: https://browser.lter.eurac.edu/), (b) IT-MtP (source: https://browser.lter.eurac.edu/), (c) IT-Lsn (source: https://www.icos-italy.it/lison-it-lsn/), (d) IT-Tor (source: https://www.icos-italy.it/elementor-2052/), (e) IT-Ren (source: https://deims.org/5d32cbf8-ab7c-4acb-b29f-600fec830a1d), (f) FR-Pue (source: https://meta.icos-cp.eu/resources/stations/ES_FR-Pue), (g) IT-SR2 (source: https://meta.icos-cp.eu/resources/stations/ES_IT-SR2), and (h) IT-MBo (source: Sakowska et al., 2015) sites.
Table B1Site-based accuracy results for the ET product obtained from 1 km Sentinel-3 LST and its corresponding downscaled version at 100 m spatial resolution. Note that for some sites low-resolution ET grids are not available due to cloud coverage detected in TSEB-PT input variables within 1 km pixels. For this reason, two sites (i.e. IT-SR2 and IT-MtP) were not included in this analysis.

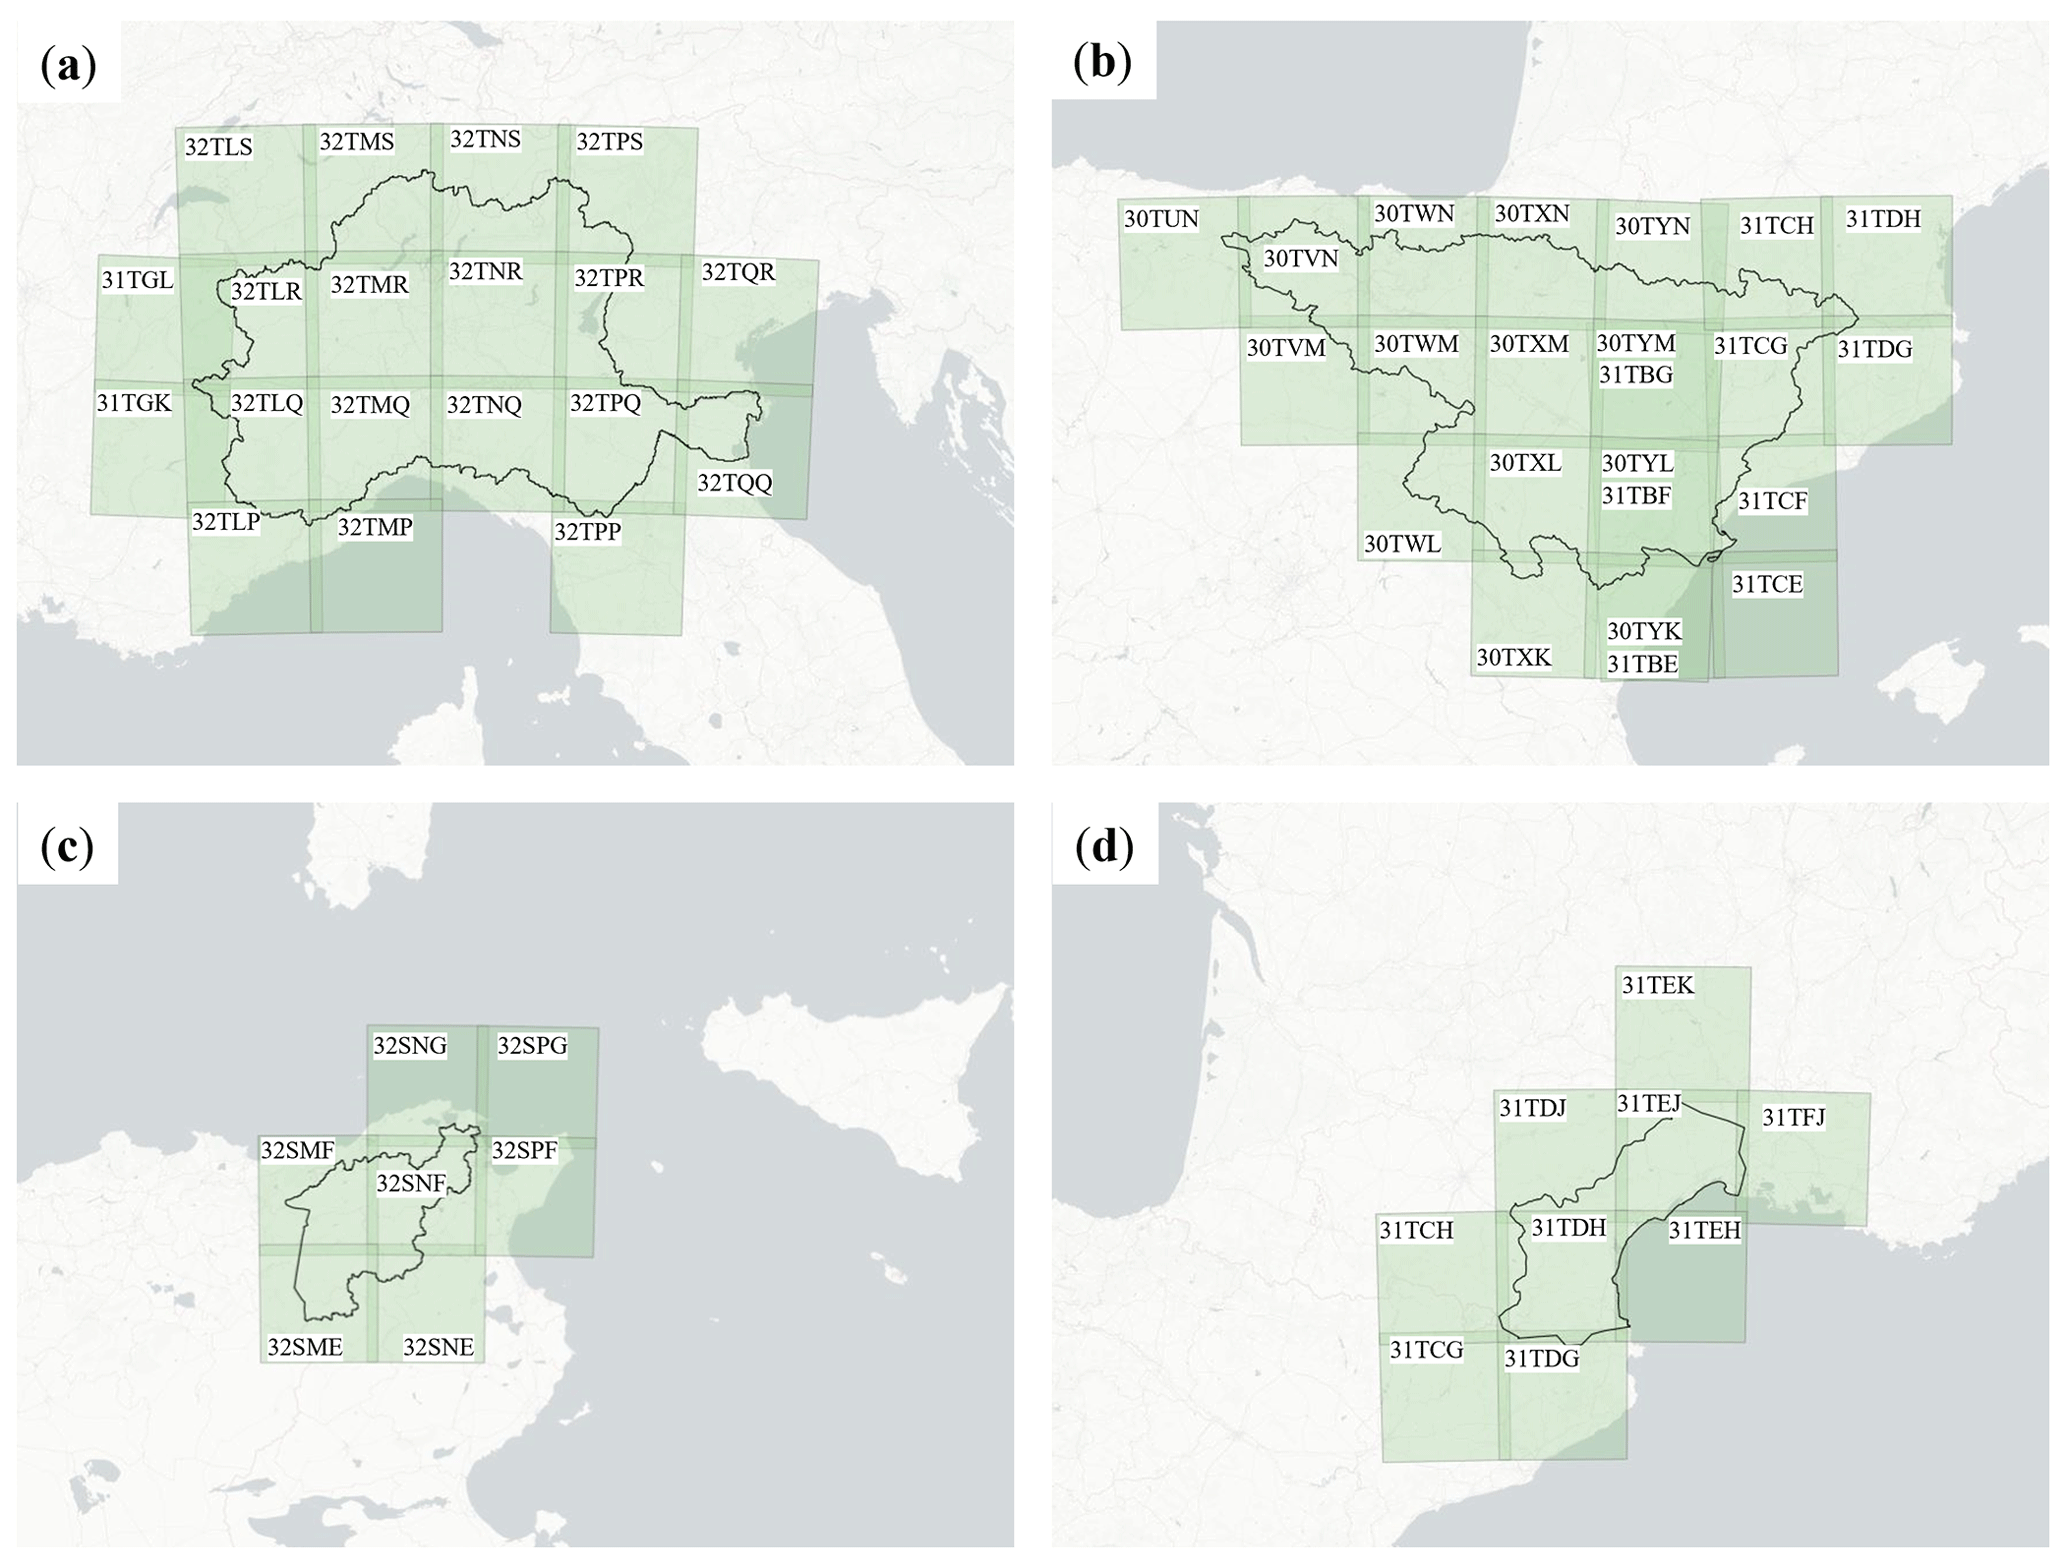
Figure C1Spatial coverage of Sentinel-2 tiles together with their overlapping areas for the (a) Po, (b) Ebro, (c) Medjerda, and (d) Hérault basins. Each tile (in green) contains the respective identification number corresponding to the Sentinel-2 tiling system as explained at https://sentinels.copernicus.eu/web/sentinel/missions/sentinel-2/data-products (last access: 7 January 2022).
The following abbreviations and acronyms are used in this work.
| αPT | Priestley–Taylor coefficient for potential transpiration (default = 1.26) |
| CC | Cloud cover |
| CERRA | Copernicus European Regional ReAnalysis |
| COG | Cloud Optimized GeoTIFF |
| DMS | Data mining sharpener |
| DTs | Decision trees |
| ECMWF | European Centre for Medium-Range Weather Forecasts |
| ECOSTRESS | ECOsystem Spaceborne Thermal Radiometer Experiment |
| EFDC | European Fluxes Database Cluster |
| EO | Earth observation |
| EODC | Earth Observation Data Centre |
| ERA5 | European Reanalysis V5 |
| ESA | European Space Agency |
| ESVEP | End-member-based Soil and Vegetation Energy Partitioning |
| ET | Evapotranspiration |
| FAO | Food and Agriculture Organization |
| GLDAS | Global Land Data Assimilation System |
| GLEAM | Global Land Evaporation Amsterdam Model |
| GPT | Graph Processing Tool |
| HR | High resolution |
| ICOS | Integrated Carbon Observation System |
| IQR | Interquartile range |
| LAI | Leaf area index |
| LC | Land cover |
| LSA-SAF | Land Surface Analysis – Satellite Application Facility |
| LST | Land surface temperature |
| LSTM | Copernicus Land Surface Temperature Monitoring |
| METRIC | Mapping Evapotranspiration with Internalized Calibration |
| MODIS | Moderate Resolution Imaging Spectroradiometer |
| MR | Mediterranean region |
| MSG | Meteosat Second Generation |
| MSI | MultiSpectral Instrument |
| NASA | National Aeronautics and Space Administration |
| OLCI | Ocean and Land Colour Instrument |
| PDU | Product dissemination unit |
| PROBA-V | Project for On-Board Autonomy – Vegetation |
| Sen-ET | Sentinels for Evapotranspiration |
| SEVIRI | Spinning Enhanced Visible and InfraRed Imager |
| SGB | Surface Biology and Geology |
| SLSTR | Sea and Land Surface Temperature Radiometer |
| S-NPP | Suomi National Polar-orbiting Partnership |
| SR | Surface reflectance |
| SRTM | Shuttle Radar Topography Mission |
| STAC | SpatioTemporal Asset Catalog |
| TIR | Thermal infrared |
| TRISHNA | Thermal infraRed Imaging Satellite for High-resolution Natural resource Assessment |
| TSEB | Two-Source Energy Balance model |
| VIIRS | Visible Infrared Imaging Radiometer Suite |
| VSWIR | Visible shortwave infrared |
| WaPOR | Water Productivity through Open access of Remotely sensed derived data |
| WGS84 | World Geodetic System 1984 |
MC and PB contributed to the research conceptualization and its implementation. Data collection, processing, and analysis were conducted by PB with the assistance of BV. AJ and BV were responsible for the cloud computing infrastructure setup and the database management. MC supervised and supported the entire work. The original draft was prepared by PB and then revised in collaboration with MC, BV, and AJ.
The contact author has declared that none of the authors has any competing interests.
Publisher's note: Copernicus Publications remains neutral with regard to jurisdictional claims made in the text, published maps, institutional affiliations, or any other geographical representation in this paper. While Copernicus Publications makes every effort to include appropriate place names, the final responsibility lies with the authors.
The authors would like to thank Petra Hulsman and Diego Miralles for preparing and sharing the pre-processed in situ data from the eddy covariance towers.
This research has been supported by the European Space Agency (grant no. 4000136272/21/I-EF).
This paper was edited by Alexander Gruber and reviewed by two anonymous referees.
Alfieri, L., Avanzi, F., Delogu, F., Gabellani, S., Bruno, G., Campo, L., Libertino, A., Massari, C., Tarpanelli, A., Rains, D., Miralles, D. G., Quast, R., Vreugdenhil, M., Wu, H., and Brocca, L.: High-resolution satellite products improve hydrological modeling in northern Italy, Hydrol. Earth Syst. Sci., 26, 3921–3939, https://doi.org/10.5194/hess-26-3921-2022, 2022.
Allen, R. G., Howell, T. A., Pruitt, W. O., Walter, I. A., and Jensen, M. E.: Lysimeters for evapotranspiration and environmental measurements, ASCE, Proceedings of the International Symposium on Lysimetry, Honolulu, Hawaii, 23–25 July 1991, ASCE Publication, p. 444, https://api.semanticscholar.org/CorpusID:131485267 (last access: 17 October 2024), 1991.
Allen, R. G., Pereira, L. S., Raes, D., and Smith, M.: Crop evapotranspiration – Guidelines for computing crop water requirements (FAO Irrigation and drainage, paper 56), 17–28, Food and Agriculture Organizatoin of the United Nations, Rome, https://www.fao.org/3/X0490E/X0490E00.htm (last access: 17 October 2024), 1998.
Amazirh, A., Merlin, O., and Er-Raki, S.: Including Sentinel-1 radar data to improve the disaggregation of MODIS land surface temperature data, ISPRS J. Photogramm. Remote Sens., 150, 11—26, 2019.
Anderson, M. C., Allen, R. G., Morse, A., and Kustas, W. P.: Use of Landsat thermal imagery in monitoring evapotranspiration and managing water resources, Remote Sens. Environ., 122, 50–65, 2012.
Anderson, M. C., Yang, Y., Xue, J., Knipper, K. R., Yang, Y., Gao, F., Hain, C. R., Kustas, W. P., Cawse-Nicholson, K., Hulley, G., and Fisher, J. B.: Interoperability of ECOSTRESS and Landsat for mapping evapotranspiration time series at sub-field scales, Remote Sens. Environ., 252, 112189, https://doi.org/10.1016/j.rse.2020.112189, 2021.
Andreu, A., Kustas, W. P., Polo, M. J., Carrara, A., and González-Dugo, M. P.: Modeling surface energy fluxes over a dehesa (oak savanna) ecosystem using a thermal based two-source energy balance model (TSEB) I, Remote Sens., 10, 567, https://doi.org/10.3390/rs10040567, 2018.
Babaeian, E., Paheding, S., Siddique, N., Devabhaktuni, V. K., and Tuller, M.: Short-and mid-term forecasts of actual evapotranspiration with deep learning, J. Hydrol., 612, 128078, https://doi.org/10.1016/j.jhydrol.2022.128078, 2022.
Bai, P. and Liu, X.: Intercomparison and evaluation of three global high-resolution evapotranspiration products across China, J. Hydrol., 566, 743–755, 2018.
Barella-Ortiz, A., Quintana-Seguí, P., Clavera-Gispert, R., Munier, S., Merlin, O., Olivera-Guerra, L.-E., Altés, V., Villar, J.-M., Brocca, L., Dari, J., Modanesi, S., Zapa, L., and Brombacher, J.: Analysis of the impact of different irrigation scenarios on the water balance of the Ebro River Basin by means of a LSM and remote sensing irrigation estimations, EGU General Assembly 2023, Vienna, Austria, 23–28 Apr 2023, EGU23-14091, https://doi.org/10.5194/egusphere-egu23-14091, 2023.
Bartkowiak, P., Castelli, M., Colombo, R., and Notarnicola, C.: Two-source energy balance modeling of evapotranspiration with thermal remote sensing at different spatial resolutions: a case study of the European Alps, in: Remote Sensing for Agriculture, Ecosystems, and Hydrology XXIV (Vol. 12262), Berlin, Germany, SPIE, https://doi.org/10.1117/12.2646185, October 2022.
Bartkowiak, P., Ventura, B., Jacob, A., and Castelli, M.: Daily evaporation product – Ebro basin (Version v1), Institute for Earth Observation [data set], https://doi.org/10.48784/B90A02D6-5D13-4ACD-B11C-99A0D381CA9A, 2023a.
Bartkowiak, P., Ventura, B., Jacob, A., and Castelli, M.: Daily evaporation product – Hérault basin (Version v1), Institute for Earth Observation [data set], https://doi.org/10.48784/FB631817-189F-4B57-AF6A-38CEF217BAD3, 2023b.
Bartkowiak, P., Ventura, B., Jacob, A., and Castelli, M.: Daily evaporation product – Medjerda basin (Version v1), Institute for Earth Observation [data set], https://doi.org/10.48784/70CD192C-0D46-4811-AD1D-51A09734A2E9, 2023c.
Bartkowiak, P., Ventura, B., Jacob, A., and Castelli, M.: Daily evaporation product – Po basin (Version v1), Institute for Earth Observation [data set], https://doi.org/10.48784/7ABDBD94-DDFE-48DF-AB09-341AD2F52E47, 2023d.
Bastiaanssen, W. G. M., Noordman, E. J. M., Pelgrum, H., Davids, G., Thoreson, B. P., and Allen, R. G.: SEBAL model with remotely sensed data to improve water-resources management under actual field conditions, J. Irrig. Drain. Eng., 131, 85–93, 2005.
Bastiaanssen, W. G. M., Cheema, M. J. M., Immerzeel, W. W., Miltenburg, I. J., and Pelgrum, H.: Surface energy balance and actual evapotranspiration of the transboundary Indus Basin estimated from satellite measurements and the ETLook model, Water Resour. Res., 48, W11512, https://doi.org/10.1029/2011WR010482, 2012.
Bellvert, J., Jofre-Ĉekalović, C., Pelechá, A., Mata, M., and Nieto, H.: Feasibility of using the two-source energy balance model (TSEB) with Sentinel-2 and Sentinel-3 images to analyze the spatio-temporal variability of vine water status in a vineyard, Remote Sens., 12, 2299, https://doi.org/10.3390/rs12142299, 2020.
Bhattarai, N. and Wagle, P.: Recent advances in remote sensing of evapotranspiration, Remote Sens., 13, 4260, https://doi.org/10.3390/rs13214260, 2021.
Bisquert, M., Sánchez, J. M., and Caselles, V.: Evaluation of disaggregation methods for downscaling MODIS land surface temperature to Landsat spatial resolution in Barrax test site, IEEE J. Sel. Top. Appl. Earth Obs., 9, 1430–1438, https://doi.org/10.1109/JSTARS.2016.2519099, 2016.
Blatchford, M. L., Mannaerts, C. M., Njuki, S. M., Nouri, H., Zeng, Y., Pelgrum, H., Wonink, S., and Karimi, P.: Evaluation of WaPOR V2 evapotranspiration products across Africa, Hydrol. Process., 34, 3200–3221, 2020.
Boulmaiz, T., Boutaghane, H., Abida, H., Saber, M., Kantoush, S. A., and Tramblay, Y.: Exploring the spatio-temporal variability of precipitation over the Medjerda Transboundary Basin in North Africa, Water, 14, 423, https://doi.org/10.3390/w14030423, 2022.
Buttar, N. A., Yongguang, H., Shabbir, A., Lakhiar, I. A., Ullah, I., Ali, A., Aleem, M., and Yasin, M. A.: Estimation of evapotranspiration using Bowen ratio method, IFAC-PapersOnLine, 51, 807–810, 2018.
Cambrea, L., Lafon, C., and Mayoux, L.: Live from the regions–Vine irrigation in the former Languedoc-Roussillon region: production potential maintained through water savings, Sciences Eaux & Territoires, (34 bis), 28–33, https://doi.org/10.14758/SET-REVUE.2020.4.05, 2020.
Cammalleri, C., Anderson, M. C., Gao, F., Hain, C. R., and Kustas, W. P.: Mapping daily evapotranspiration at field scales over rainfed and irrigated agricultural areas using remote sensing data fusion, Agr. Forest Meteorol., 186, 1–11, 2014.
Campbell, G. S. and Norman, J. M.: Radiation fluxes in natural environments, in: An introduction to environmental biophysics, Springer, New York, NY, 167–184, https://doi.org/10.1007/978-1-4612-1626-1_11, 1998.
Castelli, M.: Evapotranspiration Changes over the European Alps: Consistency of Trends and Their Drivers between the MOD16 and SSEBop Algorithms, Remote Sens., 13, 4316, https://doi.org/10.3390/rs13214316, 2021.
Castelli, M., Anderson, M. C., Yang, Y., Wohlfahrt, G., Bertoldi, G., Niedrist, G., Hammerle, A., Zhao, P., Zebisch, M., and Notarnicola, C.: Two-source energy balance modeling of evapotranspiration in Alpine grasslands, Remote Sens. Environ., 209, 327–342, 2018.
Cawse-Nicholson, K. and Anderson, M.: ECOSTRESS Level-3 DisALEXI-JPL Evapotranspiration (ECO3ETALEXI) Algorithm Theoretical Basis Document, Jet Propulsion Laboratory California Institute of Technology, Pasadena, CA, USA, https://lpdaac.usgs.gov/documents/1000/ECO3ETALEXI_ATBD_V1.pdf (last access: 17 October 2024), 2021.
Chattopadhyay, N. and Hulme, M.: Evaporation and potential evapotranspiration in India under conditions of recent and future climate change, Agr. Forest Meteorol., 87, 55–73, 1997.
Chintala, S., Harmya, T. S., Kambhammettu, B. V. N. P., Moharana, S., and Duvvuri, S.: Modelling high-resolution Evapotranspiration in fragmented croplands from the constellation of Sentinels, Remote Sensing Applications: Society and Environment, 26, 100704, https://doi.org/10.1016/j.rsase.2022.100704, 2022.
Chirouze, J., Boulet, G., Jarlan, L., Fieuzal, R., Rodriguez, J. C., Ezzahar, J., Er-Raki, S., Bigeard, G., Merlin, O., Garatuza-Payan, J., Watts, C., and Chehbouni, G.: Intercomparison of four remote-sensing-based energy balance methods to retrieve surface evapotranspiration and water stress of irrigated fields in semi-arid climate, Hydrol. Earth Syst. Sci., 18, 1165–1188, https://doi.org/10.5194/hess-18-1165-2014, 2014.
Coenders-Gerrits, M., Schilperoort, B., and Jiménez-Rodríguez, C.: Evaporative Processes on Vegetation: An Inside Look, in: Precipitation Partitioning by Vegetation: A Global Synthesis, edited by: Van Stan II, J. T., Gutmann, E. D., and Friesen, J., Springer Nature, Cham, Switzerland, 35–48, https://doi.org/10.1007/978-3-030-29702-2, 2020.
Cristóbal, J., Prakash, A., Anderson, M. C., Kustas, W. P., Alfieri, J. G., and Gens, R.: Surface energy flux estimation in two Boreal settings in Alaska using a thermal-based remote sensing model, Remote Sens., 12, 4108, https://doi.org/10.3390/rs12244108, 2020.
Cui, Y., Song, L., and Fan, W.: Generation of spatio-temporally continuous evapotranspiration and its components by coupling a two-source energy balance model and a deep neural network over the Heihe River Basin, J. Hydrol., 597, 126176, https://doi.org/10.1016/j.jhydrol.2021.126176, 2021.
Dari, J., Quintana-Seguí, P., Morbidelli, R., Saltalippi, C., Flammini, A., Giugliarelli, E., Escorihuela, M. J., Stefan, V., and Brocca, L.: Irrigation estimates from space: Implementation of different approaches to model the evapotranspiration contribution within a soil-moisture-based inversion algorithm, Agr. Water Manage., 265, 107537, https://doi.org/10.1016/j.agwat.2022.107537, 2022.
Dari, J., Brocca, L., Modanesi, S., Massari, C., Tarpanelli, A., Barbetta, S., Quast, R., Vreugdenhil, M., Freeman, V., Barella-Ortiz, A., Quintana-Seguí, P., Bretreger, D., and Volden, E.: Regional data sets of high-resolution (1 and 6 km) irrigation estimates from space, Earth Syst. Sci. Data, 15, 1555–1575, https://doi.org/10.5194/essd-15-1555-2023, 2023.
De Santis, D., D'Amato, C., Bartkowiak, P., Azimi, S., Castelli, M., Rigon, R., and Massari, C.: Evaluation of remotely-sensed evapotranspiration datasets at different spatial and temporal scales at forest and grassland sites in Italy, in: 2022 IEEE Workshop on Metrology for Agriculture and Forestry (MetroAgriFor), 356–361, IEEE, https://doi.org/10.1109/MetroAgriFor55389.2022.9964755, November 2022.
Dezsi, Ş., Mîndrescu, M., Petrea, D., Rai, P. K., Hamann, A., and Nistor, M. M.: High-resolution projections of evapotranspiration and water availability for Europe under climate change, Int. J. Climatol., 38, 3832–3841, 2018.
DHI-GRAS: User Manual For SEN-ET SNAP Plugin, 0–35, https://www.esa-sen4et.org/static/media/sen-et-user-manual-v1.1.0.2cd617fb322658397542.pdf (last access: 16 October 2023), 2020.
Douna, V., Barraza, V., Grings, F., Huete, A., Restrepo-Coupe, N., and Beringer, J.: Towards a remote sensing data based evapotranspiration estimation in Northern Australia using a simple random forest approach, J. Arid Environ., 191, 104513, https://doi.org/10.1016/j.jaridenv.2021.104513, 2021.
Elfarkh, J., Ezzahar, J., Er-Raki, S., Simonneaux, V., Ait Hssaine, B., Rachidi, S., Brut, A., Rivalland, V., Khabba, S., Chehbouni, A., and Jarlan, L.: Multi-scale evaluation of the TSEB model over a complex agricultural landscape in Morocco, Remote Sens., 12, 1181, https://doi.org/10.3390/rs12071181, 2020.
ESA: Land Cover CCI Product User Guide Version 2. Tech. Rep., http://maps.elie.ucl.ac.be/CCI/viewer/download/ESACCI-LC-Ph2-PUGv2_2.0.pdf (last access: 17 October 2024), 2017.
ESA: Sentinel-3 SRAL/MWR Land User Handbook, https://sentinel.esa.int/documents/247904/4871083/Sentinel-3+SRAL+Land+User+Handbook+V1.1.pdf (last access: 4 October 2023), 2022.
EURAC Research: EURAC Environmental Data Platform, https://edp-portal.eurac.edu/discovery/ (last access: 5 March 2024), 2024.
Fabre, J., Ruelland, D., Dezetter, A., and Grouillet, B.: Simulating past changes in the balance between water demand and availability and assessing their main drivers at the river basin scale, Hydrol. Earth Syst. Sci., 19, 1263–1285, https://doi.org/10.5194/hess-19-1263-2015, 2015.
FAO: AQUASTAT Tunisia fact sheet, https://www.fao.org/aquastat/en/geospatial-information/global-maps-irrigated-areas/irrigation-by-country/country/TUN (last access: 7 July 2023), 2020.
Ferreira, L. B., da Cunha, F. F., de Oliveira, R. A., and Fernandes Filho, E. I.: Estimation of reference evapotranspiration in Brazil with limited meteorological data using ANN and SVM – A new approach, J. Hydrol., 572, 556–570, 2019.
Filippucci, P., Brocca, L., Quast, R., Ciabatta, L., Saltalippi, C., Wagner, W., and Tarpanelli, A.: High-resolution (1 km) satellite rainfall estimation from SM2RAIN applied to Sentinel-1: Po River basin as a case study, Hydrol. Earth Syst. Sci., 26, 2481–2497, https://doi.org/10.5194/hess-26-2481-2022, 2022.
Fisher, J. B.: Level-3 Evapotranspiration L3 (ET_PT-JPL) Algorithm Theoretical Basis Document, Technical Report, NASA Jet Propulsion Laboratory, 2018.
Fisher, J. B., Tu, K. P., and Baldocchi, D. D.: Global estimates of the land–atmosphere water flux based on monthly AVHRR and ISLSCP-II data, validated at 16 FLUXNET sites, Remote Sens. Environ., 112, 901–919, https://doi.org/10.1016/j.rse.2007.06.025, 2008.
Fisher, J. B., Melton, F., Middleton, E., Hain, C., Anderson, M., Allen, R., McCabe, M. F., Hook, S., Baldocchi, D., Townsend, P. A., and Kilic, A.: The future of evapotranspiration: Global requirements for ecosystem functioning, carbon and climate feedbacks, agricultural management, and water resources, Water Resour. Res., 53, 2618–2626, 2017.
Gao, F., Kustas, W. P., and Anderson, M. C.: A data mining approach for sharpening thermal satellite imagery over land, Remote Sens., 4, 3287–3319, 2012.
Gao, X., Zhao, Q., Zhao, X., Wu, P., Pan, W., Gao, X., and Sun, M.: Temporal and spatial evolution of the standardized precipitation evapotranspiration index (SPEI) in the Loess Plateau under climate change from 2001 to 2050, Sci. Total Environ., 595, 191–200, 2017.
Gaona, J., Quintana-Seguí, P., Escorihuela, M. J., Boone, A., and Llasat, M. C.: Interactions between precipitation, evapotranspiration and soil-moisture-based indices to characterize drought with high-resolution remote sensing and land-surface model data, Nat. Hazards Earth Syst. Sci., 22, 3461–3485, https://doi.org/10.5194/nhess-22-3461-2022, 2022.
García-Santos, V., Sánchez, J. M., and Cuxart, J.: Evapotranspiration Acquired with Remote Sensing Thermal-Based Algorithms: A State-of-the-Art Review, Remote Sens., 14, 3440, https://doi.org/10.3390/rs14143440, 2022.
Gouveia, C. M., Trigo, R. M., Beguería, S., and Vicente-Serrano, S. M.: Drought impacts on vegetation activity in the Mediterranean region: An assessment using remote sensing data and multi-scale drought indicators, Global Planet. Change, 151, 15–27, 2017.
Granata, F., Gargano, R., and de Marinis, G.: Artificial intelligence based approaches to evaluate actual evapotranspiration in wetlands, Sci. Total Environ., 703, 135653, https://doi.org/10.1016/j.scitotenv.2019.135653, 2020.
Guzinski, R. and Nieto, H.: Evaluating the feasibility of using Sentinel-2 and Sentinel-3 satellites for high-resolution evapotranspiration estimations, Remote Sens. Environ., 221, 157–172, 2019.
Guzinski, R., Anderson, M. C., Kustas, W. P., Nieto, H., and Sandholt, I.: Using a thermal-based two source energy balance model with time-differencing to estimate surface energy fluxes with day–night MODIS observations, Hydrol. Earth Syst. Sci., 17, 2809–2825, https://doi.org/10.5194/hess-17-2809-2013, 2013.
Guzinski, R., Nieto, H., Jensen, R., and Mendiguren, G.: Remotely sensed land-surface energy fluxes at sub-field scale in heterogeneous agricultural landscape and coniferous plantation, Biogeosciences, 11, 5021–5046, https://doi.org/10.5194/bg-11-5021-2014, 2014.
Guzinski, R., Nieto, H., Sandholt, I., and Karamitilios, G.: Modelling high-resolution actual evapotranspiration through Sentinel-2 and Sentinel-3 data fusion, Remote Sens., 12, 1433, https://doi.org/10.3390/rs12091433, 2020.
Guzinski, R., Nieto, H., Sánchez, J. M., López-Urrea, R., Boujnah, D. M., and Boulet, G.: Utility of copernicus-based inputs for actual evapotranspiration modeling in support of sustainable water use in agriculture, IEEE J. Sel. Top. Appl. Earth Obs., 14, 11466–11484, 2021.
Guzinski, R., Nieto, H., Sánchez, R. R., Sánchez, J. M., Jomaa, I., Zitouna-Chebbi, R., Roupsard, O., and López-Urrea, R.: Improving field-scale crop actual evapotranspiration monitoring with Sentinel-3, Sentinel-2, and Landsat data fusion, Int. J. Appl. Earth Obs., 125, 103587, https://doi.org/10.1016/j.jag.2023.103587, 2023.
Heiskanen, J., Brümmer, C., Buchmann, N., Calfapietra, C., Chen, H., Gielen, B., Gkritzalis, T., Hammer, S., Hartman, S., Herbst, M., and Janssens, I. A.: The integrated carbon observation system in Europe, B. Am. Meteorol. Soc., 103, E855–E872, 2022.
Hersbach, H., Bell, B., Berrisford, P., Hirahara, S., Horányi, A., Muñoz-Sabater, J., Nicolas, J., Peubey, C., Radu, R., Schepers, D., and Simmons, A.: The ERA5 global reanalysis, Q. J. Roy. Meteorol. Soc., 146, 1999–2049, 2020.
Hoffmann, H., Nieto, H., Jensen, R., Guzinski, R., Zarco-Tejada, P., and Friborg, T.: Estimating evaporation with thermal UAV data and two-source energy balance models, Hydrol. Earth Syst. Sci., 20, 697–713, https://doi.org/10.5194/hess-20-697-2016, 2016.
Hu, T., Mallick, K., Hitzelberger, P., Didry, Y., Boulet, G., Szantoi, Z., Koetz, B., Alonso, I., Pascolini-Campbell, M., Halverson, G., and Cawse-Nicholson, K.: Evaluating European ECOSTRESS Hub Evapotranspiration Products Retrieved from Three Structurally Contrasting SEB Models over Europe, https://hal.science/hal-03866684/ (last access: 17 October 2024), 2022.
Hu, Y., Tang, R., Jiang, X., Li, Z. L., Jiang, Y., Liu, M., Gao, C., and Zhou, X.: A physical method for downscaling land surface temperatures using surface energy balance theory, Remote Sens. Environ., 286, 113421, https://doi.org/10.1016/j.rse.2022.113421, 2023.
Hu, X., Shi, L., Lin, G., and Lin, L.: Comparison of physical-based, data-driven and hybrid modeling approaches for evapotranspiration estimation, J. Hydrol., 601, 126592, https://doi.org/10.1016/j.jhydrol.2021.126592, 2021.
Hulsman, P., Keune, J., Koppa, A., Schellekens, J., and Miralles, D. G.: Incorporating Plant Access to Groundwater in Existing Global, Satellite-Based Evaporation Estimates, Water Resour. Res., 59, e2022WR033731, https://doi.org/10.1029/2022WR033731, 2023.
Jaafar, H. H., Mourad, R. M., Kustas, W. P., and Anderson, M. C.: A Global Implementation of Single-and Dual-Source Surface Energy Balance Models for Estimating Actual Evapotranspiration at 30-m Resolution Using Google Earth Engine, Water Resour. Res., 58, e2022WR032800, https://doi.org/10.1029/2022WR032800, 2022.
Jain, S. K., Nayak, P. C., and Sudheer, K. P.: Models for estimating evapotranspiration using artificial neural networks, and their physical interpretation, Hydrol. Process., 22, 2225–2234, 2008.
Jiang, S., Wei, L., Ren, L., Xu, C. Y., Zhong, F., Wang, M., Zhang, L., Yuan, F., and Liu, Y.: Utility of integrated IMERG precipitation and GLEAM potential evapotranspiration products for drought monitoring over mainland China, Atmos. Res., 247, 105141, https://doi.org/10.1016/j.atmosres.2020.105141, 2021.
Kljun, N., Calanca, P., Rotach, M. W., and Schmid, H. P.: A simple two-dimensional parameterisation for Flux Footprint Prediction (FFP), Geosci. Model Dev., 8, 3695–3713, https://doi.org/10.5194/gmd-8-3695-2015, 2015.
Konapala, G., Mishra, A. K., Wada, Y., and Mann, M. E.: Climate change will affect global water availability through compounding changes in seasonal precipitation and evaporation, Nat. Commun., 11, 3044, https://doi.org/10.1038/s41467-020-16757-w, 2020.
Kustas, W. and Anderson, M.: Advances in thermal infrared remote sensing for land surface modeling, Agr. Forest Meteorol., 149, 2071–2081, https://doi.org/10.1016/j.agrformet.2009.05.016, 2009.
Kustas, W. P. and Norman, J. M.: Evaluation of soil and vegetation heat flux predictions using a simple two-source model with radiometric temperatures for partial canopy cover, Agr. Forest Meteorol., 94, 13–29, 1999.
Li, B., Beaudoing, H., and Rodell, M.: NASA/GSFC/HSL: GLDAS Catchment Land Surface Model L4 daily 0.25 × 0.25 degree V2.0, Greenbelt, Maryland, USA, Goddard Earth Sciences Data and Information Services Center (GES DISC) [data set], https://doi.org/10.5067/LYHA9088MFWQ, 2018.
Li, W., Ni, L., Li, Z. L., Duan, S. B., and Wu, H.: Evaluation of machine learning algorithms in spatial downscaling of MODIS land surface temperature, IEEE J. Sel. Top. Appl. Earth Obs., 12, 2299–2307, 2019.
Liu, K., Su, H., Li, X., and Chen, S.: Development of a 250-m downscaled land surface temperature data set and its application to improving remotely sensed evapotranspiration over large landscapes in northern China, IEEE T. Geosci. Remote Sens., 60, 1–12, 2020.
López López, P., Sutanudjaja, E. H., Schellekens, J., Sterk, G., and Bierkens, M. F. P.: Calibration of a large-scale hydrological model using satellite-based soil moisture and evapotranspiration products, Hydrol. Earth Syst. Sci., 21, 3125–3144, https://doi.org/10.5194/hess-21-3125-2017, 2017.
Lorenzo-González, M. A., Quílez, D., and Isidoro, D.: Factors controlling the changes in surface water temperature in the Ebro River Basin, J. Hydrol., 47, 101379, https://doi.org/10.1016/j.ejrh.2023.101379, 2023.
Maes, W. H. and Steppe, K.: Estimating evapotranspiration and drought stress with ground-based thermal remote sensing in agriculture: a review, J. Exp. Bot., 63, 4671–4712, 2012.
Main-Knorn, M., Pflug, B., Louis, J., Debaecker, V., Müller-Wilm, U., and Gascon, F.: Sen2Cor for sentinel-2, in: Image and Signal Processing for Remote Sensing XXIII, Vol. 10427, Warsaw, Poland, 37–48, SPIE, https://doi.org/10.1117/12.2278218, October 2017.
Mallick, K., Jarvis, A. J., Boegh, E., Fisher, J. B., Drewry, D. T., Tu, K. P., Hook, S. J., Hulley, G., Ardö, J., Beringer, J., and Arain, A.: A Surface Temperature Initiated Closure (STIC) for surface energy balance fluxes, Remote Sens. Environ., 141, 243–261, 2014.
Maselli, F., Papale, D., Chiesi, M., Matteucci, G., Angeli, L., Raschi, A., and Seufert, G.: Operational monitoring of daily evapotranspiration by the combination of MODIS NDVI and ground meteorological data: Application and evaluation in Central Italy, Remote Sens. Environ., 152, 279–290, 2014.
Mao, Q., Peng, J., and Wang, Y.: Resolution enhancement of remotely sensed land surface temperature: Current status and perspectives, Remote Sens., 13, 1306, https://doi.org/10.3390/rs13071306, 2021.
Martens, B., Miralles, D. G., Lievens, H., van der Schalie, R., de Jeu, R. A. M., Fernández-Prieto, D., Beck, H. E., Dorigo, W. A., and Verhoest, N. E. C.: GLEAM v3: satellite-based land evaporation and root-zone soil moisture, Geosci. Model Dev., 10, 1903–1925, https://doi.org/10.5194/gmd-10-1903-2017, 2017.
Massari, C., Modanesi, S., Dari, J., Gruber, A., De Lannoy, G. J., Girotto, M., Quintana-Seguí, P., Le Page, M., Jarlan, L., Zribi, M., and Ouaadi, N.: A review of irrigation information retrievals from space and their utility for users, Remote Sens., 13, 4112, https://doi.org/10.3390/rs13204112, 2021.
Massari, C., Tarpanelli, A., Aires, F., Alfieri, L., Avanzi, F., Barbetta, S., Bechtold, M., Brocca, L., Camici, S., Castelli, M., and Ciabatta, L.: 4DMED-Hydrology: capitalizing high resolution Earth Observation data for a consistent reconstruction of the Mediterranean terrestrial water cycle, ESA Living Planet Symposium 2022, Bonn, Germany, 23–27 May 2022, http://hdl.handle.net/20.500.12708/80445 (last access: 17 October 2024), 2022.
Mauder, M., Cuntz, M., Drüe, C., Graf, A., Rebmann, C., Schmid, H. P., Schmidt, M. and Steinbrecher, R.: A strategy for quality and uncertainty assessment of long-term eddy-covariance measurements, Agr. Forest Meteorol., 169, 122–135, 2013.
McShane, R. R., Driscoll, K. P., and Sando, R.: A review of surface energy balance models for estimating actual evapotranspiration with remote sensing at high spatiotemporal resolution over large extents, in: U.S. Geological Survey Scientific Investigations Report, US Geological Survey, Reston, VA, USA, Volume 19, 1–30, https://doi.org/10.3133/sir20175087, 2017.
Merlin, O., Duchemin, B., Hagolle, O., Jacob, F., Coudert, B., Chehbouni, G., Dedieu, G., Garatuza, J., and Kerr, Y.: Disaggregation of MODIS surface temperature over an agricultural area using a time series of Formosat-2 images, Remote Sens. Environ., 114, 2500–2512, 2010.
Mildrexler, D. J., Zhao, M., and Running, S. W.: A global comparison between station air temperatures and MODIS land surface temperatures reveals the cooling role of forests, J. Geophys. Res.-Biogeo., 116, G03025, https://doi.org/10.1029/2010JG001486, 2011.
Miralles, D. G., Holmes, T. R. H., De Jeu, R. A. M., Gash, J. H., Meesters, A. G. C. A., and Dolman, A. J.: Global land-surface evaporation estimated from satellite-based observations, Hydrol. Earth Syst. Sci., 15, 453–469, https://doi.org/10.5194/hess-15-453-2011, 2011.
Monteith, J. L.: Evaporation and environment, in: Symposia of the society for experimental biology, Vol. 19, 205–234, Cambridge University Press (CUP) Cambridge, 1965.
Mu, Q., Heinsch, F. A., Zhao, M., and Running, S. W.: Development of a global evapotranspiration algorithm based on MODIS and global meteorology data, Remote Sens. Environ., 111, 519–536, 2007.
Musolino, D., De Carli, A., and Massarutto, A.: Evaluation of socio-economic impact of drought events: The case of Po river basin, European Countryside, 9, 163–176, 2017.
NASA JPL: NASA Shuttle Radar Topography Mission Global 1 arc second, NASA EOSDIS Land Processes DAAC [data set], https://doi.org/10.5067/MEaSUREs/SRTM/SRTMGL1.003, 2013.
Nieto, H., Kustas, W. P., Torres-Rúa, A., Alfieri, J. G., Gao, F., Anderson, M. C., White, W. A., Song, L., Alsina, M. D. M., Prueger, J. H., and McKee, M.: Evaluation of TSEB turbulent fluxes using different methods for the retrieval of soil and canopy component temperatures from UAV thermal and multispectral imagery, Irrig. Sci., 37, 389–406, 2019.
Norman, J. M., Kustas, W. P., and Humes, K. S.: Source approach for estimating soil and vegetation energy fluxes in observations of directional radiometric surface temperature, Agr. Forest Meteorol., 77, 263–293, 1995.
Otkin, J. A., Anderson, M. C., Hain, C., Svoboda, M., Johnson, D., Mueller, R., Tadesse, T., Wardlow, B., and Brown, J.: Assessing the evolution of soil moisture and vegetation conditions during the 2012 United States flash drought, Agr. Forest Meteorol., 218, 230–242, 2016.
Pastorello, G., Trotta, C., Canfora, E., Chu, H., Christianson, D., Cheah, Y. W., Poindexter, C., Chen, J., Elbashandy, A., Humphrey, M., and Isaac, P.: The FLUXNET2015 dataset and the ONEFlux processing pipeline for eddy covariance data, Sci. Data, 7, 1–27, 2020.
Penman, H. L.: Natural evaporation from open water, bare soil and grass, P. Roy. Soc. Lond. A., 193, 120–145, 1948.
Penot, V. and Merlin, O.: Estimating the water deficit index of a Mediterranean holm oak forest from Landsat optical/thermal data: a phenomenological correction for trees casting shadow effects, IEEE J. Sel. Top. Appl. Earth Obs., 16, 5867–5880, https://doi.org/10.1109/JSTARS.2023.3288360, 2023.
Priestley, C. H. B. and Taylor, R. J.: On the assessment of surface heat flux and evaporation using large-scale parameters, Mon. Weather Rev., 100, 81–92, 1972.
Pu, R. and Bonafoni, S.: Thermal infrared remote sensing data downscaling investigations: An overview on current status and perspectives, Remote Sens. Appl., 29, 100921, https://doi.org/10.1016/j.rsase.2023.100921, 2023.
Rajosoa, A. S., Abdelbaki, C., and Mourad, K. A.: Assessing the impact of climate change on the Medjerda River Basin, Arab. J. Geosci., 15, 1052, https://doi.org/10.1007/s12517-022-10288-y, 2022.
Rannik, Ü., Vesala, T., Peltola, O., Novick, K. A., Aurela, M., Järvi, L., Montagnani, L., Mölder, M., Peichl, M., Pilegaard, K., and Mammarella, I.: Impact of coordinate rotation on eddy covariance fluxes at complex sites, Agr. Forest Meteorol., 287, 107940, https://doi.org/10.1016/j.agrformet.2020.107940, 2020.
Reichstein, M., Camps-Valls, G., Stevens, B., Jung, M., Denzler, J., and Carvalhais, N.: Deep learning and process understanding for data-driven Earth system science, Nature, 566, 195–204, 2019.
Ross, A. N. and Grant, E. R.: A new continuous planar fit method for calculating fluxes in complex, forested terrain, Atmos. Sci. Lett., 16, 445–452, 2015.
Sakowska, K., Gianelle, D., Zaldei, A., MacArthur, A., Carotenuto, F., Miglietta, F., Zampedri, R., Cavagna, M., and Vescovo, L.: WhiteRef: A new tower-based hyperspectral system for continuous reflectance measurements, Sensors, 15, 1088–1105, 2015.
Sánchez, J. M., Galve, J. M., Nieto, H., and Guzinski, R.: Assessment of High-Resolution LST Derived From the Synergy of Sentinel-2 and Sentinel-3 in Agricultural Areas, IEEE J. Sel. Top. Appl. Earth Obs., 17, 916–928, 2023.
Senay, G. B., Bohms, S., Singh, R. K., Gowda, P. H., Velpuri, N. M., Alemu, H., and Verdin, J. P.: Operational evapotranspiration mapping using remote sensing and weather datasets: A new parameterization for the SSEB approach, J. Am. Water Resour. As., 49, 577–591, 2013.
Sobrino, J. A., Souza da Rocha, N., Skoković, D., Suélen Käfer, P., López-Urrea, R., Jiménez-Muñoz, J. C., and Alves Rolim, S. B.: Evapotranspiration Estimation with the S-SEBI Method from Landsat 8 Data against Lysimeter Measurements at the Barrax Site, Spain, Remote Sens., 13, 3686, https://doi.org/10.3390/rs13183686, 2021.
SpatioTemporal Asset Catalog Project: STAC Specification v1.0.0, https://stacspec.org/en/ (last access: 5 March 2024), 2023.
Su, Z.: The Surface Energy Balance System (SEBS) for estimation of turbulent heat fluxes, Hydrol. Earth Syst. Sci., 6, 85–100, https://doi.org/10.5194/hess-6-85-2002, 2002.
Sun, L., Chen, Z., Gao, F., Anderson, M., Song, L., Wang, L., Hu, B., and Yang, Y.: Reconstructing daily clear-sky land surface temperature for cloudy regions from MODIS data, Comput. Geosci., 105, 10–20, https://doi.org/10.1016/j.cageo.2017.04.007, 2017.
Trezza, R., Allen, R. G., and Tasumi, M.: Estimation of actual evapotranspiration along the Middle Rio Grande of New Mexico using MODIS and landsat imagery with the METRIC model, Remote Sens., 5, 5397–5423, 2013.
Velpuri, N. M., Senay, G. B., Singh, R. K., Bohms, S., and Verdin, J. P.: A comprehensive evaluation of two MODIS evapotranspiration products over the conterminous United States: Using point and gridded FLUXNET and water balance ET, Remote Sens. Environ., 139, 35–49, 2013.
Weerasinghe, I., Bastiaanssen, W., Mul, M., Jia, L., and van Griensven, A.: Can we trust remote sensing evapotranspiration products over Africa?, Hydrol. Earth Syst. Sci., 24, 1565–1586, https://doi.org/10.5194/hess-24-1565-2020, 2020.
Weiss, M., Baret, F., and Jay, S.: S2ToolBox Level 2 products: LAI, FAPAR, FCOVER, https://step.esa.int/docs/extra/ATBD_S2ToolBox_V2.1.pdf (last access: 17 October 2024), 2016.
Xie, Q., Dash, J., Huete, A., Jiang, A., Yin, G., Ding, Y., Peng, D., Hall, C. C., Brown, L., Shi, Y., and Ye, H.: Retrieval of crop biophysical parameters from Sentinel-2 remote sensing imagery, Int. J. Appl. Earth Obs., 80, 187–195, https://doi.org/10.1016/j.jag.2019.04.019, 2019.
Xue, J., Anderson, M. C., Gao, F., Hain, C., Yang, Y., Knipper, K. R., Kustas, W. P., and Yang, Y.: Mapping daily evapotranspiration at field scale using the harmonized landsat and sentinel-2 dataset, with sharpened VIIRS as a sentinel-2 thermal proxy, Remote Sens., 13, 3420, https://doi.org/10.3390/rs13173420, 2021.
Xue, J., Anderson, M. C., Gao, F., Hain, C., Knipper, K. R., Yang, Y., Kustas, W. P., Yang, Y., Bambach, N., McElrone, A. J., and Castro, S. J.: Improving the spatiotemporal resolution of remotely sensed ET information for water management through Landsat, Sentinel-2, ECOSTRESS and VIIRS data fusion, Irrig. Sci., 40, 609–634, 2022.
Yang, Y., Anderson, M. C., Gao, F., Hain, C. R., Semmens, K. A., Kustas, W. P., Noormets, A., Wynne, R. H., Thomas, V. A., and Sun, G.: Daily Landsat-scale evapotranspiration estimation over a forested landscape in North Carolina, USA, using multi-satellite data fusion, Hydrol. Earth Syst. Sci., 21, 1017–1037, https://doi.org/10.5194/hess-21-1017-2017, 2017.
Yang, Y., Anderson, M., Gao, F., Hain, C., Noormets, A., Sun, G., Wynne, R., Thomas, V., and Sun, L.: Investigating impacts of drought and disturbance on evapotranspiration over a forested landscape in North Carolina, USA using high spatiotemporal resolution remotely sensed data, Remote Sens. Environ., 238, 111018, https://doi.org/10.1016/j.rse.2018.12.017, 2020.
Yang, Y., Anderson, M. C., Gao, F., Wood, J. D., Gu, L. and Hain, C.: Studying drought-induced forest mortality using high spatiotemporal resolution evapotranspiration data from thermal satellite imaging, Remote Sens. Environ., 265, 112640, https://doi.org/10.1016/j.rse.2021.112640, 2021.
Zhang, K., Kimball, J. S., and Running, S. W.: A review of remote sensing based actual evapotranspiration estimation, WIRes Water, 3, 834–853, 2016.
- Abstract
- Introduction
- Study area and datasets
- Methodology
- Results and discussion
- Code and data availability
- Conclusions
- Appendix A
- Appendix B
- Appendix C
- Appendix D: Abbreviations and acronyms
- Author contributions
- Competing interests
- Disclaimer
- Acknowledgements
- Financial support
- Review statement
- References