the Creative Commons Attribution 4.0 License.
the Creative Commons Attribution 4.0 License.
High-resolution observations of the ocean upper layer south of Cape St. Vincent, the western northern margin of the Gulf of Cádiz
Sarah A. Rautenbach
Carlos Mendes de Sousa
Mafalda Carapuço
Paulo Relvas
This article presents an Eulerian physical and biogeochemical dataset from the Iberian Margin Cape St. Vincent Ocean observatory (IbMa-CSV), a facility of the European Multidisciplinary Seafloor and water column Observatory European Research Infrastructure Consortium (EMSO-ERIC), located 10 nautical miles south of Cape St. Vincent (Portugal), the southwest tip of the Iberian Peninsula and western limit of the northern margin of the Gulf of Cádiz (GoC). The observatory was installed on the shelf break, and the data time series spans 4 months for most of the variables. The upper 150 m were sampled intensively with a wave-powered vertical profiler at an average rate of 4.5 profiles per hour recording at 2 Hz when ascending at an approximate velocity of 0.2 m s−1 and 10 Hz when descending at a variable velocity. The vertical resolution was always higher than 0.2 m. Measured channels were conductivity, temperature, pressure, chlorophyll a, dissolved O2 concentration, and turbidity. Derived channels are sea pressure, depth, salinity, speed of sound, specific conductivity, dissolved O2 saturation, density anomaly, spiciness, and Brunt–Väisälä frequency. The acquired dataset includes the flow velocity and direction along the water column, taken from an upward-looking 300 kHz acoustic Doppler current profiler (ADCP) recorded every hour for 3 m depth bins extending the same depth range of the vertical profiler. A standard quality-control scheme was applied to the dataset. The dataset is preserved for multiple use and is accessible in the Sea Open Scientific Data Publication (SEANOE) repository via the following address: https://doi.org/10.17882/94769 (Rautenbach et al., 2022).
- Article
(5853 KB) - Full-text XML
- BibTeX
- EndNote
The Iberian Peninsula (Fig. 1) represents the northern branch of the Canary current upwelling system (CCUS), one of the four eastern boundary upwelling systems (EBUS), along with the Benguela, California, and Humboldt or Peru upwelling systems. These systems are characterized by the coastal upwelling of cold nutrient-rich subsurface water, driven by the joint action of northerly winds that blow at least during a substantial part of the year, and the Earth's rotation (Ekman mechanism). Therefore, those systems are among the most productive of the world ocean, which justifies their socio-economic relevance.
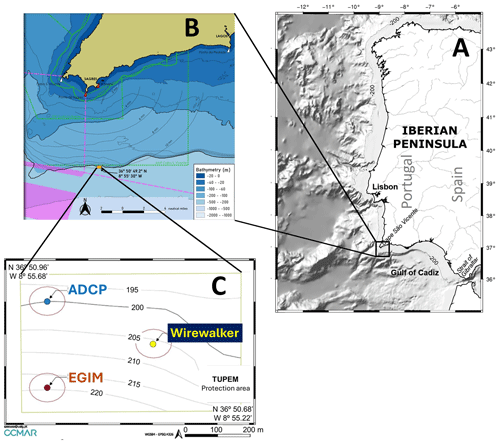
Figure 1Location of the CSV region (a). Reserved TUPEM, managed by the CCMAR. IbMa-CSV is located within the TUPEM area (b). Mooring sites for each platform; vertical wave-powered profiler (surface, yellow), EGIM (subsurface, red), and ADCP (subsurface, blue) (c).
The CCUS is unique among the EBUS, since it is the only one punctuated by a discontinuity that is imposed by the entrance of the Mediterranean Sea into the Gulf of Cádiz (GoC) through the Strait of Gibraltar (Fig. 1). The meridional coast of the western Iberian Peninsula is abruptly interrupted at Cape St. Vincent (CSV), the southwestern tip of the Iberian Peninsula. There, the coastline turns almost at a right angle into the zonal oriented northern margin of the GoC.
The continental shelf off the southern part of western Iberia and in the CSV area is narrow (< 10 km wide south of 38° N) and approximately delimited by the 200 m bathymetric contour. Over the continental shelf and slope, roughly from April to October, the oceanographic conditions are largely dominated by the upwelling process and associated cold jet flowing Equatorward (Relvas and Barton, 2002). For the remainder of the year, the flow is expected to point northward although there is a lack of observational evidence. Nevertheless, there is measured evidence that over the inner shelf, the upwelling pattern is interrupted by the development of a warm coastal countercurrent whenever the upwelling favorable winds relax below a certain threshold (Relvas and Barton, 2005; Garel et al., 2016).
The coastal transition zone, defined as the region where the coastal waters interact with the offshore oceanic waters, is populated by a variety of mesoscale structures, such as meanders, eddies, and filaments. The CSV is the root of a recurrent upwelling filament that may extend more than 150 km offshore (Sanchez et al., 2008), exporting a much larger mass than expected to the open ocean by the purely wind-driven Ekman circulation. The new production of an upwelling season could be entirely exported to the open ocean by upwelling filaments (Arístegui et al., 2006), revealing the importance of such features to the ecosystem functioning.
At deeper levels, where the wind is not a forcing factor, the CSV region reveals fascinating processes related to the Mediterranean Outflow Water (MOW). After leaping the shallow sill (< 300 m deep) of the Strait of Gibraltar, the salty and warmer MOW sinks sharply into the deep GoC (depths up to 4000 m) and spreads at depths between 800 and 1200 m, where it finds the equilibrium in the gravitational field (Sanchez et al., 2017). However, a shallow vein detaches and flows at depths as shallow as 400 m or less along the northern continental slope of the GoC, turning poleward around the CSV (Ambar, 1983; Cardeira et al., 2013).
The higher level of salt entering the North Atlantic through the Strait of Gibraltar and how it spreads throughout the Atlantic basin is a key factor, with implications in the functioning of the Atlantic meridional overturning circulation (AMOC) and, therefore, with climatic consequences. Due to the water column stability, diapycnal mixing of the MOW through entrainment occurs at long timescales when compared with horizontal dispersion through advection (Mauritzen et al., 2001). MOW is dominated by a succession of mesoscale rotating structures, the so-called meddies (Mediterranean eddies) (Bower et al., 1995; Ambar et al., 2008). Meddies are described as rotating salt-water lenses that are typically 50–200 km wide and 100–200 m thick. There is some evidence that the dynamic effect of meddies propagates along the entire water column to the surface (Serra et al., 2010). CSV is identified as a site for meddy generation. Topographic features along the continental slope near CSV are hypothesized to be meddy triggers. The key role that the CSV region plays in a wide variety of oceanographic processes of all scales, some impacting the entire North Atlantic circulation, demonstrates the relevance of the region having a high-resolution subsurface observatory installed.
In the frame of the European Multidisciplinary Seafloor and water column Observatory – European Research Infrastructure Consortium (EMSO-ERIC; https://emso.eu/, last access: 7 October 2024), physical and biogeochemical data from fixed ocean observation platforms throughout Europe are aggregated, harmonized, and openly shared under the Creative Commons Attribution License (CC-BY) license, guaranteeing open access for anyone. EMSO-ERIC is a distributed research infrastructure, encompassing observatories and test sites along European waters from coastal to deep sea locations. Some observatories have already been operating for some time, whereas other nodes are yet to be established.
The EMSO-ERIC initiative defined the Iberian margin, specifically the region southwest of the CSV, as the location to install a regional facility of its European network. Along with other objectives related to geo-hazard seafloor observations, this was the opportunity to carry out long-term in situ observations of the subsurface ocean in a clearly undersampled area regarding its oceanographic relevance. In the region, in situ observations are limited to event-scale records from research cruises. Therefore, the main goal was to construct continuous high-resolution and long-term time series of oceanographic variables along the water column. A mobile platform carrying oceanographic sensors, moving continuously throughout the water column and robust enough to survive the energetic seas of the region for long periods, was carefully selected. The vertical definition of the flow field would be ensured by placing an acoustic Doppler current profiler (ADCP) nearby, sampling the entire water column. The EMSO–Iberian Margin Cape St. Vincent observation platform (IbMa-CSV) is currently producing the first long-term set of observations from which the seminal deployment data are presented in this article.
While in situ observations play a major role in understanding ocean dynamics and can be used for various purposes, until today, the availability of continuous and long-term in situ data of the ocean has been sparse. The construction of long high-resolution time series is fundamental to access the long-term physical and biogeochemical variability in the water column and to improve modeling efforts, meeting climatic change and ecosystem function objectives. The data gathered are highly valuable for the scientific community, with social and economic implications. Most political decisions are made based on evidence or future scenarios, which is mainly provided by numerical models. Due to the turbulent nature of the ocean flow, numerical models need to be parameterized. More accurate parameterizations are achieved when based on in situ observations, the higher the resolution the better, resulting in more realistic numerical models. Therefore, one of the criteria that drove the choice of the observation devices to install at IbMa-CSV was the generation of high-resolution records.
3.1 EMSO–Iberian Margin Cape St. Vincent observatory (IbMa-CSV setup and operation
IbMa-CSV is located at the southwestern tip of the Iberian Margin, 10 nmi south of CSV, on the edge of the continental shelf (approximately 200 m in depth). Deployment site selection carefully considered fishing activity in the surrounding area, avoiding well-known heavy equipment preferred routes (e.g., trawling and longlines). A permit for private use of the national maritime space (TUPEM) was authorized by the Directorate-General for Natural Resources (DGRM) for an area of 0.35 km2, in which the observatory is deployed and should not be entered by other parties. However, ship traffic and fishing activities pose a significant risk to the observatory as the TUPEM area is not patrolled. To minimize this risk, engagement actions were undertaken with local communities, and the legal concession was publicized in local navigation charts through official channels. This approach proved to be successful as there was no visible and/or reported incident. The boundaries of the TUPEM area are 36°50.9087′N, 8°55.6243′ W; 36°50.9600′ N, 8°55.2200′ W; 36°50.6800′ N, 8°55.6800′ W; and 36°50.6800′ N 8°55.2200′ W. Within this area, the instruments are fixed on three separate moorings (Fig. 1c). The TUPEM is managed by the Algarve Centre of Marine Sciences (CCMAR), Faro, Portugal.
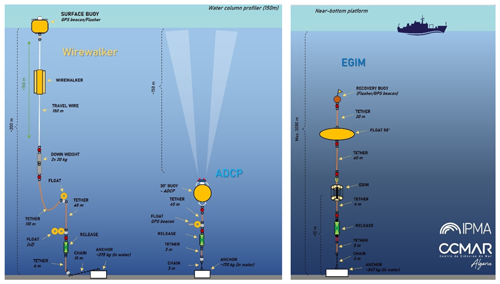
Mooring design followed current best practices (e.g., Coppola et al., 2016) based on two platform types: subsurface (EGIM and ADCP) and surface (vertical profiler; Fig. 2). The subsurface moorings were conceived as linear structures from anchor to buoy, while the surface mooring was based on an inverse catenary configuration. The choice of the hardware to be used in the mooring, i.e., the size and shape of the anchor; type of rope and chain; number, size, and shape of flotation aids and their position along the mooring line; and linking hardware (shackles, swivels, and d-links), were all carefully considered to meet the environmental features of the deployment area (e.g., waves, atmospheric forcing, and presence of strong currents). Static and dynamic behavior of all three designs was then simulated in a dedicated software (ProteusDS) considering time-dependent forcing parameters (wind, currents, and waves) to evaluate vertical load; component position, tilt, and tension; required safe anchor mass; and overall mooring configuration according to different set scenarios, i.e., “normal”, “storm”, and “extreme”. Moorings were required to not only endure extreme conditions without failure, but also maintain operational capabilities (to a reasonable extent) in more energetic events. Simulated results pointed to neglectable instrumentation tilt of the subsurface moorings under a set maximum 0.6 m s−1 current. Regarding the surface mooring, vertical travel wire inclinations greater than 20° were expected to hinder vertical motion. Simulated inclinations were, on average, 5.7, 15.2, and 29.5° under normal, storm, and extreme scenarios, respectively, and as such considered to be satisfactory. Operating depths, i.e., the subsurface platforms broadly placed below 150 m depth, and the vertical profiler traveling between approximately 150 and 1 m in constant motion (∼ five or six full profiles per hour), were expected to deter significant biofouling growth, as such requiring minor control techniques, such as a homespun coating applied to the ADCP transducers (zinc oxide paste mixed with cayenne pepper) as well as copper tape around the optical sensors. Recovered equipment experienced, as expected, biofouling; however, while the ADCP subsurface platforms were unaffected, the vertical profiler was compromised after the 2 months, where algae growth led to salinity sensor operation hindrance. Based on these findings, a new strategy must be developed for future deployments, whether it is to clean the sensors regularly during the deployment period or using innovative biofouling control techniques compatible with available sensors (wipers, non-toxic coating, and UV lights, for instance).
3.2 Data acquisition platforms and settings – instruments, parameters, and sampling
An ADCP (Teledyne RDI Sentinel V100 300 kHz) mounted in an upward-facing subsurface buoy (36.848478° N, −8.927072; 150 m), a vertical wave-powered profiler (Wirewalker) (36.84701° N, −8.92342; near the surface to 150 m), and an EMSO Generic Instrument Module (EGIM) (36.84549° N, −8.927083; 200 m) were deployed from the R/V Mário Ruivo during the EMSO-PT leg 2 campaign in collaboration with the Portuguese Institute for the Sea and Atmosphere, IP (IPMA, IP), in the TUPEM area during June–October 2022 (Fig. 1c).
ADCP data were collected every hour for 3 m depth bins (51 bins in total) mounted at 150 m depth (Fig. 2). The blank right above the ADCP accounts for 2 m. Ping interval was 1 s and number of pings 120. East–west and north–south components (m s−1) of the current together with the magnitude and direction were acquired. Supplemental parameters, substantial for quality control, are additionally provided, including correlation; echo intensity and percent of good return of each of the four beams; as well as heading, pitch, and roll. The ADCP was further equipped with a thermistor and pressure sensor. The ADCP was calibrated before deployment according to manufacturer's guidelines.
A six-channel RBRconcerto CTD, equipped with two Turner Designs Cyclops-7F sensors (chl a and turbidity) and one RBRcoda3 T.ODO (optical dissolved oxygen) were installed in a vertical wave-powered vertical profiler, traveling from about 1 m below surface to 150 m depth at variable speed: upward cast (free floating) ∼ 0.5 m s−1 and downward cast (wave motion) ∼ 0.4 m s−1 (depending on wave conditions). Sampling rate was 2 Hz ascending, and 10 s descending. Measured channels were conductivity, temperature, pressure, chlorophyll a, dissolved O2 concentration, and turbidity. Derived channels are sea pressure, depth, salinity, speed of sound, specific conductivity, dissolved O2 saturation, and density anomaly.
The EGIM, equipped with a SeaBird SBE37, Aanderaa 4831w, RBRquartz3 BPR, WET Labs ECO NTU, OCEANSONICS icListen SB60L-ETH, and Teledyne RDI 300 kHz Workhorse Monitor direct-reading ADCP, was fixed at approximately 200 m depth.
The sampling period was 60 min (ADCP), 15 min (conductivity and temperature, CT; turbidity; and oxygen), 30 s (pressure), and 1 min every 5 min recording (acoustics). The measured channels include conductivity, temperature, pressure, temperature, dissolved O2 concentration, turbidity, currents, and passive acoustics. The derived channels are sea pressure, depth, salinity, speed of sound, specific conductivity, dissolved O2 saturation, and density anomaly. The data time series from the ADCP and the Wirewalker, managed by CCMAR, will be presented in this data paper along with the description of data processing and results.
Instrument data files come in comma-separated value files and are converted into NetCDF format according to Climate and Forecast Conventions 1.6. Files are named after facility code, platform code (WW, EGIM), deployment number (D01, D02, …, Dnn), deployment period, and version (v001, v002, …, vnnn) – e.g., [folder_path]\IBMA-CSV_WW_D01_yyyymmdd_to_yyyymmdd_v001.nc. Changes are tracked in a log text file, which is located in the “dataset type” directory. Instrument data (raw) are identified with the code “*_v001” and metadata with the code “*_M”.
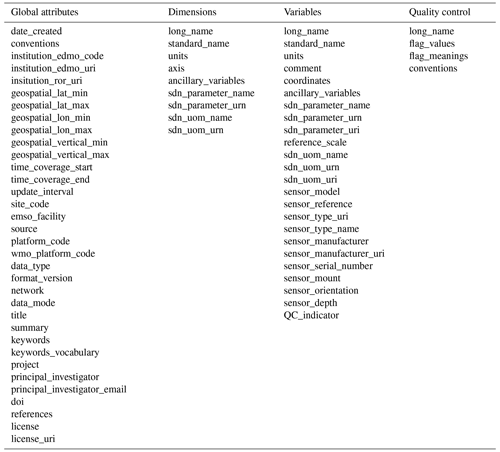
The vertical wave-powered profiler data are divided into six NetCDF files, each one containing approximately 2 million data points, to keep file size reasonable. Each NetCDF file is built on the same structure: global attributes, dimensions, and variables. Global attributes describe the dataset universally through a short descriptive summary as well as other attributes such as temporal extension, geospatial position, principal investigator, person of contact, and more (Table 1). Each variable is embedded in one or more dimensions, in this case: time, longitude, latitude, depth, and bins. Each parameter is accompanied by a set of metadata attributes, holding detailed information about the instrument type, units, and other relevant information regarding the variable. The SeaDataNet parameter discovery vocabulary (https://vocab.seadatanet.org/search, last access: 7 October 2024), well established in ocean science, is used for attributes, dimensions, variables, and units. Further, vocabulary is based on the Copernicus Marine Environment Monitoring Service In Situ Thematic Assembly Centre (CMEMS INSTAC) Manual v3.2 and SeaDataNet OceanSITES Data Format Reference Manual v1.4. Common vocabulary facilitates machine readability and manual discoverability by users. Each dataset is accompanied by comprehensive metadata. Global and variable specific metadata attributes were agreed upon in the Data Management Service Group (DMSG) of EMSO-ERIC (Table 1). The main objective of EMSO-ERIC DMSG is to make each dataset as findable, accessible, interoperable, and (re)usable as possible according to FAIR standards, harmonize data quality control, format, and add metadata to procedures. Each dataset presented in this paper can be reused under the CC-BY 4.0 license (https://spdx.org/licenses/CC-BY-4.0, last access: 7 October 2024). Quality-control variables were created for each measured parameter and for some derived parameters. The quality-control variable name is composed of the variable name of the parameter and the suffix “_QC”. Quality-control procedures and flagging conventions are described in further detail in the next section. For each dataset, it was assured that solely measurements conducted in the water column were considered. This was achieved by examining depth measurements derived from the pressure sensor as well as temperatures indicating atmospheric temperatures. Out-of-water values were removed from each dataset.
Each dataset was subject to quality control (qc). Suspicious and bad values were not removed from the published raw dataset. Instead, the complementary qc variable was created that holds flag values describing each individual parameter value. The flag values are defined by the OceanSITES Data Format Reference Manual v1.4 (OceanSITES, 2020). Flag may take the values 0, 1, 2, 3, 4, 7, 8, or 9 that are defined as “unknown”, “good_data”, “probably_good_data”, “potentially_correctable bad_data”, “bad_data”, “nominal_value”, “interpolated_value”, and “missing_value”, respectively. Suspicious and bad values were flagged as potentially_correctable bad_data (3) and bad_data (4), respectively.
Contrary to the published raw dataset, this paper presents the quality-controlled data. Data flagged as potentially_correctable bad_data, bad_data, and missing_value were excluded from the plots presented in this paper.
ADCP quality control was based on the quality-control procedures from Garel et al. (2016). To ensure that no data subject to site lobe interference are shared, the upper 10 % of the data was flagged as bad_data. Further, the sea surface was detected by locating the cells with a difference among adjacent values greater than three and flagged as bad accordingly. This criterion was restricted to cells above the 14th cell (100 m) to prevent misinterpretation of the surface. Cells above and the cell immediately below were flagged as bad_data. Furthermore, if two or more beams with cells featuring a difference among adjacent bins in echo intensity of > 30 and/or with three or more out of four beams with correlation magnitude values lower than 64 counts were also flagged as bad_data. Temperature was controlled according to SeaDataNet guidelines (see above), and pressure was assessed via visual inspection.
The first quality-control check for the vertical profiler data was done visually via line and box plots of each variable, allowing for a global and regional range check and spike detection at first sight. Quality tests applied on each variable of this dataset were the sensor range test, global range test, regional range test, and spike test. A gradient test was additionally applied to temperature and salinity. Global ranges were obtained from the literature for each variable, whereas regional ranges were discussed and selected with the support of experts from the region.
The temperature and salinity spike test (ST) was conducted according to SeaDataNet Data Quality Control Procedures Manual (SeaDataNet 2010) using the following algorithm: test value = . The value is flagged as bad_data when the test value exceeds 6 °C and 0.9 PSU, respectively. The gradient test (GT) relied on the following algorithm proposed by SeaDataNet: test value = . The value is flagged as bad_data when the test value exceeds 9 °C and 1.5 in salinity, respectively. Spikes in conductivity were determined by interquartile range (IQR) test (Hald, 1952). Quartile two and quartile three make up the interquartile range (IQR) of the data. Two thresholds are defined, one for “suspicious” (1.5) and one for bad_data (3). The IQR is multiplied by each threshold and subtracted (added) from quartile 1 (quartile 3). If a data point exceeds the computed range, it is flagged accordingly. An IQR test was not applied on other variables as it was found to be overly sensitive to biogeochemical variables, discarding reasonable values. Therefore, other manuals and standards were used for spike detection in biogeochemical parameters.
Dissolved oxygen, alongside oxygen saturation, was assessed based on the ST proposed in the Manual for Real-Time Quality Control of Dissolved Oxygen Observations by the Integrated Ocean Observing System (IOOS) Quality Assurance/Quality Control of Real-Time Oceanographic Data (QUARTOD) (IOOS QUARTOD, 2018). A spike reference (average of adjacent points, DOn−2 and DOn) is subtracted from the tested value (Dn−1) and tested against an upper and lower threshold. Values that fail the upper boundaries are flagged as bad_data, and values in the range of the lower and upper threshold are flagged as suspicious. Thresholds for dissolved oxygen and oxygen saturation were set to 4 mg L−1 (lower) and 8 mg L−1 (upper) and 80 % (lower) and 120 % (upper). The most reliable chlorophyll a spike detection for this dataset is proposed by Platforms for Biogeochemical studies: Instrumentation and Measure (PABIM) (PABIM, 2010). The ST algorithm remains the same as in the SeaDataNet guidelines for temperature and salinity. PABIM (PABIM, 2010) suggests an algorithm to define the threshold value that is the most appropriate in any region, which is computed as follows: threshold_value = . Turbidity spikes are detected with the same methodology as chlorophyll a using a predefined threshold of 6 NTU (nephelometric turbidity units).
In this section, we visualize the entire data series of the vertical profiles of the measured and derived variables in a comprehensive way. Only validated data are displayed. Data considered bad or potentially bad were not considered for display or for the interpolations, as stated in the previous section. Preliminary analyses as well as basic statistics are presented.
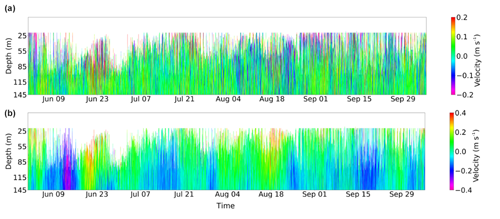
Figure 3Meridional (north–south) (a) and zonal (east–west) (b) components of acoustic Doppler current profiler throughout the whole water column from June to October 2022. White patches reveal absence of valid data. Negative values indicate southward (westward) flow, whereas positive values indicate northward (eastward) flow direction. Measurements are expressed in meters per second. Data above approximately 20 m suffer from surface interference and were removed.
6.1 Acoustic Doppler Current Profiler
Current data from the upward-facing ADCP were acquired from June to October 2022 at a depth of 150 m (Fig. 3). Measurements above 10 m failed the quality-control criteria due to interference with the surface resulting in biased data and were discarded. In the plots, we only present data below 20 m deep (Fig. 3).
Current meter records demonstrate an energetic current regime in the area south of CSV. Clearly, the dominant flow is zonal. The meridional component is weak, without any clear tendency in direction (notice the different scales of the velocity in Fig. 3). The zonal flow shows a prevailing eastward flow, interleaved with sudden inversions to westward. Westward flows are more frequent ard the seafloor.

Figure 4Demonstration of current magnitude and direction of the upper layer (a) (UL; 10–60 m), middle layer (b) (ML; 60–100 m), bottom layer (c) (BL; 100–150 m).
Current meter records were divided into three depth ranges to understand the distinctive current regimes along the vertical. The upper layer (UL) comprises the surface waters, reaching down to 60 m. The middle layer (ML) of the water column ranges from 60 to 100 m, and the bottom layer (BL) covers the range from 100 to 150 m. Polar plots were created for each depth layer to depict the vertical change in the magnitude and direction of the flow (Fig. 4). A relatively energetic flow, showing a few episodes of increased velocities of > 0.75 m s−1, prevails in the upper layer. There, the flow shows a strong eastward component, contrasting with the almost absence of westward flow. In the middle layer this prevalence diminishes, and the flow intensity decays, with velocities sporadically reaching values of > 0.6 m s−1 but mostly ranging between 0.001 and 0.4 m s−1. As we approach the seafloor, in the bottom layer, the flow is weak, with velocities between 0 and 0.2 m s−1, and a prevailing westward component is evident opposed to the upper ocean layer. A basic statistic of the flow velocity for each depth interval is presented too.
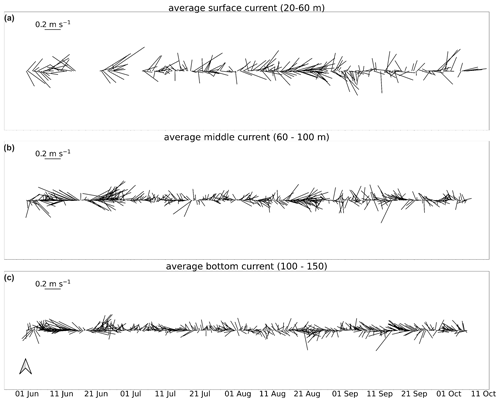
Figure 5ADCP stick plot from June to October 2022, divided into the upper layer (20–60 m; a), middle layer (60–100 m; b), and bottom layer (100–150 m; c).
Table 2Statistics of the upper layer (UL; 10–60 m), middle layer (ML; 60–100 m) and bottom layer (BL; 100–150 m) grouped by month. SD represents the standard deviation. Values are expressed in meters per second.

To detail the temporal variability in the mean flow in each depth layer, stick diagrams are presented for each depth layer (Fig. 5). The intensified current in the upper layer can be observed throughout the whole period of the deployment. A more diffuse pattern in direction, along with the decrease in velocity, can be observed in the lower layers, except for during a short period during mid-June. However, there is a prevalence of zonal flow, interrupted periodically by momentary direction changes. June can be identified as the most energetic month in the time series, featuring the highest mean values throughout the water column.
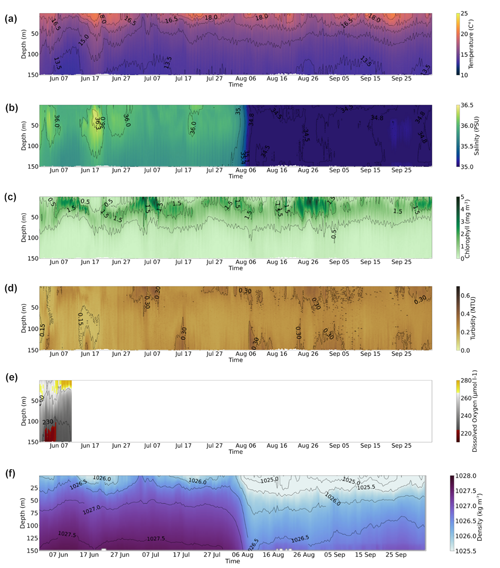
Figure 6Continuous vertical wave profiler data for June–October 2022. Temperature (°C) (a), salinity (b), chlorophyll a concentration (mg m−3) (c), turbidity (NTU) (d), dissolved oxygen (µmol l−1) (e), and density (kg m−3) (f). Salinity and density values after the month of July are ambiguous and are discarded from further discussion.
Table 3Statistics of vertical wave-powered profiler parameters grouped by month. SD represents the standard deviation. Recordings are lacking for the variables of dissolved oxygen and oxygen saturation after the first half of June and for salinity after July.

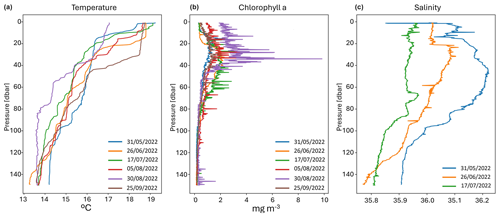
Figure 7Examples of individual vertical profiles of temperature (°C) (a), chlorophyll a (mg m−3) (b), and salinity (c).
6.2 Vertical wave-powered profiler
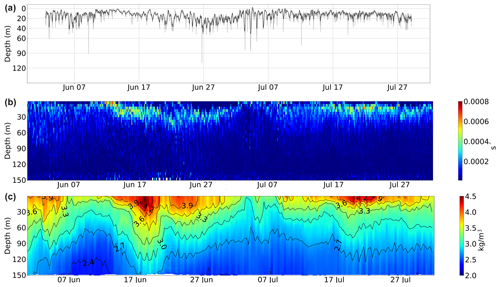
Continuous time series of the entire water column are highly valuable as they offer vast amounts of data and can create a comprehensive picture of mesoscale and sub-mesoscale processes. The vertical wave-powered profiler, equipped with physical and biogeochemical sensors, operated for 4 months continuously and delivered a rich dataset at the end of the deployment. Vertical profiles of the water column show temperatures between 12.5 °C closer to the seafloor to approximately 22 °C on the surface (Fig. 6; Table 3). The thermocline remains between 20 and 40 m, showing some periods of a well-mixed homogenous surface layer and periods of more stratified waters (Figs. 6 and 7). Salinities are found to range between 33 and 37 from June to the end of July, with an average salinity of 35.95 (SD ± 0.13) and 35.88 (SD ± 0.09), respectively (Fig. 6; Table 3). Salinity data beyond that point were discarded and will not be discussed further as the conductivity sensor was subject to intense biofouling, prohibiting the collection of trustworthy measurements after the month of July. Due to that, the mixed layer depth was only computed for the months of June and July, showing an average mixed-layer depth (MLD) around the 10–20 m mark, following the pattern of the thermocline (Fig. 8a). The dissolved oxygen sensor shows lower oxygenated waters in deeper waters but stopped operating after 2 weeks (Fig. 6). The chlorophyll a maximum can be found between 20–60 m, with concentrations between 1 and 10 mg m−3 and mitigates to almost 0 mg m−3 below (Figs. 6 and 7; Table 3). Turbidity concentrations correspond to chlorophyll a during the whole course of the measurements, with average concentrations of 0.25 NTU (SD ± 0.17), indicating the correlation between turbidity and biomass, with some additional phases of increased turbidity concentrations close to the seafloor (Table 3). In June, two periods of increased salinity were recorded between 1 and 6 and during 13–21 June near the surface down to 120 m depth, together with mitigation in chlorophyll a concentration, migrating to deeper layers along the mixed layer to a depth of approximately 60 m (Figs. 6 and 8). The salty waters appear in the form of an isolated lens, carrying a maximum salinity of 36.72 (Figs. 6 and 7). Simultaneously, an intensification in stability and spiciness can be observed (Fig. 6). Spiciness was computed with the Thermodynamic Equation of SeaWater 2010 (TEOS-10) from absolute salinity and conservative temperature according to McDougall and Krzysik (2015).
Throughout the first half of July, colder and less saline waters shoal toward the surface, with average values of 14.83 ± 1.44 °C and 35.87 ± 0.07, respectively (Fig. 6), resulting in a well-mixed and homogenous water column. In response, stability and spiciness decrease (Fig. 8), accompanied by increasing chlorophyll a concentration (0.9 ± 1.03 mg m−3) and turbidity (0.26 ± 0.07 NTU). In the second half of the month, surface waters experience warming and a slight average increase to up to 15.40 ± 1.83 °C along with an increased stability and spiciness (Figs. 6 and 8). Stratification enhances during August due to a deepening of the warmer surface waters to a depth of approximately 60 m (Fig. 8). Around 24 August, colder temperate waters shoal toward the surface (19.4 °C), simultaneously with an inflation of the maximum chlorophyll a concentration (10.51 mg m−3), attenuating in the beginning of September. Upper-layer stratification stabilizes throughout the month of September, with temperatures of around 21 °C in the upper 40 m, with an increased period of warming between the second and third week of the month, along with a slight decrease in chlorophyll a (Fig. 6). The same pattern was observed during mid-August, in which, with increased surface temperatures, higher chlorophyll a concentrations migrate to deeper layers, similarly to the third week of July.
Quality-controlled datasets are made publicly available as NetCDF files at the environmental data repository SEANOE under the DOI https://doi.org/10.17882/94769 (Rautenbach et al., 2022) and DOI https://doi.org/10.17882/95468 (Carapuco et al., 2022) in accordance with FAIR principles (Wilkinson et al., 2019). Beyond the repository, data are ingested into the CCMAR ERDDAP server (https://erddap.ccmar.ualg.pt/erddap/index.html, CCMAR, 2024), in which a first data visualization and data can be downloaded in various file formats selectively from the user. Further, the data are shared with the EMSO-ERIC Data Portal (https://data.emso.eu, EMSO ERIC, 2024), in which users can visualize and download data according to their needs. The data are not restricted and are accessible for anyone, accompanied by comprehensive metadata. Standardized datasets allow for machine readability and interoperability with various software.
This dataset conveys the importance of continuous, long-term data acquisition and ocean monitoring to capture mesoscale and sub-mesoscale events in the ocean. As presented before it was detected, for example, during the second half of June, the thermohaline records were fascinating. This deployment was the first test run of the IbMa-CSV ocean observatory. Sensor failure due to biofouling will be tackled by following a regular cleaning of the sensors at specific time intervals while deployed (profiler) and by reducing deployment turnaround with a second vertical wave-powered profiler. Hence, the two profilers will alternate in a minimum 4-month rhythm, therefore guarantying a continuous data collection. The vertical wave-powered profiler offers impeccable high temporal and vertical resolution data products at reasonable cost and with maintenance. The only instruments which provide data products with comparable resolution are autonomous underwater vehicles and gliders. Yet, both economically and regarding the scope of establishing an Eulerian, long-term observation platform, these instruments cannot compete, underpinning the exceptional potential of the vertical wave-powered profiler and its data products.
The monitoring of energetic areas, such as the western tip of the northern margin of the Gulf of Cádiz (the CSV), is crucial to understanding the complexity of the ocean dynamics and to predict future development via ocean models and their validation through comprehensive datasets. A wide range of processes, from the upper-layer wind-induced upwelling to deeper MOW features, do occur in the ocean surrounding CSV, as described in the Introduction. Intense mesoscale and sub-mesoscale activity that represents the “weather” variability in the ocean imposed by the turbulent nature of the circulation is quite conspicuous in this region and dominates all levels of the water column, challenging the investigation of a wide range of oceanographic processes.
Efforts have been made to develop numerical models for this region, with the aim of better understanding the exchange and mixing processes that occur there and their implications for the ecosystem and salt spreading in the North Atlantic. However, there is no general theory of turbulence, and numerical models must rely on parameterizations to solve this macro-turbulence. The correct parameterization of the turbulent behavior of the ocean depends on the previous knowledge that we have about the physical characteristics of the region to be modeled. This knowledge is built on the observation of the ocean. Higher-resolution observations will produce better parameterizations of the numerical models. The present knowledge of the oceanography of the region is inferred from event-scale sampling, leading to regional numerical models which are highly data deficient and tend to use parameterization analogies with ocean regions with similar oceanographic characteristics that are intensively sampled, such as the California upwelling system (Macias et al., 2014; Janeiro et al., 2017). This data series will make it possible to find better parameters for the region and to solve the turbulence and turbulence-related ocean processes more realistically.
The present dataset, with such a vertical and temporal resolution, is unique in the region. The nearest moorings, operated by Instituto Hidrográfico (Portugal), are more than 120 km away and only take measurements at the surface (https://www.hidrografico.pt/index/en, last access: 7 October 2024). The velocity field is only assessed at the surface through high-frequency radars (HFRs) that cover the region, operated by Puertos del Estado (Spain) (https://www.puertos.es, last access: 7 October 2024) and Instituto Hidrográfico (Portugal). For the first time, the subsurface is sampled in the region. The high-resolution sampling, covering the surface layer down to a depth of 150 m, makes this dataset unique in a vast area of the ocean, disclosing the high oceanographic value of the dataset. The IbMa-CSV ocean observatory was established in the scope of EMSO-ERIC, a European-wide ocean observatory network, and will be further developed and improved to operate continuously and in the long term.
EMSO data are published without any warranty, express or implied. The user assumes all risk arising from the use of EMSO data. EMSO data are intended to be of research quality and include estimates of data quality and accuracy, but it is possible that these estimates or the data themselves contain errors. It is the sole responsibility of the user to assess if the data are appropriate for their use and to interpret the data, data quality, and data accuracy accordingly. EMSO welcomes users to ask questions and report problems to the contact addresses listed in the data files or on the EMSO web page.
CMdS designed the instrument setup and the deployment strategy. SAR, PR, CMdS, and MC carried out the equipment deployment and recovery. SAR did the data processing, harmonization, and publishing. SAR, PR, and CMdS prepared the paper, with contributions from all co-authors.
The contact author has declared that none of the authors has any competing interests.
Publisher's note: Copernicus Publications remains neutral with regard to jurisdictional claims made in the text, published maps, institutional affiliations, or any other geographical representation in this paper. While Copernicus Publications makes every effort to include appropriate place names, the final responsibility lies with the authors.
The authors would like to acknowledge the support from the Portuguese FCT – Foundation for Science and Technology, from the operational programs CRESC Algarve 2020 and COMPETE 2020, and from the EEA Grants Blue Growth project “Atlantic Observatory – Data and Monitoring Infrastructure”. We would also like to acknowledge and thank the R/V Mário Ruivo for the ship time and support of the crew. The authors would like to acknowledge that the research for this study was conducted at the Centre of Marine Sciences (CCMAR), University of Algarve, Faro, Portugal, and at the Portuguese Institute for the Sea and Atmosphere (IPMA, IP), Lisbon, Portugal.
This study received Portuguese national funds from FCT – Foundation for Science and Technology through project nos. UIDB/04326/2020 (https://doi.org/10.54499/UIDB/04326/2020), UIDP/04326/2020 (https://doi.org/10.54499/UIDP/04326/2020), and LA/P/0101/2020 (https://doi.org/10.54499/LA/P/0101/2020); from the operational programs CRESC Algarve 2020 and COMPETE 2020 through project nos. EMBRC.PT ALG-01-0145-FEDER-022121 and EMSO-PT ALG-01-0145-FEDER-022231; and from the EEA Grants Blue Growth project “Atlantic Observatory – Data and Monitoring Infrastructure” (grant no. PT-INNOVATION-0002).
This paper was edited by François G. Schmitt and reviewed by two anonymous referees.
Ambar, I.: A shallow core of Mediterranean water off western Portugal, Deep-Sea Res., 30, 677–680, 1983.
Ambar, I., Serra, N., Neves, F., and Ferreira, T.: Observations of the Mediterranean Undercurrent and eddies in the Gulf of Cadiz during 2001, J. Marine Syst., 71, 195–220, 2008.
Arístegui, J., Álvarez-Salgado, X., Barton, E., Figueiras, F., Hernández-León, S., Roy, C., and Santos, A.: Oceanography and fisheries of the Canary Current/Iberian region of the eastern North Atlantic, in: The Sea, The Global Coastal Ocean: Interdisciplinary Regional Studies and Syntheses, vol. 14 (Part B), edited by: Robinson, A. and Brink, K., Harvard University Press, Cambridge, MS, 877–931, ISBN: 0-674-01527-4, 2006.
Bower, A., Armi, L., and Ambar, I.: Direct evidence of meddy formation off the southwestern coast of Portugal, Deep-Sea Res., 42, 1621–1630, 1995.
Carapuço, M., Miranda, M., Sousa, C., Rautenbach, S., Silveira, T., Silva, E., and Ferreira, H.: EMSO-Iberian Margin Cape St. Vincent observatory data (EMSO Generic Instrument Module (EGIM)) from Jun-Oct 2022, SEANOE [data set], https://doi.org/10.17882/95468, 2022.
Cardeira, S., Rita, F., Relvas, P., and Cravo, A.: Chlorophyll a and chemical signatures during an upwelling event off the South Portuguese coast (SW Iberia), Cont. Shelf Res., 52, 133–149, https://doi.org/10.1016/j.csr.2012.11.011, 2013.
Coppola, L., Ntoumas, M., Bozzano, R., Bensi, M., Hartman, S. E., Charcos Llorens, M., Craig, J., Rolin, J-F., Giovanetti, G., Cano, D., Karstensen, J., Cianca, A., Toma, D., Stasch, C.,Pensieri, S., Cardin, V., Tengberg, A., Petihakis, G., and Cristini, L.: Handbook of Best Practices for Open Ocean Fixed Observatories, FixO3 Project, 127, FP7 Programme 2007–2013 under grant agreement no 312463, European Commission, 2016.
EMSO ERIC – European Multidisciplinary Seafloor and water-column Observatory European Research Infrastructure Consortium: EMSO-ERIC Data Portal, https://data.emso.eu/, last access: 8 October 2024.
Garel, E., Laiz, I., Drago, T., and Relvas, P.: Characterisation of coastal counter-currents on the inner shelf of the Gulf of Cadiz, J. Marine Syst., 155, 19–34, 2016.
Hald, A.: Statistical theory with engineering applications, John Wiley Sons, New York, ISBN-10 0471340561, 1952.
IOOS QUARTOD: Manual for Real-Time Quality Control of Dissolved Oxygen Observations, Version 2.1, August, https://cdn.ioos.noaa.gov/attachments/2018/08/QARTOD_DOSecondUpdate_final.pdf (last access: 27 March 2023), 2018.
Janeiro, J., Neves, A., Martins, F., and Relvas, P.: Integrating technologies for oil spill response in the SW Iberian coast, J. Marine Syst., 173, 31–42, 2017.
Macias, D. M., Guerreiro, C. T., Prieto, L., Peliz, A., and Ruiz, J.: A high-resolution hydrodynamic-biogeochemical coupled model of the Gulf of Cadiz – Alboran Sea region, Mediterr. Mar. Sci., 15, 739–752, 2014.
Mauritzen, C., Morel, Y., and Paillet, J.: On the influence of Mediterranean water on the central waters of the North Atlantic Ocean, Deep-Sea Res. Pt. I, 48, 347–38, 2001.
McDougall, T. J. and Krzysik, O. A.: Spiciness, J. Mar. Res., 73, 141–152, https://elischolar.library.yale.edu/journal_of_marine_research/408 (last access: 8 October 2024), 2015.
OceanSITES: Data Format Reference Manual, Version 1.4, OceanSITES Data Format Reference Manual NetCDF Conventions and Reference Tables. Version 1.4, 16 July 2020.
PABIM: White book on oceanic autonomous platforms for biogeochemical studies: Instrumentation and measure, Version 1.3, Platforms for Biogeochemical studies: Instrumentation and Measure, https://www.coriolis.eu.org/content/download/3150/23513/file/2009_PABIM_white_book_version1.3.pdf (last access: 27 March 2023), 2010.
Rautenbach, S., Relvas, P., and Sousa, C.: EMSO-Iberian Margin Cape St. Vincent observatory data (subsurface mooring) from Jun–Oct 2022, SEANOE [data set], https://doi.org/10.17882/94769, 2022.
Relvas, P. and Barton, E. D.: Mesoscale patterns in the Cape São Vicente (Iberian Peninsula) upwelling region, J. Geophys. Res., 107, 3164, https://doi.org/10.1029/2000JC000456, 2002.
Relvas, P. and Barton, E. D.: A separated jet and coastal counterflow during upwelling relaxation off Cape São Vicente (Iberian Peninsula), Cont. Shelf Res., 25, 29–49, 2005.
Sánchez, R. F., Relvas, P., Martinho, A., and Miller, P.: Physical description of an upwelling filament west of Cape St. Vincent in late October 2004, J. Geophys. Res., 113, C07044, https://doi.org/10.1029/2007JC004430, 2008.
Sánchez-Leal, R. F., Bellanco, M. J., Fernández-Salas, L. M., García-Lafuente, J., Gasser-Rubinat, M., González-Pola, C., Hernández-Molina, F. J., Pelegrí, J. L., Peliz, A., Relvas, P., Roque, D., Ruiz-Villarreal, M., Sammartino, S., and Sánchez-Garrido, J. C.: The Mediterranean Overflow in the Gulf of Cadiz: A rugged journey, Sci. Adv., 3, eaao0609, https://doi.org/10.1126/sciadv.aao0609, 2017.
SeaDataNet: Data Quality Control Procedures, 6th Framework of EC DG Research, Version 2.0, https://www.seadatanet.org/Standards/Data-Quality-Control (last access: 27 March 2023), 2010.
Serra, N., Ambar, I., and Boutov, D.: Surface expression of Mediterranean Water dipoles and their contribution to the shelf/slope – open ocean exchange, Ocean Sci., 6, 191–209, https://doi.org/10.5194/os-6-191-2010, 2010.
Wilkinson, M. D., Dumontier, M., Jan Aalbersberg, I., Appleton, G., Axton, M., Baak, A., Blomberg, N., Boiten, J., da Silva Santos, L. B., Bourne, P. E., Bouwman, J., Brookes, A. J., Clark, T., Crosas, M., Dillo, I., Dumon, O., Edmunds, S., Evelo, C. T., Finkers, R., Gonzalez-Beltran, A., Gray, A. J. G., Groth, P., Goble, C., Grethe, J. S., Heringa, J., Hoen, P. A. C. 't., Hooft, R., Kuhn, T., Kok, R., Kok, J., Lusher, S. J., Martone, M. E., Mons, A., Packer, A. L., Persson, B., Rocca-Serra, P., Roos, M., van Schaik, R., Sansone, S., Schultes, E., Sengstag, T., Slater, T., Strawn, G., Swertz, M. A., Thompson, M., van der Lei, J., van Mulligen, E., Jan Velterop, Waagmeester, A., Wittenburg, P., Wolstencroft, K., Zhao, J., and Mons, B.: Addendum: the FAIR guiding principles for scientific data management and stewardship, Sci. Data, 6, 6, https://doi.org/10.1038/s41597-019-0009-6, 2019.


