the Creative Commons Attribution 4.0 License.
the Creative Commons Attribution 4.0 License.
 | 13 Sep 2024
Weekly green tide mapping in the Yellow Sea with deep learning: integrating optical and synthetic aperture radar ocean imagery
Yuan Guo
Xiaofeng Li
Since 2008, the Yellow Sea has experienced the world's largest-scale marine disaster, the green tide, marked by the rapid proliferation and accumulation of large floating algae. Leveraging advanced artificial intelligence (AI) models, namely AlgaeNet and GANet, this study comprehensively extracted and analyzed green tide occurrences using optical Moderate Resolution Imaging Spectroradiometer (MODIS) images and microwave Sentinel-1 synthetic aperture radar (SAR) images. However, due to cloud and rain interference and the varying observation frequencies of the two types of satellites, the daily green tide coverage time series throughout the entire life cycle often contain large gaps and missing frames, resulting in discontinuity and limiting their use. Therefore, this study presents a continuous and seamless weekly average green tide coverage dataset with a resolution of 500 m, by integrating highly precise daily optical and SAR data for each week during the green tide breakout. The uncertainty assessment shows that this weekly product conforms to the life pattern of green tide outbreaks and exhibits parabolic-curve-like characteristics, with a low uncertainty (R2=0.89 and RMSE=275 km2). This weekly dataset offers reliable long-term data spanning 15 years, facilitating research in forecasting, climate change analysis, numerical simulation, and disaster prevention planning in the Yellow Sea. The dataset is accessible through the Oceanographic Data Center, Chinese Academy of Sciences (CASODC), along with comprehensive reuse instructions provided at https://doi.org/10.12157/IOCAS.20240410.002 (Gao et al., 2024).
- Article
(22295 KB) - Full-text XML
-
Supplement
(59711 KB) - BibTeX
- EndNote


The Yellow Sea (illustrated in Fig. 1) is situated between China and the Korean Peninsula and is a marginal sea with abundant biodiversity. The Yellow Sea green tide presents a formidable ecological challenge within this maritime expanse. Comprised primarily of large floating algae, notably Ulva prolifera, these algae proliferate and aggregate under particular environmental conditions, culminating in marine ecological disasters. The Yellow Sea green tide showcases distinctive seasonal and spatiotemporal distribution patterns. Since 2008, and even earlier, they have occurred annually from early May to late August, traversing from the Subei Shoal in the western Yellow Sea to the Shandong Peninsula in the northern Yellow Sea (Fig. 1). Throughout this migration, green algae undergo rapid proliferation and aggregation, forming the world's most extensive green algal belts (Liu et al., 2013; Wang et al., 2015; Valiela et al., 2018). Changes in the drift patterns and strength of these green tide blooms could significantly affect offshore fishery resources, the ecological environment, and the tourism industry of the Yellow Sea (Cao and Han, 2020). Consequently, monitoring and analyzing the Yellow Sea green tide remain imperative and pressing tasks.
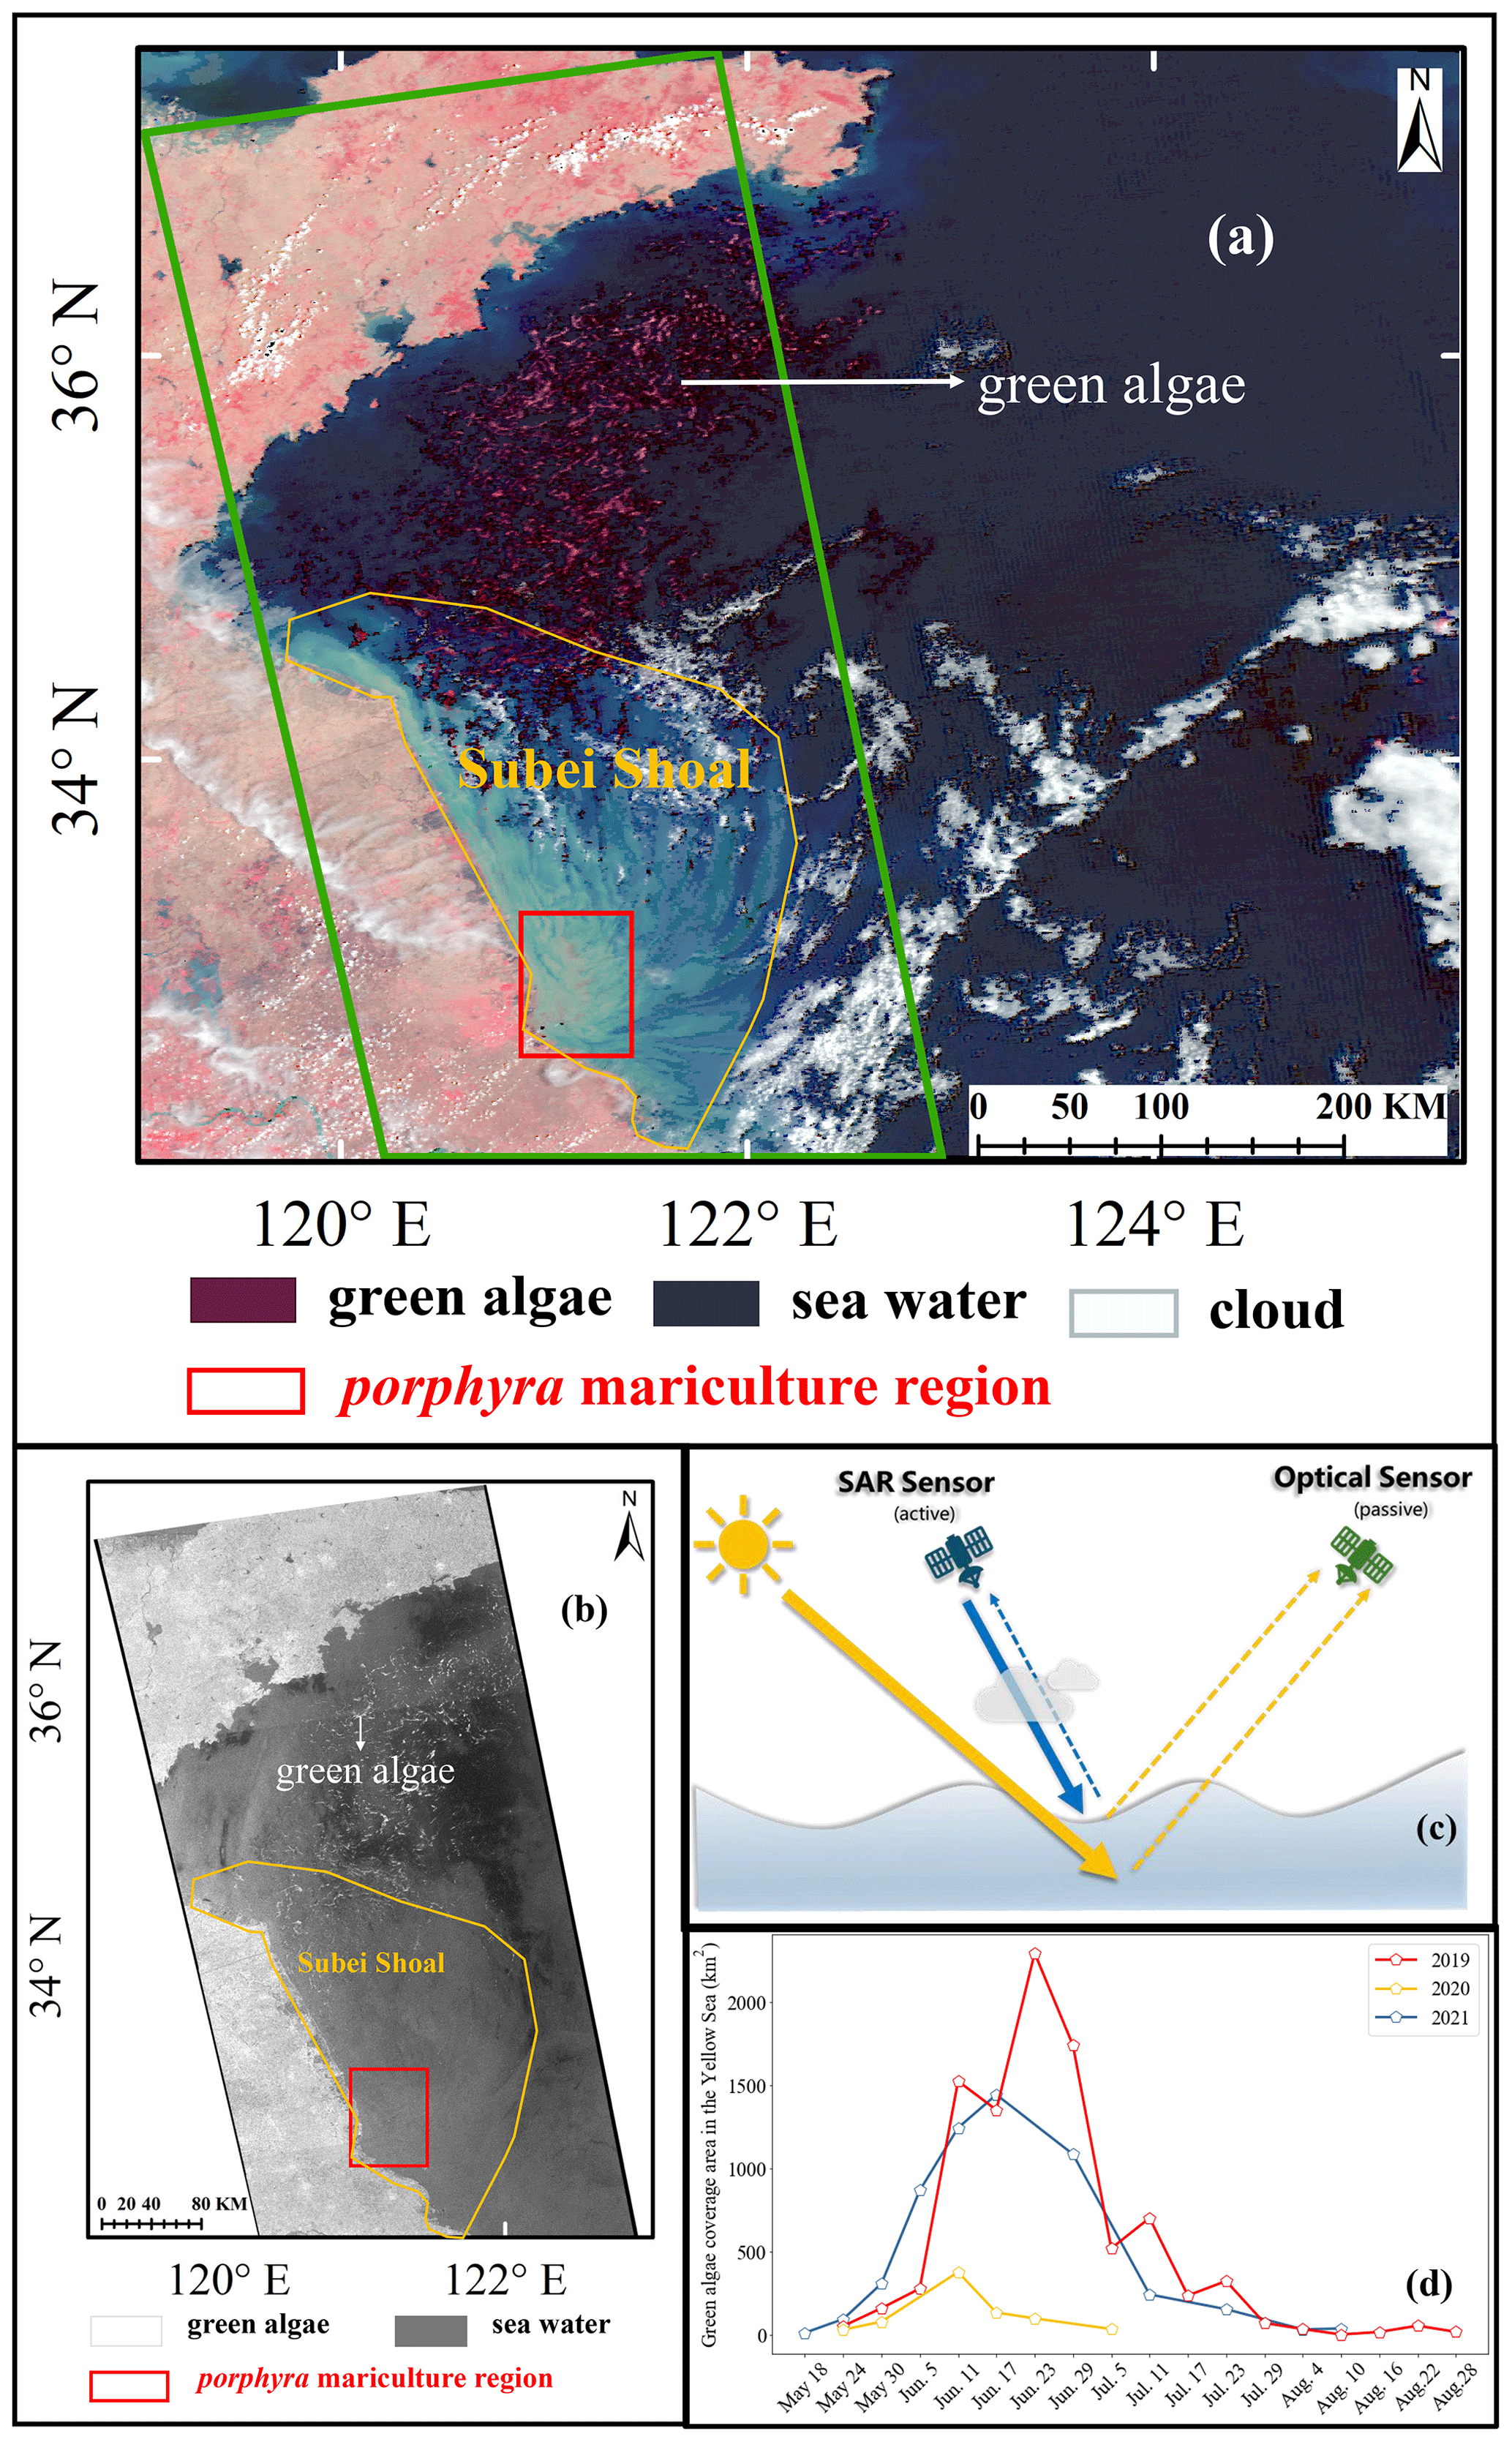
Figure 1The occurrence scale of green tides in the Yellow Sea. (a) False-color image synthesized from near-infrared, red, and green bands. (b) Sentinel-1 SAR image captured within the Yellow Sea, corresponding to the location indicated by the green box in (a). (c) Schematic diagram depicting the optical and SAR imaging processes. (d) Randomly selected daily green tide coverage in 2019–2021, revealing a distinct “parabola-like” pattern.
Due to its extensive coverage and rapid revisit capabilities, satellite remote sensing technology has emerged as the predominant method for spatiotemporal monitoring of large floating algae. Previous research has leveraged optical and synthetic aperture radar (SAR) satellite imagery to track the entire life cycle of green tides (see Fig. 1a and b). Optical satellite sensors, typified by the Moderate Resolution Imaging Spectroradiometer (MODIS) on board the Terra and Aqua satellites; the Multispectral Scanner (MSS), Thematic Mapper (TM), Enhanced Thematic Mapper Plus (ETM+), Operational Land Imager (OLI), and Thermal Infrared Sensor (TIRS) on board Landsat (a series of Earth-observing satellite missions that have taken place since 1972); the Visible Infrared Imaging Radiometer Suite (VIIRS) on board the Suomi National Polar-Orbiting Partnership (Suomi NPP) spacecraft; and the Geostationary Ocean Color Imager (GOCI) on board the Communication, Ocean and Meteorological Satellite (COMS), have become the primary data source for extracting green tide information (Xing and Hu, 2016; Xing et al., 2018, 2019). As illustrated in Fig. 1a, green algae manifests as a distinct red strip in the false-color image synthesized from near-infrared, red, and green bands, presenting a stark contrast with the surrounding seawater. However, owing to the spectral reflectance similarity between green algae and terrestrial vegetation, numerous biological indices such as the normalized difference vegetation index (NDVI), floating algae index (FAI), and alternative floating algae index (AFAI) have been proposed and utilized for green algae extraction (Hu, 2009; Son et al., 2012; Fang et al., 2019). Yet, due to the coarse resolution and mixed pixels of optical satellite images, only relatively large green algae strips can be identified, resulting in both overestimation and underestimation issues in optical imagery (Cui et al., 2018, 2020). Moreover, despite the daily transit of optical satellites over the Yellow Sea area, the continuous observation of green tide information is impeded by the presence of clouds and rain.
SAR presents an alternative effective tool for monitoring green tides, exemplified by Sentinel-1 and Gaofen-3. Unaffected by clouds and rain, SAR sensors operate under all-weather conditions (Qi et al., 2022a). SAR emits radar pulses using several polarization modes and retrieves backscattering signals from the sea surface, known as the normalized radar cross section (NRCS). The NRCS is commonly affected by Bragg waves generated by winds and currents. As green algae float on the sea surface and mimic solid objects, they produce significant volume scattering or double/triple bouncing in the incoming radar signal due to their solid structure. Numerous methods have been proposed to extract green tide information from radar NRCS data under different polarization modes, including threshold-based automatic approaches and empirical human threshold methods (Yu et al., 2020; Yuan et al., 2022). Essentially, these methods classify green algae based on the contrast between algae and seawater. With higher resolution, narrower observation swaths, and long revisit cycles (e.g., Sentinel-1's single satellite with a 12 d cycle and a constellation of two satellites enabling global image capture every 6 d), microwave SAR imagery can capture even the smallest patches of green algae (Fig. 1b). However, their coverage of the entire Yellow Sea remains incomplete, as depicted in Fig. 1b. Green algae strips exhibit strong reflectivity, appearing as bright white patches on SAR images, while seawater seems black. As microwaves cannot penetrate seawater, SAR sensors only capture green algae completely floating on the sea surface, thus omitting information about green algae below the seawater surface (see Fig. 1c and Gao et al., 2022). Moreover, the outbreak of green tide has significant inter-annual variations in outbreak magnitude (Guo et al., 2016; Xing et al., 2019), including the conspicuous “parabola-like” pattern, illustrated in Fig. 1d.
Therefore, integrating the green algae extraction results from both optical MODIS and microwave SAR systems not only enhances the effective number of daily observations throughout the algae's life cycle but also addresses the limitations of each system. The optical MODIS system typically observes large green algae strips due to their coarse resolution, while SAR primarily detects green algae on the sea surface. Combining these datasets generates a fusion product, comprehensively representing continuous green tide changes. However, as mentioned earlier, daily optical MODIS satellite records of green tide coverage have numerous missing values due to cloud and rain interference. The Sentinel-1 SAR satellite has a relatively slower return cycle than the optical MODIS satellite, resulting in a low observation frequency for daily green tide monitoring. The green tide outbreak process is characterized by rapid changes over short periods (Fig. 1d), making it challenging for daily optical and SAR data to capture the outbreak at a continuously high frequency. Hu et al. (2023) proposed using monthly average green tide coverage data to address the limitations of daily data. However, the Yellow Sea green tide occurs from early May to the end of August, lasting about 4 months. Consequently, the monthly average data only provide one record per month, totaling about four records for the entire life cycle, which is insufficient to fully describe the outbreak dynamics due to its low temporal resolution. In response to the shortcomings of daily and monthly records, it is urgent to propose a weekly average green tide coverage dataset. This dataset offers higher temporal resolution than monthly averages and provides seamless and continuous coverage compared to daily data, making it more suitable for studying green tide outbreaks.
In recent years, propelled by the rapid advancements in artificial intelligence (AI) technology (Jordan and Mitchell, 2015; LeCun et al., 2015; Li et al., 2020, 2022; Dong et al., 2022; Chen et al., 2023; Wang and Li, 2024), several green tide extraction algorithms based on deep learning have emerged. Notably, models such as AlgaeNet (Gao et al., 2022) and GANet (Guo et al., 2022) leverage image texture enhancement mechanisms and attention mechanisms, effectively addressing the challenge of algae–water imbalance for the optical MODIS and Sentinel-1 SAR imagery. These models boast superior detection accuracy and generalization capabilities compared to some state-of-the-art models, e.g., classic U-Net, Visual Geometry Group 16 (VGG16), random forest (RF), and normalized difference vegetation index (NDVI). They eliminate the need for fixed threshold selection, ensuring consistent green algae detection across diverse imaging conditions. However, the efficacy of AI models hinges on the availability of abundant representative green algae training samples across various environmental scenarios, necessitating labor-intensive and time-consuming manual labeling efforts. Consequently, manual labeling and sharing representative sample labels have posed persistent challenges. Moreover, despite the plethora of green algae extraction algorithms proposed in previous studies, the time series of historical green tide coverage datasets, dating back to the inception of green tide records, have yet to be made publicly available and shared (Hu et al., 2019, 2023; Cao et al., 2023). These datasets serve as the foundation of green tide research and provide essential data for the mutual comparison and verification of various extraction algorithms.
The objective of this article, illustrated in Fig. 2, is to develop a weekly green algae coverage dataset by integrating optical and SAR data. This dataset addresses limitations such as missing small strips in optical images due to coarse resolution and the inability of SAR to observe green algae not completely floating on the sea surface. It also aims to overcome the “discontinuous” characteristics of previous daily green algae coverage datasets, while maintaining a relatively high observation frequency.
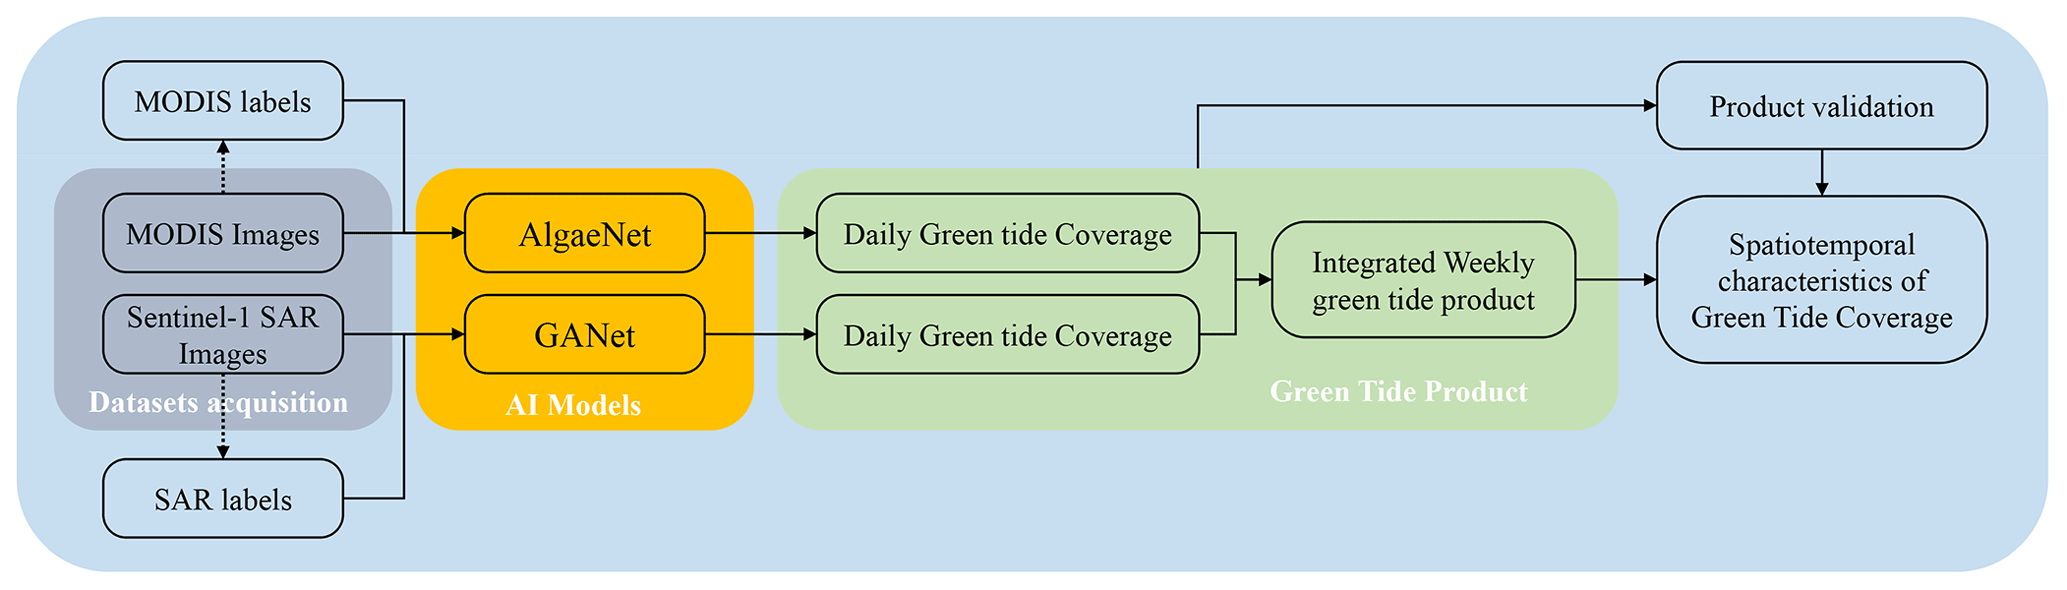
This study manually annotates optical and SAR images across diverse environmental conditions to achieve these goals and creates and shares representative green tide sample datasets tailored to multi-environment scenarios. These sets will be training data for developing other AI-based green algae extraction models. The AlgaeNet and GANet models will also be refined and retrained for detecting green tides in optical MODIS and microwave Sentinel-1 SAR images, respectively. This continued training step facilitates the creation of daily green tide coverage datasets. Daily green tide detection accuracy will be evaluated by comparing the results with the manually annotated sample dataset and fully annotated images. Furthermore, differences in green tide detection under the two observation modes of optical and microwave will be analyzed, followed by the validation of uncertainty in the weekly datasets using skillful assessment strategies.
2.1 Dataset acquisition
The optical MODIS and microwave SAR images in the Yellow Sea are acquired. These datasets are utilized to construct our green tide coverage time series. It is worth mentioning that the biomass of the green tide coverage is calculated by multiplying the detected algae pixel coverage area by a calibration constant derived from the water tank and in situ experiments (Hu et al., 2019). Since biomass is linearly related to the green tide coverage area, identifying algae pixels and measuring their coverage area are fundamental tasks. Consequently, the dataset released in this paper is a green tide coverage dataset rather than a biomass dataset.
2.1.1 Optical MODIS imagery
MODIS, comprising Terra and Aqua satellites launched in 1999 and 2002, respectively, has maintained stable operations, enabling daily observations covering the entire Yellow Sea. Satellite records of the Yellow Sea green tide date back to 1999, with large-scale outbreaks observed since 2008. This study utilizes optical MODIS surface reflectance products, specifically MYD09GA and MOD09GA, which offer data for bands 1–7 in a daily gridded L2G product. Different combinations of these bands produce distinct false-color images. Notably, within the electromagnetic spectrum, near-infrared (band 2) bands exhibit prominent peaks compared to red (band 1) and green (band 4) bands (Qi et al., 2017). Consequently, in false-color images generated by these bands (Fig. 3a), the green tide appears red, providing enhanced contrast with the surrounding seawater. This approach offers notable advantages over true-color images created using the red (band 1), green (band 4), and blue (band 3) bands, depicted in Fig. 3. From 2008 to 2022, we collected a total of 577 daily optical images, comprising 258 from Aqua and 319 from Terra, with a resolution of 500 m in the Yellow Sea. These MODIS images are geometrically and radiometrically corrected. Since optical sensors possess certain underwater detection capabilities, MODIS can effectively detect green algae on the water surface and submerged portions up to 1–2 m beneath the sea surface (Ding and Luan, 2009; Gao et al., 2022).
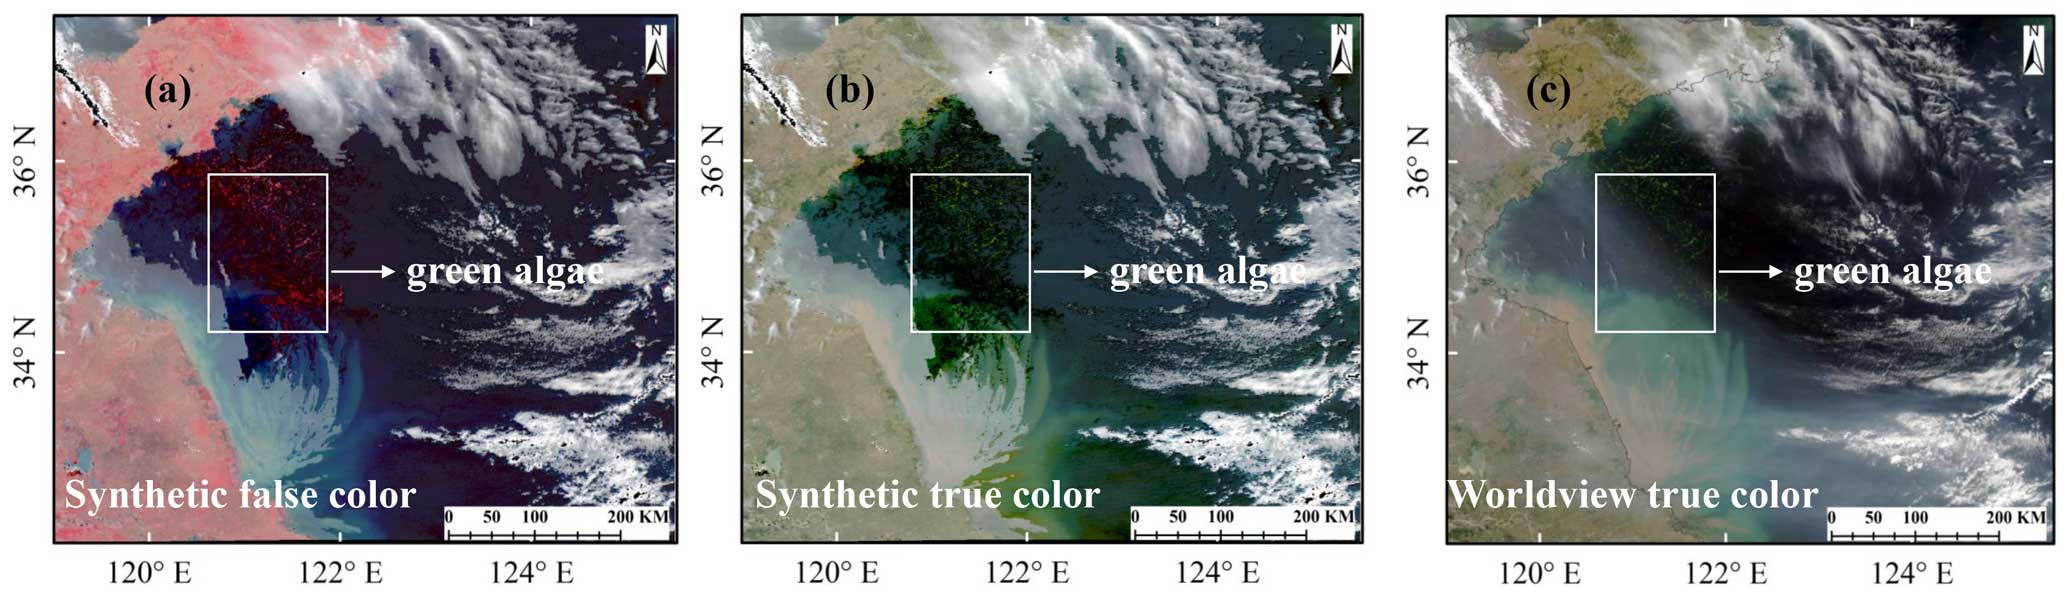
Figure 3Comparison of synthetic images from different spectral bands (23 June 2021): (a) MODIS false-color composite using near-infrared, red, and green bands; (b) MODIS true-color composite using red, green, and blue bands; and (c) Worldview true-color composite using red, green, and blue bands for reference.
2.1.2 Microwave SAR imagery
The Sentinel-1 satellite, composed of SAR satellites A and B, launched in 2014 and 2016, respectively, operates on a 12 d repeat cycle, providing global coverage every 6 d through a satellite constellation. It began retrieving green algae data in the Yellow Sea from 2015 onwards. As a result, the daily green tide coverage dataset released spans 2015 to 2022, with a time resolution of a 6 d cycle based on Sentinel-1 SAR satellite images. This study utilizes microwave Sentinel-1 SAR satellite imagery. We collected 216 Sentinel-1 Level-1 ground-range-detected high-resolution (GRDH) images with VV and VH polarizations spanning the Yellow Sea from 2015 to 2022. These SAR images are acquired in interferometric wide (IW) mode, featuring a 250 km swath and 10 m initial resolution. At this high resolution, Sentinel-1 images can detect small algae patches. However, due to the rapid absorption of microwave signals in the water, the SAR sensor can only capture reflected signals from green algae entirely floating on the sea surface, resulting in the observed green tide appearing as a bright white strip in SAR imagery. The dataset comprising SAR images covering the Yellow Sea is extensive, with individual images exceeding 1 gigabit in size. To enhance the processing efficiency of satellite images containing green tides, we resampled the original 10 m resolution to 30 m.
2.2 Data annotation
To develop an AI-based green algae extraction model, precise training samples are imperative as ground truth for model training. To achieve this, we conduct expert-level visual interpretation and manual annotation of optical MODIS and Sentinel-1 SAR images.
2.2.1 Optical image annotations
To establish precise ground-truth labels for optical images, we rely on a carefully selected set of 48 false-color images derived from the near-infrared, red, and green bands as the basis for visual interpretation and labeling of green tides. In regions encompassing oceanic deep-water areas devoid of clouds, offshore shallow-water regions without clouds, thin-cloud areas, dense and sparse algae strip regions, and cloud edge zones, algae-containing pixels are manually identified on optical images using LabelMe software (Russell et al., 2008). A total of 5296 pairs of samples are labeled as training sets and 662 pairs as testing sets, with each labeled sample standardized to 128×128 pixels.
2.2.2 SAR image annotations
To enhance the feature learning capabilities of the green tide detection model across diverse environmental contexts, including dense green algae strip areas, sparse strip areas, oceanic deep-water regions, and offshore shallow-water areas, we utilize a resolution of 30 m while maintaining a size of 256×256 pixels for the training samples. Maintaining the size of the training sample while transitioning to a 30 m resolution enables a broader representation of green tide characteristics, owing to the increased spatial scale compared to the original 10 m resolution. For instance, a training sample featuring green algae features across deep- and shallow-water regions allows the detection model to learn from these varied features concurrently. Conversely, training samples at 10 m resolution often exhibit uniform green tide characteristics, limiting the deep-learning model's learning capacity. Similarly, we manually annotate algae-containing pixels on a meticulously selected set of 22 SAR images using LabelMe software. This annotation process results in 4535 pairs of samples, comprising 4268 pairs for training and 267 pairs for testing, facilitating comprehensive model training and evaluation across a spectrum of environmental scenarios.
2.3 Deep-learning models
Recently, we introduced two AI-based algorithms, AlgaeNet (Gao et al., 2022) and GANet (Guo et al., 2022), designed for the rapid and precise extraction of green tide coverage from optical and SAR imagery (see Fig. 4). Both models demonstrate significant scalability and can be readily applied to various satellite images, including optical MODIS, GOCI, and Landsat and microwave Sentinel-1, Gaofen-3, and RADARSAT.
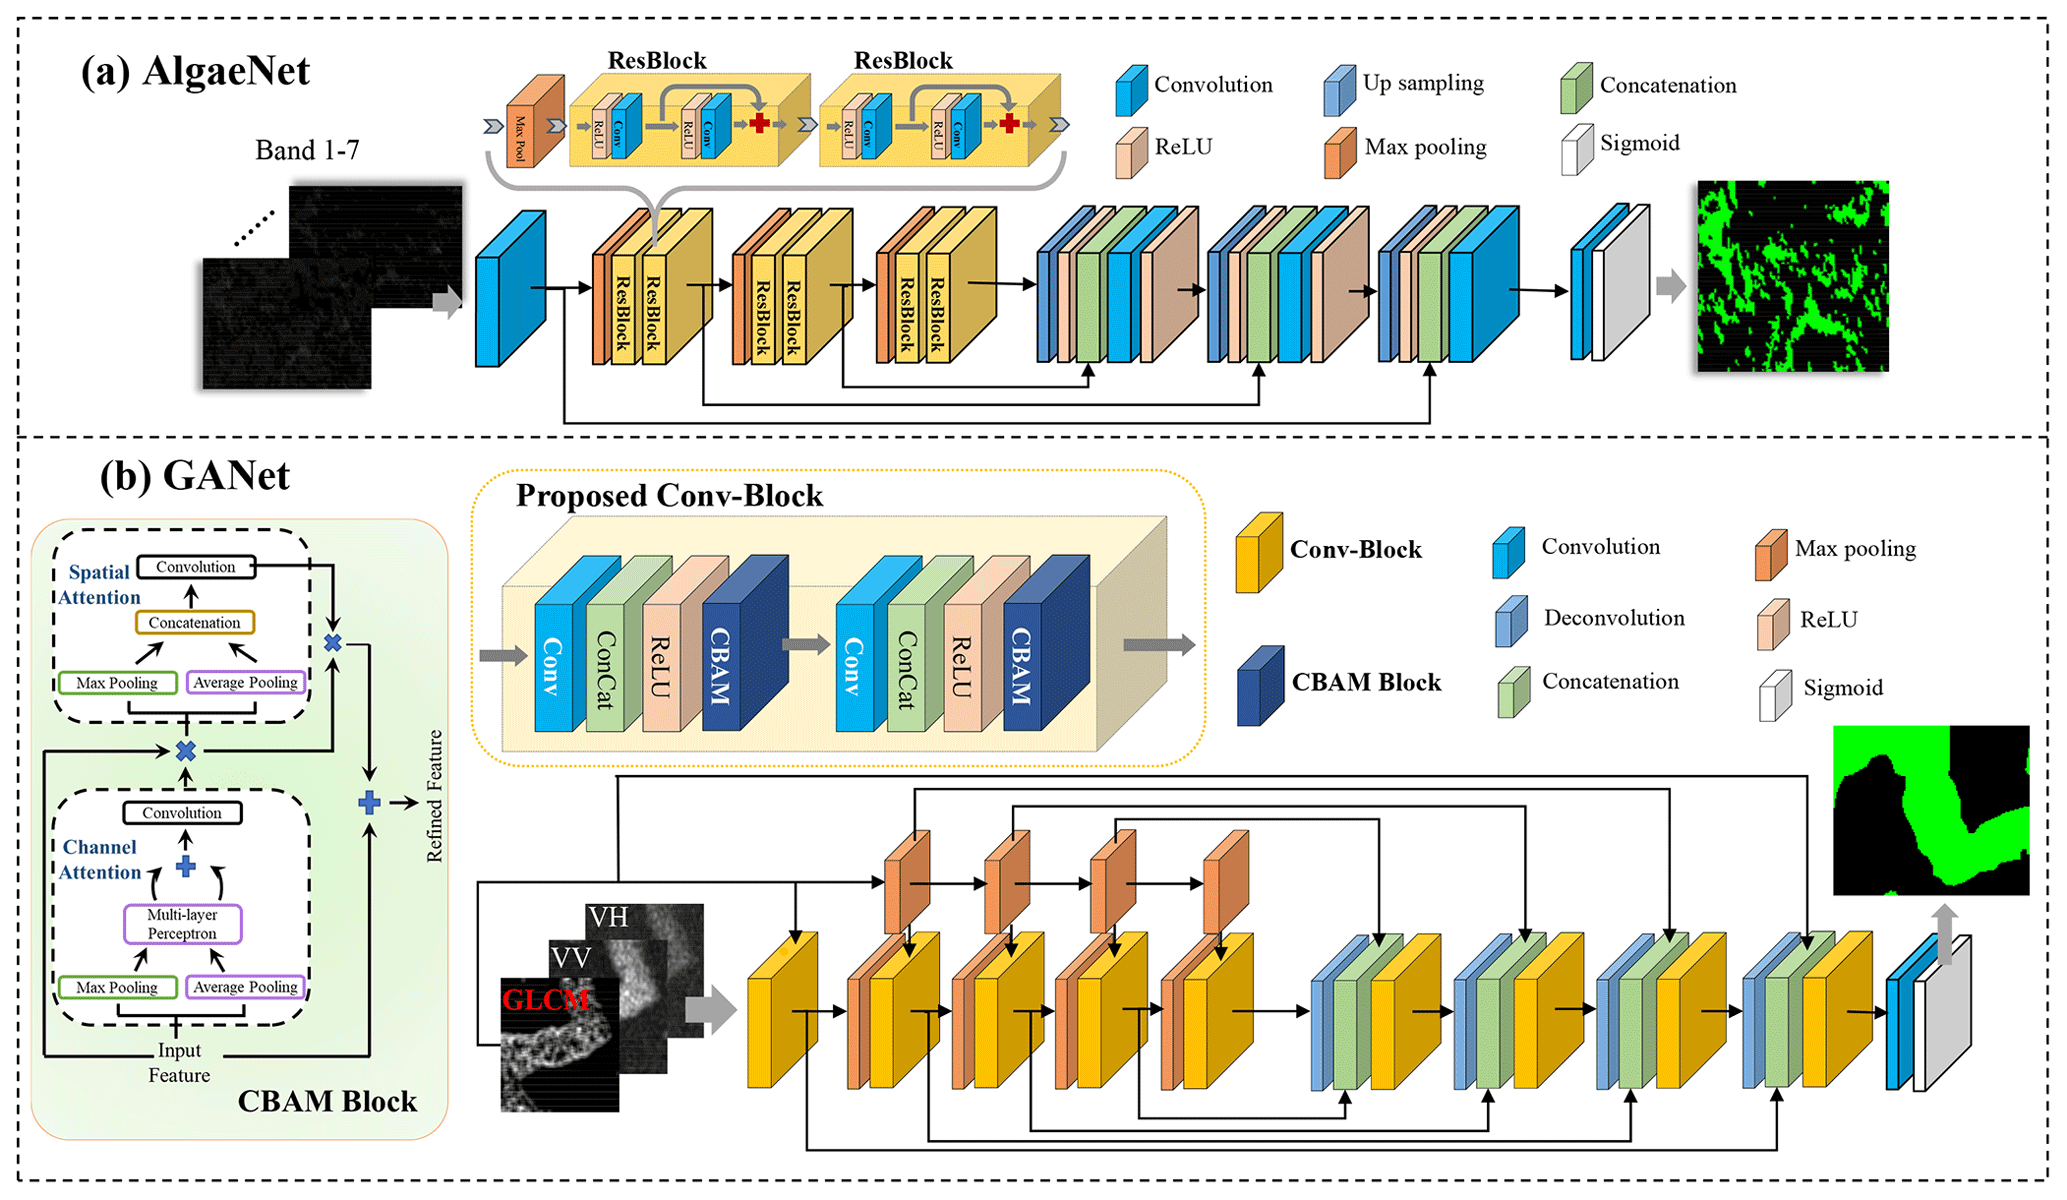
Figure 4Green tide detection network. (a) Proposed AlgaeNet model based on the basic U-Net framework and (b) proposed GANet model based on the basic U-Net framework.
2.3.1 AlgaeNet model
The AlgaeNet model addresses physical-ware input and algae–water imbalance in training samples, mitigating potential biases inherent in traditional threshold-based segmentation methods. It outperforms other models, such as random forest and VGG16, in accuracy for optical MODIS imagery and achieves higher recall and precision than optical index methods like NDVI, FAI, and EVI (enhanced vegetation index; Gao et al., 2022). Figure 4a shows the AlgaeNet model's system diagram based on the U-Net framework, including input, encoder, decoder, and prediction modules. Unlike the original AlgaeNet model, this study further modified the input module. The AlgaeNet model can automatically assign weights to each input channel during training, preventing contamination issues with any physical input bands. Therefore, we used the unique physical multichannel combination of all bands of MODIS surface reflectance products as input, and the improved AlgaeNet model can perform green algae detection in the optical image. All pixels of the entire area are divided into two categories: seawater pixels and algae pixels.
We employed the AlgaeNet model to extract daily green tide coverage from optical MODIS images. Unlike previous methods that solely utilized true-color bands (Gao et al., 2022), our approach incorporates MYD09GA and MOD09GA channels (MODIS surface reflectance products), enabling more precise detection in areas affected by thin clouds, shallow waters, and turbid seawater. We enhanced extraction accuracy by retraining the model with a new annotation dataset (see Table 1), achieving a mean intersection over union (mIOU) of 67.51 %. However, MODIS images are susceptible to cloud edge effects (see Fig. 5), leading to the misidentification of some green algae pixels. To address this challenge, we implemented a filtering strategy, eliminating green algae patches smaller than 1.10 km2 to mitigate misidentifications at broken cloud boundaries while retaining algae information in cloud-free and thin-cloud areas.
Table 1Accuracy of daily green tide detection model based on the testing set (%).
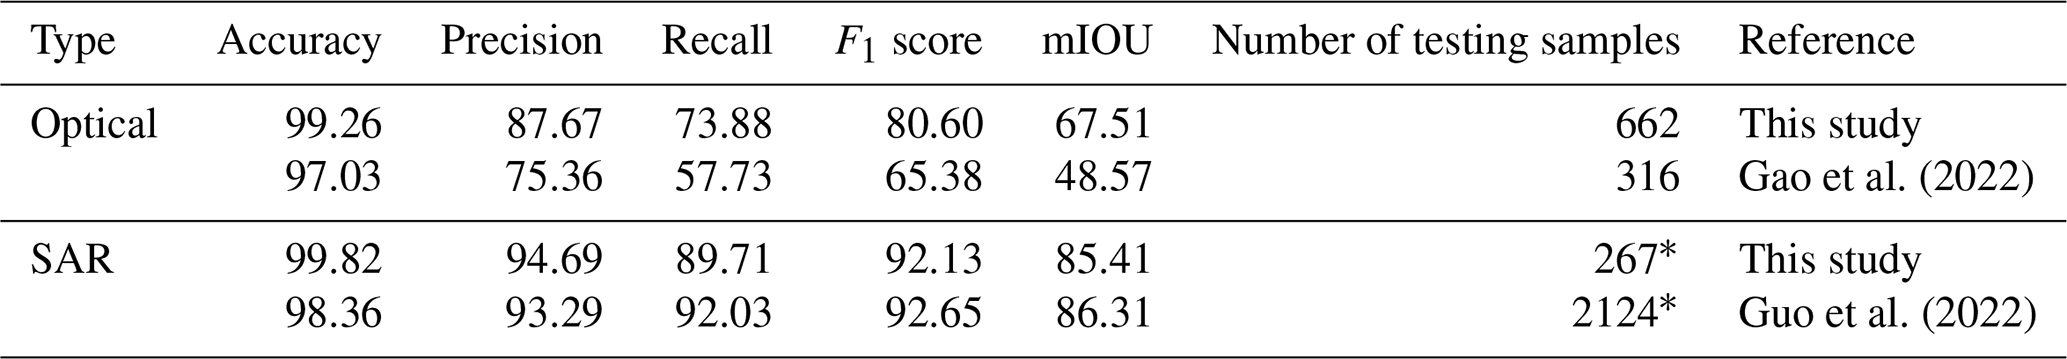
∗ The number of testing samples, 267, pertains to the retrained GANet model applied to SAR images with a 30 m resolution, while the number of testing samples, 2124, applies to the initial GANet model used with SAR images at a 10 m resolution.
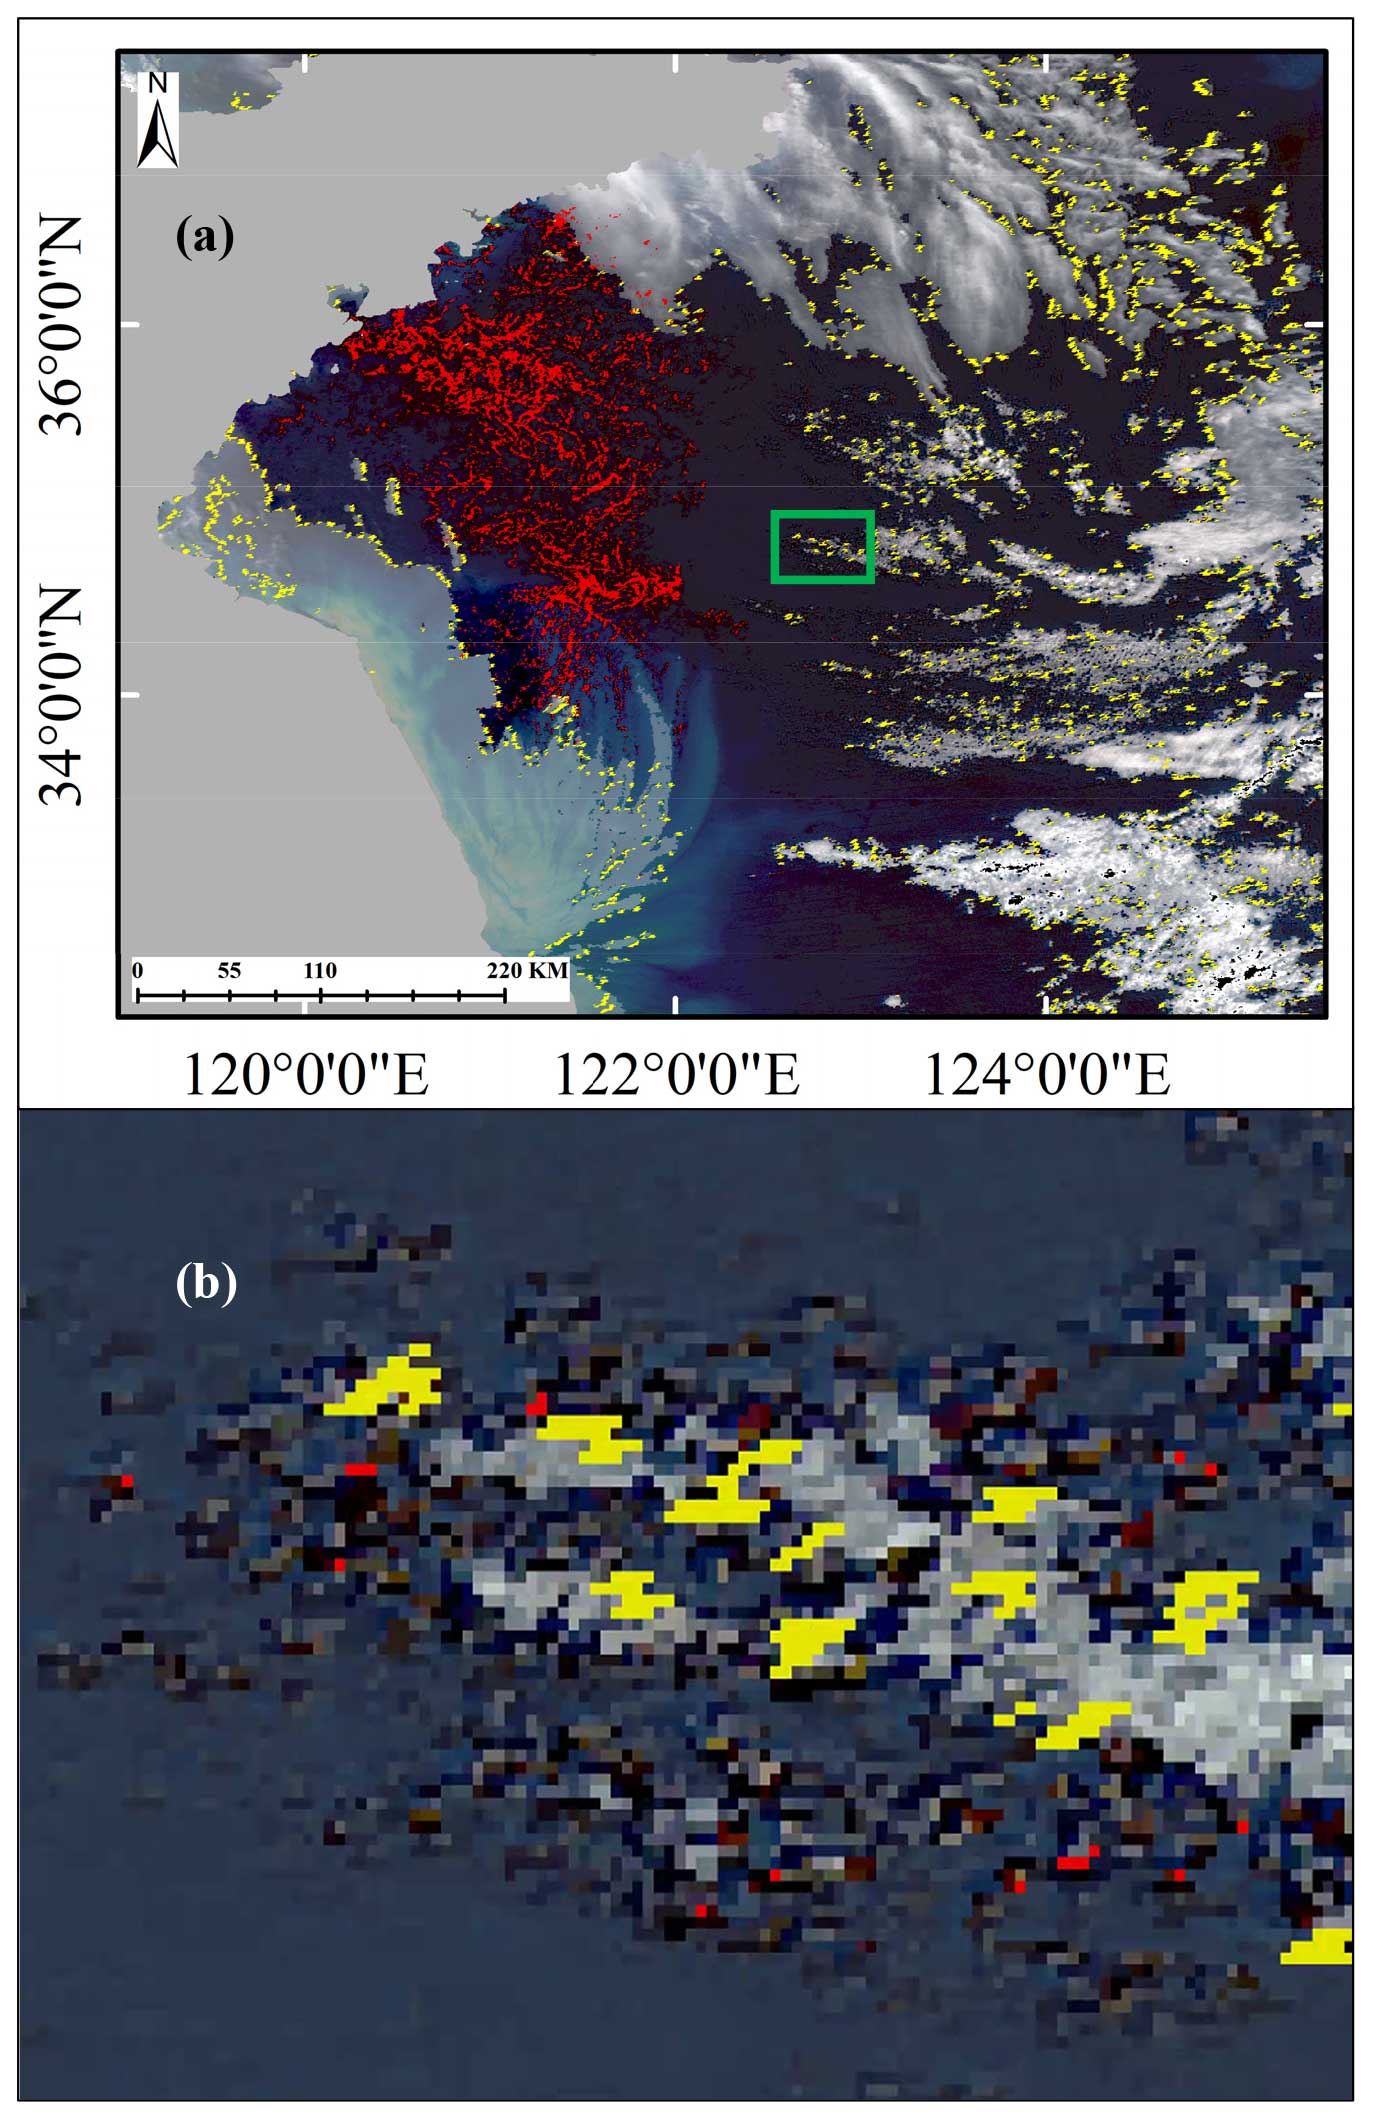
Figure 5Size statistics of misidentified patches at the cloud edge (date: 23 June 2021). (a) Randomly selected MODIS optical image, where red patches represent green algae pixels and yellow dots indicate cloud shadows derived from the MODIS product. (b) An enlarged view of the green square part in (a), with the red pixels representing algae pixels that were mistakenly identified due to the presence of cloud edges. Initially, they were supposed to be eliminated using yellow shadows. However, since the two do not coincide, the misidentification cannot be rectified.
2.3.2 GANet model
The GANet model, incorporating attention mechanisms, sample imbalance loss functions, and texture enhancement mechanisms, surpasses alternative algorithms (Guo et al., 2022). Figure 4b illustrates the system diagram of the GANet model, built upon the U-Net framework. It also comprises the input, encoder, decoder, and prediction modules. Distinguished from the original GANet model, two significant enhancements have been introduced into the texture enhancement mechanisms utilizing 30 m resolution SAR images, replacing the prior 10 m resolution images. Primarily, the input module now integrates VV- or VH-polarized NRCS data and textural feature maps derived from the SAR dataset, specifically employing the gray-level co-occurrence matrix (GLCM). Through ablation experiments, we found that the mean, ASM (angular second moment), and entropy – three texture features – play a more critical role in the extraction of green tide, which is also partially supported by previous studies (Liu et al., 2015; Hall-Beyer, 2017). GLCM features are also extracted into pooling layers, generating feature maps within the encoder and decoder modules. The resulting multiscale GLCM features are then concatenated with feature tensors generated by the convolutional layers. Moreover, when feeding image slices into the GANet model, we apply random brightness enhancements to the image slices to improve the model's adaptability to different sea conditions. These enhancements empower the GANet model to effectively discern green algae in SAR images, thereby partitioning all pixels across the area into seawater and algae classifications.
It is worth noting that, as Gao et al. (2022) reported, although the AlgaeNet model can detect green algae in SAR images, the GANet model achieves higher extraction accuracy. This improvement is attributed to strategies such as texture feature enhancement (Guo et al., 2022). Therefore, we employed the GANet model to extract daily green tides from Sentinel-1 SAR images and augmented the model's accuracy by integrating additional training samples from shallow nearshore waters. Furthermore, adopting 30 m resolution samples with a size of 256×256 pixels expanded the model's feature learning ability compared to the previous 10 m resolution. These enhancements have raised the model's performance to 85.41 % based on new testing samples (see Table 1); although this appears similar to the original model's accuracy of 86.31 %, it is important to note that the comparison is affected by inconsistent label sample sizes. Additionally, these enhancements have significantly improved processing performance and efficiency across the entire image of the Yellow Sea region, transcending the limitations of a limited number of labeled samples.
2.4 Integrating daily optical and SAR products
The direct outputs from the AlgaeNet and GANet models are daily green tide coverage and distribution, with a spatial resolution of 500 m from MODIS images and 30 m from Sentinel-1 SAR images, respectively. While MODIS images provide comprehensive coverage of the entire Yellow Sea during the green tide period, the interference of cloud and rain limits effective green tide observations to two to four times per week under cloud-free or thin-cloud conditions. Consequently, daily green tide coverage derived from optical images may still exhibit several missing frames on certain days. On the other hand, the Sentinel-1 satellite operates with a time resolution of a 6 d cycle. However, the effective observation range of green tides by Sentinel-1 SAR sensors is primarily limited to most regions of the Yellow Sea (Fig. 1b) but not the entire Yellow Sea. This discontinuous or relatively low observation frequency of green tide coverage challenges practical applications such as green tide forecasting. Therefore, a fusion of these two types of daily products is necessary to produce continuous and seamless green tide data products.
Previous studies, including Li et al. (2021), have proposed various methods to integrate green tide datasets derived from optical and SAR images, aiming to enhance compatibility and extend the temporal sequences of daily green tide observations. Figure 6 illustrates simultaneously observed optical and SAR images alongside their corresponding green tide coverage (Fig. 6a and b). The optical green tide coverage pattern aligns seamlessly with that captured by SAR imagery (Fig. 6c). However, while optical sensors can detect algae strips both on the sea surface and beneath a certain water depth of 1–2 m, SAR sensors only capture signals from algae strips entirely floating on the surface (as illustrated in Fig. 1c). Consequently, the boundaries of algae strips detected by optical sensors tend to appear wider for larger green algae strips. Additionally, due to the relatively coarse resolution of the optical MODIS sensor, very small green algae patches may be missed (Fig. 6d). For instance, Li et al. (2021) proposed a method to standardize algae detection results from high-resolution images to a coarser resolution. However, this approach is primarily suitable for larger green algae strips detectable by both sensors and may not adequately address tiny green algae patches overlooked in optical images. This forced standardization strategy inadvertently introduces artifacts, resulting in inconsistent green algae time series patterns. Hence, caution is warranted when jointly utilizing daily optical and SAR data, particularly for green tide simulation and forecasting purposes.
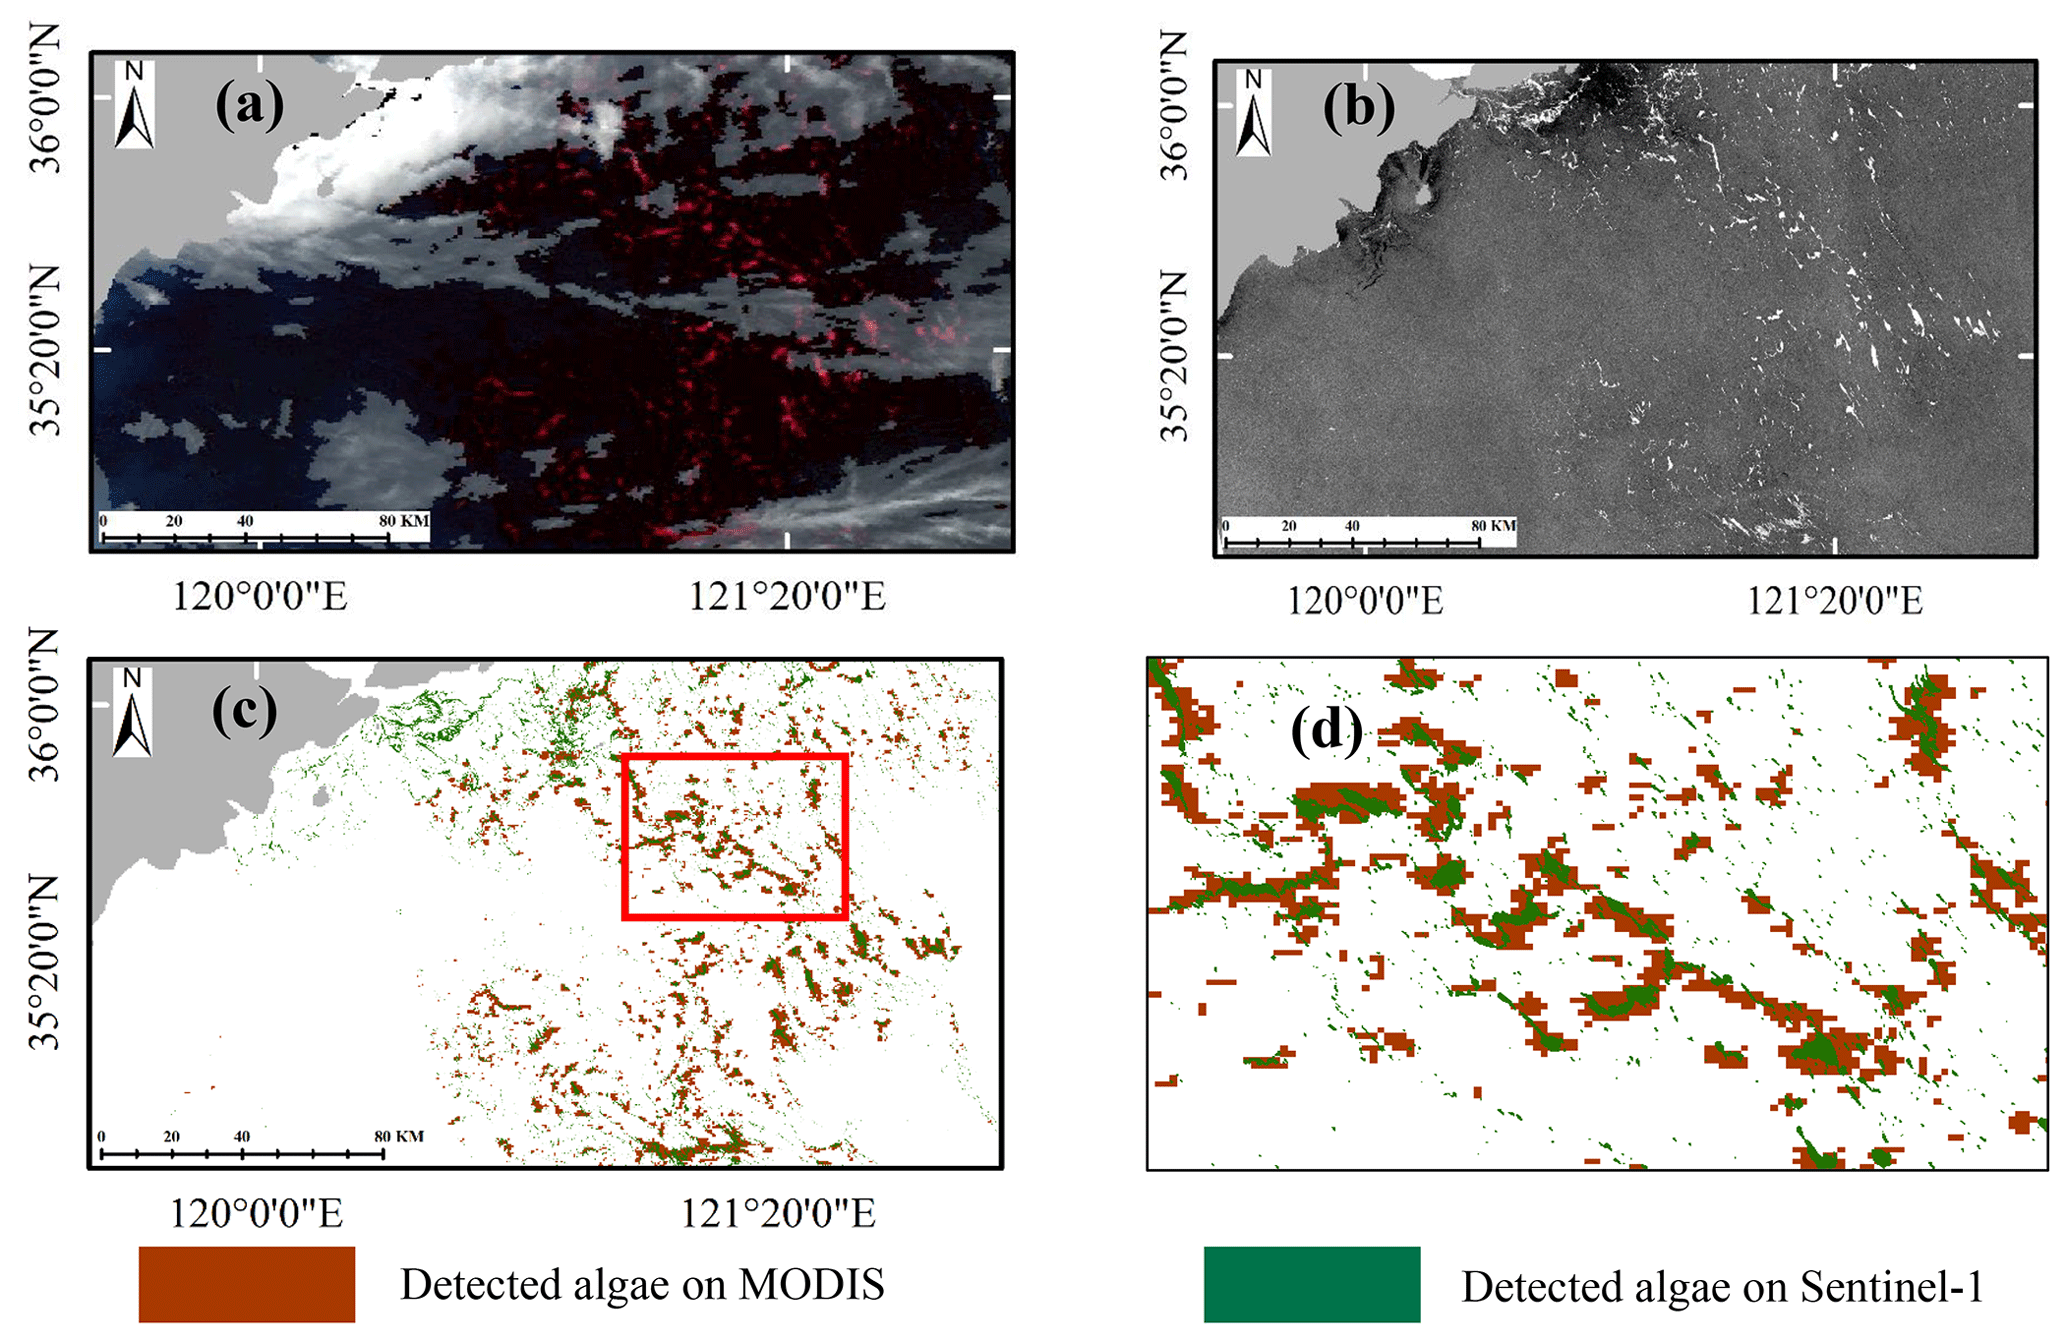
Figure 6Comparison of randomly selected optical and SAR image detection results (date: 30 June 2021). Panels (a) and (b) are the optical and SAR images observed on the same day. Panel (c) is the overlapping green algae coverage derived from (a) and (b). Panel (d) is the zoomed-in view of the area outlined in red in (c).
Figure 7 shows the randomly selected optical remote sensing images and green tide coverage results obtained by MODIS Aqua and Terra sensors under cloudless conditions on 23 June 2019. Due to the different overflying times of the Aqua and Terra sensors, one image was obtained in the morning (02:15 UTC for Terra) and the other in the afternoon (05:30 UTC for Aqua), with a time interval of about 3 h. When the satellite sensors operate and observe the sea surface, the final quality of the optical images obtained by the Aqua and Terra sensors varies due to different environmental factors such as sunglint, atmospheric refraction, and solar inclination. Correspondingly, the size of the green tide coverage area detected by the proposed deep-learning model is different. Similarly, SAR images exhibit this phenomenon compared to optical sensors. To mitigate the impact of overflying time on the green tide detection results on the same day, averaging the green tide coverage obtained by two or more sensors at different overflying times is an effective approach.
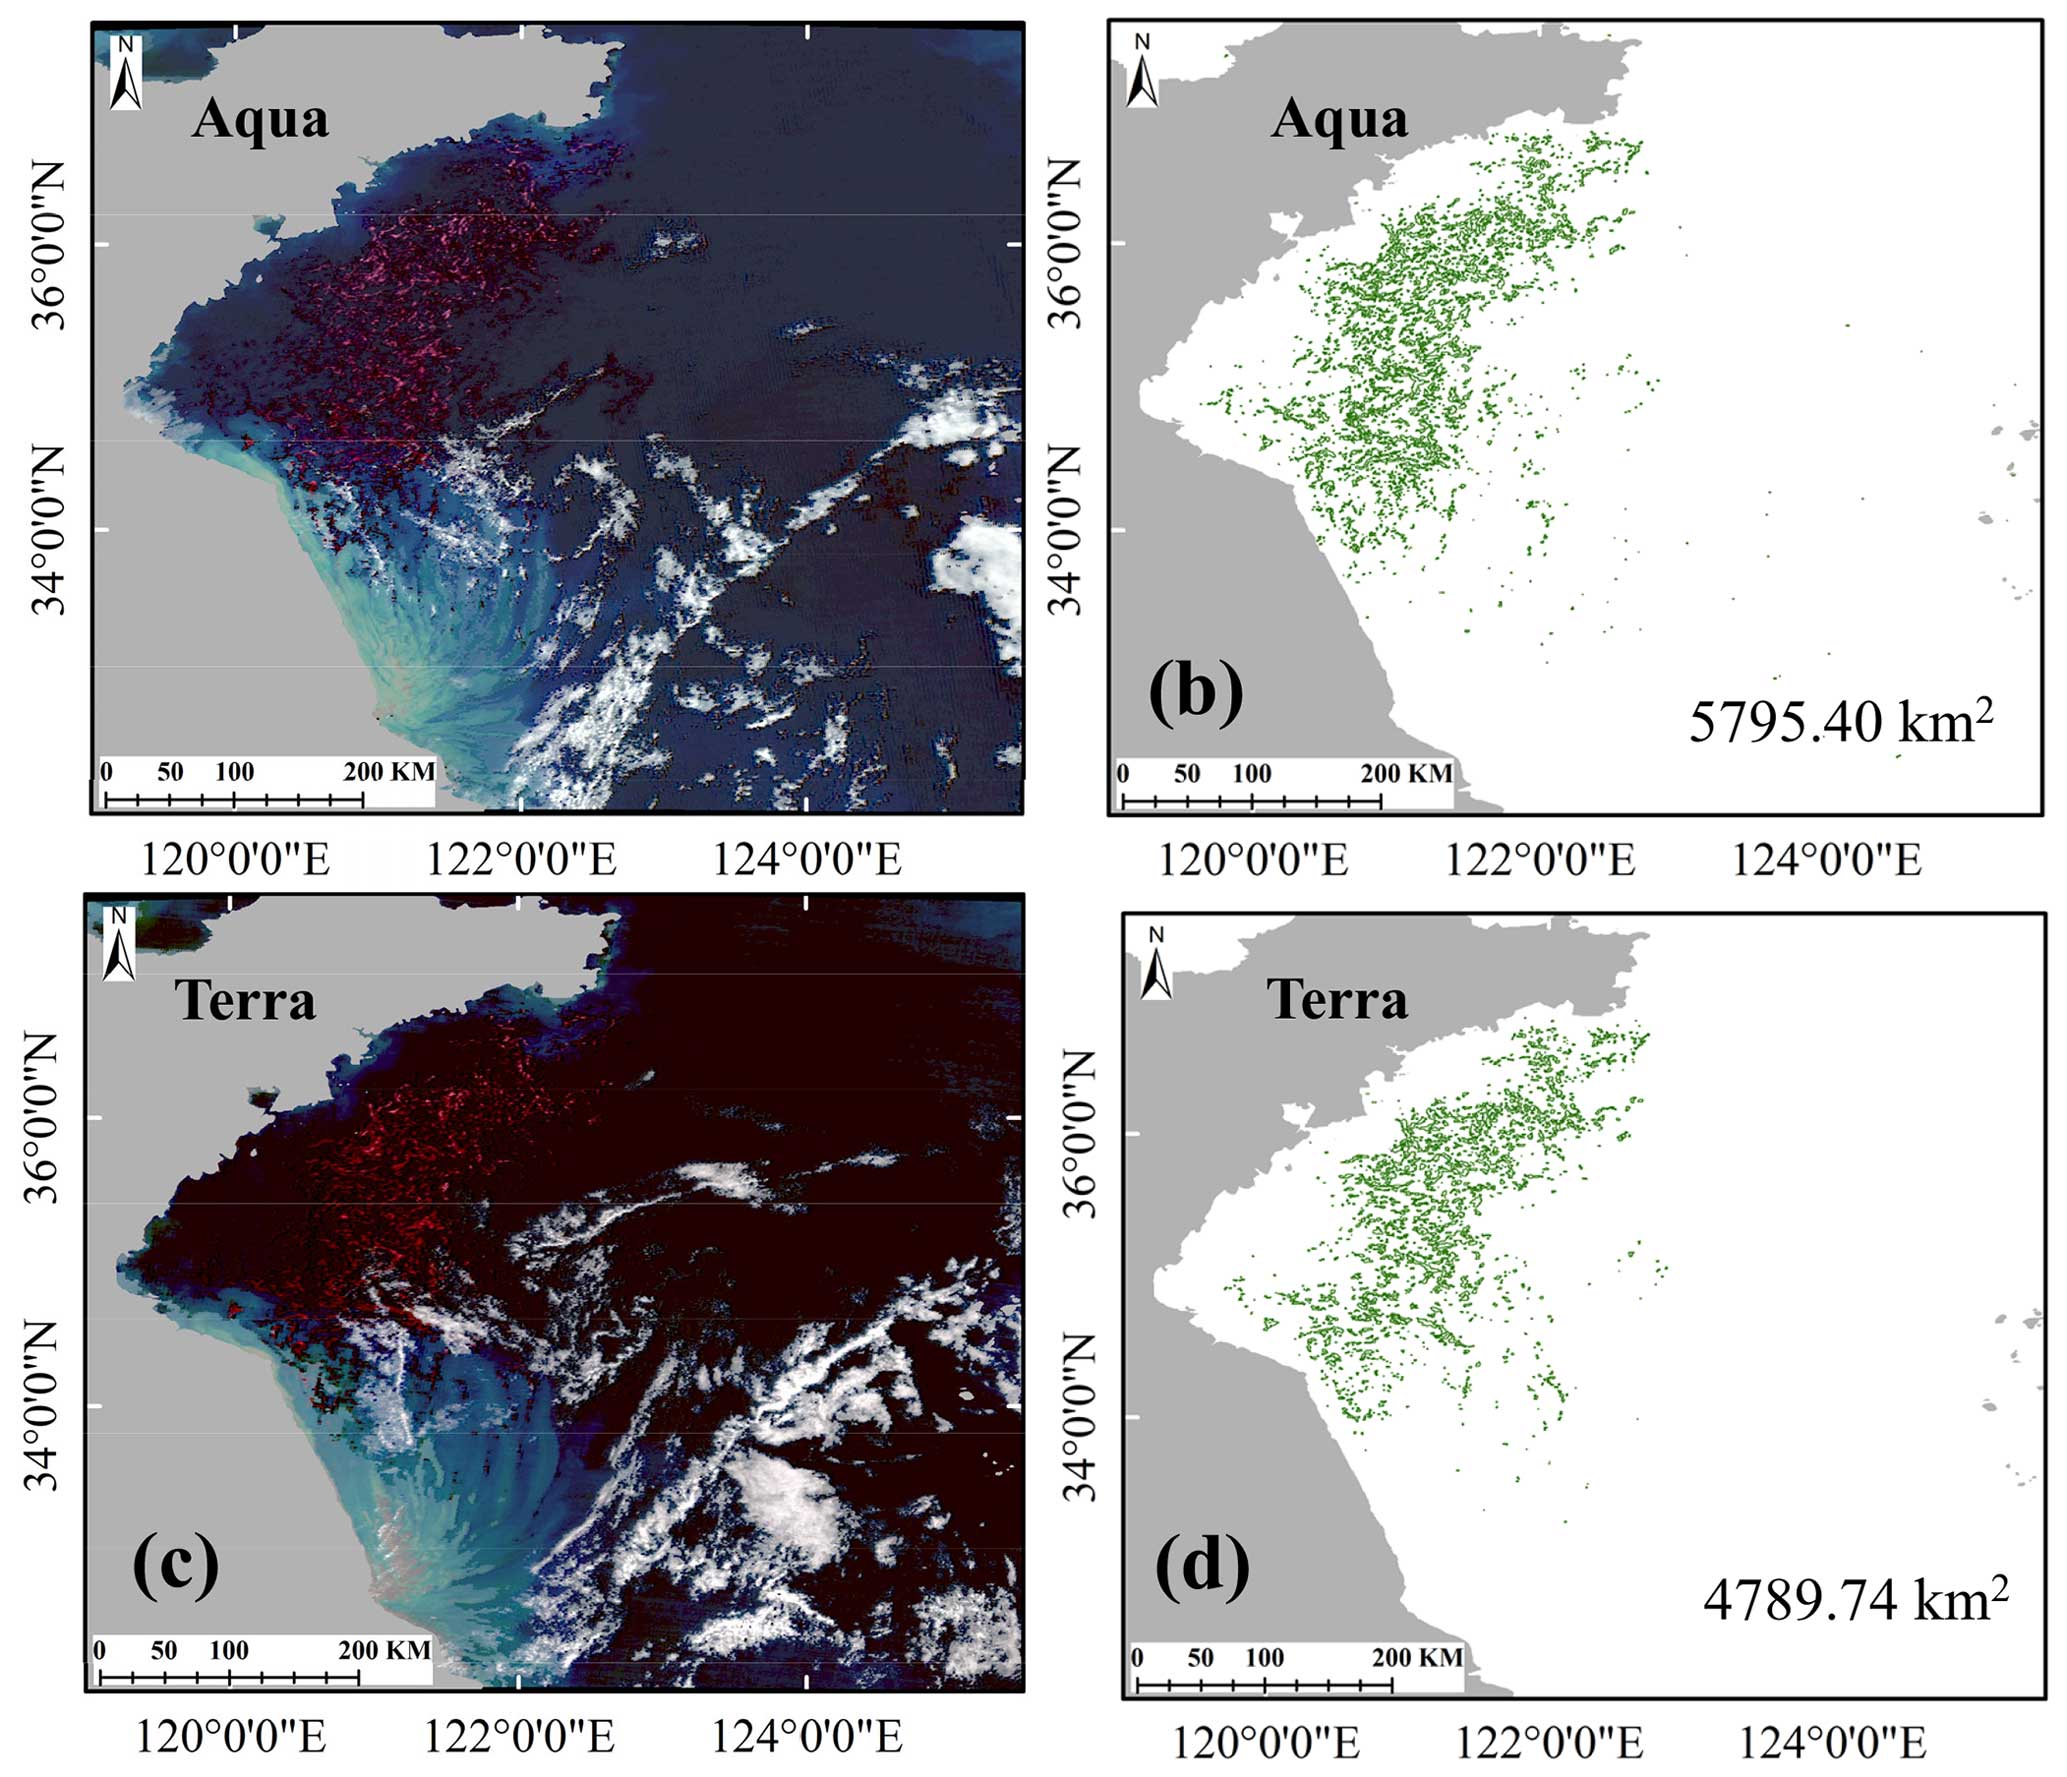
Figure 7Randomly selected observation images and extraction results of Aqua and Terra on the same day (23 June 2019).
Furthermore, each year, the maximum coverage area of the green tide bloom is a critical indicator of the outbreak's scale. However, interference from clouds and rain and the varying revisit periods of optical MODIS and Sentinel-1 SAR affect their effective observation frequencies. This leads to varying maximum daily green tide coverage throughout the bloom's life cycle, as illustrated in Fig. 8. Accurately determining the true maximum coverage area is challenging. It can only be preliminarily assessed based on the limited daily coverage time series observed by satellites. Weekly averaging helps mitigate differences in maximum green tide coverage due to satellite overflying times, highlighting another advantage of multi-sensor fusion products over daily data.
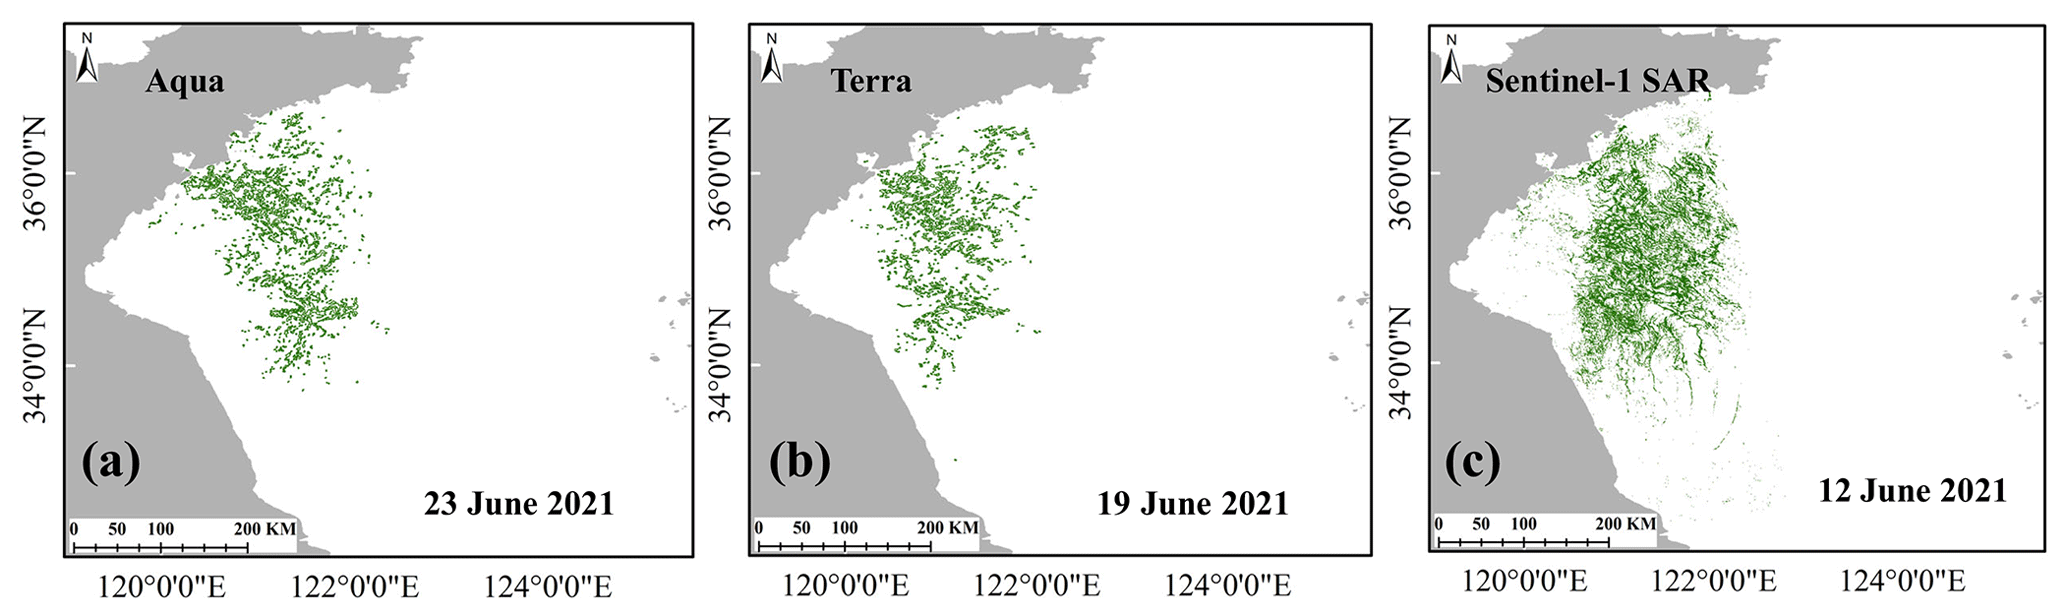
Figure 8Maximum daily green tide coverage obtained by the different sensors, (a) MODIS Aqua, (b) MODIS Terra, and (c) Sentinel-1 SAR, in 2021.
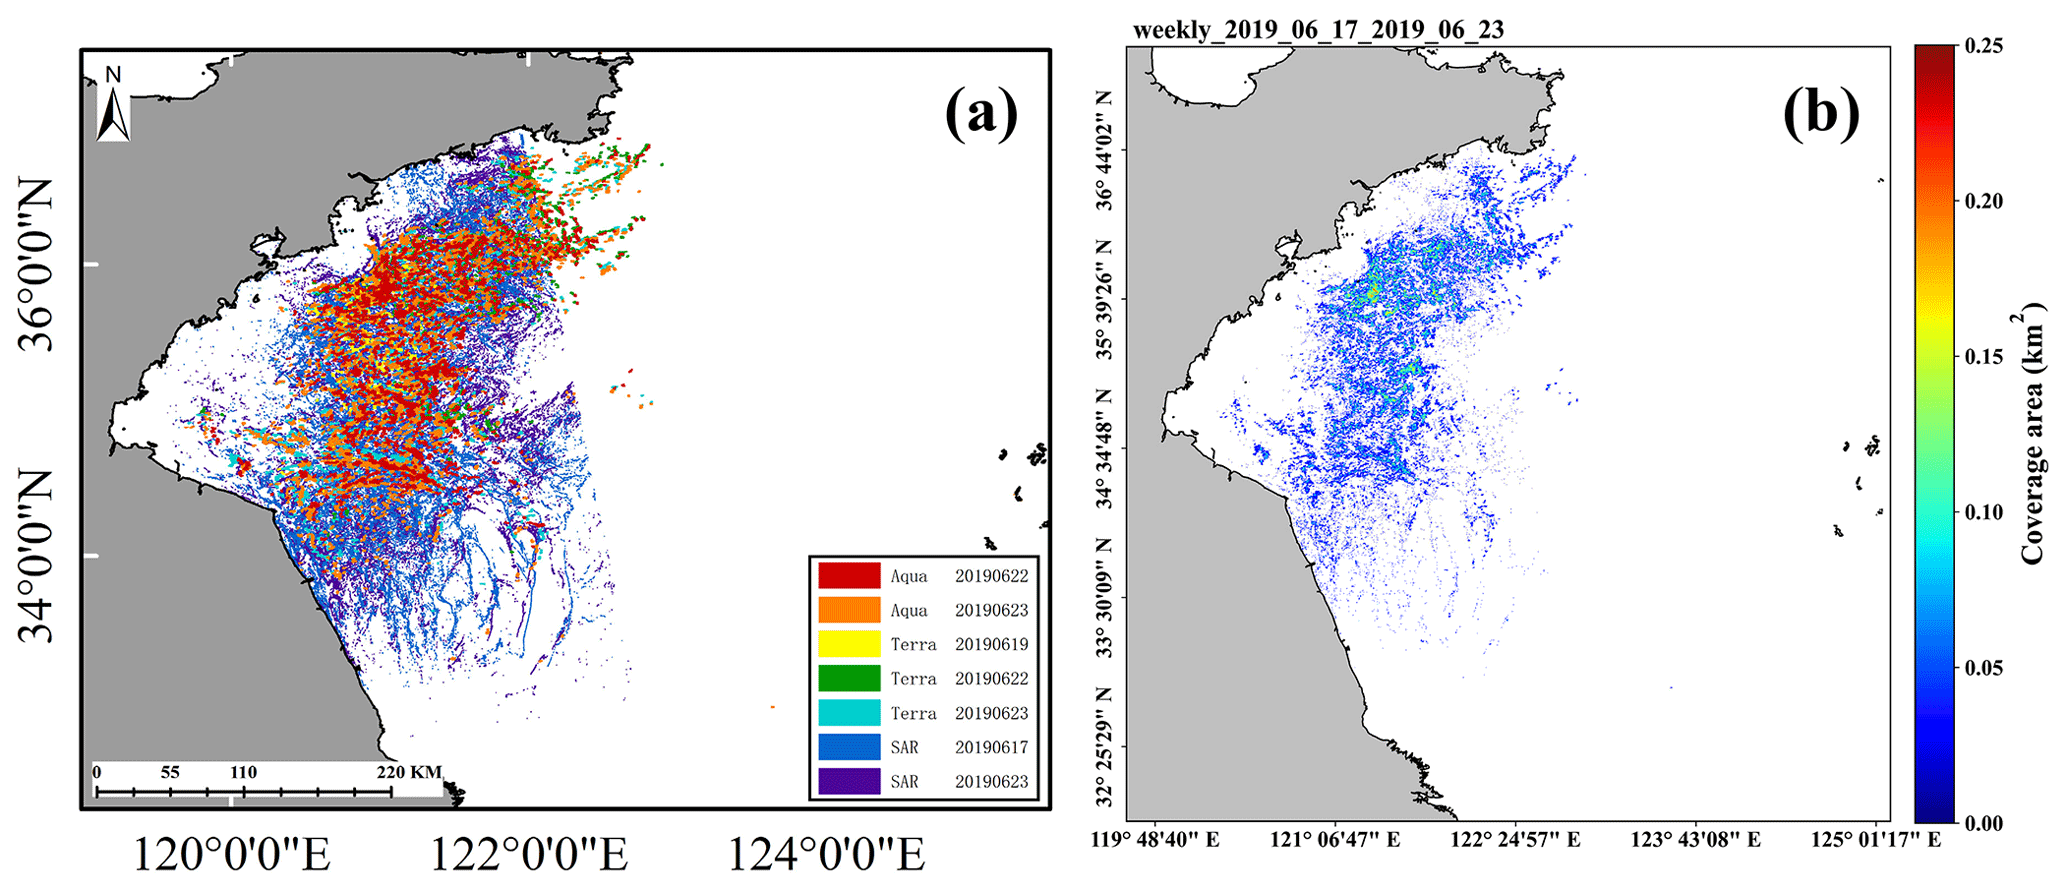
Figure 9Weekly integration sample of daily optical and SAR products from 17–23 June 2019.
To address these limitations and to generate a continuous, seamless, comprehensive green tide coverage dataset with relatively high temporal and spatial resolution for the entire Yellow Sea, we present a fusion dataset consisting of weekly average green tide coverage data by merging the two datasets. Following the methodology outlined by Hu et al. (2023) for defining monthly green tide data, the specific process of integrating daily optical and SAR green tide products in this article is as follows:
-
The daily SAR green tide coverage data, originally acquired at a resolution of 30 m, are resampled to 500 m. This step ensures consistency with the resolution of the MODIS green tide product.
-
Our analysis indicates at least one valid daily green tide observation in the Yellow Sea every week. To integrate the daily optical and SAR green tide coverage products, we divide them into weekly intervals, forming a time unit consisting of daily data each week. We count the number of images (N) where green tides are observed within a given time unit without distinguishing between sensors. This count represents the total valid observations within the time unit.
-
For a specific pixel in the study area, we count the number of green algae occurrences (recorded as M), where M is less than or equal to N. When a pixel is identified as containing green algae by the AlgaeNet or GANet model, we assume it contains 100 % algae. Therefore, the proportion of algae in a pixel of the weekly product is calculated as , and the corresponding coverage area of the pixel is (in km2).
Taking 17–23 June 2019 as an example, throughout this week, there were seven cases of daily optical and SAR green tide coverage, as depicted in the left image (Fig. 9a), while the right image displays the combined weekly green tide coverage (Fig. 9b), following the data fusion steps mentioned above.
Comparisons with other datasets are challenging due to the scarcity of internationally available similar datasets. The weekly product comes from the daily green tide product fusion. The data accuracy of the initial daily product directly affects the accuracy of the final fusion product. Therefore, verifying the weekly product includes two parts: verifying the daily product and verifying the final weekly fusion product.
3.1 Verification of daily green tide datasets in the Yellow Sea
Besides validating AlgaeNet and GANet models using the testing set, as described in the “Data and methods” section, it is crucial to comprehensively evaluate the daily green algae dataset extracted from the entire remote sensing image of the Yellow Sea region.
3.1.1 Daily MODIS product validation
For this study, MODIS images under cloud-free and thin-cloud conditions on 19 June 2021 were randomly selected (Fig. 10). The overall evaluation (mIOU) of the green tide data reached 85.86 %, 69.81 %, 84.23 %, and 89.61 %, respectively, for the entire Yellow Sea, open water, cloud area, and Subei Shoal area. Furthermore, through visual inspection of three randomly selected typical regions (box 1–3), the green tide dataset demonstrated excellent accuracy (see Table 2 and Fig. 10).
Table 2Green tide detection result analysis (random entire-image examples).
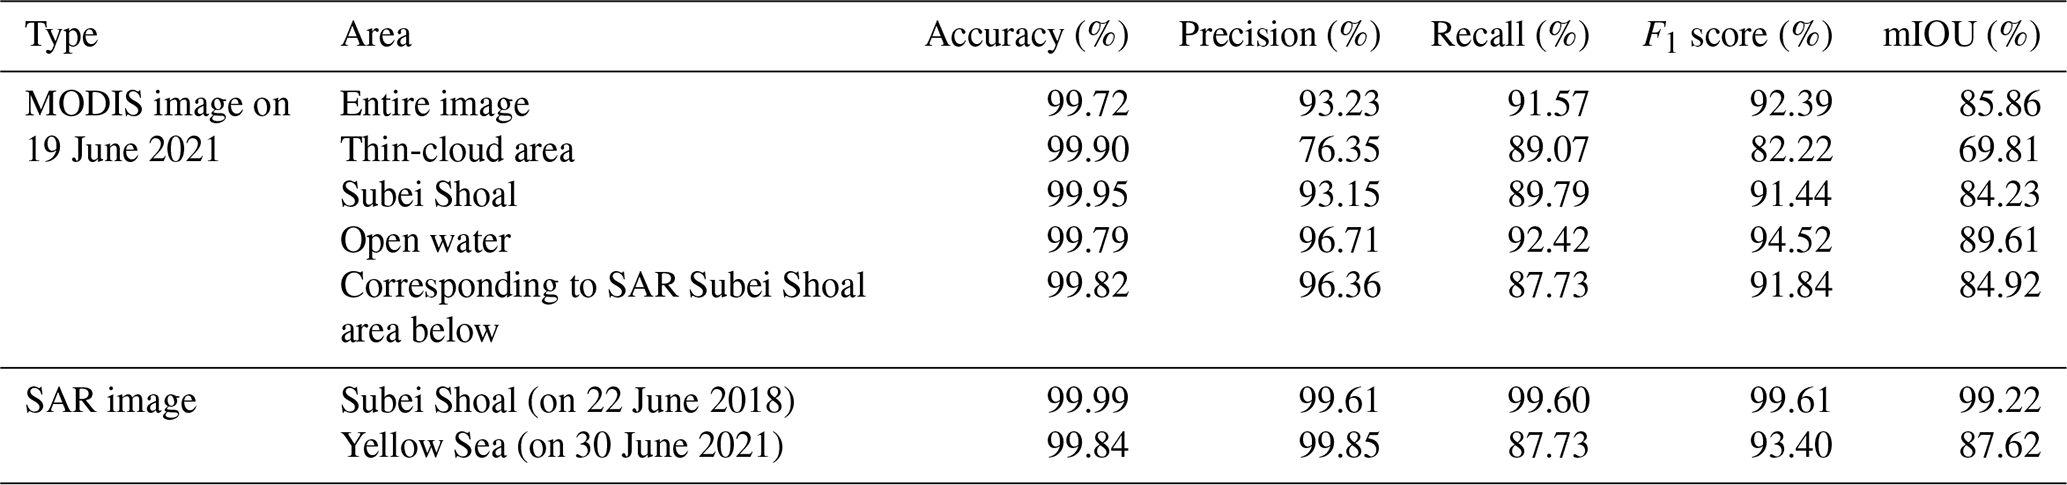
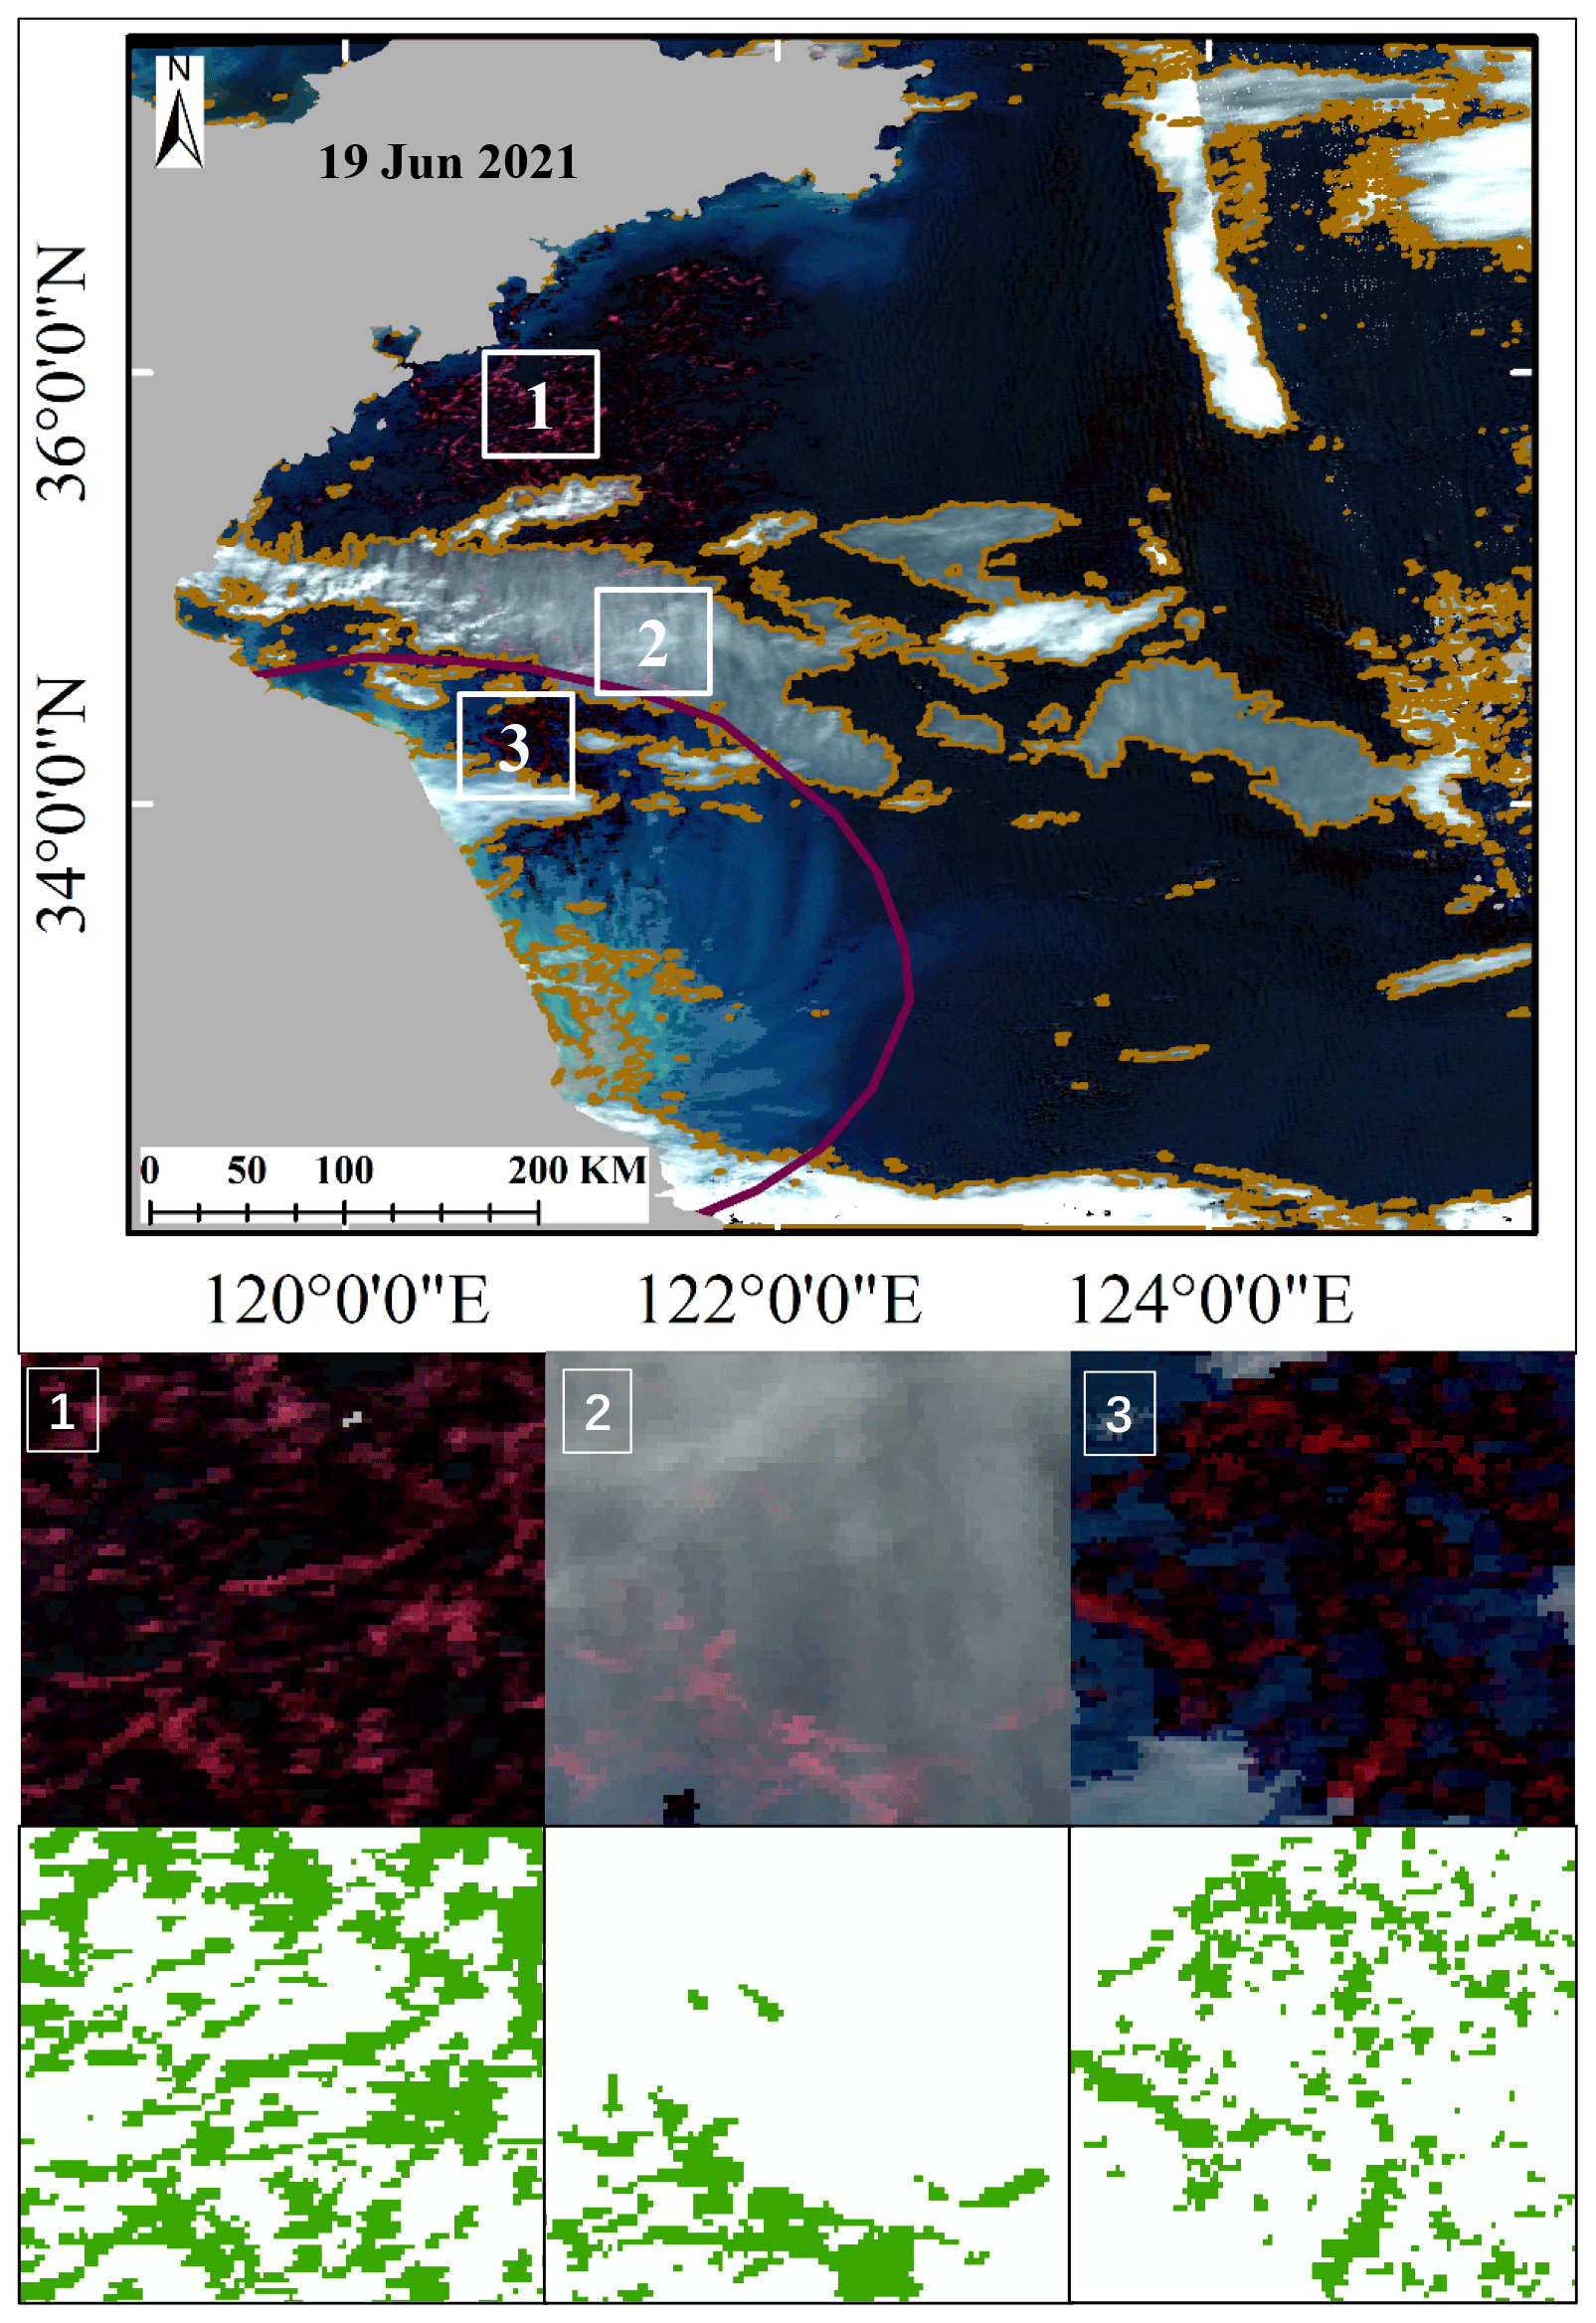
Figure 10Green tide detection result analysis from randomly selected optical images. Box 1 is an enlarged view of the open-sea area under cloud-free conditions. Box 2 is an enlarged view of the thin-cloud area. Box 3 is an enlarged view of a portion of the nearshore area of the Subei Shoal (date: 19 June 2021).
We categorize the entire algae tide outbreak process into two stages: the growth period (from the satellite's initial algae coverage to the largest coverage) and the decaying period (from the largest algae coverage to complete disappearance). Considering the differences in imaging capabilities between the two optical satellites, Aqua and Terra, Fig. 11 presents histogram statistics of the size of green algae strips detected from MODIS images. It was observed that during the growth stage, the size of green algae strips was primarily concentrated at <50 km2, with the maximum algae strip reaching 400 km2. In the decaying stage, the size of algae strips was concentrated at <20 km2, and the largest strip measured less than 150 km2. Theoretically, the lower detection limit for MODIS 250 m resolution bands is approximately 1 % of the pixel size, i.e., 625 m2 (Hu et al., 2015). However, based on the statistical results, the smallest detected strip of green algae (∼1 km2) is much larger than the theoretical threshold (625 m2) due to resampling to 500 m resolution.
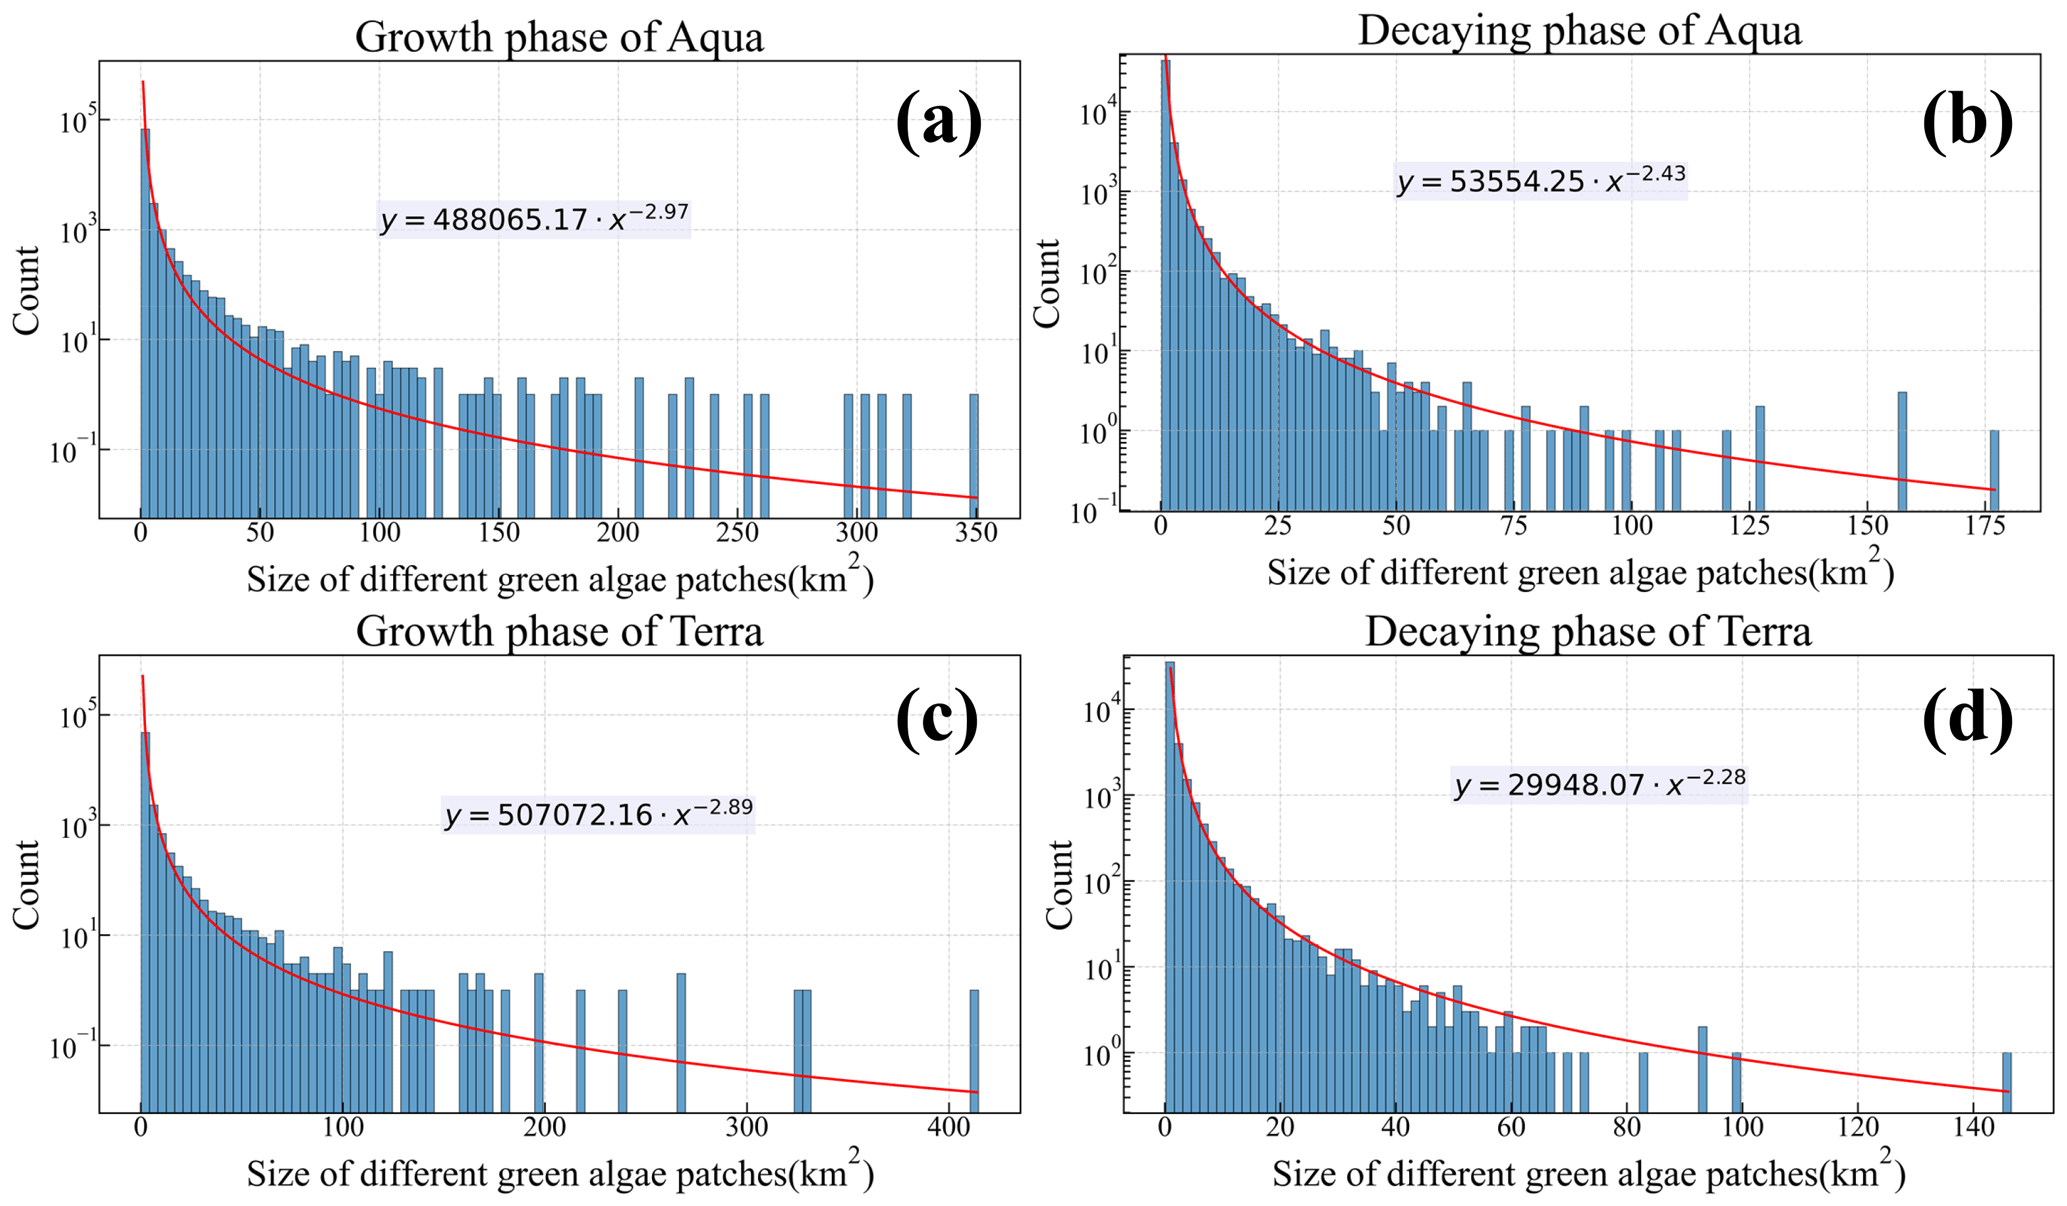
Figure 11Statistical analysis of green algae patch size derived from optical imagery, with the vertical axis on a log scale.
In addition, Fig. 11 also illustrates the frequency of occurrence of green algae patches of varying sizes as detected by MODIS. The data reveal that large patches (>100 km2) are less common, while small patches (<100 km2) occur more frequently, suggesting that the green tide in the Yellow Sea predominantly consists of smaller green algae patches. The size of these patches influences the satellite's ability to detect them. The different sizes and the corresponding counts of the green tide patches also reveal a clear and definite power law with an experimental scaling exponent, i.e., y=bxa ( and ).
3.1.2 Daily SAR product validation
In SAR images, the initial GANet model demonstrates its poorest detection capability in the shallow-water area of the Subei Shoal (Guo et al., 2022). This deficiency is primarily attributed to the turbid seawater in the Subei Shoal, which reflects strongly on the SAR image, thereby reducing the contrast between seawater and green algae. Consequently, the accuracy of green algae extraction is lower compared to that in open-sea areas. However, the new GANet model has significantly improved green algae detection capabilities by incorporating labeled samples from this area. As depicted in Fig. 12, the mIOU evaluation index of a randomly selected green tide dataset in the Subei Shoal on 22 June 2018 reached 99.22 %, showcasing reasonable performance (Fig. 12a–d). Moreover, for the MODIS image of the corresponding area on the same day (Fig. 12e and f), green tide extraction also exhibits high accuracy, reaching 84.92 %. The distribution pattern remains consistent for SAR datasets (as shown in Fig. 12b and f). The relevant assessment of the entire image for the green tide dataset is provided in Table 2. Additionally, SAR observation images covering the Yellow Sea were randomly selected (Fig. 12g–j), where the overall mIOU reached 87.62 %, further highlighting the excellent detection capability of the model.
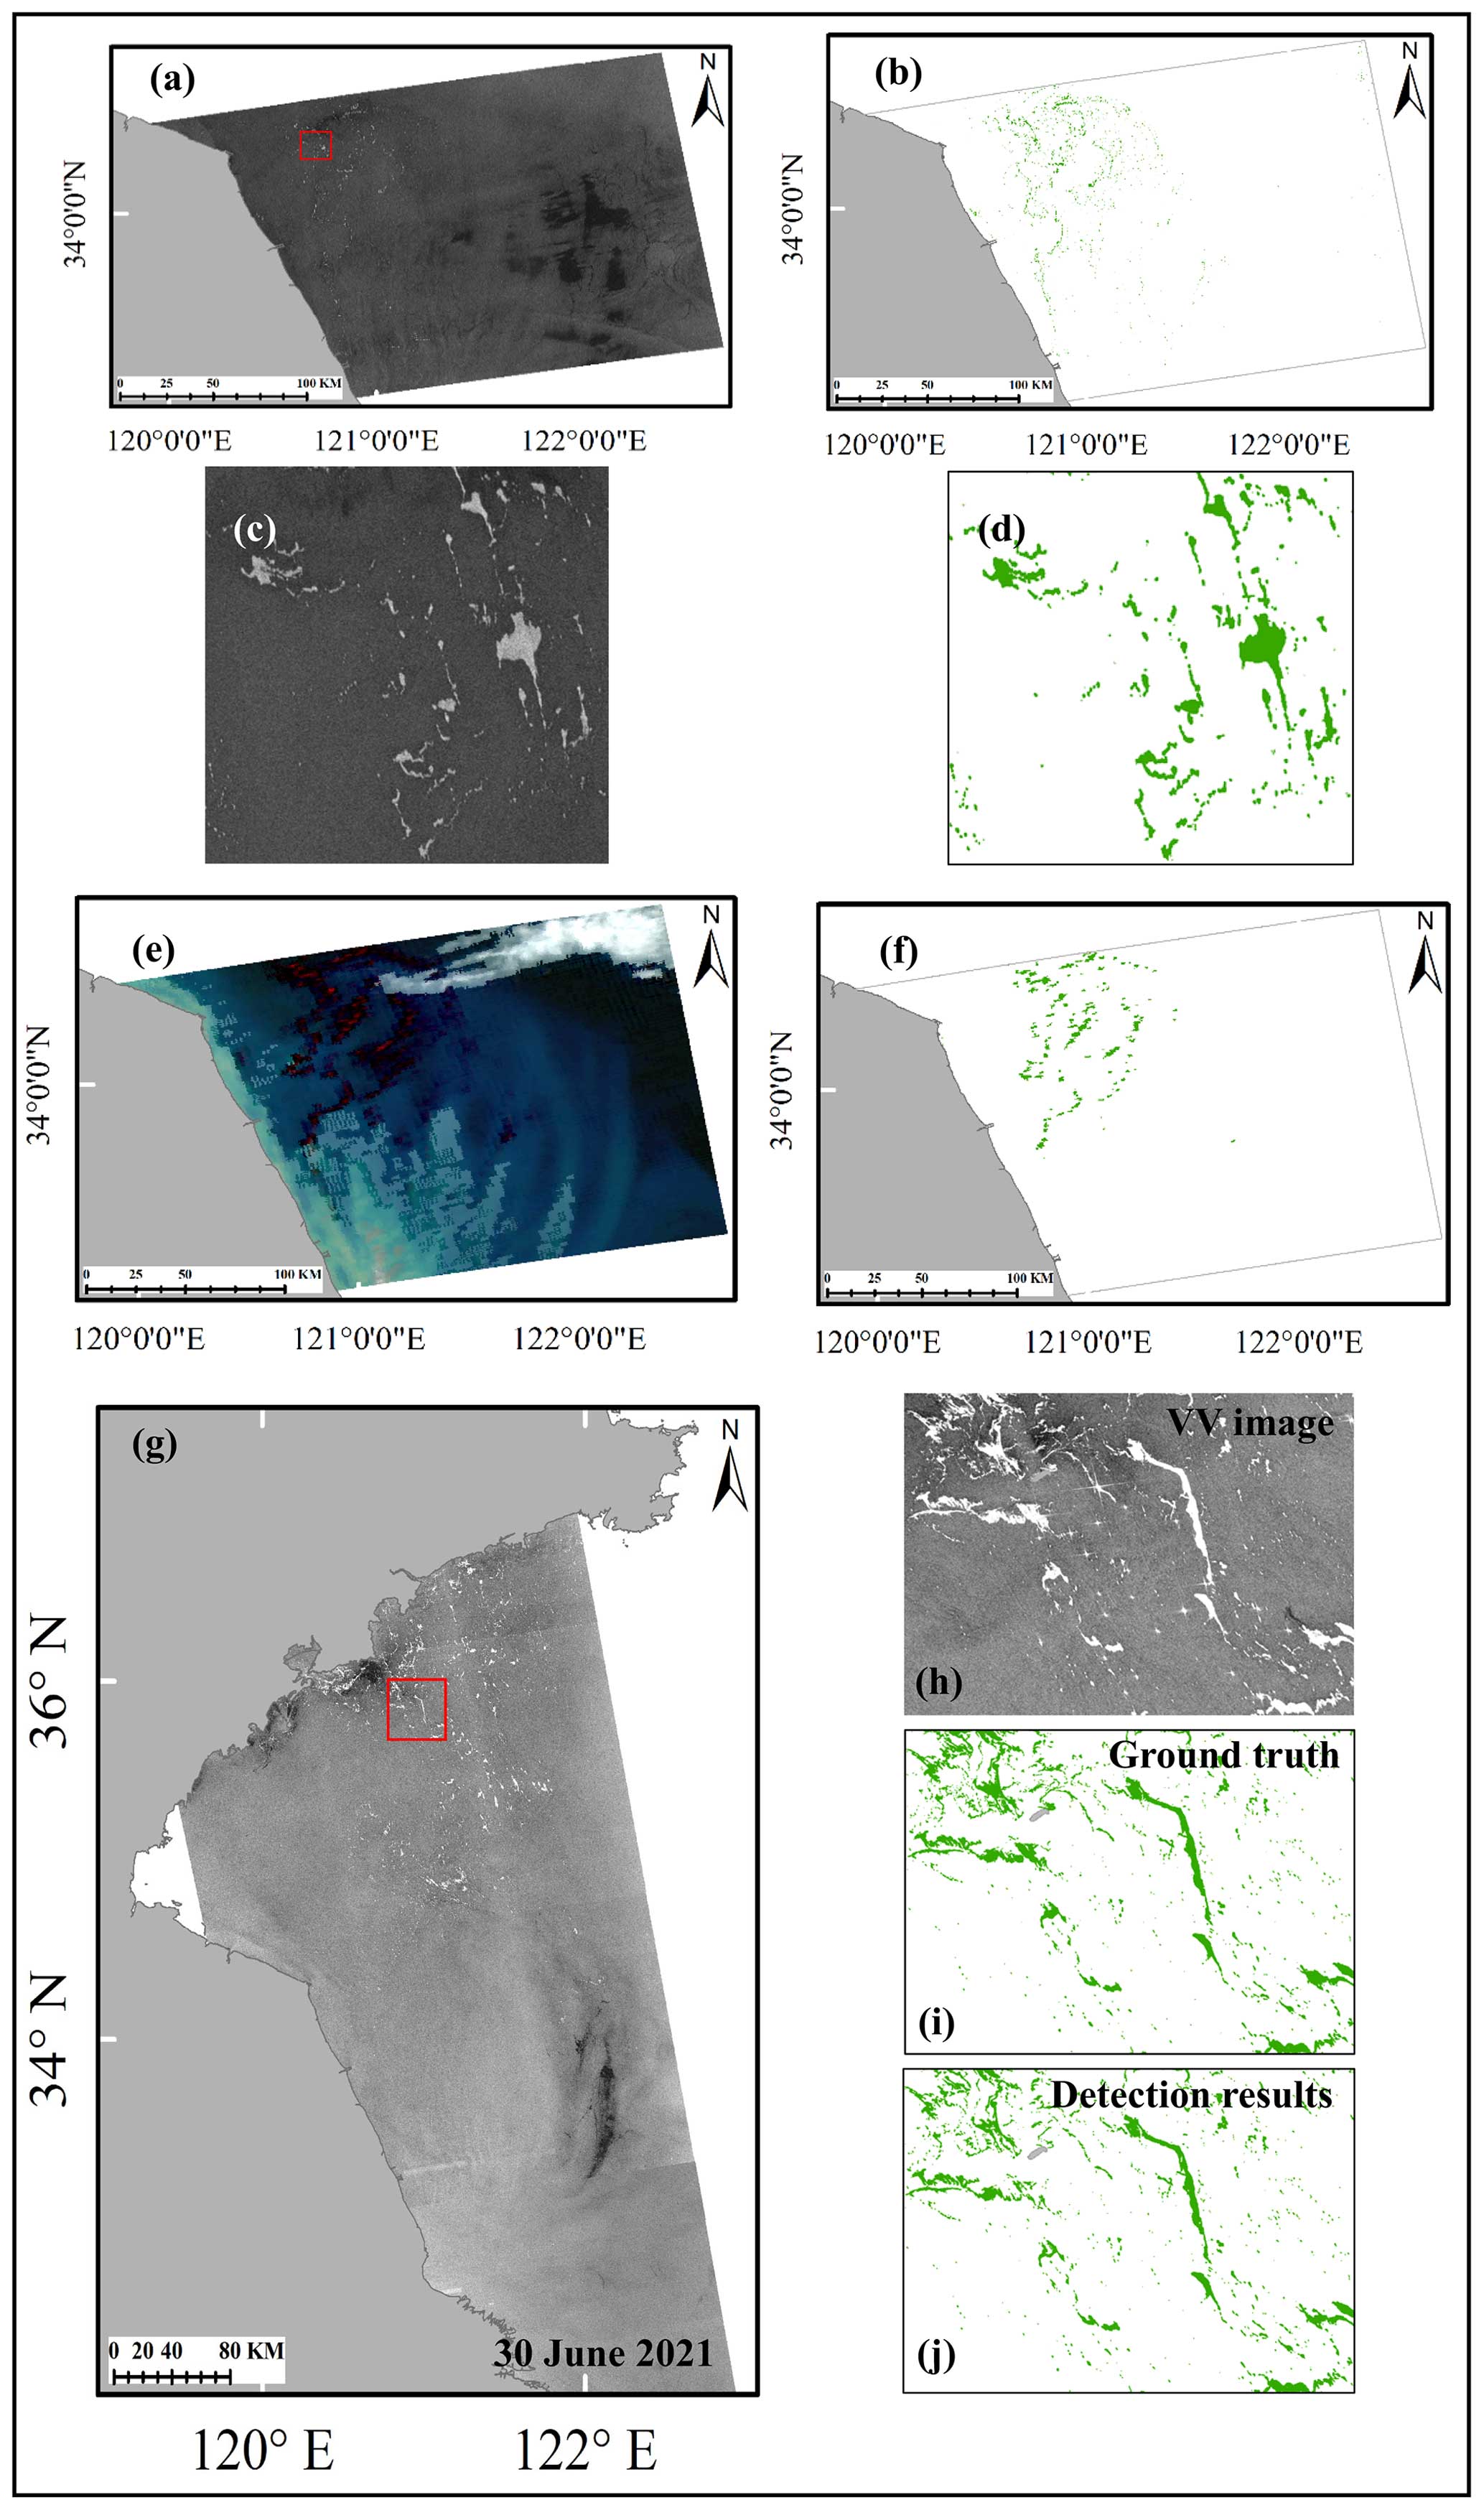
Figure 12Randomly selected SAR image detection results for the Subei Shoal (a–f) and the entire Yellow Sea (g–j) regions on 22 June 2018 and 30 June 2021.
3.2 Verification of weekly green tide datasets in the Yellow Sea
Green tide bloom follows a parabolic-like change pattern (as shown in Fig. 1d). Therefore, verifying whether the weekly product conforms to this pattern each year is necessary. The specific process is as follows:
-
Generation of the green tide outbreak curve. Fit the outbreak parabolic curve of the entire life cycle of the green tide bloom using the satellite's daily green algae coverage data and the Gompertz curve model. The Gompertz curve model is a widely used mathematical model for describing growth processes and has been particularly effective in modeling biological phenomena, such as population growth, tumor growth, and the spread of diseases. Its applicability extends to domains where growth initially accelerates rapidly but then slows down as it approaches an asymptotic limit. The growth process of Yellow Sea green tide outbreaks also meets these characteristics. The decaying process of the green tide can be seen as the reverse process of the growth stage. Previous studies have demonstrated a good empirical fit to similar data types, including green tide data (Winsor, 1932; Xu et al., 2023). The Gompertz curve model is calculated as
where y is the accumulative coverage of the satellite's daily green tide, and x is the corresponding date (here it is expressed in terms of day of year, DOY). a, b, and c represent the fitted constant terms obtained by utilizing daily green tide coverage to fit the Gompertz curve model. We derived the life parabola curve using a piecewise fitting strategy based on the green tide growth and decaying periods.
-
Comparison with daily observations. Compare the daily green tide coverage obtained from satellite daily observations with the daily green tide coverage predicted by the parabolic curve.
-
Assessment of daily observation uncertainty. Calculate the observation uncertainty (R2 and RMSE, recorded as U1) of the satellite daily product by comparing it with the fitted parabolic curve.
-
Calculation of theoretical weekly average green tide coverage. Based on the green tide parabolic curve, compute all theoretical weekly average green tide coverage values throughout the entire outbreak cycle.
-
Assessment of weekly product uncertainty. Assess the uncertainty (R2 and RMSE, recorded as U2) between the weekly product in this article and the theoretical weekly average data obtained from the parabolic curve.
-
Comparison of weekly and daily uncertainty. Evaluate the difference level between the uncertainty of the weekly product and the daily uncertainty, i.e., U1 vs. U2.
We randomly chose the green tide outbreak in 2019 as a case study, as demonstrated in Fig. 13. Not only do the fused weekly green tide data conform to a parabolic outbreak trend, but also their variance is close to the theoretical outbreak curve, with an R2 value of 0.89 and an RMSE of 275 km2 (U2; see Fig. 13b). Moreover, Fig. 13a shows that the uncertainty associated with the weekly data exhibits a stronger correlation and smaller RMSE value than the daily data, with an R2 value of 0.61 and an RMSE of 794 km2 (U1). Furthermore, we noted a decrease in the uncertainty of the fused weekly product, corresponding to an increase in the effectiveness of daily satellite observations over the week.
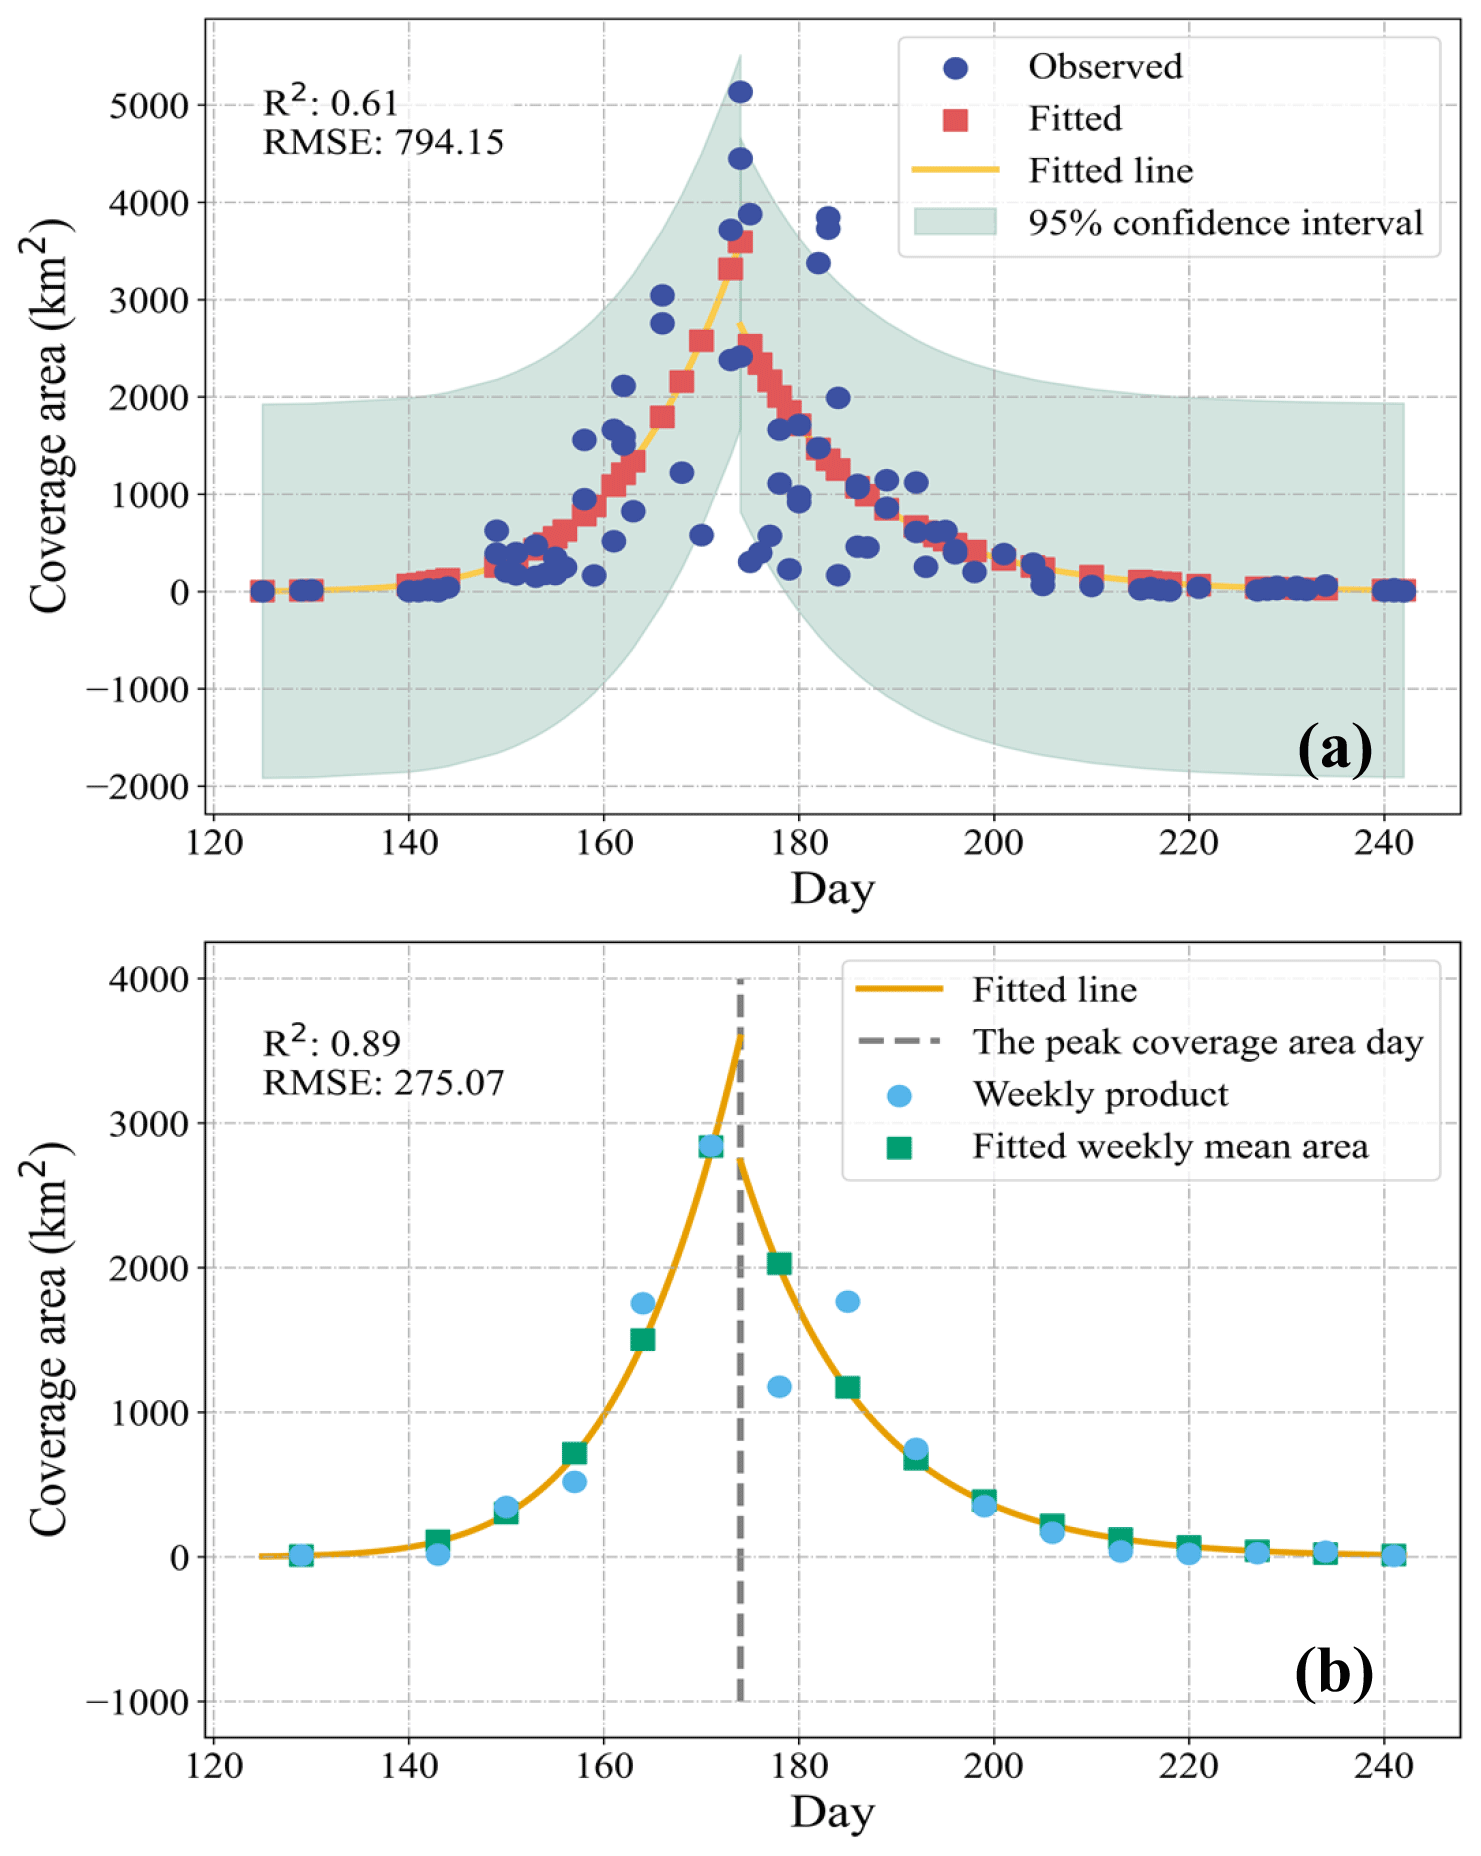
Figure 13Uncertainty assessment of green tide products based on green tide outbreak pattern (2019). (a) Uncertainty in daily product and (b) uncertainty in weekly product.
3.3 Spatial characteristics of green tide coverage
In Fig. 14, the frequency of algae-containing pixels over the years is depicted, accompanied by a hotspot map illustrating the distribution of green algae. The analysis reveals that over 90 % of green algae occurrences are concentrated in the shallow waters of the central Yellow Sea (water depth ≤30 m). This region exhibits higher water transparency than the shallow coastal waters off the Subei Shoal, facilitating enhanced light absorption by floating algae during their drift, thereby promoting their growth. Additionally, the area surrounding the Shandong Peninsula experiences a notable influx of green algae (highlighted in the black box in Fig. 14), attributed primarily to the influence of wind forces and ocean currents.
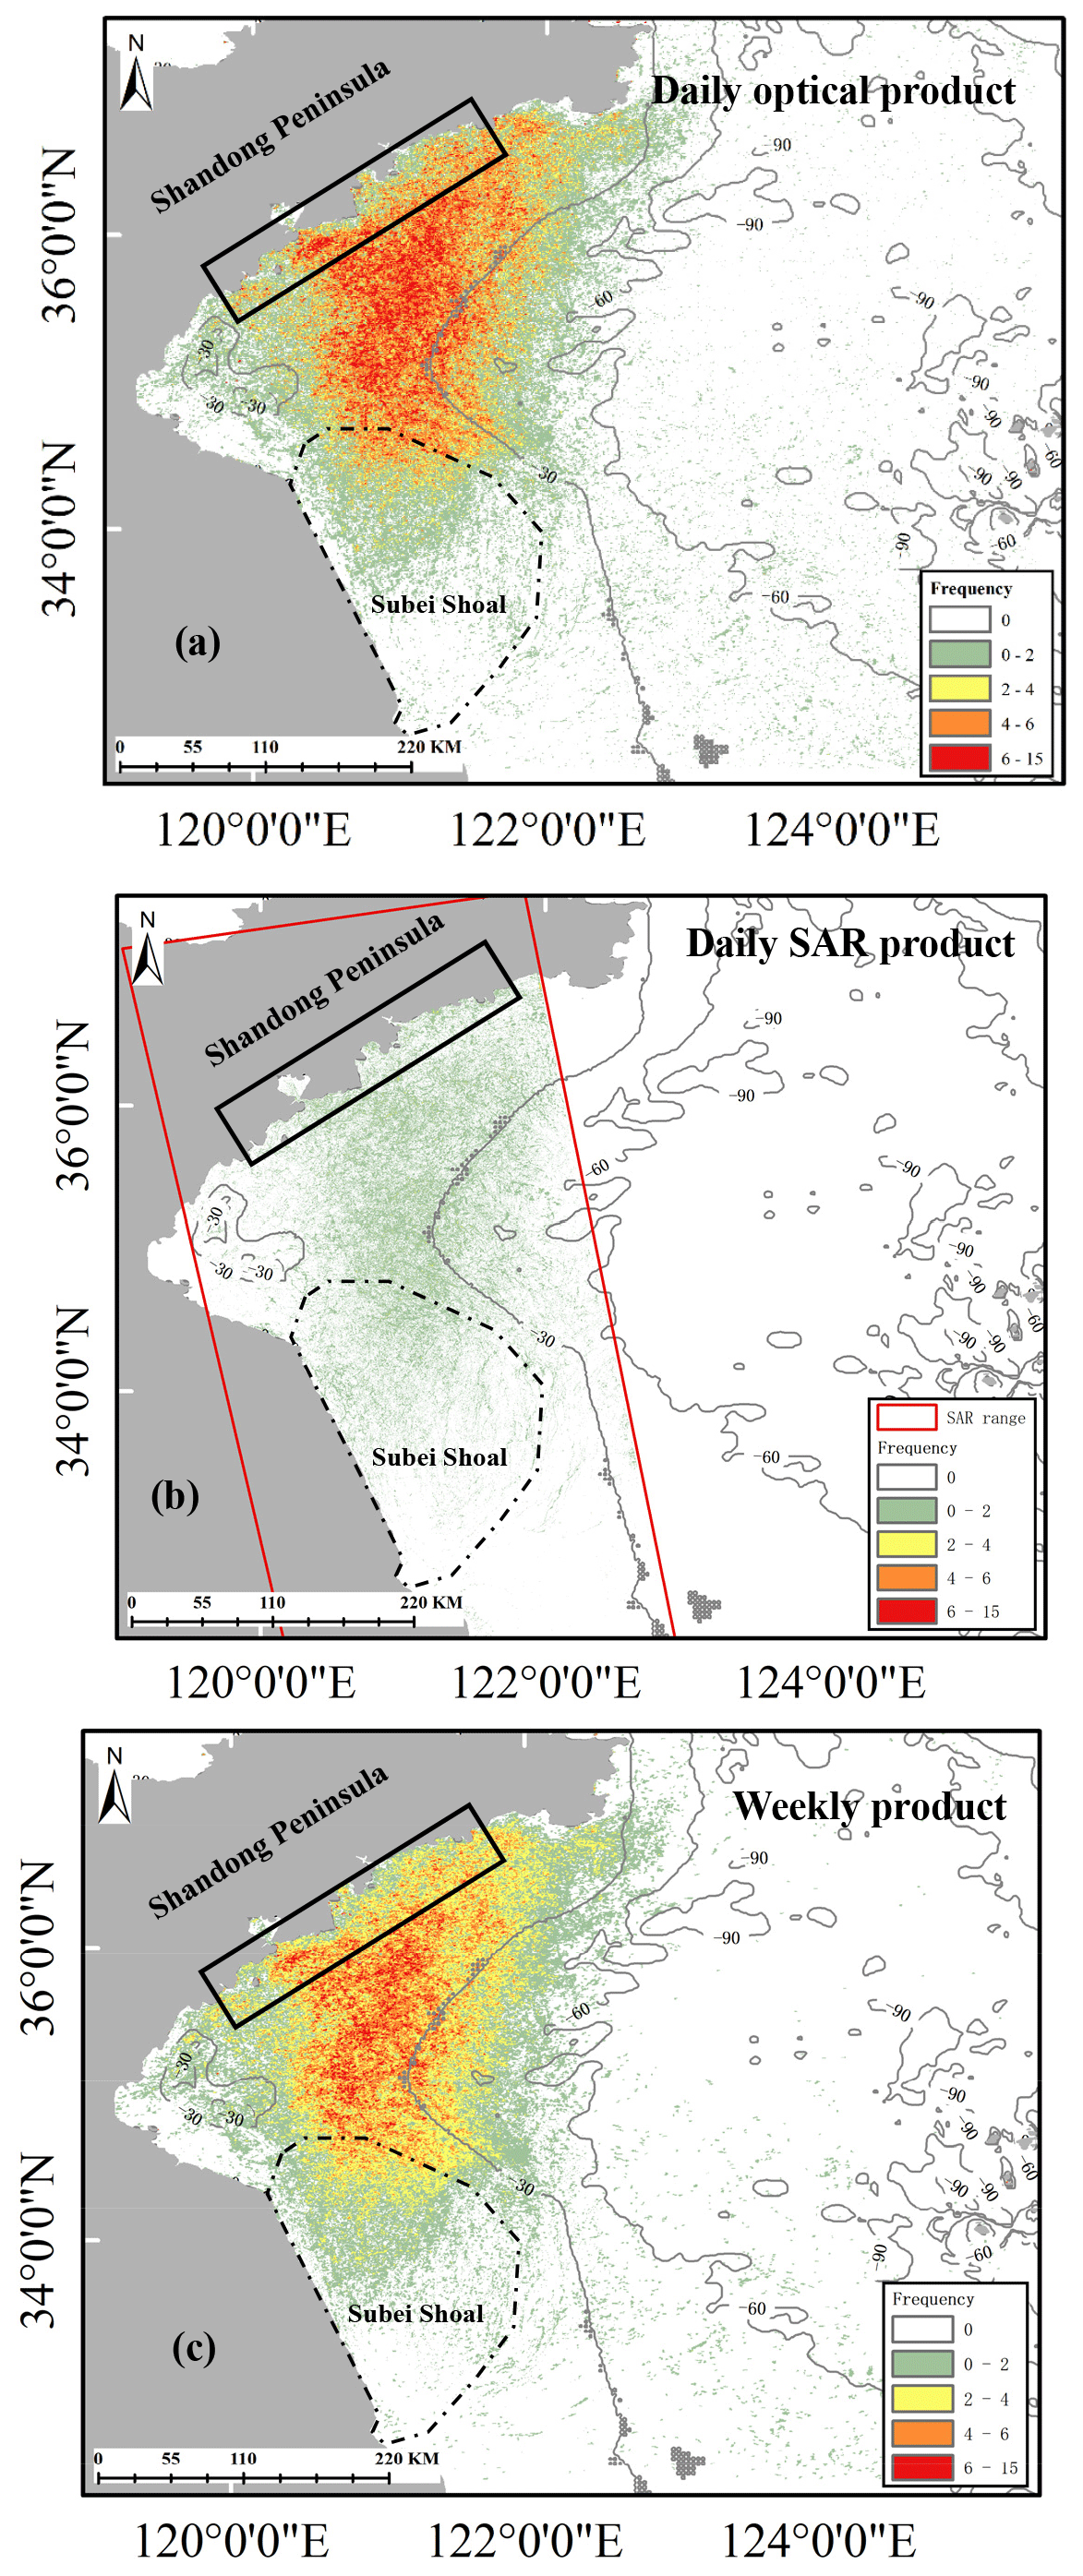
Figure 14Green tide distribution hotspot map obtained from daily optical (a) and SAR (b) products and weekly products (c).
3.4 Temporal characteristics of green tide coverage
Based on daily and weekly green tide datasets derived from optical and SAR images, we analyzed the time series of green tide coverage to determine the annual maximum area coverage of algae observed by both satellites. The resulting maximum coverage time series aligns with findings from Cao et al. (2023) and Hu et al. (2023). As shown in Fig. 15a, from 2008 to 2012, there was a notable downward trend in annual variations of green tide coverage. However, since 2012, there has been a rapid expansion in the scale of green tide outbreaks, particularly evident since 2018. Notably, the outbreak in 2019 reached unprecedented levels, partially influenced by proposed prevention and control measures. However, these measures have not been entirely effective in curbing large-scale green tide outbreaks (Feng et al., 2020; Hao et al., 2020; Sun et al., 2022). It is worth noting that SAR sensors only detect green algae completely exposed on the sea surface (as depicted in Fig. 1c), resulting in slightly smaller coverage areas compared to daily optical detection (indicated by the orange polyline in Fig. 15a). This discrepancy can also be attributed to variations in the dates corresponding to the maximum coverage areas monitored by the two satellites due to different revisit cycles and varying effective observation frequencies under cloud and rain cover. For instance, in 2021, the maximum daily coverage on MODIS (Aqua) images occurred on 23 June, while the maximum daily green tide coverage on SAR images was recorded on 12 June (Fig. 8a and c). The weekly coverage data are derived by fusing daily coverage within each week, with the default set as the middle of each week. This approach helps to mitigate variations in maximum green tide coverage caused by satellite overflying times, as illustrated in Fig. 15a. Furthermore, analysis in Fig. 15b highlights 2012 and 2019 as the years with the lowest and largest values in the historical green tide coverage time series. Notably, the onset of a large-scale green tide outbreak typically occurs much earlier than periods without such outbreaks. Therefore, the scale of a green tide outbreak is directly proportional to its initial onset time. Earlier observations of green algae by satellites correspond to larger expected outbreak scales. Additionally, the green tide outbreak's final scale is directly proportional to the initial outbreak scale (Xing et al., 2019; Cao et al., 2023).
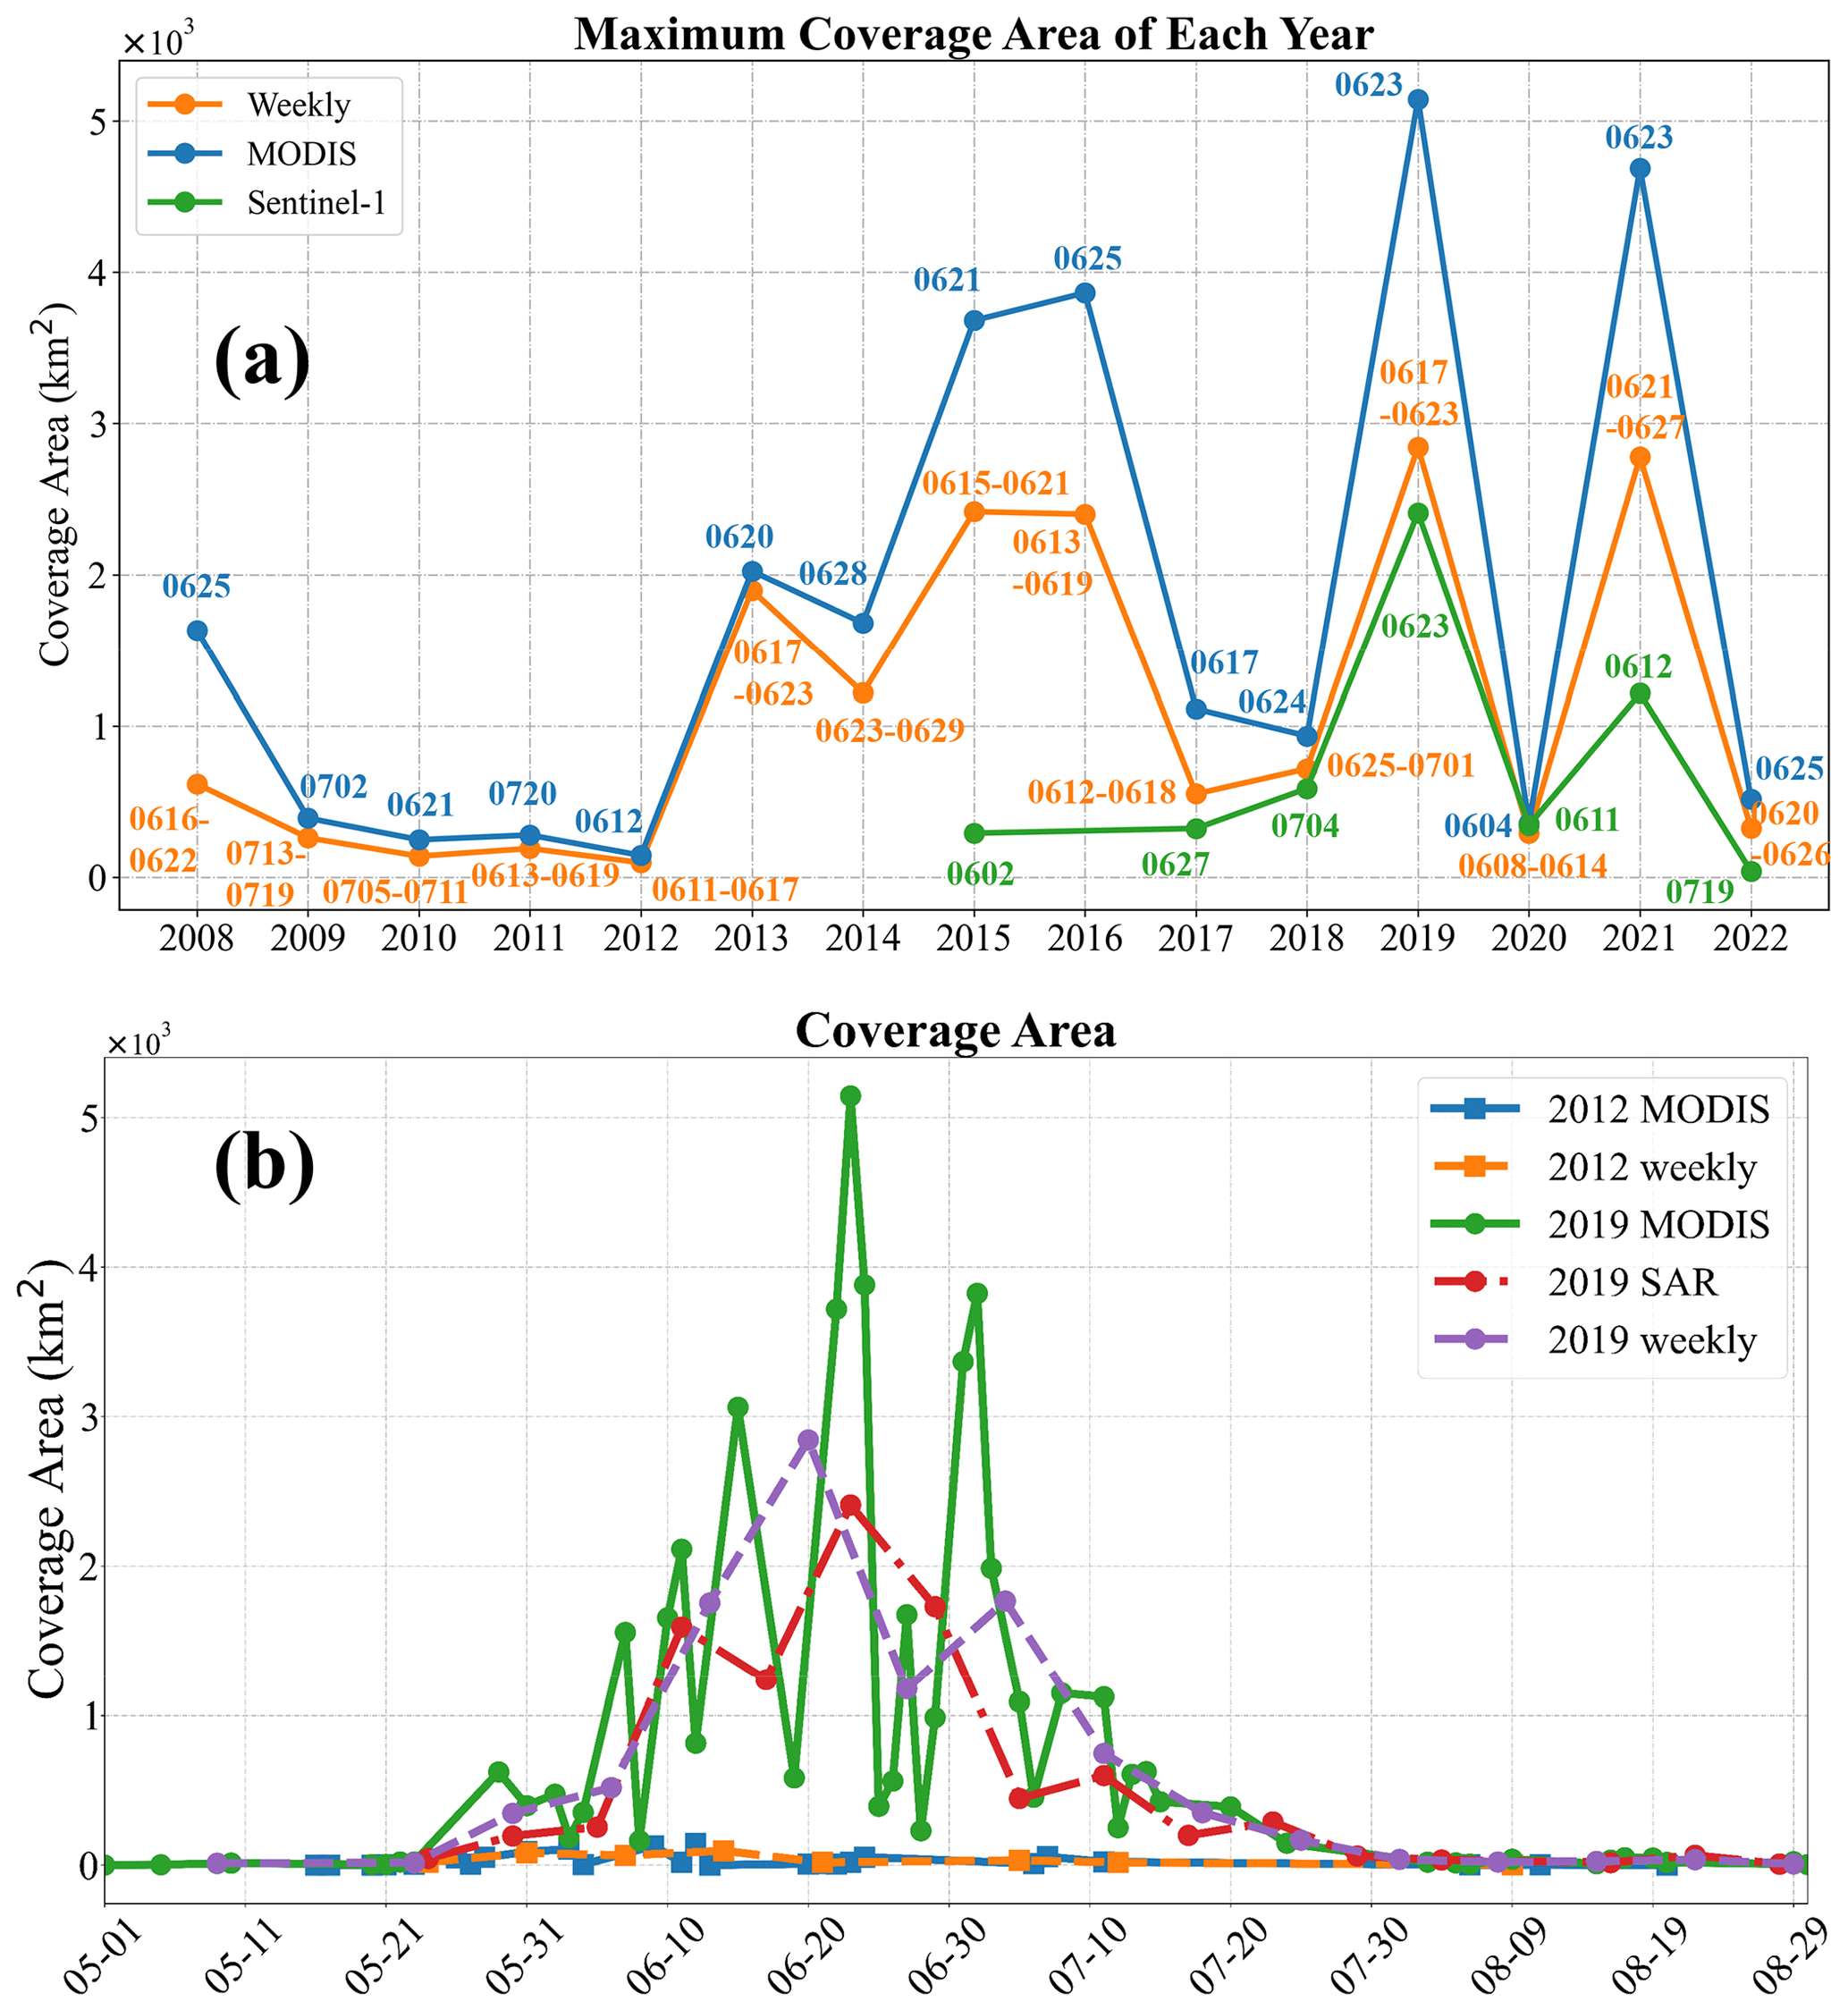
Figure 15(a) Time series of the green tide's maximum daily and weekly coverage area from 2008 to 2022. The numbers represent the corresponding observation date and the week to which the fusion product belongs. (b) Daily and weekly green algae coverage throughout the entire life cycle in 2012 and 2019.
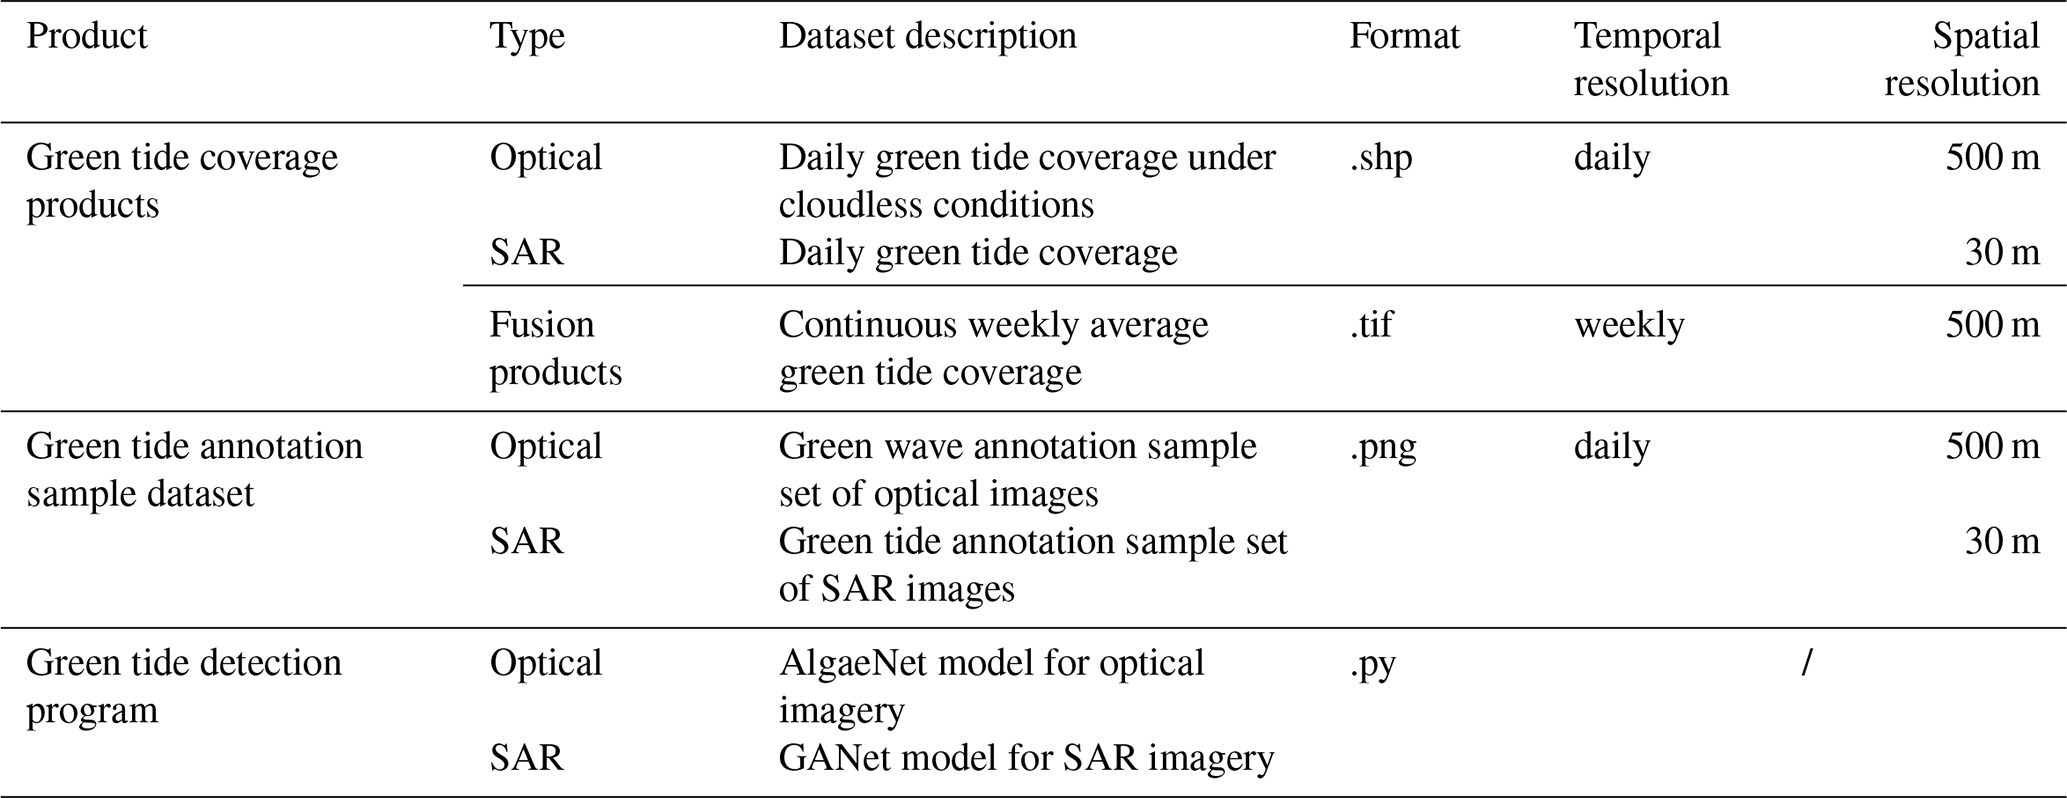
The weekly green tide products and deep-learning models developed in this study have been released, as detailed in Table 3:
-
The study releases the weekly green tide coverage datasets by integrating optical MODIS and Sentinel-1 SAR images spanning 2008–2022 with 500 m spatial resolution. These can be used as foundational data for green tide model simulation and forecasting. The weekly product conforms to the life pattern of green tide outbreaks and exhibits parabolic-curve-like characteristics, with an uncertainty of R2=0.89 and RMSE=275 km2. The weekly green tide product is in Tagged Image File (TIF) format.
-
The continuous weekly datasets were derived from daily green tide datasets, and what the AI-based AlgaeNet and GANet models directly detect is also daily green tide coverage; therefore daily green tide datasets with 500 m spatial resolution from MODIS images and 30 m spatial resolution from SAR images are also released as verification datasets for other green tide extraction models (e.g., Zhou et al., 2021; Qi et al., 2022b; Z. Wang et al., 2023). The overall indices demonstrated a higher mIOU, reaching 85.86 % and 87.62 %, respectively, based on the optical and SAR images covering the entire Yellow Sea. The daily green tide product is provided in shapefile format.
-
The annotated green tide sample dataset will also be shared as ground truth. This ground-truth dataset can be used to train and test for the development of other AI-based green algae extraction models. Optical green algae labels from MODIS images with 500 m spatial resolution and the green algae labels from SAR images with 30 m spatial resolution are provided in Portable Network Graphics (PNG) format.
-
The retrained AI-based green tide detection models – AlgaeNet and GANet – achieved a comprehensive metric mIOU of 67.51 % (85.41 %) based on optical (SAR) testing labels. These models offer scalable and effective tools for future green tide extraction tasks. Furthermore, they can serve as pre-trained models for analyzing various satellite imagery types, including optical GOCI and microwave Gaofen-3 imagery.
The dataset is openly accessible to the public without any restrictions. It is permanently stored at https://doi.org/10.12157/IOCAS.20240410.002 (Gao et al., 2024), where the green tide coverage dataset is available as separate daily and weekly files. The daily and weekly datasets utilize the WGS84 spatial reference system and the UTM51 projected system.
Additionally, the green tide annotation sample dataset and the code for the green tide detection program can be freely accessed on the same website, providing convenient access to annotated samples and code for algae detection programs. All code is written in Python.
The Yellow Sea in the northwest Pacific has witnessed an ecological anomaly known as the green tide since 2008. This phenomenon, characterized by the rapid proliferation and accumulation of large floating algae in a very short time, has escalated into one of the world's largest-scale marine disasters caused by green algae blooms, attracting significant international attention. Satellite remote sensing has emerged as the primary data source for detecting occurrences of green tide, benefiting from its advantages in acquiring data with full coverage, high frequency, and periodic monitoring capabilities. The rapid advancement of artificial intelligence (AI) technology in recent years has provided significant advantages over traditional methods for the precise and intelligent extraction of green algae in satellite imagery. This study utilizes optimized and scalable AI models, namely AlgaeNet and GANet, to comprehensively extract and analyze the Yellow Sea green tide. Our analysis encompasses optical MODIS images (500 m resolution) from 2008 to 2022 and microwave Sentinel-1 synthetic aperture radar (SAR) images (30 m resolution) from 2015 to 2022, with a temporal resolution of 1 d. The evaluation of green algae extraction achieved notable results with the two models, reaching a comprehensive evaluation index (mIOU) of 67.51 % and 85.41 % based on 662 and 267 pairs of optical and SAR-labeled testing samples, respectively. Moreover, when applied to randomly selected optical and SAR entire images of the Yellow Sea, the indices demonstrated even higher mIOU, reaching 85.86 % and 87.62 %, respectively. Most importantly, we present a continuous and seamless weekly average green tide coverage dataset. This weekly dataset is derived from integrating daily optical and SAR green tide coverage during each week of the green tide breakout. Verification shows that this weekly product conforms to the life pattern of green tide outbreaks and exhibits parabolic-curve-like characteristics, with an uncertainty of R2=0.89 and RMSE=275 km2. This weekly green tide dataset provides an independent and reliable source of long-term data spanning 15 years in the Yellow Sea, facilitating comprehensive research in various domains such as forecasting, numerical model simulation, regional- and national-scale climate change analysis, and formulation of disaster prevention plans.
An animation of weekly green tide datasets from 2008 to 2022 has been uploaded as the Supplement. The supplement related to this article is available online at: https://doi.org/10.5194/essd-16-4189-2024-supplement.
LG and XL designed the study, and LG and YG developed the deep-learning code for the AlgaeNet and GANet models and final green tide datasets. YG processed the optical and SAR data and performed the computations. All authors discussed and contributed to the models, datasets, and manuscript.
The contact author has declared that none of the authors has any competing interests.
Publisher's note: Copernicus Publications remains neutral with regard to jurisdictional claims made in the text, published maps, institutional affiliations, or any other geographical representation in this paper. While Copernicus Publications makes every effort to include appropriate place names, the final responsibility lies with the authors.
The MODIS surface reflectance products can be accessed at https://ladsweb.modaps.eosdis.nasa.gov/missions-and-measurements/products/MYD09GA (MYD09GA, last access: 31 August 2024) and https://ladsweb.modaps.eosdis.nasa.gov/missions-and-measurements/products/MOD09GA (MOD09GA, last access: 31 August 2024).
The European Space Agency (ESA) and NASA provided the Sentinel-1 SAR images via https://browser.dataspace.copernicus.eu/ (last access: 31 August 2024) and https://search.asf.alaska.edu/ (last access: 31 August 2024).
This research has been supported by the National Natural Science Foundation of China (grant nos. 42376175, U2006211, 42090044, and 42076200) and the Strategic Priority Research Program of the Chinese Academy of Sciences (grant no. XDB42040401).
This paper was edited by François G. Schmitt and reviewed by Qianguo Xing and one anonymous referee.
Cao, H. and Han, L.: Drift path of green tide and the impact of typhoon “Chan-hom” in the Chinese Yellow Sea based on GOCI images in 2015, Ecol. Inform., 60, 101156, https://doi.org/10.1016/j.ecoinf.2020.101156, 2020.
Cao, M., Li, X., Cui, T., Pan, X., Li, Y., Chen, Y., Wang, N., Xiao, Y., Song, X., and Xu, Y.: Unprecedent green macroalgae bloom: mechanism and implication to disaster prediction and prevention, Int. J. Digit. Earth, 16, 3772–3793, https://doi.org/10.1080/17538947.2023.2257658, 2023.
Chen, G., Huang, B. X., Yang, J., Radenkovic, M., Ge, L. Y., Cao, C. C., Chen, X. Y., Xia, L. H., Han, G. Y., and Ma, Y.: Deep blue artificial intelligence for knowledge discovery of the intermediate ocean, Frontiers in Marine Science, 9, 1034188, https://doi.org/10.3389/fmars.2022.1034188, 2023.
Cui, T., Li, F., Wei, Y., Yang, X., Xiao, Y., Chen, X., Liu, R., Ma, Y., and Zhang, J.: Super-resolution optical mapping of floating macroalgae from geostationary orbit, Appl. Optics, 59, C70–C77, https://doi.org/10.1364/AO.382081, 2020.
Cui, T. W., Liang, X. J., Gong, J. L., Tong, C., Xiao, Y. F., Liu, R. J., Zhang, X., and Zhang, J.: Assessing and refining the satellite-derived massive green macro-algal coverage in the Yellow Sea with high resolution images, ISPRS J. Photogramm., 144, 315–324, https://doi.org/10.1016/j.isprsjprs.2018.08.001, 2018.
Ding, L. and Luan, R.: The taxonomy, habit, and distribution of a green alga enteromorpha prolifera (ulvales, chlorophyta), Oceanologia et Limnologia Sinica, 40, 68–71, 2009.
Dong, C., Xu, G., Han, G., Bethel, B. J., Xie, W., and Zhou, S.: Recent developments in artificial intelligence in oceanography, Ocean-Land-Atmosphere Research, 2022, 9870950, https://doi.org/10.34133/2022/9870950, 2022.
Fang, C., Song, K. S., Shang, Y. X., Ma, J. H., Wen, Z. D., and Du, J.: Remote sensing of harmful algal blooms variability for Lake Hulun using adjusted FAI (AFAI) algorithm, J. Environ. Inform., 34, 108–122, https://doi.org/10.3808/jei.201700385, 2019.
Feng, L., Zhang, H., Sun, Y., Li, X., Su, R., and Shi, X.: On nutrient releases from the decomposition of Ulva prolifera green tide and their impacts on nearshore seawaters in the southern Yellow Sea, Acta Oceanol. Sin., 42, 59–68, https://doi.org/10.3969/j.issn.0253-4193.2020.08.007, 2020.
Gao, L., Li, X., Kong, F., Yu, R., Guo, Y., and Ren, Y.: AlgaeNet: A deep-learning framework to detect floating green algae from optical and SAR imagery, IEEE J. Sel. Top. Appl., 15, 2782–2796, https://doi.org/10.1109/JSTARS.2022.3162387, 2022.
Gao, L., Guo, Y., and Li, X.: The green tide coverage product in the Yellow Sea during 2008–2022, Oceanographic Data Center, Chinese Academy of Sciences (CASODC), https://doi.org/10.12157/IOCAS.20240410.002, 2024.
Guo, W., Zhao, L., and Li, X.: The interannual variation of Green Tide in the Yellow Sea, Acta Oceanol. Sin., 38, 36–45, https://doi.org/10.3969/j.issn.0253-4193.2016.12.004, 2016.
Guo, Y., Gao, L., and Li, X.: A deep learning model for green algae detection on SAR images, IEEE T. Geosci. Remote, 60, 4210914, https://doi.org/10.1109/TGRS.2022.3215895, 2022.
Hall-Beyer, M.: Practical guidelines for choosing GLCM textures to use in landscape classification tasks over a range of moderate spatial scales, Int. J. Remote Sens., 38, 1312–1338, https://doi.org/10.1080/01431161.2016.1278314, 2017.
Hao, Y., Qu, T., Guan, C., Zhao, X., Hou, C., Tang, X., and Wang, Y.: Competitive advantages of Ulva prolifera from Pyropia aquaculture rafts in Subei Shoal and its implication for the green tide in the Yellow Sea, Mar. Pollut. Bull., 157, 111353, https://doi.org/10.1016/j.marpolbul.2020.111353, 2020.
Hu, C.: A novel ocean color index to detect floating algae in the global oceans, Remote Sens. Environ., 113, 2118–2129, https://doi.org/10.1016/j.rse.2009.05.012, 2009.
Hu, C., Feng, L., Hardy, R. F., and Eric, J.: Hochberg, Spectral and spatial requirements of remote measurements of pelagic Sargassum macroalgae, Remote Sens. Environ., 167, 229–246, https://doi.org/10.1016/j.rse.2015.05.022, 2015.
Hu, C., Qi, L., Hu, L., Cui, T., Xing, Q., He, M., Wang, N., Xiao, Y., Sun, D., and Lu, Y.: Mapping Ulva prolifera green tides from space: A revisit on algorithm design and data products, Int. J. Appl. Earth Obs., 116, 103173, https://doi.org/10.1016/j.jag.2022.103173, 2023.
Hu, L., Zeng, K., Hu, C., and He, M.-X.: On the remote estimation of Ulva prolifera areal coverage and biomass, Remote. Sens. Environ., 223, 194–207, https://doi.org/10.1016/j.rse.2019.01.014, 2019.
Jordan, M. I. and Mitchell, T. M.: Machine learning: Trends, perspectives, and prospects, Science, 349, 255–260, https://doi.org/10.1126/science.aaa8415, 2015.
LeCun, Y., Bengio, Y., and Hinton, G.: Deep learning, Nature, 521, 436–444, 2015.
Li, D., Gao, Z., and Xu, F.: Research on the dissipation of green tide and its influencing factors in the Yellow Sea based on Google Earth Engine, Mar. Pollut. Bull., 172, 112801, https://doi.org/10.1016/j.marpolbul.2021.112801, 2021.
Li, X., Liu, B., Zheng, G., Ren, Y., Zhang, S., Liu, Y., Gao, L., Liu, Y., Zhang, B., and Wang, F.: Deep-learning-based information mining from ocean remote-sensing imagery, Natl. Sci. Rev., 7, 1584–1605, 2020.
Li, X., Zhou, Y., and Wang, F.: Advanced information mining from ocean remote sensing imagery with deep learning, Journal of Remote Sensing, 2022, 9849645, https://doi.org/10.34133/2022/9849645, 2022.
Liu, D., Keesing, J. K., He, P., Wang, Z., Shi, Y., and Wang, Y.: The world's largest macroalgal bloom in the Yellow Sea, China: formation and implications, Estuar. Coast. Shelf S., 129, 2–10, 2013.
Liu, H., Guo, H., and Zhang, L.: SVM-based sea ice classification using textural features and concentration from RADARSAT-2 dual-pol ScanSAR data, IEEE J. Sel. Top. Appl., 8, 1601–1613, 2015.
Qi, L., Hu, C., Wang, M., Shang, S., and Wilson, C.: Floating algae blooms in the East China Sea, Geophys. Res. Lett., 44, 11501–11509, 2017.
Qi, L., Hu, C., Barnes, B. B., Lapointe, B. E., Chen, Y., Xie, Y., and Wang, M.: Climate and anthropogenic controls of seaweed expansions in the East China Sea and Yellow Sea, Geophys. Res. Lett., 49, e2022GL098185, https://doi.org/10.1029/2022GL098185, 2022a.
Qi, L., Wang, M., Hu, C., and Holt, B.: On the capacity of Sentinel-1 synthetic aperture radar in detecting floating macroalgae and other floating matters, Remote Sens. Environ., 280, 113188, https://doi.org/10.1016/j.rse.2022.113188, 2022b.
Russell, B. C., Torralba, A., Murphy, K. P., and Freeman, W. T.: LabelMe: a database and web-based tool for image annotation, Int. J. Comput. Vision, 77, 157–173, 2008.
Son, Y. B., Min, J.-E., and Ryu, J.-H.: Detecting massive green algae (Ulva prolifera) blooms in the Yellow Sea and East China Sea using geostationary ocean color imager (GOCI) data, Ocean Sci. J., 47, 359–375, 2012.
Sun, Y., Yao, L., Liu, J., Tong, Y., Xia, J., Zhao, X., Zhao, S., Fu, M., Zhuang, M., and He, P.: Prevention strategies for green tides at source in the Southern Yellow Sea, Mar. Pollut. Bull., 178, 113646, https://doi.org/10.1016/j.marpolbul.2022.113646, 2022.
Valiela, I., Liu, D., Lloret, J., Chenoweth, K., and Hanacek, D.: Stable isotopic evidence of nitrogen sources and C4 metabolism driving the world's largest macroalgal green tides in the Yellow Sea, Sci. Rep.-UK, 8, 17437, https://doi.org/10.1038/s41598-018-35309-3, 2018.
Wang, H. and Li, X.: DeepBlue: Advanced convolutional neural network applications for ocean remote sensing, IEEE Geosci. Remote Sens. Mag., 12, 138–161, https://doi.org/10.1109/MGRS.2023.3343623, 2024.
Wang, Z., Xiao, J., Fan, S., Li, Y., Liu, X., and Liu, D.: Who made the world's largest green tide in China? – an integrated study on the initiation and early development of the green tide in Yellow Sea, Limnol. Oceanogr., 60, 1105–1117, 2015.
Wang, Z., Fang, Z., Liang, J., and Song, X.: Estimating Ulva prolifera green tides of the Yellow Sea through ConvLSTM data fusion, Environ. Pollut., 324, 121350, https://doi.org/10.1016/j.envpol.2023.121350, 2023.
Winsor, C. P.: The Gompertz curve as a growth curve, P. Natl. Acad. Sci. USA, 18, 1–8, https://doi.org/10.1073/pnas.18.1.1, 1932.
Xing, Q. and Hu, C.: Mapping macroalgal blooms in the Yellow Sea and East China Sea using HJ-1 and Landsat data: Application of a virtual baseline reflectance height technique, Remote Sens. Environ., 178, 113–126, 2016.
Xing, Q., Wu, L., Tian, L., Cui, T., Li, L., Kong, F., Gao, X., and Wu, M.: Remote sensing of early-stage green tide in the Yellow Sea for floating-macroalgae collecting campaign, Mar. Pollut. Bull., 133, 150–156, 2018.
Xing, Q., An, D., Zheng, X., Wei, Z., Wang, X., Li, L., Tian, L., and Chen, J.: Monitoring seaweed aquaculture in the Yellow Sea with multiple sensors for managing the disaster of macroalgal blooms, Remote Sens. Environ., 231, 111279, https://doi.org/10.1016/j.rse.2019.111279, 2019.
Xu, S., Yu, T., Xu, J., Pan, X., Shao, W., Zuo, J., and Yu, Y.: Monitoring and Forecasting Green Tide in the Yellow Sea Using Satellite Imagery, Remote Sens.-Basel, 15, 2196, https://doi.org/10.3390/rs15082196, 2023.
Yu, H., Wang, C., Sui, Y., Li, J., and Chu, J.: Automatic Extraction of Green Tide Using Dual Polarization Chinese GF-3 SAR Images, J. Coastal Res., 102, 318–325, https://doi.org/10.2112/SI102-038.1, 2020.
Yuan, C., Xiao, J., Zhang, X., Zhou, J., Wang, Z.: A new assessment of the algal biomass of green tide in the Yellow Sea, Mar. Pollut. Bull., 174, 113253, https://doi.org/10.1016/j.marpolbul.2021.113253, 2022.
Zhou, F., Ge, J., Liu, D., Ding, P., Chen, C., and Wei, X.: The Lagrangian-based Floating Macroalgal Growth and Drift Model (FMGDM v1.0): application to the Yellow Sea green tide, Geosci. Model Dev., 14, 6049–6070, https://doi.org/10.5194/gmd-14-6049-2021, 2021.