the Creative Commons Attribution 4.0 License.
the Creative Commons Attribution 4.0 License.
 | 23 Aug 2024
First comprehensive stable isotope dataset of diverse water units in a permafrost-dominated catchment on the Qinghai–Tibet Plateau
Yuzhong Yang
Qingbai Wu
Xiaoyan Guo
Lu Zhou
Helin Yao
Dandan Zhang
Zhongqiong Zhang
Ji Chen
Guojun Liu
Considered the Asian water tower, the Qinghai–Tibet Plateau (QTP) processes substantial permafrost, and its hydrological environments are spatially different and can be easily disturbed by changing permafrost and melting ground ice. Permafrost degradation compels melting permafrost to become an important source of surface runoff, changes the storage of groundwater, and greatly influences the hydrological processes in permafrost regions. However, the evidence linking permafrost degradation and hydrological processes on the QTP is lacking, which increases the uncertainties in the evaluation of the results of changing permafrost on the water resources. Stable isotopes offer valuable information on the connections between changing permafrost (ground ice) and water components. It is therefore particularly important to observe the changes in the stable isotopes of different waterbodies which can vary over hourly to annual timescales and truly capture the thawing signals and reflect the influence of permafrost (ground ice) on the regional hydrological processes. The Beiluhe Basin (BLH) in the hinterland of the QTP was selected; it integrates all the water components related to hydrological cycles well and is an ideal site to study the hydrological effect of permafrost change. This paper presents the temporal data of stable isotopes (δ18O, δD, and d-excess) in different waterbodies (precipitation, stream water, thermokarst lake, and groundwater) in the BLH produced between 2017 and 2022. Here, the first detailed stable isotope data of ground ice at 17 boreholes and 2 thaw slumps are presented. A detailed description of the sampling processes, sample pretreating processes, and isotopic data quality control is given. The data first described the full seasonal isotope amplitude in the precipitation, stream, and thermokarst lakes and delineated the depth isotopic variability in ground ice. In total, 554 precipitation samples, 2402 lake/pond samples, 675 stream water samples, 102 supra-permafrost water samples, and 19 sub-permafrost water samples were collected during 6 years of continuous sampling work. Importantly, 359 ground ice samples at different depths from 17 boreholes and 2 profiles were collected. This first dataset provides a new basis for understanding the hydrological effects of permafrost degradation on the QTP. It also provides support for the cryospheric study on the Northern Hemisphere. The dataset provided in this paper can be obtained at https://doi.org/10.5281/zenodo.10684110 (Yang, 2024).
- Article
(6856 KB) - Full-text XML
-
Supplement
(57778 KB) - BibTeX
- EndNote


Recognized as the main component of cryosphere, permafrost plays critical roles in climate change, the evolution of the ecosystem, the water cycle, and human activities (Brown et al., 1997). Throughout the past several decades, the thermal stability of permafrost has suffered serious threats (Cheng et al., 2019; Douglas et al., 2021; Biskaborn et al., 2019) caused by continuous global warming (Shukla et al., 2019). The latest Intergovernmental Panel on Climate Change (IPCC) report indicates that up to 24 %–69 % of permafrost will disappear by 2100 (Shukla et al., 2019). Warming and thawing of permafrost and an overall reduction in the ice content have been predicted under future climate change scenarios (Shukla et al., 2019). Dramatic permafrost degradation and ground ice melting has changed the regional hydrological processes (Yang et al., 2011; Quinton and Baltzer, 2013; Rogger et al., 2017), enhanced the hydraulic connections (Connon et al., 2014; Cheng and Jin, 2013; Zhang et al., 2013), and compelled ground ice to become an important source of surface runoff and lakes (Yang et al., 2019; Zhang et al., 2005; Lawrence and Slater, 2005). Accordingly, clarifying the influence of degrading permafrost on the ecohydrology and water resources is of great significance to the protection of the eco-environment and the effective utilization of fresh water in permafrost regions in the world.
The Qinghai–Tibet Plateau (QTP) is known as the Asia Water Tower, which is considered the headwater region of many large rivers in Asia (Immerzeel et al., 2010). As the world's largest high-altitude permafrost region (Cheng et al., 2019), the QTP contains as many as 1.06×10⁶ km2 of permafrost and 12 700 km3 of ground ice (Cheng et al., 2019). The extensive development of permafrost and substantial reserves of ground ice has played critical roles in climate change, ecosystem transition, water resources, the carbon budget, and the infrastructure of the QTP (Zhao et al., 2020; F. Liu et al., 2022; L. Liu et al., 2022). Accordingly, the QTP has been becoming a topical region for scientists from different research fields (Wang et al., 2006; Yang et al., 2019; Zhao et al., 2021). The QTP has been experiencing severe warming over the past 50 years (Yao et al., 2013; Ran et al., 2022; Kuang and Jiao, 2016), leading to accelerated permafrost degradation (Wu and Zhang, 2010; Zhao et al., 2021) and thus greatly affecting the plateau water–eco-environment–carbon cycle systems (T. Wang et al., 2023; Yi et al., 2014; F. Liu et al., 2022).
So far, due to the harsh climate conditions, inconvenient transportation, and the high experimental costs of site-specific field data, there has been a lack of comprehensive research on the different waterbodies in permafrost regions over a long time period on the QTP, making it challenging to study the water cycle and hydrological processes associated with changing permafrost. In addition, traditional methods (e.g., modeling or the GRACE satellite technique) are thus difficult for delineating the processes of the ice–water transition truly and comprehensively, thus greatly increasing the uncertainties in evaluation results about the impacts of permafrost degradation on the hydrological processes (Guo et al., 2017). Hydrogen and oxygen stable isotopes (δ18O and δD) are widely existing natural tracers which are considered to be ideal tools to identify the spatiotemporal patterns of precipitation–river–lake–groundwater systems (Knapp et al., 2019; Narancic et al., 2017; Vystavna et al., 2021) and therefore to delineate hydrological connectivity under degrading permafrost (Wang et al., 2022; Streletskiy et al., 2015; Yang et al., 2019). Furthermore, the stable isotopes can document the signals of ice–water phase transition and freezing history well, making them able to provide a convenient means for investigating the ground ice evolution (Michel, 2011; Lacelle et al., 2014; Porter et al., 2019) in permafrost.
Accordingly, continued observations of the stable isotope data, required to understand the changes in the hydrological processes and water vapor cycles linked with permafrost degradation and ground ice melt, are therefore of great importance. However, the acquisition of long time series stable isotopic data in a permafrost-dominated catchment on the QTP is challenging, especially as the stable isotope records of thermokarst lakes/ponds and ground ice on the QTP are extremely scarce. This greatly limits a deep understanding of the hydrological processes under thawing permafrost.
In this paper, we provide information on the study site and full documentation of the water components in a typical permafrost watershed (Beiluhe Basin, BLH) on the QTP. The datasets presented here, including the stable isotopes of daily precipitation, monthly isotope data of surface waters (stream and thermokarst lakes/ponds) and groundwater, and ground ice within 20 m depth, will be of great value for tracking water vapor cycles, for capturing the signals of permafrost thawing, and for delineating the hydrological routines of permafrost meltwater, as well as for continuing baseline studies for future permafrost degradation trend analysis and water resource evaluations on the QTP. Special emphasis is given to the critical role of the BLH for research in the hinterland of QTP to diagnose the effect of thawing permafrost.
A typical permafrost catchment, namely the Beiluhe Basin (BLH; Fig. 1), was selected to comprehensively observe the hydrological processes under changing permafrost. The BLH is situated in the interior of the QTP with elevations of 4500 to 4600 m.s.l. It is considered a core region of the Hoh Xil Nature Reserve region and provides the best habitats for wild animals on the QTP. The BLH is also identified as one of the most fragile and sensitive ecosystems in the world due to the diversities in the ecosystems, which include swamp meadow, alpine meadow, degrading alpine meadow, alpine steppe, desert alpine grassland, and sparse grassland (Yin et al., 2017). According to the meteorological station of the BLH, between 2017 and 2022 the annual mean air temperature ranged between −3.57 °C (2019) and −2.43 °C (2022), the annual precipitation ranged between 394 mm (2020) and 556 mm (2018), and the duration of negative air temperature exceeds 200 d.
The BLH is closely connected with the source area of the Yangtze River (i.e., the Tuotuo He River) and is characterized by a complex hydrological system of streams (Yang et al., 2017), thermokarst lakes (Yang et al., 2016; Niu et al., 2011), groundwater (springs), and abundant ground ice (Yang et al., 2013, 2016). Thermokarst lakes are widely distributed in the basin, with a total lake number of more than 1200 (Luo et al., 2015) and which are showing a gradually increasing trend. In addition, controlled by the piedmont faults of the Gushan Mountain (Fig. 1) in the BLH, the natural springs are extensively exposed on the ground, and these are the main sources of small streams. The connectivity of lakes, streams, groundwater, and melting water from permafrost plays an important role in how ecological and hydrological systems are propagated in this basin.
The BLH is located in the zone of continuous ice-rich permafrost in the Changtang Basin. The permafrost thickness is approximately 20–80 m. The mean annual ground temperature (MAGT) at 15 m depth ranges from −1.8 to −0.5 °C, and the active layer thickness is 1.6–3.4 m (Wu et al., 2015). Ground ice is abundant in this region, and as much as 70 % of this area has a volumetric ice content (VIC) higher than 30 % (Luo et al., 2015). Most of the ground ice in the BLH is identified as excess ice (Niu et al., 2002) which could melt out to recharge supra-permafrost water (springs) or even surface water (Yang et al., 2016). Accordingly, the BLH is a natural laboratory in which to conduct field hydrological observations, and the observation data can facilitate the development of human infrastructure and the ecological restoration of QTP.
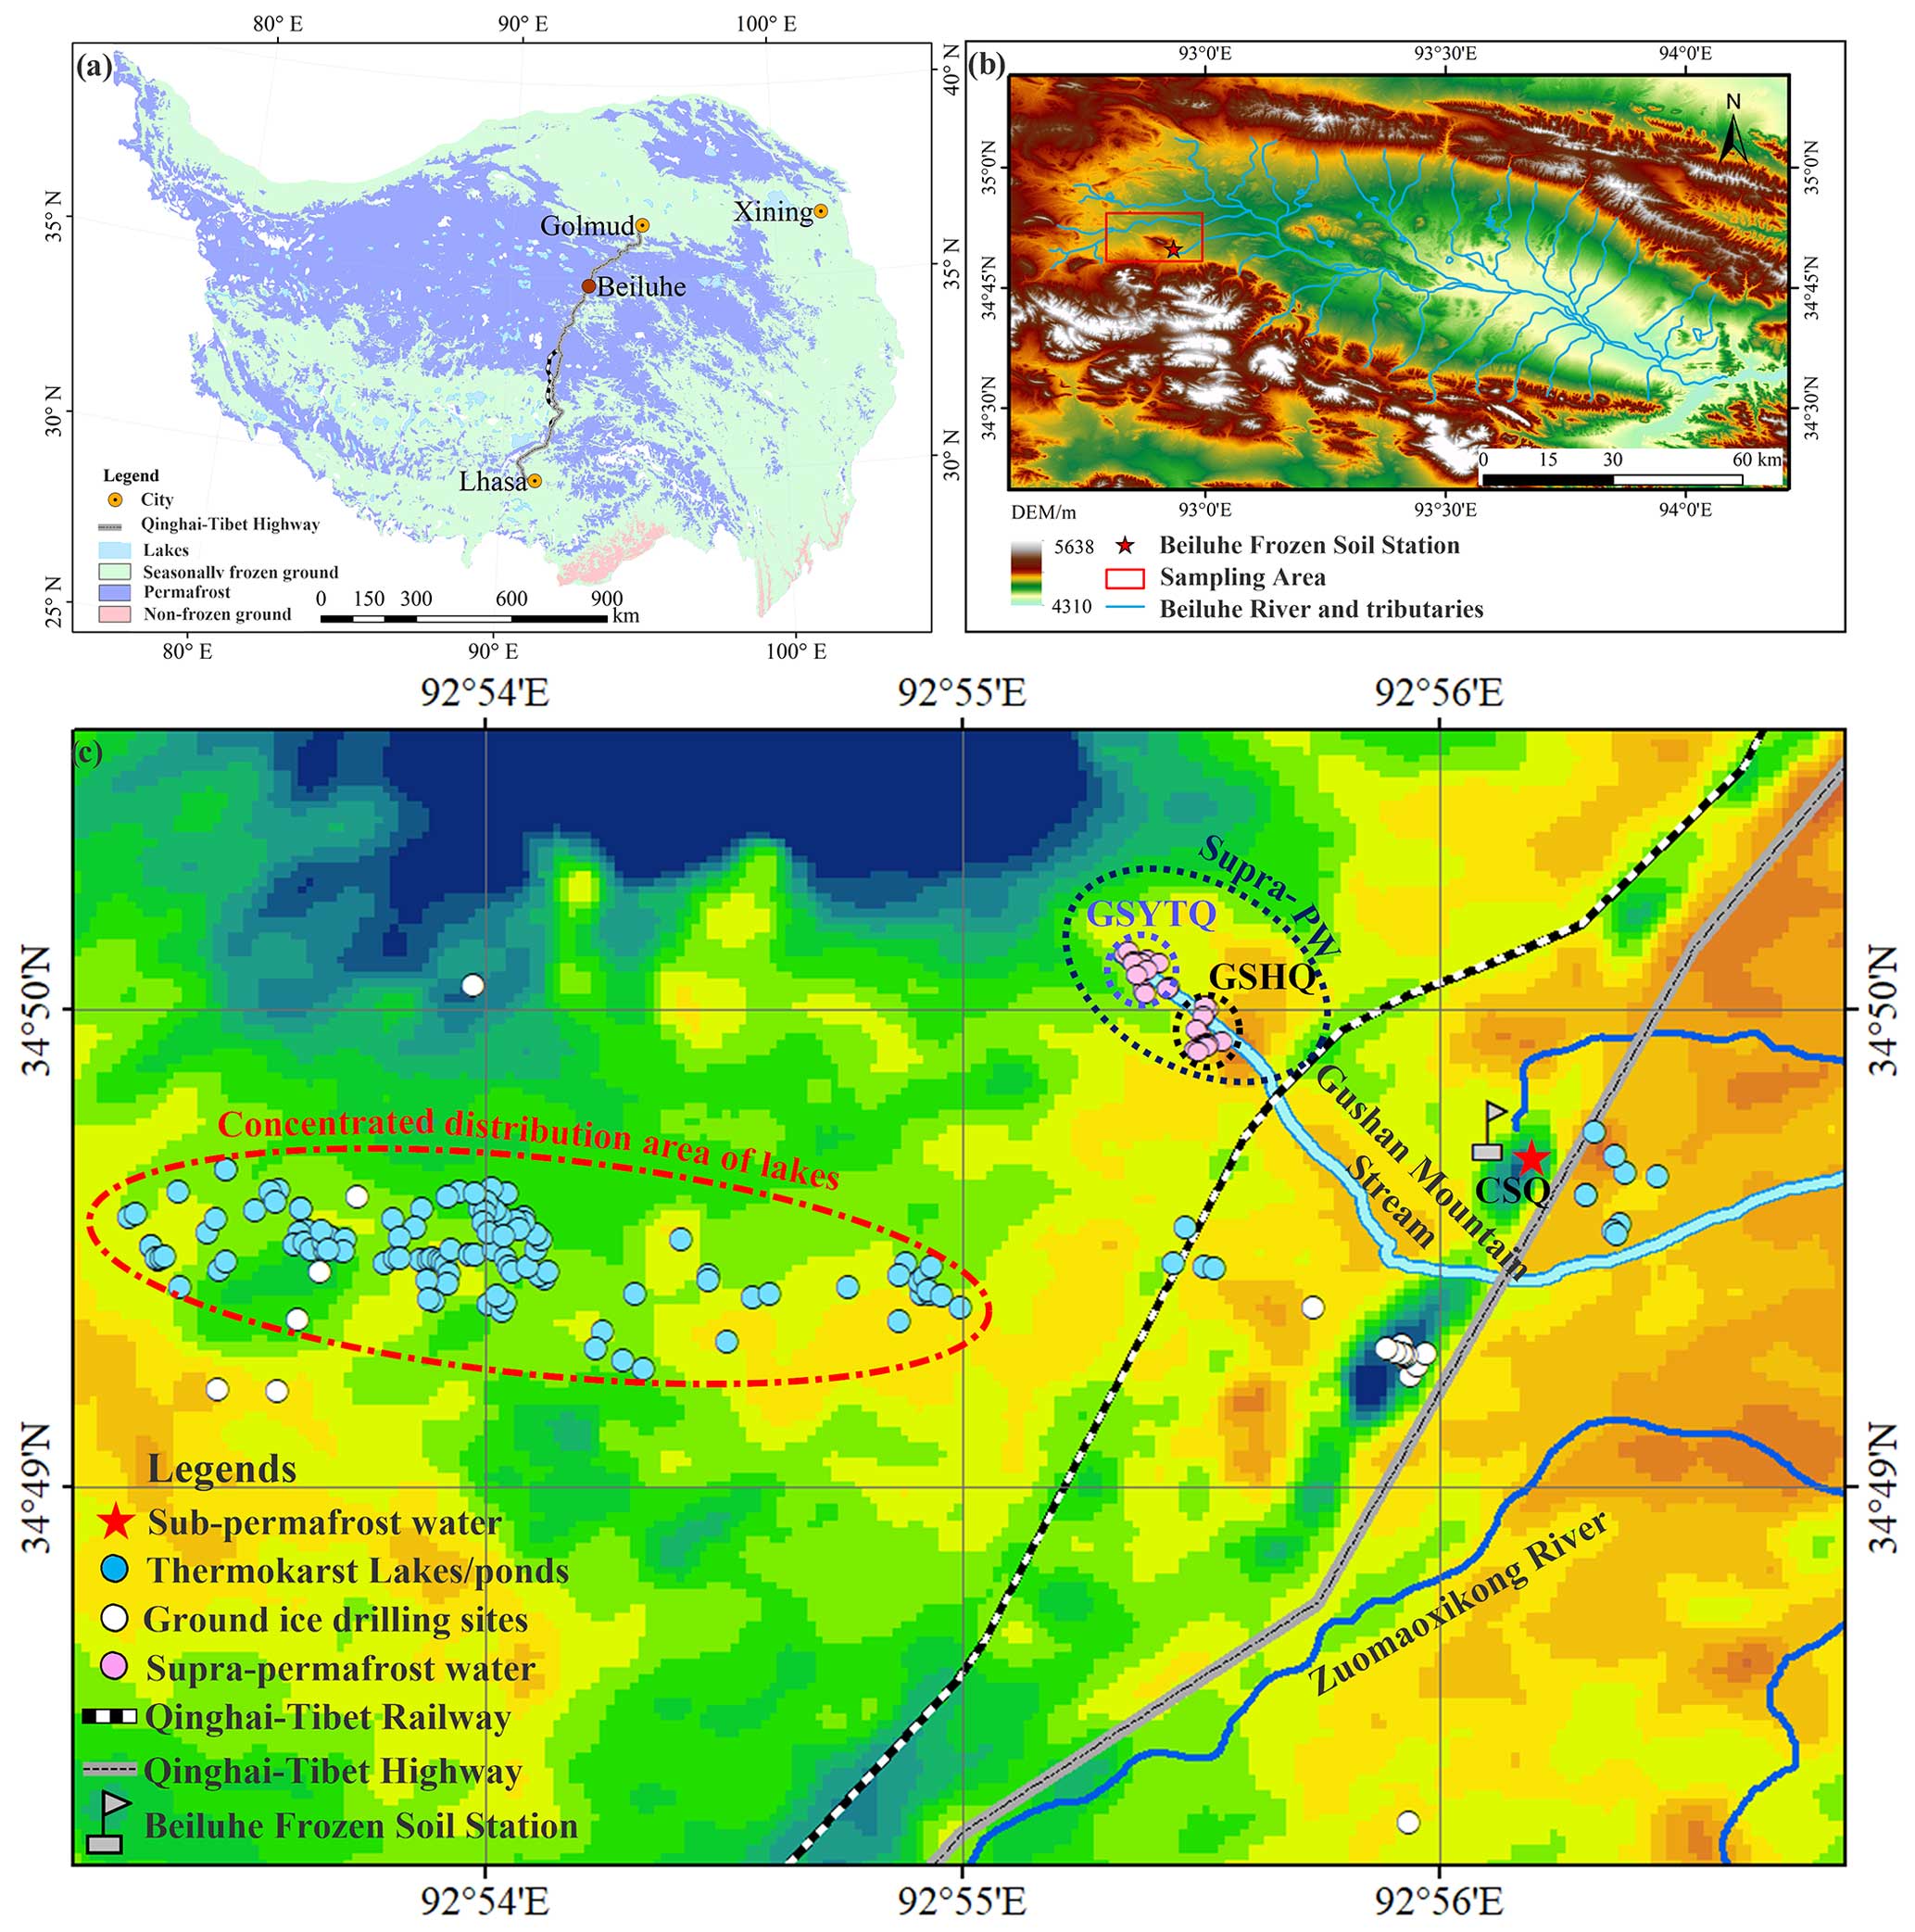
Figure 1(a) Location of the Beiluhe Basin on the QTP. (b) Distribution of our study area in the Beiluhe Basin. (c) The specific sampling sites of different water components in the BLH. Supra-PW denotes the supra-permafrost water.
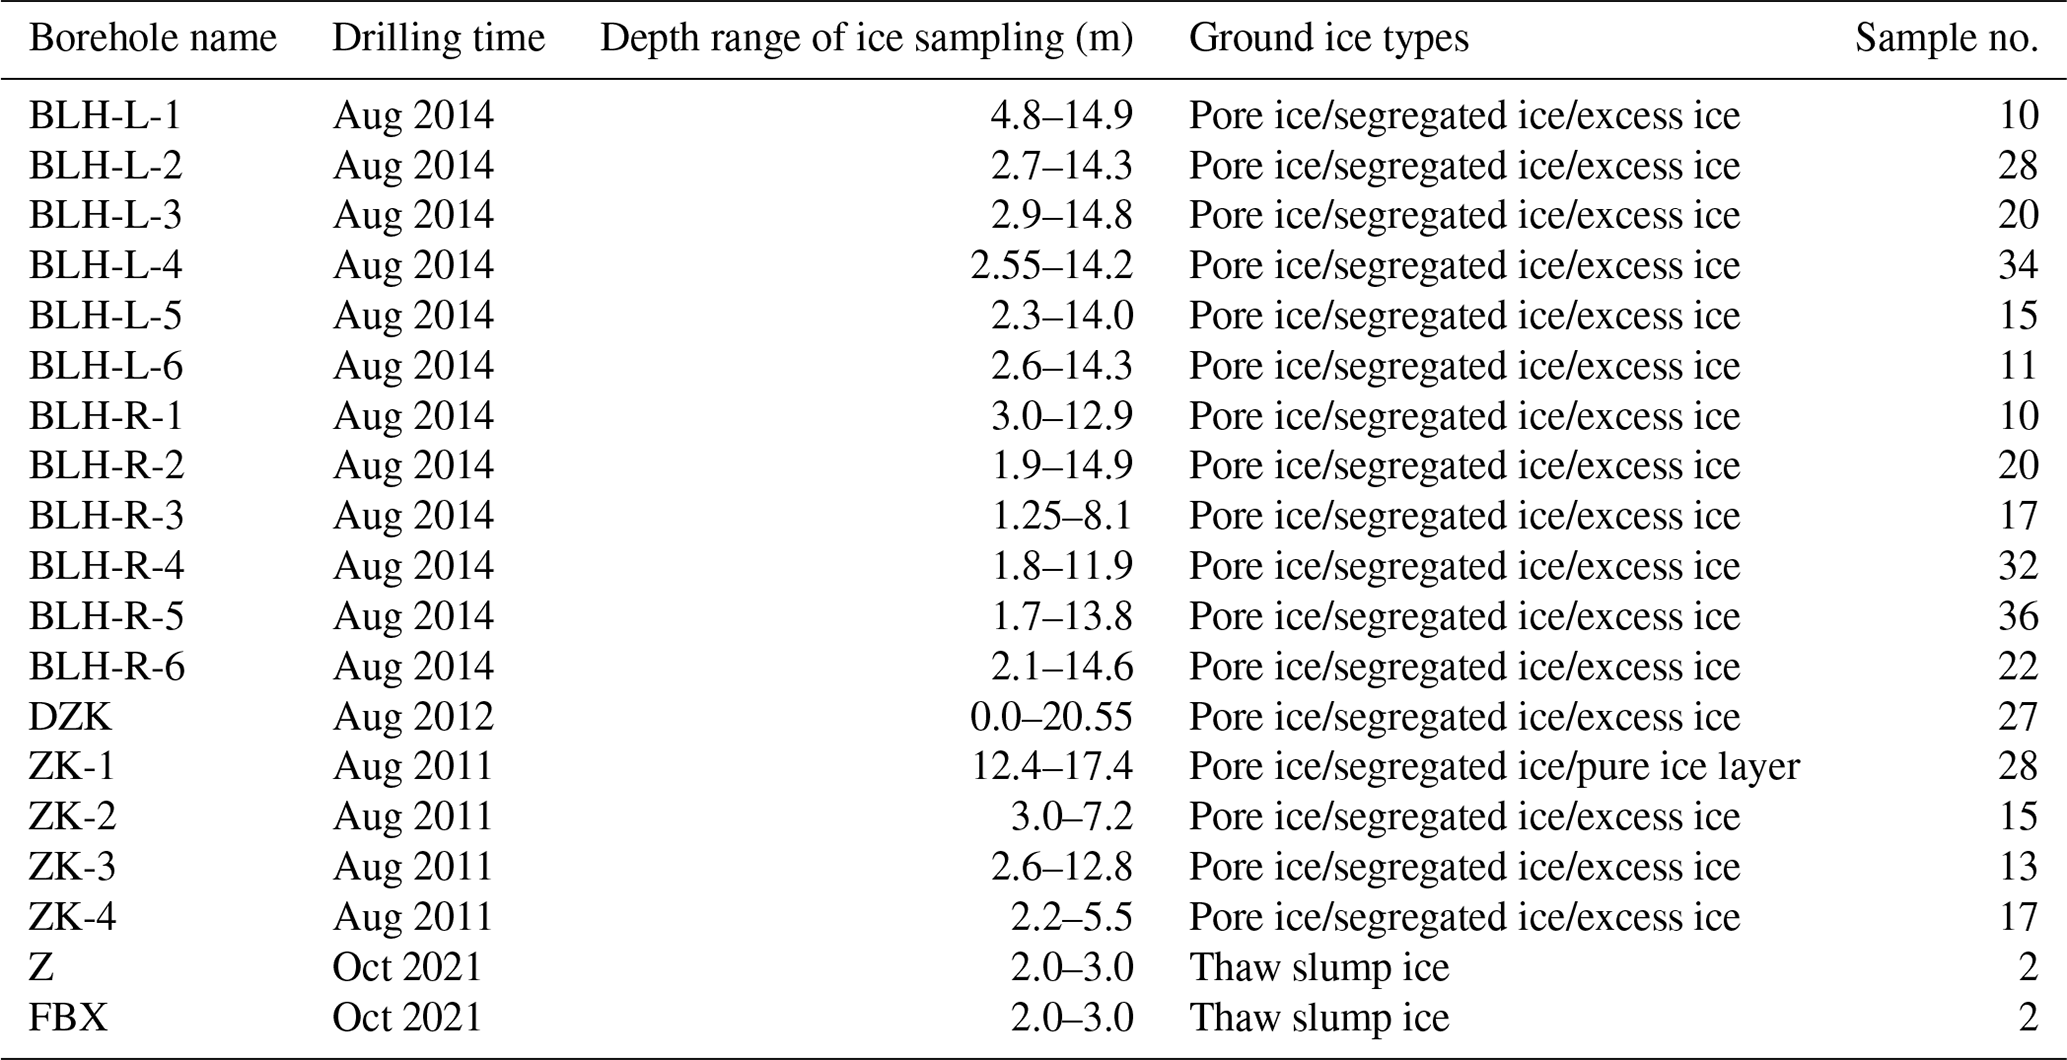
From 2017 to 2022, we set up sampling sites of precipitation, stream, thermokarst lake/pond, groundwater (including supra-permafrost water and sub-permafrost water), and ground ice in the BLH (Fig. 1). The precipitation stable isotope sampling site was set up at the BLH frozen soil station (Fig. 1). A rain gauge was installed to collect daily rain, and a steel plate was put on the roof to obtain enough snow samples. In addition, we selected a typical small stream (defined as the Gushan Mountain stream, GMS) in the BLH which originates from four natural springs in foothills of the Gushan Mountain (Figs. 2, S1). This stream is 4.8 km in length. The vegetation along this stream is mainly composed of deserted steppe. A total of 25 fixed points along the stream were selected to collect water samples during the ice-free seasons between June and October. Furthermore, a typical thermokarst lake belt located in the southwestern part of the BLH station on the QTP was selected to observe the lake water balance (Fig. 1). For the groundwater observation, we selected two areas with substantial naturally opening springs occurring, i.e., springs along both sides of the observation stream (named GSHQ) and a spring in the source area of this stream (named GSYTQ) (Figs. 1, 2). Given the intermittent occurrence of these springs among different years and their unstable isotopic signals, we identified them as supra-permafrost water. In addition, a perennial spring (CSQ; Fig. 1) for the domestic water supply behind the BLH station (Fig. 1), with its aquifer depth (reaching 92 m) being deeper than the permafrost thickness (∼50 m) in the BLH, is selected to conduct continuous sampling work. With regard to the small fluctuations in water levels throughout the year and little interannual differences in the stable isotopes of spring, we identified it as the observation site of sub-permafrost water. In order to detect the permafrost changes and clarify the characteristics of ground ice conditions, 17 boreholes (20 m depth) were drilled in the BLH (Fig. 1). All visible ice samples were collected in the field.
Meanwhile, an auto-meteorological station has been set up in the center of the BLH since 2005. Air temperature is measured using a solar radiation shield 2.0 m above the ground surface. The precipitation amount from the nearby meteorological station was measured using a T200B rain/snow gauge (Geonor AS, Norway), and data were recorded every 30 min. The meteorological data have a high quality and continuity with very limited missing data due to regular maintenance by Beiluhe frozen soil station.
Table 1Location information of the sampling sites in the Beiluhe Basin.
4.1 Sampling and preservation
4.1.1 Precipitation sampling work
According to the International Atomic Energy Agency/Global Network of Isotopes in Precipitation (IAEA/GNIP) precipitation sampling guide, a precipitation collector was manually constructed in an open area near the BLH meteorological station. To avoid the contamination of water vapor from the evaporation of shallow soil and surface water and the mixing of windblown snow, this collector was installed 2 m above the ground. We define 1 complete precipitation day as beginning at 20:00 UTC+8 on 1 d and ending at 20:00 on the next day; then, one sample was collected. All the rainfall samples were immediately collected after the end of the precipitation to minimize the effects of evaporation. Hail and snow samples were filled in pre-cleaned plastic bags, the air was pressed out from the bags and sealed to avoid the water vapor exchange, and all samples in sealed bags were melted at room temperature (25 °C). In order to clarify the changes comprehensively and accurately in the precipitation isotopes in the BLH, we tried to collect all samples during every precipitation event, including light rain and short time events (usually with precipitation amounts of less than 5 mm). Accordingly, a wide-mouth stainless-steel plate (400 mm × 600 mm) was used to collect enough samples of light rain and short time rain/snow events for analysis.
Regarding preserving samples, 100 mL high-density polyethylene (HDPE) bottles were used. Before the sampling, the bottles were washed three times with rainwater and then rapidly filled. In total, 554 precipitation samples were collected, including 224 rain samples, 203 snow samples, 85 hail samples, and 42 sleet samples.
4.1.2 Stream, thermokarst lakes/ponds, and groundwater sampling
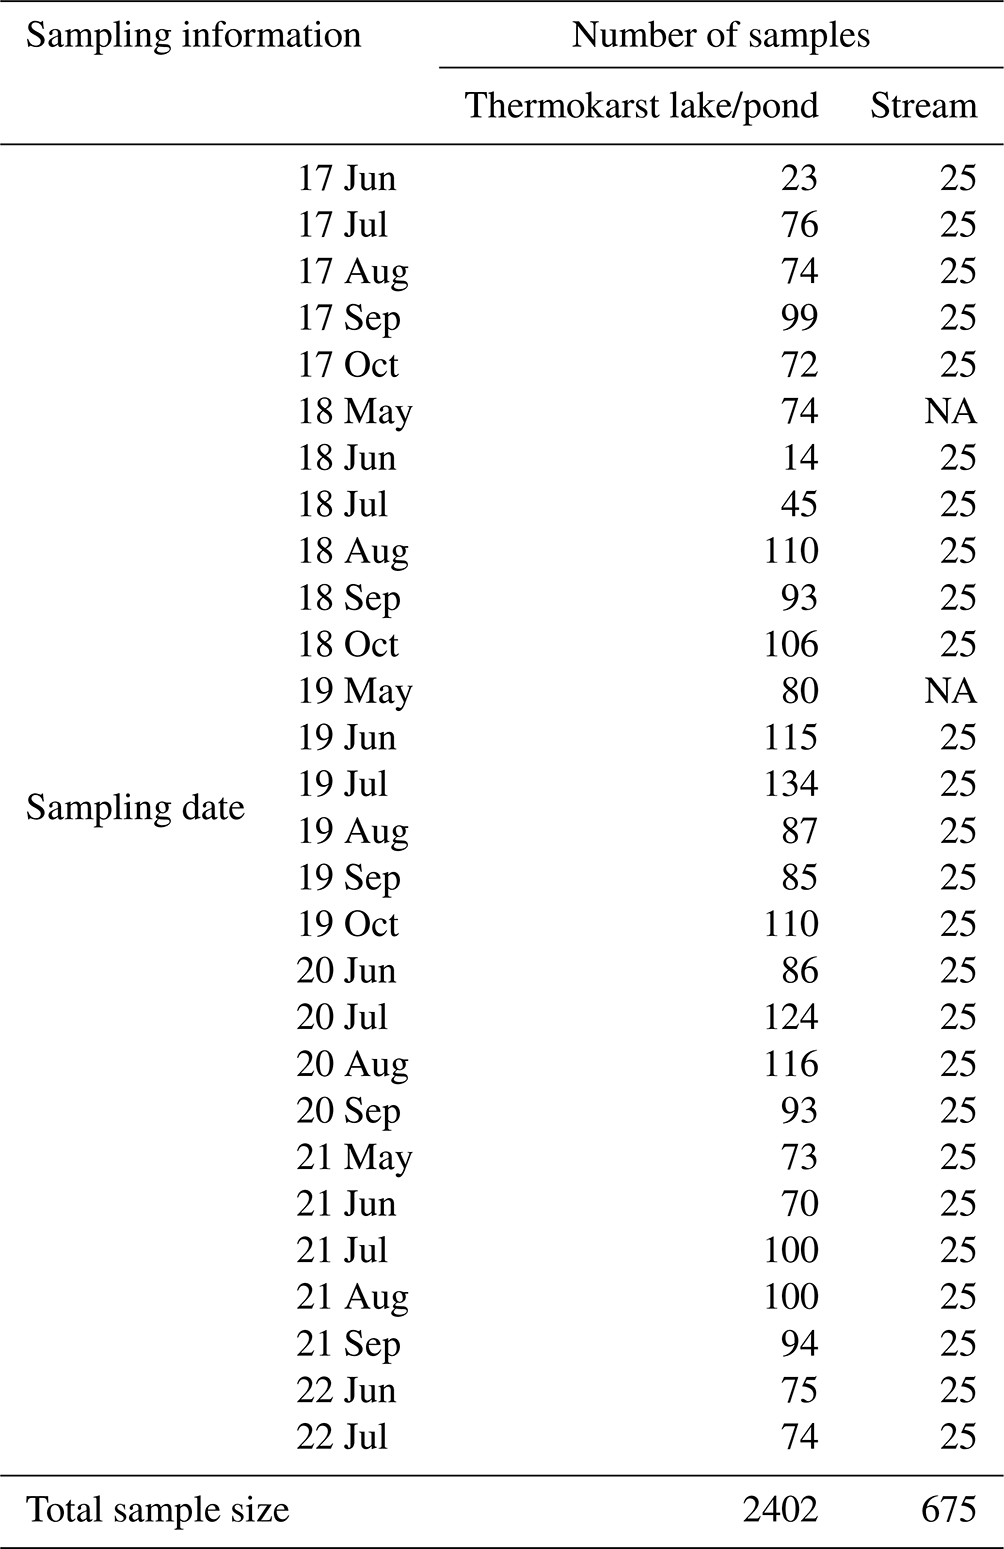
Samples of thermokarst lakes/ponds (Fig. 2) were collected by hand using a self-made water sample collector at monthly intervals during ice-free seasons (between May and October) from 2017 to 2022 in the BLH (Fig. 1). During the observation periods, the occurrence numbers of thermokarst lakes dynamically changed among different sampling years (Table 2) due to the interannual variations in the precipitation, active layer thickness, supra-permafrost water, and near-surface ground ice. Some of the sampled lakes disappeared in the next sampling year, and additional new lakes emerged. Accordingly, we obtained sufficient lake water samples to constrain the seasonal changes in the lake water hydrology and try to clarify the influence of permafrost and climate on the water balance of thermokarst lakes in this region. Influenced by the COVID-19 pandemic and lockdown policies between August 2022 and December 2022 in China, only 2 months of sampling work (June and July) were conducted in 2022. Lake water samples were taken at the center of lakes from 20–40 cm below the water surface. The running water samples of stream water samples were collected at each fixed point 20–30 cm beneath the water surface. In addition, the supra-permafrost water and sub-permafrost water were randomly collected using an artificial water ladle at the location where the springs gushing out during each fieldwork. The water ladle was washed using the spring water before sampling.
In total, as many as 2402 thermokarst lake/pond samples, 675 stream water samples (Table 2), 102 supra-permafrost water samples, and 19 sub-permafrost water samples were collected during 6 years of continuous sampling work.
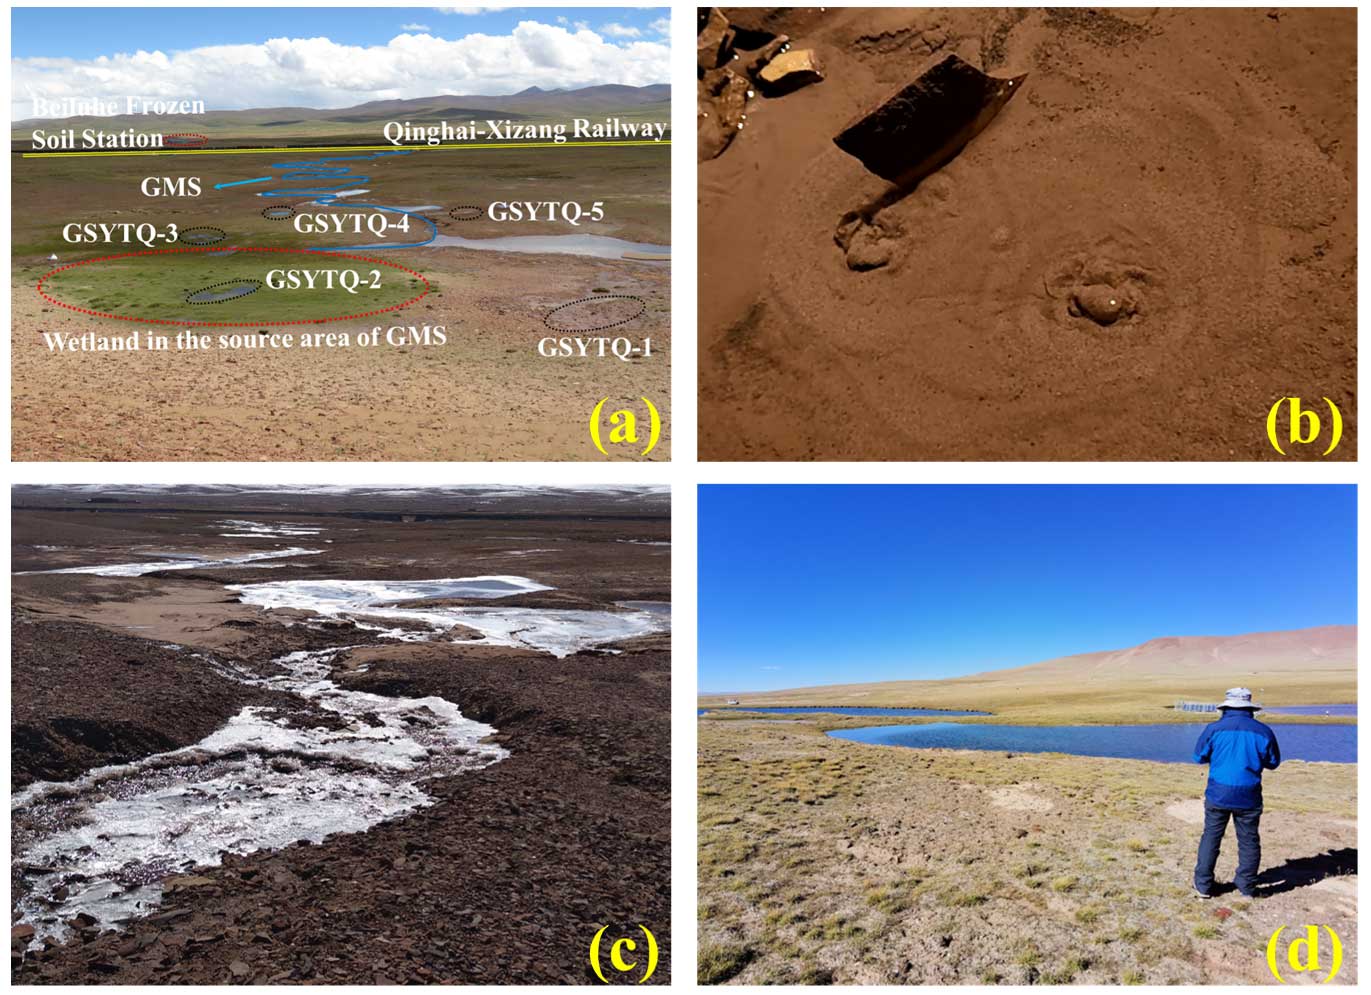
Figure 2(a) General conditions of Gushan Mountain stream (GMS) and the distribution of springs. (b) Typical features of one spring gushing out from sand sediment. (c) Overview of the GMS. (d) Sampling thermokarst lakes in the BLH.
Table 2Sampling descriptions of surface water in the BLH.
NA: not available
4.1.3 Ground ice sampling
To clarify the characteristics of ground ice and its role in the local hydrological cycles and regional eco-environment, we have designed 17 boreholes (∼20 m depth) in the BLH (Fig. 1). A total of 12 boreholes was drilled near the Qinghai–Tibet Highway (QTH) in 2014, and 5 boreholes were distributed in the center of BLH, which were drilled between 2011 and 2021. In addition, two thaw slumps were dug (Fig. 1). Frozen soil cores were extracted from different depths using a mechanical drilling rig with a drilling diameter of 157 mm (Fig. 3). All visible ground ice samples were collected immediately after the core barrel was pulled out. During the sampling work, disposable PE gloves were used, and the exterior of each sample was removed to avoid contamination from mud and the surplus water in the borehole. In total, 355 ground ice samples were collected from 17 boreholes, and 4 samples were obtained from 2 profiles (Fig. 3; Table 3).
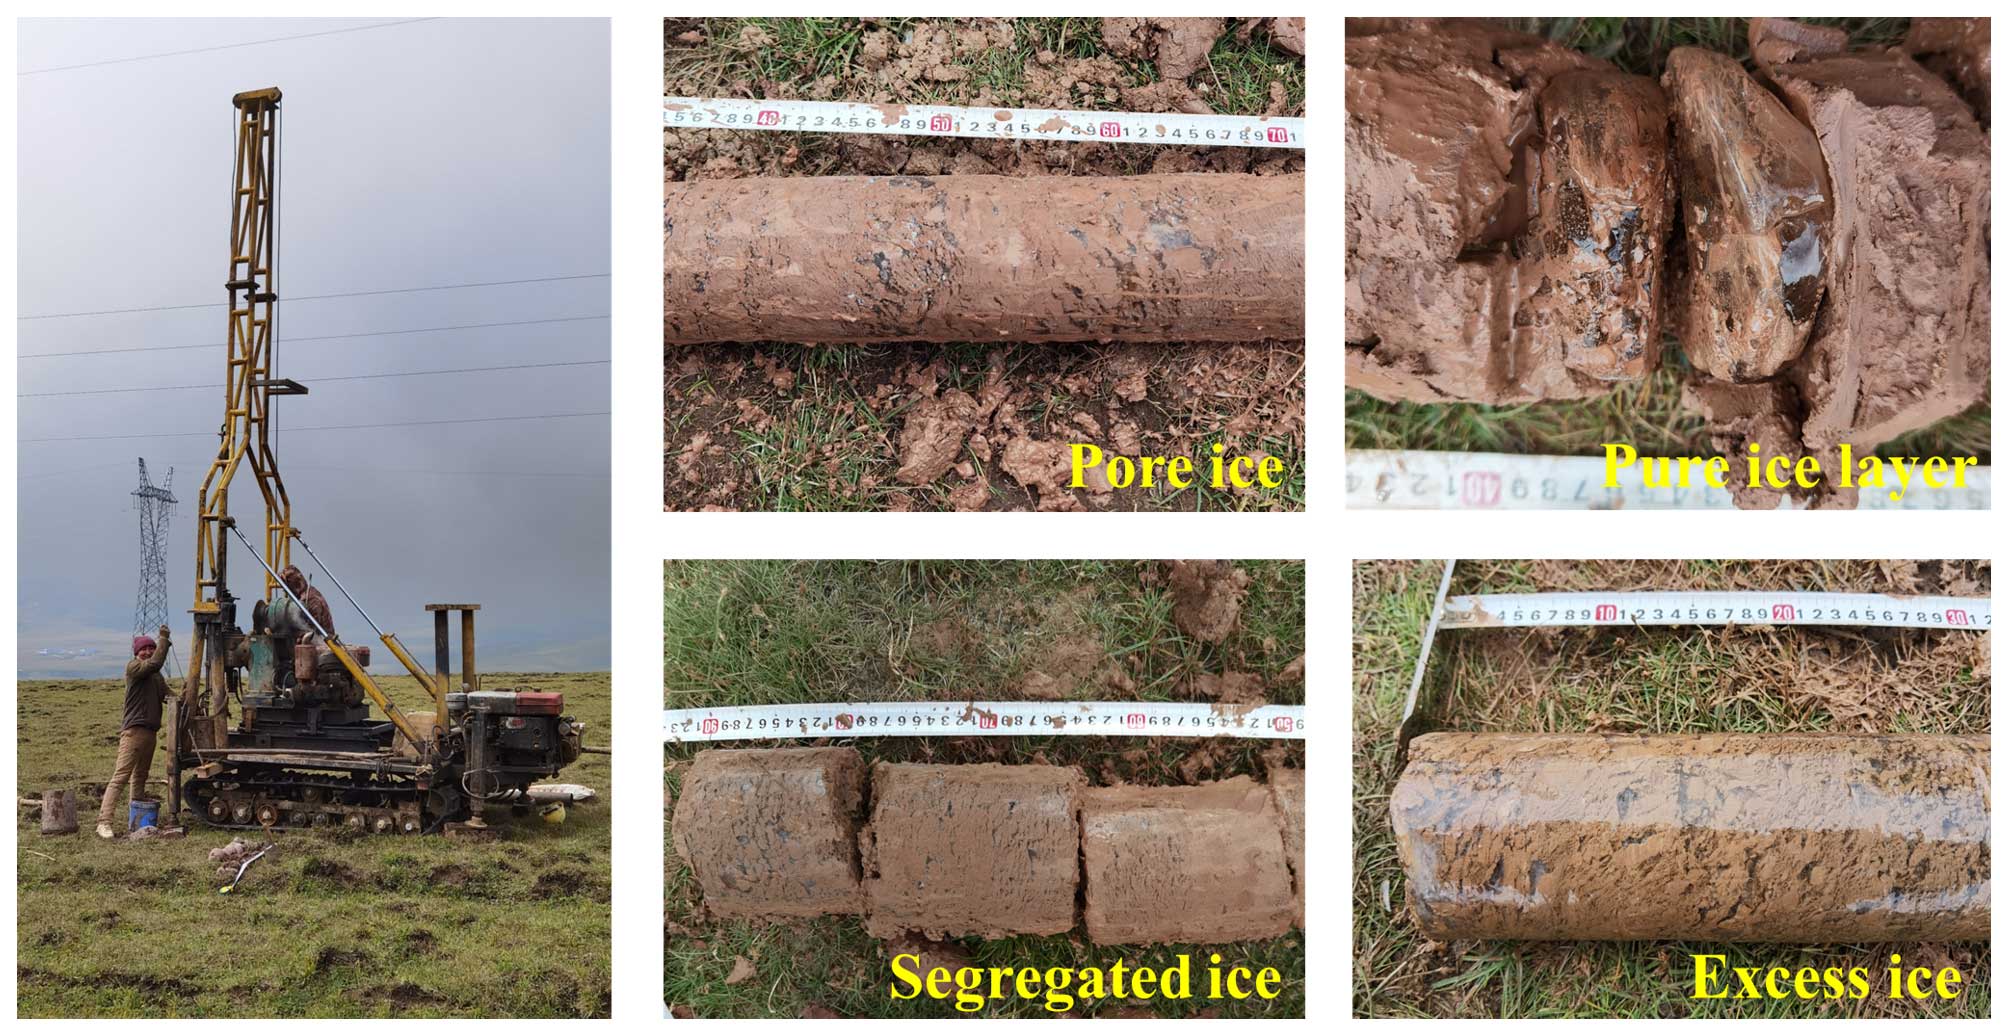
Figure 3Field permafrost drilling work and various types of ground ice obtained during drilling.
Table 3Borehole drilling and ground ice sampling information in the BLH.
4.1.4 Sample storage
Liquid water storage. All the samples were transferred to 100 mL high-density polyethylene (HDPE) bottles. The sample bottles were filled up without bubbles and sealed with Parafilm. The collection date of the sample types (precipitation, lake water, stream water, and groundwater) was added to the bottle label. For the precipitation samples, the precipitation types (rain, snow, and hail) were recorded. All of the samples were stored at 4 °C and shipped to the State Key Laboratory of Frozen Soil Engineering (SKLFSE) at the Northwest Institute of Eco-Environment and Resources, Chinese Academy of Sciences (CAS), China.
Ground ice storage. All the treated raw frozen soil samples were immediately preserved in HDPE bottles. The massive ice and pure ice layers were sealed in pre-cleaned plastic bags. The depths and drilling site information were recorded. All of the frozen soil and ground ice samples were kept frozen at −4 °C in the field to avoid the sublimation of the ice and the evaporation of the water in the soil.
4.2 Sample pretreatment and stable isotope analysis
Before analyzing, each liquid sample was pretreated to remove the impurities through 0.22 µm disposable membrane filters. The frozen soil samples and pure ground ice samples were allowed to completely melt at 4 °C in sealed plastic bags. The supernatant water from thawed soil and meltwater from ground ice were also filtered through a 0.22 µm membrane. The processed liquid water samples were filled in a 2 mL analytical vial and were stored in a cold room (4 °C) in the dark for the stable isotopes (δ18O and δD) analysis within 1 week.
The δ18O and δD ratios were measured at SKLFSE using an isotopic liquid water and water vapor analyzer (Picarro L2130-i, USA) based on the wavelength-scanned cavity ring-down spectroscopy technique. The guaranteed instrument precision was 0.025 ‰ for the δ18O value measurements and 0.1 ‰ for the δD value measurements. The isotopic values were reported using notation representing the per mille (‰) relative difference with respect to the IAEA Vienna Standard Mean Ocean Water (VSMOW) standard, following Eq. (1):
Rsa is the respective isotope ratio measurement for the samples, and Rst is the defined isotope ratio of a standard sample.
4.3 Quality control of data
4.3.1 Sampling errors
The precipitation samples were transferred to HDPE bottles immediately. If multiple rain/snow events occurred during 1 sampling day, the water sample from every single precipitation event was collected separately. At the end of 1 complete sampling day, all the samples collected from a single event were mixed. If the precipitation types changed during 1 sampling day, then different samples were collected separately. The final complete samples were kept cool at 4 °C. All we have done is to avoid the influence of evaporation on the enrichment of δD and 18O and ensure the originality of the samples.
During the sampling work of thermokarst lakes/ponds and streams, we do our best to control the sampling time at the same period during every month (controlling the sampling time within 1 week, i.e., between the 17th and 22th of every month) to make sure that all the samples can represent the average level of the whole month. The sampling HDPE bottles were precleaned three times using raw water. Lake water was taken at the center of lakes from 20–40 cm beneath the water surface. The running water samples of the stream were collected at each fixed point 20–30 cm beneath the water surface.
4.3.2 Analytical errors
Before we started to analyze the samples, we first prepared 14 distilled water samples with the same stable isotopes to test the stability of our analyzer. The precision of the δ18O and δD values was calculated by calculating the 1σ standard deviation of groups of 12 injections and then calculating the average of these standard deviations. In order to ensure the data quality, the “high-precision” mode was employed during analysis. Under this mode, the analyzing time for each injection is about 8.75 min. The drift of the analyzer was determined by taking the mean of these same 12 groups of measurements and calculating the difference between the maximum and minimum means. All of these measured precision and drift values were smaller than those of the guaranteed precision (0.025 ‰ and 0.1 ‰ for δ18O and δD, respectively) and drift values (0.2 ‰ and 0.8 ‰ for δ18O and δD, respectively), indicating that the analyzer achieves both a good repeatability and a good reproducibility. If the measured precision and drift values did not pass the guaranteed values, then a comprehensive inspection of the analyzer was conducted, i.e., the instrument analyzing system, the vaporizer module, and the quality of the dry nitrogen. After completing all processes of checking, we repeated the analysis of 14 distilled/tap water samples and calculated the drift values until they passed the guaranteed values. The results were normalized to the Vienna Standard Mean Ocean Water–Standard Light Antarctic Precipitation (VSMOW–SLAP) scale by analyzing the internal standards before and after each set of 10 samples. Five laboratory standards (provided by LICA United Technology Limited, Beijing, China) with given isotopic values were inserted before 10 samples, which were used for instrument calibration with δ18O values of −21.28 ‰, −16.71 ‰, −11.04 ‰, −7.81 ‰, and −2.99 ‰ and δD values of −165.7 ‰, −123.8 ‰, −79.6 ‰, −49.2 ‰, and −9.9 ‰. The best-fit linear relationship between the five known calibration values and the analyzer's reported values was determined. The slope and intercept of the best-fit line through these points are used to calibrate the results of our samples.
To avoid memory effects, the first three results of the measurements were discarded, and arithmetic mean values were calculated from the last three injections. During the analyzing process, the real-time data of the water concentration of all injections were controlled within a range between 19 000 and 20 000 ppm and with a standard deviation smaller than 200 ppm. Once the water concentration values appeared to decrease, the work was stopped, and the syringe was detached for washing with deionized water. All measurements were post-processed with the Picarro ChemCorrect™ software to monitor the organic contamination and correct the data.
5.1 Variations in the stable isotopes of different water components
5.1.1 Precipitation
The stable isotopes of precipitation exhibit a remarkable seasonal variability during 6 years of observations (Fig. 4). The δ18O and δD of the local precipitation in the BLH ranged from −30.4 ‰ to 6.2 ‰ and from −238.0 ‰ to 65.4 ‰, respectively. The d-excess ranged between −37.5 ‰ and 44.5 ‰. The amounts of the weighted-average values of annual precipitation are −10.9 ‰, −72.1 ‰, and 15.4 ‰ for δ18O, δD, and d-excess, respectively. As shown, the δ18O and δD display distinct seasonal patterns with high values in summer and low values in winter (Figs. 2, S2); this is due to the changes in moisture sources and the influence of local climate conditions (Guo et al., 2022; Tian et al., 2005; Guan et al., 2013; Bershaw et al., 2012).
5.1.2 Surface waterbodies
For comparison, the δ18O and δD of thermokarst lakes/ponds are more positive than those of precipitation due to strong evaporation and the resultant enrichments of heavier isotopes in lake water (Yang et al., 2016; Narancic et al., 2017; Ala-aho et al., 2018). δ18O ranged from −14.4 ‰ to 5.7 ‰ (mean: −6.0 ‰), δD is between −104.1 ‰ and 22.6 ‰ (mean: −48.0 ‰), and the d-excess ranged from −35.8 ‰ to 21.8 ‰ (mean: −0.1 ‰), respectively. Similarly, the isotopic patterns of thermokarst lakes/ponds exhibited strong seasonal variations (Figs. 4, S3), which are due to the changes in source waters (i.e., precipitation, meltwater of thawing permafrost/ground ice, and groundwater) and alternations of evaporation degrees due to air temperature fluctuations (Narancic et al., 2017; Yang et al., 2021; Aichner et al., 2022; Zhu et al., 2022). Generally, the heavy isotope contents of lakes/ponds are lower in August and September (Figs. 4, S3) and are is attributed to the recharges of monsoonal precipitation and water with more negative isotopes fed by melting ground ice (Gibson et al., 2015; Yang et al., 2021). In comparison, the majority of the isotope values of lakes/ponds are positive in May, June, July, and October (Figs. 4, S3) due to evaporation and recharge of isotope-enriched precipitation water.
For the streams, the isotope values varied from −13.7 ‰ to −7.2 ‰ (δ18O; mean: −11.1 ‰) and from −83.8 ‰ to −53.3 ‰ (δD; mean: −73.6 ‰), and the d-excess ranged from −0.6 ‰ to 25.6 ‰ (mean: 15.0 ‰), respectively. The mean values are equivalent to the average values of annual precipitation in the BLH. Compared with thermokarst lakes/ponds, the δ18O values of stream water exhibited relatively stable patterns (Fig. 4) due to the short residence time (Yang et al., 2021; S. Wang et al., 2023; Song et al., 2017), which indicates weak evaporation. However, the stream isotopes also represented seasonal variations during the 6 years of observation (Figs. 4, S4) as lower values prevailed in August and September. The temporal changes in the stream isotopes are mainly influenced by the seasonal variability in the evaporation (Yang et al., 2017) and differences in the source water, i.e., alternative replenishment of precipitation, melting ground ice, and groundwater (Streletskiy et al., 2015; Yang et al., 2019; Ala-aho et al., 2018).
The two kinds of supra-permafrost water (i.e., GSHQ and GSYTQ) exhibited a similar seasonal trend (Fig. 4). For comparison, the GSHQ displayed relatively more positive isotopic peaks during whole sampling periods (Fig. 4), with δ18O ranging from −13.3 ‰ to −5.8 ‰ (mean: −11.2 ‰), the δD ranging between −86.7 ‰ and −39.0 ‰ (mean: −74.2 ‰), and the d-excess varying from 6.5 to 22.4 ‰ (mean: 15.1 ‰), respectively. The isotopes of GSYTQ varied from −13.5 ‰ to −8.4 ‰ (mean: −11.4 ‰), the δD ranged between −83.2 ‰ and −50.6 ‰ (mean: −73.8 ‰), and the d-excess varied from 4.6 to 25.1 ‰ (mean: 16.9 ‰). The isotopic peaks of the two types of springs lagged behind those of precipitation (Fig. 4), indicating the replenishment of precipitation via infiltration. In contrast, the stable isotopes of sub-permafrost water are more negative than those of supra-permafrost water which range between −12.7 ‰ and −11.1 ‰ (mean: −11.8 ‰) for δ18O, from −83.7 ‰ to −77.7 ‰ (mean: −80.7 ‰) for δD, and from 10.9 ‰ to 17.7 ‰ for d-excess (mean: 13.5 ‰). In addition, they stayed nearly stable over a long time series (Fig. 4), suggesting unchanged sources of isotopically light water (monsoonal precipitation, meltwater from thawing permafrost, etc.) and an insignificant influence by precipitation.
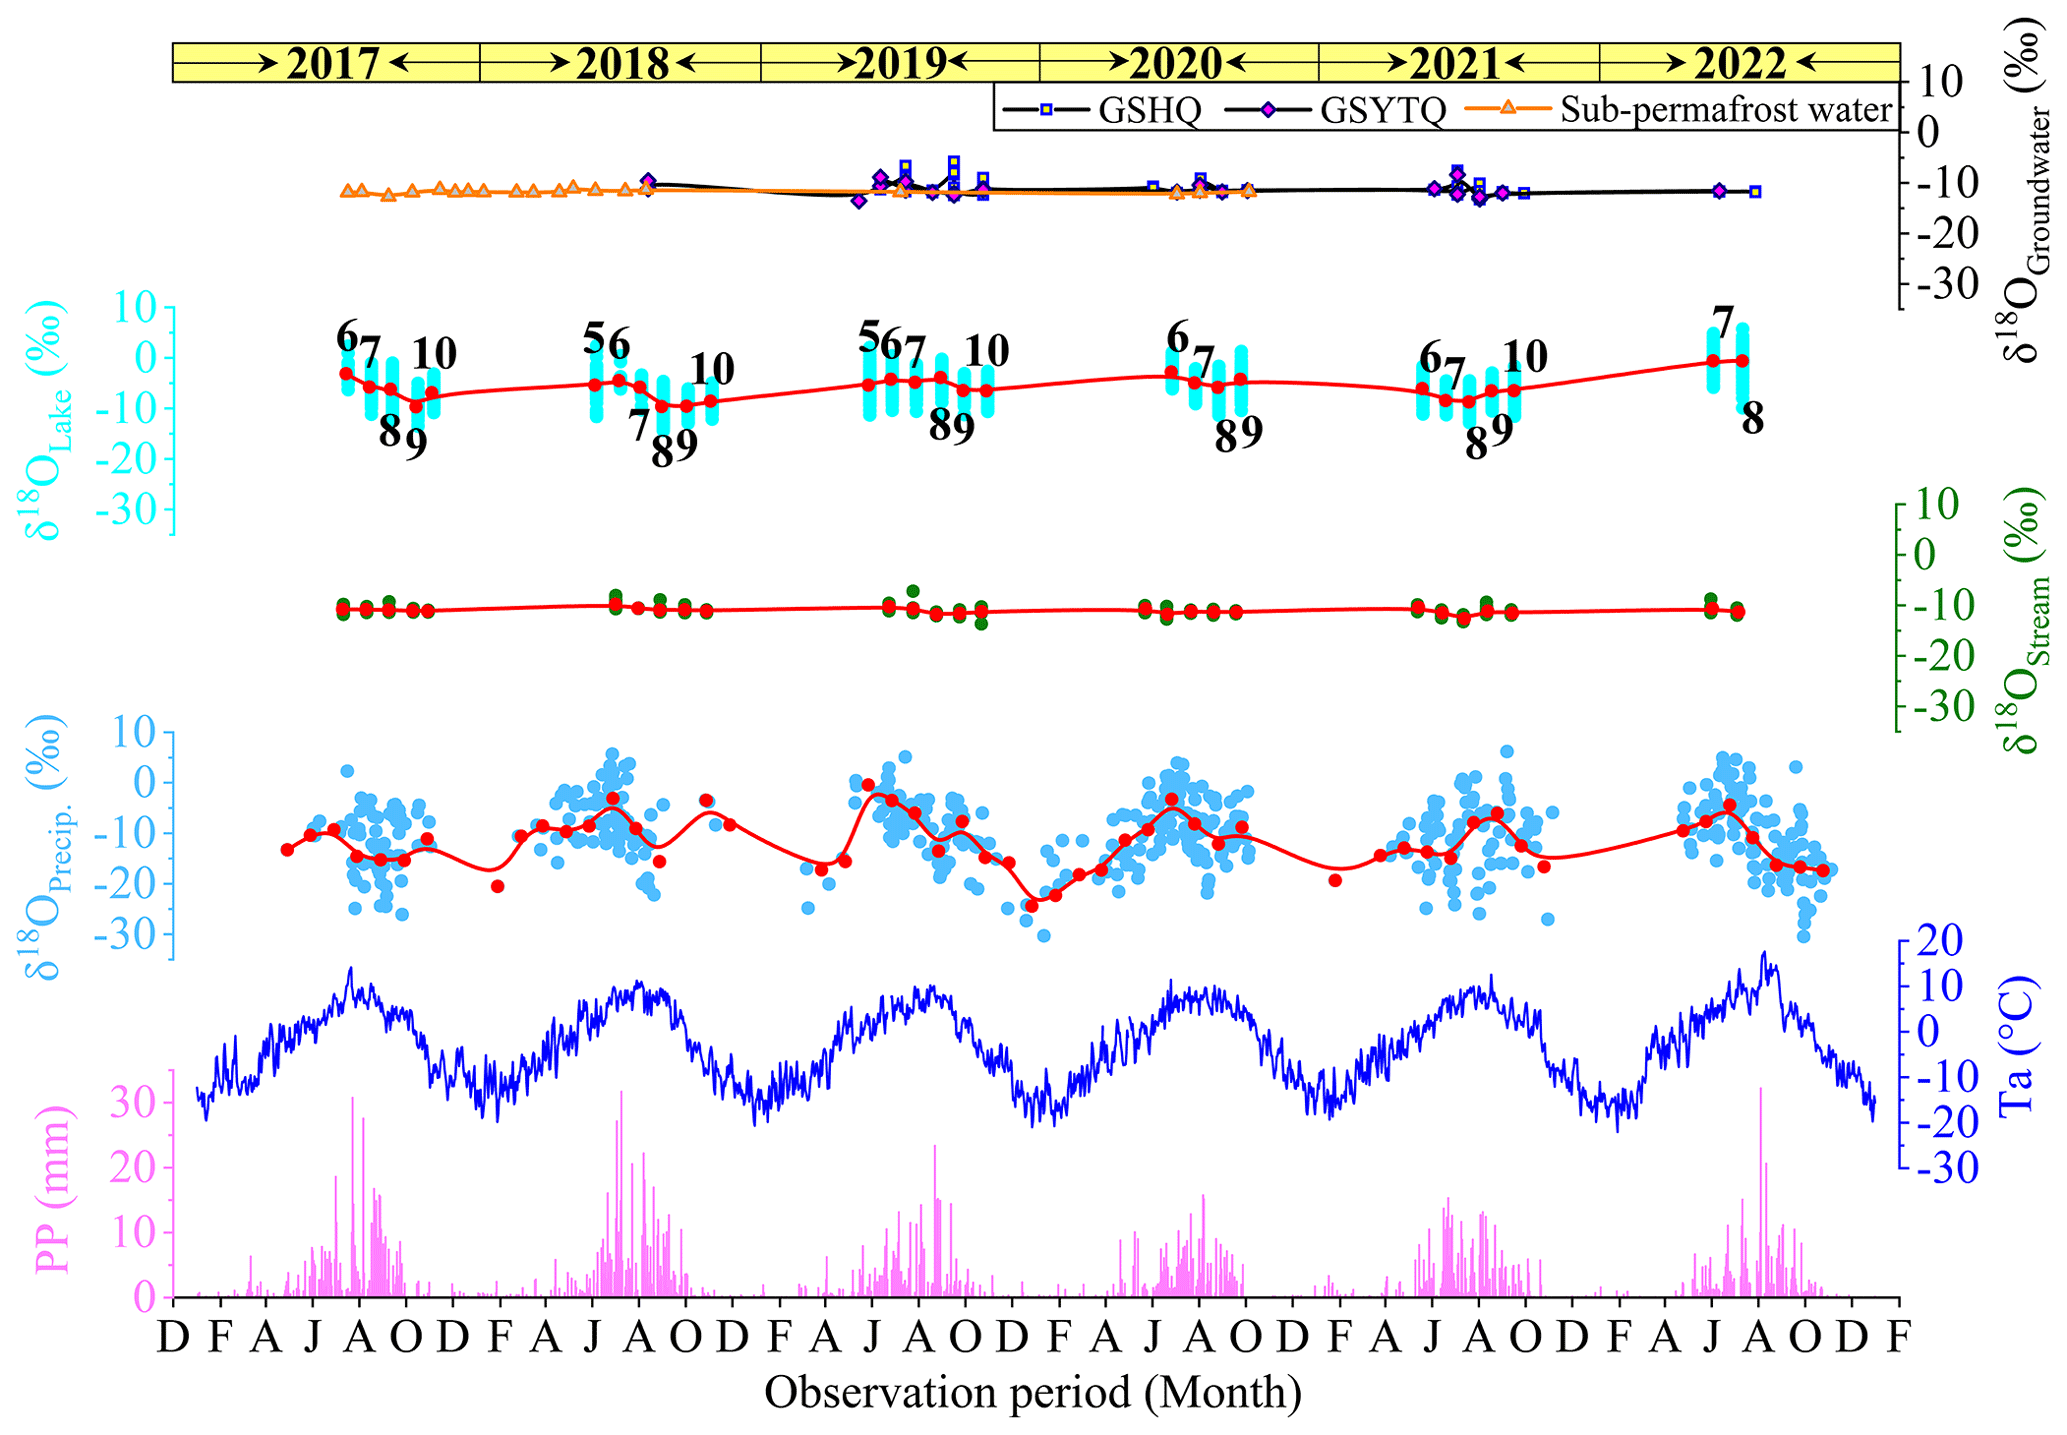
Figure 4Temporal variations in the δ18O of different water components in the BLH. The numbers denote the observation months of thermokarst lakes/ponds. The dots with different colors represent event values, while the dotted red line denotes the monthly average values. GSHQ and GSYTQ denote the springs along both sides of the observation stream and spring in the source area of this stream, respectively.
5.1.3 Ground ice
The distributions of stable isotope dots of all cores are scattered along various depths (Fig. 5). Generally, the δ18O ranges from −15.0 ‰ to −8.3 ‰ (mean: −12.2 ‰), from −113.7 ‰ to −66.4 ‰ (mean: −94.4 ‰) for δD, and between −13.4 ‰ and 15.5 ‰ (mean: 3.1 ‰) for d-excess, respectively. Comparing with the precipitation, the majority of the δ18O values of ground ice is lower than the precipitation, indicating multiple sources of initial water during ice formation under variable climatic conditions and complex geological contexts on the QTP (Michel, 2011; Yang et al., 2017, 2023; Murton, 2013).
Specifically, the stable isotopes of ground ice varied between different boreholes (Fig. 5; Table 4). This is attributed to the influences of the initial source water and the complex ice formation mechanism. In addition, the isotopic patterns along various depths showed marked differences between boreholes (Fig. 5), suggesting influence of lithology on the water migration and freezing fractionation of stable isotopes (Yang et al., 2020; Lacelle et al., 2014; Fisher et al., 2021). Remarkably, the thaw slump ice was isotopically lighter than that of drilling ground ice (Fig. 5; Table 4); this is due to the considerable differences in the initial source water and freezing processes. The thaw slump ice is considered replenished by winter snowmelt via cracks and quick freezing (Fritz et al., 2011; Porter and Opel, 2020). However, the pore ice with lower isotopic values in these boreholes suffered isotope fractionation due to freeze–thaw conditions under climate transitions (Wetterich et al., 2014; Yang et al., 2023).
Table 4General stable isotope composition of ground ice in the Beiluhe Basin.
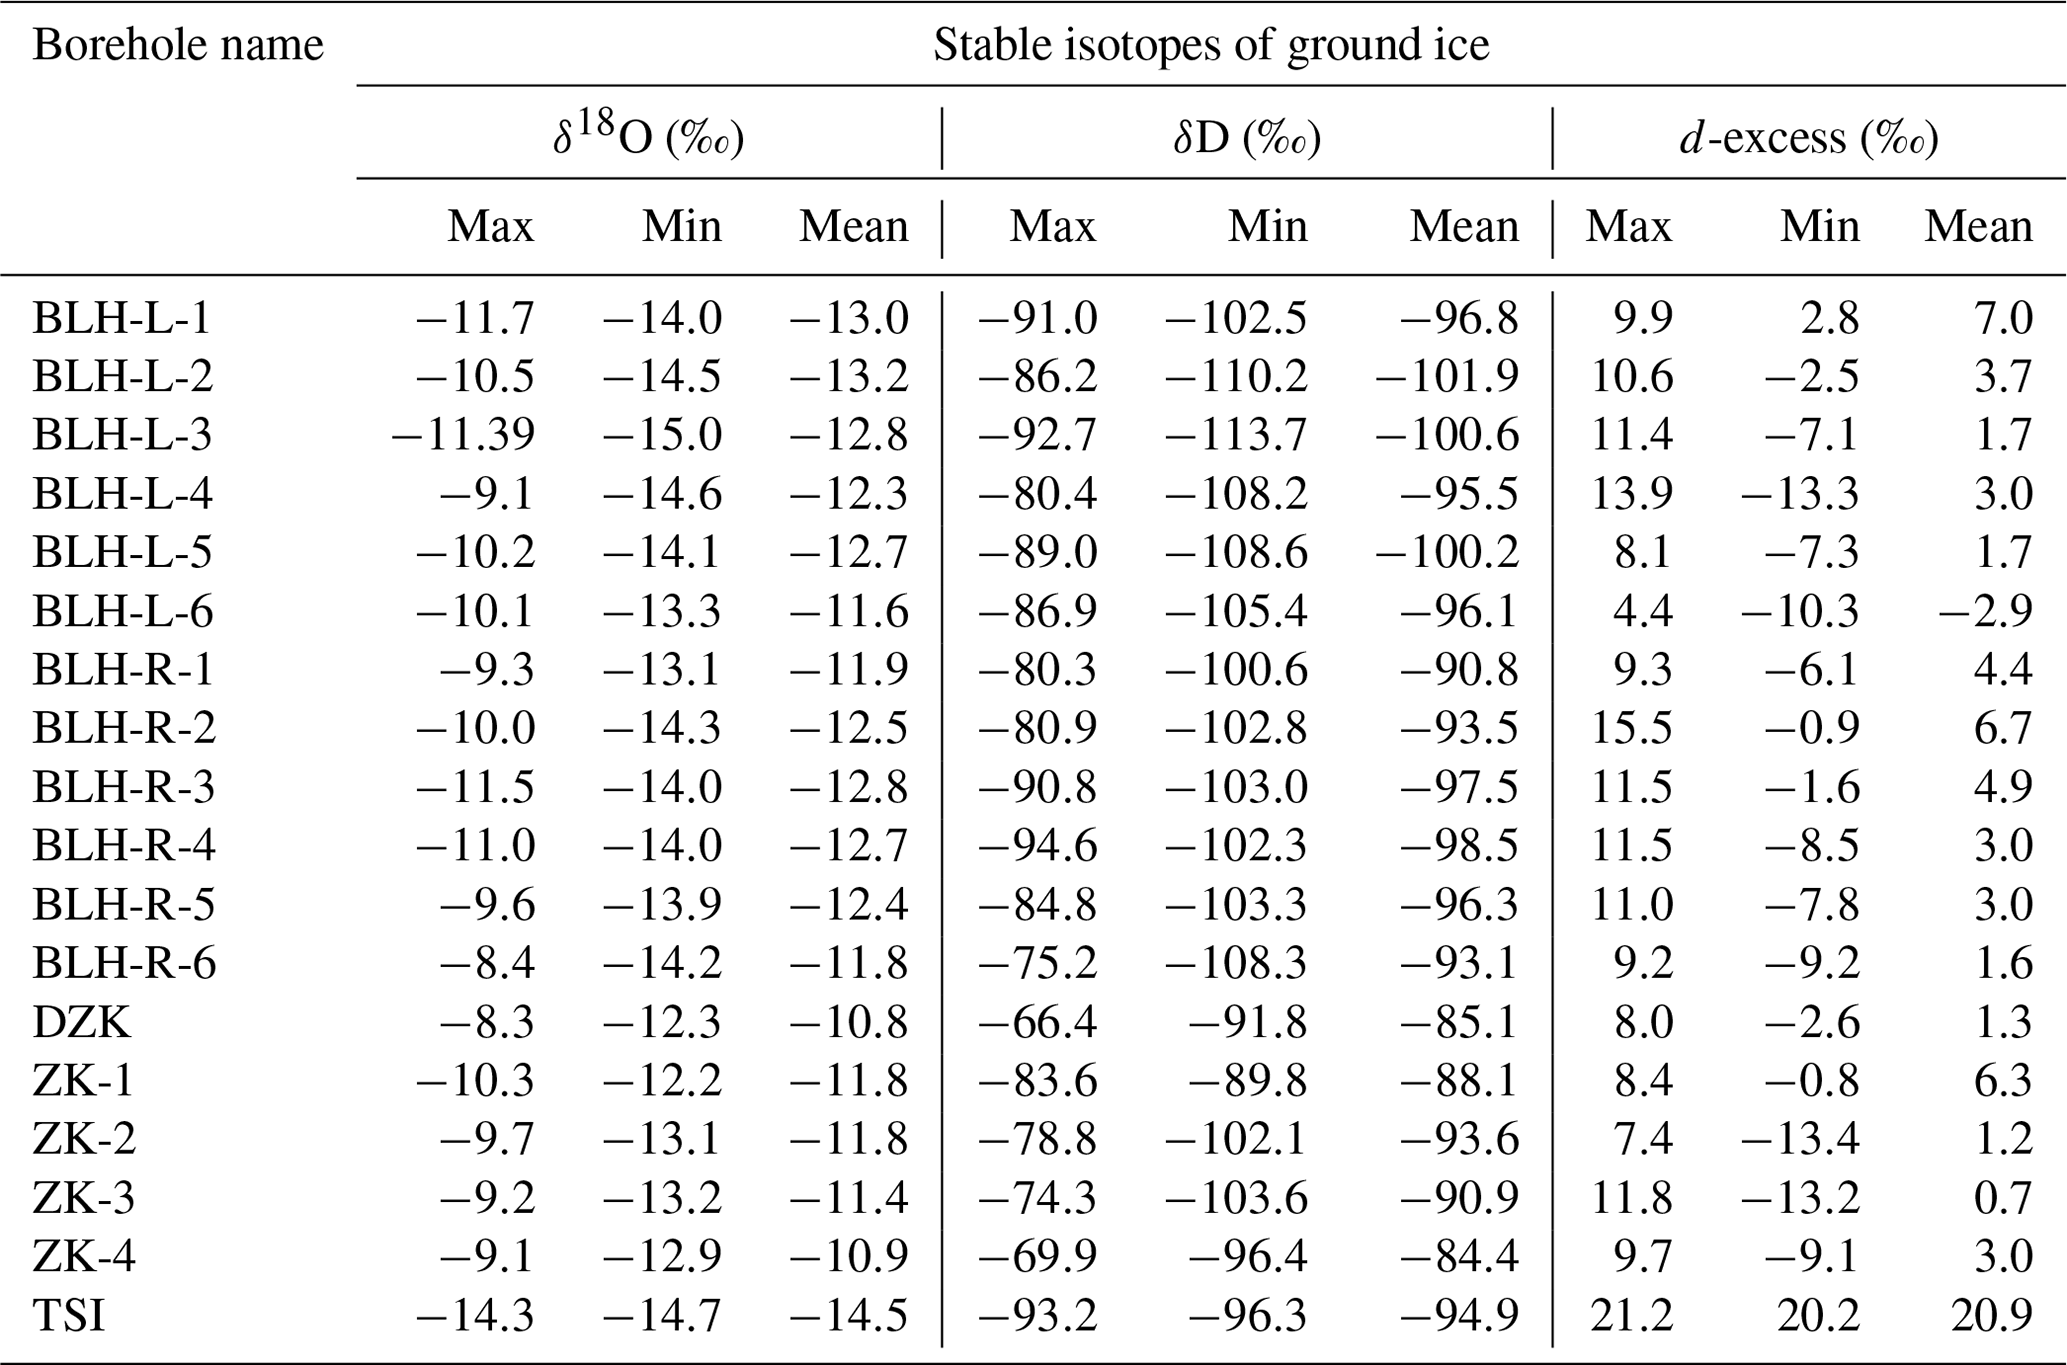
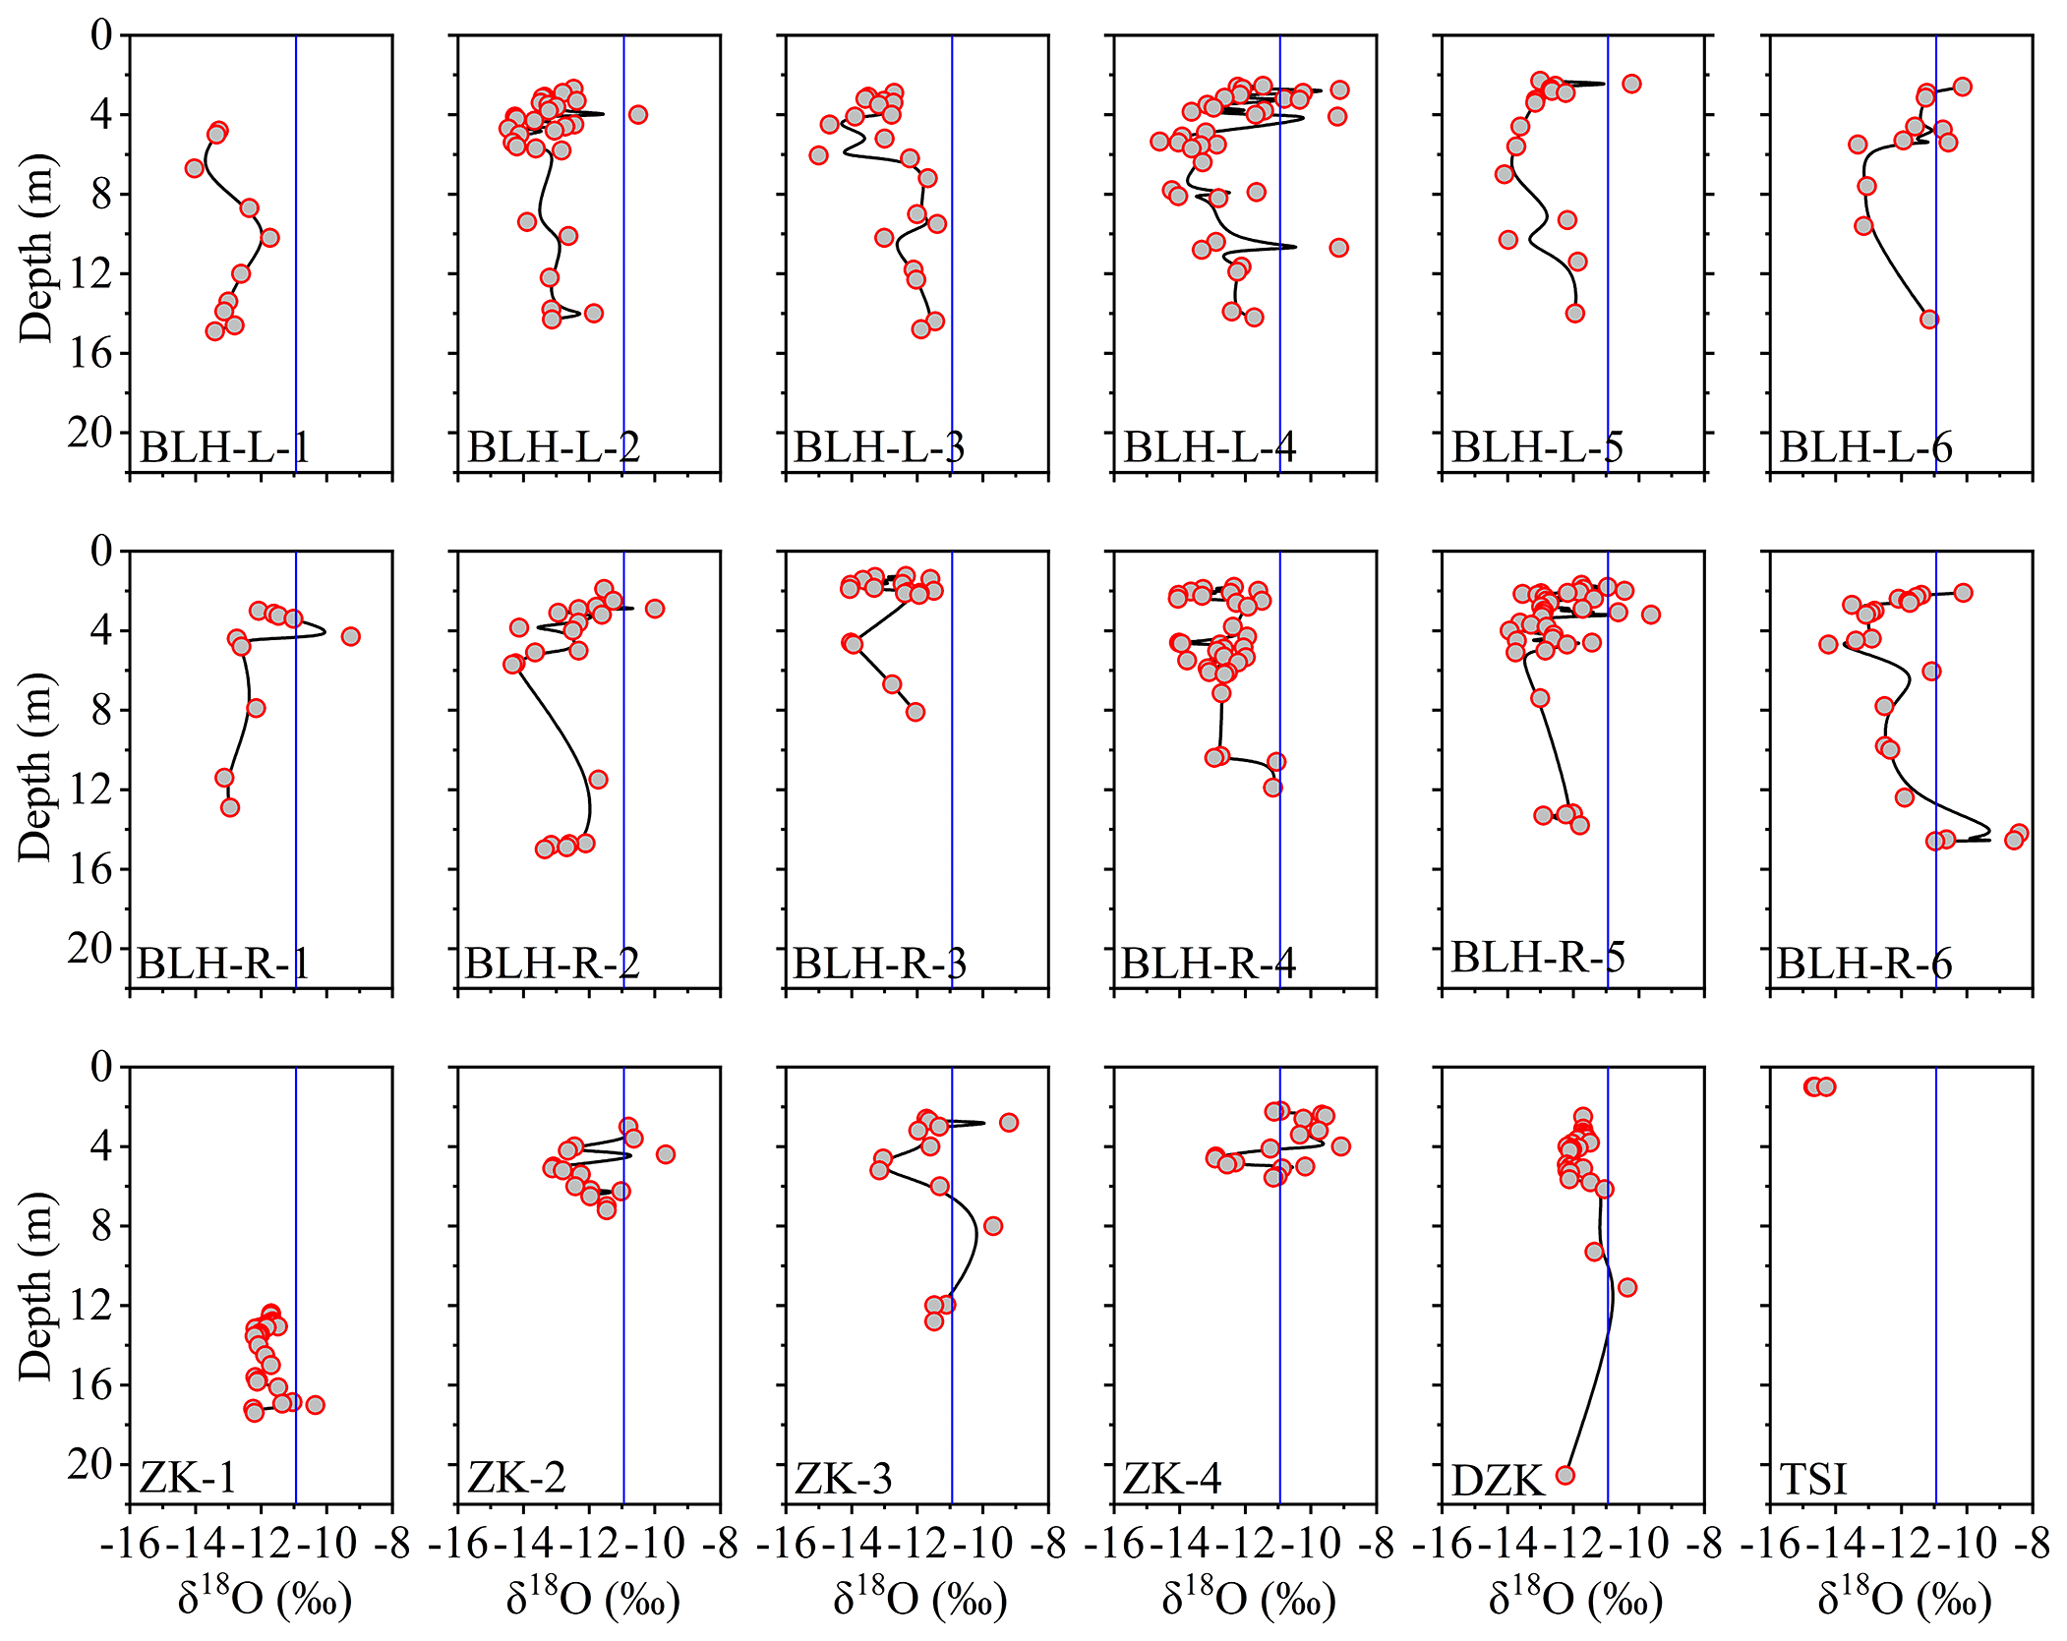
Figure 5Variations in the stable isotopes of ground ice along depths in the BLH. The blue line denotes the amounts of the weighted-average δ18O value of precipitation in the BLH.
5.2 δ18O-δD relations and hydrological connections
5.2.1 δ18O–δD relationships of different water components
The local meteoric water line (LMWL), determined by three different methods, i.e., ordinary least squares regression using the daily isotopic data, the arithmetic mean isotopic values, and the amounts of weighted multi-monthly mean isotopic values during 6 years (2017–2022). They are expressed as LMWLevent, with δD = 7.97δ18O + 15.26 (r2=0.96); LMWLmonthly, with δD = 8.06δ18O +12.58 (r2=0.93); and LMWLPWA, with δD = 7.78δ18O +8.78 (r2=0.92). The slope is nearly identical to that of the global meteoric water line (GMWL; Craig, 1961). However, the intercepts are quite different (Fig. 6) due to the influences of precipitation amounts and the exceptional meteorological conditions (Barešić et al., 2006; Hughes and Crawford, 2012; Kern et al., 2016).
The δ18O–δD diagrams of lakes, streams, and groundwater were built using the monthly stable isotopic values and defined as the local evaporation line (LEL). The LELs observed during 6 years are calculated as δD =5.88δ18O −12.80 (r2=0.95), δD = 4.89δ18O −19.41 (r2=0.83), δD = 5.69δ18O −10.50 (r2=0.85) (supra-permafrost water), and δD = 3.54δ18O −39.06 (r2=0.92) (sub-permafrost water), respectively. The slopes of the three LELs are all lower than those of the LMWL (Fig. 6) and range between 4 and 6, indicating strong evaporation (Cui et al., 2017; Yang et al., 2019) due to the lower relative humidity (Clark and Fritz, 1997). Interestingly, the correlation coefficients of streams and supra-permafrost water are much lower (smaller than 0.9), and the slopes are smaller than those of precipitation and lakes/ponds (Fig. 6), which may be affected by the transitions of source water during warm seasons and the evaporative concentration of isotopes.
The δ18O–δD relationship for ground ice was established using the stable isotopic values of the ice samples, and the correlation is defined as the freezing line (FL; Souchez et al., 2000). In this study, the freezing line of the ground ice at 16 borehole sites was calculated as δD =5.36δ18O −29.15 (r2=0.73), which is significantly different from the LMWL (Fig. 6). The difference reflects the freezing characteristics of liquid water under different conditions (Lacelle, 2011). Our freezing slope between 6.2 and 7.3 was usually obtained during equilibrium freezing, Rayleigh-type fractionation (Lacelle, 2011). The lower correlation coefficient (Fig. 6) suggests variable freezing rates (Souchez et al., 2000), kinetic isotopic fractionation during ice formation (Souchez et al., 2000), and the influence of the initial source water of the ground ice at different sites (Lacelle, 2011; Yang et al., 2017).
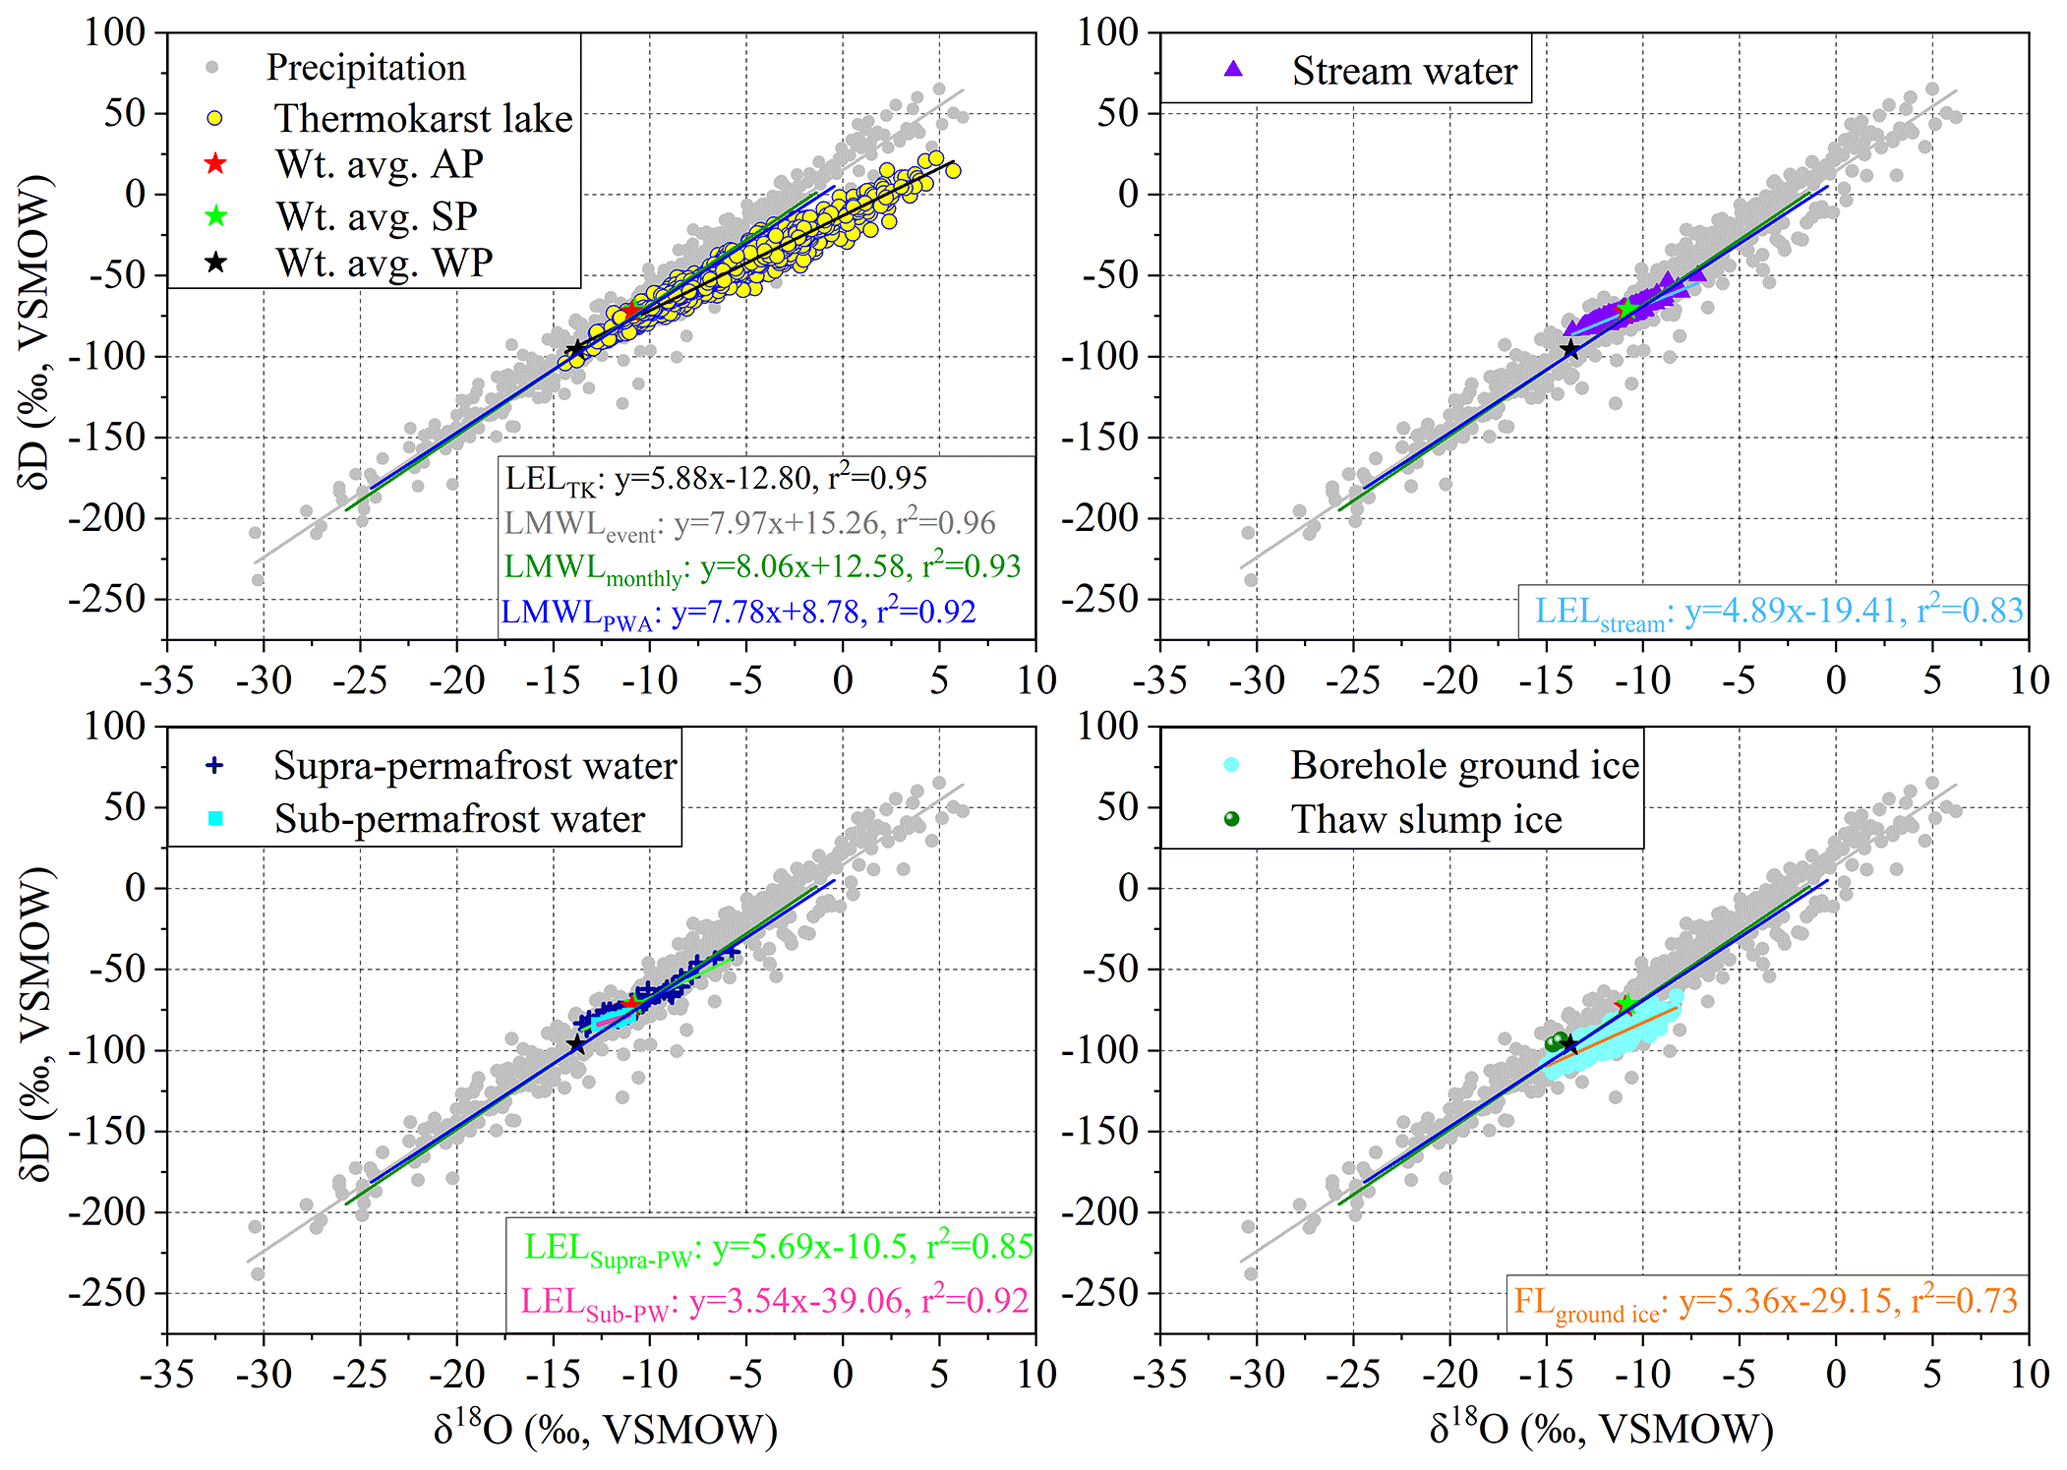
Figure 6The relation between δD and δ18O for different water components in the BLH. The terms Wt. avg. SP, Wt. avg. WP, Wt. avg. AP, LEL, and FL denote the weighted-average value of summer precipitation, weighted-average value of winter precipitation, weighted-average value of annual precipitation, local evaporation line of surface water components, and freezing line of ground ice, respectively.
5.2.2 Hydrological connections between various water components
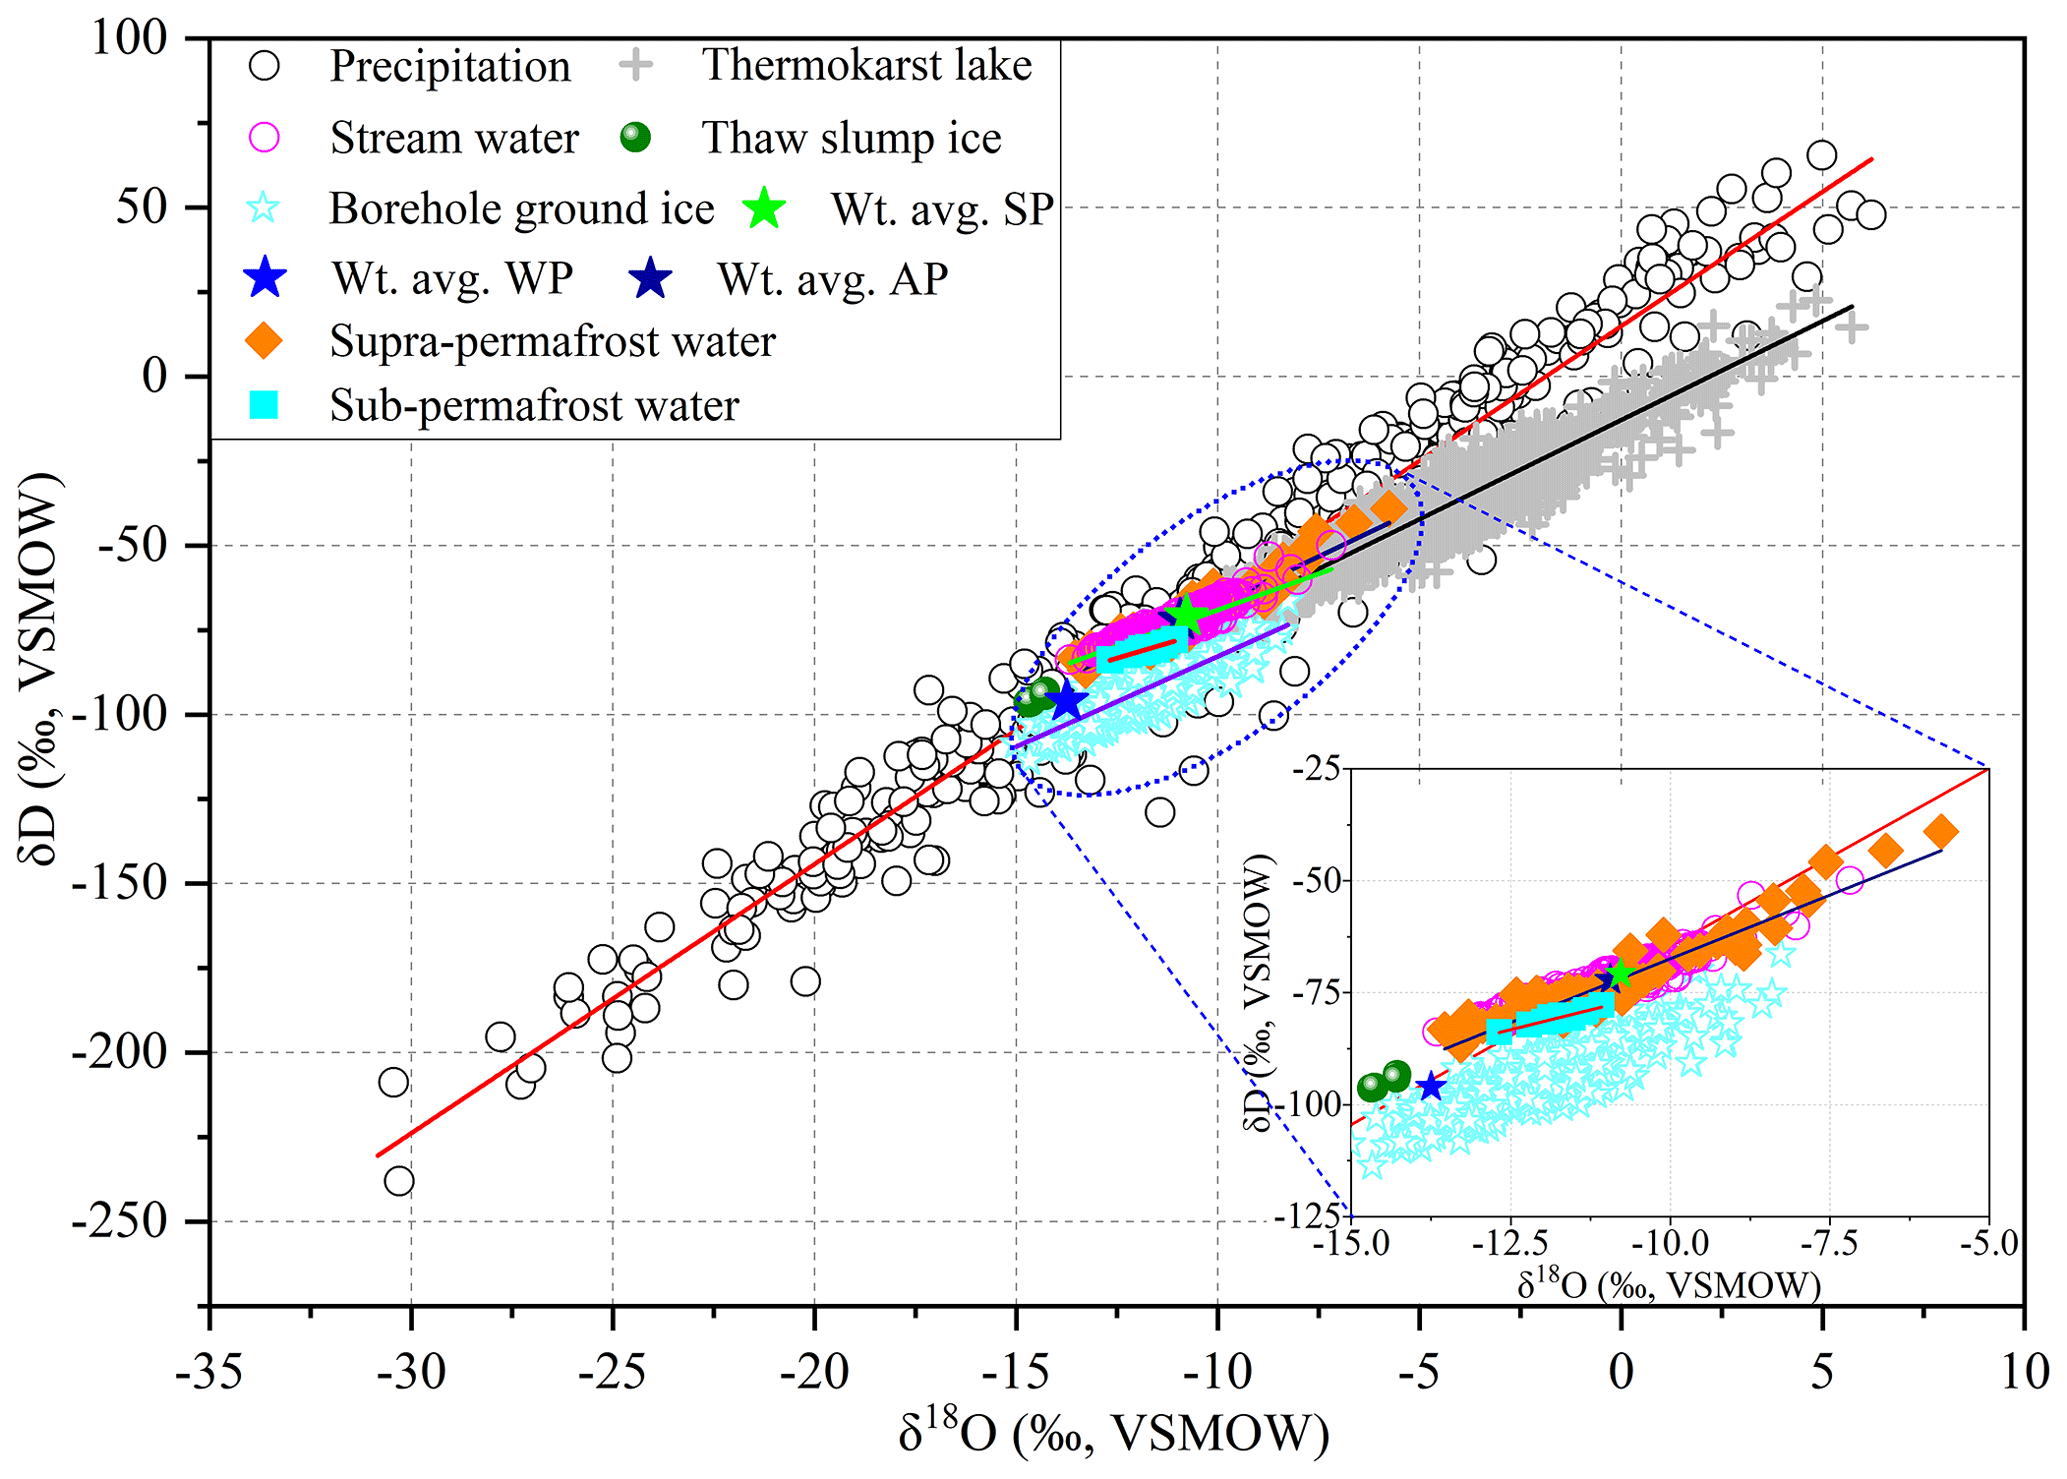
Majority of the stable isotopes of the stream lie on the LMWL (Fig. 6) and embrace in the range of supra-permafrost water (Fig. 7). In addition, the mean value is close to the amounts of the weighted-average value of annual/summer precipitation, indicating the direct recharge of precipitation and supra-permafrost waters. However, some of the isotopic points do not lie on the LMWL, exhibiting a clear evaporative effect. The supra-permafrost water and sub-permafrost water display concentrated isotopic patterns compared with precipitation, reflecting relatively stable recharge sources. In addition, the scattered isotopic dots of supra-permafrost water rather than sub-permafrost water indicated changeable sources and climate conditions. For comparison, some of the isotope points of the supra-permafrost water are overlapping with those of precipitation and stream water, suggesting an important replenishment of precipitation and streams. However, the isotopic cluster of sub-permafrost water deviated significantly from the LMWL, and all the isotope values are lower than the annual average value of modern precipitation, suggesting the recharge signal of past water with negative δ18O (δD) values under cold climate conditions. The LEL of thermokarst lakes/ponds significantly deviated from LMWL (Figs. 6, 7), and some of the isotopic dots overlapped with precipitation, groundwater, and ground ice, indicating the hydrological connections between them (Yang et al., 2016, 2017).
The cluster of ground ice is partly overlapped with precipitation, groundwater, lakes, and streams (Fig. 7). It is indicative of the mutual replenishment relations between them. Some of the isotope dots are more positive than the summer precipitation, implying the recharge from the evaporative active layer water. A clear freezing slope is shown, indicating typical freezing of liquid water (Jouzel and Souchez, 1982; Souchez and Jouzel, 1984; Lacelle, 2011; Perşoiu and Pazdur, 2011). However, the d-excess values of ground ice are lower than those of river water and the amount of the weighted-average value of annual/summer precipitation (Fig. 7), suggesting the important recharge of the active layer of water (subjected to evaporation) by the near-surface ground ice (Yang et al., 2013; Throckmorton et al., 2016). In addition, the thaw slump ice exhibited more negative isotopes which are even lower than the amount of the weighted average, indicating the main recharge of the snowmelt water (Yang et al., 2020; Opel et al., 2018).
The dataset provided in this paper can be obtained at https://doi.org/10.5281/zenodo.10684110 (Yang, 2024).
From 2017 to 2022, we constructed the first stable isotope monitoring network in a typical permafrost-dominated watershed (namely the Beiluhe Basin, BLH) on the central Qinghai–Tibet Plateau (QTP). In total, we obtained 554 precipitation samples, 2402 lake/pond samples, 675 stream water samples, 102 supra-permafrost water samples, and 19 sub-permafrost water samples. Importantly, 359 ground ice samples at different depths from 17 boreholes and 2 profiles were collected, making these samples the first detailed isotopic data of permafrost ice on the QTP. The following conclusions are drawn.
-
The stable isotopes of precipitation display distinct seasonal patterns with high δ18O (δD) values in summer and low δ18O (δD) values in winter. The slope of the LMWL is reflected in the global mean. However, the intercepts are quite different due to the influences of precipitation amounts and the exceptional meteorological conditions.
-
The thermokarst lakes/ponds and streams exhibit remarkable seasonal patterns in stable isotopes, which is due to the transition of source waters and evaporation differences. The lower isotopic values in August and September are attributed to the recharge of monsoonal precipitation and melting ground ice. Evaporation enrichment and recharge of precipitation with heavier isotopes greatly influenced the isotopic patterns in May, June, July, and October. The slopes of the three LELs are all lower than those of LMWL, indicating strong evaporation due to lower relative humidity. The supra-permafrost water was recharged by precipitation via infiltration. In contrast, the sub-permafrost water was replenished by unchanged sources of isotopically lighter water during cold periods.
-
The stable isotopes of ground ice varied between different boreholes. This is attributed to the influences of initial source water and the complex ice formation mechanism. The near-surface ground ice was closely related to the recent precipitation and active layer hydrology; however, the deep-layer ground ice exhibited a complicated formation mechanism. In addition, the variability in the isotopic patterns along depths suggested the influence of lithology on the water migration and freezing fractionation of stable isotopes. The freezing line of the ground ice is significantly different from the LMWL and is reflected in the freezing characteristics of liquid water under different conditions.
This first comprehensive dataset provides a new basis for studying the isotopic hydrology and exploring the hydrological effects of degrading permafrost on the QTP. It also enriches the cryospheric database of the Northern Hemisphere.
| Thermokarst lake | A lake occupying a closed depression formed by settlement of the ground following the thawing of ice-rich permafrost or the melting of massive ice. |
| Ground ice | A general term referring to all types of ice contained in freezing and frozen ground. |
| Pore ice | It is termed interstitial or “cement” ice and is the bonding material that holds soil grains together. |
| Segregated ice | It is formed by the migration of porewater to the “frozen fringe” where it forms discrete lenses or layers. |
| Excess ice | It is defined as the volume of ice in the ground that exceeds the total pore volume that the ground would have under natural unfrozen conditions. |
| Active layer | It is usually identified as the ground or a rock above the permafrost table which undergoes seasonal freezing in winter. |
The supplement related to this article is available online at: https://doi.org/10.5194/essd-16-3755-2024-supplement.
YY and QW conceived the idea of the study. YY and XG designed the isotope observation network and completed the paper. XG and ZZ analyzed water samples and plotted figures. LZ, HY, and DZ participated the fieldwork. JC and GL provided and analyzed the meteorological data.
The contact author has declared that none of the authors has any competing interests.
Publisher's note: Copernicus Publications remains neutral with regard to jurisdictional claims made in the text, published maps, institutional affiliations, or any other geographical representation in this paper. While Copernicus Publications makes every effort to include appropriate place names, the final responsibility lies with the authors.
We extend our special thanks to Hong Tan, Yandong Hou, Jing Zhan, Siru Gao, Guanli Jiang, and Peng Zhang for their kind help during field sampling work. The authors thank all reviewers for their very good suggestions and comments. Our thanks are also given to chief and editors for their patient work.
This research has been supported by the Key Research Program of Frontier Science, Chinese Academy of Sciences (grant no. ZDBS–LY–DQC026), the National Natural Science Foundation of China (grant nos. 41871062 and 42177073), and the foundation of the State Key Laboratory of Frozen Soil Engineering (grant no. SKLFSE-ZT-202118).
This paper was edited by Attila Demény and reviewed by István Fórizs, Aurel Perşoiu, and one anonymous referee.
Aichner, B., Dubbert, D., Kiel, C., Kohnert, K., Ogashawara, I., Jechow, A., Harpenslager, S.-F., Hölker, F., Nejstgaard, J. C., Grossart, H.-P., Singer, G., Wollrab, S., and Berger, S. A.: Spatial and seasonal patterns of water isotopes in northeastern German lakes, Earth Syst. Sci. Data, 14, 1857–1867, https://doi.org/10.5194/essd-14-1857-2022, 2022.
Ala-aho, P., Soulsby, C., Pokrovsky, O., Kirpotin, S. N., Karlsson, J. P., Serikova, S., Manasypov, R., Lim, A., Krickov, I., and Kolesnichenko, L. G.: Permafrost and lakes control river isotope composition across a boreal-arctic transect in the Western Siberia lowlands, Environ. Res. Lett., 13, 034028, https://doi.org/10.1088/1748-9326/aaa4fe, 2018.
Barešić, J., Horvatinčić, N., Krajcar Bronić, I., Obelić, B., and Vreča, P.: Stable isotope composition of daily and monthly precipitation in Zagreb, Isot. Environ. Healt. S., 42, 239–249, 2006.
Bershaw, J., Penny, S. M., and Garzione, C. N.: Stable isotopes of modern water across the Himalaya and eastern Tibetan Plateau: Implications for estimates of paleoelevation and paleoclimate, J. Geophys. Res-Atmos., 117, https://doi.org/10.1029/2011JD016132, 2012.
Biskaborn, B. K., Smith, S. L., Noetzli, J., Matthes, H., Vieira, G., Streletskiy, D. A., and Lantuit, H.: Permafrost is warming at a global scale, Nat. Commun., 10, 264, https://doi.org/10.1038/s41467-018-08240-4, 2019.
Brown, J., Sidlauskas, F. J., and Delinski, G. F. (Eds.): Circum-Arctic map of permafrost and ground ice conditions, Washington, DC, U.S. Geological Survey in Cooperation with the Circum-Pacific Council for Energy and Mineral Resources, Circum-Pacific Map Series CP-45, scale 1:10 000 000, 1 sheet, 1997.
Cheng, G., Zhao, L., Li, R., Wu, X., Sheng, Y., Hu, G., Zou, D., Jin, H., Li, X., and Wu, Q.: Characteristic, changes and impacts of permafrost on Qinghai-Tibet Plateau, Chinese Sci. Bull., 64, 2783–2795, 2019.
Cheng, G. D. and Jin, H. J.: Permafrost and Groundwater on the Qinghai-Tibet Plateau and in Northeast China, Hydrogeol, J., 21, 5–23, 2013.
Clark, I. and Fritz, P.: Environmental Isotopes in Hydrogeology, CRC Press, https://doi.org/10.1201/9781482242911, 1997.
Connon, R. F., Quinton, W. L., Craig, J. R., and Hayashi, M.: Changing hydrologic connectivity due to permafrost thaw in the lower Liard River valley, NWT, Canada, Hydrol. Process., 28, 4163–4178, 2014.
Craig, H.: Isotopic variations in meteoric waters, Science, 133, 1702–1703, 1961.
Cui, J., Tian, L., Biggs, T. W., and Wen, R.: Deuterium-excess determination of evaporation to inflow ratios of an alpine lake: Implications for water balance and modelling, Hydrol. Process., 31, 1034–1046, 2017.
Douglas, T. A., Hiemstra, C. A., Anderson, J. E., Barbato, R. A., Bjella, K. L., Deeb, E. J., Gelvin, A. B., Nelsen, P. E., Newman, S. D., Saari, S. P., and Wagner, A. M.: Recent degradation of interior Alaska permafrost mapped with ground surveys, geophysics, deep drilling, and repeat airborne lidar, The Cryosphere, 15, 3555–3575, https://doi.org/10.5194/tc-15-3555-2021, 2021.
Fisher, D. A., Lacelle, D., Pollard, W., and Faucher, B.: A model for stable isotopes of residual liquid water and ground ice in permafrost soils using arbitrary water chemistries and soil-specific empirical residual water functions, Permafrost Periglac., 32, 248–260, 2021.
Fritz, M., Wetterich, S., Meyer, H., Schirrmeister, L., Lantuit, H., and Pollard, W. H.: Origin and characteristics of massive ground ice on Herschel Island (western Canadian Arctic) as revealed by stable water isotope and hydrochemical signatures, Permafrost Periglac., 22, 26–38, 2011.
Gibson, J. J., Birks, S. J., Yi, Y., and Vitt, D.: Runoff to boreal lakes linked to land cover, watershed morphology and permafrost thaw: a 9-year isotope mass balance assessment, Hydrol. Process., 29, 3848–3861, 2015.
Guan, H., Zhang, X., Skrzypek, G., Sun, Z., and Xu, X.: Deuterium excess variations of rainfall events in a coastal area of South Australia and its relationship with synoptic weather systems and atmospheric moisture sources, J. Geophys. Res-Atmos., 118, 1123–1138, 2013.
Guo, D., Wang, H., and Wang, A.: Sensitivity of historical simulation of the permafrost to different atmospheric forcing data sets from 1979 to 2009, J. Geophys. Res-Atmos., 122, 12269–12284, 2017.
Guo, X., Feng, Q., Si, J., and Zhang, X.: Considerable influences of recycled moistures and summer monsoons to local precipitation on the northeastern Tibetan Plateau, J. Hydrol., 605, 127343, https://doi.org/10.1016/j.jhydrol.2021.127343, 2022.
Hughes, C. E. and Crawford, J.: A new precipitation weighted method for determining the meteoric water line for hydrological applications demonstrated using Australian and global GNIP data, J. Hydrol., 464, 344–351, 2012.
Immerzeel, W. W., Van Beek, L. P., and Bierkens, M. F.: Climate change will affect the Asian water towers, Science, 328, 1382–1385, 2010.
Jouzel, J. and Souchez, R. A.: Melting–refreezing at the glacier sole and the isotopic composition of the ice, J. Glaciol., 28, 35–42, 1982.
Kern, Z., Harmon, R. S., and Fórizs, I.: Stable isotope signatures of seasonal precipitation on the Pacific coast of central Panama, Isot. Environ. Healt. S., 52, 128–140, 2016.
Knapp, J. L. A., Neal, C., Schlumpf, A., Neal, M., and Kirchner, J. W.: New water fractions and transit time distributions at Plynlimon, Wales, estimated from stable water isotopes in precipitation and streamflow, Hydrol. Earth Syst. Sci., 23, 4367–4388, https://doi.org/10.5194/hess-23-4367-2019, 2019.
Kuang, X. and Jiao, J. J.: Review on climate change on the Tibetan Plateau during the last half century, J. Geophys. Res-Atmos., 121, 3979–4007, 2016.
Lacelle, D.: On the δ18O, δD and d-excess relations in meteoric precipitation and during equilibrium freezing: theoretical approach and field examples, Permafrost Periglac., 22, 13–25, 2011.
Lacelle, D., Fontaine, M., Forest, A. P., and Kokelj, S.: High-resolution stable water isotopes as tracers of thaw unconformities in permafrost: A case study from western Arctic Canada, Chem. Geol., 368, 85–96, https://doi.org/10.1016/j.chemgeo.2014.01.005, 2014.
Lawrence, D. M. and Slater, A. G.: A projection of severe near-surface permafrost degradation during the 21st century, Geophys. Res. Lett., 32, L24401, https://doi.org/10.1029/2005GL025080, 2005.
Liu, F., Qin, S., Fang, K., Chen, L., Peng, Y., Smith, P., and Yang, Y.: Divergent changes in particulate and mineral-associated organic carbon upon permafrost thaw, Nat. Commun., 13, 5073, https://doi.org/10.1038/s41467-022-32681-7, 2022a.
Liu, L., Zhuang, Q., Zhao, D., Zheng, D., Kou, D., and Yang, Y.: Permafrost Degradation Diminishes Terrestrial Ecosystem Carbon Sequestration Capacity on the Qinghai-Tibetan Plateau, Global Biogeochem. Cy., 36, e2021GB007068, https://doi.org/10.1029/2021GB007068, 2022b.
Luo, J., Niu, F., Lin, Z., Liu, M., and Yin, G.: Thermokarst lake changes between 1969 and 2010 in the Beilu River basin, Qinghai–Tibet Plateau, China, Sci. Bull., 60, 556–564, 2015.
Michel, F. A.: Isotope characterisation of ground ice in northern Canada, Permafrost Periglac., 22, 3–12, 2011.
Murton, J. B.: Ground Ice and Cryostratigraphy, in: Treatise on Geomorphology, edited by: Shroder, J. F., Academic Press, San Diego, 173–201, 2013.
Narancic, B., Wolfe, B. B., Pienitz, R., Meyer, H., and Lamhonwah, D.: Landscape-gradient assessment of thermokarst lake hydrology using water isotope tracers, J. Hydrol., 545, 327–338, 2017.
Niu, F., Lin, Z., Liu, H., and Lu, J.: Characteristics of thermokarst lakes and their influence on permafrost in Qinghai–Tibet Plateau, Geomorphology, 132, 222–233, 2011.
Niu, F. J., Zhang, J. M., and Zhang, Z.: Engineering geological characteristics and evaluations of permafrost in Beiluhe testing field of Qinghai-Tibetan Railway, J. Glaciol. Geocryol., 24, 264–269, 2002.
Opel, T., Meyer, H., Wetterich, S., Laepple, T., Dereviagin, A., and Murton, J.: Ice wedges as archives of winter paleoclimate: A review, Permafrost Periglac., 29, 199–209, 2018.
Persoiu, A. and Pazdur, A.: Ice genesis and its long-term mass balance and dynamics in Scarisoara Ice Cave, Romania, The Cryosphere, 5, 45–53, https://doi.org/10.5194/tc-5-45-2011, 2011.
Porter, T. J. and Opel, T.: Recent advances in paleoclimatological studies of Arctic wedge-and pore-ice stable-water isotope records, Permafrost Periglac., 31, 429–441, 2020.
Porter, T. J., Schoenemann, S. W., Davies, L. J., Steig, E. J., Bandara, S., and Froese, D. G.: Recent summer warming in northwestern Canada exceeds the Holocene thermal maximum, Nat. Commun., 10, 1631, https://doi.org/10.1038/s41467-019-09622-y, 2019.
Quinton, W. L. and Baltzer, L. J.: The active-layer hydrology of a peat plateau with thawing permafrost (scotty creek, canada), Hydrogeol. J., 21, 201–220, 2013.
Ran, Y., Li, X., Cheng, G., Che, J., Aalto, J., Karjalainen, O., Hjort, J., Luoto, M., Jin, H., Obu, J., Hori, M., Yu, Q., and Chang, X.: New high-resolution estimates of the permafrost thermal state and hydrothermal conditions over the Northern Hemisphere, Earth Syst. Sci. Data, 14, 865–884, https://doi.org/10.5194/essd-14-865-2022, 2022.
Rogger, M., Chirico, G., Hausmann, H., Krainer, K., Brückl, E., Stadler, P., and Blöschl, G: Impact of mountain permafrost on flow path and runoff response in a high alpine catchment, Water Resour. Res., 53, 1288–1308, 2017.
Shukla, P. R., Skeg, J., Buendia, E. C., Masson-Delmotte, V., Pörtner, H. O., Roberts, D. C., Zhai, P., Slade, R., Connors, S., van Diemen, S., Ferrat, M., Haughey, E., Luz, S., Pathak, M., Petzold, J., Portugal Pereira, J., Vyas, P., Huntley, E., Kissick, K., Belkacemi Malley, M. J. (Eds.): IPCC: Climate Change and Land: an IPCC special report on climate change, desertification, land degradation, sustainable land management, food security, and greenhouse gas fluxes in terrestrial ecosystems, Cambridge University Press , https://doi.org/10.1017/9781009157988, 2019.
Song, C., Wang, G., Liu, G., Mao, T., Sun, X., and Chen, X.: Stable isotope variations of precipitation and streamflow reveal the young water fraction of a permafrost watershed, Hydrol. Process., 31, 935–947, 2017.
Souchez, R. A. and Jouzel, J.: On the isotopic composition in δD and δ18O of water and ice during freezing, J. Glaciol., 30, 369–372, 1984.
Souchez, R., Jouzel, J., Lorrain, R., Sleewaegen, S., Stiévenard, M., and Verbeke, V.: A kinetic isotope effect during ice formation by water freezing, Geophys. Res. Lett., 27, 1923–1926, 2000.
Streletskiy, D. A., Tananaev, N. I., Opel, T., Shiklomanov, N. I., Nyland, K. E., Streletskaya, I. D., and Shiklomanov, A. I.: Permafrost hydrology in changing climatic conditions: seasonal variability of stable isotope composition in rivers in discontinuous permafrost, Environ. Res. Lett., 10, 095003, https://doi.org/10.1088/1748-9326/10/9/095003, 2015.
Throckmorton, H. M., Newman, B. D., Heikoop, J. M., Perkins, G. B., Feng, X., Graham, D. E., and Wilson, C. J.: Active layer hydrology in an arctic tundra ecosystem: quantifying water sources and cycling using water stable isotopes, Hydrol. Process., 30, 4972–4986, 2016.
Tian, L., Yao, T., White, J. W. C., Yu, W., and Wang, N.: Westerlies moisture transport to the middle of Himalayas revealed from the high deuterium excess, Chinese Sci. Bull., 50, 1026–1030, 2005.
Vystavna, Y., Harjung, A., Monteiro, L. R., Matiatos, I., and Wassenaar, L. I.: Stable isotopes in global lakes integrate catchment and climatic controls on evaporation, Nat. Commun., 12, 7224, https://doi.org/10.1038/s41467-021-27569-x, 2021.
Wang, G., Li, Y., Wu, Q., and Wang, Y.: Impacts of permafrost changes on alpine ecosystem in Qinghai-Tibet Plateau, Sci. China. Ser. D, 49, 1156–1169, 2006.
Wang, S., He, X., Kang, S., Fu, H., and Hong, X.: Estimation of stream water components and residence time in a permafrost catchment in the central Tibetan Plateau using long-term water stable isotopic data, The Cryosphere, 16, 5023–5040, https://doi.org/10.5194/tc-16-5023-2022, 2022.
Wang, S., He, X., Kang, S., Hong, X., Fu, H., Xue, Y., and Guo, H.: Assessment of streamwater age using water stable isotopes in a headwater catchment of the central Tibetan Plateau, J. Hydrol., 618, 129175, https://doi.org/10.1016/j.jhydrol.2023.129175, 2023b.
Wang, T., Yang, D., Yang, Y., Zheng, G., Jin, H., Li, X., and Cheng, G.: Unsustainable water supply from thawing permafrost on the Tibetan Plateau in a changing climate, Sci. Bull., 68, 1105–1108, https://doi.org/10.1016/j.scib.2023.04.037, 2023a.
Wetterich, S., Tumskoy, V., Rudaya, N., Andreev, A. A., Opel, T., Meyer, H., and Hüls, M.: Ice Complex formation in arctic East Siberia during the MIS3 Interstadial, Quaternary. Sci. Rev., 84, 39–55, 2014.
Wu, Q. and Zhang, T.: Changes in active layer thickness over the Qinghai-Tibetan Plateau from 1995 to 2007, J. Geophys. Res-Atmos., 115, https://doi.org/10.1029/2009JD012974, 2010.
Wu, Q., Hou, Y., Yun, H., and Liu, Y.: Changes in active-layer thickness and near-surface permafrost between 2002 and 2012 in alpine ecosystems, Qinghai–Xizang (Tibet) Plateau, China, Global Planet. Change, 124, 149–155, 2015.
Yang, Y.: Stable isotope dataset of different water components in a tyical permafrost-dominated Basin on the Qinghai–Tibet Plateau, Zenodo [data set], https://doi.org/10.5281/zenodo.10684110, 2024.
Yang, K., Ye, B., Zhou, D., Wu, B., Foken, T., Qin, J., and Zhou, Z.: Response of hydrological cycle to recent climate changes in the Tibetan Plateau, Clim. Change, 109, 517–534, 2011.
Yang, Y., Wu, Q., and Yun, H.: Stable isotope variations in the ground ice of Beiluhe Basin on the Qinghai-Tibet Plateau, Quaternary Int., 313, 85–91, 2013.
Yang, Y., Wu, Q., Yun, H., Jin, H., and Zhang, Z.: Evaluation of the hydrological contributions of permafrost to the thermokarst lakes on the Qinghai–Tibet Plateau using stable isotopes, Global Planet. Change, 140, 1–8, 2016.
Yang, Y., Wu, Q., Jiang, G., and Zhang, P.: Stable Isotopic Stratification and Growth Patterns of Ground Ice in Permafrost on the Qinghai-Tibet Plateau, China, Permafrost Periglac., 28, 119–129, 2017.
Yang, Y., Wu, Q., Jin, H., Wang, Q., Huang, Y., Luo, D., Gao, S., and Jin, X.: Delineating the Hydrol. Process and hydraulic connectivities under permafrost degradation on Northeastern Qinghai-Tibet Plateau, China, J. Hydrol., 569, 359–372, 2019.
Yang, Y., Wu, Q., Jiang, G., and Zhang, P.: Ground ice at depths in the Tianshuihai Lake basin on the western Qinghai-Tibet Plateau: An indication of permafrost evolution, Sci. Total. Environ., 729, 138966, https://doi.org/10.1016/j.scitotenv.2022.160967, 2020.
Yang, Y., Wu, Q., Liu, F., and Jin, H.: Spatial-temporal trends of hydrological transitions in thermokarst lakes on Northeast Qinghai-Tibet Plateau based on stable isotopes, J. Hydrol., 597, 126314, https://doi.org/10.1016/j.jhydrol.2021.126314, 2021.
Yang, Y., Guo, X., Wu, Q., Jin, H., and Liu, F.: Formation processes of shallow ground ice in permafrost in the Northeastern Qinghai-Tibet Plateau: A stable isotope perspective, Sci. Total. Environ., 863, 160967, https://doi.org/10.1016/j.scitotenv.2022.160967, 2023.
Yao, T., Qin, D., Shen, Y., Zhao, L., Wang, N., and Lu, A.: Cryospheric changes and their impacts on regional water cycle and ecological conditions in the Qinghai-Tibetan Plateau. Chin, J. Nat., 35, 179–186, 2013.
Yi, S., Wang, X., Qin, Y., Xiang, B., and Ding, Y.: Responses of alpine grassland on Qinghai–Tibetan plateau to climate warming and permafrost degradation: a modeling perspective, Environ. Res. Lett., 9, 074014, https://doi.org/10.1088/1748-9326/9/7/074014, 2014.
Yin, G., Niu, F., Lin, Z., Luo, J., and Liu, M.: Effects of local factors and climate on permafrost conditions and distribution in Beiluhe basin, Qinghai-Tibet Plateau, China, Sci. Total. Environ., 581, 472–485, 2017.
Zhang, X., He, J., Zhang, J., Polyakov, I., Gerdes, R., Inoue, J., and Wu, P.: Enhanced poleward moisture transport and amplified northern high-latitude wetting trend, Nat. Clim. Change, 3, 47–51, 2013.
Zhang, T., Frauenfeld, O. W., Serreze, M. C., Etringer, A., Oelke, C., McCreight, J., Barry, R. G., Gilichinsky, D., Yang, D., Ye, H., Ling, F., and Chudinova, S.: Spatial and temporal variability in active layer thickness over the Russian Arctic drainage basin, J. Geophys. Res-Atmos, 110, 1–14, 2005.
Zhao, L., Zou, D., Hu, G., Du, E., Pang, Q., Xiao, Y., Li, R., Sheng, Y., Wu, X., Sun, Z., Wang, L., Wang, C., Ma, L., Zhou, H., and Liu, S.: Changing climate and the permafrost environment on the Qinghai-Tibet (Xizang) Plateau, Permafrost Periglac., 31, 396–405, 2020.
Zhao, L., Zou, D., Hu, G., Wu, T., Du, E., Liu, G., Xiao, Y., Li, R., Pang, Q., Qiao, Y., Wu, X., Sun, Z., Xing, Z., Sheng, Y., Zhao, Y., Shi, J., Xie, C., Wang, L., Wang, C., and Cheng, G.: A synthesis dataset of permafrost thermal state for the Qinghai–Tibet (Xizang) Plateau, China, Earth Syst. Sci. Data, 13, 4207–4218, https://doi.org/10.5194/essd-13-4207-2021, 2021.
Zhu, G., Liu, Y., Shi, P., Jia, W., Zhou, J., Liu, Y., Ma, X., Pan, H., Zhang, Y., Zhang, Z., Sun, Z., Yong, L., and Zhao, K.: Stable water isotope monitoring network of different water bodies in Shiyang River basin, a typical arid river in China, Earth Syst. Sci. Data, 14, 3773–3789, https://doi.org/10.5194/essd-14-3773-2022, 2022.
- Abstract
- Introduction
- Study area
- General design of the monitoring network
- Sample collection and processing
- General characteristics of stable isotopes in different water components
- Data availability
- Conclusions
- Appendix A: Definition or description of permafrost-associated terms
- Author contributions
- Competing interests
- Disclaimer
- Acknowledgements
- Financial support
- Review statement
- References
- Supplement