the Creative Commons Attribution 4.0 License.
the Creative Commons Attribution 4.0 License.
 | 16 Jan 2024
Flood simulation with the RiverCure approach: the open dataset of the 2016 Águeda flood event
Ana M. Ricardo
Rui M. L. Ferreira
Alberto Rodrigues da Silva
Jacinto Estima
Jorge Marques
Ivo Gamito
Alexandre Serra
Floods are among the most common natural disasters responsible for severe damages and human losses. Numerically produced data, managed by user-friendly tools for geographically referenced data, have been adopted to increase preparedness and reduce vulnerabilities. This paper describes the locally sensed and numerically produced data that characterize a flood event that occurred in February 2016 in the Portuguese Águeda River, referred to as Agueda.2016Flood for short. The data were managed through the RiverCure portal, a collaborative web platform connected to a validated shallow-water model featuring modelled dynamic bed geometries and sediment transport. The dataset provides a synthesis of topo-bathymetric, hydrometric and numerically produced data from a calibrated hydrodynamic model. Due to the lack of measured hydrometric data near the city, the numerically produced data are crucial for a complete description of the flood event. The Agueda.2016Flood dataset constitutes a complete validation test for flood forecasting models and a tool to better mitigate floods in this river and in similar rivers. Thus, Agueda.2016Flood is a relevant dataset for Águeda River stakeholders as well as for the community of flood modellers, as it provides a well-documented validation event for forecasting tools. The dataset can be accessed at https://doi.org/10.4211/hs.937927473a3a4e66a07a2e2fdd9d581e (Ricardo et al., 2024).
- Article
(4626 KB) - Full-text XML
- BibTeX
- EndNote


Floods cause widespread damages and human losses. For instance, according to the Centre for Research on the Epidemiology of Disasters, floods were the most frequent type of natural disaster between 1998 and 2017 (Wallemacq et al., 2018). There have been changes in the frequency and magnitude of floods (Amponsah et al., 2018), including an increase in their severity in central and northern Europe (Blöschl et al., 2019; Hall et al., 2015). Recently, severe floods were observed in Germany and Belgium in the summer of 2021 (Fekete and Sandholz, 2021). Accurate forecasting tools and early warning systems have been proposed to increase preparedness and reduce systemic vulnerabilities (Yuan et al., 2022).
While planning for flood resilience differs from nowcasting (Yuan et al., 2022), both activities rely on analysing available hydrological data and on hydraulic modelling, even at different timescales. Crucially, both require decision support systems that channel available input data, that conduct hydraulic modelling (possibly combined with the assimilation of input data) and that collect and organize results into datasets ready to be interpreted by decision-makers. Fostering the Digital Earth concept, these benefit from current research efforts in designing and developing digital earth twin hydrology systems (DARTHs), which are not isolated models but are services or components that can be assembled together (Rigon et al., 2022).
This paper describes a synthesis of data that allows the spatial and temporal characterization of a flood that occurred in the Portuguese Águeda River in February 2016. It also describes the main features of the RiverCure portal (RCP), the information system employed to manage and articulate the locally sensed data and the numerically produced data. The RiverCure portal (http://rivercure.inesc-id.pt/, last access: 20 December 2023) is a web platform aligned with the DARTHs paradigm and developed to integrate hydrodynamic and morphodynamic modelling tools and input data (Rodrigues da Silva et al., 2023).
The Águeda River runs through the city of Águeda, which has registered many flood occurrences causing significant damages. As an area prone to flooding, the municipality of Águeda has made considerable investments in flood protection: in 2015, it invested around EUR 2 million towards constructing a secondary river channel to divert the river flow. However, those efforts were not enough to prevent a severe flood event in February 2016, which was the most significant flood of the previous 15 years (https://www.tsf.pt/sociedade/maiores-cheias-dos-ultimos-anos-em-agueda-5027639.html, last access: 7 January 2024). That flood revealed weaknesses in the flood defence infrastructure of the municipality, although the water level of the river, in the city's vicinity, was, at its peak, 10 to 20 cm below the protection wall crest. That flood event was the result of heavy precipitation associated with strong instabilities in the North Atlantic, causing significant disturbances in the city of Águeda and affecting its mobility, public services and infrastructures.
Although flooding is a recurring problem of the city of Águeda, there are no curated datasets that allow for a description of its flooding events. This paper aims to fulfil gap assembling of the key input geographical and hydrologic data, the pre-processing steps and the rationale for establishing the parameters of the hydrodynamic modelling tools that ultimately produce the hydrometric datasets of the aforementioned February 2016 flood event. To have a complete flood description, numerically produced hydrometric data (flow depths, discharges and flow velocities) are required due to the lack of reliable physical data as the hydrometric sensor installed at the Águeda bridge was malfunctioning during the flood event. Thus, the presented dataset is a unique synthesis of topo-bathymetric, hydrological and numerically produced hydrometric data. It is very relevant locally as it documents an event relevant to Águeda River stakeholders. It is also relevant to a wider community of flood modellers as it provides a well-documented validation event for flood models, particularly shallow-water models. The community can also use this dataset as a starting point to design independent experiments and tools and as a training example for more general usage of the RiverCure portal.
The software tools used in the scope of this research are the RiverCure portal and the HiSTAV (High Performance Computing version of the original Strong Transients in Alluvial Valleys) numerical model, which run in an integrated way.
The RCP is a collaborative web application, publicly available at http://rivercure.inesc-id.pt/ (last access: 20 December 2023), that allows different organizations to set up and manage their geographic contexts, sensors and events in a controlled way. The RCP has been developed with Web and GIS technologies, such as Django, GeoDjango, PostgreSQL and PostGIS. The RCP conveys geographical and hydrological data to a numerical model as a processing service to provide simulation results. A detailed description of the concepts, design and technologies behind the RCP is presented by Rodrigues da Silva et al. (2023). Herein, only a brief description of the main features is provided.
The structure of the RCP consists of two main top-level concepts: contexts and sensors. Context allows definition of the geometry of the area and management of the events to be modelled and simulated. The geometrical details consist of the set of georeferenced features that are visualized and edited over a basemap from OpenStreetMaps (Haklay and Weber, 2008) through the Leaflet (https://leafletjs.com/, last access: 16 September 2023) library (Peterson, 2014; Edler and Vetter, 2019). The polygons and polylines can be either uploaded (i.e. when they are developed offline) or directly defined in the RCP. The raster files containing the digital elevation model (DEM) and the roughness coefficients should be uploaded. The geographic features of the context include the mesh generation process, as the mesh is a required feature of the numerical modelling. The mesh is generated from the geometrical and raster input data and employs the open-source 3D finite-element grid generator Gmsh (Geuzaine and Remacle, 2009). The connection between the RCP and the numerical model is established by defining an event to be modelled. The event features allow the user to define the results' writing rates and the simulation's starting and ending times.
The sensors represent cyber-physical devices that load and store the environmental data in the RCP. Generically, a sensor reads and collects data in a given location, usually a geographical point, with a given frequency. The sensor observations (data values) are automatically obtained or manually introduced in the RCP by users, either on a value-by-value basis or in sets of values by a given spreadsheet. The mapping between a sensor and a context is defined by associating a sensor with a boundary point or an entire boundary of a context.
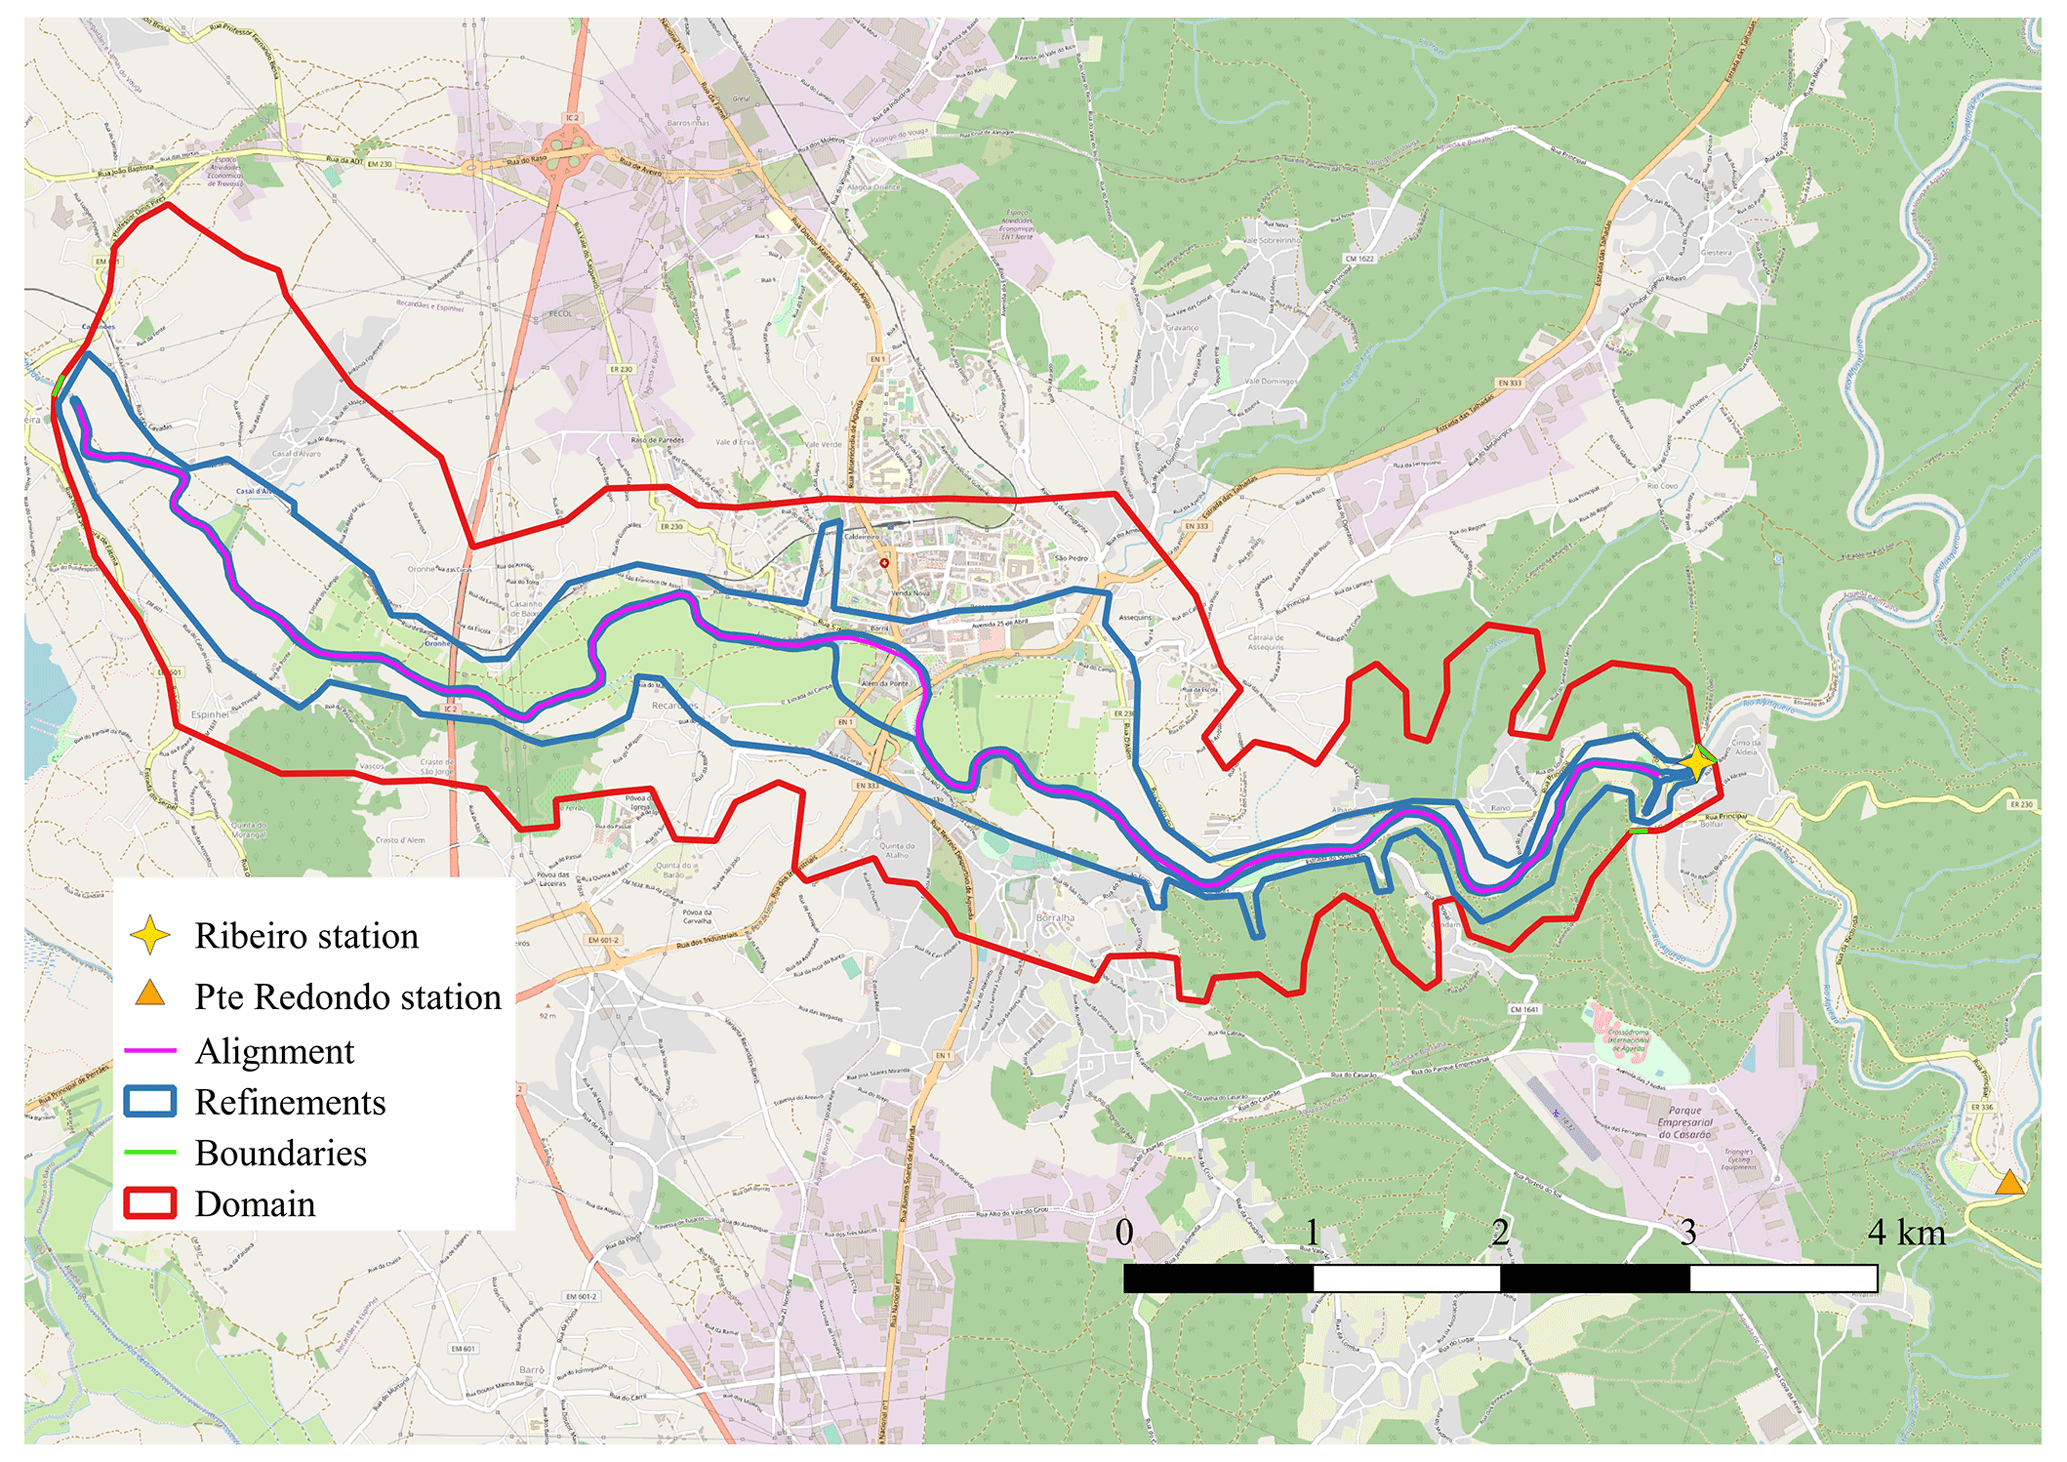
Figure 1Map of the modelled area (domain) including the geometrical features for mesh generation (alignment and refinements) and the location of the inlet and outlet boundaries. The orange triangles show the locations of the hydrometric stations (Ribeiro and Ponte Redonda). The map was produced with QGIS employing the basemap from © OpenStreetMap contributors 2023. Distributed under the Open Data Commons Open Database License (ODbL) v1.0.
The numerical model currently linked to the RCP is HiSTAV; however, it could use other existing simulation tools. HiSTAV is an in-house shallow-water model featuring dynamic bed geometries and sediment transport modelled via the difference between capacity bedload discharge and local solid discharge (Ferreira et al., 2009; Canelas et al., 2013; Conde et al., 2020; Conde, 2018). The model comprises the total mass conservation equation, the momentum conservation equation and the sediment mass conservation equation. The conservation equation system is hyperbolic and is discretized with a finite-volume method employing a flux-splitting technique and a reviewed Roe–Riemann solver with appropriate source-term formulations to ensure full conservativeness (Conde et al., 2020). The sediment mass conservation expresses the interaction between the bed and the flow in the bed.
In HiSTAV, the closed conservation equations are discretized by a finite-volume approach and are solved explicitly, obeying a Courant–Friedrichs–Lewy (CFL) condition that is conventional for restricting the computational time step. The implementation is entirely cross-compatible between CPUs and GPUs through an intuitive object-oriented approach (Conde et al., 2020). It thus supports distributed and heterogeneous computing of significant problems at very high resolutions. Therefore, there are no special requirements for the machines that may run HiSTAV; it can spread its load through available GPUs or CPUs. The current simulations were run on a multi-CPU or multi-GPU computational server with two nodes, each with two Xeon(R) E5-2650 Octa-core CPUs and four NVIDIA GPUs with 128 GB ECC RAM installed and a 10 K rpm hard disk with a capacity of 1 TB (TYAN FT77A-B7059).
The data produced by HiSTAV are stored in .vtk files created by the Visualization Toolkit (VTK), state-of-the-art open-source software for manipulating and displaying scientific data (https://vtk.org/, last access: 16 September 2023).
3.1 Overview of the dataset
The simulation of the 2016 Águeda flood event involved a geographical extent corresponding to an area of 560 ha crossed by a 9.8 km long stretch of the Águeda River, including the riverfront part of Águeda as represented in Fig. 1. Regarding the time span, this flood event was defined between 9 February 2016, 00:00:00 WET and 16 February 2016, 23:00:00.
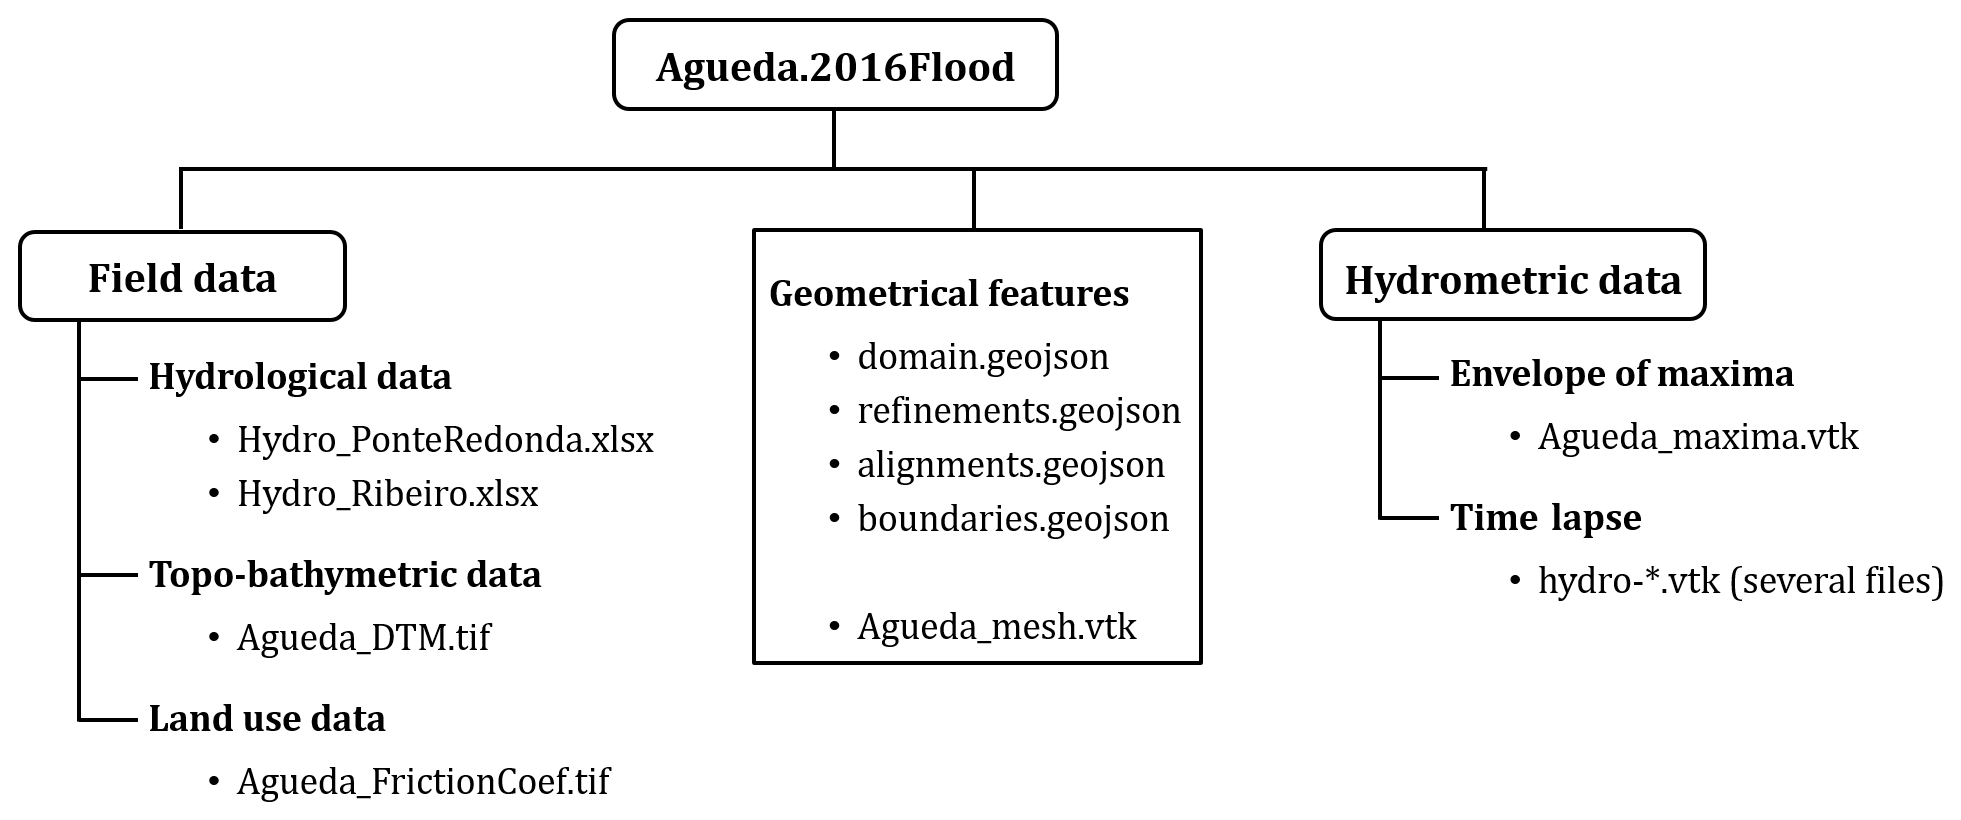
Figure 2Schematic representation of the dataset organization with the identification of the files included in each part.
Figure 2 presents an overview of the Agueda.2016Flood dataset. The dataset includes the geometrical features of the simulated context and two main subsets of data: the field data, including topo-bathymetric, land use and hydrologic data collected to feed the flood event simulation, and the numerically produced hydrometric data. Details on each part of the dataset are provided in the following subsections.
The Agueda.2016Flood dataset (Ricardo et al., 2024) is publicly available in the HydroShare repository. The specification of the employed data entities uses the controlled natural language RSL as discussed in Rodrigues da Silva and Savić (2021) (see Appendix A for details on the main concepts and the properties related to the context definition).
3.2 Geometrical features
The subset named Geometrical features contains auxiliary elements rather than actual data. These elements include the features to geometrically define the simulation and its mesh.
Concerning the geometrical characteristics of the simulation, the numerical model requires the following set of lines and polygons in GeoJSON format.
-
Domain: a polygon delimitating the area to be modelled
-
Refinements: polygons delimitating areas where specific mesh refinements are desired
-
Alignments: polylines identifying the river centreline
-
Boundaries: polylines aligned with domain limits defining the inlet and outlet boundaries of the domain.
The boundaries are characterized by the type of boundary condition (input, known output, critical or transmissive) and, when applicable, the type of data to be given as input to the model (e.g. depth, discharge, velocity or elevation). These features can be set or updated through the user interface of the RCP. The polylines defining the main channel alignment and the refinement polygons are not mandatory: they are used for custom-made improvements of the mesh size definition. A feature named “CL”, storing an indicative value for the length of the largest cell size in metres, must be an attribute of the polygons defining the domain and the desired mesh refinement zones as well as of the polyline defining the main channel alignment. Furthermore, to fulfil the mesh generator requirements, the geometries cannot intersect. That is, any larger polygon must completely contain a given polygon or polyline.
The geometrical features subset also includes the Agueda_mesh.vtk file containing the mesh used in the simulation of the flood event. The mesh consists of a set of unstructured triangular cells containing the following data: cell ID (named “Address”), bed level (m), roughness coefficient (), a physical tag to identify the cells corresponding to boundary cells and the length of the largest cell size (m).
3.3 Field data
The field data subset corresponds, in a broad sense, to data locally collected. It includes local topography, river bathymetry, land use data and hydrologic data obtained from two hydrometric stations.
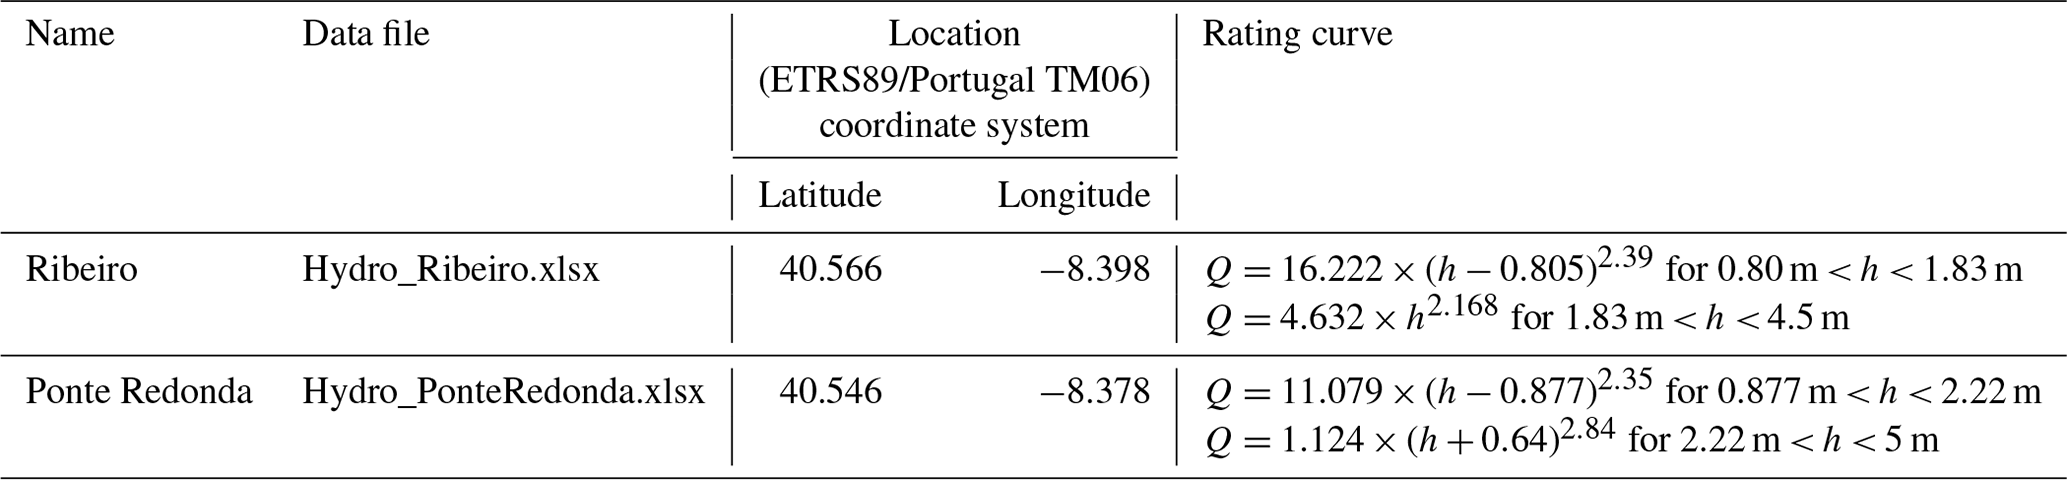
Table 1Information on the name of the file containing the discharge data, the location and the rating curves of each station.
3.3.1 Hydrological data
The hydrological data employed as model input data consist of hourly discharge time series obtained from two hydrometric stations managed by the Portuguese Environmental Agency (APA, https://snirh.apambiente.pt/, last access: 16 September 2023), Ribeiro and Ponte Redonda stations (Table 1). Ribeiro station is located within the simulated area on the Alfusqueiro River, close to its confluence with the Águeda River. Ponte Redonda station is located on the Águeda River, 5 km upstream of the domain boundary. Both stations are equipped with automatic sensors that measure the hydrometric level at every hour, except when a critical threshold is reached. In that case, the measurement frequency is increased (Pereira, 2021). The measured flow levels (h) are converted to discharges (Q) by the rating curves defined and updated by the national authorities. Further details on the hydrometric stations and the corresponding rating curves can be obtained from the APA website or from Pereira (2021).
A synthetic and constant time series, with 20 h in length and a discharge equal to the value obtained for 9 February 2016, 00:00, was added to the event data series to ensure the model warm-up. Table 1 summarizes the information regarding the two hydrometric stations.
Another hydrometric station exists within the simulated area, Ponte de Águeda station, located on the bridge that crosses the river in downtown Águeda. The data from that station proved to be inaccurate due to possible malfunctioning of the sensor as well as the lack of an update of the rating curves after the regulation works carried out in 2015 on the river banks in the vicinity of Águeda.
3.3.2 Topo-bathymetric data
The ASTER Global Digital Elevation Model (GDEM) Version 3 (ASTGTM), publicly provided by NASA (https://search.earthdata.nasa.gov/), was the base for the topographic characterization of the modelled area. The ASTER platform has three subsystems: a visible and near-infrared radiometer, a shortwave-infrared radiometer and a thermal-infrared radiometer (Yamaguchi et al., 1998; Fujisada et al., 2018). Version 3 counts with a technical methodology to improve the initial tile-based waterbody data (Fujisada et al., 2018). The geographic coverage of the ASTER GDEM extends from 83∘ N to 83∘ S, divided into 22 912 tiles with a spatial resolution of 1 arcsec (approximately 30 m horizontal posting at the Equator). Each tile is distributed in GeoTIFF format and is projected onto the 1984 World Geodetic System (WGS84)/1996 Earth Gravitational Model (EGM96) geoid. The ASTGTMV003_N40W009 tile, which includes the littoral centre and the north of Portugal, was downloaded, and the region of interest was cropped and employed as a starting point for the DEM provided by the Agueda_DEM.tif raster file. The base raster was edited for accuracy and resolution improvement by adding detail to the river bottom and banks, particularly in the vicinity of Águeda.
The river centreline and width were defined through Google Earth. The Águeda River in front of Águeda has suffered many interventions that resulted in a channel with a rectangular cross section with protection walls. A significant effort was made to identify adequate and accurate data from elements provided by the municipality of Águeda and to collect field data regarding the elevation of the protection walls of the riverfront of Águeda and regarding the river bathymetry. Since the city was flooded not because of the protection walls overtopping but because of vulnerabilities in these walls, these had to be investigated to be incorporated into the DEM, reproducing the geometry of the under-passages of the Águeda bridge.
Although based on the relatively poor resolution of the ASTER GDEM, the produced DEM ensured the accuracy and adequacy of the spatial resolution regarding the river bottom and the city in the river's vicinity.
3.3.3 Land use data
The spatial distribution of the roughness coefficient over the modelled area is also a required model input. It was obtained from COS2018, a spatial dataset produced by the Portuguese governmental office for territorial development, DGT (Direção Geral do Território – https://www.dgterritorio.gov.pt/dados-abertos, last access: 16 September 2023), representing the thematic map of land use and land cover for mainland Portugal for the year 2018. COS2018, made available as Linked Open Data (LOD) in RDF format, is a map of polygons with a defined minimum cartographic unit (1 ha) with a distance between lines equal to or greater than 20 m. It is based on photointerpretation and has a terminology with more than 80 classes. Manning's coefficient values (n) used for specific land cover are based on the well-established values presented in Chow (1959) and van der Sande et al. (2003). The Agueda_FrictionCoef.tif raster file includes the spatial distribution of the Manning–Strickler friction coefficient, ().
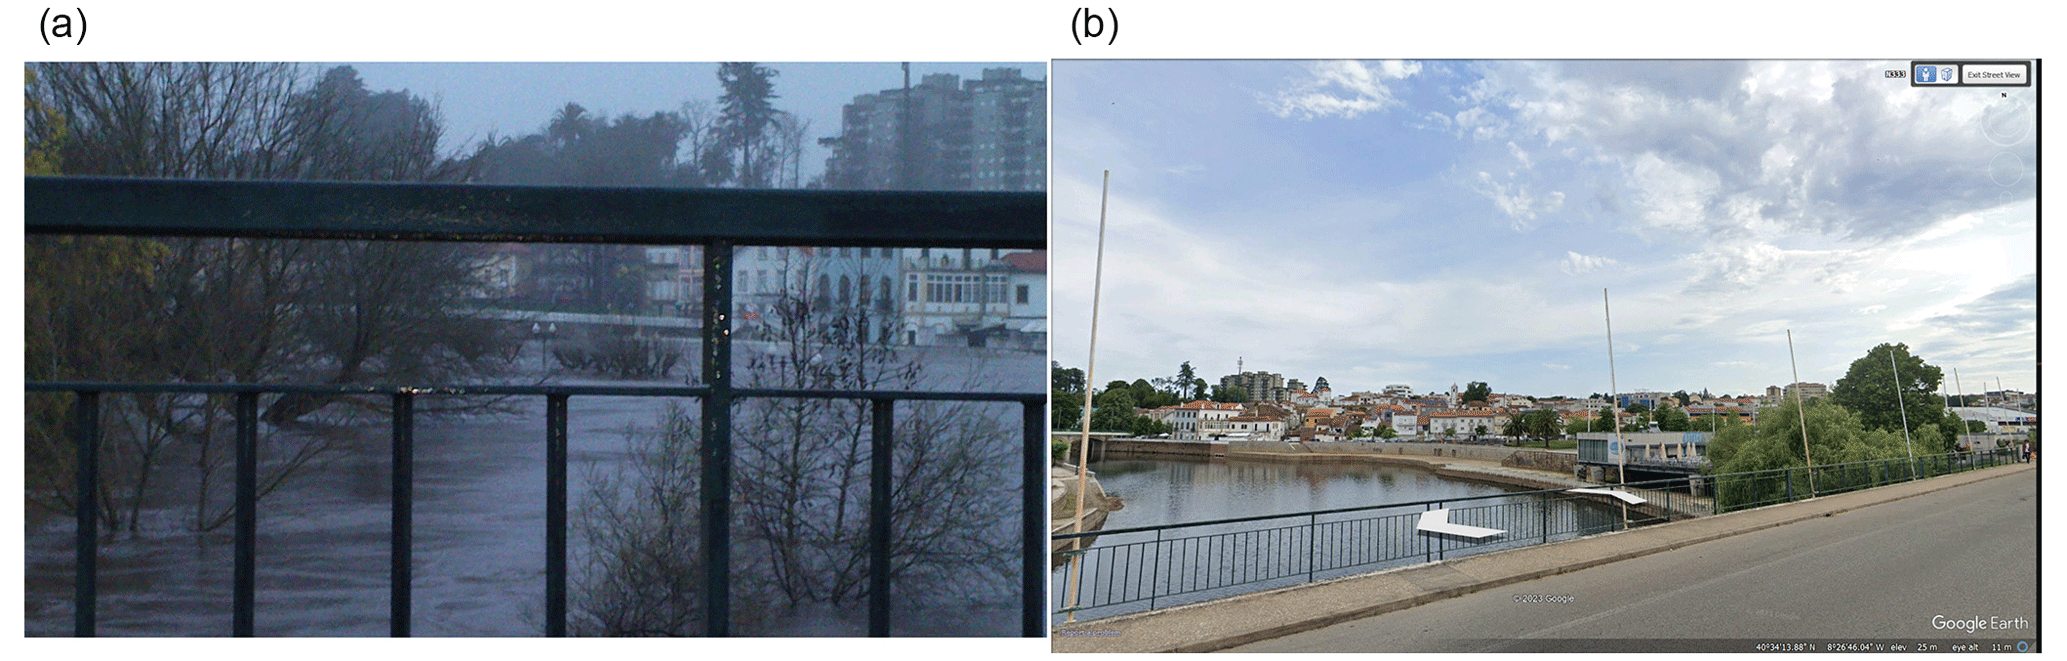
Figure 3Photo of the water level of the river (a) and © Google Earth Pro view (street view) from the location where the photo was taken.
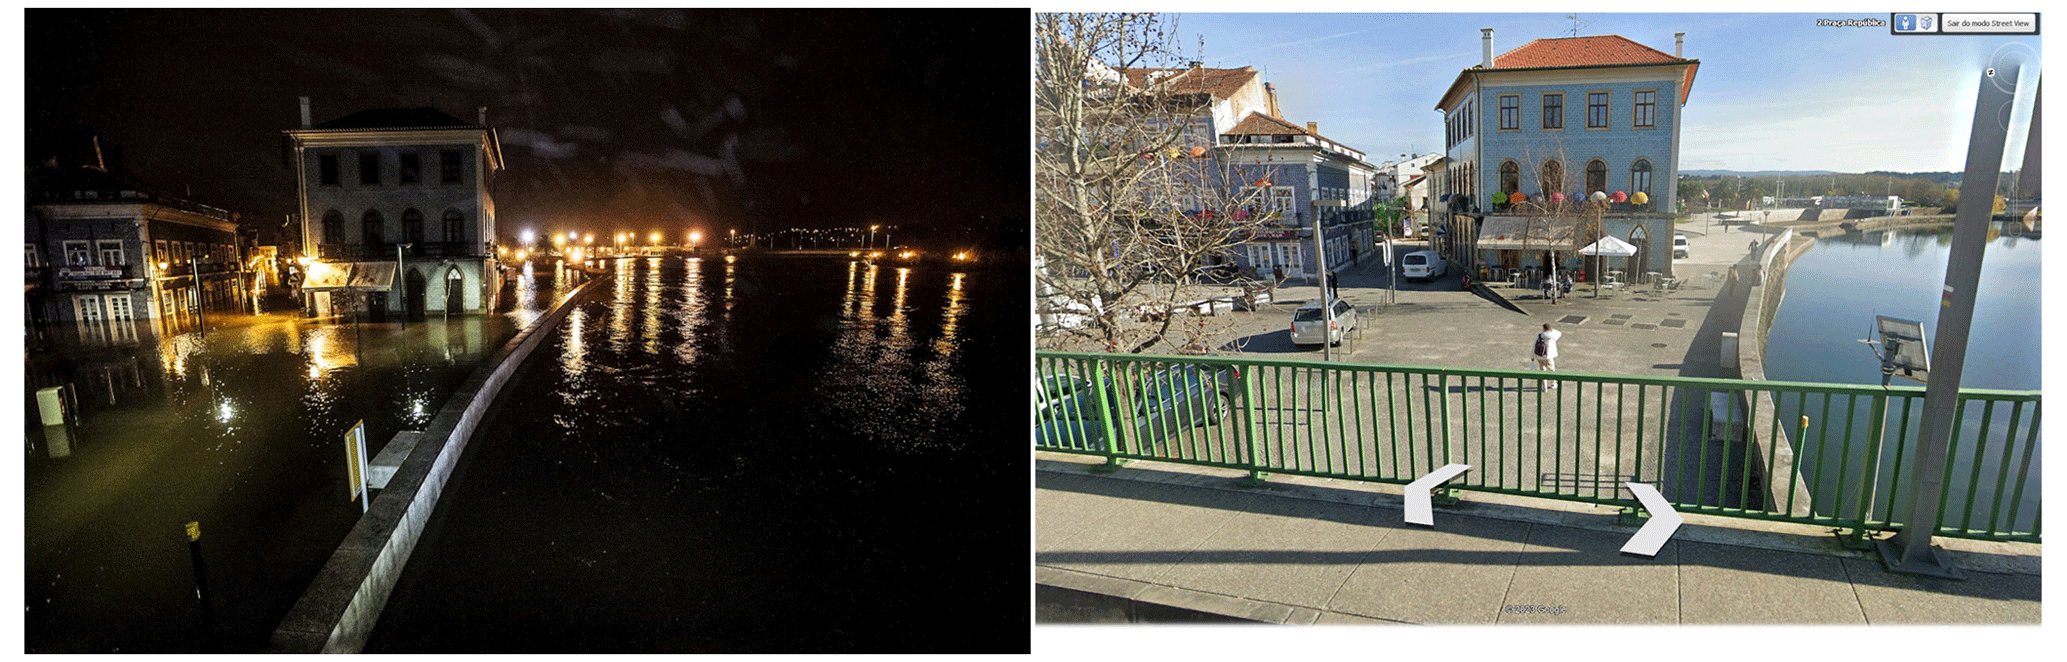
Figure 4Photo of the flood in a square (Praça da Repúlica) and a street (Rua Vasco da Gama) in downtown Águeda and © Google Earth Pro view (street view) from the location where the photo was taken.
3.4 Hydrometric data
The hydrometric data to characterize the flood event were produced numerically by HiSTAV. This subset of the dataset includes the spatial distribution of the maximum values of the hydrometric variables and instantaneous maps for a selected set of time instants.
3.4.1 Envelope of maxima
The Agueda_maxima.vtk file corresponds to the envelope of maxima for each variable, i.e. stores the maximum values of each mesh cell for the modelled flow variables. The variables included are flow depth, water level, flow velocity, hazard index (defined as , where h is the flow depth and v is the flow velocity according to Penning-Rowsell et al., 2005), the time to reach the maximum hazard index of each cell and the time to reach the wet state of each cell.
The rate of update of maximum values during a given simulation can be set by the user on the RCP. In the present simulations, the maxima were updated every second.
3.4.2 Time lapse
The spatial distribution of bed level (m), water level (m) and flow velocity (m s−1) for a set of time instants is provided by the hydro-*.vtk files. The numbers in the filename indicate the simulation time step.
In the present case, the time-dependent result files were written hourly but were sampled every 3 h as a compromise between a detailed time characterization and storage management. The hourly dataset will be shared directly with the authors upon request.
The accuracy of the discharge time series computed from the data collected by the Ribeiro and Ponte Redonda hydrometric stations was confirmed by Pereira (2021) by hydrological and hydraulic modelling employing rain data from radar and from rain gauges.
The fixed bed version of HiSTAV requires the empirical quantification of one parameter to complete the roughness closure. In this case, it is the conveyance coefficient (the inverse of a roughness coefficient) of the Manning–Strickler equation. The model was given maps of the Manning–Strickler coefficients that were merged with the mesh at the pre-processing stage. No formal calibration was necessary. A bulk verification of the roughness parameters and the topo-bathymetry was undertaken: it verified that the roughness and topo-bathymetric data led to the observed river water level in the vicinity of Águeda at t = 110 h (12 February 2016, 18:00:00 WET), i.e. 10–20 cm below the protection wall crest.
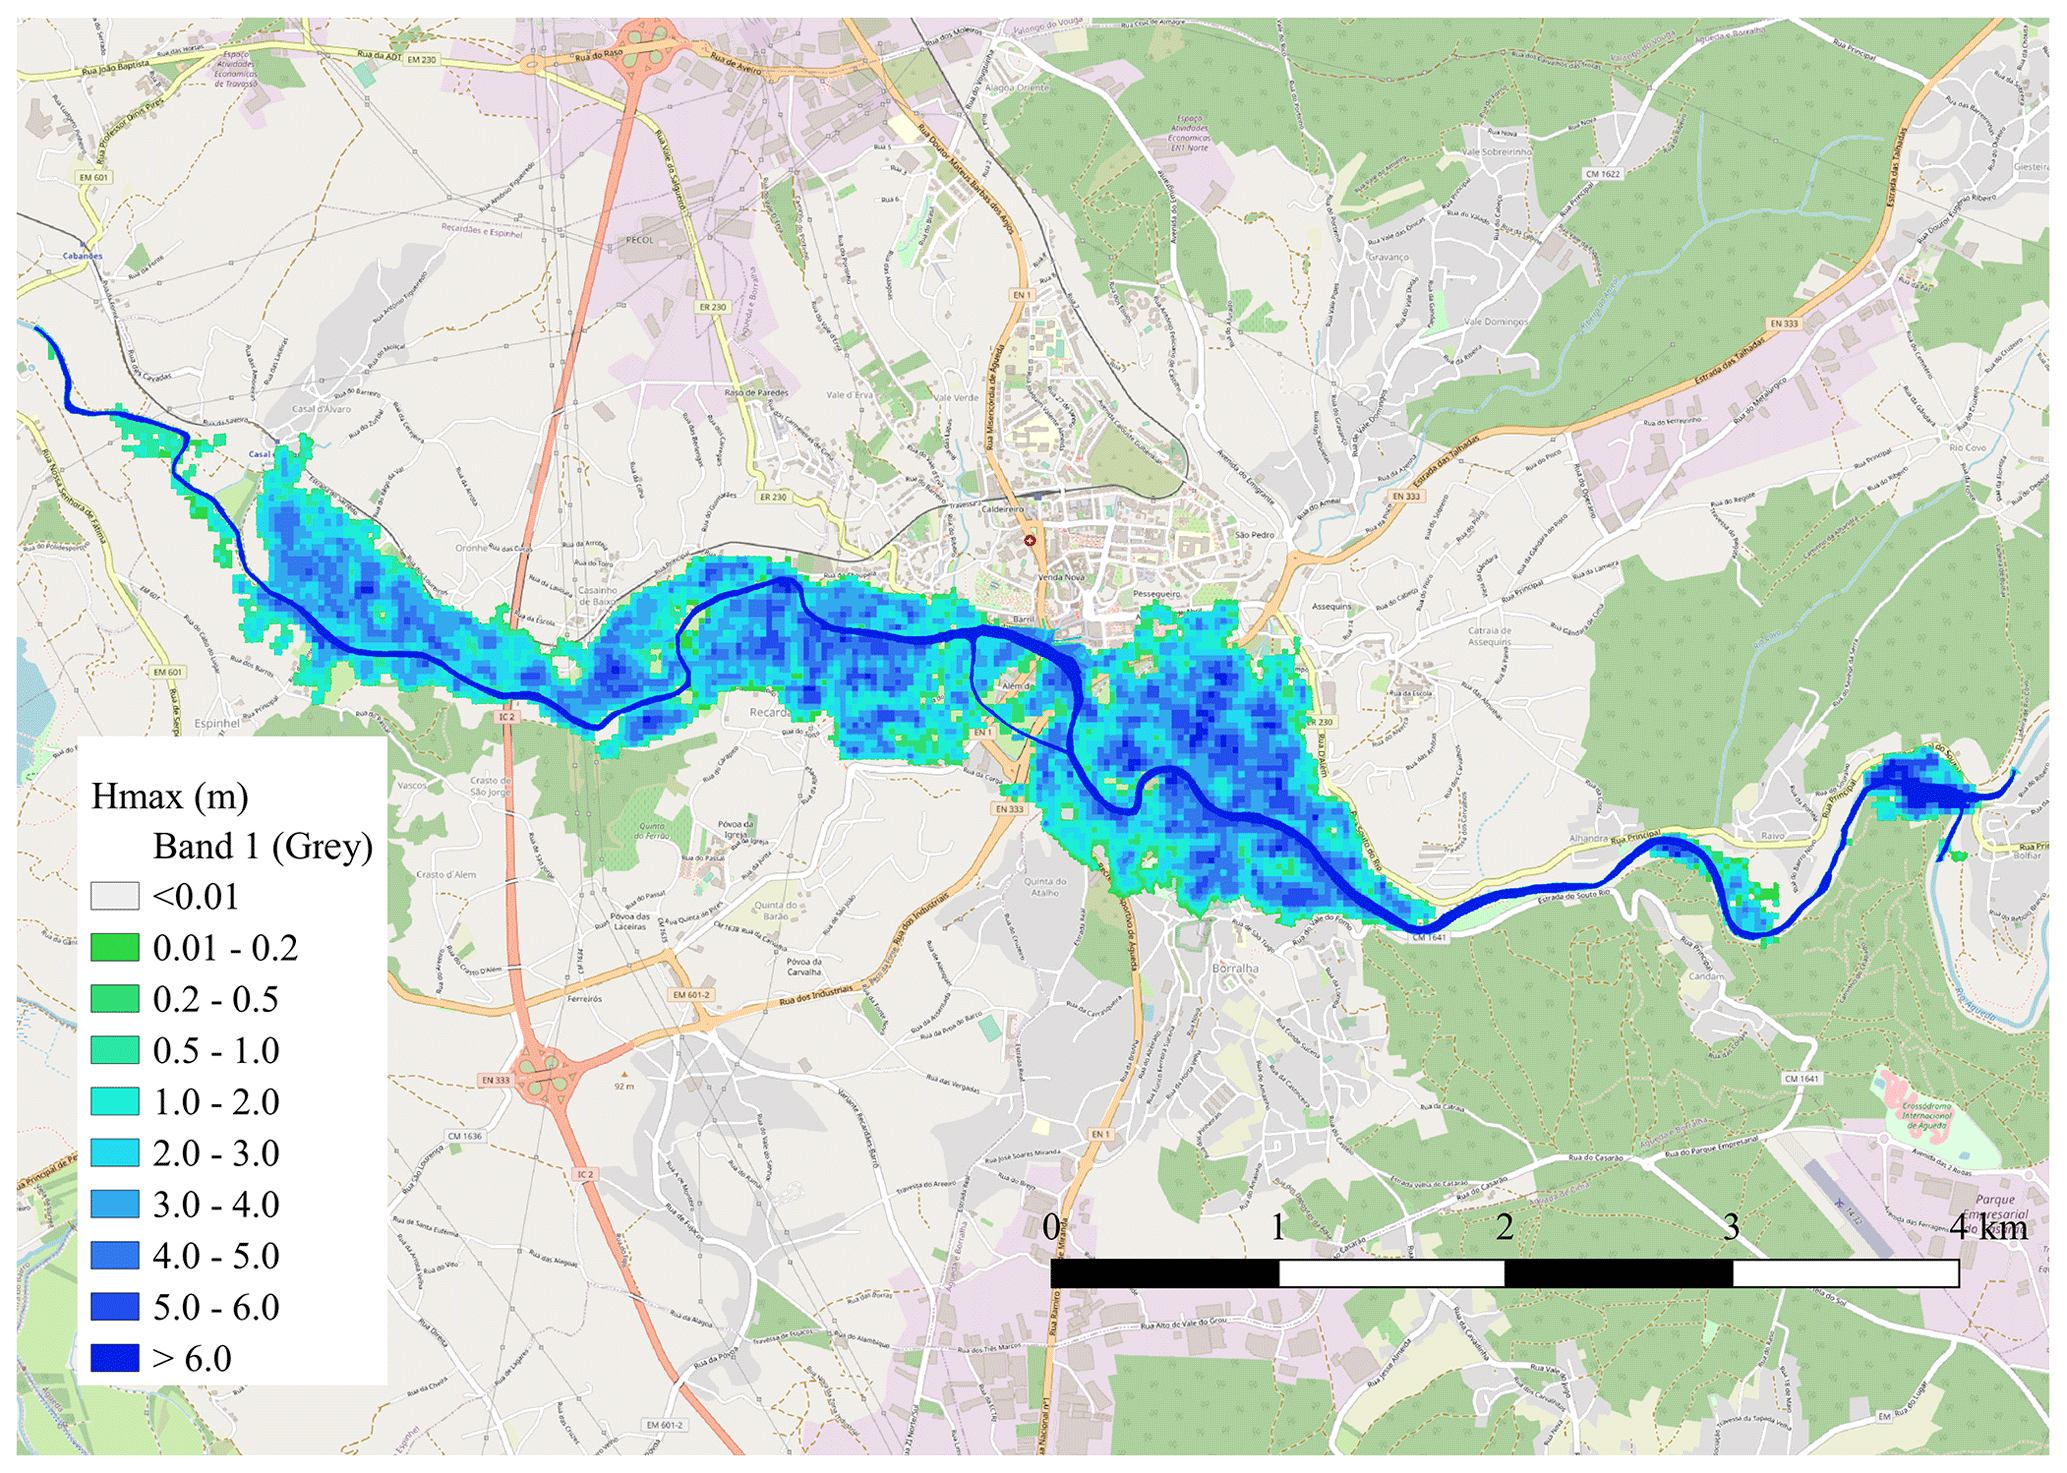
Figure 5Distribution of the maximum values of the computed water depth overlapped on the map. The colour scale is in metres (m). The map was produced with QGIS employing the basemap from © OpenStreetMap contributors 2023. Distributed under the Open Data Commons Open Database License (ODbL) v1.0.
The validation tests guarantee the quality of the numerically produced data shown by the HiSTAV tool. The HiSTAV model has been compared with theoretical solutions and experimental data for both resistance and solid transport (Canelas et al., 2013) and has been tested in a benchmark text of 2D dam-break flows over a sand bed (Soares-Frazão et al., 2012). HiSTAV has also been employed to model a tsunami in the Tagus estuary (Lisbon), demonstrating a good performance on the Monai Valley benchmark and in comparison with historical data (Conde et al., 2015).
The 2016 Águeda flood event was largely reported in the Portuguese media, allowing us to gather informal but accurate data regarding the water depth and extent of the flooded areas. The efforts in improving the topo-bathymetric data allowed us to obtain good agreement between the modelled and observed flood extent in downtown Águeda.
The 2016 flood event is of particular interest due to the large media coverage allowing us to gather informal but accurate data regarding the water depth and extent of the flooded areas. In this event, the water depth of the river near the bridge was, at its peak, 10 to 20 cm below the protection wall crest. This has been observed by local authorities and registered in photos and videos between 04:00 and 20:00 on 12 February. These photos were used to verify the extent of the inundation along Rua Luís de Camões and Rua Vasco da Gama. Examples of the photos collected and analysed for comparison with the numerically produced data are shown in Figs. 3 and 4.
Figure 5 presents a 2D distribution of the maximum water depth values on the modelled domain overlapped on the terrain model.
Another way to verify the reliability of the produced dataset is to compare the input discharge data with the numerically produced data, as shown in Fig. 6. The “upstream” hydrograph corresponds to the numerically produced discharge on the cross section at approximately 400 m downstream of the domain limit at the intersection of the two inlet channels. The discharge computed in that section coincides with the summation of the two input hydrographs. The “downstream” hydrograph was obtained at the domain outlet boundary. The comparison of the two computed hydrographs shows the expected delay and damping of the flood from the entrance to the outlet of the domain.
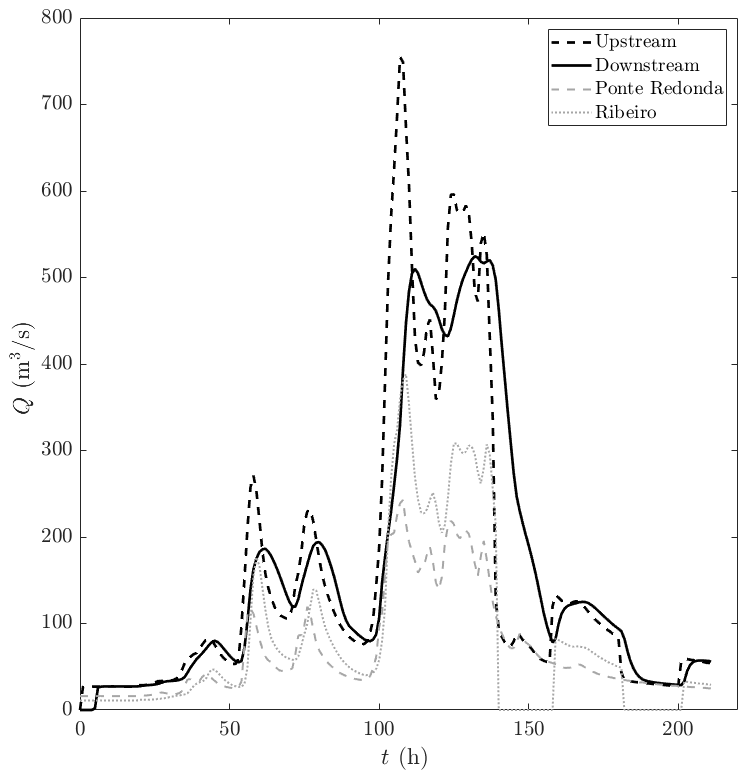
Figure 6Time series of flow discharge at the inlet boundaries (Ponte Redonda and Ribeiro), at the confluence of the two inlet streams (“Upstream”) and at the downstream boundary. The upstream and downstream hydrographs were computed from the numerically produced database. The time instant t = 0 h corresponds to 04:00 of 8 February 2016.
All data are stored in the Agueda.2016Flood dataset (https://doi.org/10.4211/hs.937927473a3a4e66a07a2e2fdd9d 581e, Ricardo et al., 2024), which is publicly available in the HydroShare repository. HydroShare is an open-source web-based system developed, mainly, for water-related professionals to easily share, collaborate and publish all types of scientific data. HydroShare adheres to the FAIR (findable, accessible, interoperable, and reusable) archival standard and provides a representational state transfer (REST) application program interface (API) that allows third-party applications to interact with HydroShare resources. HydroShare is a large Python and Django application with some extra features and technologies added on. All data uploaded to HydroShare become part of a “resource” which provides the ability to group together multiple files of different types in one location. The dataset presented herein is the resource named Agueda.2016Flood. The resource contents are organized into three folders following the schematic representation of Fig. 2. Download of the files can be done by scrolling down the resource's landing page until the “Content” section. This can be done by downloading each file individually, by downloading a zip file or by downloading all the contents as a zipped Bagit archive. Further details are provided at https://help.hydroshare.org/creating-and-managing-resources/view-and-download-a-resource/ (last access: 10 January 2024).
The RiverCure portal is publicly available at http://rivercure.inesc-id.pt/ (last access: 20 December 2023) and can be used to run the presented case study or any other case upon free registration. The HiSTAV numerical model can be explored through the RiverCure portal. Conde et al. (2020) provide further details about the numerical model, its discretization and its implementation within the paradigm of high-performance computing (HPC) for GPU- and CPU-based computer architectures.
This work describes the Agueda.2016Flood dataset. It presents a unique and highly relevant dataset to fully characterize the flood event that occurred in February 2016 in the Portuguese Águeda River, a river for which there are no curated datasets of flooding events, despite their relatively high frequency. The dataset was managed through the RiverCure portal, a collaborative web platform connected to HiSTAV, a validated shallow-water model featuring modelled dynamic bed geometries and sediment transport.
The dataset includes hydrological, topo-bathymetric and land use data together with numerically produced hydrometric data from a calibrated model. Per se, none of these data subsets would be sufficient: it is the synthesis that allows the complete description of the flood event. Thus, the dataset constitutes a relevant and complete validation test for other flood forecasting models and a tool for better understanding and mitigating floods in this river and in similar rivers.
Below is illustrated the data model supported by the RiverCure portal that shows its main concepts and properties related to context definition. This specification is defined according to the ITLingo RSL language (Rodrigues da Silva and Savić, 2021).
// Contexts
DataEntity e_Context ”Context”: Master [
attribute id ”Id”: Integer [constraints (PrimaryKey)]
attribute code ”Code”: String [constraints (NotNull Unique)]
attribute Name ”Name”: String [constraints (NotNull Unique)]
attribute organization ”Organization”: Integer [constraints (ForeignKey(e_Organization))]
attribute creator ”Creator”: Integer [constraints (ForeignKey(e_User))]
attribute createDate ”Create Date”: Datetime
attribute isPublic ”Is public” : Boolean [defaultValue ”False”]
attribute hydrofeature ”Hydro Feature”: Integer [constraints(NotNull ForeignKey(e_HydroFeature))]
attribute geomExternalBoundary ”Geometry External Boundary”: GeoPolyline // domain ?
attribute CLExternalBoundary ”CL External Boundary”: Decimal
attribute hasMesh ”Has mesh” : Boolean [defaultValue ”False”]
attribute taskId ”Task id”: String
attribute requester ”Requester”: Integer [constraints (ForeignKey(e_User))] ]
// Context's Geo Features
DataEntity e_ContextDTM ”Context DTM”: Parameter [
attribute id ”Id”: Integer [constraints (PrimaryKey)]
attribute context ”Context”: Integer [constraints(NotNull ForeignKey(e_Context))]
attribute rasterFile ”Raster File”: FilePath
attribute raster ”Raster”: GeoRaster ]
DataEntity e_ContextFrictionCoeff ”Context Friction Coefficient”: Parameter [
attribute id ”Id”: Integer [constraints (PrimaryKey)]
attribute context ”Context”: Integer [constraints(NotNull ForeignKey(e_Context))]
attribute geometry ”Geometry”: GeoPoint [constraints (multiplicity ”*”)] // LineString
attribute fileName ”Geometry File Name”: FilePath ]
DataEntity e_ContextRefinement ”Context Refinement”: Parameter [
attribute id ”Id”: Integer [constraints (PrimaryKey)]
attribute context ”Context”: Integer [constraints(NotNull ForeignKey(e_Context))]
attribute geometry ”Geometry”: GeoPolygon
attribute fileName ”Geometry File Name”: FilePath
attribute cl ”CL”: Decimal ]
DataEntity e_ContextAlignment ”Context Alignment”: Parameter [
attribute id ”Id”: Integer [constraints (PrimaryKey)]
attribute context ”Context”: Integer [constraints(NotNull ForeignKey(e_Context))]
attribute geometry ”Geometry”: GeoPolyline [constraints (multiplicity ”*”)] // LineString
attribute fileName ”Geometry File Name”: FilePath
attribute cl ”CL”: Decimal ]
DataEntity e_ContextBoundaryLine ”Context Boundary Line”: Parameter [
attribute id ”Id”: Integer [constraints (PrimaryKey)]
attribute context ”Context”: Integer [constraints(NotNull ForeignKey(e_Context))]
attribute geometry ”Geometry”: GeoPolyline //GeoPoint [constraints (multiplicity ”*”)] //FileField
attribute fileName ”Geometry File Name”: FilePath
attribute type ”Type”: DataEnumeration ContextBoundaryChoices [constraints (NotNull)]
attribute dataType ”Data type”: DataEnumeration ContextBoundaryLineDataKindChoices [constraints (NotNull)] ]
DataEntity e_ContextBoundaryPoint ”Context Boundary Point”: Parameter [
attribute id ”Id”: Integer [constraints (PrimaryKey)]
attribute contextBoundaryLine ”Context Boundary Line”: Integer [constraints(ForeignKey(e_Context))]
attribute geometry ”Geometry”: GeoPoint
attribute fileName ”Geometry File Name”: FilePath ]
// Context's Sensors
DataEntity e_ContextSensor ”Context Sensor”: Master [
attribute id ”Id”: Integer [constraints (PrimaryKey)]
attribute boundaryPoint ”Boundary Point”: Integer [constraints(ForeignKey(e_ContextBoundaryPoint))]
attribute sensor ”Sensor”: Integer [constraints(ForeignKey(e_Sensor))]
attribute Description ”Description”: String [constraints (NotNull)]
attribute associateDateTime ”Associate Date Time”: Datetime ]
// Context's Events
DataEntity e_ContextEvent ”Context Event”: Document:Regular [
attribute id ”Id”: Integer [constraints (PrimaryKey)]
attribute context ”Context”: Integer [constraints(NotNull ForeignKey(e_Context))]
attribute Name ”Name”: String [constraints (NotNull Unique)]
attribute type ”Type”: DataEnumeration ContextEventTypeChoices [constraints (NotNull)]
attribute subType ”Subtype”: DataEnumeration ContextEventSubTypeChoices [constraints (NotNull)]
attribute State ”State”: DataEnumeration ContextEventStateChoices [constraints (NotNull)]
attribute startDateTime ”Start Datetime”: Datetime [constraints (NotNull)]
attribute endDateTime ”End Datetime”: Datetime [constraints (NotNull)]
attribute Description ”Description”: String
attribute returnPeriod ”Return Period”: Integer [defaultValue ”1 ”]
attribute warmUp ”Warm Up”: Boolean [defaultValue ”False”]
attribute writingPeriodicity ”Writing Periodicity”: Decimal [defaultValue ”1.0”]
attribute writingPeriodicityUnit ”Writing Periodicity Unit”: String
attribute updateMaximumValue ”Update Maximum Value”: Decimal [defaultValue ”1.0”]
attribute updateMaximumValueUnit ”Update Maximum Value Unit”: String
attribute hasSimulation ”Has Simulation”: Boolean [defaultValue ”False”]
attribute taskId ”Task id”: String
attribute requester ”Requester”: Integer [constraints (ForeignKey(e_User))] ]
DataEntity e_ContextEventResult ”Context Event Result”: Document:Weak [
attribute id ”Id”: Integer [constraints (PrimaryKey)]
attribute contextEvent ”Context Event”: Integer [constraints(ForeignKey(e_ContextEvent))]
attribute maxDepth ”Maximum Depth”: GeoRaster
attribute maxLevel ”Maximum Level”: GeoRaster
attribute maxQ ”Maximum Q”: GeoRaster
attribute maxVel ”Maximum Velocity”: GeoRaster
attribute time ”Time”: Datetime [constraints(NotNull)] ]
All the authors contributed to the article's conception and design. The RiverCure portal was designed by ARdS, RMLF and JE and developed by AS, JM and IG. AMR performed material preparation and data collection. The manuscript was written by AMR, ARdS and RMLF. All the authors read and approved the final manuscript.
The contact author has declared that none of the authors has any competing interests.
Publisher's note: Copernicus Publications remains neutral with regard to jurisdictional claims made in the text, published maps, institutional affiliations, or any other geographical representation in this paper. While Copernicus Publications makes every effort to include appropriate place names, the final responsibility lies with the authors.
This research has been supported by the Portuguese Foundation for Science and Technology through national and European funds within the COMPETE 2020 and PORL-FEDER programs through projects RiverCure PTDC/CTA-OHR/29360/2017 and DikesFPro PTDC/ECI-EGC/7739/2020; by 02/SAICT/2017/29360, UIDB/50021/2020, and UIDB/00326/2020; by CISUC funding UIDB/00326/2020; and by CERIS funding UIDB/04625/2020.
This research has been supported by the Fundação para a Ciência e a Tecnologia (grant nos. PTDC/CTA-OHR/29360/2017 and PTDC/ECI-EGC/7739/2020).
This paper was edited by Alexander Gelfan and reviewed by four anonymous referees.
Amponsah, W., Ayral, P.-A., Boudevillain, B., Bouvier, C., Braud, I., Brunet, P., Delrieu, G., Didon-Lescot, J.-F., Gaume, E., Lebouc, L., Marchi, L., Marra, F., Morin, E., Nord, G., Payrastre, O., Zoccatelli, D., and Borga, M.: Integrated high-resolution dataset of high-intensity European and Mediterranean flash floods, Earth Syst. Sci. Data, 10, 1783–1794, https://doi.org/10.5194/essd-10-1783-2018, 2018.
Blöschl, G., Hall, J., Viglione, A., Perdigão, R. A., Parajka, J., Merz, B., Lun, D., Arheimer, B., Aronica, G. T., Bilibashi, A., and Boháč, M.: Changing climate both increases and decreases European river floods, Nature, 573, 108–111, https://doi.org/10.1038/s41586-019-1495-6, 2019.
Canelas, R., Murillo, J., and Ferreira, R. M. L.: Two-Dimensional Depth-Averaged Modelling Of Dambreak Flows Over Mobile Beds, J. Hydraul. Res., 51, 392–407, https://doi.org/10.1080/00221686.2013.798891, 2013.
Chow, V. T.: Open-Channel Hydraulics, McGraw-Hill, New York, ISBN 007085906X, 1959.
Conde, D.: Mathematical Modelling of Tsunami Impacts on Built Environments, PhD thesis, Instituto Superior Técnico, Universidade de Lisboa, Lisbon, 2018.
Conde, D., Canelas, R. B., and Ferreira, R. M. L.: A unified object-oriented framework for CPU+GPU explicit hyperbolic solvers, Adv. Eng. Softw., 148, 102802, https://doi.org/10.1016/j.advengsoft.2020.102802, 2020.
Conde, D. A., Telhado, M. J., Viana Baptista, M. A., and Ferreira, R. M.: Severity and exposure associated with tsunami actions in urban waterfronts: the case of Lisbon, Portugal, Nat. Hazards, 79, 2125–2144, https://doi.org/10.1007/s11069-015-1951-z, 2015.
Edler, D. and Vetter, M.: The simplicity of modern audiovisual web cartography: An example with the open-source javascript library leaflet.js, KN J. Cartogr. Geogr. Inf.. 69, 51–62, https://doi.org/10.1007/s42489-019-00006-2, 2019.
Fekete, A. and Sandholz, S.: Here comes the flood, but not failure? Lessons to learn after the heavy rain and pluvial floods in Germany 2021, Water, 13, 3016, https://doi.org/10.3390/w13213016, 2021.
Ferreira, R. M. L., Franca, M. J., Leal, J. G. A. B., and Cardoso, A. H.: Mathematical modelling of shallow flows: Closure models drawn from grain-scale mechanics of sediment transport and flow hydrodynamics, Can. J. Civil Eng., 36, 1605–1621, https://doi.org/10.1139/L09-033, 2009.
Fujisada, H., Urai, M., and Iwasaki, A.: Technical Methodology for ASTER Global Water Body Data Base, Remote Sens.-Basel, 10, 1860, https://doi.org/10.3390/rs10121860, 2018.
Geuzaine, C. and Remacle, J. F.: Gmsh: A 3-D finite element mesh generator with built-in pre-and post-processing facilities, Int. J. Numer. Meth. Eng., 79, 1309–1331, https://doi.org/10.1002/nme.2579, 2009.
Haklay, M. and Weber, P.: Openstreetmap: User-generated street maps, IEEE Pervas. Comput., 7, 12–18, https://doi.org/10.1109/MPRV.2008.80, 2008.
Hall, J., Arheimer, B., Aronica, G. T., Bilibashi, A., Boháč, M., Bonacci, O., Borga, M., Burlando, P., Castellarin, A., Chirico, G. B., Claps, P., Fiala, K., Gaál, L., Gorbachova, L., Gül, A., Hannaford, J., Kiss, A., Kjeldsen, T., Kohnová, S., Koskela, J. J., Macdonald, N., Mavrova-Guirguinova, M., Ledvinka, O., Mediero, L., Merz, B., Merz, R., Molnar, P., Montanari, A., Osuch, M., Parajka, J., Perdigão, R. A. P., Radevski, I., Renard, B., Rogger, M., Salinas, J. L., Sauquet, E., Šraj, M., Szolgay, J., Viglione, A., Volpi, E., Wilson, D., Zaimi, K., and Blöschl, G.: A European Flood Database: facilitating comprehensive flood research beyond administrative boundaries, Proc. IAHS, 370, 89–95, https://doi.org/10.5194/piahs-370-89-2015, 2015.
Penning-Rowsell, E. C., Floyd, P., Ramsbottom, D., and Surendran, S.: Estimating Injury and Loss of Life in Floods: A Deterministic Framework, Nat. Hazards, 36, 43–64, https://doi.org/10.1007/s11069-004-4538-7, 2005.
Pereira, A.: On the use of a weather radar for flood forecasting in the Centre of Portugal, Master thesis, Instituto Superior Técnico, Lisbon, https://fenix.tecnico.ulisboa.pt/cursos/meambi/dissertacao/846778572212913 (last access: 16 September 2023), 2021.
Peterson, G.: GIS Cartography: A Guide To Effective Map Design, 2nd edn., CRC Press, Boca Raton, ISBN 978-1-4200-8213-5, 2014.
Ricardo, A. M., Silva, A., Estima, J., Ferreira, R. M., Marques, J., Gamito, I., and Serra, A.: Águeda.2016Flood – The open dataset of the 2016 Águeda flood event, HydroShare [data set], https://doi.org/10.4211/hs.937927473a3a4e66a07a2e2fdd9d581e, 2024.
Rigon, R., Formetta, G., Bancheri, M., Tubini, N., D'Amato, C., David, O., and Massari, C.: HESS Opinions: Participatory Digital eARth Twin Hydrology systems (DARTHs) for everyone – a blueprint for hydrologists, Hydrol. Earth Syst. Sci., 26, 4773–4800, https://doi.org/10.5194/hess-26-4773-2022, 2022.
Rodrigues da Silva, A. and Savić, D.: Linguistic Patterns and Linguistic Styles for Requirements Specification: Focus on Data Entities. Appl. Sci. 11, 4119, https://doi.org/10.3390/app11094119, 2021.
Rodrigues da Silva, A., Estima, J., Marques, J., Gamito, I., Serra, A., Moura, L., Ricardo, A. M., Mendes, L., and Ferreira, R. M. L.: A Web GIS Platform to Modeling, Simulate and Analyze Flood Events: The RiverCure Portal, ISPRS Int. J. Geo-Inf., 12, 268, https://doi.org/10.3390/ijgi12070268, 2023.
Soares-Frazão, S., Canelas, R., Cao, Z., Cea, L., Chaudhry, H. M., Die Moran, A., El Kadi, K., Ferreira, R., Cadórniga, I. F., Gonzalez-Ramirez, N., Greco, M., Huang, W., Imran, J., Le Coz, J., Marsooli, R., Paquier, A., Pender, G., Pontillo, M., Puertas, J., Spinewine, B., Swartenbroekx, C., Tsubaki, R., Villaret, C., Wu, W., Yue, Z., and Zech, Y.: Dam-break flows over mobile beds: experiments and benchmark tests for numerical models, J. Hydraul. Res., 50, 364–375, https://doi.org/10.1080/00221686.2012.689682, 2012.
van der Sande, C. J., De Jong, S. M., and De Roo, A. P. J.: A segmentation and classification approach of IKONOS-2 imagery for land cover mapping to assist flood risk and flood damage assessment, Int. J. Appl. Earth Obs., 4, 217–229, https://doi.org/10.1016/S0303-2434(03)00003-5, 2003.
Wallemacq, P., Below, R., and McLean, D.: UNISDR and CRED report: Economic Losses, Poverty & Disasters (1998–2017), Report of Centre for Research on the Epidemiology of Disasters (CRED) and United Nations Office for Disaster Risk Reduction (UNISDR), CRED, Belgium, 2018.
Yamaguchi, Y., Kahle, A. B., Tsu, H., Kawakami, T., and Pniel, M.: Overview of Advanced Spaceborne Thermal Emission and Reflection Radiometer (ASTER), IEEE T. Geosci. Remote, 36, 1062–1071, https://doi.org/10.1109/36.700991, 1998.
Yuan, F., Fan, C., Farahmand, H., Coleman, N., Esmalian, A., Lee, C. C., Patrascu, F. I., Zhang, C., Dong, S., and Mostafavi, A.: Smart flood resilience: Harnessing community-scale big data for predictive flood risk monitoring, rapid impact assessment, and situational awareness, Environ. Res. Infrastruct. Sustain., 2, 025006, https://doi.org/10.1088/2634-4505/ac7251, 2022.