the Creative Commons Attribution 4.0 License.
the Creative Commons Attribution 4.0 License.
 | 16 Aug 2024
A synthesized field survey database of vegetation and active-layer properties for the Alaskan tundra (1972–2020)
Xiaoran Zhu
Dong Chen
Maruko Kogure
Elizabeth Hoy
Logan T. Berner
Amy L. Breen
Abhishek Chatterjee
Scott J. Davidson
Gerald V. Frost
Teresa N. Hollingsworth
Go Iwahana
Randi R. Jandt
Anja N. Kade
Tatiana V. Loboda
Matt J. Macander
Michelle Mack
Charles E. Miller
Eric A. Miller
Susan M. Natali
Martha K. Raynolds
Adrian V. Rocha
Shiro Tsuyuzaki
Craig E. Tweedie
Donald A. Walker
Mathew Williams
Yingtong Zhang
Nancy French
Scott Goetz
Studies in recent decades have shown strong evidence of physical and biological changes in the Arctic tundra, largely in response to rapid rates of warming. Given the important implications of these changes for ecosystem services, hydrology, surface energy balance, carbon budgets, and climate feedbacks, research on the trends and patterns of these changes is becoming increasingly important and can help better constrain estimates of local, regional, and global impacts as well as inform mitigation and adaptation strategies. Despite this great need, scientific understanding of tundra ecology and change remains limited, largely due to the inaccessibility of this region and less intensive studies compared to other terrestrial biomes. A synthesis of existing datasets from past field studies can make field data more accessible and open up possibilities for collaborative research as well as for investigating and informing future studies. Here, we synthesize field datasets of vegetation and active-layer properties from the Alaskan tundra, one of the most well-studied tundra regions. Given the potentially increasing intensive fire regimes in the tundra, fire history and severity attributes have been added to data points where available. The resulting database is a resource that future investigators can employ to analyze spatial and temporal patterns in soil, vegetation, and fire disturbance-related environmental variables across the Alaskan tundra. This database, titled the Synthesized Alaskan Tundra Field Database (SATFiD), can be accessed at the Oak Ridge National Laboratory Distributed Active Archive Center (ORNL DAAC) for Biogeochemical Dynamics (Chen et al., 2023: https://doi.org/10.3334/ORNLDAAC/2177).
- Article
(2676 KB) - Full-text XML
- BibTeX
- EndNote


Over recent decades, the Arctic tundra has warmed 3 to 4 times faster than the global average rate (Rantanen et al., 2022), leading to profound physical and ecological changes. Over this period, shrubs and trees have become more abundant in the North American and Eurasian Low Arctic (Hagedorn et al., 2014; Rees et al., 2020; Mekonnen et al., 2021; Dial et al., 2022). Across the Arctic tundra, as defined by the Circumpolar Arctic Vegetation Map (CAVM) (CAVM Team, 2003; Walker et al., 2005; Raynolds et al., 2019), a lengthening of the growing season has been observed due to rising temperatures (Goetz et al., 2005; Ernakovich et al., 2014; Arndt et al., 2019). At the same time, widespread increases in vegetation productivity have been documented by both field measurements (Myers-Smith et al., 2020) and satellite observations (Goetz et al., 2005; Berner et al., 2020). While the direct mechanisms underlying Arctic “greening” are complicated and vary among ecosystems (Rocha et al., 2018; Myers-Smith et al., 2020), it is believed that these mechanisms are fundamentally driven by the increasingly favorable growing conditions for vegetation created by warming, including longer growing seasons (Goetz et al., 2005; Arndt et al., 2019; Berner et al., 2020). Moreover, because of this warming, carbon-rich permafrost across the Arctic tundra has shown signs of thawing (Lewkowicz and Way, 2019; Heijmans et al., 2022). Permafrost degradation is apparent through the increasing occurrence of thermokarst and the deepening of the active-layer thickness (ALT), both of which have contributed to increased nutrient availability and a changing cover of surface water bodies across the Arctic tundra (Schuur et al., 2007; Chen et al., 2021). Additionally, wildfires, while historically rare during recent geological periods, are a significant disturbance agent that may have entered a stage of increasing severity, frequency, and extent (French et al., 2015; Hu et al., 2010). Altogether, these physical and biological changes have profound implications for the global carbon cycle, energy budget, land–atmosphere interactions, and future state of the tundra (Oechel et al., 1993; Chapin et al., 2005; Mack et al., 2011; Schuur et al., 2015).
Considering the Arctic tundra's important role in the Earth system and the rapid warming in this region, understanding current ecosystem dynamics is crucial for the projection of future states of the Arctic tundra. Also important is understanding the subsequent changes in ecosystem services and land–atmosphere interactions occurring in a changing Arctic. Despite the vast expanse of Arctic tundra and its high susceptibility to sustained warming, our collective understanding of the ecological processes that occur in the tundra remains limited. This historical lack of studies compared with other biomes is a consequence of limited in situ measurements stemming from interwoven factors including harsh Arctic environmental conditions, logistical challenges, and the high cost of conducting scientific field surveys.
The Alaskan tundra represents an important fraction of the Arctic tundra biome that spans 8.5×10⁶ km2 and shares similar characteristics with other Arctic regions (CAVM Team, 2003). It has been one of the few wildfire “hotspots” across the circumpolar tundra in recent decades (Masrur et al., 2018). Thanks to efforts by state and federal fire management agencies, the Alaskan tundra has one of the longest and highest-quality wildfire records of any Arctic region, with the earliest spatially explicit wildfire record dating back to the early 1950s. However, even these early records of wildfires across the region are sparse, and often only larger wildfires were inventoried, leading to unaccounted-for wildfires in the region (Miller et al., 2023). Additionally, the Alaskan tundra is arguably one of the most studied tundra regions in the world. To our knowledge, field measurements of vegetation and active-layer properties made in the Alaskan tundra were mentioned in the literature as early as 1889, and the USGS began field surveys of geography and geology in 1889 (Schrader, 1902; Russell, 1890). Moreover, dedicated field stations, e.g., the Toolik Field Station (established in 1975) (a part of the Arctic Long Term Ecological Research Network, LTER) and the Barrow Arctic Research Center/Environmental Observatory (established in 1973), have greatly facilitated scientific discovery in the region.
Despite the fact that many in situ datasets recorded in the Arctic tundra have been made publicly available, they are scattered across data repositories. Additionally, it is not uncommon for field datasets to be referenced in the published literature while the datasets themselves were never publicly released. While all existing field datasets are important in their own right (in support of the scientific goals of the individual field campaigns), when combined properly they can provide an unprecedented lens through which the ecosystem dynamics of the Arctic tundra, both above ground and below ground, can be revealed on a wide spatial scale. To our knowledge, there has been no effort to compile field datasets on vegetation, active-layer properties, and fire attributes collected in different parts of the Alaskan tundra and reconciled into a consistent database. Because of this, we built a database from in situ datasets across the Alaskan tundra with four major objectives: (1) gather datasets and synthesize them in a way that will facilitate further analysis by investigators and promote synthesis research efforts; (2) deepen our understanding of ecosystem processes within the Alaskan tundra, particularly fire–vegetation–permafrost interactions; (3) identify areas of interest for future research where knowledge is lacking or where there is great potential for follow-up research to study change and long-term trends; and (4) provide a source of vegetation and soil property data that could improve understanding of physical processes and that could be used to inform and validate process-based models and simulations.
This database, titled the Synthesized Alaskan Tundra Field Database (SATFiD), synthesizes field-based datasets from the Alaskan tundra as defined by the CAVM (CAVM Team, 2003; Walker et al., 2005; Raynolds et al., 2019). Data from this area can be further categorized by four major subregions: the North Slope, Noatak, the Seward Peninsula, and Southwest Alaska (Fig. 1). These subregions span a large range of climatic and topographic conditions. In the North Slope, the northernmost Arctic Coastal Plain ecoregion is located in Bioclimate Subzone D of the Circumpolar Arctic Vegetation Map and is characterized by flat, poorly drained lowlands with herbaceous and dwarf-shrub vegetation and a mosaic of water bodies (CAVM Team, 2003; Gallant et al., 1995). All Alaskan tundra south of the Arctic Coastal Plain ecoregion lies within Subzone E of the CAVM and is generally warmer and more densely vegetated (CAVM Team, 2003). Within this subzone, farther inland in the North Slope, is the Arctic Foothills ecoregion, which experiences warmer summer temperatures and features rolling hills, more distinct drainage networks, and taller, extensive shrub cover (Gallant et al., 1995). The Noatak subregion follows the Noatak River Valley and has a dry climate compared to the Seward Peninsula to its south (He et al., 2021). Southwest Alaska is the warmest subregion of the Alaskan tundra. It consists of coastal plains with wet soils, shallow active layers, and winding rivers and streams (Gallant et al., 1995).
3.1 Data
Datasets compiled into SATFiD were obtained from three main sources: (1) direct correspondence with principal investigators; (2) data repositories, including the Oak Ridge National Laboratory Distributed Active Archive Center (ORNL DAAC) and the Environmental Data Initiative (EDI); and (3) a systematic search for literature that was based on field data collected in the Alaskan tundra. Permission was obtained from each principal investigator to incorporate their datasets into this synthesis. A list of these original datasets and access to ones that are published and publicly available are included in Appendix A (Table A1). These datasets spanned many research projects with diverse research foci pertaining to the Alaskan tundra. This translates to specific variables included in the original datasets, which vary greatly. Even for the same variables, sampling frequency, and number of samples, instrumentation and methodology often varied by project. To create a database that can advance capacity for synthesis research on the Alaskan tundra, variables were selected for inclusion in the database (Sect. 3.2), and these data were standardized and filtered (Sect. 3.3).
The individual datasets that were incorporated defined plots that varied in size, sampling within sites versus along transects, and sampling techniques. For consistency, we define unique data points as points that were collected at unique latitude, longitude, and collection dates as provided in the original datasets.
3.2 In situ variable selection
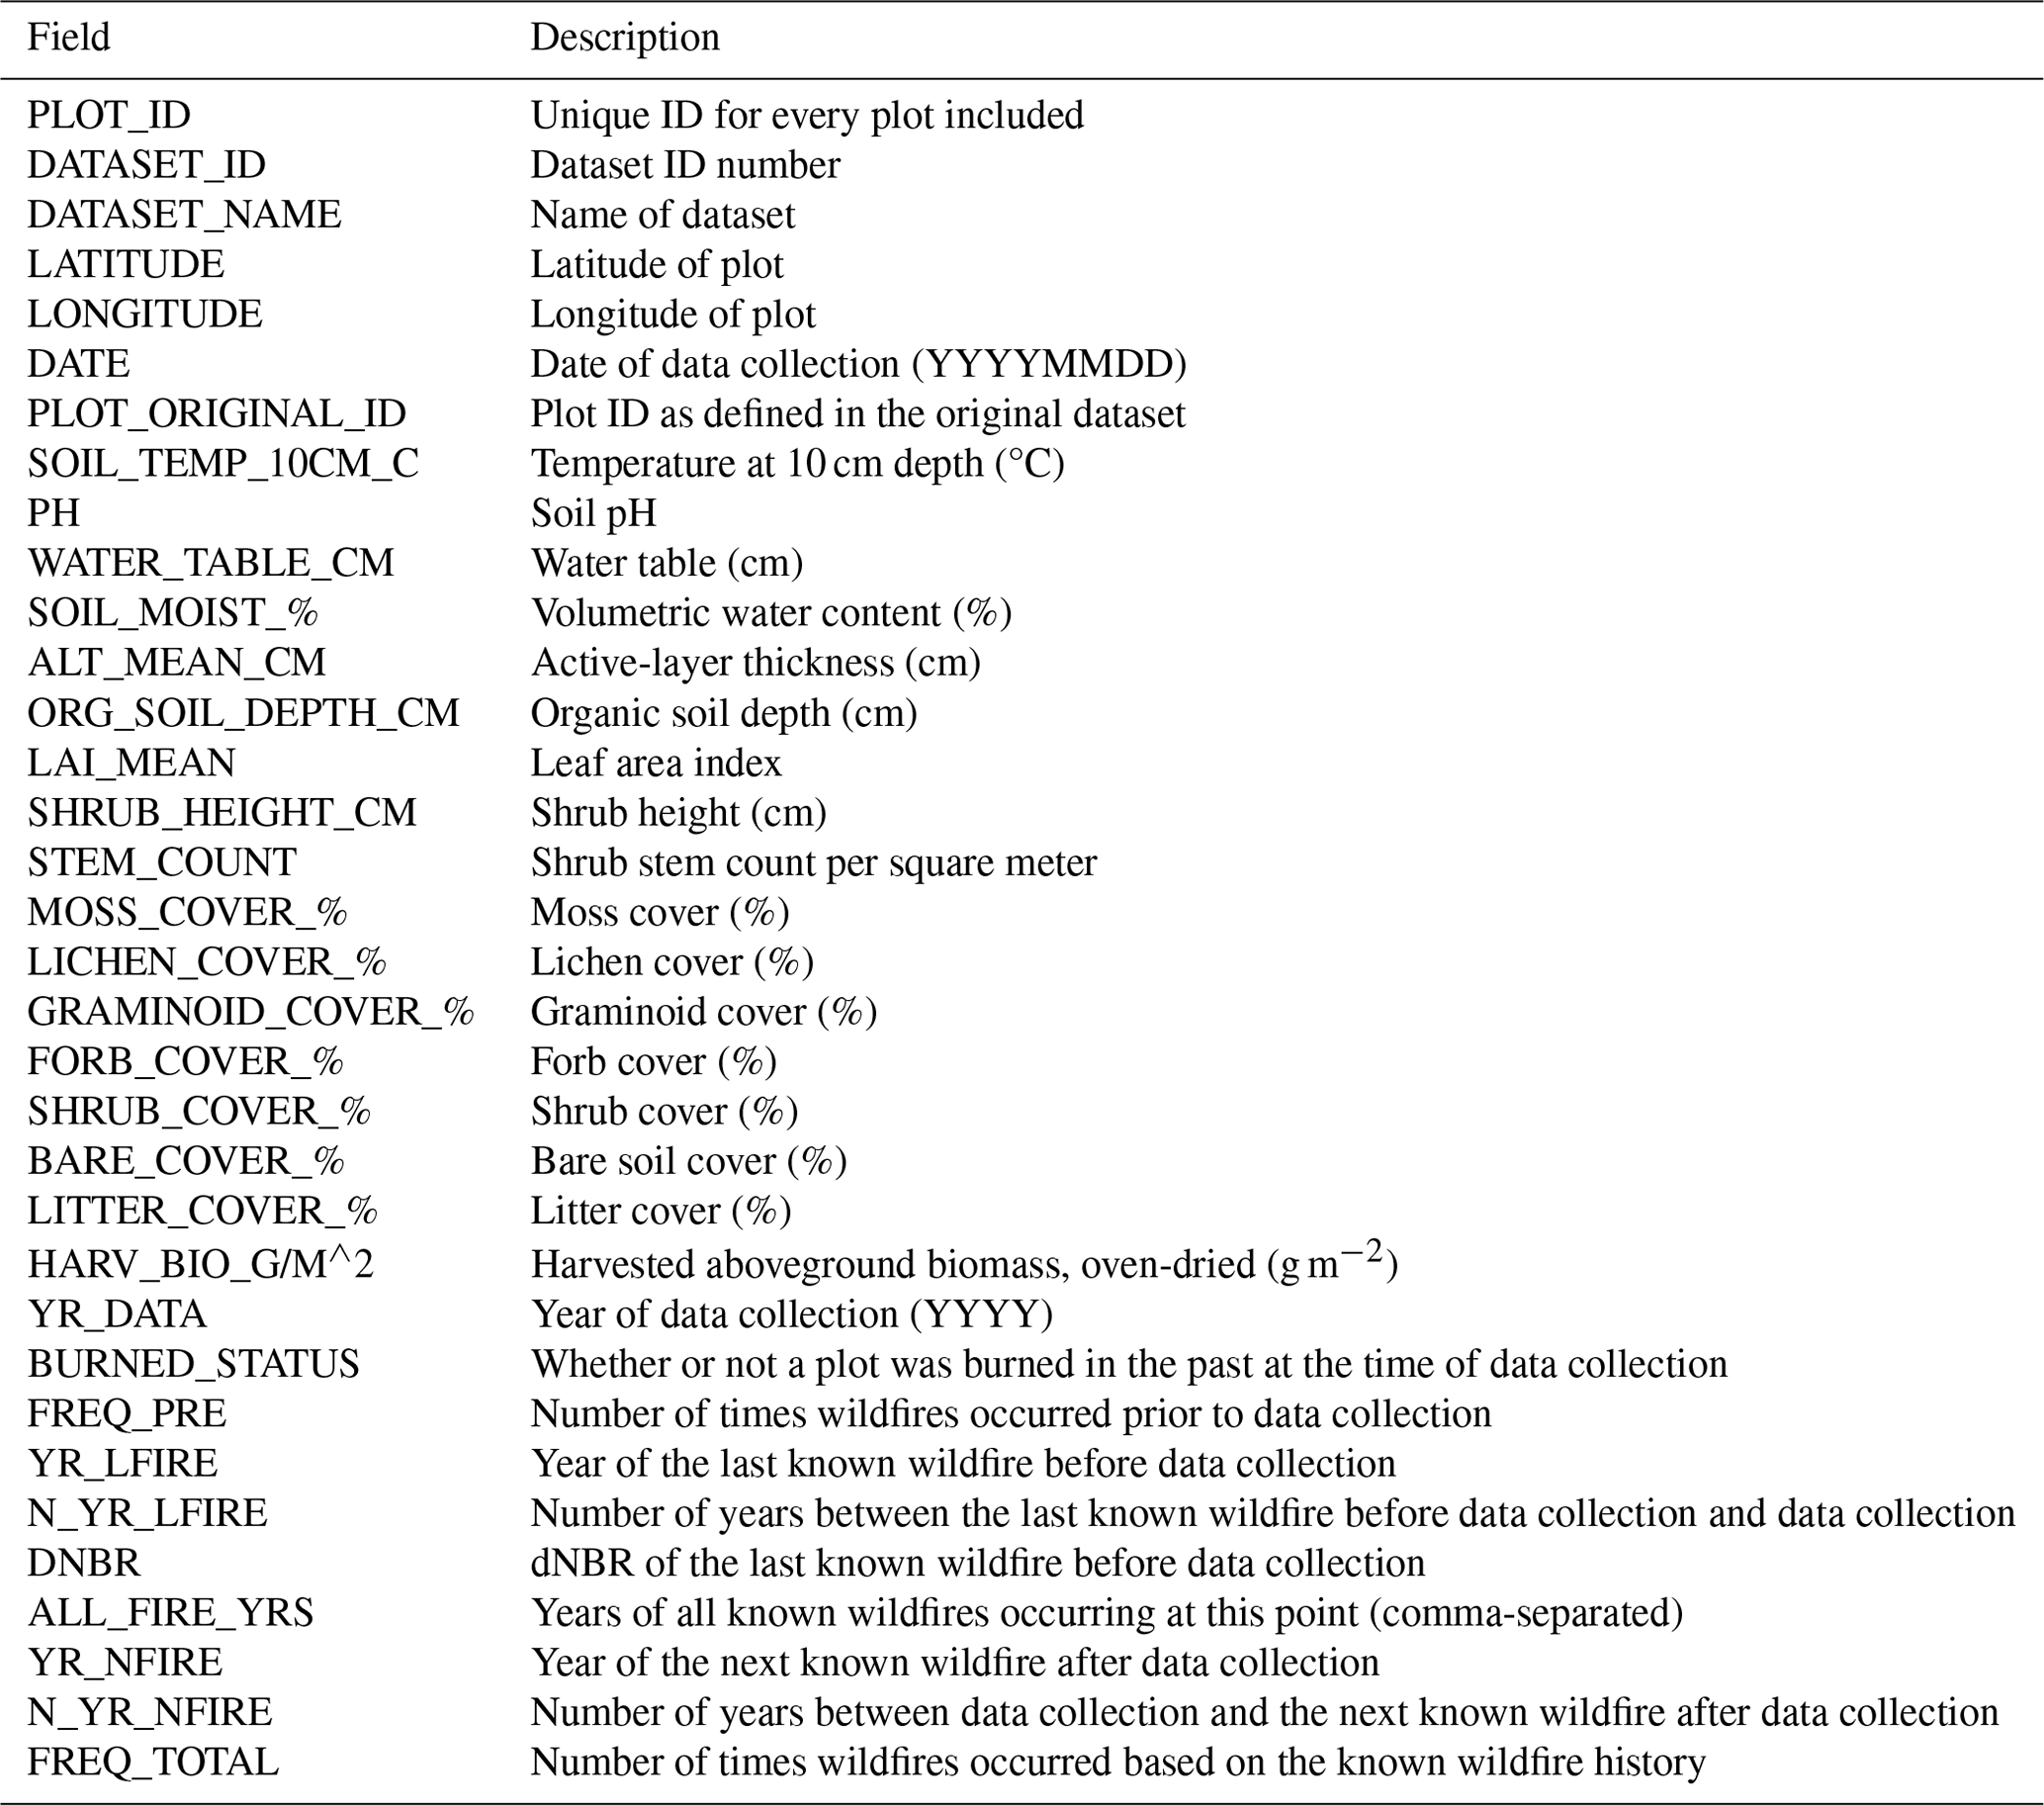
The variables included in SATFiD (shown in Table 1) were selected from the incorporated datasets with the goal of preserving variables that were gathered frequently in the various studies and that are most relevant to the study of Alaskan tundra vegetation and active-layer properties. In addition to the field data variables, data descriptors and wildfire-related variables were added to our database. The data descriptors include the assigned plot ID, dataset ID, dataset name, latitude, longitude, date of collection, and year of collection. For each data point, the dataset ID and name link it to its original dataset. These variables were added to facilitate the use of our database and also to allow the users to be able to trace the original datasets when such a need arises. The geospatial and remote-sensing-based wildfire-related variables were added to link data points to the known wildfire history at each point (since wildfire plays a critical role in affecting the aboveground and belowground conditions of tundra ecosystems). In total, 34 variables are contained in SATFiD (Table 1). Ground-based burn severity variables are not included in this database as their collection methods were inconsistent across the datasets, including various qualitative or quantitative measures of severity that could not be reconciled into a single variable.
Table 1List of data variables included in SATFiD. Fire history attributes are sampled from the Alaska Large Fire Database (ALFD) (Alaska Large Fire Database | FRAMES, 2022), and dNBR is sampled from the Landsat-derived Burn Scar dNBR dataset (Loboda et al., 2018).
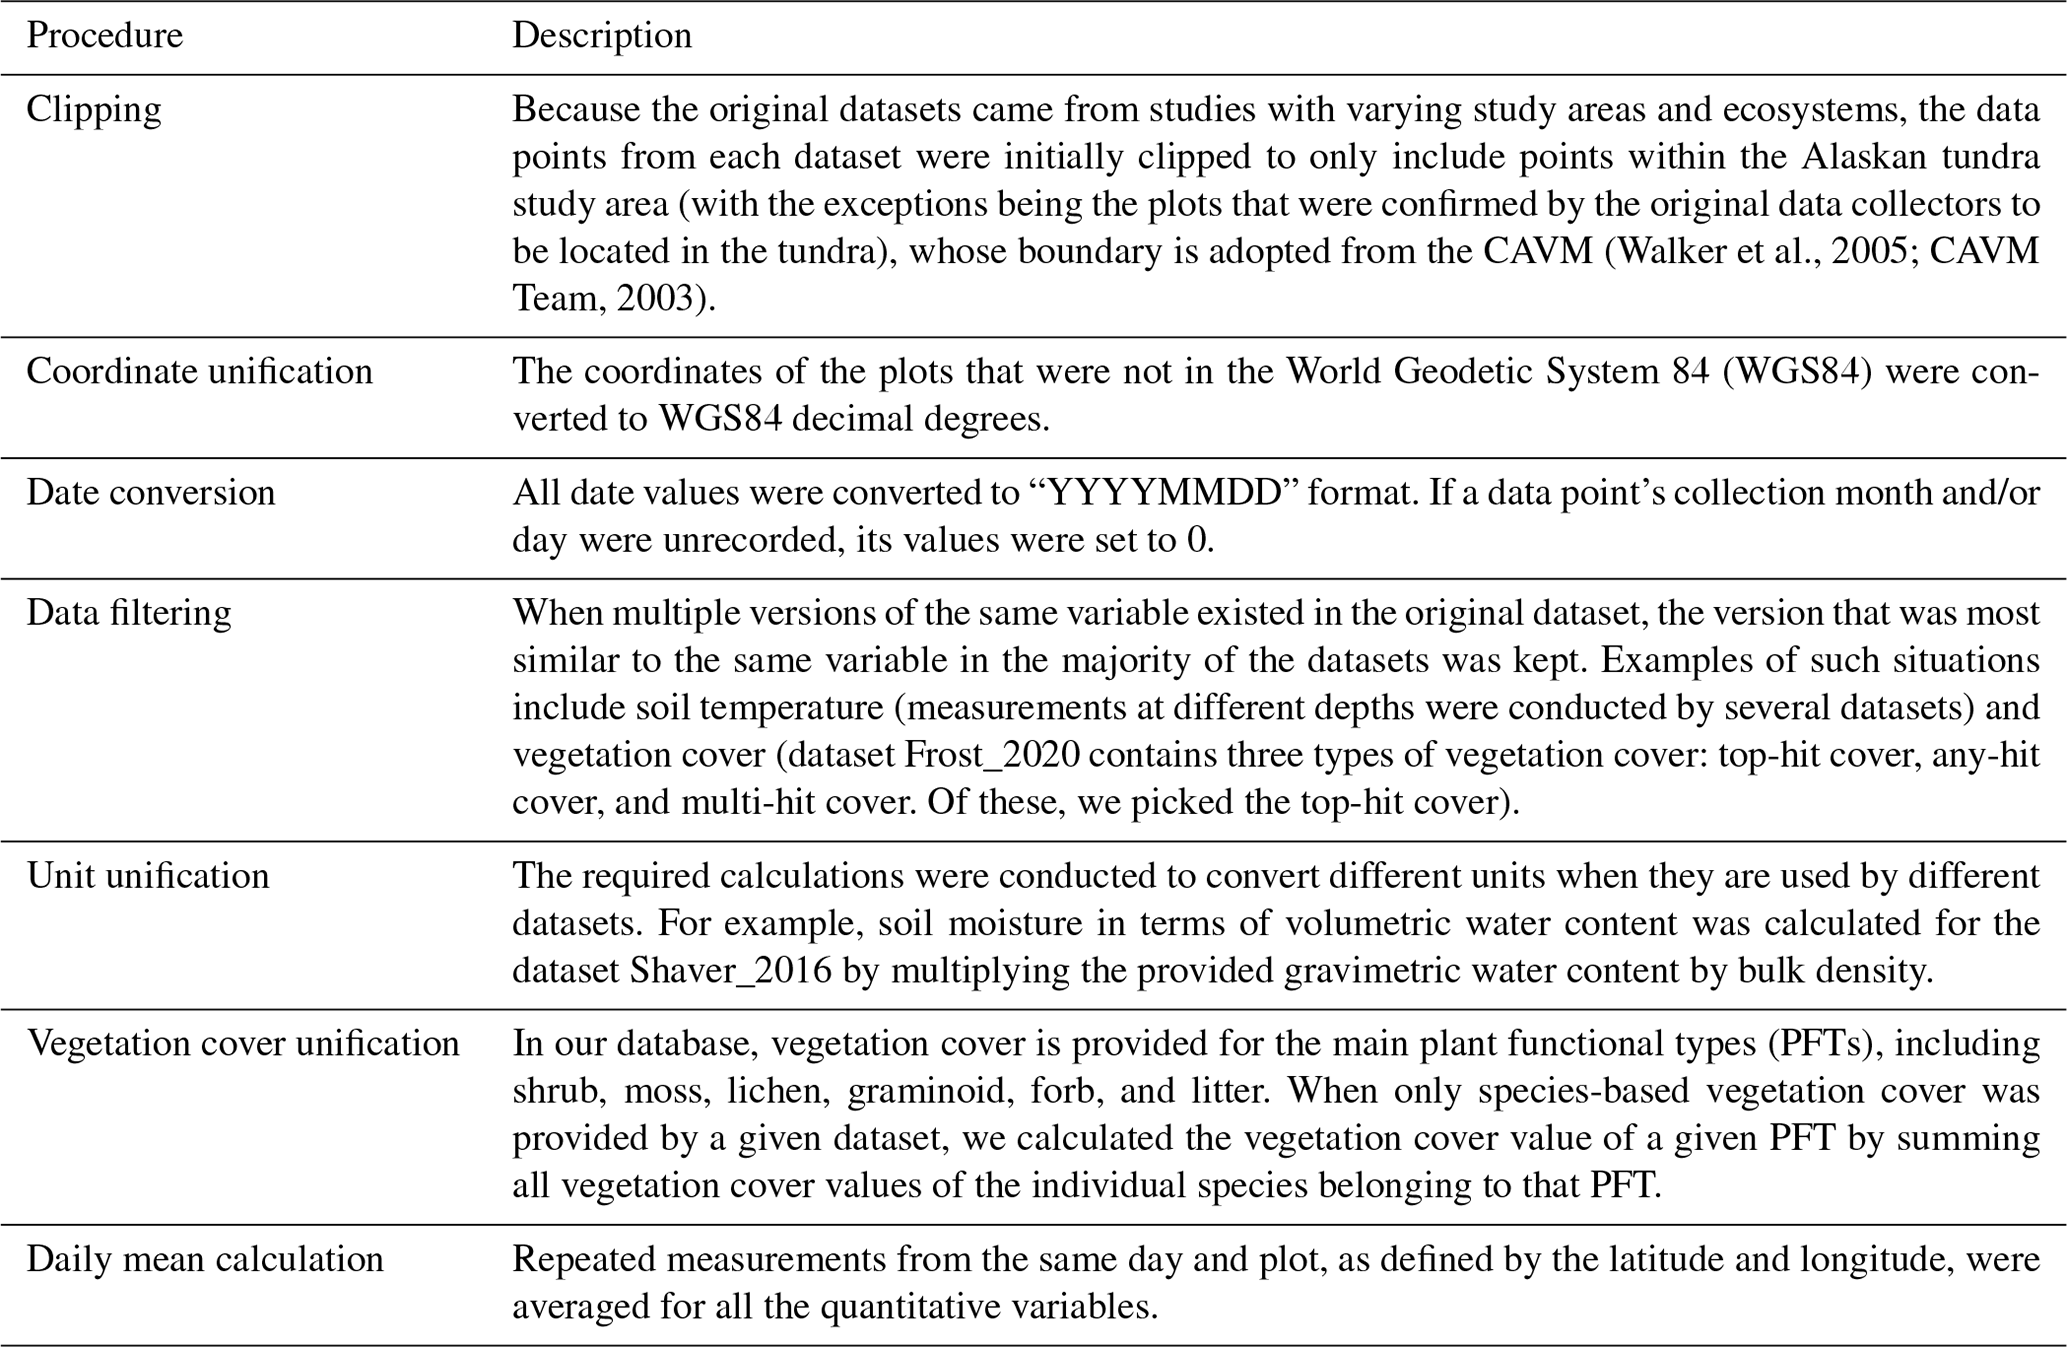
3.3 Data standardization and cleaning
Multiple types of data standardization were implemented to reconcile the incorporated datasets. These standardization decisions are listed in Table 2.
3.4 Fire history and severity sampling
3.4.1 Sampling fire history data from the Alaska Large Fire Database (1940–2021)
The Alaska Large Fire Database (ALFD) is the longest and most comprehensive spatially explicit record of fire history in Alaska. Particularly for the tundra, where fire is historically scarce, the ALFD is useful for capturing relatively small fire scars compared to the larger scars found in the neighboring boreal forests, making it a useful tool for identifying fire history at a fine spatial scale. Fires in the ALFD are defined as fires of at least 1000 acres (405 ha) in area, but the spatial resolution improves dramatically through the record, with fires of down to 10 acres (4 ha) included by 2015. Please see the “Uncertainty” section (Sect. 5.2) for a more detailed breakdown of how the ALFD defines large fires and a discussion of the implications.
We used the ALFD to sample the fire history data for each individual data point. Eight fire-related variables were added by sampling fire history polygons that data points intersected. Approximately 17 % of the data points in this database were sampled at locations that fell within ALFD fire perimeters (Fig. 3). If a point was within a fire polygon from before the data sampling date, the point was labeled “Burned” in the BURNED_STATUS field. FREQ_PRE is the total count of past fire polygons that a data point intersects. YR_LFIRE is the year of the most recent fire prior to a data point being sampled. N_YR_LFIRE is the year of data collection minus the year of the most recent past fire. ALL_FIRE_YRS is a list of fire years for all fire polygons intersected by a data point. YR_NFIRE represents the year of the most recent fire after a data point is sampled. N_YR_NFIRE is the year of the next fire minus the year of data collection. FREQ_TOTAL is a count of the years in ALL_FIRE_YRS, representing the total number of fire polygons intersected by a data point. Our database currently extends to 2020 and samples the fire history data from the 2021 updated version of the ALFD, but several large tundra fires have occurred since then. These will be incorporated along with additional field datasets into future versions of the database.
3.4.2 Sampling fire severity data from the Landsat-derived Burn Scar differenced normalized burn ratio (dNBR) dataset (1985–2015)
A dNBR attribute was sampled for data points from the Landsat-derived Burn Scar dNBR dataset (Loboda et al., 2018). Rasters covering the tundra region of the Arctic-Boreal Vulnerability Experiment (ABoVE) domain were mosaicked for each unique fire year associated with the data points. For each burned point, a dNBR value from the mosaicked raster was sampled if available. The values were then filtered to remove values of −3000, which represents no data, and −2500, which indicates invalid pixels due to factors such as cloud cover.
4.1 Database overview
SATFiD synthesizes 197 830 individual data points gathered from 37 datasets. The data span the North Slope, Noatak, Seward Peninsula, and Southwest Alaska subregions of the Alaskan tundra. A large cluster of points can be seen in the North Slope in the area of the 2007 Anaktuvuk River Fire scar, which is a notable study point for tundra fire research, as well as in the continuous north–south transect along the Dalton Highway. Seventeen clustered data points in the Seward Peninsula subregion from Jandt_1995 fall outside the CAVM definition of tundra. These are data from the Bureau of Land Management (BLM) and have been confirmed as tundra points (Fig. 1).
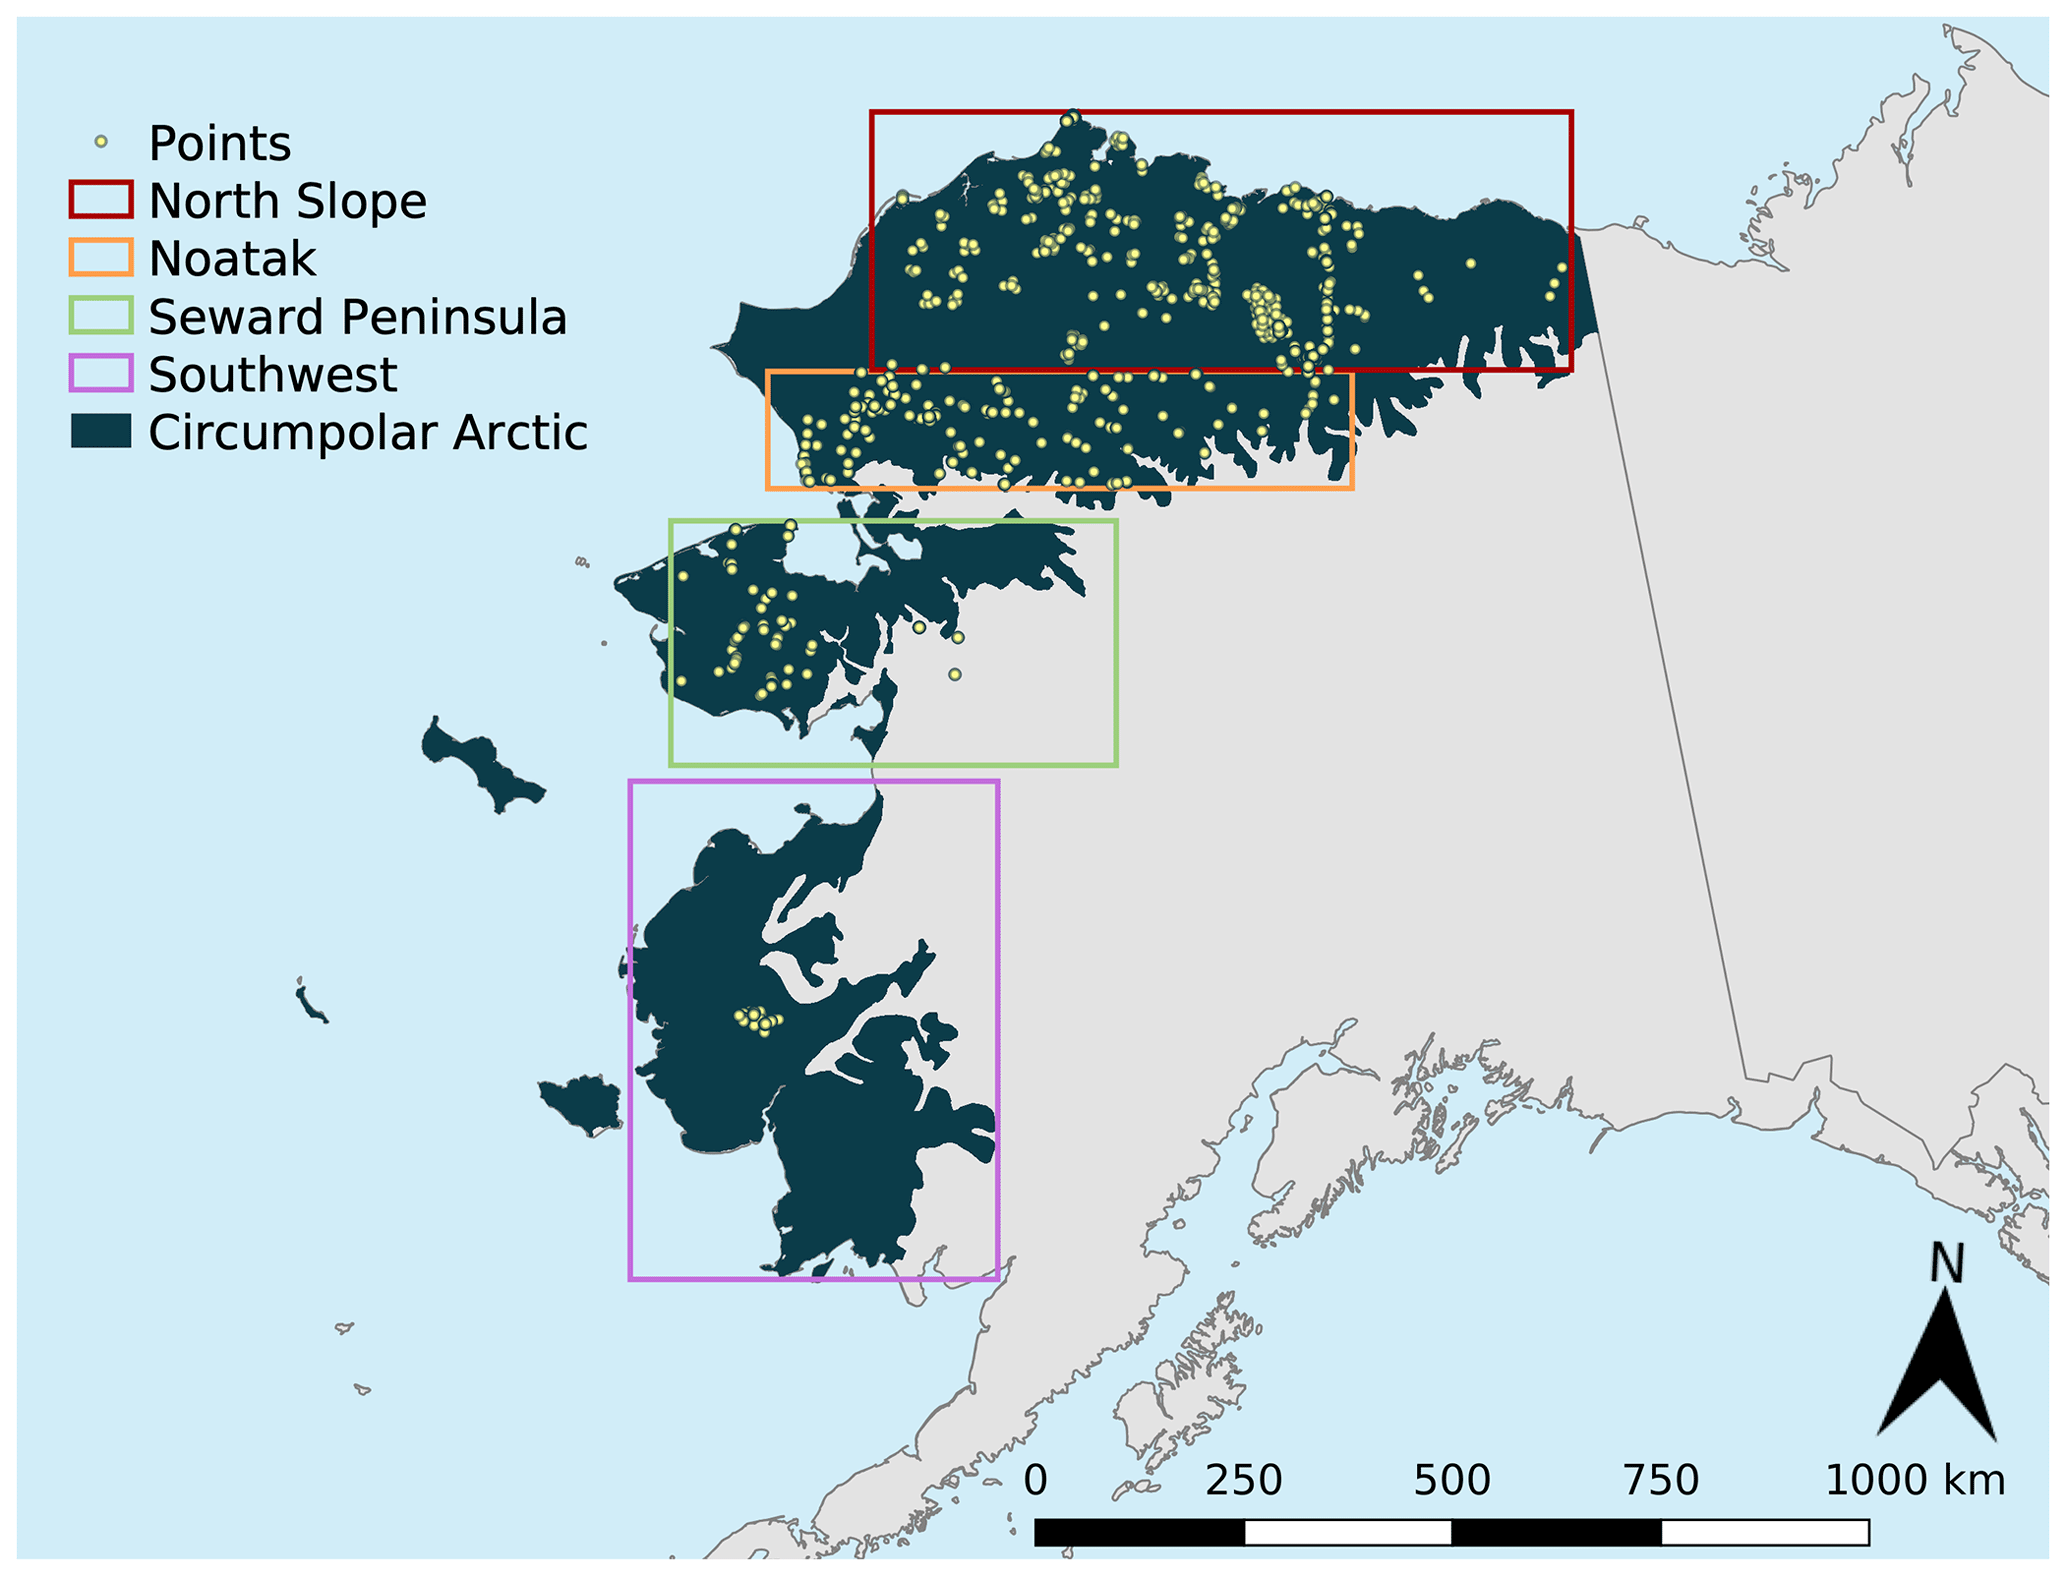
Figure 1Map of all points from 1940 through 2021 on top of the circumpolar Arctic as defined in the CAVM, clipped to the state of Alaska; 17 of the data points lie outside the CAVM definition of tundra. These points were sampled by the BLM and are tundra points. The colored reference boxes indicate the locations of points within the circumpolar Arctic and are used to define the regions for this study.
We note that each dataset has unique variables sampled and total numbers of data points. Many variables are measured across multiple datasets, with the most frequently sampled variable across the studies being shrub cover, which can be found in 23 datasets. Second in greatest coverage across the datasets are lichen cover and active-layer thickness, which appear in 22 datasets (Fig. 2, Table 3). The active-layer thickness variable is dominated by the Schaefer_2021 dataset, which has 192 483 data points, making up 98.6 % of active-layer thickness measurements and 97.3 % of the data points in the database. It is very important to note however that, despite the large number of data points, the Schaefer_2021 dataset only includes measurements of active-layer thicknesses and a relatively small number of soil moisture measurements (4892 points); hence, this dataset is not overrepresented in our synthesis and in fact does not contribute any other field-collected variable in this synthesis.
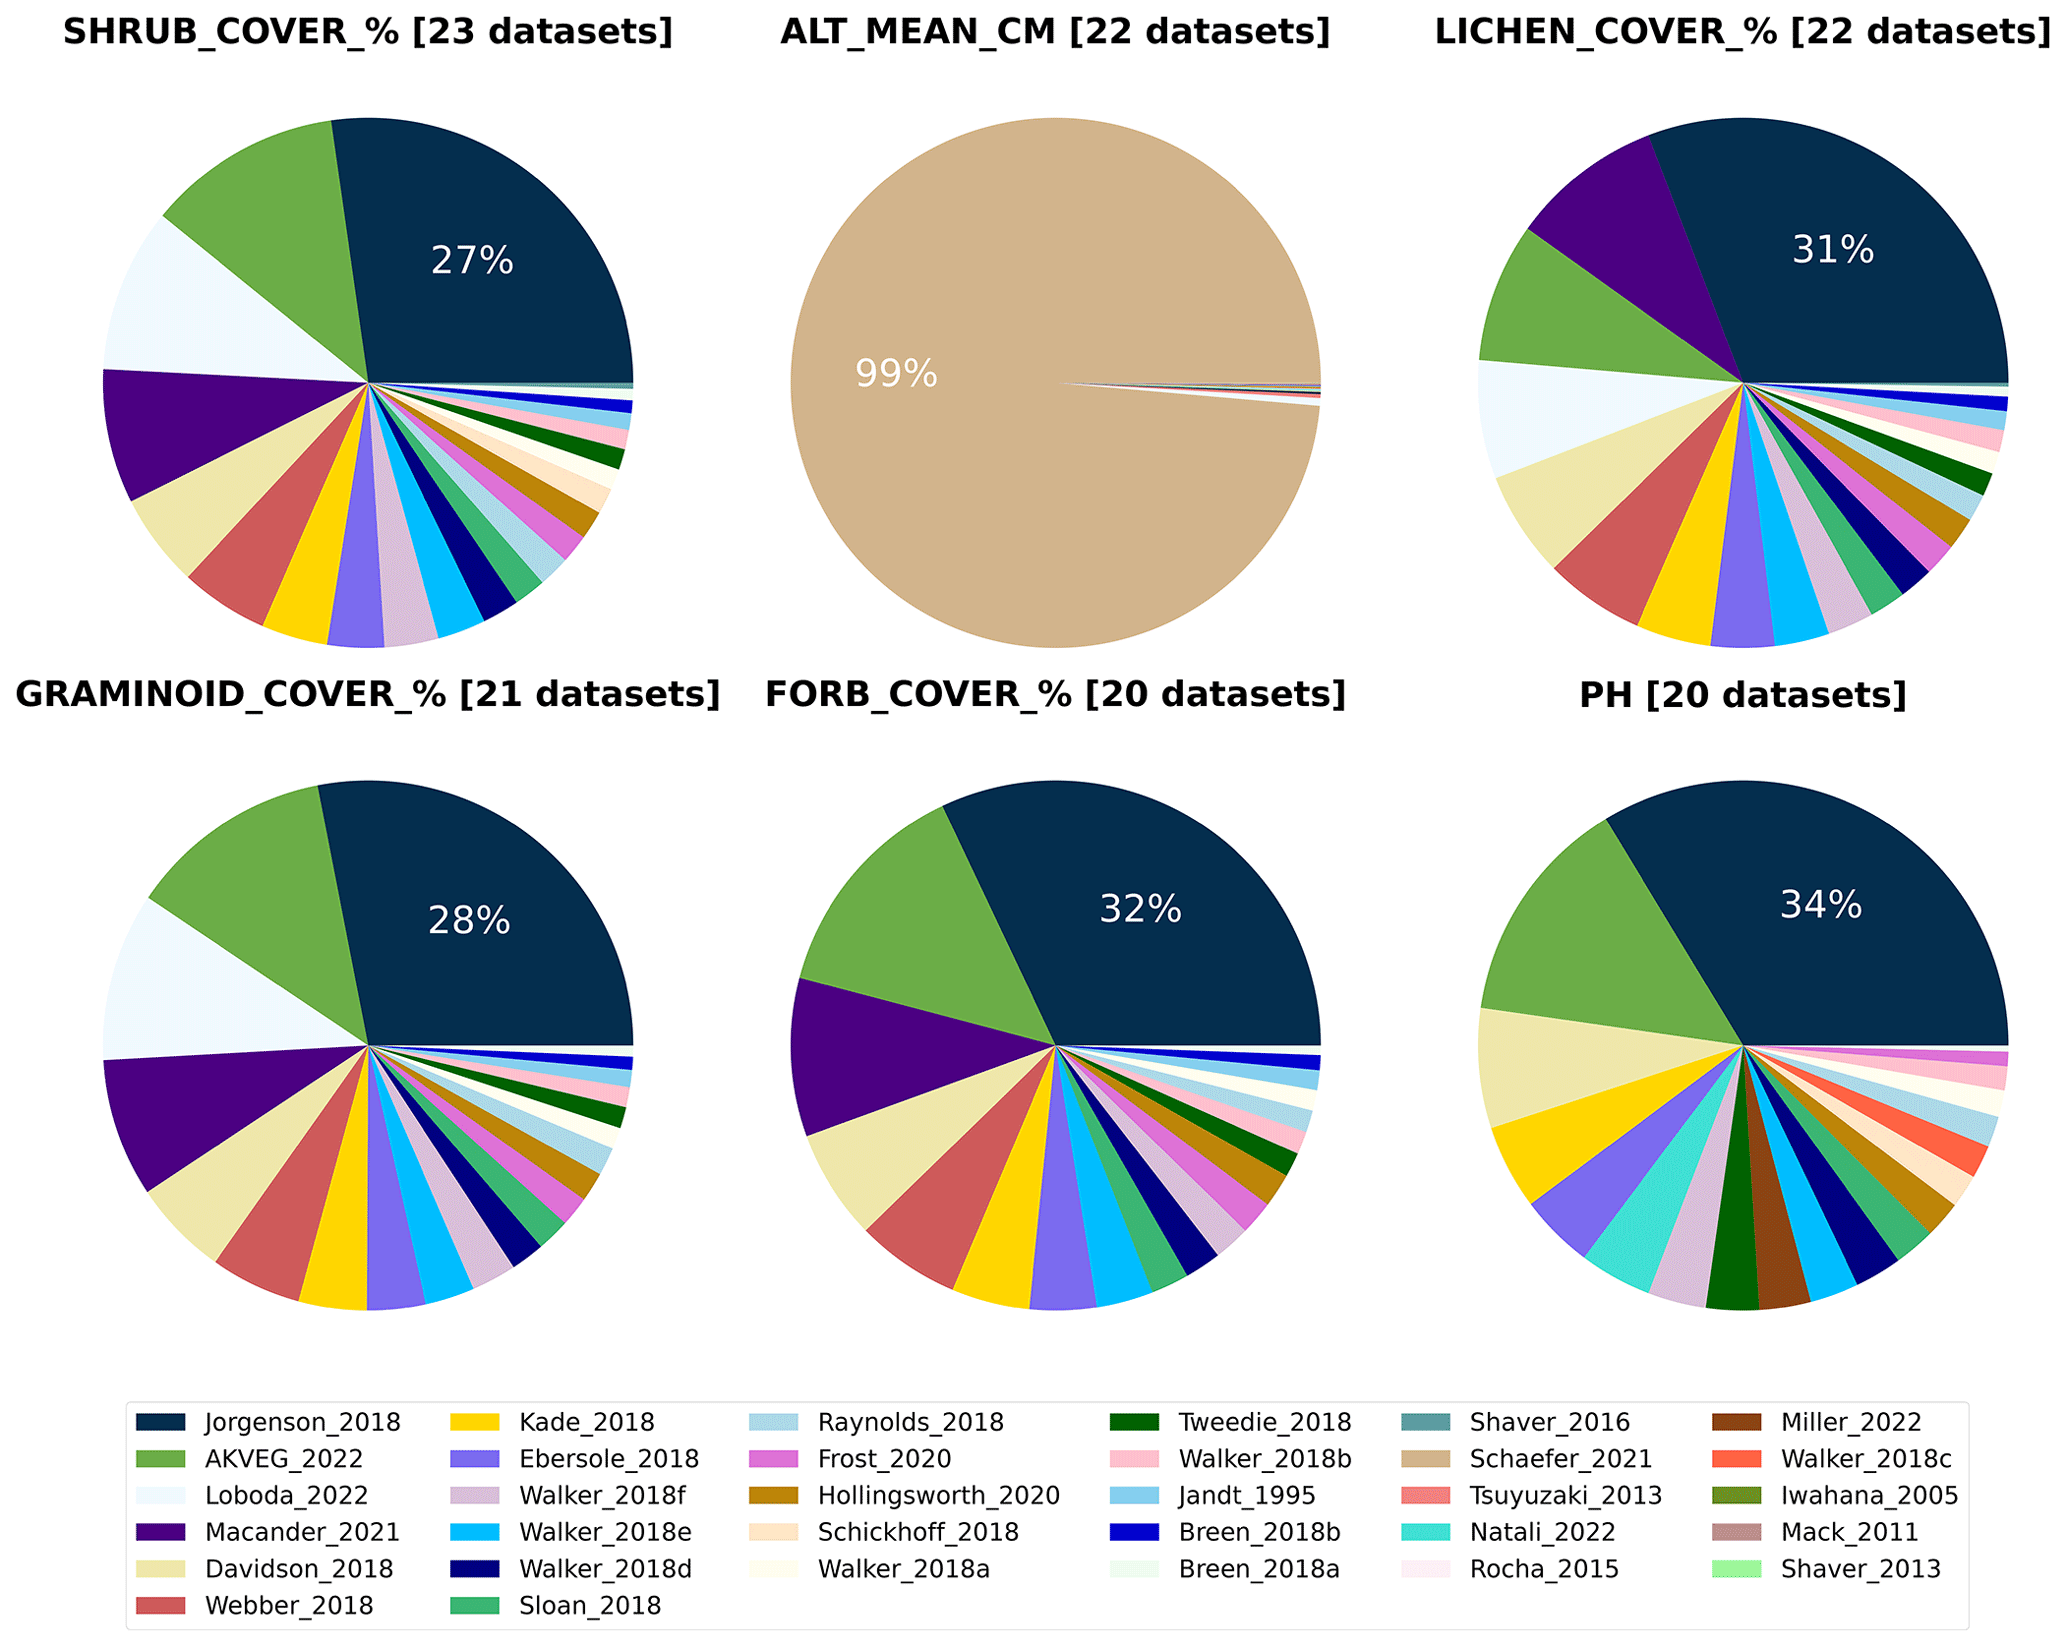
Figure 2Pie charts showing the distribution of how many data points each dataset contributes to the six field-collected variables that appear the most across datasets. The top-center pie chart indicates that the Schaefer_2021 dataset contributed overwhelmingly to the active-layer thickness data, but, as the neighboring pie charts demonstrate, data for other variables are more evenly distributed across the datasets.
Table 3Field-based and fire-related variables by the number of datasets and data points they appear in.
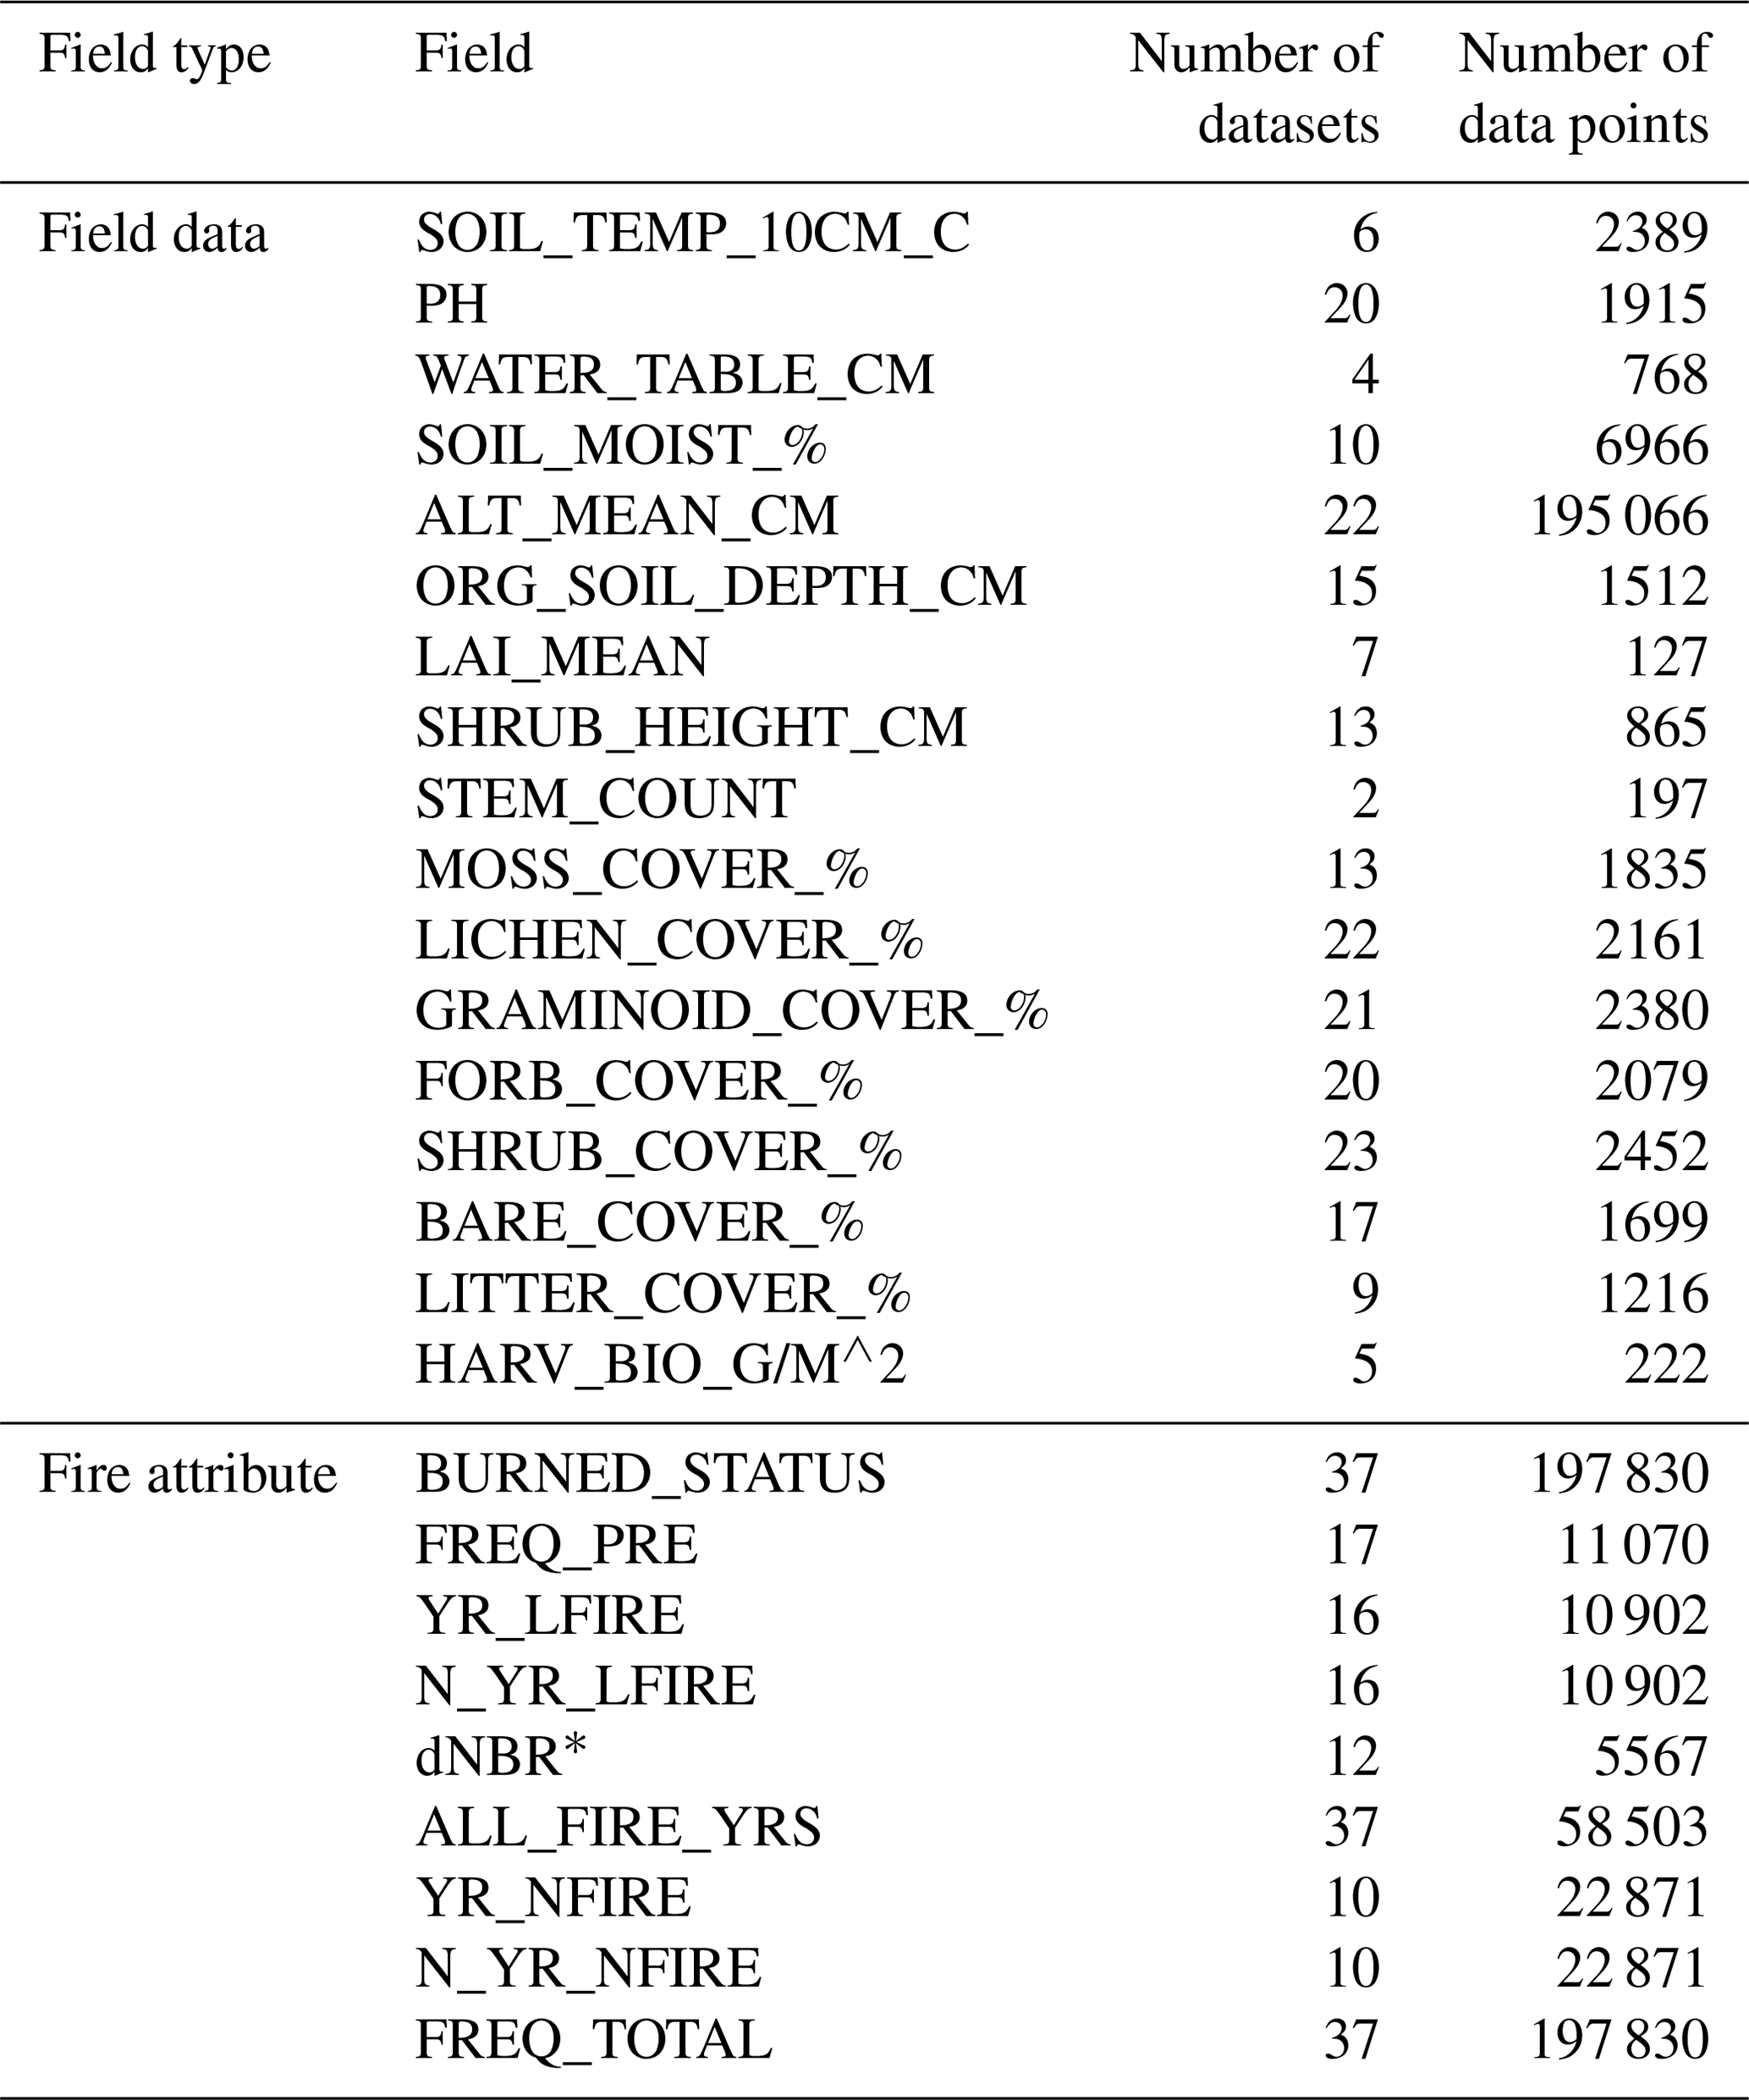
* Extracted from intersected 30 m pixels in the Landsat-derived Burn Scar dNBR dataset (Loboda et al., 2018).
4.2 Descriptive analysis of data by fire attributes
The fire history information from the ALFD allows for the database to be grouped by whether and when points fell within fire perimeters. If a point in a fire perimeter was sampled after the fire, it can be labeled “post-fire”, and if the point was sampled before the fire, it can be labeled “pre-fire”. In the following figures, we define points that are in fire perimeters from years before and after sampling as pre-fire and post-fire, respectively. Of course, analysis using different grouping methods may be equally if not more interesting to pursue, depending on the field of interest. What we present here is one of many ways to explore the data.
Of the data points, 83 % or 164 118 in total came from points that did not have any fire history since 1940 according to the ALFD. These are considered “unburned” in the recent recorded fire history, although they could have been burned prior to 1940. Of the burned points, 10 847 were sampled post-fire and 22 865 were sampled pre-fire (Fig. 3a). A parallel plot showing the distribution after excluding the Schaefer_2021 dataset of mostly active-layer thickness measurements is presented for comparison (Fig. 3b). Within this subset, points with fire history make up 46 % of the data points.
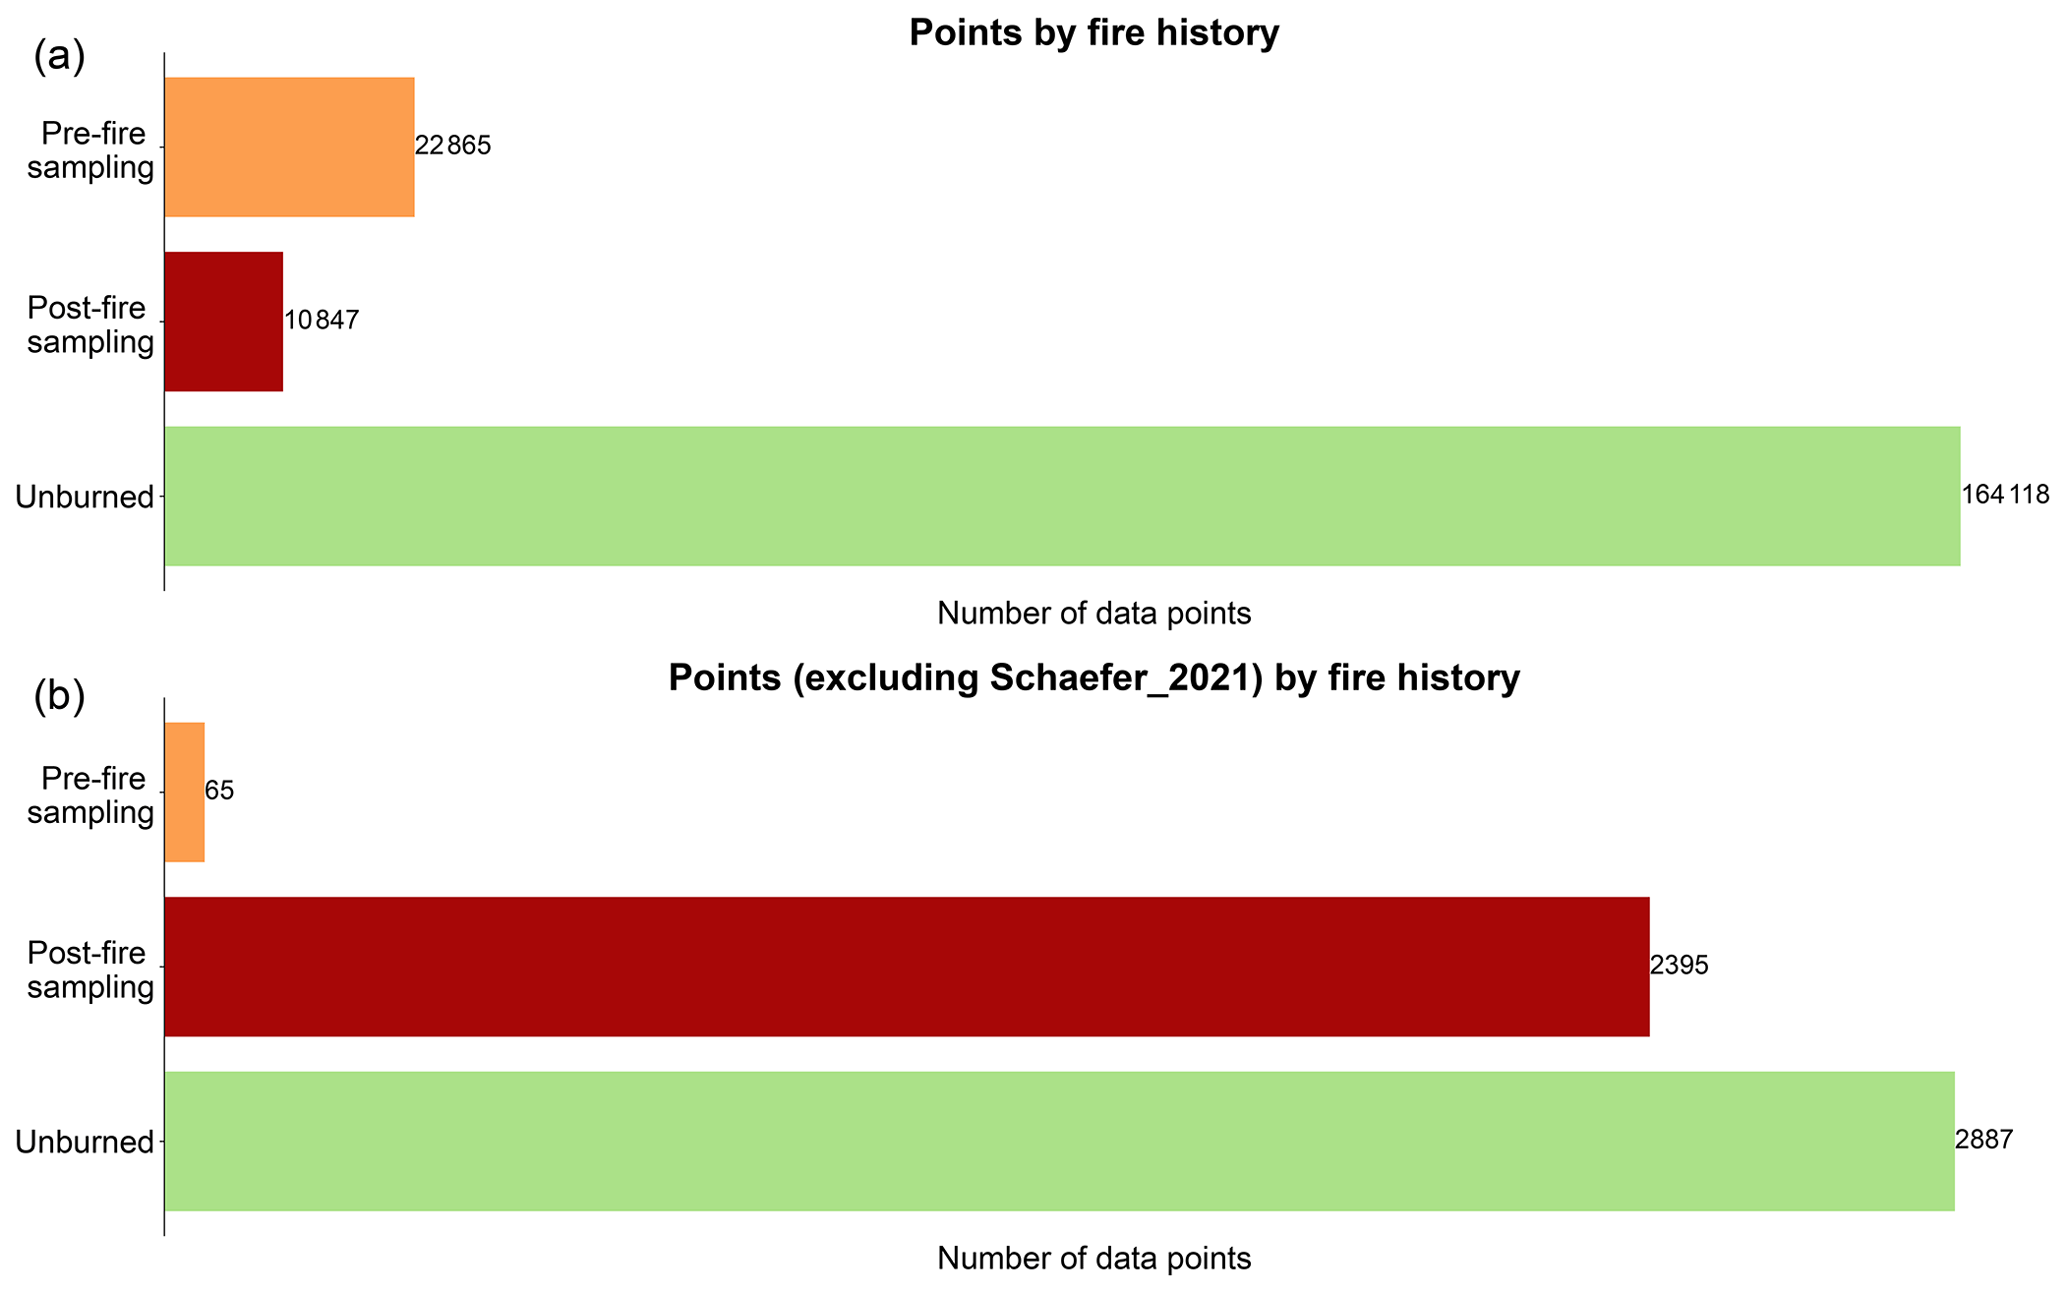
Figure 3(a) Data sorted by whether and when the point was burned relative to sampling using fire perimeters from the ALFD. (b) Data excluding the Schaefer_2021 dataset sorted by whether and when the point was burned relative to sampling using fire perimeters from the ALFD.
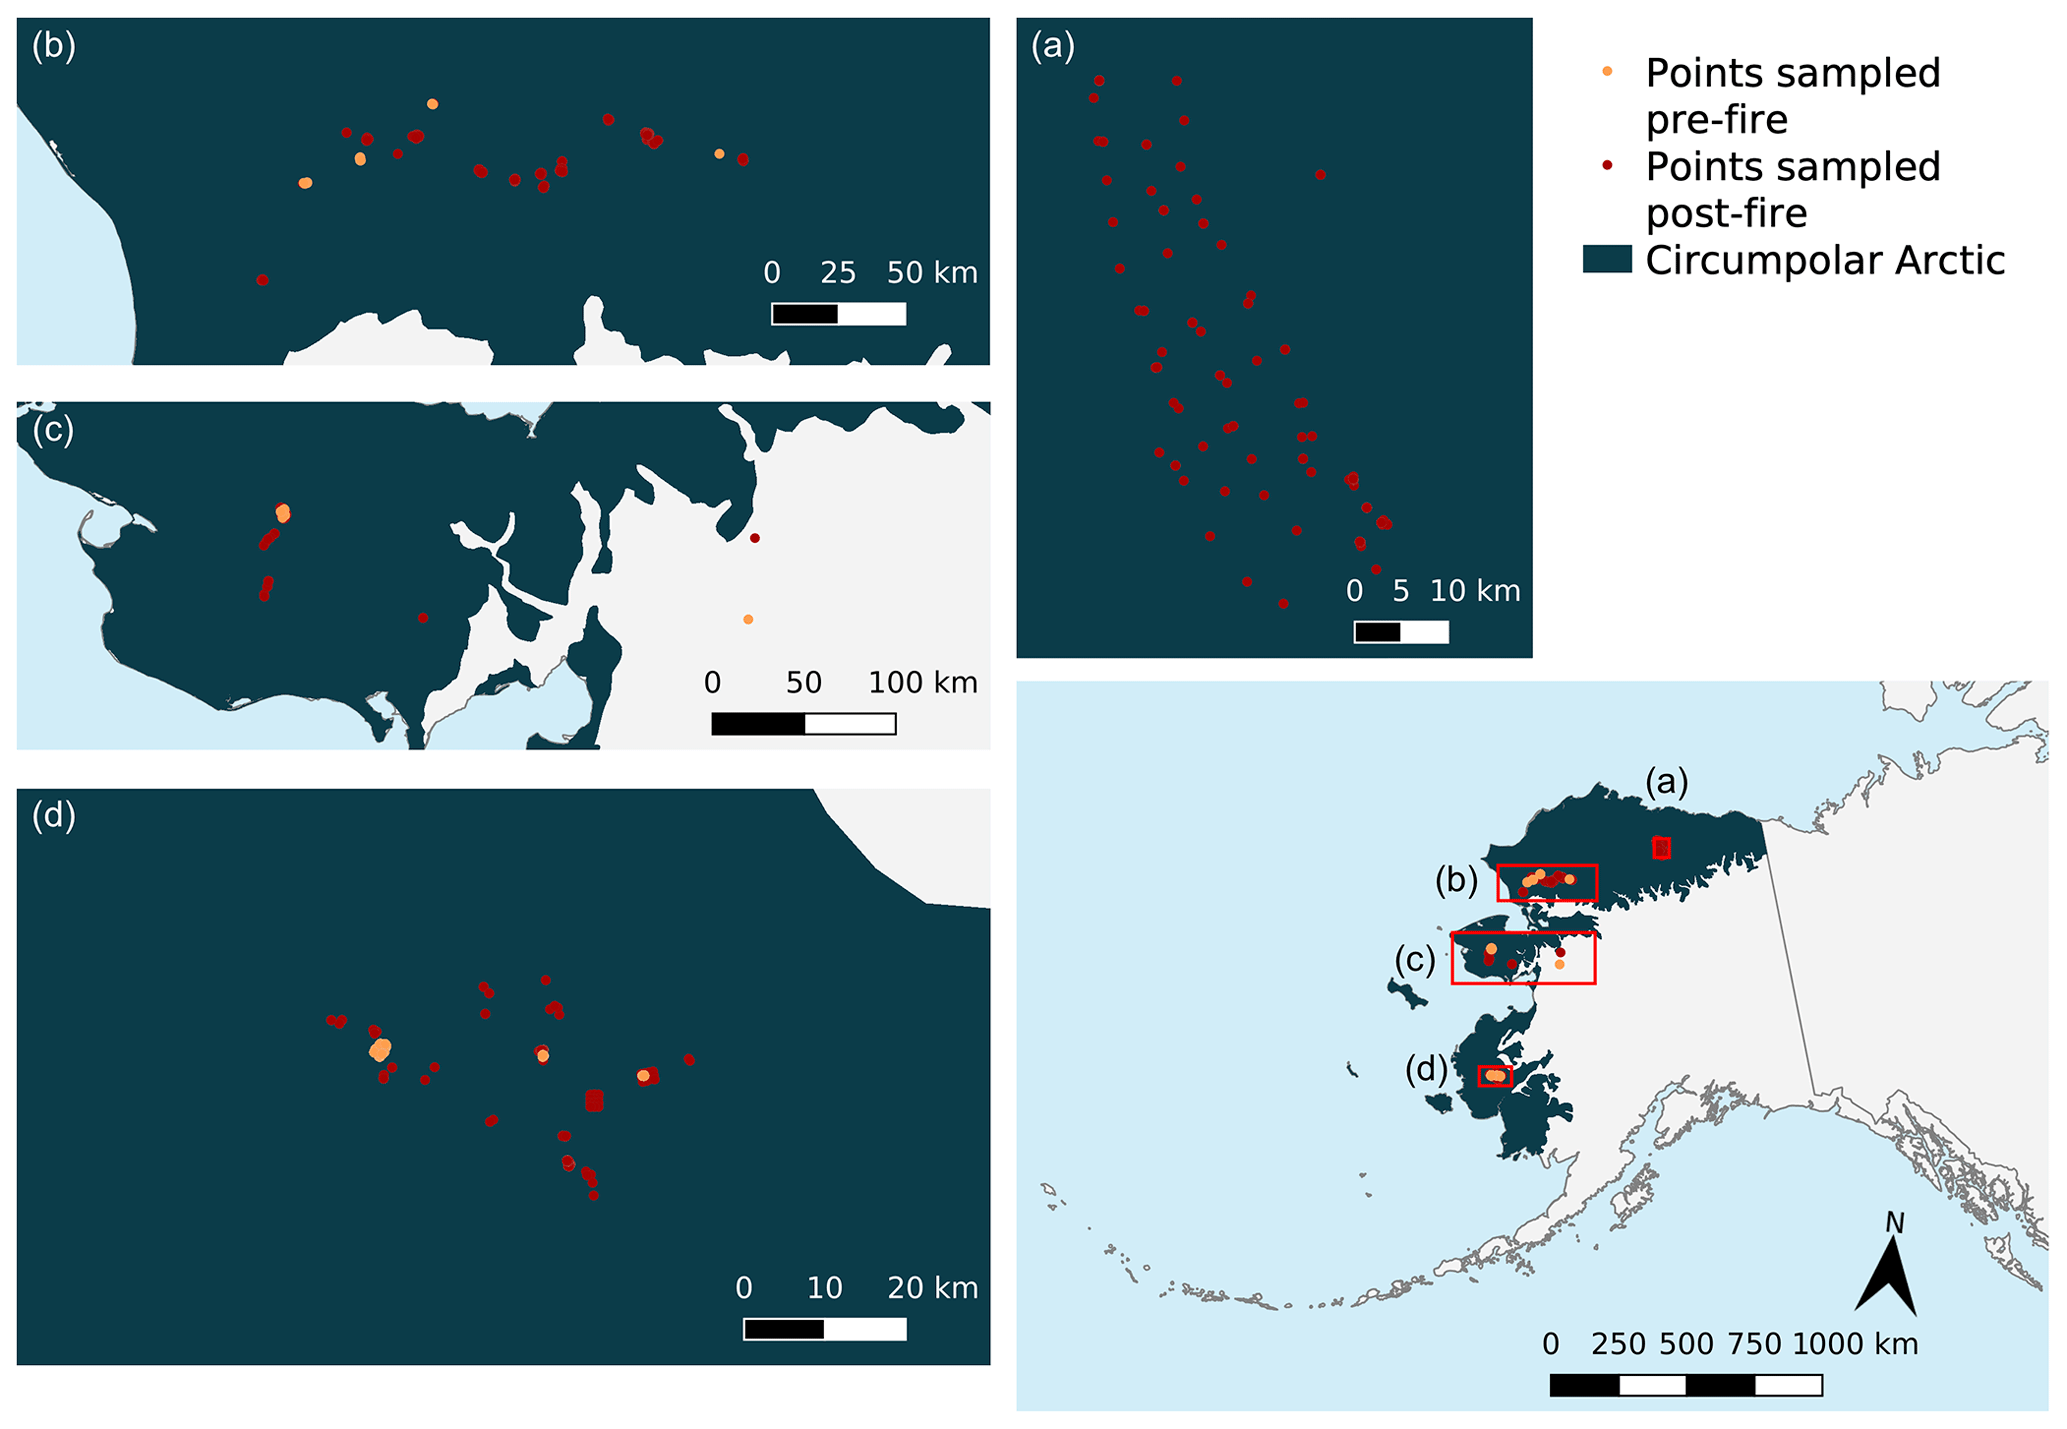
Figure 4Fire history for data points by subregion. Insets (a)–(d) show points with fire history in the (a) North Slope, (b) Noatak, (c) Seward Peninsula, and (d) Southwest Alaska. Several clustered data points in panel (c) lie outside the CAVM definition of tundra. These points were sampled by the BLM and are tundra points.
Points with fire history also varied by when they were sampled relative to the year of the most recent fire and how many times it had burned from 1940 to 2021. Of the points that were sampled pre-fire, almost all fires occurred within 1 decade after sampling. In fact, only eight points fell in the 10–19 years-since-sampling bin (Fig. 5a). Of the points sampled post-fire, the greatest number of points (5539 points) was sampled within the second decade post-fire, followed by the third decade and then the first decade post-fire. Still, there were over 100 points across five datasets sampled 30 or more years post-fire (Fig. 5c). For points sampled before and after the most recent fire, most had only one fire occurrence between 1940 and 2021. The number of data points falls exponentially for points burned more than once. There are, however, points that have up to 4 years of recorded fire for both points that were sampled before and after the most recent fire (Fig. 5b, d).
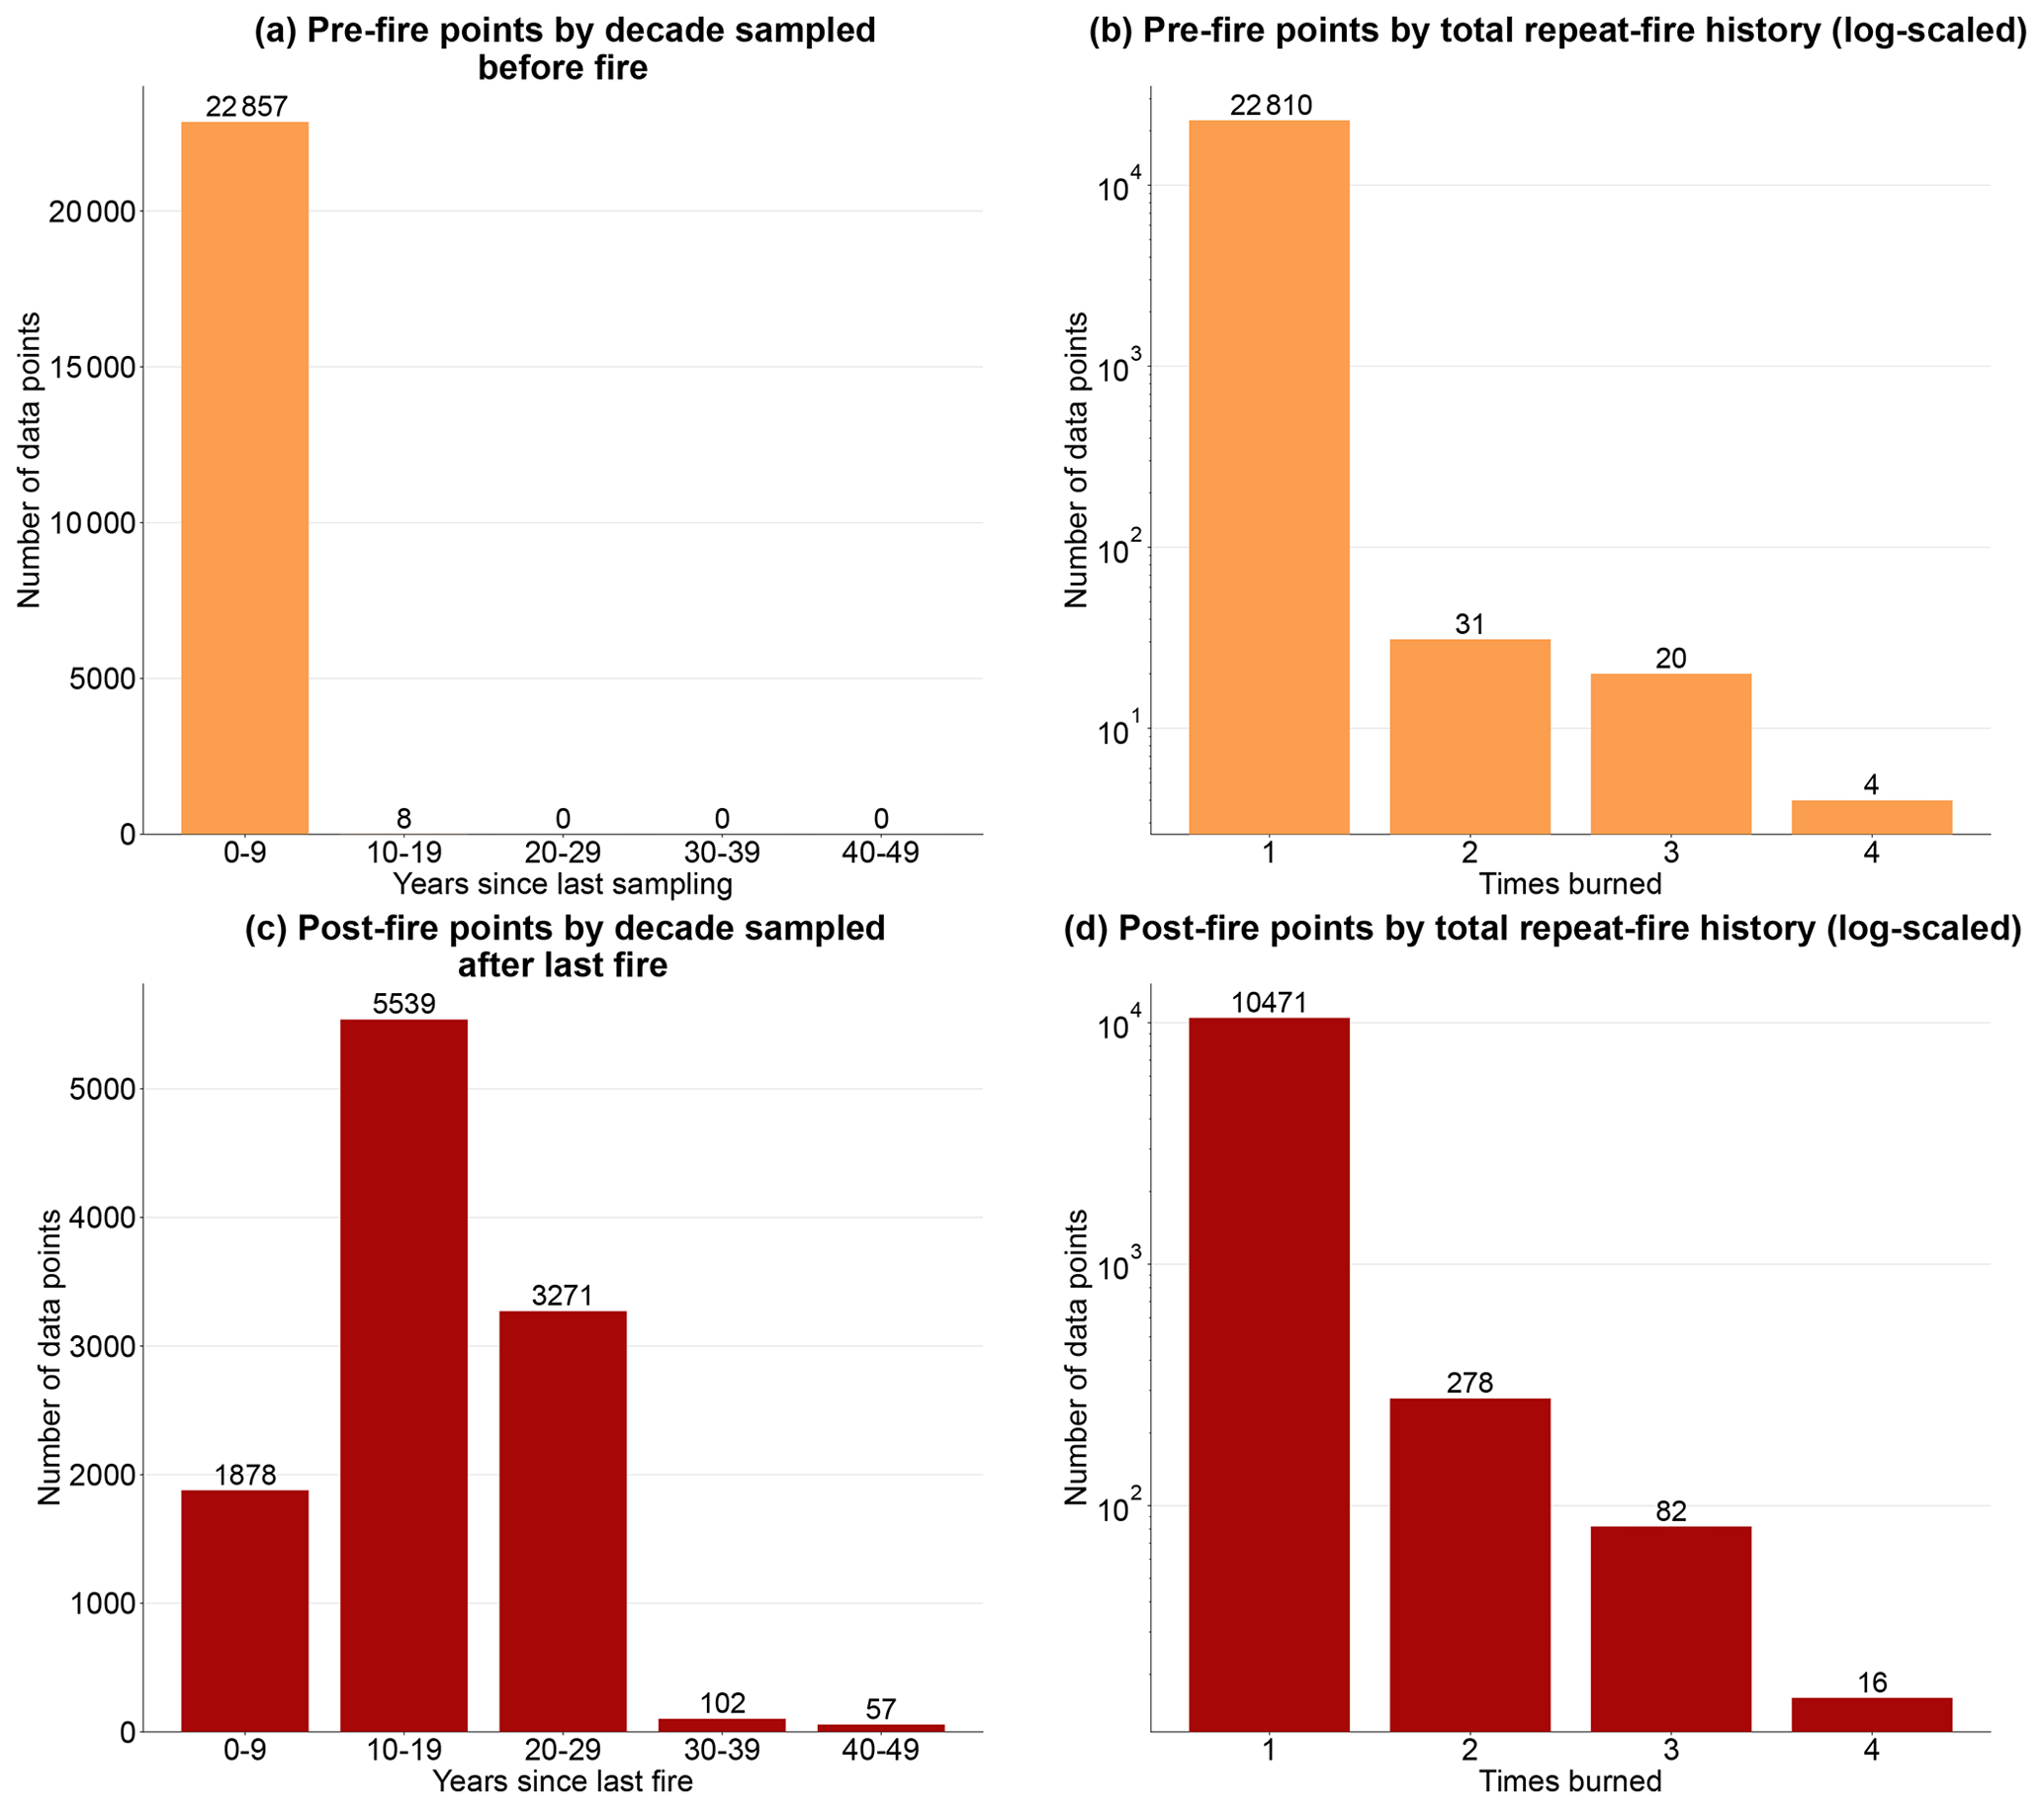
Figure 5(a) Points sampled before the most recent fire binned by the years between sampling and fire disturbance, (b) points sampled before the most recent fire binned by the number of times burned, (c) points sampled after the most recent fire binned by the years between the last fire and the sampling date, and (d) points sampled after the most recent fire binned by the number of times burned.
Table 4 summarizes the datasets within each subregion and their fire history. The greatest number of burned points, sampled both before and after fire appeared in Southwest Alaska, are largely from the Schaefer_2021 dataset. The Seward Peninsula subregion, on the other hand, contains the largest number of datasets with fire history. The Noatak subregion has the greatest number of fire years represented in this database, with 17 unique fire years, 14 of them included for points within the Loboda_2022 dataset. All fire data from the North Slope, with the exception of some points from a 2017 fire in the Miller_2022 dataset, are from the 2007 Anaktuvuk River Fire (Fig. 4; Table 4).
Table 4Fire history for points from the ALFD by subregion and dataset. The dataset name follows the convention of “Name_Year”, where “Name” indicates the names of the principal investigators and “Year” indicates the years of data release. If the original dataset has not been released publicly, the year of data acquisition is used.
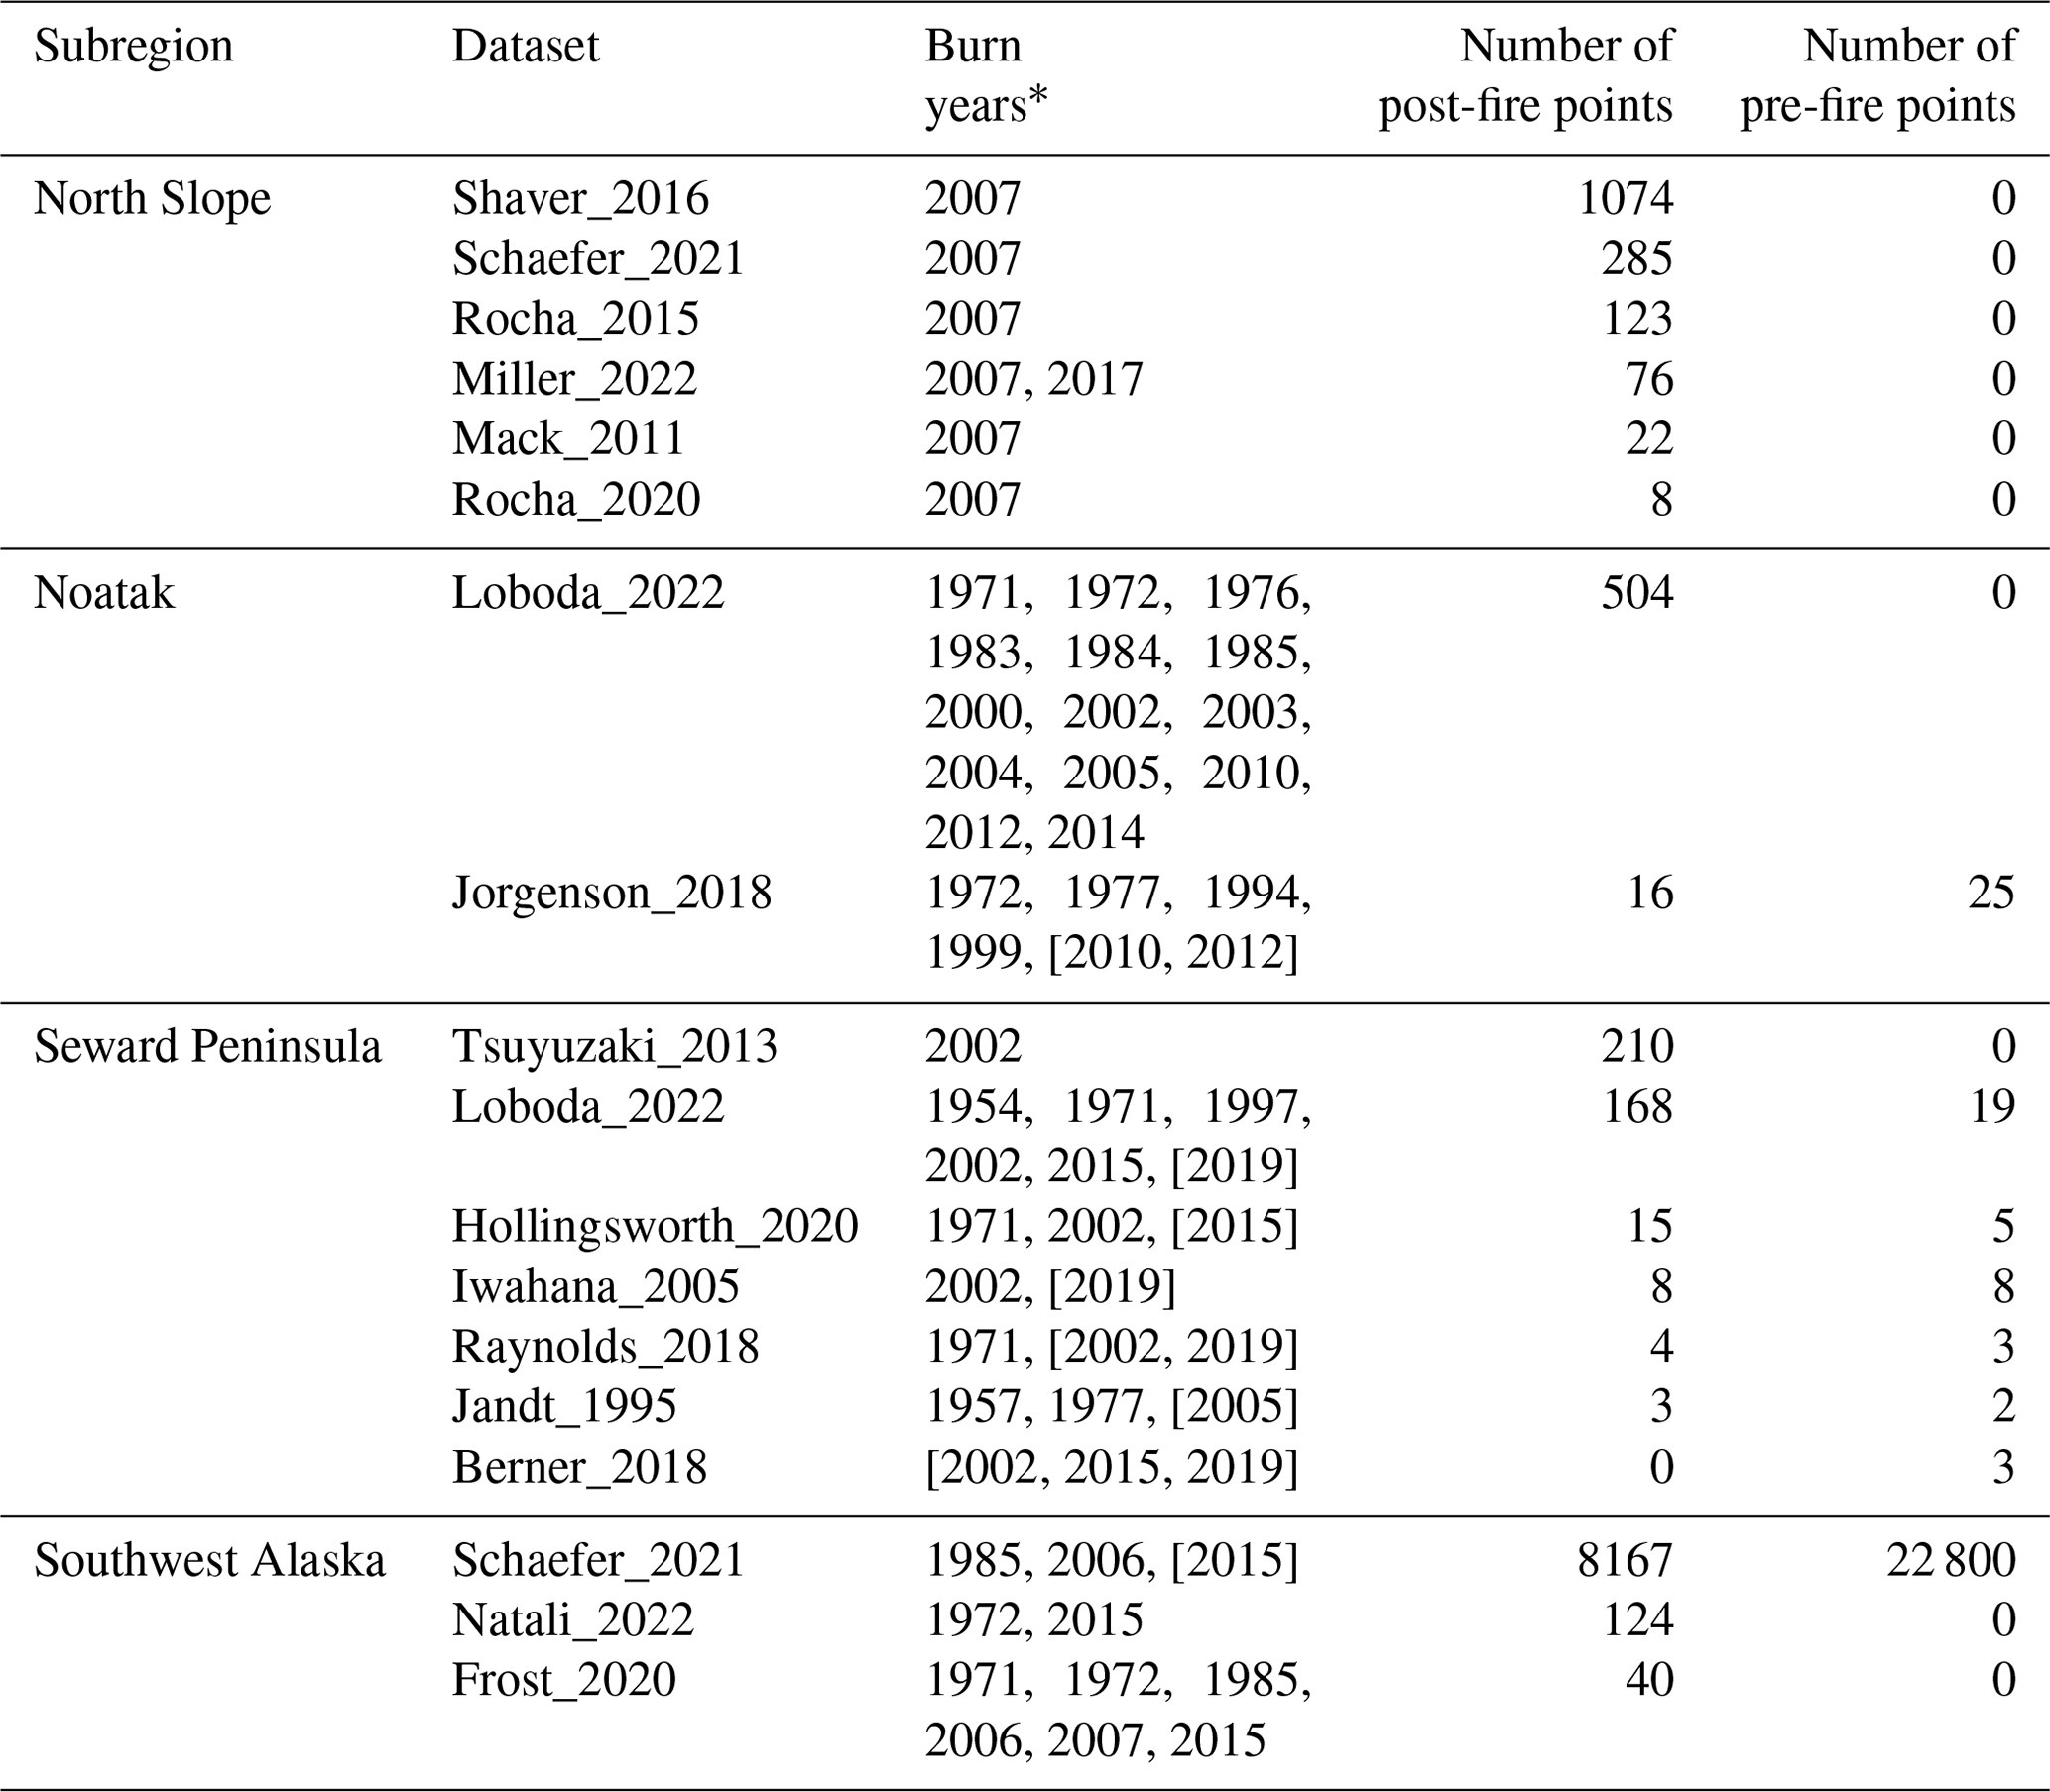
* Burned points sampled pre-fire appear in square brackets ([]).
5.1 Scientific implications
SATFiD represents the first attempt we know of to compile the field datasets of vegetation, active-layer properties, and fire history collected in different parts of the Alaskan tundra and reconcile them into a consistent database. As such, it offers the largest collection of Alaskan tundra field data accessible in one place. It spans both a large temporal extent of 49 years and a spatial extent, with over 1000 data points coming from each of the four subregions of the Alaskan tundra.
The descriptive analyses provided here provide examples of and a starting point for exploring the database and its coverage of various variables, both spatially and temporally. With this rich resource of in situ measurements, we encourage future investigators to identify potential research applications and questions that can be asked with this database. Possibilities may involve relating soil variables and vegetation cover to fire history. Studies could look at patterns or differences over spatial extents or between different subregions. They might also consider patterns or trends over time. Researchers could also leverage the database as a training point for remote-sensing-based, spatially explicit, physical, or process-based modeling. Variables such as vegetation cover and soil variables such as soil moisture, soil temperature, and active-layer thickness could potentially feed into these models.
Another benefit and potential use of this synthesized database is discovering opportunities for future research. One aspect of field studies in the Alaskan tundra that we found while compiling the database is that revisits and repeat observations over many years are lacking, likely due in part to the difficulty in accessing the regions where the initial studies took place and in limitations placed by government funding, which generally favors short-term (3- to 4-year) studies. As the climate, soil, and vegetation features of the tundra transform, it will be opportune to revisit points in this database in order to measure changes and trends over time. The descriptive analysis we conducted also indicates that a large number of points were burned in the years after field sampling took place, which we have called “pre-fire” points (Fig. 3). These points can be examined by subregion (Fig. 4, Table 4), and information on the number of times burned and how many years have passed between the sampling and fire occurrence can be found in the database (Figs. 5, 6). Selecting and revisiting these points based on this fire history information could form the basis for studies on pre-fire and post-fire analyses of change. SATFiD can also inform future research by providing a broad-scale idea of which variables could be of interest and what the common methods used to measure them are. This could be a step leading towards greater standardization in the variables measured and the techniques used, which would strengthen future sampling and synthesis research efforts.
Although there are a large number of points dispersed throughout the four subregions of the Alaskan tundra, the map of the 197 830 unique data points in SATFiD also demonstrates strong geographic clustering. This makes intuitive sense as in situ studies of this remote region are challenging, and investigators typically collect a large number of data within their relatively small, accessible study areas. Based on this database, future researchers can also identify areas that have not been sampled before, that may be interesting for ecological reasons, and that can fill gaps in data availability and knowledge of the various conditions in the heterogeneous tundra landscape. There are also many areas within fire extents defined by the ALFD that have not been sampled by any datasets incorporated into this database and that could be sites of fire-related field studies.
Additionally, we intend to keep SATFiD updated biennially to include newly acquired field data in the Alaskan tundra, allowing further expansion of SATFiD's utility in studies of long-term changes in the tundra. To that end, we will actively seek funding to support the future updates.
5.2 Uncertainty
The datasets incorporated into SATFiD originate from a variety of research efforts led by different principal investigators and span 5 decades of field sampling. This leads to large variances in both the documentation and methods employed for sampling. Often, the same variable or a similar variable is measured slightly differently between datasets. These differences produce uncertainties that can propagate and influence results in unpredictable ways when conducting synthesis studies with these data, and they represent an important consideration for any synthesis work.
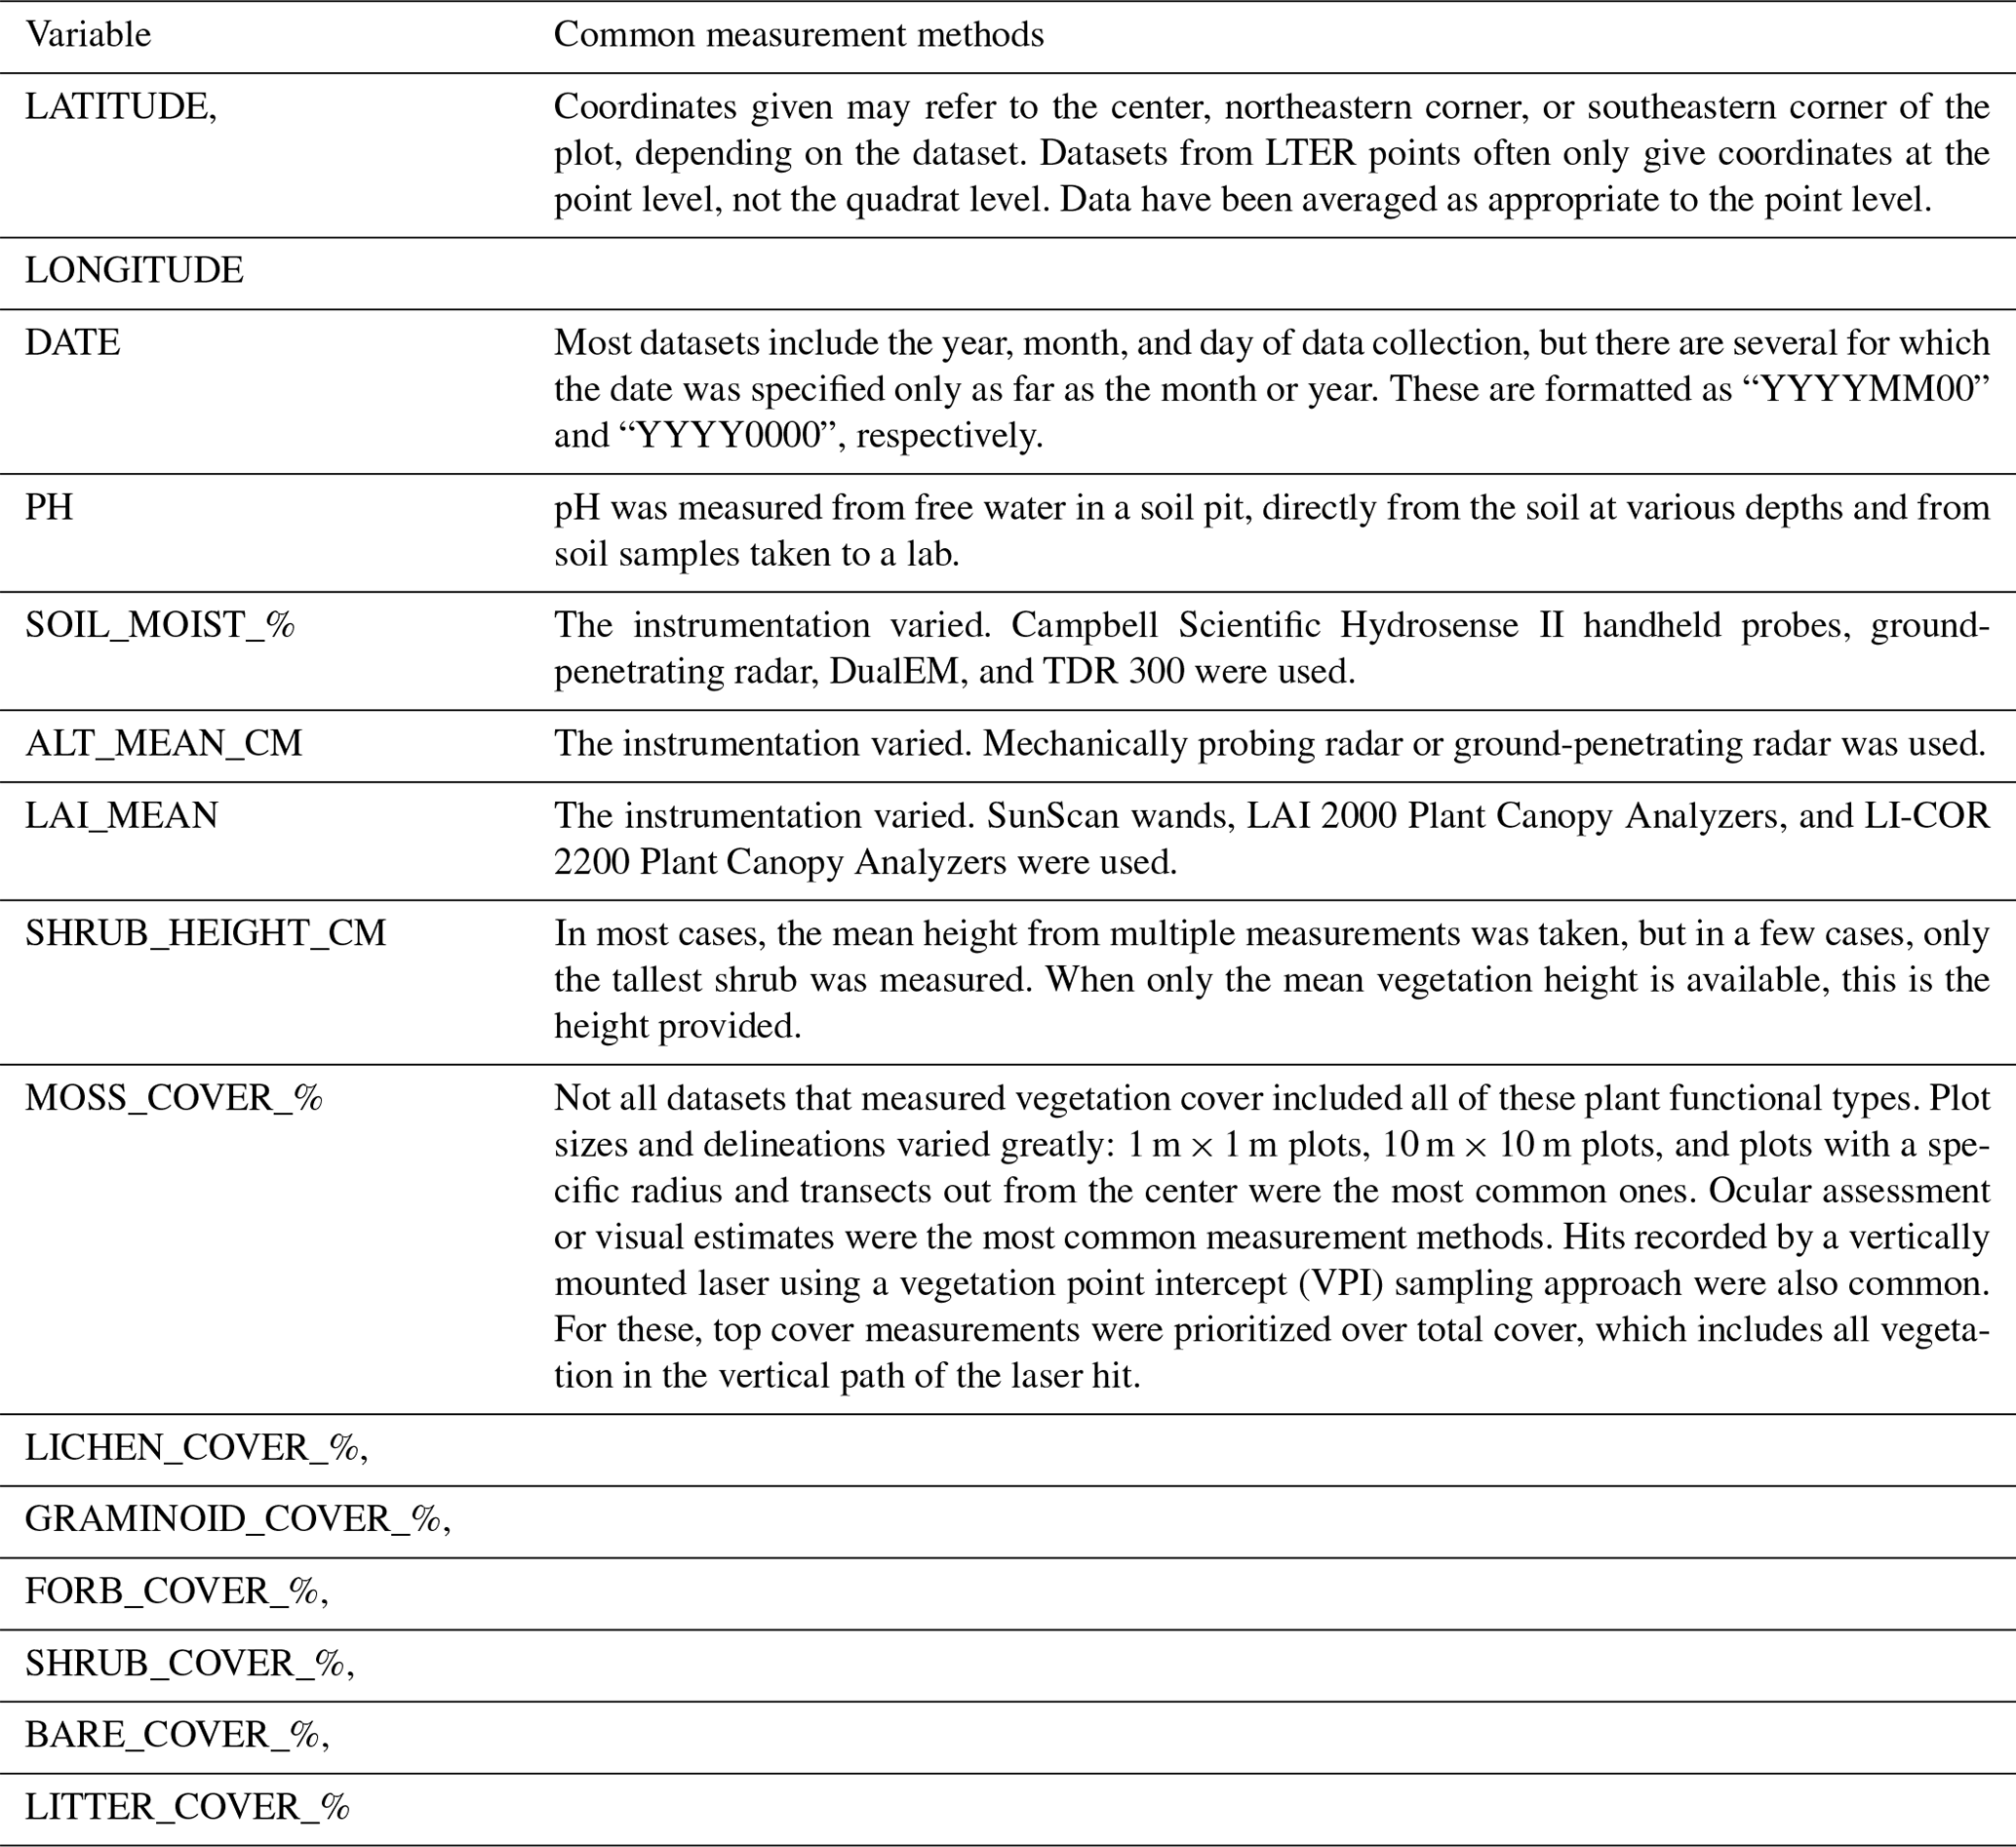
In order to help identify potential sources of uncertainty that should be factored into or acknowledged in research using these data, we have compiled variables that commonly have methodological differences among datasets as well as common measurement methods applied for each of them (Table 5). Of particular note is how different datasets have defined their plots. For many soil and vegetation variables, the measurement instrumentation varied, as did the number of samples taken. Another important consideration is that soil moisture tends to vary significantly within and across seasons. One-time measurements are less meaningful than measurements logged over an entire season or a number of years. For vegetation cover data, the accuracies of the covers depend on the methodology, as some are more quantitative and others are more qualitative. Also, not all of the chosen functional types for this synthesis were included in every dataset. It is unclear whether these functional types existed in the study area or whether the categorization scheme was different, in which case they could have been grouped with other functional types. As an example, several datasets that measured cover did not include moss or litter covers (Table 5).
An expanded version of Table 5 that lists each dataset and summarizes the methods for each variable when provided in the original dataset can be found with the data release in the ORNL DAAC. We strongly encourage investigators to refer to this expanded table as well as the original datasets' metadata and associated paper publications for additional details on the methodology. Important next steps for synthesis research using our database are to take this information, conduct a meta-analysis, and find ways to factor and address uncertainties.
Fire attributes, including fire history information sampled from the ALFD as well as dNBR from the Landsat-derived Burn Scar dNBR dataset (Loboda et al., 2018), are not comprehensive or perfectly accurate. Before 1987, the ALFD defined large fires as those with areas of least 1000 acres (405 ha). Between 1987 and 2015, fires of at least 100 acres (405 ha) were also included. Since 2015, fires of at least 10 acres (4 ha) have been added (Kasischke et al., 2002; Alaska Large Fire Database | FRAMES, 2022). Smaller fires are missing from the record, especially earlier in the ALFD record, and some fine-scale heterogeneity of burned versus unburned vegetation is also not captured by the fire polygons (Miller et al., 2023). Fire history attributes for the data points are only as accurate as the ALFD. Likewise, the dNBR field is only as accurate as the dNBR dataset it was derived from, which only extends from 1985 to 2015 (Loboda et al., 2018). Points from the early and more recent years of our database's records do not have this attribute, even if they were burned.
Table 5Variables with the greatest varied sampling methods and several common measurement methods employed.
SATFiD strives to be as comprehensive as possible, but we acknowledge that there are published and unpublished datasets referenced in the literature that we may have missed or were unable to obtain for this synthesis effort. Also, newer field surveys of the Alaskan tundra from 2020 onward have yet to be added to this current collection. In the future, we hope to build upon this database by incorporating missed and new datasets. Potential future activities might also include sampling of active-layer thickness and soil moisture measurements from aerial remote sensing to in situ data points by geographic locations, similarly to how fire history information and dNBR were collected for the current database. Future improved remote-sensing-based datasets for fire history and severity may also enable higher spatial accuracy and temporal consistency to determine each point's fire history and burn severity.
One additional caveat when using SATFiD is its long-term nature. Because it incorporates various datasets that were collected over half a century, during which the Arctic tundra has undergone substantial warming (Kaufman et al., 2009), the tundra conditions from the earlier field campaigns may be quite different from those acquired in recent years. For example, two data entries in SATFiD collected decades apart with similar values of certain measurements do not necessarily mean that the two tundra sites that they represent are ecologically similar. Users should take this non-static nature of the Arctic tundra into account when adopting SATFiD for long-term analyses.
SATFiD (Chen et al., 2023) is available from the ORNL DAAC at https://doi.org/10.3334/ORNLDAAC/2177. SATFiD is also accessible via a Google Earth Engine application (https://ee-ytzhang.projects.earthengine.app/view/satfid, last access: 12 April 2023) that allows users to query the database and visualize summary statistics and locations of data points by attribute.
As warming and other climate drivers continue to induce physical and biological changes in the Alaskan tundra, in situ field measurements of vegetation, active layers, and fire properties are becoming increasingly important as tools for understanding and analyzing patterns and trends in the region. We synthesized data from the last half-century of tundra field research into a database with utility for synthesis and future research activities of the Alaskan tundra. We reconciled 197 830 individual data points from 37 datasets into a consistent database with 34 variables. Of these 34 variables, 8 fire history variables derived from geospatial and remote sensing datasets provide fire information for data points, allowing for scientific analysis relating vegetation and active-layer properties to fire attributes. SATFiD is a database investigators can leverage to engage in collaborative synthesis research and use to inform aspects of future studies from research questions to study areas and methodologies. This collaborative effort to synthesize tundra field data fits the scope of the NASA Arctic-Boreal Vulnerability Experiment (ABoVE) Phase 3 goal of combining efforts of multiple research projects to benefit future research. In the context of climate change and its effects on the Alaskan tundra, we hope that this timely synthesis effort will make the data collected over the last 5 decades more accessible and help inform and guide future research in this region.
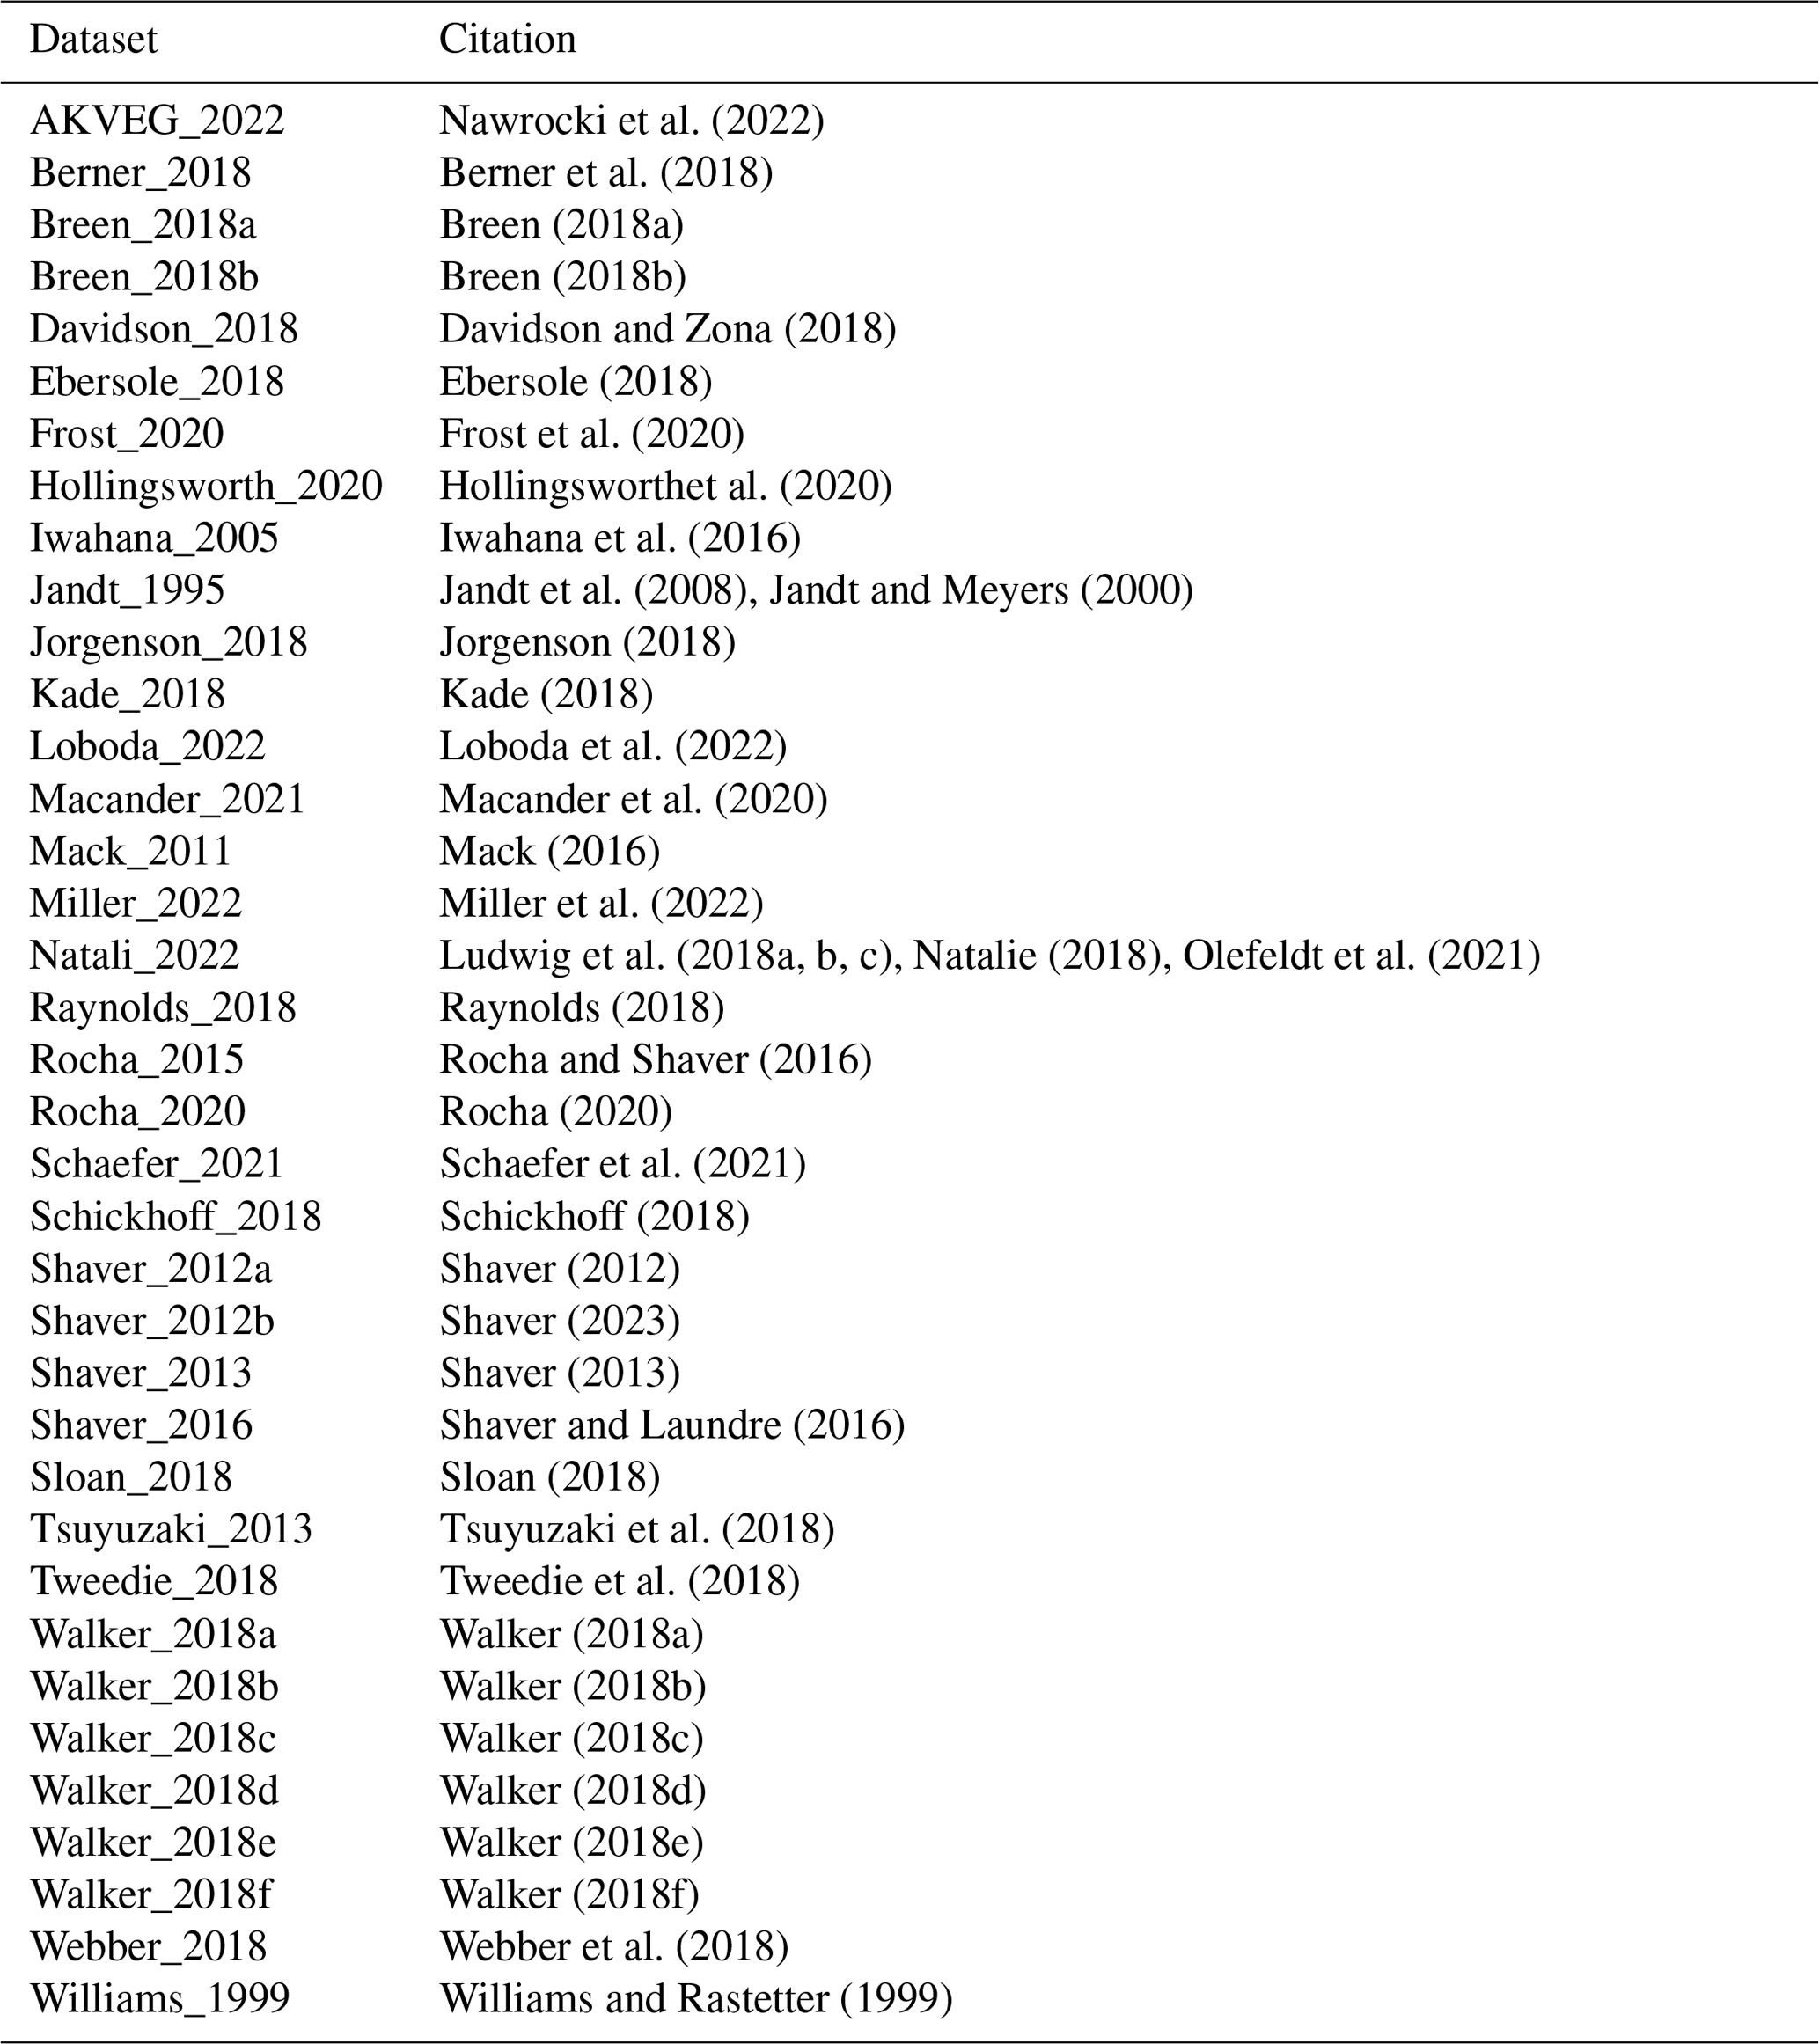
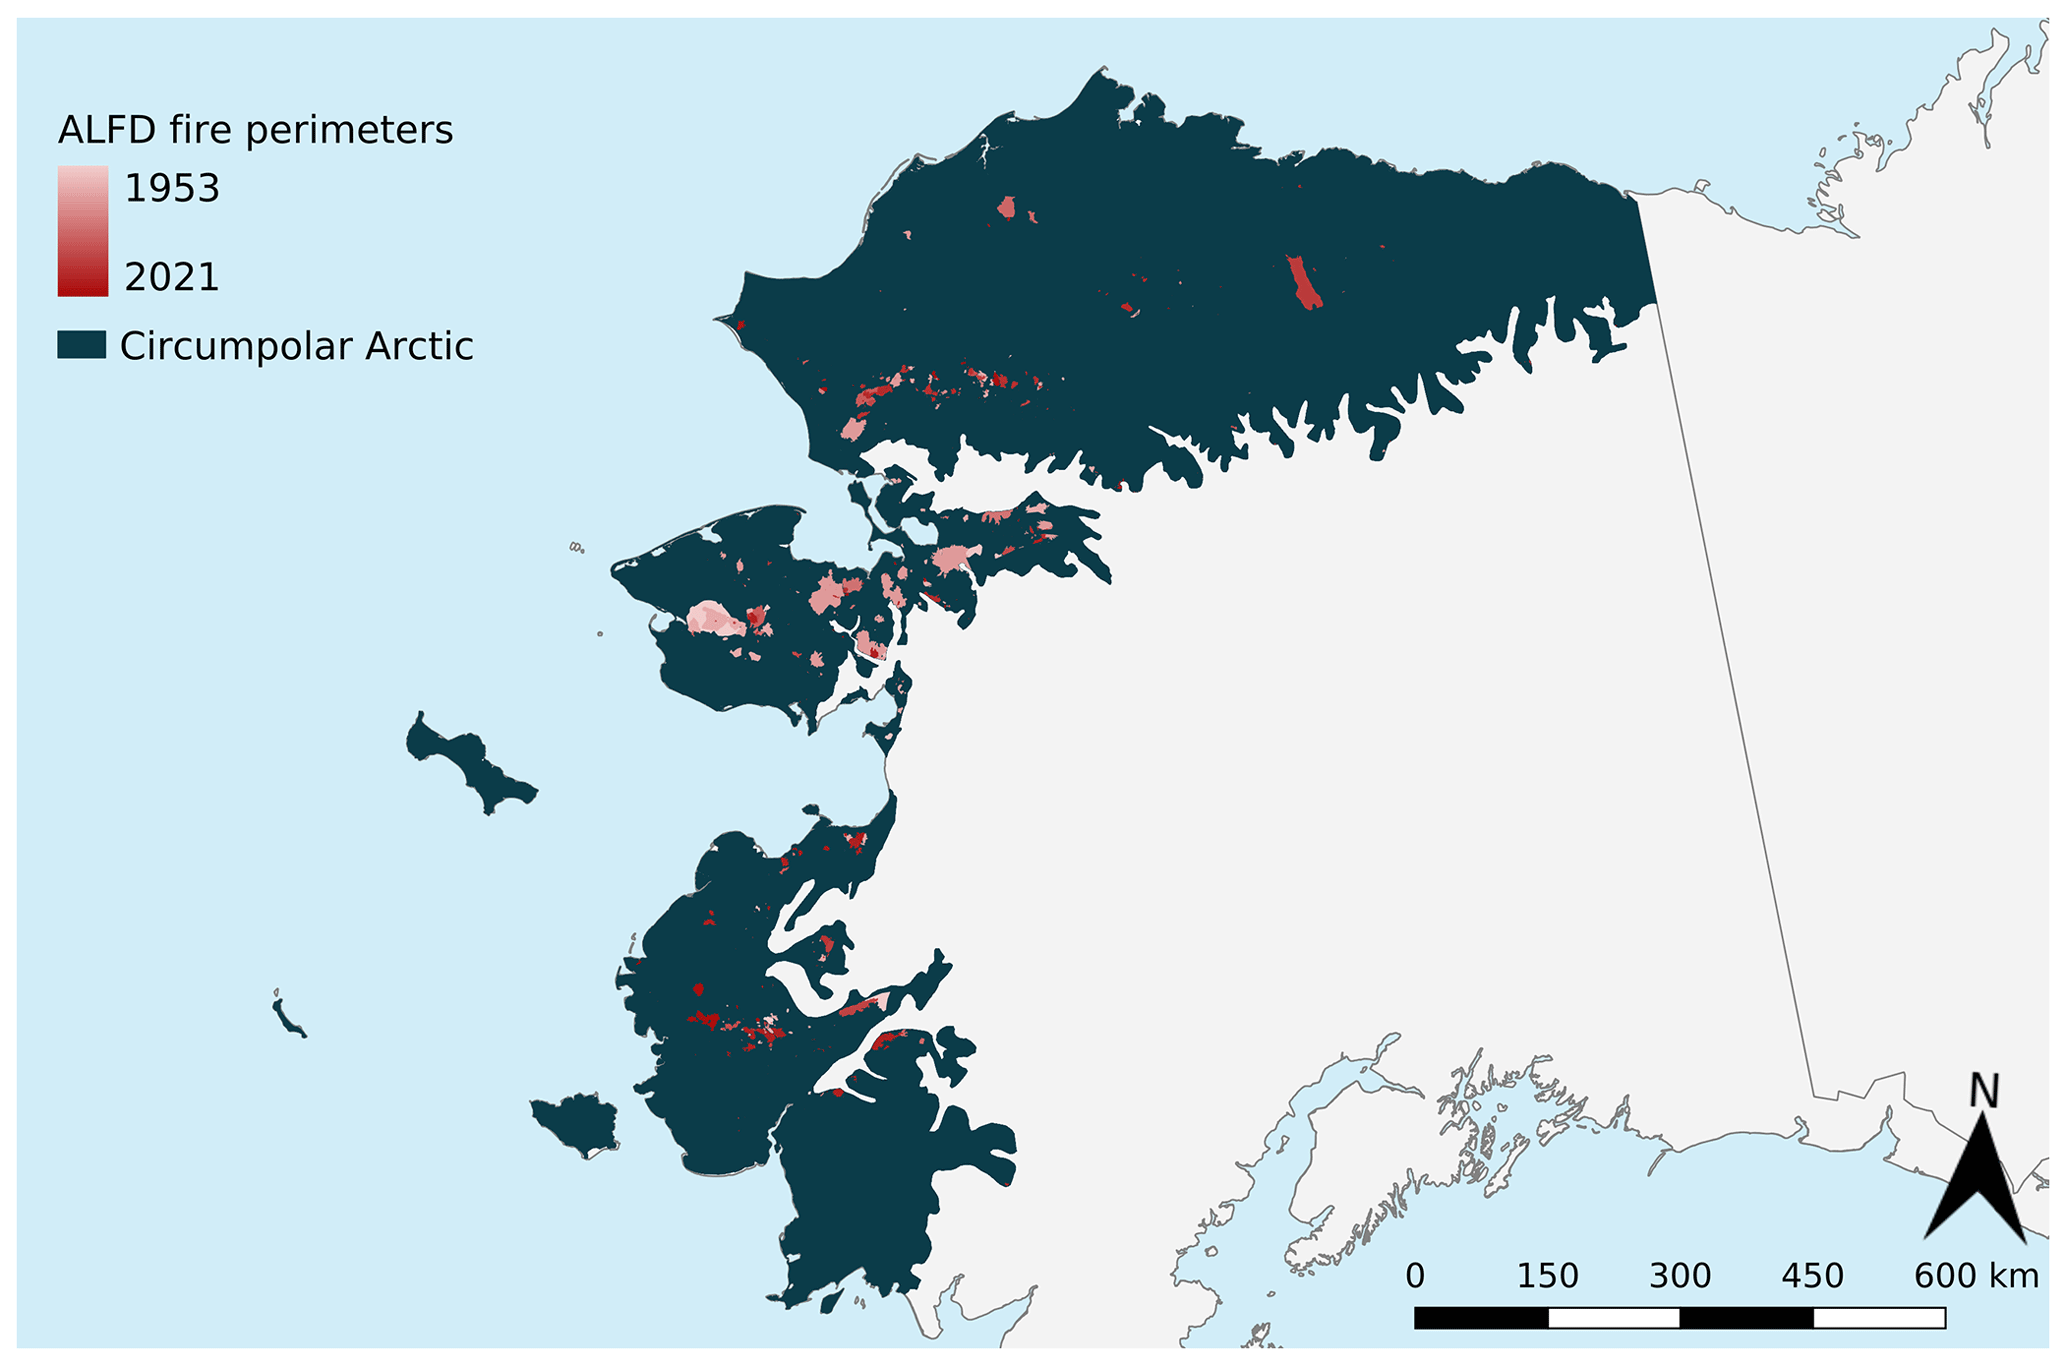
Figure B1Map of the Alaska Large Fire Database (ALFD) circumpolar Arctic fire perimeters through 2021.
DC designed the synthesis project. DC and MK initiated the process for listing the datasets. XZ and DC compiled the database and wrote the draft. EH mentored XZ and contributed to compiling the database and writing the paper. All the authors contributed to discussing the results and editing the final paper.
The contact author has declared that none of the authors has any competing interests.
Publisher’s note: Copernicus Publications remains neutral with regard to jurisdictional claims made in the text, published maps, institutional affiliations, or any other geographical representation in this paper. While Copernicus Publications makes every effort to include appropriate place names, the final responsibility lies with the authors.
This paper was supported by the NASA Arctic-Boreal Vulnerability Experiment (ABoVE). Resources supporting this work were provided by the NASA High-End Computing (HEC) program through the NASA Center for Climate Simulation (NCCS) at the Goddard Space Flight Center.
This research has been supported by NASA (grant nos. NNX15AT79A, NNH16CP09C, NSF-1915307, and NSF-2103539); the Gordon and Betty Moore Foundation (grant no. 8414); the NASA summer internship program through the NASA Terrestrial Ecology program and the Carbon Cycle and Ecosystems Office; and the College of Behavioral and Social Sciences at the University of Maryland, College Park, through the Dean's Research Initiative award.
This paper was edited by Kirsten Elger and reviewed by Michel Allard and one anonymous referee.
Alaska Large Fire Database | FRAMES: https://www.frames.gov/catalog/10465, last access: 21 December 2022.
Arndt, K. A., Santos, M. J., Ustin, S., Davidson, S. J., Stow, D., Oechel, W. C., Tran, T. T. P., Graybill, B., and Zona, D.: Arctic greening associated with lengthening growing seasons in Northern Alaska, Environ. Res. Lett., 14, 125018, https://doi.org/10.1088/1748-9326/ab5e26, 2019.
Berner, L. T., Massey, R., Jantz, P., Forbes, B. C., Macias-Fauria, M., Myers-Smith, I., Kumpula, T., Gauthier, G., Andreu-Hayles, L., Gaglioti, B. V., Burns, P., Zetterberg, P., D'Arrigo, R., and Goetz, S. J.: Summer warming explains widespread but not uniform greening in the Arctic tundra biome, Nat. Commun., 11, 4621, https://doi.org/10.1038/s41467-020-18479-5, 2020.
Berner, L. T., Jantz, P., Tape, K. D., and Goetz, S. J.: ABoVE: Gridded 30-m Aboveground Biomass, Shrub Dominance, North Slope, AK, 2007–2016, ORNL DAAC [data set], Oak Ridge, Tennessee, USA, https://doi.org/10.3334/ORNLDAAC/1565, 2018.
Breen, A. L.: Arctic Vegetation Plots in Burned and Unburned Tundra, Alaska, 2011–2012, ORNL DAAC [data set], Oak Ridge, Tennessee, USA, https://doi.org/10.3334/ORNLDAAC/1547, 2018a.
Breen, A. L.: Arctic Vegetation Plots, Poplars, Arctic and Interior AK and YT, Canada, 2003–2005, ORNL DAAC [data set], Oak Ridge, Tennessee, USA, https://doi.org/10.3334/ORNLDAAC/1376, 2018b.
CAVM Team: Circumpolar Arctic Vegetation Map, U.S. Fish and Wildlife Service, Anchorage, Alaska, ISBN 0-9767525-0-6, 2003.
Chapin, F. S., Sturm, M., Serreze, M. C., McFadden, J. P., Key, J. R., Lloyd, A. H., McGuire, A. D., Rupp, T. S., Lynch, A. H., Schimel, J. P., Beringer, J., Chapman, W. L., Epstein, H. E., Euskirchen, E. S., Hinzman, L. D., Jia, G., Ping, C.-L., Tape, K. D., Thompson, C. D. C., Walker, D. A., and Welker, J. M.: Role of Land-Surface Changes in Arctic Summer Warming, Science, 310, 657–660, https://doi.org/10.1126/science.1117368, 2005.
Chen, D., Zhu, X., Kogure, M., Hoy, E. E., Xu, X., French, N. H. F., Berner, L. T., Breen, A. L., Bret-Harte, S., Davidson, S. J., Ebersole, J. J., Frost, G. V., Goetz, S. J., Hewitt, R. E., Hung, J. K. Y., Iversen, C. M., Iwahana, G., Jandt, R., Jenkins, L. K., Kade, A. N., Klupar, I., Loboda, T. V., Ludwig, S., Macander, M. J., Mack, M. C., Meyers, C. R., Michaelides, R. J., Miller, E. A., Natali, S., Nawrocki, T. W., Nelson, P. R., Parsekian, A. D., Rastetter, E., Raynolds, M. K., Rocha, A. V., Schaefer, K., Schickhoff, U., Schuur, E. a. G., Tsuyuzaki, S., Tweedie, C. E., Zesati, S. V., Walker, D. A., Webber, P. J., Williams, M., and Zona, D.: Field Data on Soils, Vegetation, and Fire History for Alaska Tundra Sites, 1972–2020, ORNL DAAC [data set], https://doi.org/10.3334/ORNLDAAC/2177, 2023.
Chen, Y., Hu, F. S., and Lara, M. J.: Divergent shrub-cover responses driven by climate, wildfire, and permafrost interactions in Arctic tundra ecosystems, Glob. Change Biol., 27, 652–663, https://doi.org/10.1111/gcb.15451, 2021.
Davidson, S. J. and Zona, D.: Arctic Vegetation Plots in Flux Tower Footprints, North Slope, Alaska, 2014, ORNL DAAC [data set], Oak Ridge, Tennessee, USA, https://doi.org/10.3334/ORNLDAAC/1546, 2018.
Dial, R. J., Maher, C. T., Hewitt, R. E., and Sullivan, P. F.: Sufficient conditions for rapid range expansion of a boreal conifer, Nature, 608, 546–551, https://doi.org/10.1038/s41586-022-05093-2, 2022.
Ebersole, J. J.: Arctic Vegetation Plots at Oumalik, AK, 1983–1985, ORNL DAAC [data set], Oak Ridge, Tennessee, USA, https://doi.org/10.3334/ORNLDAAC/1506, 2018.
Ernakovich, J. G., Hopping, K. A., Berdanier, A. B., Simpson, R. T., Kachergis, E. J., Steltzer, H., and Wallenstein, M. D.: Predicted responses of arctic and alpine ecosystems to altered seasonality under climate change, Glob. Change Biol., 20, 3256–3269, https://doi.org/10.1111/gcb.12568, 2014.
French, N. H. F., Jenkins, L. K., Loboda, T. V., Flannigan, M., Jandt, R., Bourgeau-Chavez, L. L., and Whitley, M.: Fire in arctic tundra of Alaska: past fire activity, future fire potential, and significance for land management and ecology, Int. J. Wildland Fire, 24, 1045–1061, https://doi.org/10.1071/WF14167, 2015.
Frost, G. V., Loehman, R. A., Nelson, P. R., and Paradis, D. P.: ABoVE: Vegetation Composition across Fire History Gradients on the Y-K Delta, Alaska, ORNL DAAC [data set], Oak Ridge, Tennessee, USA, https://doi.org/10.3334/ORNLDAAC/1772, 2020.
Gallant, A. L., Binnian, E. F., Omernik, J. M., and Shasby, M. B.: Ecoregions of Alaska, U.S. Geological Survey Professional Paper 1567, 73, United States Government Printing Office: Washington, DC, USA, 1995.
Goetz, S. J., Bunn, A. G., Fiske, G. J., and Houghton, R. A.: Satellite-observed photosynthetic trends across boreal North America associated with climate and fire disturbance, P. Natl. Acad. Sci. USA, 102, 13521–13525, https://doi.org/10.1073/pnas.0506179102, 2005.
Hagedorn, F., Shiyatov, S. G., Mazepa, V. S., Devi, N. M., Grigor'ev, A. A., Bartysh, A. A., Fomin, V. V., Kapralov, D. S., Terent'ev, M., Bugman, H., Rigling, A., and Moiseev, P. A.: Treeline advances along the Urals mountain range – driven by improved winter conditions?, Glob. Change Biol., 20, 3530–3543, https://doi.org/10.1111/gcb.12613, 2014.
He, J., Chen, D., Jenkins, L., and Loboda, T. V.: Impacts of wildfire and landscape factors on organic soil properties in Arctic tussock tundra, Environ. Res. Lett., 16, 085004, https://doi.org/10.1088/1748-9326/ac1192, 2021.
Heijmans, M. M. P. D., Magnússon, R. Í., Lara, M. J., Frost, G. V., Myers-Smith, I. H., van Huissteden, J., Jorgenson, M. T., Fedorov, A. N., Epstein, H. E., Lawrence, D. M., and Limpens, J.: Tundra vegetation change and impacts on permafrost, Nat. Rev. Earth Environ., 3, 68–84, https://doi.org/10.1038/s43017-021-00233-0, 2022.
Hollingsworth, T. N., Breen, A., Mack, M. C., and Hewitt, R. E.: Seward Peninsula post-fire vegetation and soil data from multiple burns occurring from 1971 to 2012: “SPANFire” Study Sites Sampled in July 2012, http://www.lter.uaf.edu/data/data-detail/id/752 (last access: 15 August 2024), 2020.
Hu, F. S., Higuera, P. E., Walsh, J. E., Chapman, W. L., Duffy, P. A., Brubaker, L. B., and Chipman, M. L.: Tundra burning in Alaska: Linkages to climatic change and sea ice retreat, J. Geophys. Res.-Biogeo., 115, G04002, https://doi.org/10.1029/2009JG001270, 2010.
Iwahana, G., Harada, K., Uchida, M., Tsuyuzaki, S., Saito, K., Narita, K., Kushida, K., and Hinzman, L. D.: Geomorphological and geochemistry changes in permafrost after the 2002 tundra wildfire in Kougarok, Seward Peninsula, Alaska, J. Geophys. Res.-Earth, 121, 1697–1715, https://doi.org/10.1002/2016JF003921, 2016.
Jandt, R., Joly, K., Meyers, C. R., and Racine, C.: Slow recovery of lichen on burned caribou winter range in Alaska tundra: Potential influences of climate warming and other disturbance factors, Arct. Antarct. Alp. Res., 40, 89–95, https://doi.org/10.1657/1523-0430(06-122)[jandt]2.0.co;2, 2008.
Jandt, R. R. and Meyers, C. R.: Recovery of lichen in tussock tundra following fire in northwestern Alaska, in: US Department of the Interior, Bureau of Land Management, Alaska State Office, https://doi.org/10.5962/BHL.TITLE.61209, 2000.
Jorgenson, M. T.: Arctic Vegetation Plots in NPS Arctic Network Parks, Alaska, 2002–2008, ORNL DAAC [data set], Oak Ridge, Tennessee, USA, https://doi.org/10.3334/ORNLDAAC/1542, 2018.
Kade, A. N.: Arctic Vegetation Plots at Frost Boil Sites, North Slope, Alaska, 2000–2006, ORNL DAAC [data set], Oak Ridge, Tennessee, USA. https://doi.org/10.3334/ORNLDAAC/1361, 2018.
Kasischke, E. S., Williams, D., and Barry, D.: Analysis of the patterns of large fires in the boreal forest region of Alaska, Int. J. Wildland Fire, 11, 131–144, 2002.
Kaufman, D. S., Schneider, D. P., McKay, N. P., Ammann, C. M., Bradley, R. S., Briffa, K. R., Miller, G. H., Otto-Bliesner, B. L., Overpeck, J. T., Vinther, B. M., Members, P., Abbott, M., Axford, Y., Bird, B., B. Birks, H. J., Bjune, A. E., Briner, J., Cook, T., Chipman, M., Fracus, P., Gajewski, K., Geirsdóttir, Á., Hu, F. S., Kutchko, B., Lamoureux, S., Loso, M., MacDonald, G., Peros, M., Porinchu, D., Schiff, C., Seppä, H., and Thomas, E.: Recent Warming Reverses Long-Term Arctic Cooling, Science, 325, 1236–1239, https://doi.org/10.1126/science.1173983, 2009.
Lewkowicz, A. G. and Way, R. G.: Extremes of summer climate trigger thousands of thermokarst landslides in a High Arctic environment, Nat. Commun., 10, 1329, https://doi.org/10.1038/s41467-019-09314-7, 2019.
Loboda, T. V., Chen, D., Hall, J. V., and He, J.: ABoVE: Landsat-derived Burn Scar dNBR across Alaska and Canada, 1985–2015, ORNL DAAC [data set], https://doi.org/10.3334/ORNLDAAC/1564, 2018.
Loboda, T. V., Jenkins, L. K., Chen, D., He, J., and Baer, A.: Burned and Unburned Field Site Data, Noatak, Seward, and North Slope, AK, 2016–2018, ORNL DAAC [data set], Oak Ridge, Tennessee, USA, https://doi.org/10.3334/ORNLDAAC/1919, 2022.
Ludwig, S., Holmes, R. M., Schade, J., Natali, S., and Mann, P.: Polaris Project 2017: Vegetation biomass, carbon, and nitrogen, Yukon-Kuskokwim Delta, Alaska, Arctic Data Center [data set], https://doi.org/10.18739/A2FJ29D12, 2018a.
Ludwig, S., Holmes, R. M., Natali, S., Mann, P., and Schade, J.: Polaris Project 2017: Soil fluxes, carbon, and nitrogen, Yukon-Kuskokwim Delta, Alaska, Arctic Data Center [data set], https://doi.org/10.18739/A2Q23R08G, 2018b.
Ludwig, S., Holmes, R. M., Natali, S., Schade, J., and Mann, P.: Yukon-Kuskokwim Delta fire: vegetation biomass, Yukon-Kuskokwim Delta Alaska, 2016, Arctic Data Center [data set], https://doi.org/10.18739/A29S1KK6T, 2018c.
Macander, M. J., Frost, G. V., Nelson, P. R., and Swingley, C. S.: ABoVE: Tundra Plant Functional Type Continuous-Cover, North Slope, Alaska, 2010–2015, ORNL DAAC [data set], Oak Ridge, Tennessee, USA, https://doi.org/10.3334/ORNLDAAC/1830, 2020.
Mack, M.: Characterization of burned and unburned moist acidic tundra sites for estimating C and N loss from the 2007 Anaktuvuk River Fire, sampled in 2008. ver 5., Environmental Data Initiative, https://doi.org/10.6073/pasta/81868b65c853d5eb2052d9f1a8397d0d, 2016.
Mack, M. C., Bret-Harte, M. S., Hollingsworth, T. N., Jandt, R. R., Schuur, E. A. G., Shaver, G. R., and Verbyla, D. L.: Carbon loss from an unprecedented Arctic tundra wildfire, Nature, 475, 489–492, https://doi.org/10.1038/nature10283, 2011.
Masrur, A., Petrov, A. N., and DeGroote, J.: Circumpolar spatio-temporal patterns and contributing climatic factors of wildfire activity in the Arctic tundra from 2001–2015, Environ. Res. Lett., 13, 014019, https://doi.org/10.1088/1748-9326/aa9a76, 2018.
Mekonnen, Z. A., Riley, W. J., Berner, L. T., Bouskill, N. J., Torn, M. S., Iwahana, G., Breen, A. L., Myers-Smith, I. H., Criado, M. G., Liu, Y., Euskirchen, E. S., Goetz, S. J., Mack, M. C., and Grant, R. F.: Arctic tundra shrubification: a review of mechanisms and impacts on ecosystem carbon balance, Environ. Res. Lett., 16, 053001, https://doi.org/10.1088/1748-9326/abf28b, 2021.
Miller, E. A., Jandt, R., Baughman, C. A., Jones, B. M., and Yokel, D. A.: ABoVE: Post-Fire and Unburned Field Site Data, Anaktuvuk River Fire Area, 2008–2017, ORNL DAAC [data set], Oak Ridge, Tennessee, USA, https://doi.org/10.3334/ORNLDAAC/2119, 2022.
Miller, E. A., Jones, B. M., Baughman, C. A., Jandt, R. R., Jenkins, J. L., and Yokel, D. A.: Unrecorded Tundra Fires of the Arctic Slope, Alaska USA, Fire, 6, 101, https://doi.org/10.3390/fire6030101, 2023.
Myers-Smith, I. H., Kerby, J. T., Phoenix, G. K., Bjerke, J. W., Epstein, H. E., Assmann, J. J., John, C., Andreu-Hayles, L., Angers-Blondin, S., Beck, P. S. A., Berner, L. T., Bhatt, U. S., Bjorkman, A. D., Blok, D., Bryn, A., Christiansen, C. T., Cornelissen, J. H. C., Cunliffe, A. M., Elmendorf, S. C., Forbes, B. C., Goetz, S. J., Hollister, R. D., de Jong, R., Loranty, M. M., Macias-Fauria, M., Maseyk, K., Normand, S., Olofsson, J., Parker, T. C., Parmentier, F.-J. W., Post, E., Schaepman-Strub, G., Stordal, F., Sullivan, P. F., Thomas, H. J. D., Tømmervik, H., Treharne, R., Tweedie, C. E., Walker, D. A., Wilmking, M., and Wipf, S.: Complexity revealed in the greening of the Arctic, Nat. Clim. Change, 10, 106–117, https://doi.org/10.1038/s41558-019-0688-1, 2020.
Natali, S.: Yukon-Kuskokwim Delta fire: thaw depth, soil temperature, and point-intercept vegetation, Yukon-Kuskokwim Delta Alaska, 2015–2016, Arctic Data Center [data set], https://doi.org/10.18739/A2707WP16, 2018.
Nawrocki, T. W., Wells, A. F., Macander, M. J., Powers, E. M., Flagstad, L. A., Droghini, A., Gravely, H. A., Steer, M. A., Frost, G. V., Boucher, T. V., Roland, C. A., Miller, A. E., Swanson, D. K., and Johanson, J. K.: Alaska Vegetation Plots (AKVEG) Database, University of Alaska Anchorage, https://akveg.uaa.alaska.edu (last access: 12 April 2023), 2022.
Oechel, W. C., Hastings, S. J., Vourlrtis, G., Jenkins, M., Riechers, G., and Grulke, N.: Recent change of Arctic tundra ecosystems from a net carbon dioxide sink to a source, Nature, 361, 520–523, https://doi.org/10.1038/361520a0, 1993.
Olefeldt, D., Hovemyr, M., Kuhn, M., Bastviken, D., and Bohn, T.: The fractional land cover estimates from the Boreal-Arctic Wetland and Lake Dataset (BAWLD), 2021, Arctic Data Center [data set], https://doi.org/10.18739/A2C824F9X, 2021.
Rantanen, M., Karpechko, A. Yu., Lipponen, A., Nordling, K., Hyvärinen, O., Ruosteenoja, K., Vihma, T., and Laaksonen, A.: The Arctic has warmed nearly four times faster than the globe since 1979, Commun. Earth Environ.t, 3, 168, https://doi.org/10.1038/s43247-022-00498-3, 2022.
Raynolds, M. K.: Arctic Vegetation Plots ATLAS Project North Slope and Seward Peninsula, AK, 1998–2000, ORNL DAAC [data set], Oak Ridge, Tennessee, USA, https://doi.org/10.3334/ORNLDAAC/1541, 2018.
Raynolds, M. K., Walker, D. A., Balser, A., Bay, C., Campbell, M., Cherosov, M. M., Daniëls, F. J. A., Eidesen, P. B., Ermokhina, K. A., Frost, G. V., Jedrzejek, B., Jorgenson, M. T., Kennedy, B. E., Kholod, S. S., Lavrinenko, I. A., Lavrinenko, O. V., Magnússon, B., Matveyeva, N. V., Metúsalemsson, S., Nilsen, L., Olthof, I., Pospelov, I. N., Pospelova, E. B., Pouliot, D., Razzhivin, V., Schaepman-Strub, G., Šibík, J., Telyatnikov, M. Yu., and Troeva, E.: A raster version of the Circumpolar Arctic Vegetation Map (CAVM), Remote Sens. Environ., 232, 111297, https://doi.org/10.1016/j.rse.2019.111297, 2019.
Rees, W. G., Hofgaard, A., Boudreau, S., Cairns, D. M., Harper, K., Mamet, S., Mathisen, I., Swirad, Z., and Tutubalina, O.: Is subarctic forest advance able to keep pace with climate change?, Glob. Change Biol., 26, 3965–3977, https://doi.org/10.1111/gcb.15113, 2020.
Rocha, A.: Leaf area index (LAI) recorded from a nitrogen (N), phosphorus (P) and N+P fertilization experiment at the 2007 Anaktuvuk River, Alaska, USA fire scar during the 2016–2019 growing seasons ver 2, Environmental Data Initiative [data set], https://doi.org/10.6073/pasta/06559231aa04fd7fecd661f107985c8f, 2020.
Rocha, A. and Shaver, G.: Anaktuvuk River fire scar thaw depth measurements during the 2008 to 2014 growing season ver 6, Environmental Data Initiative [data set], https://doi.org/10.6073/pasta/93121fc86e6fbcf88de4a9350609aed6, 2016.
Rocha, A. V., Blakely, B., Jiang, Y., Wright, K. S., and Curasi, S. R.: Is arctic greening consistent with the ecology of tundra? Lessons from an ecologically informed mass balance model, Environ. Res. Lett., 13, 125007, https://doi.org/10.1088/1748-9326/aaeb50, 2018.
Russell, I. C.: Notes on the Surface Geology of Alaska, GSA Bull., 1, 99–162, https://doi.org/10.1130/GSAB-1-99, 1890.
Schaefer, K., Clayton, L. K., Battaglia, M. J., Bourgeau-Chavez, L. L., Chen, R. H., Chen, A. C., Chen, J., Bakian-Dogaheh, K., Douglas, T. A., Grelick, S. E., Iwahana, G., Jafarov, E., Liu, L., Ludwig, S., Michaelides, R. J., Moghaddam, M., Natali, S., Panda, S. K., Parsekian, A. D., Rocha, A. V., Schaefer, S. R., Sullivan, T. D., Tabatabaeenejad, A., Wang, K., Wilson, C. J., Zebker, H. A., Zhang, T., and Zhao, Y.: ABoVE: Soil Moisture and Active Layer Thickness in Alaska and NWT, Canada, 2008–2020, ORNL DAAC [data set], Oak Ridge, Tennessee, USA. https://doi.org/10.3334/ORNLDAAC/1903, 2021.
Schickhoff, U.: Arctic Vegetation Plots in Willow Communities, North Slope, Alaska, 1997, ORNL DAAC [data set], Oak Ridge, Tennessee, USA, https://doi.org/10.3334/ORNLDAAC/1368, 2018.
Schrader, F. C.: Recent Work of the U. S. Geological Survey in Alaska, Bull. Am. Geogr. Soc., 34, 1–16, https://doi.org/10.2307/198855, 1902.
Schuur, E. A. G., Crummer, K. G., Vogel, J. G., and Mack, M. C.: Plant Species Composition and Productivity following Permafrost Thaw and Thermokarst in Alaskan Tundra, Ecosystems, 10, 280–292, https://doi.org/10.1007/s10021-007-9024-0, 2007.
Schuur, E. A. G., McGuire, A. D., Schädel, C., Grosse, G., Harden, J. W., Hayes, D. J., Hugelius, G., Koven, C. D., Kuhry, P., Lawrence, D. M., Natali, S. M., Olefeldt, D., Romanovsky, V. E., Schaefer, K., Turetsky, M. R., Treat, C. C., and Vonk, J. E.: Climate change and the permafrost carbon feedback, Nature, 520, 171–179, https://doi.org/10.1038/nature14338, 2015.
Shaver, G.: Leaf Area Index every 15 cm of 1m x 1m chamber flux and point frame plots and sites where dataloggers monitored PAR above, within and below S. pulchra and B. nana canopies during the growing season at the Toolik Field Station in AK, Summer 2012, Environmental Data Initiative [data set], https://doi.org/10.6073/pasta/627698983259d6963a6083d5251723cc, 2012.
Shaver, G.: Summary of soil temperature, moisture, and thaw depth for 14 chamber flux measurements sampled near LTER shrub sites at Toolik Field Station, Alaska, summer 2012, Environmental Data Initiative [data set], https://doi.org/10.6073/pasta/7ccf390e6fe4824e93b7a2b844605a40, 2013.
Shaver, G.: Summary of three different Leaf Area Index (LAI) methodologies of 19 1m x 1m point frame plots sampled near the LTER Shrub plots at Toolik Field Station in AK the summer of 2012, Environmental Data Initiative [data set], https://doi.org/10.6073/pasta/17302da4bd951a9dc4140187f03fae24, 2023.
Shaver, G. and Laundre, J.: Summer soil temperature and moisture at the Anaktuvuk River Severely burned site from 2010 to 2013, ver 2, Environmental Data Initiative [data set], https://doi.org/10.6073/pasta/3094e3e293703580c95e17ddce51af65, 2016.
Sloan, V. L.: Arctic Vegetation Plots for NGEE-Arctic at Barrow, Alaska, 2012, ORNL DAAC [data set], Oak Ridge, Tennessee, USA, https://doi.org/10.3334/ORNLDAAC/1505, 2018.
Tsuyuzaki, S., Iwahana, G., and Saito, K.: Tundra fire alters vegetation patterns more than the resultant thermokarst, Polar Biol., 41, 753–761, https://doi.org/10.1007/s00300-017-2236-7, 2018.
Tweedie, C. E., Webber, P. J., Komarkova, V., and Villarreal, S.: Arctic Vegetation Plots at Atqasuk, Alaska, 1975, 2000, and 2010, ORNL DAAC [data set], Oak Ridge, Tennessee, USA, https://doi.org/10.3334/ORNLDAAC/1371, 2018.
Walker, D. A.: Arctic Vegetation Plots Legacy Project Barter Island and Point Barrow, Alaska, 1994, ORNL DAAC [data set], Oak Ridge, Tennessee, USA. https://doi.org/10.3334/ORNLDAAC/1534, 2018a.
Walker, D. A.: Arctic Vegetation Plots, Prudhoe Bay ArcSEES Road Study, Lake Colleen, Alaska, 2014, ORNL DAAC [data set], Oak Ridge, Tennessee, USA. https://doi.org/10.3334/ORNLDAAC/1555, 2018b.
Walker, M. D.: Arctic Vegetation Plots from Pingo Communities, North Slope, Alaska, 1984–1986, ORNL DAAC [data set], Oak Ridge, Tennessee, USA. https://doi.org/10.3334/ORNLDAAC/1507, 2018c.
Walker, D. A.: Arctic Vegetation Plots at Happy Valley, Alaska, 1994, ORNL DAAC [data set], Oak Ridge, Tennessee, USA, https://doi.org/10.3334/ORNLDAAC/1354, 2018d.
Walker, D. A.: Arctic Vegetation Plots at Imnavait Creek, Alaska, 1984–1985, ORNL DAAC [data set], Oak Ridge, Tennessee, USA, https://doi.org/10.3334/ORNLDAAC/1356, 2018e.
Walker, D. A.: Arctic Vegetation Plots at Toolik Lake, Alaska, 1989, ORNL DAAC [data set], Oak Ridge, Tennessee, USA, https://doi.org/10.3334/ORNLDAAC/1333, 2018f.
Walker, D. A., Raynolds, M. K., Daniëls, F. J. A., Einarsson, E., Elvebakk, A., Gould, W. A., Katenin, A. E., Kholod, S. S., Markon, C. J., Melnikov, E. S., Moskalenko, N. G., Talbot, S. S., Yurtsev, B. A., and other members of the CAVM Team: The Circumpolar Arctic Vegetation Map, J. Veg. Sci., 16, 267–282, 2005.
Webber, P. J., Villarreal, S., and Tweedie, C. E.: Arctic Vegetation Plots for IBP Tundra Biome, Barrow, Alaska, 1972–2010, ORNL DAAC, Oak Ridge, Tennessee, USA, https://doi.org/10.3334/ORNLDAAC/1535, 2018.
Williams, M. and Rastetter, E.: Measurements of Leaf area, foliar C and N for 14 sites along a transect down the Kuparuk River basin, summer 1997, North Slope, Alaska. Environmental Data Initiative [data set], https://doi.org/10.6073/pasta/a5a4d4154e0a8181a5523b4d9c49ed99, 1999.