the Creative Commons Attribution 4.0 License.
the Creative Commons Attribution 4.0 License.
 | 08 Aug 2024
Reconstructing long-term (1980–2022) daily ground particulate matter concentrations in India (LongPMInd)
Shuai Wang
Mengyuan Zhang
Hui Zhao
Peng Wang
Sri Harsha Kota
Qingyan Fu
Cong Liu
Severe airborne particulate matter (PM, including PM2.5 and PM10) pollution in India has caused widespread concern. Accurate PM concentrations are fundamental for scientific policymaking and health impact assessment, while surface observations in India are limited due to scarce sites and uneven distribution. In this work, a simple structured, efficient, and robust model based on the Light Gradient-Boosting Machine (LightGBM) was developed to fuse multisource data and estimate long-term (1980–2022) historical daily ground PM concentrations in India (LongPMInd). The LightGBM model shows good accuracy with out-of-sample, out-of-site, and out-of-year cross-validation (CV) test R2 values of 0.77, 0.70, and 0.66, respectively. Small performance gaps between PM2.5 training and testing (delta RMSE of 1.06, 3.83, and 7.74 µg m−3) indicate low overfitting risks. With great generalization ability, the openly accessible, long-term, and high-quality daily PM2.5 and PM10 products were then reconstructed (10 km, 1980–2022). This showed that India has experienced severe PM pollution in the Indo-Gangetic Plain (IGP), especially in winter. PM concentrations have significantly increased (p<0.05) in most regions since 2000 (0.34 ). The turning point occurred in 2018 when the Indian government launched the National Clean Air Programme, and PM2.5 concentrations declined in most regions (−0.78 ) during 2018–2022. Severe PM2.5 pollution caused continuous increased attributable premature mortalities, from 0.73 (95 % confidence interval (CI) [0.65, 0.80]) million in 2000 to 1.22 (95 % CI [1.03, 1.41]) million in 2019, particularly in the IGP, where attributable mortality increased from 0.36 million to 0.60 million. LongPMInd has the potential to support multiple applications of air quality management, public health initiatives, and efforts to address climate change. The daily and monthly PM2.5 and PM10 concentrations are publicly accessible at https://doi.org/10.5281/zenodo.10073944 (Wang et al., 2023a).
- Article
(5384 KB) - Full-text XML
-
Supplement
(2238 KB) - BibTeX
- EndNote


Airborne particulate matter (PM, including PM2.5 with diameters <2.5 µm and PM10 with diameters <10 µm) not only impacts climate by changing radiation budgets but also has significant adverse effects on human health (Murray et al., 2020; Wang et al., 2012; Yang et al., 2016). India is one of the world's most populous countries, with severe PM pollution resulting from rapid economic development and industrialization over the last few decades. Exposure to PM2.5 has become one of the leading causes of health burden in India, contributing to, for example, heart disease, stroke, lung cancer, and premature death (Pandey et al., 2021; Dandona et al., 2017).
Accurate ground PM concentrations are prerequisites for evidence-based policymaking and health impact assessments. The Central Pollution Control Board (CPCB) of India has established and maintained ground-based monitoring networks with ∼335 continuous ambient air quality monitoring stations (CAAQMSs) currently. However, these monitoring sites are unevenly distributed (mainly located in urban, residential, and industrial areas), with a limited number of sites (monitoring density: ∼0.6 sites per million population) (Brauer et al., 2019), and many cities even have no monitoring sites (Martin et al., 2019). Therefore, the surface observations alone are not sufficient to support air quality management, especially on a regional scale (Pant et al., 2019; Dey et al., 2020).
Two main approaches have been used for large-scale and long-term PM2.5 estimation: scaling methods and statistical methods. Scaling methods use chemical transport models (CTMs) to simulate the association between aerosol optical depth (AOD) and PM2.5 and require no ground observations. However, the relationship between PM2.5 and AOD is spatially and temporally variable and without the constraints of ground observations, so these methods usually have a large uncertainty (Ma et al., 2022). Compared with scaling methods, statistical methods based on multivariate data fusion have higher prediction accuracy and have been widely used. Statistical models (traditional linear and nonlinear regression and machine learning algorithms) estimate PM2.5 concentrations by fitting the relationship between input variables (meteorological factors, emissions, and other relevant variables) and target variables (Wang et al., 2023b; Wei et al., 2021a; X. Ren et al., 2022; Katoch et al., 2023).
Tree-based machine learning (ML) models typically outperform deep learning approaches and traditional machine learning methods in tabular data (e.g., air pollutant observation datasets) and thus have been widely developed and used (Grinsztajn et al., 2022; Sayeed et al., 2022). Wei et al. (2021a) and Li et al. (2021) reconstructed long-term PM2.5 data records in China by fusing satellite, meteorological, and emission data using a spatiotemporal tree-based model. Ni et al. (2024) analyzed the contribution of meteorology and emissions to O3 in China using a chemical transport model (GEOS-Chem) and a tree-based model. Sayeed et al. (2022) improved analysis of the PM2.5 concentration in the continental United States using the random forest approach coupled with meteorology and aerosol species of the Modern-Era Retrospective analysis for Research and Applications, Version 2 (MERRA-2).
Some studies have estimated PM2.5 concentrations in India using different methods. Chowdhury et al. (2019) used the PM2.5–AOD equation method to estimate PM2.5 concentrations in Delhi; however, AOD satellite data suffer from significant non-random misses, especially during cloud cover and on hazy, polluted days, so it is difficult to derive a full-spatiotemporal-coverage PM dataset (Wang et al., 2023b; Bai et al., 2022). Bali et al. (2021) and Dey et al. (2020) estimated total PM2.5 in India through empirical coefficients and the MERRA-2 dataset, but these coefficients vary with geographic location and pollution scenarios, which makes the related estimation potentially unreliable. Kumar et al. (2023) analyzed PM2.5 for India using a random forest model and showed a gap between train and test scores with a risk of overfitting. In addition, global-scale daily PM2.5 concentration datasets (including India) have recently been developed, including GlobalHighAirPollutants (GHAP) (Wei et al., 2023) and the Long-term Gap-free High-resolution Air Pollutants concentration dataset version 2 (LGHAPv2) (Bai et al., 2024). Global monthly PM2.5 datasets have also been developed before (Van Donkelaar et al., 2021). These datasets were trained on a global scale and estimated PM2.5 concentrations for the India region. The severity of PM2.5 pollution in India is much higher than in Europe and the United States (Wei et al., 2023). However, due to the small number of observations recorded, the global model can gain only limited knowledge of PM2.5 pollution in India during the training process. Therefore, the reliability and robustness of global model estimates of PM2.5 concentrations in India should be systematically assessed. Building a model locally in India can provide a useful comparison, which can also complement the biases in global modeling (e.g., due to focusing more on lightly polluted regions such as Europe and the United States). However, it is challenging to establish long-term, full-coverage, high-accuracy, open-source PM data products locally in India due to insufficient observational data and lack of model robustness because of variations in data distribution across regions and years (Kumar et al., 2023; Dey et al., 2020).
To improve performance, previous models have usually had high complexity, such as numerous trees and leaf nodes (Zhang et al., 2021; Huang et al., 2021). This practice increases the computational resource requirement and is prone to overfitting, leading to a large gap between the performance of the training and testing data (Zhang et al., 2021; Jabbar and Khan, 2015; Ying, 2019). Therefore, it is necessary to minimize model complexity to avoid overfitting. The Light Gradient-Boosting Machine (LightGBM) is an optimized gradient boosting decision tree (GBDT) (Ke et al., 2017), and it has shown superior performance in many fields (Wei et al., 2021b; Yan et al., 2021; Sun et al., 2020; Liang et al., 2020). LightGBM uses a histogram-based decision tree algorithm along with gradient-based one-side sampling (GOSS), which can save memory and computation time (Ke et al., 2017). Our previous study comparing several commonly used machine learning models found that LightGBM has similar performance to the eXtreme Gradient Boosting (XGBoost) with the highest accuracy, but LightGBM was faster and more robust, with the potential to estimate long-term concentrations of PM in India (Wang et al., 2023c).
In this work, a simple structured, efficient, and robust model based on LightGBM was developed to estimate PM concentration. Three cross-validation methods and separate test datasets were designed to evaluate model performance. Long-term (1980–2022) and open-source datasets with a spatial resolution of 10 km of PM2.5 and PM10 in India were then generated, and the mortalities due to PM2.5-induced diseases were also estimated. The concentration datasets could help with pollution formation analysis, assessment of PM health risks, and air quality management in India.
2.1 Data sources
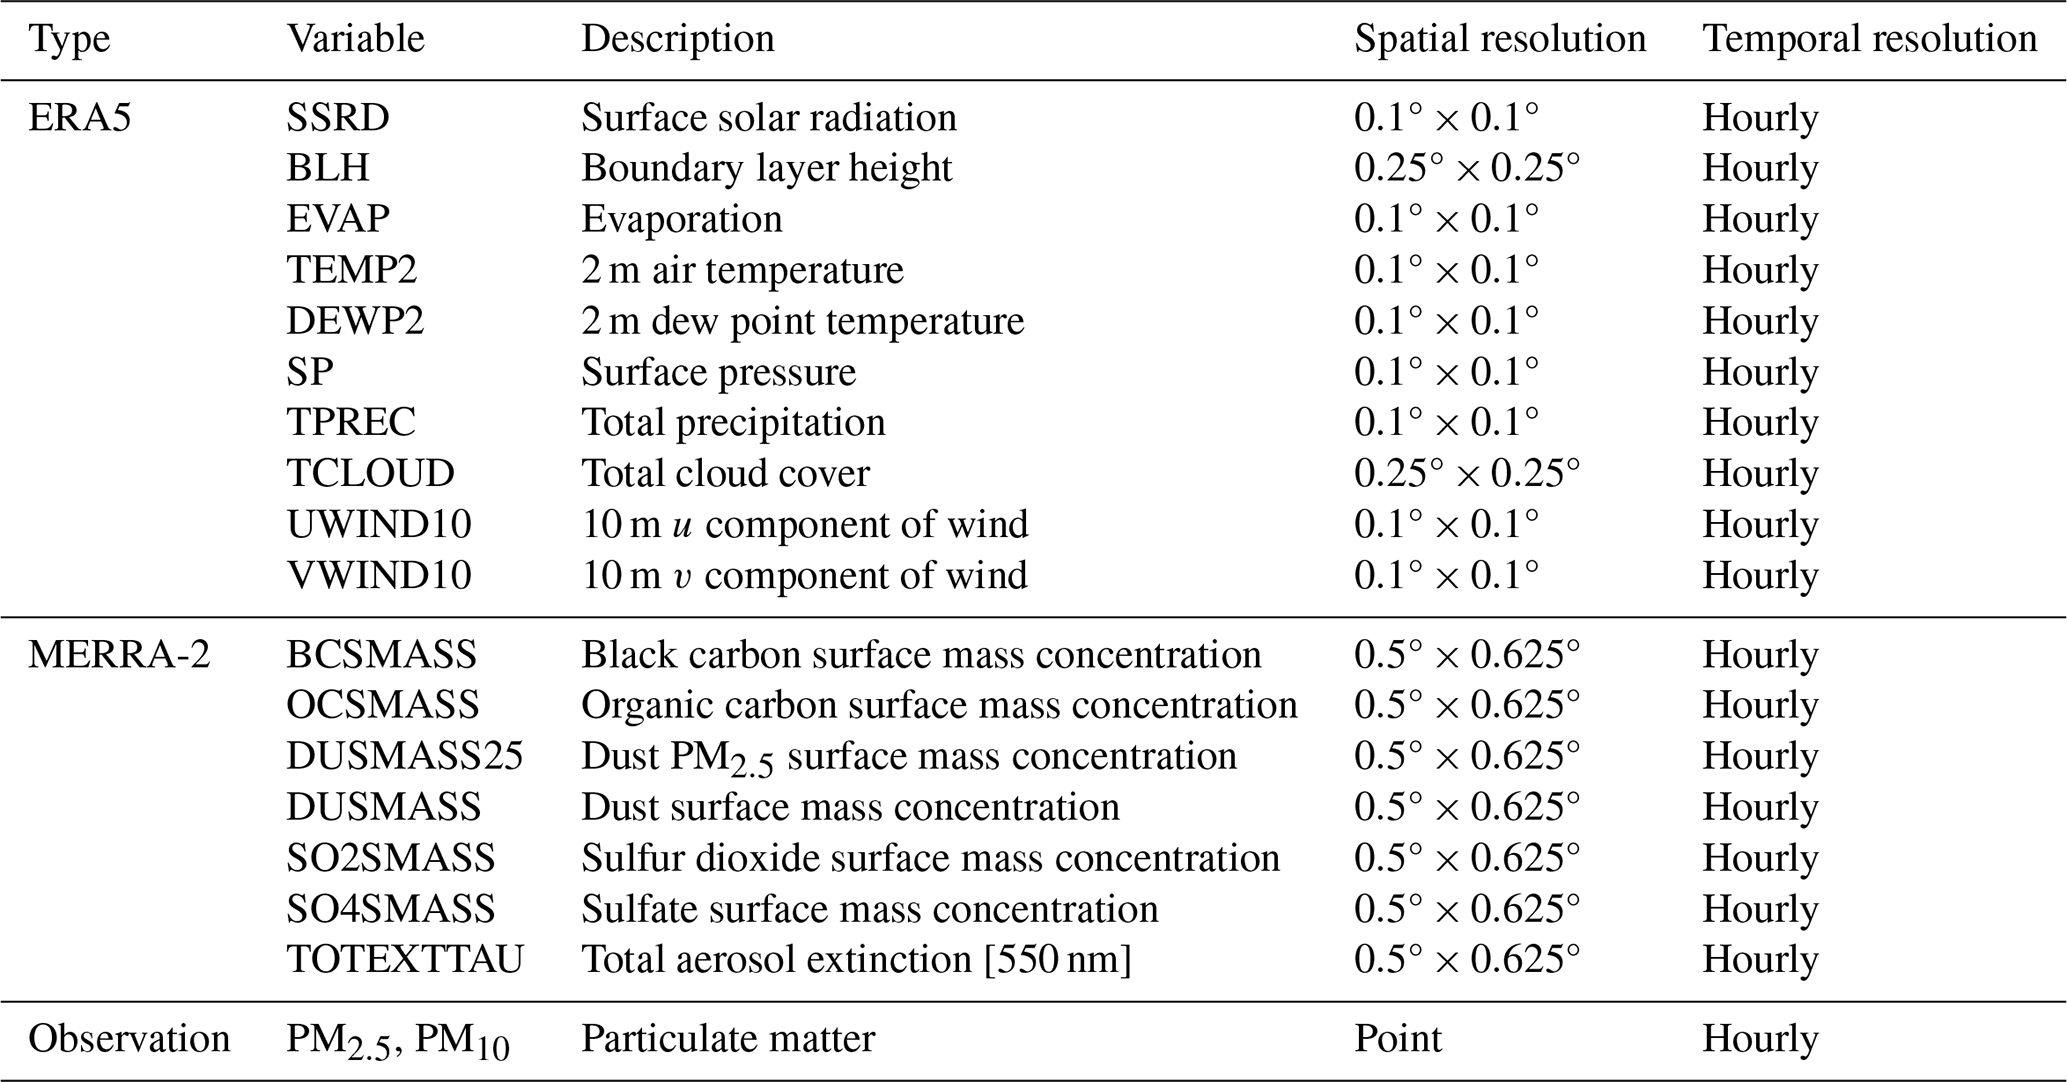
Table 1 shows the multisource datasets used in this study. Ground observations of PM2.5 and PM10 during 2018–2022 in India were collected from the CPCB air quality monitoring network (https://www.cpcb.nic.in, last access: 29 July 2024). The location of monitoring sites is shown in Fig. S1 in the Supplement. As extreme values affect model robustness, the bottom and top 0.01 % of observation data were excluded. The fifth-generation ECMWF atmospheric reanalysis dataset ERA5-Land covering 1980–2022 was used. Features were selected by their relative importance, which was calculated by their gain, and several meteorological factors with high relative importance were included (Table 1). Data products of the Modern-Era Retrospective analysis for Research and Applications, Version 2 (MERRA-2), covering 1980–2022 were also collected, with data including aerosol optical depth and aerosol components and precursors (black carbon, organic carbon, sulfate, dust, and SO2).
Table 1Summary of the ERA5, MERRA-2, and ground observation data used in this study.
2.2 Model building
In this study, LightGBM (Ke et al., 2017), an efficient gradient boosting decision tree (GBDT), was used to estimate PM2.5 and PM10, which has been proven to be accurate, fast, and robust in our previous studies (Wang et al., 2023c, d). A grid search cross-validation (CV) method was used to select the optimal hyperparameters. An algorithm for hyperparameter selection (Algorithm S1 in the Supplement) was designed to ensure the model's generalization ability. Looping is performed to increase the model complexity (e.g., number of trees), followed by ending the loop and returning the hyperparameters when the model-predicted RMSE does not decrease significantly (<0.01) or the difference between the training and predicted RMSE does not increase significantly (<0.05). Features were selected based on their relative importance. Ten meteorological features, six emission-related features, and total aerosol extinction were used to train LightGBM and estimate PM concentrations (Fig. 1). The meteorological and emission features contributed 64 % and 31 % to the PM2.5 prediction.
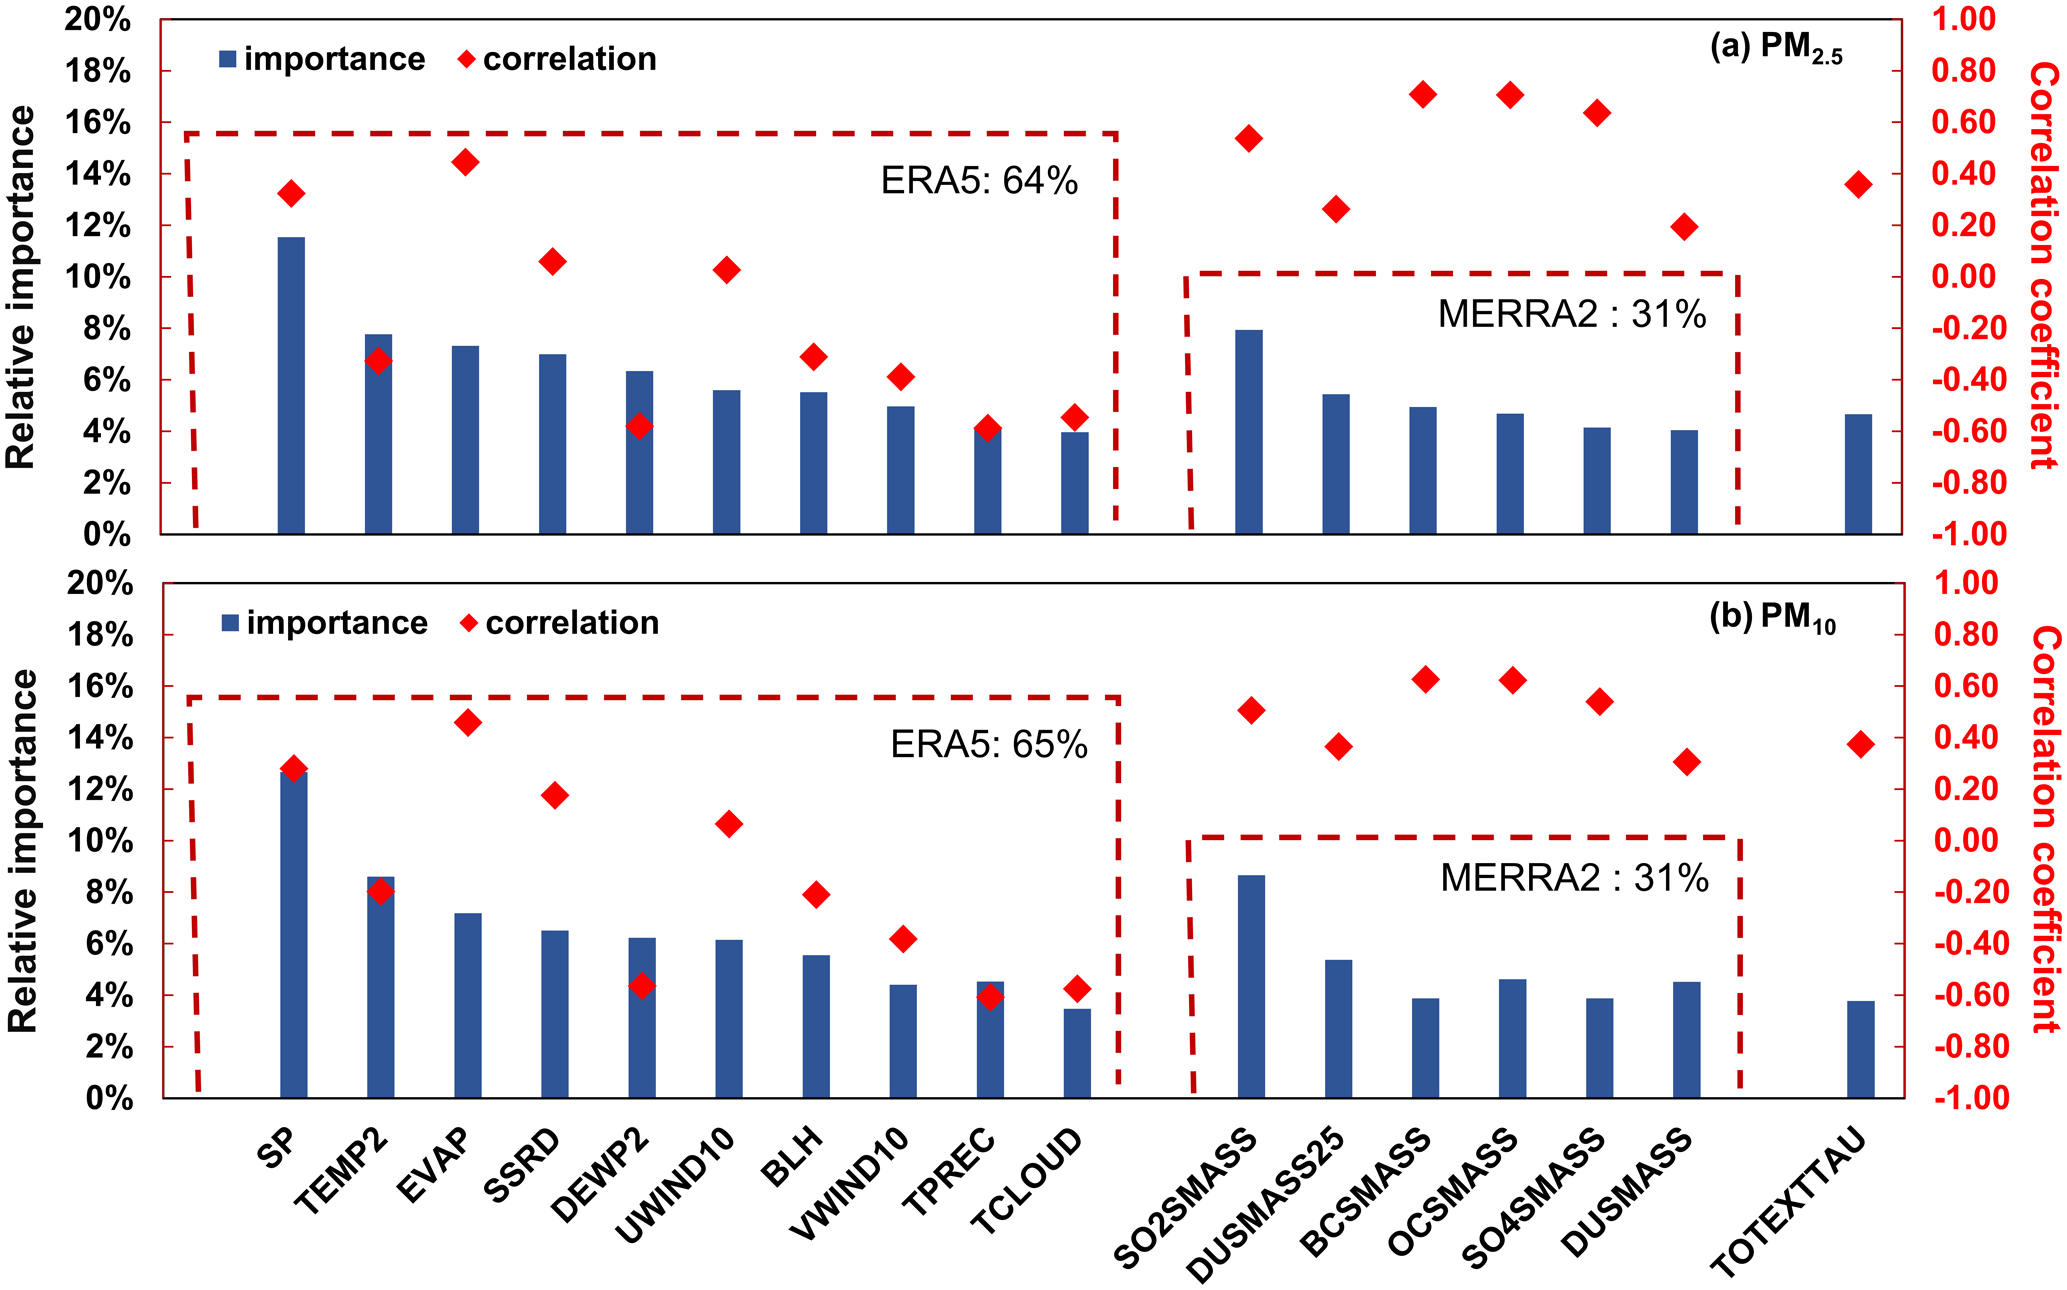
Figure 1Relative importance and correlation coefficient for the PM2.5 and PM10 estimate models. A description of the features is given in Table 1.
Meteorology is more important than emissions. Compared to MERRA-2, which has higher uncertainty and lower spatial resolution, ERA5 has higher resolution and accuracy, and its meteorological features can provide richer information and contribute more in model training and thus have higher importance (Muñoz-Sabater et al., 2021; Hersbach et al., 2020). Besides, more meteorological features were used to train the model, thus contributing more to prediction results. The highest importance of surface pressure can be attributed to the important effect on PM2.5 concentration and its high data quality (Chen et al., 2020; Bauer et al., 2015).
Three independent CV methods and three metrics (coefficient of determination: R2; root mean square error: RMSE; mean absolute error: MAE) were designed to evaluate the model's spatiotemporal predictive power. The first is out-of-sample CV, where the dataset is randomly divided into 10 subsets, 1 of which is taken in turn for testing and the remaining 9 of which are used for training; this is repeated 10 times and averaged. The second is out-of-site CV, which is similar to the out-of-sample CV, but the dataset is randomly divided by site. This method can measure the model's spatial predictive power. The third method is interannual out-of-year CV, which sequentially takes 1 year of data for testing and the rest for training. This approach can measure the model's predictive power for the years with no observations. Besides, observations in January–June 2023 were used as a separate test set, and these data were not involved in any of the training and hyperparameter selection processes.
2.3 Mortality estimation
According to the database of the Global Burden of Disease (GBD) study in 2019 (Murray et al., 2020; Vos et al., 2020), annual average concentrations were used to assess long-term exposure to PM2.5, and premature deaths were assessed using the following equation:
where My,i represents the mortality attributable to cause j due to long-term PM2.5 exposure in year y in region i, RR(Cy,i) represents the relative risk of cause j for year y in region i, Py,i represents the population j in year y in region i, and Iy represents the baseline mortality in year y.
PM2.5 exposure-related deaths due to ischemic heart disease (CVD_IHD), chronic stroke (CVD_stroke), obstructive pulmonary disease (RESP_COPD), lung cancer (NEO_LUNG), lower respiratory infections (LRI), and type 2 diabetes mellitus (T2_DM) were estimated. The gridded population data were obtained from WorldPop datasets (https://www.worldpop.org, last access: 29 July 2024). The relative risk is a discrete value obtained from GBD 2019 and is the relative risk corresponding to each PM2.5 concentration level. Details about the calculation of relative risk can be found in GBD 2019 (Murray et al., 2020). Annual baseline mortality (2000–2019) and the risk of cause-specific deaths at different PM2.5 levels were obtained from GBD 2019. The minimum-risk exposure level for the health effects of PM2.5 is in the range of 2.4 to 5.9 µg m−3.
The LongPMInd dataset, including daily PM2.5 and PM10 concentration (10 km) for India during 1980–2022, is publicly accessible. All data are provided in NetCDF format and can be downloaded at https://doi.org/10.5281/zenodo.10073944 (Wang et al., 2023a).
4.1 Long-term India PM2.5 dataset
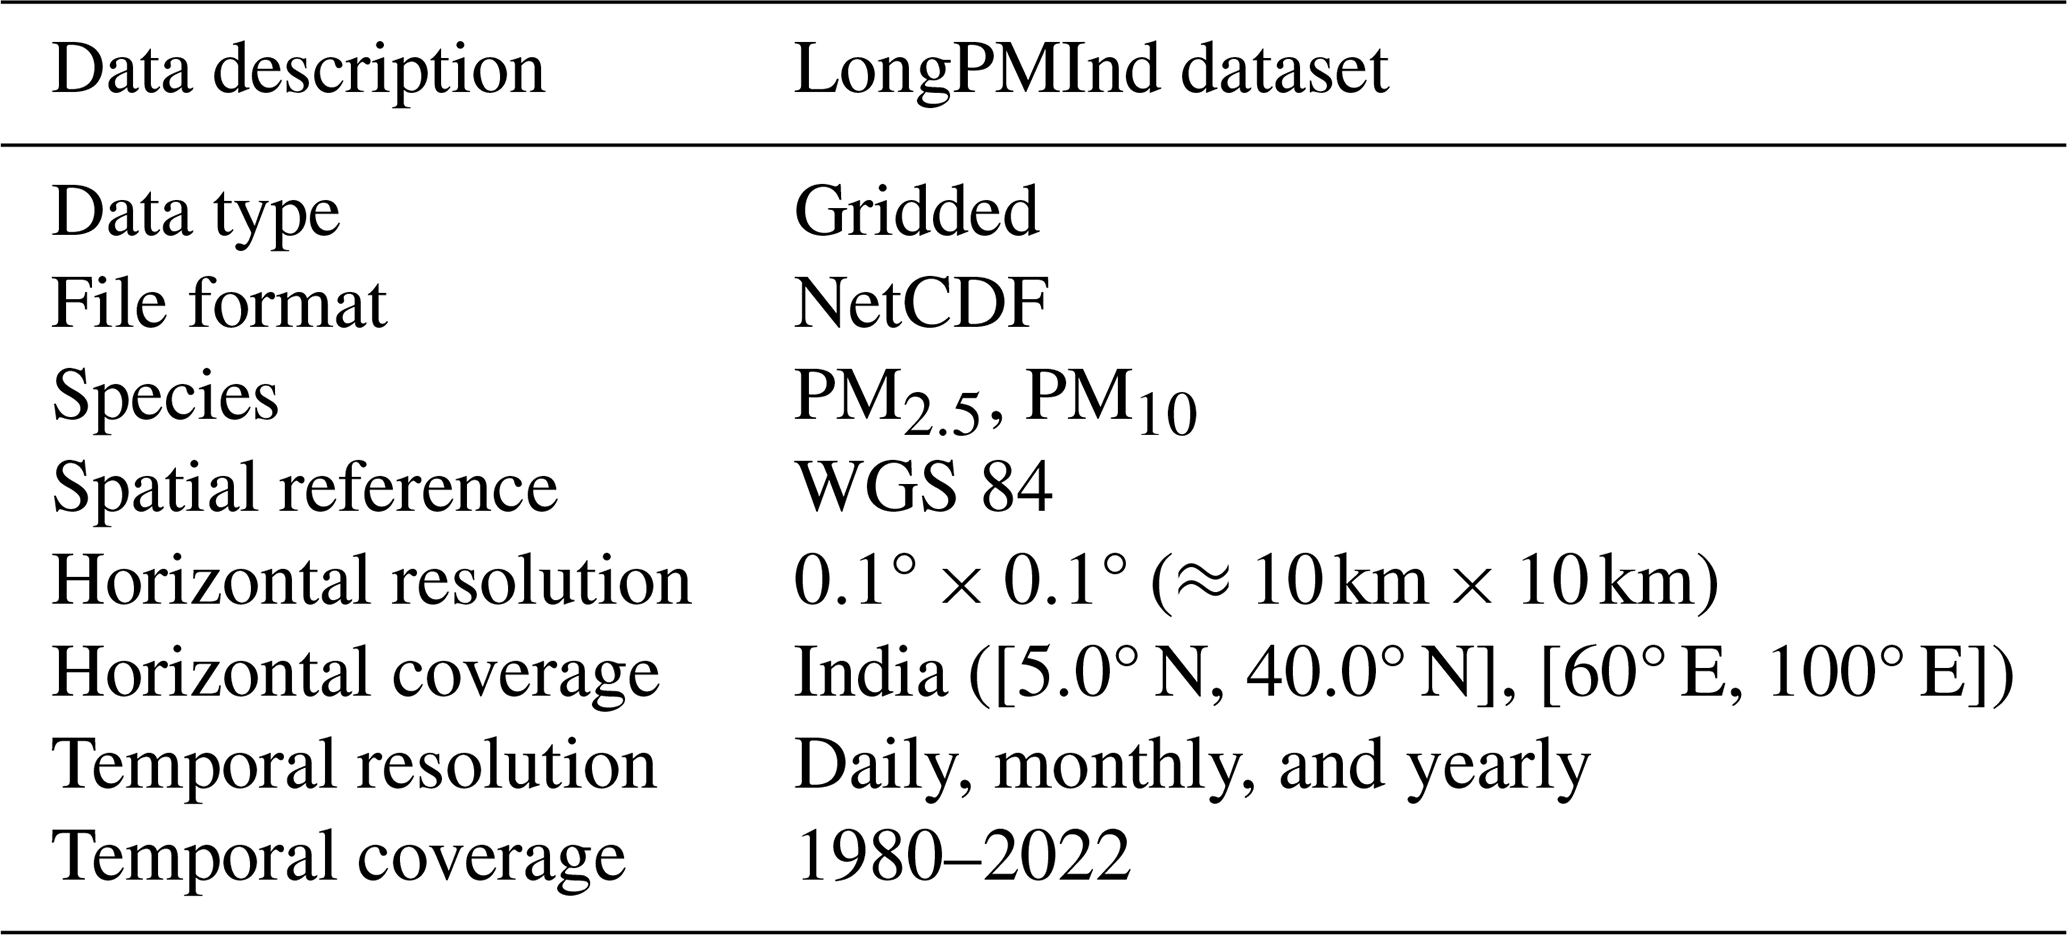
Applying the trained LightGBM model to the large input dataset constructed for the years 1980–2022, the long-term high-quality daily PM2.5 and PM10 products of India (LongPMInd) are reconstructed. Table 2 summarizes basic information about the dataset; the data are provided in NetCDF format with a spatial resolution of 10 km. The LongPMInd dataset, to the best of our knowledge, is the first open-source, long-term (i.e., 1980–2022), and relatively high accuracy dataset covering the whole of India. The daily, monthly, and yearly PM2.5 and PM10 datasets are publicly available at https://doi.org/10.5281/zenodo.10073944 (Wang et al., 2023a).
4.2 Model performance
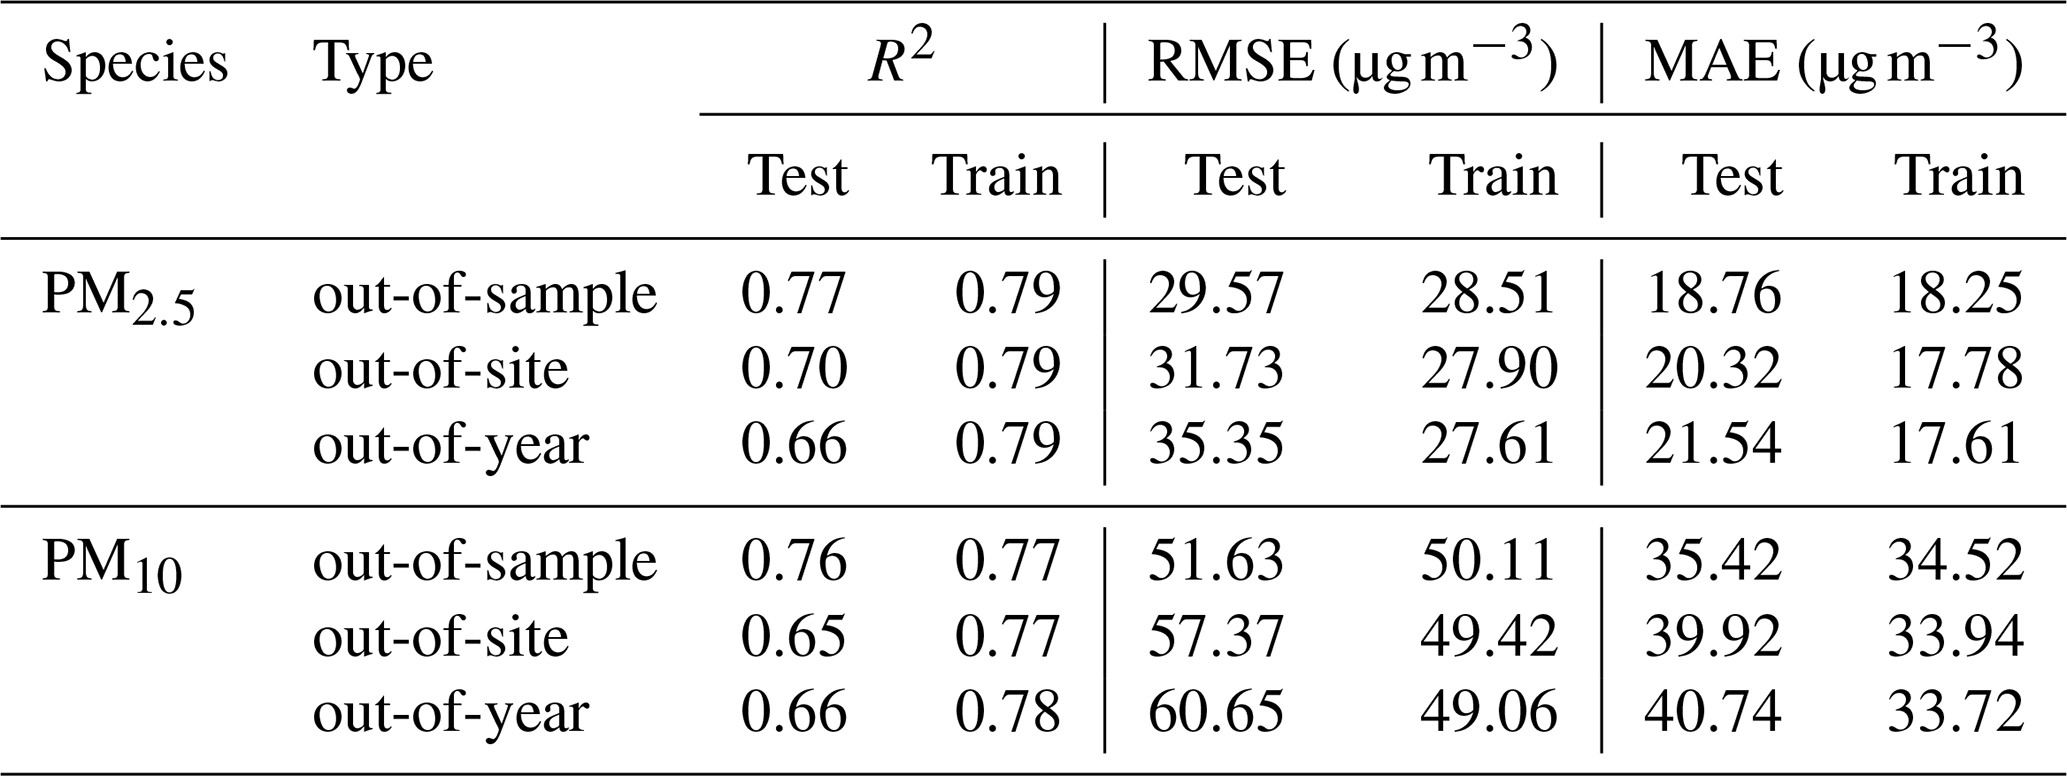
Table 3 shows the training and testing results of out-of-sample CV, out-of-site CV, and out-of-year CV for daily PM2.5 and PM10. Overall, the model shows good accuracy, with out-of-sample CV R2 values of 0.77 and 0.76 and RMSE of 29.57 and 51.63 µg m−3 for daily PM2.5 and PM10. Monthly predictions show better performance, with out-of-sample CV R2 values of 0.87 and 0.86 and RMSE of 17.65 and 31.26 µg m−3 for monthly PM2.5 and PM10. More importantly, out-of-sample CV results of training and testing showed small accuracy gaps with RMSE and MAE of 1.06 (4 %) and 0.51 (3 %) µg m−3 for PM2.5 and 1.52 (3 %) and 0.9 (3 %) µg m−3 for PM10, reflecting good generalization ability. Out-of-site CV measures the model's predictive ability for unobserved areas. The spatially validated R2 and RMSE for PM2.5 and PM10 were 0.70 and 0.65 and 31.73 and 51.37 µg m−3, respectively, indicating the model's ability to fill the unobserved areas accurately. The small performance gap between out-of-site CV training and testing also reflects good spatial generalization ability. Observations before 2018 are limited due to the number and quality of sites. Out-of-year CV was used to evaluate LightGBM prediction performance, which was conducted by sequentially taking 1 year of data for testing and the rest for training. The model's prediction accuracy for unobserved years decreases slightly compared to out-of-sample CV (R2 decreases by 14 %, and RMSE increases by 20 %) due to differences in data distributions among years (Fig. S2). Notably, most predictions are consistent with observations, with most data samples evenly distributed around the 1:1 line (Fig. S3) but with underestimation for high PM levels and overestimation for low PM levels (slopes of 0.75 and 0.74 and intercepts of 16.45 and 35.79 µg m−3 for daily PM2.5 and PM10 predictions). Monthly predictions show better agreement with observations, with slopes of 0.84 and 0.82 and intercepts of 10.26 and 23.53 µg m−3 for monthly PM2.5 and PM10. The underestimation and overestimation indicate the potential unreliability of model predictions for extreme pollution and extreme clean days. This can be attributed to the small proportion of data records for extreme pollution and clean days.
Table 3Training and testing results of out-of-sample CV, out-of-site CV, and out-of-year CV for daily PM2.5 and PM10 (2018–2022). RMSE and MAE unit: µg m−3.
Observations from January to June 2023 were used for testing and were not involved in any training or hyperparameter selection processes (Fig. S4 and Table S1 in the Supplement). Six representative regions were selected for the analysis including Delhi and Uttar Pradesh (the Indo-Gangetic Plain – IGP – region), Gujarat (western India region), Madhya Pradesh (central India region), West Bengal (eastern India region), and Andhra Pradesh (southern India region). The model shows accurate prediction ability with RMSE of 33.58 and 64.25 µg m−3 for PM2.5 and PM10, respectively, in India. The model can capture the decreasing trend in PM concentration from January to June in different regions of India but with some biases, e.g., overestimation of PM2.5 in Uttar Pradesh on 8 January and underestimation of haze pollution in Gujarat on 19 February. The large RMSE of PM2.5 prediction in Uttar Pradesh (32.72 µg m−3) could be attributed to the complexity of pollution causes in the region as well as insufficient observation data. The small RMSE (8.34 µg m−3) of PM2.5 prediction in Andhra Pradesh can be related to the light haze pollution and small fluctuation in PM2.5 concentration.
4.3 Spatial and temporal trends
First, spatial patterns of PM2.5 and PM10 are analyzed (Figs. S5 and S6). The Indo-Gangetic Plain (IGP) and western arid regions show high levels of PM2.5 and PM10, especially for years after 2000. Low PM concentrations were observed in southern India. The high terrain in the northern and southern IGP is unfavorable for pollutant dispersion. Intense human activities in the IGP (population >700 million) emit large quantities of primary PM and gas pollutants (SO2 and nitrogen oxide), and this, coupled with unfavorable dispersion conditions, leads to severe PM pollution (Dey et al., 2020; Maheshwarkar et al., 2022). Both PM2.5 and PM10 concentrations show a north-to-south (high-to-low) distribution, consistent with the population distribution and corresponding anthropogenic emissions (Upadhyay et al., 2020; Dey et al., 2020).
Figure 2 shows the spatial patterns of seasonal PM2.5 and PM10 anomalies. The highest PM levels occurred in winter, especially in the IGP (positive anomaly >20 µg m−3 relative to the annual mean during 1980–2022). This enhancement is related to additional anthropogenic emissions (from space and water heating of households especially in cold places like the IGP) and stable meteorological conditions (low boundary layer height and low wind speed) (Pandey et al., 2014; Tiwari et al., 2013). During the pre-monsoon season (March–April–May), favorable meteorological conditions (increased boundary layer height due to increased temperature and wind speeds) reduce PM2.5 concentrations in the IGP area (Dey et al., 2020). During the monsoon season (June to September), rainfall enhances PM deposition, resulting in a substantial reduction in PM concentrations. With the end of the monsoon (post-monsoon season, October and November), less rainfall, lower temperatures, extensive open biomass burning (for heating), and reduced boundary layer heights exacerbate PM pollution (Nagpure et al., 2015; Kumari et al., 2021).
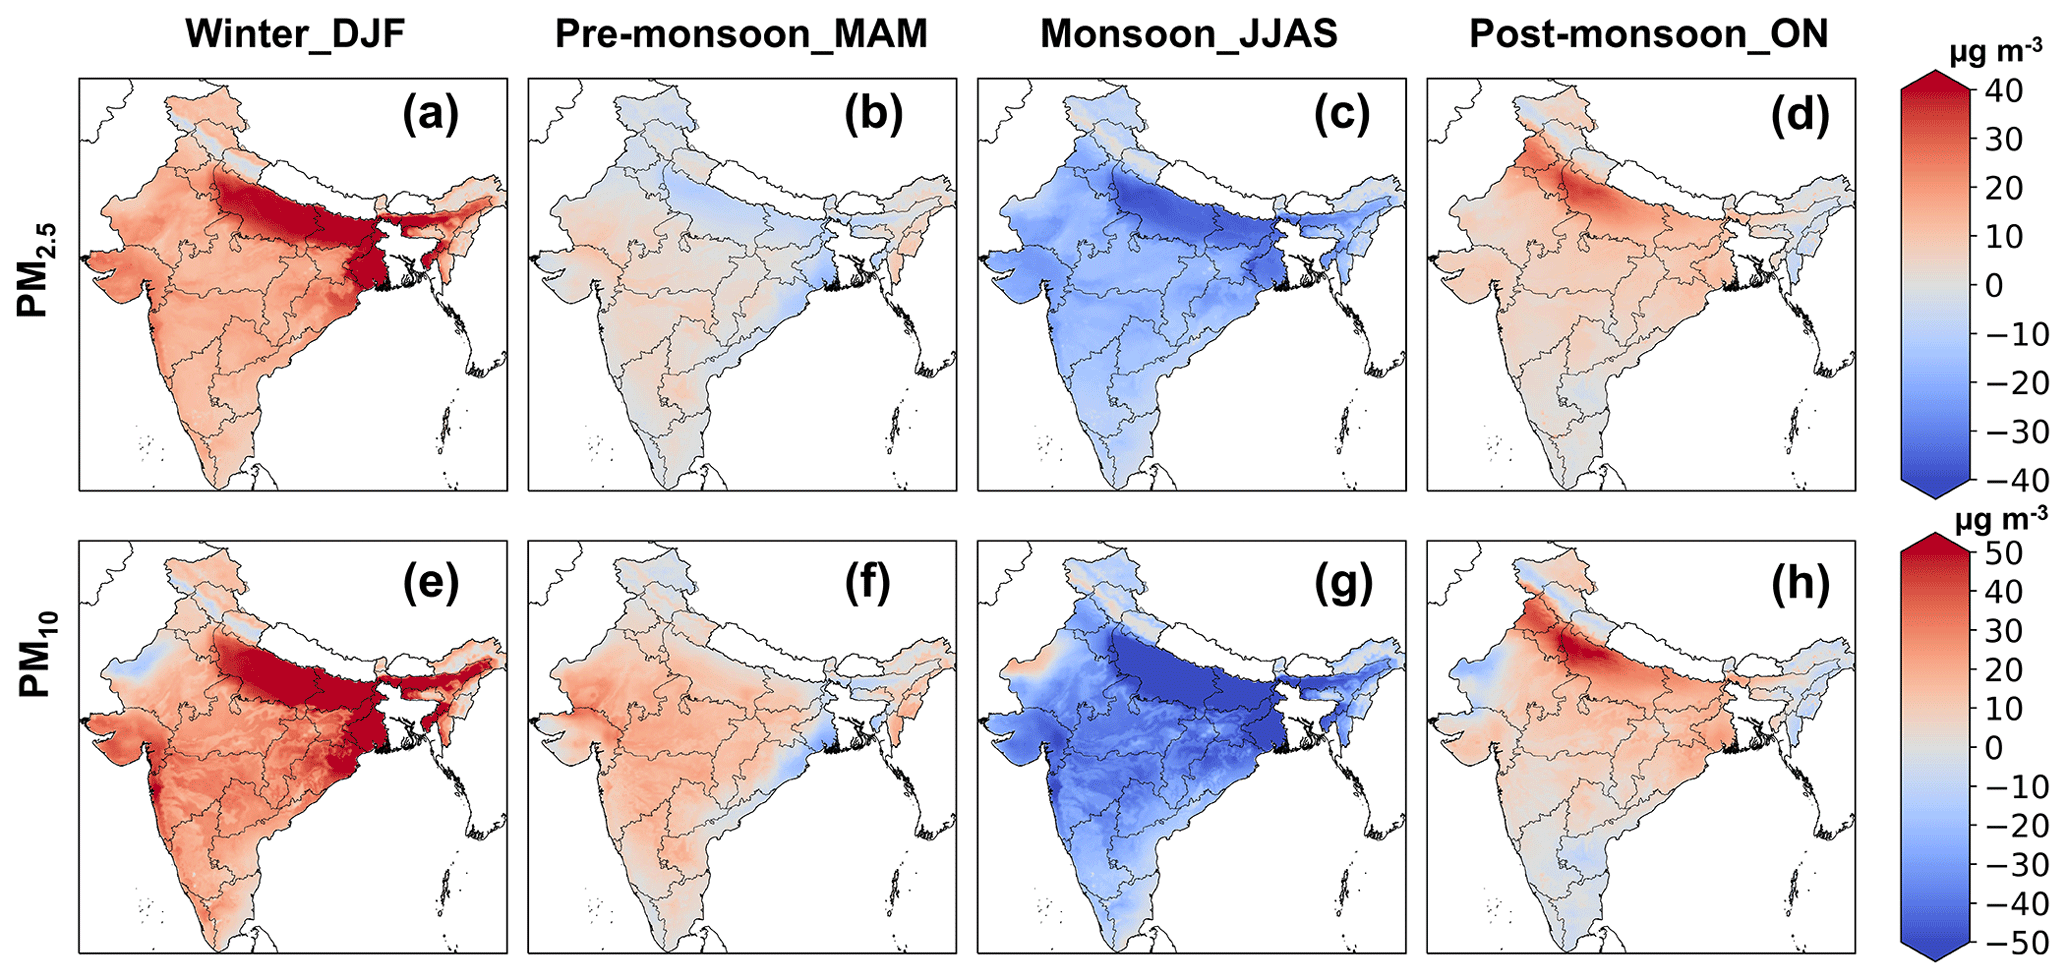
Figure 2Spatial patterns of seasonal PM2.5 and PM10 anomalies (the difference between the seasonal mean and annual mean) in India during 1980–2022.
The long-term trends of aerosols in India can be better examined given the advantage of long temporal coverage of the LongPMInd dataset. The monthly PM2.5 and PM10 anomalies from 1980 to 2022 in India and typical regions were first calculated (Figs. 3 and S7). PM concentrations slowly increased in India (0.19 ) before 2000; in the IGP and eastern India, they increased by 0.43 and 0.26 , respectively. The PM concentrations jumped in 2000, which can be attributed to the absence of satellite data for MERRA-2 before 2000 (Buchard et al., 2017). The MERRA-2 dataset before 2000 could not provide the same level of data quality as in the later period, further leading to a systematic bias in the model estimates. With accelerated industrialization, anthropogenic emissions of primary particulate matter (PPM) and precursors of secondary aerosols (e.g., SO2, NO, and NH3) have increased since 2000 (Pandey et al., 2014; Nagpure et al., 2015), leading to significant increases in PM concentrations in most regions (p<0.05), except for western India (Figs. 4 and S8). PM2.5 increased by 0.50 and 0.46 in the IGP and eastern India during 2000–2017. In early 2018, the Indian government launched the National Clean Air Programme (NCAP). The interventions were grouped into transport, industry, waste management, domestic, and construction activities as well as road dust and others (Ganguly et al., 2020). Emissions declined rapidly, and PM2.5 concentrations declined significantly in the IGP (1.63 ), western India (1.22 ), and southern India (0.52 ). However, PM concentrations in east-central India showed an increasing trend (Fig. 4), which may be related to emissions from mining activities and related industries and thermal power plants (Upadhyay et al., 2020).
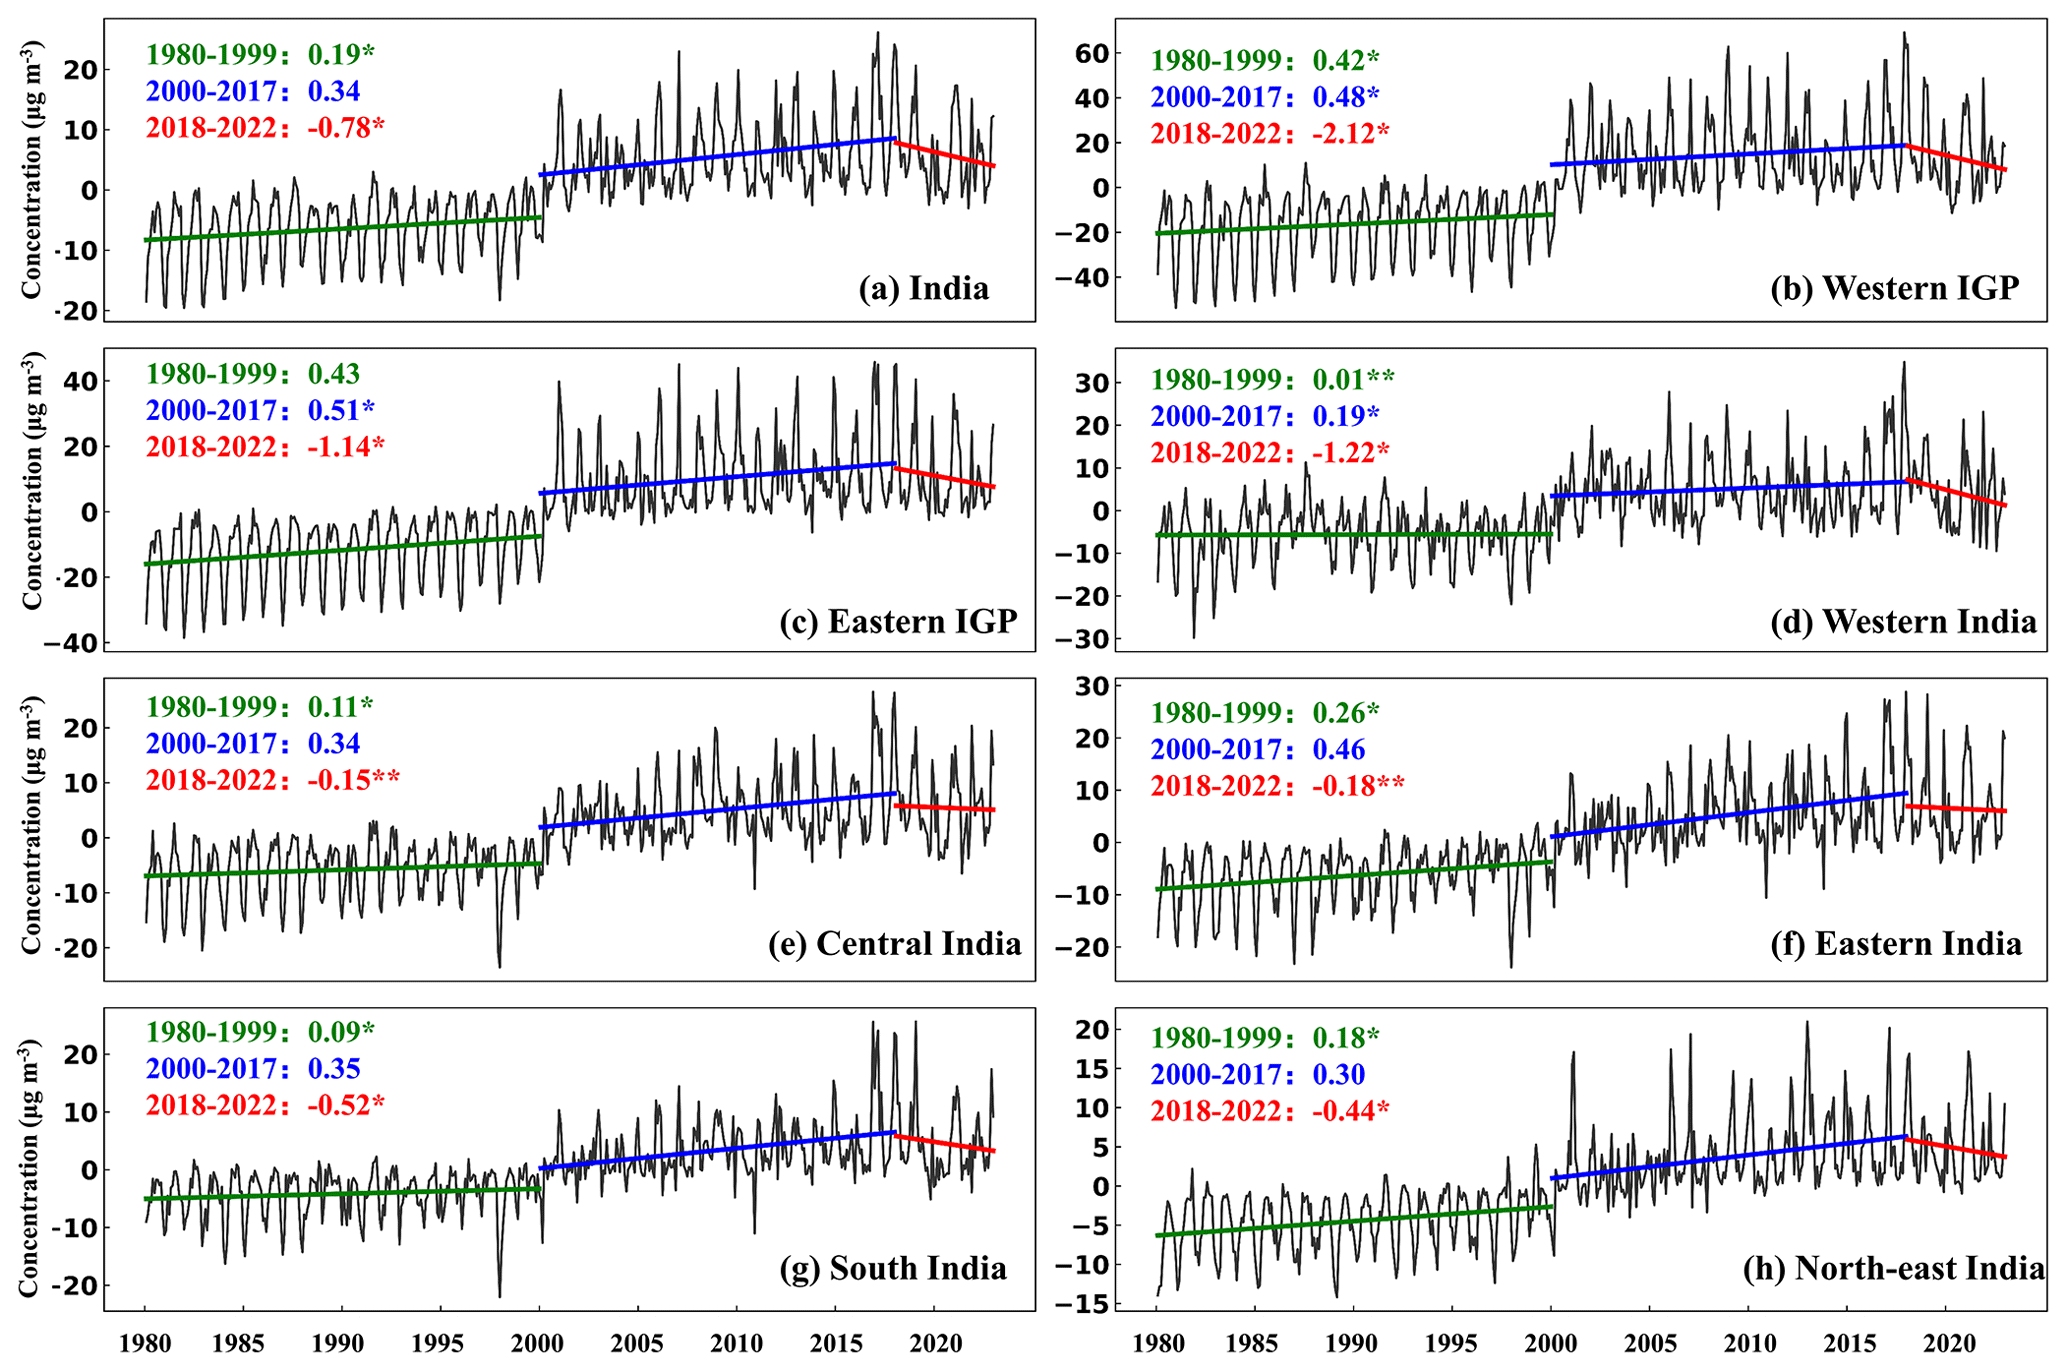
Figure 3Time series of the monthly PM2.5 anomaly from 1980 to 2022 in India (overall and regionally). The colored straight lines are the linear regression trend () for different periods in China, and ∗ represent the significance of the trends (∗ mean p<0.05 and mean p<0.01).
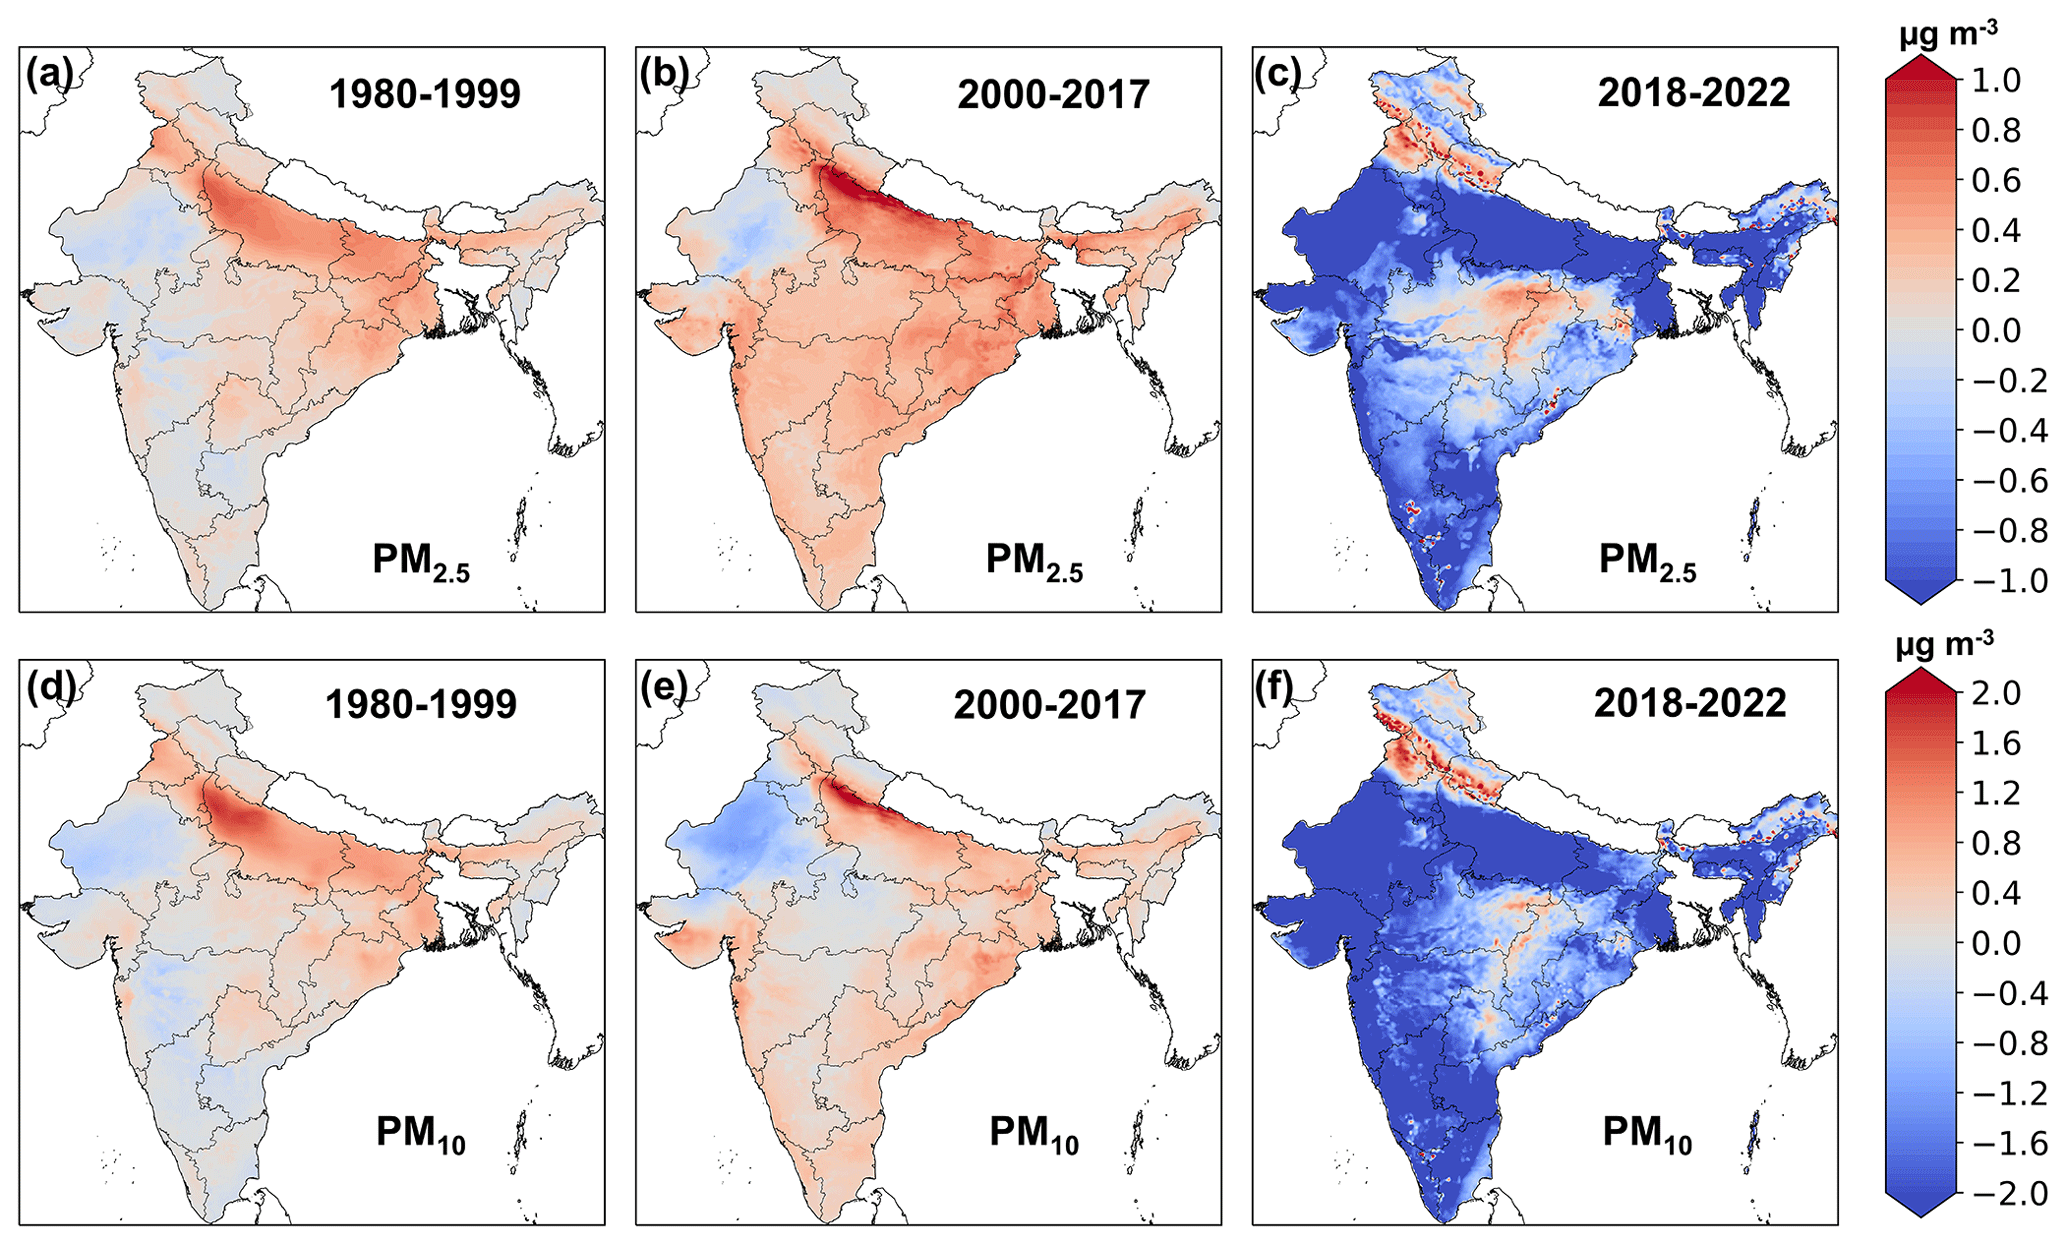
Figure 4Spatial patterns of annual changes for PM2.5 and PM10 () during different periods (1980–1999, 2000–2017, and 2018–2022). Publisher's remark: please note that the above figure contains disputed territories.
4.4 Health burden analysis
The health burden of PM2.5 was estimated from 2000–2019 following the rapid increase in PM2.5 concentrations after 2000. Using GBD 2019, premature deaths attributed to PM2.5 exposure were calculated for six diseases, comprising ischemic heart disease (CVD_IHD), chronic stroke (CVD_stroke), obstructive pulmonary disease (RESP_COPD), lung cancer (NEO_LUNG), lower respiratory infections (LRI), and diabetes mellitus type 2 (T2_DM) (Murray et al., 2020; Vos et al., 2020).
Figure 5 shows the changes in annual average PM2.5 concentrations and corresponding attributed deaths, and Table S2 shows the related uncertainties. PM2.5 concentrations showed a fluctuating upward trend with a continuous increase in attributable premature mortality, from 0.73 (95 % confidence interval (CI) [0.65, 0.80]) million premature deaths in 2000 to 1.22 (95 % CI [1.03, 1.41]) million in 2019, with CVD_IHD, CVD_stroke, RESP_COPD, NEO_LUNG, LRI, and T2_DM causing an annual average of 0.35 million, 0.21 million, 0.21 million, 0.02 million, 0.12 million, and 0.04 million premature deaths, respectively. PM2.5-attributable deaths were counted by region (Fig. 5). The IGP had the highest attributable premature deaths, increasing from 0.36 million in 2000 to 0.60 million in 2019, due to high population density coupled with severe haze pollution (Dey et al., 2020; Pandey et al., 2021).
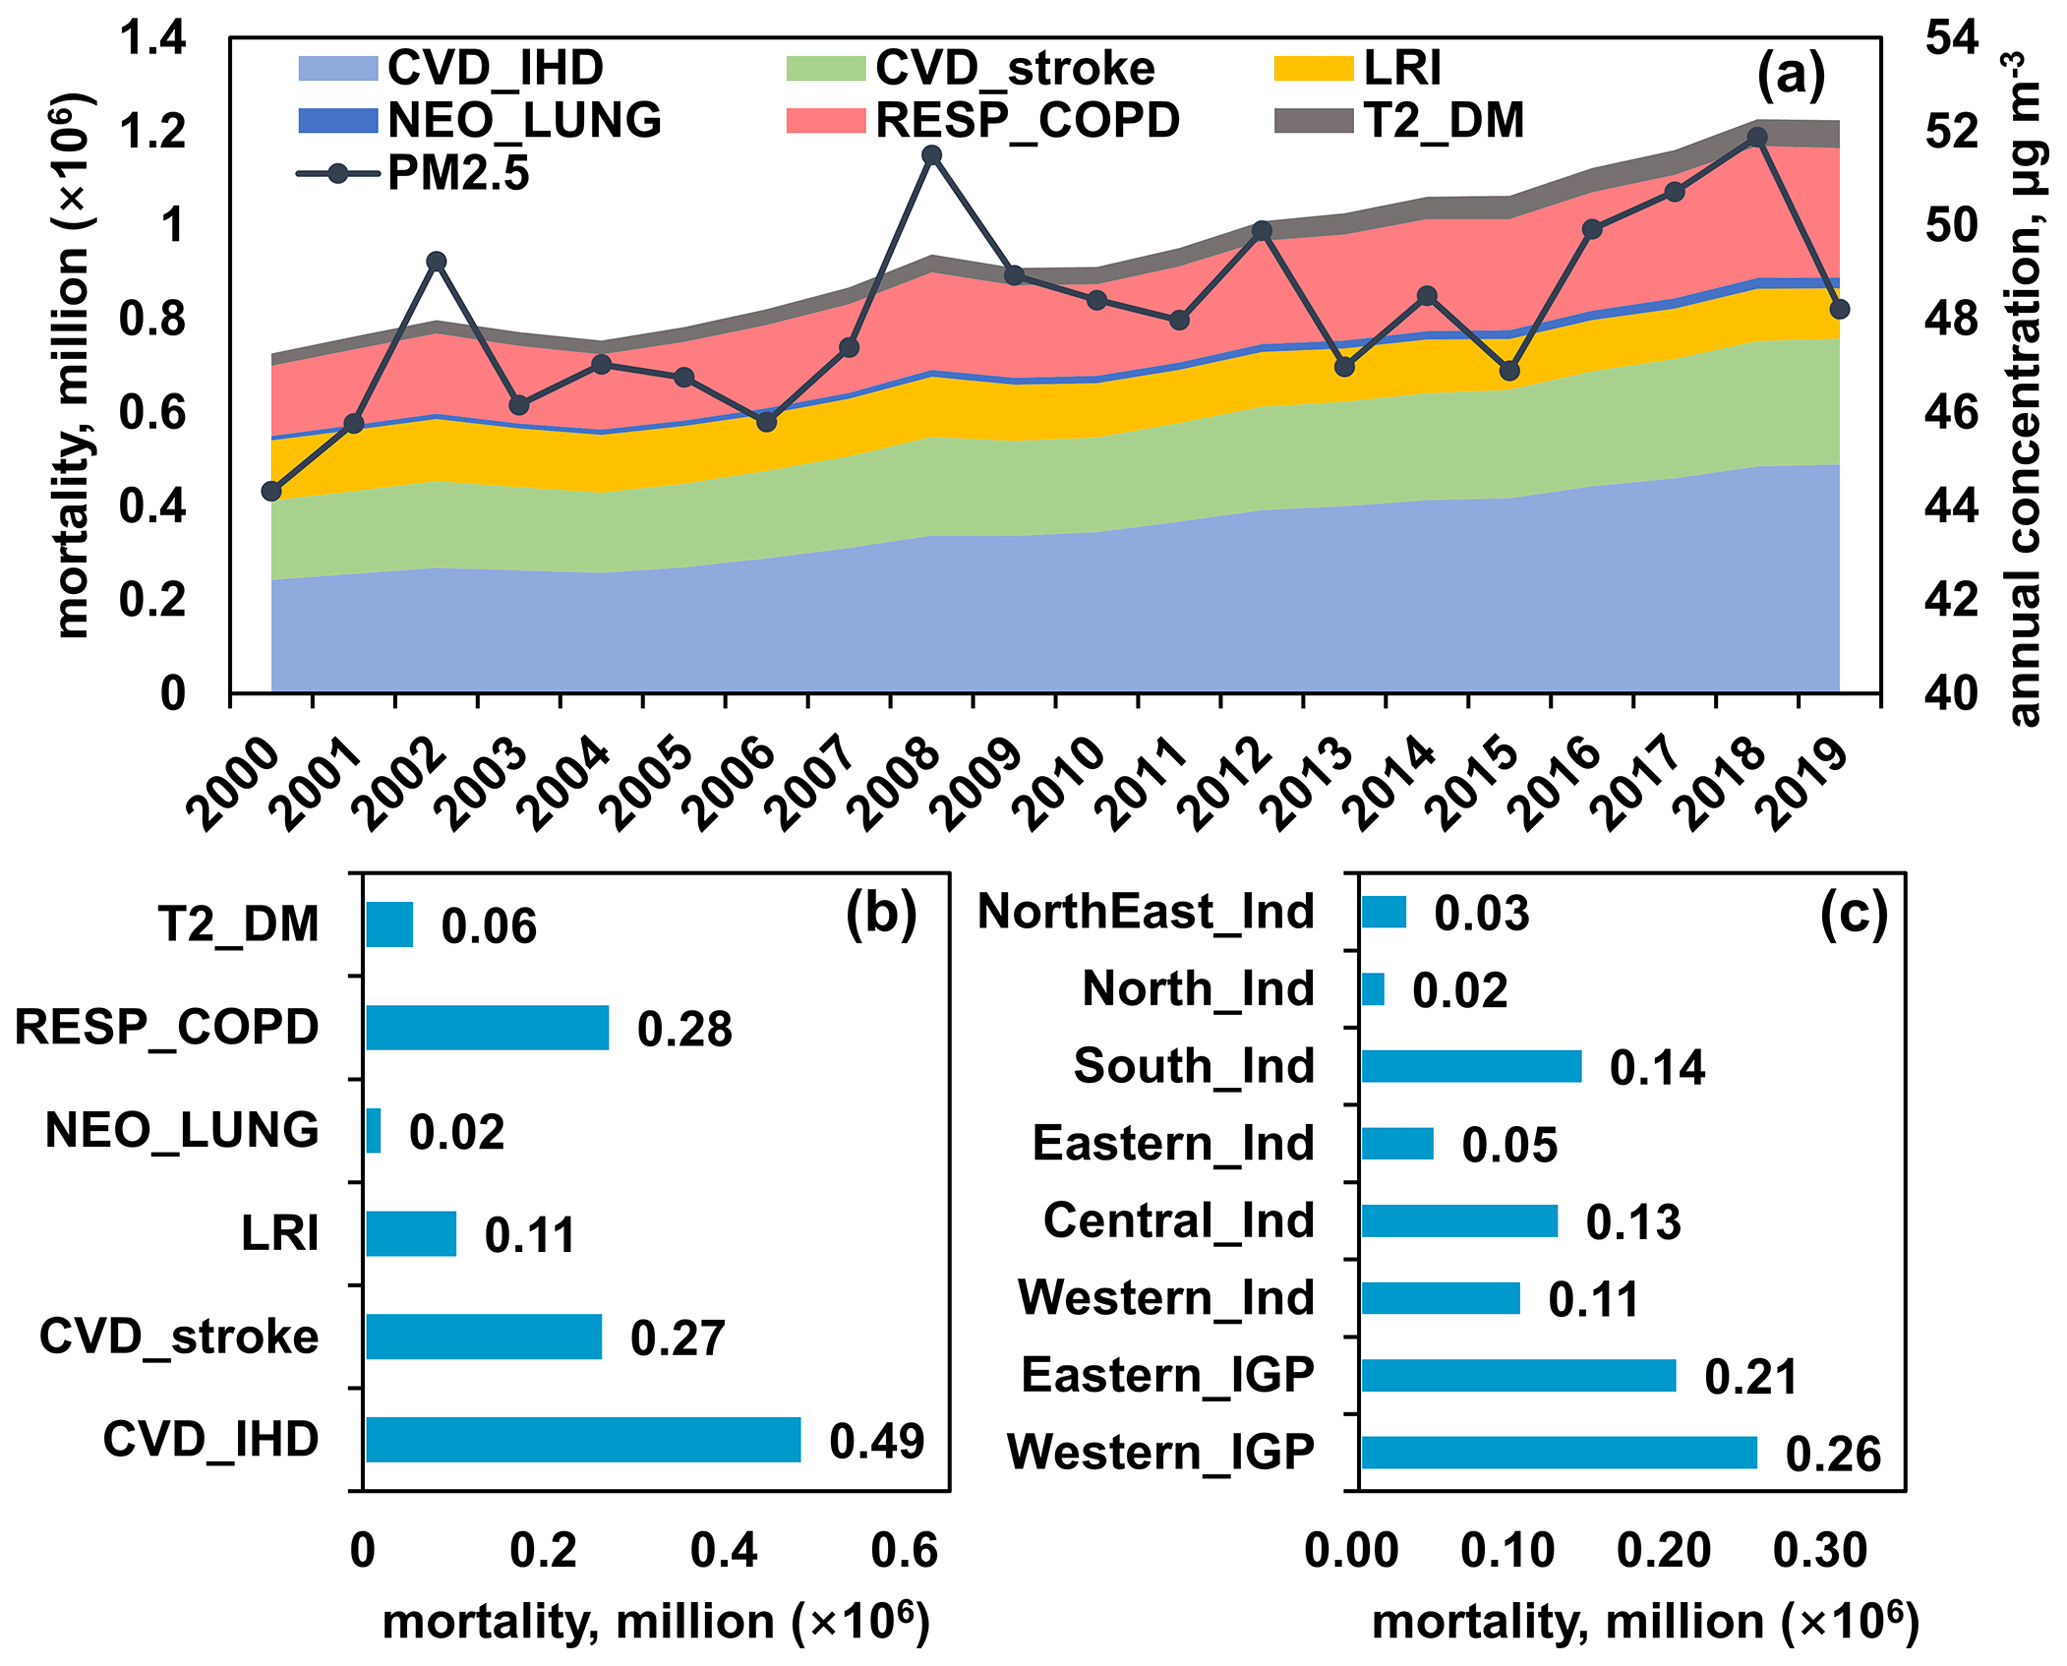
Figure 5Annual mortalities due to PM2.5-induced diseases in India during 2000–2019, including ischemic heart disease (CVD_IHD), chronic stroke (CVD_stroke), obstructive pulmonary disease (RESP_COPD), lung cancer (NEO_LUNG), lower respiratory infections (LRI), and diabetes mellitus type 2 (T2_DM). Panels (b) and (c) show statistical results for causes and regions.
To reduce premature deaths from PM2.5 exposure, policies to mitigate PM2.5 pollution should be implemented. In addition, appropriate health advice and enhanced medical facilities to reduce baseline mortality are also important to reduce the health burden (Maji et al., 2023). India has experienced rapid urbanization and large-scale population migration, which introduces uncertainty into health risk estimates for PM2.5 (Shi et al., 2020). Country-level baseline disease rates were used, so regional differences were not accounted for due to lack of data, which could introduce some error. In addition, uncertainties in relative risk, population, and PM2.5 concentrations may also introduce errors into health risk estimates.
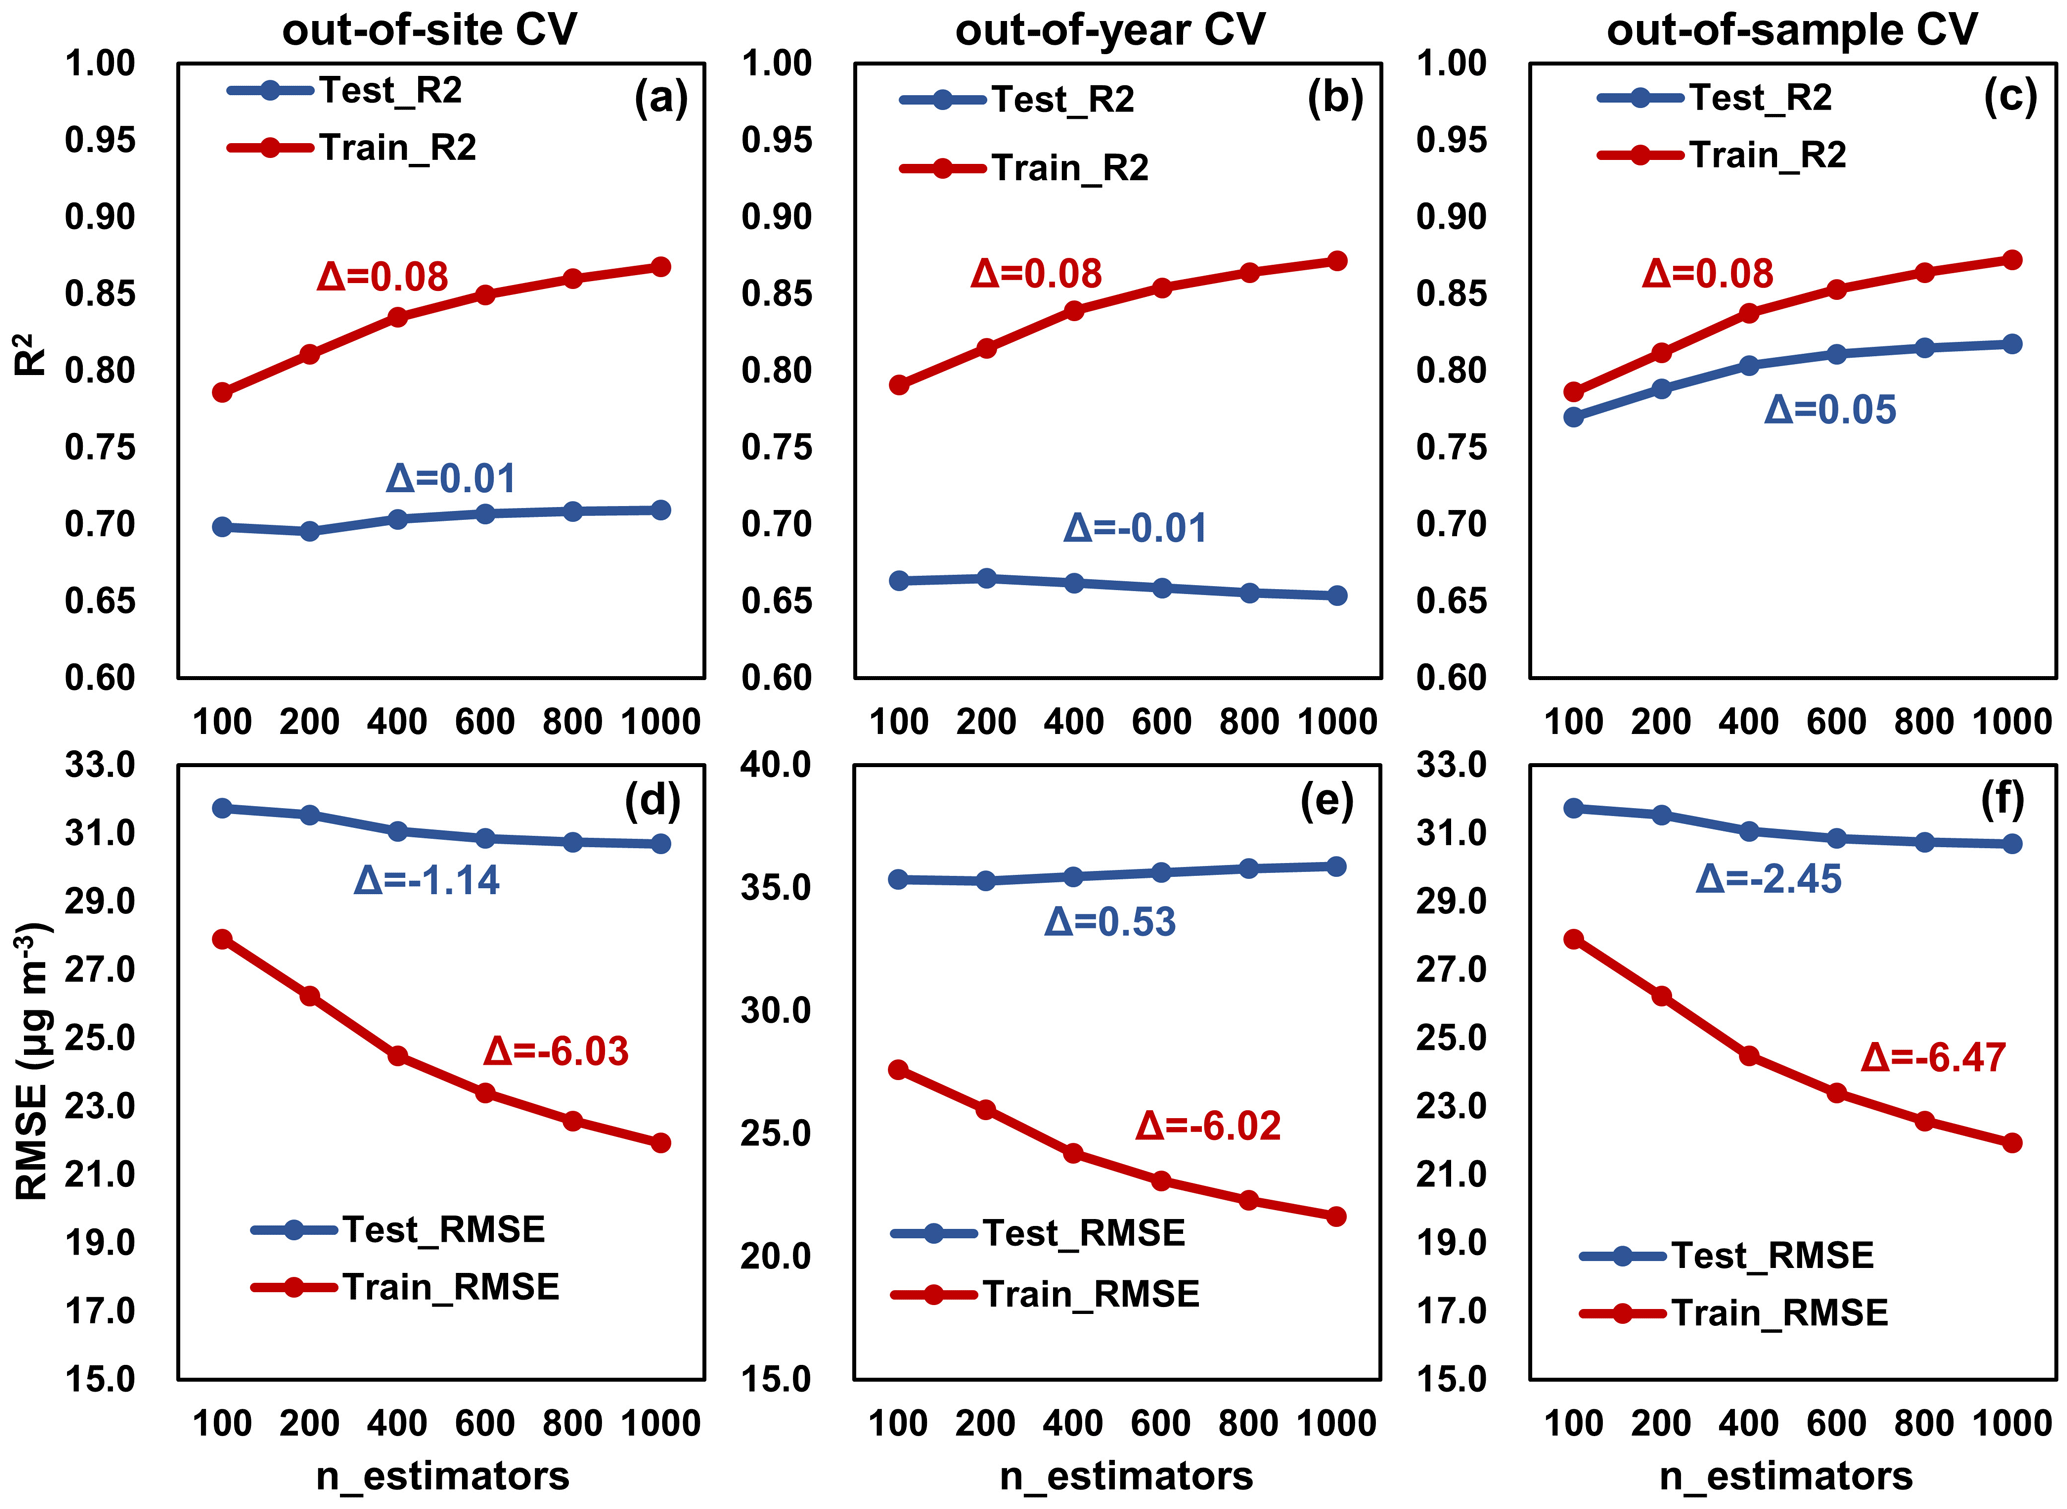
Figure 6Three CV results of the model complexity test for PM2.5 estimation. The n_estimators is the number of trees, representing the complexity of LightGBM. Δ is the difference between the metrics with n_estimators=1000 and n_estimators=100. Units of RMSE and MAE are µg m−3.
4.5 Model complexity
Model complexity can be measured by the number of parameters the model has. As model complexity increases, the model is more capable of learning complex patterns in the data, but at the same time, it may lead to overfitting and inaccurate predictions of new and unseen data (Hu et al., 2021). The impact of the complexity of the tree-based LightGBM model on the performance of training and testing is analyzed (Fig. 6). The number of trees (n_estimators) was used as a complexity proxy, and the other hyperparameters were kept constant. All three cross-validation results show that the increase in model complexity improves the model's fitting ability, increasing R2 and decreasing RMSE. However, the increase in complexity did not improve the model's predictive performance. With n_estimators increasing from 100 to 1000, there was no significant change in R2 for the out-of-site and out-of-year CV (−0.01 to 0.01), and the RMSE for the out-of-year CV on the contrary increased by 0.53. Out-of-sample CV showed an improvement in R2 but with a limited reduction in RMSE (−2.45). Therefore, using only out-of-sample CV to select hyperparameters and evaluate the model is limiting, and out-of-site and out-of-year CV allows a more objective evaluation of the model's generalization ability.
4.6 Uncertainties
Uncertainty in this study comes from two main sources: the machine learning model and the dataset used. Firstly, machine learning is essentially based on probability theory and is influenced by the distribution pattern of the target variable (PM2.5 and PM10) (Yang et al., 2021; Breiman, 2001). Due to the low frequency of extreme pollution scenarios, the model suffers from the problem of smoothing predictions, i.e., underestimating high-pollution scenarios (Wei et al., 2021a; Yu et al., 2023; Geng et al., 2021). In addition, machine learning has limitations in describing atmospheric physical and chemical processes, and it is difficult to fit complex, logistically long processes, such as secondary aerosol generation (Stirnberg et al., 2021; Li et al., 2023). Attempts have been made to incorporate physical constraints into neural networks to improve interpretability, but this approach is limited to spatially continuous two-dimensional data (Geiss et al., 2022). Other studies have shown that chemical reaction processes can be described by neural networks, but it is still a challenge to efficiently couple them with CTMs (Huang et al., 2022; Huang and Seinfeld, 2022).
The second aspect is the uncertainties caused by the datasets. First, the label (observations) and corresponding features (MERRA-2 and ERA5) have a long-tailed distribution with few high-pollution records, so there is an issue of imbalance regression (Yang et al., 2021). The model was trained with a bias towards denser observations, leading to the underestimation of high-pollution scenarios. For the problem of imbalanced regression, there are currently mainly data-based solutions and model-based solutions (J. Ren et al., 2022). Data-based solutions require acquiring more data or changing the data distribution by resampling. Model-based solutions increase the weighting of fewer samples (high-pollution scenarios) by modifying the loss function. Both methods can improve the accuracy of fewer samples, but they are not suitable for the task of this study because the distribution of the data was altered. Therefore, more observations should be collected in the future to increase observations recorded for high-pollution scenarios and mitigate the problem of imbalanced regression. In addition, observational data can only be collected for recent years (2018–2022), which may lead to uncertainties when inferring PM concentrations for historical years. In out-of-year validation, the gap between training and testing is mainly attributed to the difference in the data distribution among years (data drift, Fig. S2). Besides, changes in climate and human activities over the decades may affect the relationship among emissions, meteorology, and PM concentrations, resulting in extra uncertainty (concept drift).
Secondly, the uncertainty in the input feature sets (ERA5 and MERRA-2) also affects the estimation results. The uncertainty in ERA5, a widely used meteorological reanalysis dataset, has been systematically analyzed. ERA5 has good accuracy for most meteorological factors, exceeding other reanalysis data (Muñoz-Sabater et al., 2021; Hersbach et al., 2020). With MODIS data as a reference, the global mean surface temperature of ERA5-Land shows lower uncertainty (Muñoz-Sabater et al., 2021). For precipitation, ERA5 shows 77 % correlation with monthly mean Global Precipitation Climatology Project (GPCP) data (Hersbach et al., 2020). Compared to the pre-assimilation data, ERA5-Land provides an improved fit to tropospheric winds and humidity (Hersbach et al., 2020).
MERRA-2 is a global air pollution reanalysis dataset, published and maintained by NASA; it has been widely used for PM pollution studies in the Indian region, and its reliability has been extensively analyzed (Gueymard and Yang, 2020; Navinya et al., 2020; Buchard et al., 2017). For MERRA-2 AOD, evaluation using AERONET observations showed that MERRA-2 outperformed the Copernicus Atmosphere Monitoring Service (CAMS) in most regions (Gueymard and Yang, 2020). Kumar et al. (2023) predicted ground-level PM2.5 concentrations in India using only MERRA-2 and machine learning methods, proving the reliability of MERRA-2 data.
In addition, before 2000, there were no assimilated satellite data for MERRA-2, and nitrate was not provided in the MERRA-2 aerosol reanalysis datasets (Buchard et al., 2017). These issues may be detrimental to the accuracy of the LongPMInd dataset. Previous studies in India have shown that PM2.5 estimates based on MERRA-2 and empirical formulas suffer from inaccuracies due to issues such as the absence of nitrate, which can be improved by tree-based modeling (Sayeed et al., 2022). The model trained in this study relies heavily on ERA5 (64 % relative contribution) with a minor contribution from MERRA-2 (36 %). Although tree-based models can improve PM2.5 estimation accuracy and the inclusion of ERA5 meteorological features reduces the model's dependence on MERRA-2, model accuracy may decrease for areas dominated by nitrate emissions and for years before 2000.
This file contains the research domain, feature importance, spatial and temporal patterns of PM2.5 and PM10, and uncertainty in estimated annual mortalities. The supplement related to this article is available online at: https://doi.org/10.5194/essd-16-3565-2024-supplement.
SW: methodology, software, writing (original draft). MZ: visualization, validation. HuZ: data curation, methodology. PW: methodology, writing (reviewing and editing). SHK: data curation. QF: writing (reviewing and editing). CL: writing (reviewing and editing). HoZ: conceptualization, funding acquisition, supervision, writing (reviewing and editing).
The contact author has declared that none of the authors has any competing interests.
Publisher's note: Copernicus Publications remains neutral with regard to jurisdictional claims made in the text, published maps, institutional affiliations, or any other geographical representation in this paper. While Copernicus Publications makes every effort to include appropriate place names, the final responsibility lies with the authors.
We thank the editor Jing Wei, the reviewer Yang Yang, and the anonymous reviewer for their helpful comments and suggestions for improving this paper. In addition, we would like to thank all the organizations and groups that provided important datasets for this study.
This work was supported by the National Key R&D Program of China (grant no. 2022YFC3701105), the co-fund DFG–NSFC Sino-German AirChanges project (grant no. 448720203), the National Natural Science Foundation of China (grant nos. 42077194 and 42061134008), and the Shanghai International Science and Technology Partnership Project (grant no. 21230780200).
This paper was edited by Jing Wei and reviewed by Yang Yang and one anonymous referee.
Bai, K., Li, K., Ma, M., Li, K., Li, Z., Guo, J., Chang, N.-B., Tan, Z., and Han, D.: LGHAP: the Long-term Gap-free High-resolution Air Pollutant concentration dataset, derived via tensor-flow-based multimodal data fusion, Earth Syst. Sci. Data, 14, 907–927, https://doi.org/10.5194/essd-14-907-2022, 2022.
Bai, K., Li, K., Shao, L., Li, X., Liu, C., Li, Z., Ma, M., Han, D., Sun, Y., Zheng, Z., Li, R., Chang, N.-B., and Guo, J.: LGHAP v2: a global gap-free aerosol optical depth and PM2.5 concentration dataset since 2000 derived via big Earth data analytics, Earth Syst. Sci. Data, 16, 2425–2448, https://doi.org/10.5194/essd-16-2425-2024, 2024.
Bali, K., Dey, S., and Ganguly, D.: Diurnal patterns in ambient PM2.5 exposure over India using MERRA-2 reanalysis data, Atmos. Environ., 248, 118180, https://doi.org/10.1016/j.atmosenv.2020.118180, 2021.
Bauer, P., Thorpe, A., and Brunet, G.: The quiet revolution of numerical weather prediction, Nature, 525, 47–55, https://doi.org/10.1038/nature14956, 2015.
Brauer, M., Guttikunda, S. K., Nishadh, K. A., Dey, S., Tripathi, S. N., Weagle, C., and Martin, R. V.: Examination of monitoring approaches for ambient air pollution: A case study for India, Atmos. Environ., 216, 116940, https://doi.org/10.1016/j.atmosenv.2019.116940, 2019.
Breiman, L.: Random Forests, Mach. Learn., 45, 5–32, https://doi.org/10.1023/A:1010933404324, 2001.
Buchard, V., Randles, C. A., da Silva, A. M., Darmenov, A., Colarco, P. R., Govindaraju, R., Ferrare, R., Hair, J., Beyersdorf, A. J., Ziemba, L. D., and Yu, H.: The MERRA-2 Aerosol Reanalysis, 1980 Onward. Part II: Evaluation and Case Studies, J. Climate, 30, 6851–6872, https://doi.org/10.1175/JCLI-D-16-0613.1, 2017.
Chen, Z., Chen, D., Zhao, C., Kwan, M.-P., Cai, J., Zhuang, Y., Zhao, B., Wang, X., Chen, B., Yang, J., Li, R., He, B., Gao, B., Wang, K., and Xu, B.: Influence of meteorological conditions on PM2.5 concentrations across China: A review of methodology and mechanism, Environ. Int., 139, 105558, https://doi.org/10.1016/j.envint.2020.105558, 2020.
Chowdhury, S., Dey, S., Di Girolamo, L., Smith, K. R., Pillarisetti, A., and Lyapustin, A.: Tracking ambient PM2.5 build-up in Delhi national capital region during the dry season over 15 years using a high-resolution (1 km) satellite aerosol dataset, Atmos. Environ., 204, 142–150, https://doi.org/10.1016/j.atmosenv.2019.02.029, 2019.
Dandona, L., Dandona, R., Kumar, G. A., Shukla, D., Paul, V. K., Balakrishnan, K., Prabhakaran, D., Tandon, N., Salvi, S., and Dash, A.: Nations within a nation: variations in epidemiological transition across the states of India, 1990–2016 in the Global Burden of Disease Study, Lancet, 390, 2437–2460, 2017.
Dey, S., Purohit, B., Balyan, P., Dixit, K., Bali, K., Kumar, A., Imam, F., Chowdhury, S., Ganguly, D., Gargava, P., and Shukla, V. K.: A Satellite-Based High-Resolution (1 km) Ambient PM2.5 Database for India over Two Decades (2000–2019): Applications for Air Quality Management, Remote Sens.-Basel, 12, 3872, https://doi.org/10.3390/rs12233872, 2020.
Ganguly, T., Selvaraj, K. L., and Guttikunda, S. K.: National Clean Air Programme (NCAP) for Indian cities: Review and outlook of clean air action plans, Atmospheric Environment: X, 8, 100096, https://doi.org/10.1016/j.aeaoa.2020.100096, 2020.
Geiss, A., Silva, S. J., and Hardin, J. C.: Downscaling atmospheric chemistry simulations with physically consistent deep learning, Geosci. Model Dev., 15, 6677–6694, https://doi.org/10.5194/gmd-15-6677-2022, 2022.
Geng, G., Xiao, Q., Liu, S., Liu, X., Cheng, J., Zheng, Y., Xue, T., Tong, D., Zheng, B., and Peng, Y.: Tracking Air Pollution in China: Near Real-Time PM2.5 Retrievals from Multisource Data Fusion, Environ. Sci. Technol., 55, 12106–12115, 2021.
Grinsztajn, L., Oyallon, E., and Varoquaux, G.: Why do tree-based models still outperform deep learning on typical tabular data?, Adv. Neur. In., 35, 507–520, 2022.
Gueymard, C. A. and Yang, D.: Worldwide validation of CAMS and MERRA-2 reanalysis aerosol optical depth products using 15 years of AERONET observations, Atmos. Environ., 225, 117216, https://doi.org/10.1016/j.atmosenv.2019.117216, 2020.
Hersbach, H., Bell, B., Berrisford, P., Hirahara, S., Horányi, A., Muñoz-Sabater, J., Nicolas, J., Peubey, C., Radu, R., Schepers, D., Simmons, A., Soci, C., Abdalla, S., Abellan, X., Balsamo, G., Bechtold, P., Biavati, G., Bidlot, J., Bonavita, M., De Chiara, G., Dahlgren, P., Dee, D., Diamantakis, M., Dragani, R., Flemming, J., Forbes, R., Fuentes, M., Geer, A., Haimberger, L., Healy, S., Hogan, R. J., Hólm, E., Janisková, M., Keeley, S., Laloyaux, P., Lopez, P., Lupu, C., Radnoti, G., de Rosnay, P., Rozum, I., Vamborg, F., Villaume, S., and Thépaut, J.-N.: The ERA5 global reanalysis, Q. J. Roy. Meteor. Soc., 146, 1999–2049, https://doi.org/10.1002/qj.3803, 2020.
Hu, X., Chu, L., Pei, J., Liu, W., and Bian, J.: Model complexity of deep learning: a survey, Knowl. Inf. Syst., 63, 2585–2619, https://doi.org/10.1007/s10115-021-01605-0, 2021.
Huang, C., Hu, J., Xue, T., Xu, H., and Wang, M.: High-Resolution Spatiotemporal Modeling for Ambient PM2.5 Exposure Assessment in China from 2013 to 2019, Environ. Sci. Technol., 55, 2152–2162, 2021.
Huang, J., Zhou, Y., and Yong, W.-A.: Data-driven discovery of multiscale chemical reactions governed by the law of mass action, J. Comput. Phys., 448, 110743, https://doi.org/10.1016/j.jcp.2021.110743, 2022.
Huang, Y. and Seinfeld, J. H.: A neural network-assisted Euler integrator for stiff kinetics in atmospheric chemistry, Environ. Sci. Technol., 56, 4676–4685, 2022.
Jabbar, H. and Khan, R. Z.: Methods to avoid over-fitting and under-fitting in supervised machine learning (comparative study), Computer Science, Communication and Instrumentation Devices, 70, 978–981, 2015.
Katoch, V., Kumar, A., Imam, F., Sarkar, D., Knibbs, L. D., Liu, Y., Ganguly, D., and Dey, S.: Addressing Biases in Ambient PM2.5 Exposure and Associated Health Burden Estimates by Filling Satellite AOD Retrieval Gaps over India, Environ. Sci. Technol., 57, 19190–19201, https://doi.org/10.1021/acs.est.3c03355, 2023.
Ke, G. L., Meng, Q., Finley, T., Wang, T. F., Chen, W., Ma, W. D., Ye, Q. W., and Liu, T. Y.: LightGBM: A Highly Efficient Gradient Boosting Decision Tree, 31st Annual Conference on Neural Information Processing Systems (NIPS), Long Beach, CA, Dec 04-09, WOS:000452649403021, 2017.
Kumar, V., Malyan, V., Sahu, M., Biswal, B., Pawar, M., and Dev, I.: Spatiotemporal analysis of fine particulate matter for India (1980–2021) from MERRA-2 using ensemble machine learning, Atmos. Pollut. Res., 14, 101834, https://doi.org/10.1016/j.apr.2023.101834, 2023.
Kumari, S., Verma, N., Lakhani, A., and Kumari, K. M.: Severe haze events in the Indo-Gangetic Plain during post-monsoon: Synergetic effect of synoptic meteorology and crop residue burning emission, Sci. Total Environ., 768, 145479, https://doi.org/10.1016/j.scitotenv.2021.145479, 2021.
Li, H., Yang, Y., Wang, H., Li, B., Wang, P., Li, J., and Liao, H.: Constructing a spatiotemporally coherent long-term PM2.5 concentration dataset over China during 1980–2019 using a machine learning approach, Sci. Total Environ., 765, 144263, https://doi.org/10.1016/j.scitotenv.2020.144263, 2021.
Li, T., Zhang, Q., Peng, Y., Guan, X., Li, L., Mu, J., Wang, X., Yin, X., and Wang, Q.: Contributions of Various Driving Factors to Air Pollution Events: Interpretability Analysis from Machine Learning Perspective, Environ. Int., 173, 107861, https://doi.org/10.1016/j.envint.2023.107861, 2023.
Liang, W., Luo, S., Zhao, G., and Wu, H.: Predicting hard rock pillar stability using GBDT, XGBoost, and LightGBM algorithms, Mathematics, 8, 765, https://doi.org/10.3390/math8050765, 2020.
Ma, Z., Dey, S., Christopher, S., Liu, R., Bi, J., Balyan, P., and Liu, Y.: A review of statistical methods used for developing large-scale and long-term PM2.5 models from satellite data, Remote Sens. Environ., 269, 112827, https://doi.org/10.1016/j.rse.2021.112827, 2022.
Maheshwarkar, P., Ralhan, A., Sunder Raman, R., Tibrewal, K., Venkataraman, C., Dhandapani, A., Kumar, R. N., Mukherjee, S., Chatterje, A., Rabha, S., Saikia, B. K., Bhardwaj, A., Chaudhary, P., Sinha, B., Lokhande, P., Phuleria, H. C., Roy, S., Imran, M., Habib, G., Azharuddin Hashmi, M., Qureshi, A., Qadri, A. M., Gupta, T., Lian, Y., Pandithurai, G., Prasad, L., Murthy, S., Deswal, M., Laura, J. S., Chhangani, A. K., Najar, T. A., and Jehangir, A.: Understanding the Influence of Meteorology and Emission Sources on PM2.5 Mass Concentrations Across India: First Results From the COALESCE Network, J. Geophys. Res.-Atmos., 127, e2021JD035663, https://doi.org/10.1029/2021JD035663, 2022.
Maji, K. J., Namdeo, A., and Bramwell, L.: Driving factors behind the continuous increase of long-term PM2.5-attributable health burden in India using the high-resolution global datasets from 2001 to 2020, Sci. Total Environ., 866, 161435, https://doi.org/10.1016/j.scitotenv.2023.161435, 2023.
Martin, R. V., Brauer, M., van Donkelaar, A., Shaddick, G., Narain, U., and Dey, S.: No one knows which city has the highest concentration of fine particulate matter, Atmospheric Environment: X, 3, 100040, https://doi.org/10.1016/j.aeaoa.2019.100040, 2019.
Muñoz-Sabater, J., Dutra, E., Agustí-Panareda, A., Albergel, C., Arduini, G., Balsamo, G., Boussetta, S., Choulga, M., Harrigan, S., Hersbach, H., Martens, B., Miralles, D. G., Piles, M., Rodríguez-Fernández, N. J., Zsoter, E., Buontempo, C., and Thépaut, J.-N.: ERA5-Land: a state-of-the-art global reanalysis dataset for land applications, Earth Syst. Sci. Data, 13, 4349–4383, https://doi.org/10.5194/essd-13-4349-2021, 2021.
Murray, C. J., Aravkin, A. Y., Zheng, P., Abbafati, C., Abbas, K. M., Abbasi-Kangevari, M., Abd-Allah, F., Abdelalim, A., Abdollahi, M., and Abdollahpour, I. J. T. L.: Global burden of 87 risk factors in 204 countries and territories, 1990–2019: a systematic analysis for the Global Burden of Disease Study 2019, Lancet, 396, 1223–1249, 2020.
Nagpure, A. S., Ramaswami, A., and Russell, A.: Characterizing the spatial and temporal patterns of open burning of municipal solid waste (MSW) in Indian cities, Environ. Sci. Technol., 49, 12904–12912, 2015.
Navinya, C. D., Vinoj, V., and Pandey, S. K.: Evaluation of PM2.5 Surface Concentrations Simulated by NASA's MERRA Version 2 Aerosol Reanalysis over India and its Relation to the Air Quality Index, Aerosol Air Qual. Res., 20, 1329–1339, https://doi.org/10.4209/aaqr.2019.12.0615, 2020.
Ni, Y., Yang, Y., Wang, H., Li, H., Li, M., Wang, P., Li, K., and Liao, H.: Contrasting changes in ozone during 2019–2021 between eastern and the other regions of China attributed to anthropogenic emissions and meteorological conditions, Sci. Total Environ., 908, 168272, https://doi.org/10.1016/j.scitotenv.2023.168272, 2024.
Pandey, A., Sadavarte, P., Rao, A. B., and Venkataraman, C.: Trends in multi-pollutant emissions from a technology-linked inventory for India: II. Residential, agricultural and informal industry sectors, Atmos. Environ., 99, 341–352, https://doi.org/10.1016/j.atmosenv.2014.09.080, 2014.
Pandey, A., Brauer, M., Cropper, M. L., Balakrishnan, K., Mathur, P., Dey, S., Turkgulu, B., Kumar, G. A., Khare, M., and Beig, G.: Health and economic impact of air pollution in the states of India: the Global Burden of Disease Study 2019, The Lancet Planetary Health, 5, e25–e38, 2021.
Pant, P., Lal, R. M., Guttikunda, S. K., Russell, A. G., Nagpure, A. S., Ramaswami, A., and Peltier, R. E.: Monitoring particulate matter in India: recent trends and future outlook, Air Qual. Atmos. Hlth., 12, 45–58, 2019.
Ren, J., Zhang, M., Yu, C., and Liu, Z.: Balanced mse for imbalanced visual regression, Proceedings of the IEEE/CVF Conference on Computer Vision and Pattern Recognition, 21–24 June 2022, New Orleans Ernest N. Morial Convention Center, New Orleans, Louisiana, 7926–7935, https://arxiv.org/abs/2203.16427 (last access: 30 July 2024), 2022.
Ren, X., Mi, Z., Cai, T., Nolte, C. G., and Georgopoulos, P. G.: Flexible Bayesian Ensemble Machine Learning Framework for Predicting Local Ozone Concentrations, Environ. Sci. Technol., 56, 3871–3883, https://doi.org/10.1021/acs.est.1c04076, 2022.
Sayeed, A., Lin, P., Gupta, P., Tran, N. N. M., Buchard, V., and Christopher, S.: Hourly and Daily PM2.5 Estimations Using MERRA-2: A Machine Learning Approach, Earth Space Sci., 9, e2022EA002375, https://doi.org/10.1029/2022EA002375, 2022.
Shi, G., Lu, X., Deng, Y., Urpelainen, J., Liu, L.-C., Zhang, Z., Wei, W., and Wang, H.: Air pollutant emissions induced by population migration in China, Environ. Sci. Technol., 54, 6308–6318, 2020.
Stirnberg, R., Cermak, J., Kotthaus, S., Haeffelin, M., Andersen, H., Fuchs, J., Kim, M., Petit, J.-E., and Favez, O.: Meteorology-driven variability of air pollution (PM1) revealed with explainable machine learning, Atmos. Chem. Phys., 21, 3919–3948, https://doi.org/10.5194/acp-21-3919-2021, 2021.
Sun, X., Liu, M., and Sima, Z.: A novel cryptocurrency price trend forecasting model based on LightGBM, Financ. Res. Lett., 32, 101084, https://doi.org/10.1016/j.frl.2018.12.032, 2020.
Tiwari, S., Srivastava, A. K., Bisht, D. S., Parmita, P., Srivastava, M. K., and Attri, S.: Diurnal and seasonal variations of black carbon and PM2.5 over New Delhi, India: Influence of meteorology, Atmos. Res., 125, 50–62, 2013.
Upadhyay, A., Dey, S., and Goyal, P.: A comparative assessment of regional representativeness of EDGAR and ECLIPSE emission inventories for air quality studies in India, Atmos. Environ., 223, 117182, https://doi.org/10.1016/j.atmosenv.2019.117182, 2020.
van Donkelaar, A., Hammer, M. S., Bindle, L., Brauer, M., Brook, J. R., Garay, M. J., Hsu, N. C., Kalashnikova, O. V., Kahn, R. A., Lee, C., Levy, R. C., Lyapustin, A., Sayer, A. M., and Martin, R. V.: Monthly Global Estimates of Fine Particulate Matter and Their Uncertainty, Environ. Sci. Technol., 55, 15287–15300, https://doi.org/10.1021/acs.est.1c05309, 2021.
Vos, T., Lim, S. S., Abbafati, C., Abbas, K. M., Abbasi, M., Abbasifard, M., Abbasi-Kangevari, M., Abbastabar, H., Abd-Allah, F., and Abdelalim, A.: Global burden of 369 diseases and injuries in 204 countries and territories, 1990–2019: a systematic analysis for the Global Burden of Disease Study 2019, Lancet, 396, 1204–1222, 2020.
Wang, K. C., Dickinson, R. E., Wild, M., and Liang, S.: Atmospheric impacts on climatic variability of surface incident solar radiation, Atmos. Chem. Phys., 12, 9581–9592, https://doi.org/10.5194/acp-12-9581-2012, 2012.
Wang, S., Kota, S. H., and Zhang, H.: LongPMInd: long-term (1980–2022) daily ground particulate matter datasets in India, Zenodo [data set], https://doi.org/10.5281/zenodo.10073944, 2023a.
Wang, S., Wang, P., Qi, Q., Wang, S., Meng, X., Kan, H., Zhu, S., and Zhang, H.: Improved estimation of particulate matter in China based on multisource data fusion, Sci. Total Environ., 869, 161552, https://doi.org/10.1016/j.scitotenv.2023.161552, 2023b.
Wang, S., Wang, P., Zhang, R., Meng, X., Kan, H., and Zhang, H.: Estimating particulate matter concentrations and meteorological contributions in China during 2000–2020, Chemosphere, 330, 138742, https://doi.org/10.1016/j.chemosphere.2023.138742, 2023c.
Wang, S., Zhang, M., Gao, Y., Wang, P., Fu, Q., and Zhang, H.: Diagnosing drivers of PM2.5 simulation biases from meteorology, chemical composition, and emission sources using an efficient machine learning method, EGUsphere [preprint], https://doi.org/10.5194/egusphere-2023-1531, 2023d.
Wei, J., Li, Z., Lyapustin, A., Sun, L., Peng, Y., Xue, W., Su, T., and Cribb, M.: Reconstructing 1-km-resolution high-quality PM2.5 data records from 2000 to 2018 in China: spatiotemporal variations and policy implications, Remote Sens. Environ., 252, 112136, https://doi.org/10.1016/j.rse.2020.112136, 2021a.
Wei, J., Li, Z., Pinker, R. T., Wang, J., Sun, L., Xue, W., Li, R., and Cribb, M.: Himawari-8-derived diurnal variations in ground-level PM2.5 pollution across China using the fast space-time Light Gradient Boosting Machine (LightGBM), Atmos. Chem. Phys., 21, 7863–7880, https://doi.org/10.5194/acp-21-7863-2021, 2021b.
Wei, J., Li, Z., Lyapustin, A., Wang, J., Dubovik, O., Schwartz, J., Sun, L., Li, C., Liu, S., and Zhu, T.: First close insight into global daily gapless 1 km PM2.5 pollution, variability, and health impact, Nat. Commun., 14, 8349, https://doi.org/10.1038/s41467-023-43862-3, 2023.
Yan, J., Xu, Y., Cheng, Q., Jiang, S., Wang, Q., Xiao, Y., Ma, C., Yan, J., and Wang, X.: LightGBM: accelerated genomically designed crop breeding through ensemble learning, Genome Biol., 22, 1–24, 2021.
Yang, X., Zhao, C. F., Zhou, L. J., Wang, Y., and Liu, X. H.: Distinct impact of different types of aerosols on surface solar radiation in China, J. Geophys. Res.-Atmos., 121, 6459–6471, https://doi.org/10.1002/2016jd024938, 2016.
Yang, Y., Zha, K., Chen, Y., Wang, H., and Katabi, D.: Delving into deep imbalanced regression, International Conference on Machine Learning, 18–24 July 2021, Honolulu, Hawaii, 65 USA, 11842–11851, https://arxiv.org/abs/2102.09554 (last access: 30 July 2024), 2021.
Ying, X.: An overview of overfitting and its solutions, J. Phys. Conf. Ser., 1168, 022022, https://doi.org/10.1088/1742-6596/1168/2/022022, 2019.
Yu, W., Ye, T., Zhang, Y., Xu, R., Lei, Y., Chen, Z., Yang, Z., Zhang, Y., Song, J., and Yue, X.: Global estimates of daily ambient fine particulate matter concentrations and unequal spatiotemporal distribution of population exposure: a machine learning modelling study, The Lancet Planetary Health, 7, e209–e218, 2023.
Zhang, T. N., He, W. H., Zheng, H., Cui, Y. P., Song, H. Q., and Fu, S. L.: Satellite-based ground PM2.5 estimation using a gradient boosting decision tree, Chemosphere, 268, 128801, https://doi.org/10.1016/j.chemosphere.2020.128801, 2021.